Adi Sarana Armada (Maintain)
15
PT Trimegah Sekuritas Indonesia Tbk – www.trimegah.com 1 COMPANY FOCUS │ 7 March, 2021 Company Data Year end Dec 2018 2019F 2020F 2021F 2022F Revenue (IDR bn) 1,863 2,330 2,957 3,876 5,265 Net Profit (IDR bn) 144 110 93 150 178 EPS Growth (%) 39.1 -23.1 -15.4 60.2 18.9 P/E (x) 34.1 44.3 52.4 32.7 27.5 P/BV (X) 4.5 4.1 3.8 3.4 3.0 EBITDA (IDR bn) 787 866 873 1,072 1,334 EV/EBITDA 8.9 8.7 8.9 7.7 6.4 Div Yield (%) 0.8 0.0 0.0 0.0 0.0 Adi Sarana Armada Blue Chip in Presence, Meaningful in Impact: Part II Conquering ecosystem is what set the company apart Valuation of digital banks valuation (E.g. ~$30bn for WeBank, ~$9.15bn for Kakao Bank, and ~$5.5bn for Tinkoff) highly depends on how a bank can conquer a person’s ecosystem. Similar with digital technology adoptions in the logistics industry, one should value a logistic company based on the company’s ability to operate in a seamless end to end logistic chain. ASSA is able to adopt and combine technology/digital and operational excellence both simultaneously. Anteraja’s (55% owned by ASSA) shareholder, SF Holdings, plans to acquire 51.8% of Kerry Logistics Network Ltd. (a logistic company based in HK), creating the biggest logistic group in Asia. We believe ASSA will be part of the supply chain to the international markets as well. It is worth noting that ASSA’s sister company, Puninar, has partnership with Kerry Logistics since 5 years ago. After a very strong last-mile delivery performance (Anteraja’s parcel delivery up 7x to ~50m deliveries in 2020 from ~6m in 2019), the company further expands its logistic wings by establishing Bisnisaja (customized B2B shipping process), travylite (collaboration with Angkasa Pura II airport for excess baggage services) and Titipaja (e- fulfillment services with multi-location warehouses to serve inter-region services). Indonesia’s logistic value is ~Rp3,300trn/year and Anteraja’s 2021 revenue is only ~0.05% of this. SF Holdings and Kerry Logistics have both market cap combined of $73bn (Rp1,000trn) with combined 2020 revenue size of ~$30bn (Rp429trn). Logistic last mile is still at growing stage We estimate avg. spending of Shopee transactions/user/year is ~$42 and ~6% of the $42 would be logistic costs ($2.6). We believe the number of transactions done still has lots of upside especially from non-Jakarta areas. ASSA’s goal to pursue ~2m parcels per/day by 2024 is becoming more plausible looking at the current growth trajectory. China’s parcel delivery (~174k/day) is ~44x larger than Indonesia (~4m/day) while China’s population is only ~5x larger. Upgrade TP to Rp2.7k (+88% ups.), Buy We expect earnings to book +34% CAGR in the next 5 years (2020-25) driven mainly by Anteraja’s multi-beggar growth coupled with solid double-digit growth from its rental business. Our new SOP-based TP is Rp2.7k. The new TP is mainly premised on 50% discount to Anteraja’s 2m parcel/day target by 2024 coupled with valuation/delivery transactions/year of $2.6. We believe that Anteraja will be one of the top key players in this e-commerce logistics industry and our confidence on Anteraja reaching that 2m/day delivery level is substantially increasing after proving exponential growth since April 2019’s inception. BUY (Maintain) Current TP IDR2,700 (+88%) Previous TP IDR770 Current Price IDR1,440 Willinoy Sitorus [email protected] 021 - 2924 9107 Hasbie [email protected] +62-21 2924 6322 Stock Data & Indices Bloomberg Code ASSA.IJ JCI Member JAKINFR MSCI Indonesia No JII No LQ45 No Kompas 100 No Key Data Issued Shares (mn) 3.397.5 Free Float (est) 35.7 Mkt. Cap (IDRbn) 4,892.4 Mkt. Cap (USDmn) 339.3 ADTV 6 months (USDmn) 16.3 52 Wk-range 1615 / 268 Performance (%) YTD 1m 3m 12m Absolute 126.8 42.6 166.7 174.3 Relative to JCI 122.1 41.8 161.4 160.5
Transcript of Adi Sarana Armada (Maintain)

PT Trimegah Sekuritas Indonesia Tbk – www.trimegah.com 1
COMPANY FOCUS │ 7 March, 2021
Company Data
Year end Dec 2018 2019F 2020F 2021F 2022F
Revenue (IDR bn) 1,863 2,330 2,957 3,876 5,265
Net Profit (IDR bn) 144 110 93 150 178
EPS Growth (%) 39.1 -23.1 -15.4 60.2 18.9
P/E (x) 34.1 44.3 52.4 32.7 27.5
P/BV (X) 4.5 4.1 3.8 3.4 3.0
EBITDA (IDR bn) 787 866 873 1,072 1,334
EV/EBITDA 8.9 8.7 8.9 7.7 6.4
Div Yield (%) 0.8 0.0 0.0 0.0 0.0
Adi Sarana Armada Blue Chip in Presence, Meaningful in Impact:
Part II
Conquering ecosystem is what set the company apart
Valuation of digital banks valuation (E.g. ~$30bn for WeBank, ~$9.15bn for Kakao
Bank, and ~$5.5bn for Tinkoff) highly depends on how a bank can conquer a
person’s ecosystem. Similar with digital technology adoptions in the logistics
industry, one should value a logistic company based on the company’s ability to
operate in a seamless end to end logistic chain. ASSA is able to adopt and combine
technology/digital and operational excellence both simultaneously. Anteraja’s (55%
owned by ASSA) shareholder, SF Holdings, plans to acquire 51.8% of Kerry
Logistics Network Ltd. (a logistic company based in HK), creating the biggest
logistic group in Asia. We believe ASSA will be part of the supply chain to the
international markets as well. It is worth noting that ASSA’s sister company,
Puninar, has partnership with Kerry Logistics since 5 years ago. After a very strong
last-mile delivery performance (Anteraja’s parcel delivery up 7x to ~50m deliveries
in 2020 from ~6m in 2019), the company further expands its logistic wings by
establishing Bisnisaja (customized B2B shipping process), travylite (collaboration
with Angkasa Pura II airport for excess baggage services) and Titipaja (e-
fulfillment services with multi-location warehouses to serve inter-region services).
Indonesia’s logistic value is ~Rp3,300trn/year and Anteraja’s 2021 revenue is only
~0.05% of this. SF Holdings and Kerry Logistics have both market cap combined of
$73bn (Rp1,000trn) with combined 2020 revenue size of ~$30bn (Rp429trn).
Logistic last mile is still at growing stage
We estimate avg. spending of Shopee transactions/user/year is ~$42 and ~6% of
the $42 would be logistic costs ($2.6). We believe the number of transactions done
still has lots of upside especially from non-Jakarta areas. ASSA’s goal to pursue
~2m parcels per/day by 2024 is becoming more plausible looking at the current
growth trajectory. China’s parcel delivery (~174k/day) is ~44x larger than
Indonesia (~4m/day) while China’s population is only ~5x larger.
Upgrade TP to Rp2.7k (+88% ups.), Buy
We expect earnings to book +34% CAGR in the next 5 years (2020-25) driven
mainly by Anteraja’s multi-beggar growth coupled with solid double-digit growth
from its rental business. Our new SOP-based TP is Rp2.7k. The new TP is mainly
premised on 50% discount to Anteraja’s 2m parcel/day target by 2024 coupled
with valuation/delivery transactions/year of $2.6. We believe that Anteraja will be
one of the top key players in this e-commerce logistics industry and our confidence
on Anteraja reaching that 2m/day delivery level is substantially increasing after
proving exponential growth since April 2019’s inception.
BUY (Maintain) Current TP IDR2,700 (+88%) Previous TP IDR770 Current Price IDR1,440
Willinoy Sitorus [email protected] 021 - 2924 9107 Hasbie [email protected] +62-21 2924 6322
Stock Data & Indices
Bloomberg Code ASSA.IJ
JCI Member JAKINFR
MSCI Indonesia No
JII No
LQ45 No
Kompas 100 No
Key Data
Issued Shares (mn) 3.397.5
Free Float (est) 35.7
Mkt. Cap (IDRbn) 4,892.4
Mkt. Cap (USDmn) 339.3
ADTV 6 months (USDmn) 16.3
52 Wk-range 1615 / 268
Performance (%)
YTD 1m 3m 12m
Absolute 126.8 42.6 166.7 174.3
Relative to
JCI 122.1 41.8 161.4 160.5

PT Trimegah Sekuritas Indonesia Tbk – www.trimegah.com 2
Cash Flow
Year end Dec (IDR bn) 2018 2019F 2020F 2021F 2022F
Net Profit 144 110 93 150 178
Depr / Amort 431 517 529 601 691
Chg in Working Cap 188 (99) (46) (90) (1)
Others (639) (675) (340) (314) (227)
CF's from oprs 123 (146) 236 346 641
Capex (736) (590) (484) (782) (797)
Others 623 441 0 0 0
CF's from investing (113) (149) (484) (782) (797)
Net change in debt 348 560 50 450 650
Others (215) (237) 8 (22) (86)
CF's from financing 133 323 58 428 564
Net cash flow 143 28 (189) (8) 408
Cash at BoY 85 228 255 65 57
Cash at EoY 228 256 65 57 465
Income Statement
Year end Dec (IDR bn) 2018 2019F 2020F 2021F 2022F
Revenue 1,863 2,330 2,957 3,876 5,265
Gross Profit 599 740 825 1,003 1,326
Opr. Profit 357 349 345 471 642
EBITDA 787 866 873 1,072 1,334
Net Int Inc/(Exp) -173.2 -229.1 -239.6 -258.7 -324.2
Other Income (Expense) (3) 0 0 0 0 Pre-tax Profit 182 117 105 212 318
Income Tax Expense (40) (26) (20) (40) (54)
Minority Interest 1 19 8 (22) (86)
Net Profit 144 110 93 150 178
Dividend payout ratio (%) 28 0 0 0 0
Balance Sheet
Year end Dec (IDR bn) 2018 2019F 2020F 2021F 2022F
Cash and equivalents 228 255 65 57 465
Other curr asset 309 398 451 565 602
Net fixed asset 3,412 3,894 4,189 4,685 5,017
Other non-current assets 114 303 303 303 303
Total Asset 4,063 4,849 5,008 5,610 6,387
ST debt 747 847 847 997 1,247
Other curr liab 403 394 401 425 461
LT debt 1,604 2,064 2,114 2,414 2,814
Other LT Liab 170 207 207 207 207
Minority interest 2,924 3,511 3,568 4,043 4,728
Total Liabilities 52 146 155 132 46
Shareholders Equity 1,086 1,192 1,285 1,435 1,613
Net debt / (cash) 2,123 2,656 2,895 3,353 3,595
Total cap employed 2,912 3,609 3,761 4,188 4,680
Net Working capital (613) (588) (731) (800) (640)
Ratio Analysis
Year end Dec 2018 2019F 2020F 2021F 2022F
Profitability
Gross Margin (%) 32.1 31.8 27.9 25.9 25.2
Opr Margin (%) 19.1 15.0 11.7 12.2 12.2
EBITDA Margin (%) 42.2 37.2 29.5 27.7 25.3
Core Net Margin (%) 7.7 4.7 3.2 3.9 3.4
ROE (%) 13.9 9.7 7.5 11.0 11.7
ROA (%) 3.9 2.5 1.9 2.8 3.0
Stability
Current ratio (x) 0.5 0.5 0.4 0.4 0.6
Net Debt to Equity (x) 2.0 2.2 2.3 2.3 2.2
Net Debt to EBITDA (x) 2.7 3.1 3.3 3.1 2.7
Interest Coverage (x) 2.0 1.4 1.4 1.7 1.9
Efficiency
Account Payable (days) 10 12 12 12 12
Account Receivable (days) 42 39 39 39 30
Inventory Day (days) 10 8 8 8 8
Major Shareholders
Major Shareholders
PT Adi Sarana Armada Tbk (ASSA) is
one of the largest car rental
company with >20k rental units and
44 branch & service points. It
entered the car auction business
back in 2014.
Company Background
PT Adi Dinamika Investindo 25.1%
PT Daya Adicipta Mustika 19.2%
Drs. Prodjo Sunarjanto SP 9.9%
Public 45.8%
SWOT Analysis
Threat -Increase in cost
of funds.
-High discount
for new car.
Strength -Strong customer
base (corporate).
-Lower car
acquisition price
-Synergy within
business units
-technology
driven
Weakness -Exposure to
change in
interest rates.
Opportunity -Increase in
second hand
car price.
-Trend to
outsource
transportation
needs
(increase in
potential
customer base)
-Monetize
technology to
make
businesses
more efficient
Major Shareholders
PT Trimegah Sekuritas Indonesia Tbk – www.trimegah.com 3
INDUSTRY OUTLOOK
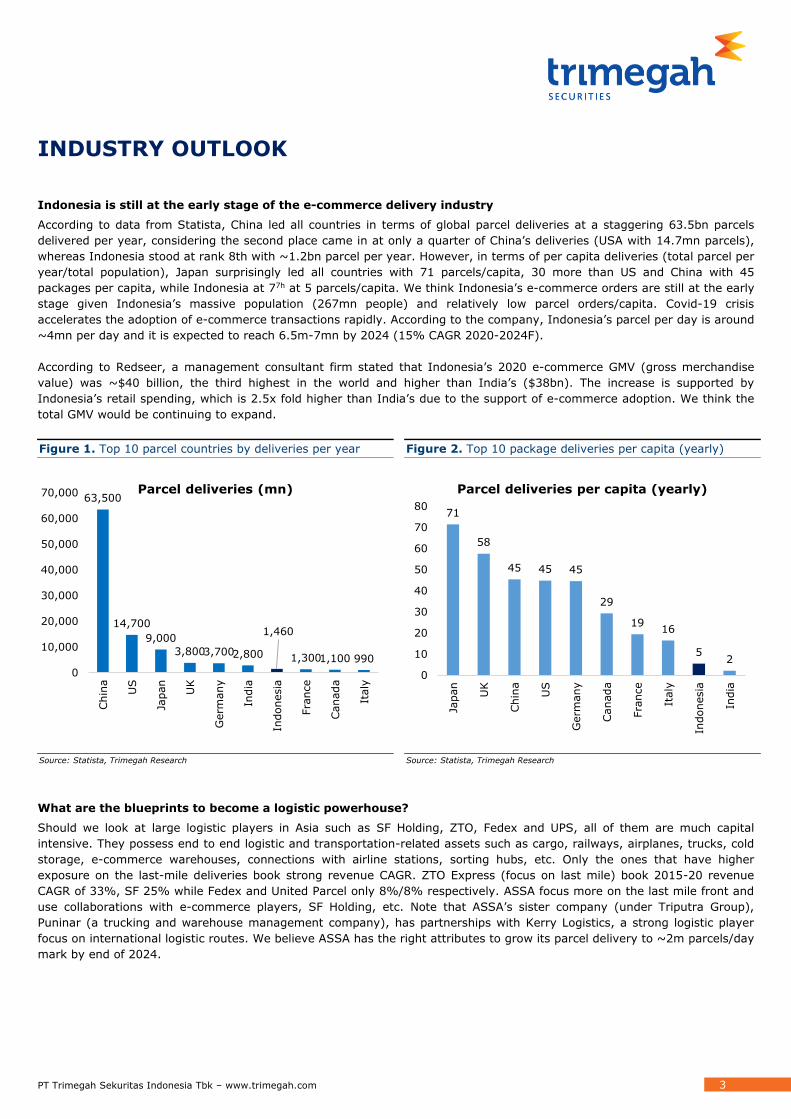
Indonesia is still at the early stage of the e-commerce delivery industry
According to data from Statista, China led all countries in terms of global parcel deliveries at a staggering 63.5bn parcels
delivered per year, considering the second place came in at only a quarter of China’s deliveries (USA with 14.7mn parcels),
whereas Indonesia stood at rank 8th with ~1.2bn parcel per year. However, in terms of per capita deliveries (total parcel per
year/total population), Japan surprisingly led all countries with 71 parcels/capita, 30 more than US and China with 45
packages per capita, while Indonesia at 77h at 5 parcels/capita. We think Indonesia’s e-commerce orders are still at the early
stage given Indonesia’s massive population (267mn people) and relatively low parcel orders/capita. Covid-19 crisis
accelerates the adoption of e-commerce transactions rapidly. According to the company, Indonesia’s parcel per day is around
~4mn per day and it is expected to reach 6.5m-7mn by 2024 (15% CAGR 2020-2024F).
According to Redseer, a management consultant firm stated that Indonesia’s 2020 e-commerce GMV (gross merchandise
value) was ~$40 billion, the third highest in the world and higher than India’s ($38bn). The increase is supported by
Indonesia’s retail spending, which is 2.5x fold higher than India’s due to the support of e-commerce adoption. We think the
total GMV would be continuing to expand.
Figure 1. Top 10 parcel countries by deliveries per year Figure 2. Top 10 package deliveries per capita (yearly)
Source: Statista, Trimegah Research Source: Statista, Trimegah Research
What are the blueprints to become a logistic powerhouse?
Should we look at large logistic players in Asia such as SF Holding, ZTO, Fedex and UPS, all of them are much capital
intensive. They possess end to end logistic and transportation-related assets such as cargo, railways, airplanes, trucks, cold
storage, e-commerce warehouses, connections with airline stations, sorting hubs, etc. Only the ones that have higher
exposure on the last-mile deliveries book strong revenue CAGR. ZTO Express (focus on last mile) book 2015-20 revenue
CAGR of 33%, SF 25% while Fedex and United Parcel only 8%/8% respectively. ASSA focus more on the last mile front and
use collaborations with e-commerce players, SF Holding, etc. Note that ASSA’s sister company (under Triputra Group),
Puninar (a trucking and warehouse management company), has partnerships with Kerry Logistics, a strong logistic player
focus on international logistic routes. We believe ASSA has the right attributes to grow its parcel delivery to ~2m parcels/day
mark by end of 2024.
63,500
14,700
9,000
3,8003,7002,800
1,460
1,3001,100 990
0
10,000
20,000
30,000
40,000
50,000
60,000
70,000
Chin
a
US
Japan
UK
Germ
any
India
Indonesia
Fra
nce
Canada
Italy
Parcel deliveries (mn)
71
58
45 45 45
29
1916
52
0
10
20
30
40
50
60
70
80
Japan
UK
Chin
a
US
Germ
any
Canada
Fra
nce
Italy
Indonesia
India
Parcel deliveries per capita (yearly)

PT Trimegah Sekuritas Indonesia Tbk – www.trimegah.com 4
Figure 3. SF, ZTO, Fedex, and UPS revenue CAGR 2015-2020
Source: Trimegah Research, Bloomberg
Figure 4. Anteraja’s revenue growth 2019-2024F Figure 5. Anteraja’s average no parcel delivery per day
Source: Trimegah Research, company Source: Trimegah Research, company
Figure 6. Anteraja’s business model
Source: Company
33%
25%
8% 8%
0%
5%
10%
15%
20%
25%
30%
35%
ZTO EXPRESSCAYMAN INC
S F HOLDING CO LTD-A
FEDEX CORP UNITED PARCELSERVICE-CL B
83
801
1,705
3,023
4,408
6,249
-
1,000
2,000
3,000
4,000
5,000
6,000
7,000
2019 2020F 2021F 2022F 2023F 2024F
(IDRbn)
91
214
450
799
1,153
1,603
-
200
400
600
800
1,000
1,200
1,400
1,600
1,800
2019 2020F 2021F 2022F 2023F 2024F
(No. of parcel delivery, in 000 per day)

PT Trimegah Sekuritas Indonesia Tbk – www.trimegah.com 5
Figure 7. ASSA’s new business initiatives: Tapping various delivery business using the adoption of technology
Source: Company
Figure 8. Anteraja’s peers comparison
Source: Trimegah Research, Bloomberg
Figure 9. Changes of estimate
Source: Trimegah Research, Bloomberg
Ticker Market cap
(USDMn) 2020Y 2021Y 2020Y 2021Y 2020Y 2021Y 2020Y 2021Y 2020Y 2021Y
*as of 3/5/2021
Courier
China
S F HOLDING CO LTD-A 002352 CH EQUITY 68,098 59.72 47.69 8.80 7.48 29.65 24.03 2.90 2.34 14.97 16.15
KERRY LOGISTICS NETWORK LTD 636 HK EQUITY 5,269 24.73 21.92 1.62 1.54 10.63 10.03 0.89 0.83 6.60 5.94
ZTO EXPRESS CAYMAN INC 2057 HK EQUITY 29,411 38.52 34.28 3.66 3.34 24.78 19.37 7.44 6.08 9.95 11.35
SINOTRANS LIMITED-H 598 HK EQUITY 4,539 7.42 6.93 0.61 0.57 9.06 8.54 0.35 0.33 8.60 8.93
Japan
YAMATO HOLDINGS CO LTD 9064 JP EQUITY 9,984 50.77 23.22 1.91 1.80 9.90 7.17 0.66 0.64 3.81 7.98
SG HOLDINGS CO LTD 9143 JT EQUITY 14,537 33.31 21.53 4.02 3.77 16.50 12.60 1.34 1.23 13.10 17.85
US
UNITED PARCEL SERVICE-CL B UPS US EQUITY 142,541 21.36 18.51 18.71 24.26 14.97 13.00 1.73 1.63 119.41 205.48
FEDEX CORP FDX US EQUITY 68,200 29.68 14.76 3.57 3.07 12.94 8.51 1.00 0.86 12.01 22.00
Average 42,822 33.19 23.60 5.36 5.73 16.05 12.91 2.04 1.74 23.55 36.96
PER (x) PBV (x) EV/EBITDA (x) ROE (%)P/S (x)
2021F 2022F 2021F 2022F 2021F 2022F
Revenue 3,876 5,265 3,475 4,362 12% 21%
Gross profit 1,003 1,326 927 1,216 8% 9%
Gross margin 25.9% 25.2% 26.7% 27.9%
Operating profit 471 642 421 521 12% 23%
Op. profit margin 12.2% 12.2% 12.1% 11.9%
Pre-tax profit 212 318 171 231 24% 38%
Pre-tax margin 5.5% 6.0% 4.9% 5.3%
Net profit 150 178 138 164 9% 8%
Net margin 3.9% 3.4% 4.0% 3.8%
NEW OLD CHANGE
PT Trimegah Sekuritas Indonesia Tbk – www.trimegah.com 6
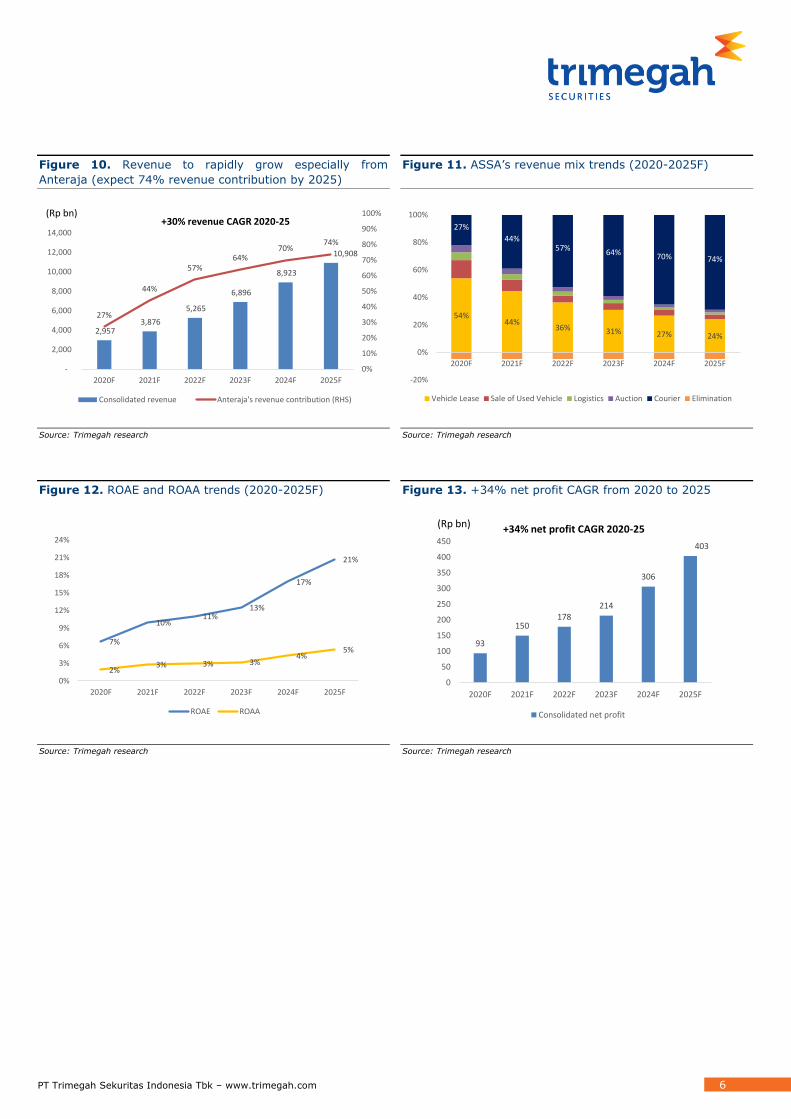
Figure 10. Revenue to rapidly grow especially from
Anteraja (expect 74% revenue contribution by 2025)
Figure 11. ASSA’s revenue mix trends (2020-2025F)
Source: Trimegah research Source: Trimegah research
Figure 12. ROAE and ROAA trends (2020-2025F) Figure 13. +34% net profit CAGR from 2020 to 2025
Source: Trimegah research Source: Trimegah research
2,957 3,876
5,265
6,896
8,923
10,908
27%
44%
57%64%
70%74%
0%
10%
20%
30%
40%
50%
60%
70%
80%
90%
100%
-
2,000
4,000
6,000
8,000
10,000
12,000
14,000
16,000
2020F 2021F 2022F 2023F 2024F 2025F
Consolidated revenue Anteraja's revenue contribution (RHS)
(Rp bn)+30% revenue CAGR 2020-25
54%44%
36% 31% 27% 24%
27%
44%57%
64% 70% 74%
-20%
0%
20%
40%
60%
80%
100%
2020F 2021F 2022F 2023F 2024F 2025F
Vehicle Lease Sale of Used Vehicle Logistics Auction Courier Elimination
7%
10%11%
13%
17%
21%
2%3% 3% 3%
4%5%
0%
3%
6%
9%
12%
15%
18%
21%
24%
2020F 2021F 2022F 2023F 2024F 2025F
ROAE ROAA
93
150178
214
306
403
0
50
100
150
200
250
300
350
400
450
2020F 2021F 2022F 2023F 2024F 2025F
Consolidated net profit
(Rp bn) +34% net profit CAGR 2020-25
PT Trimegah Sekuritas Indonesia Tbk – www.trimegah.com 7
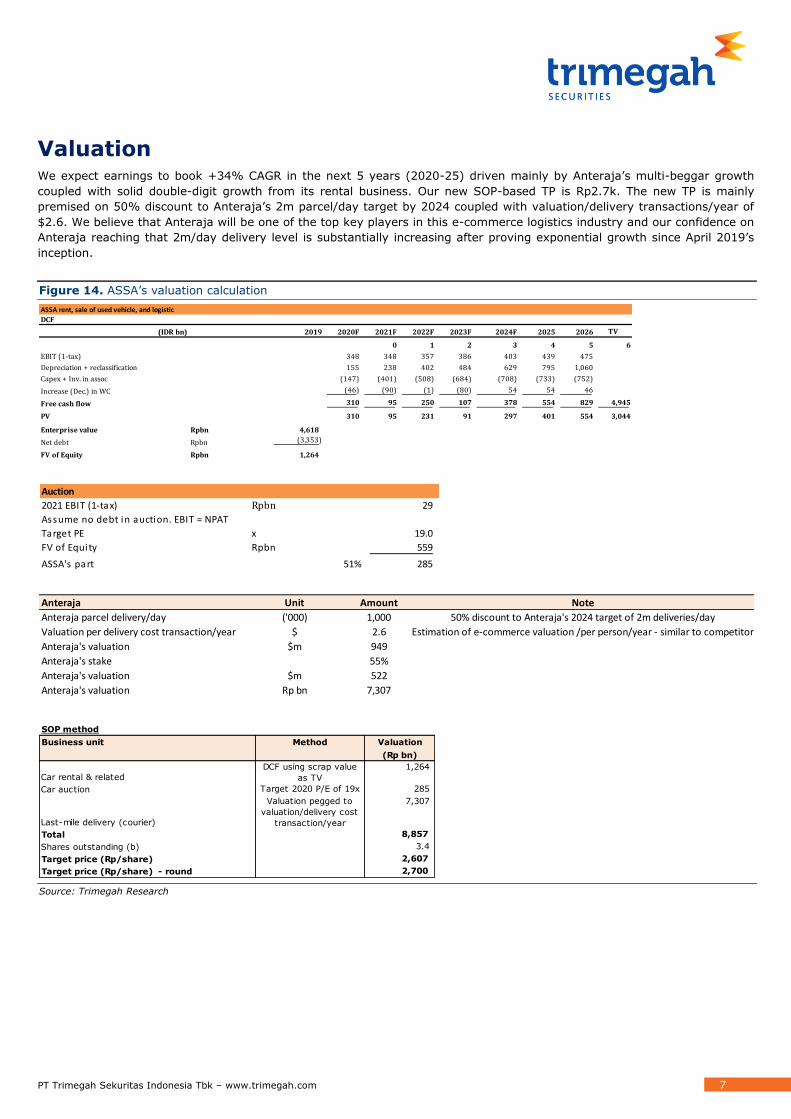
Valuation We expect earnings to book +34% CAGR in the next 5 years (2020-25) driven mainly by Anteraja’s multi-beggar growth
coupled with solid double-digit growth from its rental business. Our new SOP-based TP is Rp2.7k. The new TP is mainly
premised on 50% discount to Anteraja’s 2m parcel/day target by 2024 coupled with valuation/delivery transactions/year of
$2.6. We believe that Anteraja will be one of the top key players in this e-commerce logistics industry and our confidence on
Anteraja reaching that 2m/day delivery level is substantially increasing after proving exponential growth since April 2019’s
inception.
Figure 14. ASSA’s valuation calculation
Source: Trimegah Research
ASSA rent, sale of used vehicle, and logistic
DCF
(IDR bn) 2019 2020F 2021F 2022F 2023F 2024F 2025 2026 TV
0 1 2 3 4 5 6
EBIT (1-tax) 348 348 357 386 403 439 475
Depreciation + reclassification 155 238 402 484 629 795 1,060
Capex + Inv. in assoc (147) (401) (508) (684) (708) (733) (752)
Increase (Dec.) in WC (46) (90) (1) (80) 54 54 46
Free cash flow 310 95 250 107 378 554 829 4,945
PV 310 95 231 91 297 401 554 3,044
Enterprise value Rpbn 4,618
Net debt Rpbn (3,353)
FV of Equity Rpbn 1,264
Auction
2021 EBIT (1-tax) Rpbn 29
Assume no debt in auction. EBIT = NPAT
Target PE x 19.0
FV of Equity Rpbn 559
ASSA's part 51% 285
Anteraja Unit Amount Note
Anteraja parcel delivery/day ('000) 1,000 50% discount to Anteraja's 2024 target of 2m deliveries/day
Valuation per delivery cost transaction/year $ 2.6 Estimation of e-commerce valuation /per person/year - similar to competitor
Anteraja's valuation $m 949
Anteraja's stake 55%
Anteraja's valuation $m 522
Anteraja's valuation Rp bn 7,307
SOP method
Business unit Method Valuation
(Rp bn)
Car rental & related
DCF using scrap value
as TV
1,264
Car auction Target 2020 P/E of 19x 285
Last-mile delivery (courier)
Valuation pegged to
valuation/delivery cost
transaction/year
7,307
Total 8,857
Shares outstanding (b) 3.4
Target price (Rp/share) 2,607
Target price (Rp/share) - round 2,700

PT Trimegah Sekuritas Indonesia Tbk – www.trimegah.com 8
Figure 15. Peers comparison
Source: Trimegah Research, Bloomberg
Figure 16. ASSA 1-year historical forward P/E for the last 2 year
Source: Trimegah Research, Bloomberg
Stocks ASSA
Latest date 3/5/2021
Latest valuation 31.65
2-year average valuation 19.86
(disc)/premium to 2-year avg 59%
7.0
12.0
17.0
22.0
27.0
32.0
37.0
Fwd PE band ASSA avg 19.8x +1 STD 26.8x +2 STD 33.8x -1 STD 12.8x -2 STD 5.81x
PT Trimegah Sekuritas Indonesia Tbk – www.trimegah.com 9
APPENDIX – Apps comparison
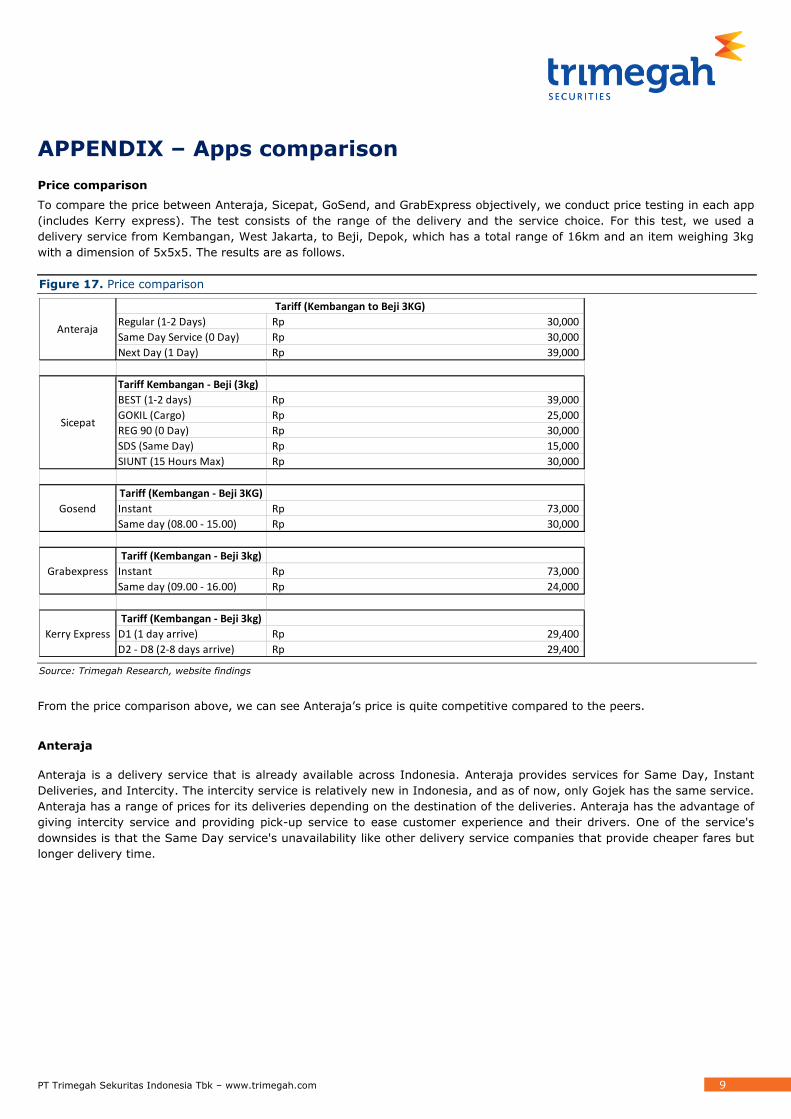
Price comparison
To compare the price between Anteraja, Sicepat, GoSend, and GrabExpress objectively, we conduct price testing in each app
(includes Kerry express). The test consists of the range of the delivery and the service choice. For this test, we used a
delivery service from Kembangan, West Jakarta, to Beji, Depok, which has a total range of 16km and an item weighing 3kg
with a dimension of 5x5x5. The results are as follows.
Figure 17. Price comparison
Source: Trimegah Research, website findings
From the price comparison above, we can see Anteraja’s price is quite competitive compared to the peers.
Anteraja
Anteraja is a delivery service that is already available across Indonesia. Anteraja provides services for Same Day, Instant
Deliveries, and Intercity. The intercity service is relatively new in Indonesia, and as of now, only Gojek has the same service.
Anteraja has a range of prices for its deliveries depending on the destination of the deliveries. Anteraja has the advantage of
giving intercity service and providing pick-up service to ease customer experience and their drivers. One of the service's
downsides is that the Same Day service's unavailability like other delivery service companies that provide cheaper fares but
longer delivery time.
Tariff (Kembangan to Beji 3KG)
Regular (1-2 Days) 30,000Rp
Same Day Service (0 Day) 30,000Rp
Next Day (1 Day) 39,000Rp
Tariff Kembangan - Beji (3kg)
BEST (1-2 days) 39,000Rp
GOKIL (Cargo) 25,000Rp
REG 90 (0 Day) 30,000Rp
SDS (Same Day) 15,000Rp
SIUNT (15 Hours Max) 30,000Rp
Tariff (Kembangan - Beji 3KG)
Instant 73,000Rp
Same day (08.00 - 15.00) 30,000Rp
Tariff (Kembangan - Beji 3kg)
Instant 73,000Rp
Same day (09.00 - 16.00) 24,000Rp
Tariff (Kembangan - Beji 3kg)
D1 (1 day arrive) 29,400Rp
D2 - D8 (2-8 days arrive) 29,400Rp
Anteraja
Sicepat
Gosend
Grabexpress
Kerry Express

PT Trimegah Sekuritas Indonesia Tbk – www.trimegah.com 10
Figure 18. Anteraja registration and login page, landing page, and delivery service’s user interface
Source: Trimegah Research, website findings
Registration Page Login Page
Profile Page Home Page Contact Us Page

PT Trimegah Sekuritas Indonesia Tbk – www.trimegah.com 11
Sicepat
Sicepat is a delivery service company that provides service for deliveries across Indonesia. It has five notable services called
BEST (Besok Sampai Tujuan), GOKIL (Cargo), REG (Instant Delivery), SDS (Same Day), and SIUNT (15-hour deliveries max
in jabodetabek). The advantage of Sicepat is that its service gives a relatively lower fare; however, the downside is in the
unavailable of intercity deliveries. However, due to the new account has not been verified by the customer service, we can
only provide the check ongkir (prices) feature and its landing page.
Figure 19. Sicepat Landing Page and Cek Ongkir Page
Source: Trimegah Research, website findings
GoSend
GoSend is one of the services that Gojek provides in its app that caters to deliveries inner and intercity. GoSend only
provides two delivery services which are Instant Delivery and Same Day Delivery. The Same Day Delivery service only
available between 08.00 AM until 03.00 PM. Gojek is also one of Indonesia's delivery services that have introduced their
intercity service alongside anteraja, making it feasible for users to deliver from and to different cities with affordable fares.
GoSend advantages are that they have a Same-day service that gives lower fares and has an intercity service. But on the
other hand, they also have a relatively expensive fare for its instant delivery service.
Figure 20. GoSend Service
Source: Trimegah Research, website findings
Landing Page Cek Ongkir Page Price
Gosend Service (Sameday and Instant)
GoSend Intercity Service

PT Trimegah Sekuritas Indonesia Tbk – www.trimegah.com 12
GrabExpress
GrabExpress is a delivery service provided by Grab. The service has changed its name from GrabSend to GrabExpress. Like
Gojek, GrabExpress also offers two services in its delivery services: Instant Delivery and Same Day Delivery. The Same Day
delivery service is only available from 09.00 AM to 16.00 AM. The advantages of grabexpress are the availability of same-
day service, which provides lower fares. Still, on the other hand, there is now an intercity option, and the fare for instant
deliveries is relatively expensive.
Figure 21. GrabExpress Delivery Service
Source: Trimegah Research, website findings

PT Trimegah Sekuritas Indonesia Tbk – www.trimegah.com 13
Research Team
Sebastian Tobing Strategy, Digital, Telecom, and Commodities
[email protected] +62-21 2924 9105
Willinoy Sitorus Banks, Automotive and Small Caps [email protected] +62-21 2924 9107
Fakhrul Fulvian Economics, Fixed Income [email protected] +62-21 2924 9097
Darien Sanusi Consumer Staples, Retail, Healthcare [email protected] +62-21 2924 9106
Heribertus Ariando Consumer Staples and Media [email protected] +62-21 2924 9060
Farah Rahmi Oktaviani Cement, Property and Infrastructure [email protected] +62-21 2924 6325
Rifina Rahisa Banks and Digital Financials [email protected] +62-21 2924 9103
Hasbie Small Cap & Automotive [email protected] +62-21 2924 6322
Kenny Vincent Economics, Fixed Income [email protected] +62-21 2924 6325
Pandu Megananda Digital Media [email protected] +62-21 2924 9088
Nur Marini Corporate Access [email protected] +62-21 2924 6323
Institutional Sales Team
Beatrix Susanto Head of Institutional Sales [email protected] +62-21 2924 9086
Henry Sidarta, CFTe Deputy Head of Institutional Sales [email protected] +62-21 3043 6309
Dewi Yusnita Equity Institutional Sales [email protected] +62-21 2924 9082
Raditya Andyono Equity Institutional Sales [email protected] +62-21 2924 9146
Calvina Karmoko Equity Institutional Sales [email protected] +62-21 2924 9080
Morgan Gindo Simorangkir Equity Institutional Sales [email protected] +62-21 2924 9076
Gerry Benedict Equity Institutional Sales [email protected] +62-21 2924 9081
Retail Sales Team
Andrew Jatmiko Head of Retail Equity Sales [email protected] +62-21 3043 6310
Hasbie Sukaton Deputy Head of Retail of Sales [email protected] +62-21 2924 9088
Jakarta Area
Untung Wijaya Kelapa Gading, Artha Graha, Jakarta [email protected] +62-21 4503 345
Windra Djulnaily Pluit, Jakarta [email protected] +62-21 6660 1456
Ignatius Candra Perwira BSD, Tangerang [email protected] +62-21 5386 700
Sumatera
Juliana Effendy Medan, Sumatera Utara [email protected] +62-61 4520 336
East Indonesia
Pandu Wibisono Surabaya, Jawa Timur [email protected] +62-31 5623 720
Carlo Ernest Frits Coutrier Makasar, Sulawesi Selatan [email protected] +62-41 1850 222
Central Java, Area
Mariana Kusuma Wati Semarang, Jawa Tengah [email protected] +62-24 8452 333
Antonius Santoso Solo, Jawa Tengah [email protected] +62-27 1733 328
West Java
Asep Saepudin Bandung, Jawa Barat [email protected] +62-22 4267 929
Ariffianto Cirebon, Jawa Barat [email protected] +62-23 1829 1155

PT Trimegah Sekuritas Indonesia Tbk – www.trimegah.com 14
Disclaimer
This report has been prepared by PT Trimegah Sekuritas Indonesia Tbk on behalf of itself and its affiliated
companies and is provided for information purposes only. Under no circumstances is it to be used or
considered as an offer to sell, or a solicitation of any offer to buy. This report has been produced
independently and the forecasts, opinions and expectations contained herein are entirely those of PT
Trimegah Sekuritas Indonesia Tbk.
While all reasonable care has been taken to ensure that information contained herein is not untrue or
misleading at the time of publication, PT Trimegah Sekuritas Indonesia Tbk makes no representation as to
its accuracy or completeness and it should not be relied upon as such. This report is provided solely for
the information of clients of PT Trimegah Sekuritas Indonesia Tbk who are expected to make their own
investment decisions without reliance on this report. Neither PT Trimegah Sekuritas Indonesia Tbk nor any
officer or employee of PT Trimegah Sekuritas Indonesia Tbk accept any liability whatsoever for any direct
or consequential loss arising from any use of this report or its contents. PT Trimegah Sekuritas Indonesia
Tbk and/or persons connected with it may have acted upon or used the information herein contained, or
the research or analysis on which it is based, before publication. PT Trimegah Sekuritas Indonesia Tbk
may in future participate in an offering of the company’s equity securities.
This report is not intended for media publication. The media is not allowed to quote this report in any
article whether in full or in parts without permission from PT Trimegah Sekuritas Indonesia Tbk. For
further information, the media can contact the head of research of PT Trimegah Sekuritas Indonesia Tbk.
This report was prepared, approved, published and distributed by PT Trimegah Sekuritas Indonesia Tbk
located outside of the United States (a “non-US Group Company”). Neither the report nor any analyst who
prepared or approved the report is subject to U.S. legal requirements or the Financial Industry Regulatory
Authority, Inc. (“FINRA”) or other regulatory requirements pertaining to research reports or research
analysts. No non-US Group Company is registered as a broker-dealer under the Exchange Act or is a
member of the Financial Industry Regulatory Authority, Inc. or any other U.S. self-regulatory
organization.
INVESTMENT RATING RULE:
Buy : Share price is expected to exceed more than 10% over the next 12 months
Neutral : Share price is expected to trade within the range of 0%-10% over the next 12 months
Sell : Share price is expected to trade below 0% over the next 12 months
Not Rated : The company is not within Trimegah research coverage

PT Trimegah Sekuritas Indonesia Tbk – www.trimegah.com 15
Analysts Certification
The research analyst(s) of PT Trimegah Sekuritas Indonesia Tbk. primarily responsible for the content of
this research report, in whole or in part, certifies that with respect to the companies or relevant securities
that the analyst(s) covered in this report: (1) all of the views expressed accurately reflect his or her
personal views on the company or relevant securities mentioned herein; (2) no part of his or her
remuneration was, is, or will be, directly or indirectly, connected with his or her specific recommendations
or views expressed in the research report; and (3) the report does not contain any material non-public
information.
The disclosure column in the following table lists the important disclosures applicable to each company
that has been rated and/or recommended in this report:
Company Ticker Disclosure (as applicable)
ASSA -
Trimegah Disclosure Data
Trimegah represents that:
1. Within the past year, it has managed or co-managed a public offering for this company, for which
it received fees.
2. It had an investment banking relationship with this company in the last 12 months.
3. It received compensation for investment banking services from this company in the last 12
months.
4. It expects to receive or intends to seek compensation for investment banking services from the
subject company/ies in the next 3 months.
5. It beneficially owns 1% or more of any class of common equity securities of the subject company.
6. It makes a market in securities in respect of this company.
7. The analyst(s) or an individual who assisted in the preparation of this report (or a member of
his/her household) has a financial interest position in securities issued by this company. The
financial interest is in the common stock of the subject company, unless otherwise noted.
8. The analyst (or a member of his/her household) is an officer, director, employee or advisory board
member of this company or has received compensation from the company.