ADI Best Of The Best: Driving Social Media Success
17
EUROPE BEST OF THE BEST 2015: SOCIAL ADOBE DIGITAL INDEX
Transcript of ADI Best Of The Best: Driving Social Media Success

EUROPE BEST OF THE BEST 2015: SOCIALADOBE DIGITAL INDEX
Appendix
11 Methodology
12 Glossary
14 Tables
Table of Contents
ADOBE DIGITAL INSIGHTS | Europe Best of the Best 2015 2
Europe Best of the Best: Social
03 What is Best of the Best?04 Media & Entertainment capitalize on social to drive traffic05 United Kingdom leads in driving
traffic via social media06 Top performers have significant
social presence07 Facebook #1 for use, and for
following and engaging with brands
08 Auto and Media & Entertainment have largest following
09 Millennials focus on Media & Entertainment and Beauty
10 Breaking News and Offers and Deals are most engaging forms of social content

3
What is the Best of the Best?The Best of the Best 2015 report refers to companies using the Adobe Marketing Cloud who rank in the Top 20% of fellow Adobe clients in their industry on various key performance metrics. It is called the Best of the Best because Adobe Marketing Cloud customers are already ahead of the masses through their investment in excellence.
How to read the graph:
Industry being measured
Overall average for sites in this industry
Overall average for the Top 20% of sites in this industry
Year-over-year change. Up arrow indicates increase, down
arrow indicates decrease.
Gap between Top 20% and average from 2014 to 2015.
Narrower means the gap is closing. Wider means it’s increasing.
ADOBE DIGITAL INSIGHTS | Europe Best of the Best 2015
4
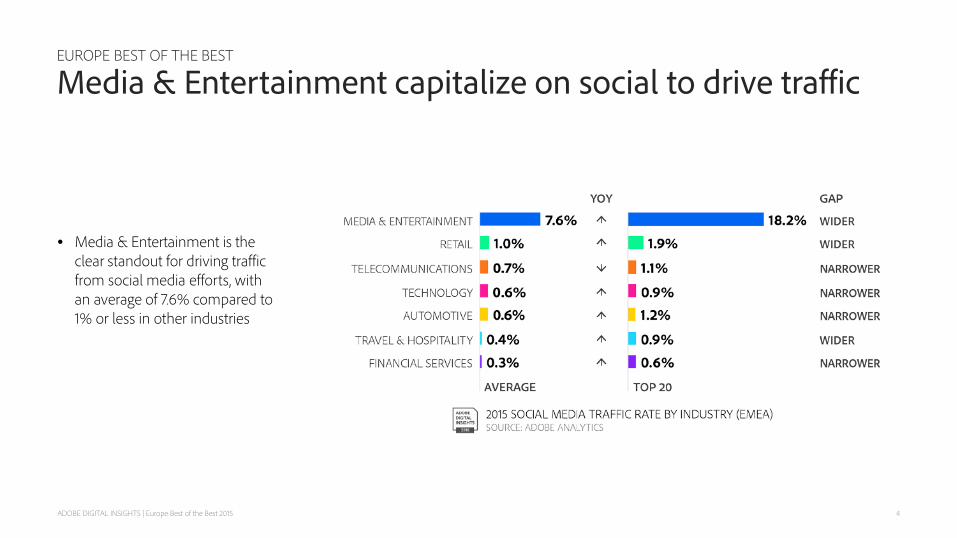
EUROPE BEST OF THE BEST
Media & Entertainment capitalize on social to drive traffic
• Media & Entertainment is the clear standout for driving traffic from social media efforts, with an average of 7.6% compared to 1% or less in other industries
ADOBE DIGITAL INSIGHTS | Europe Best of the Best 2015

5
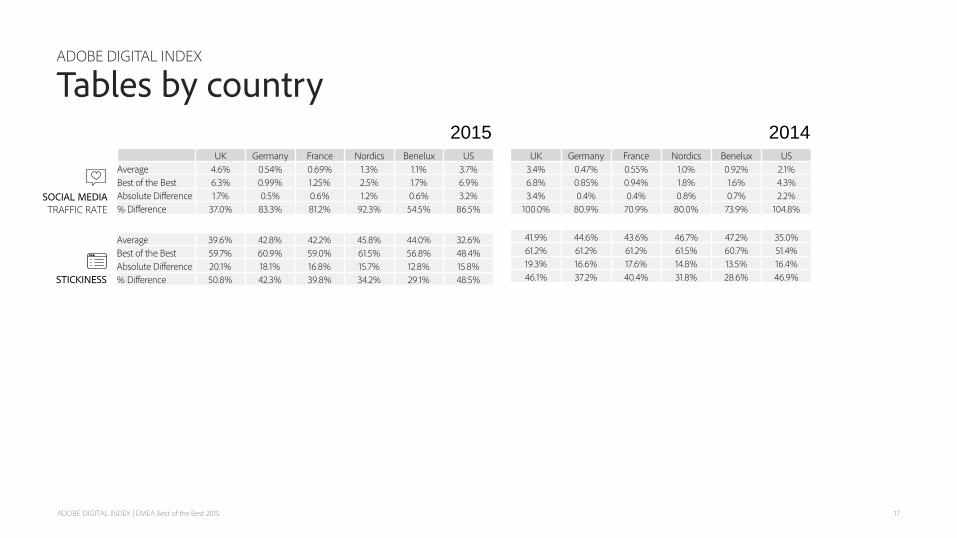
• The United Kingdom average leads in terms of driving traffic to websites via social media, outperforming the US average by 24%
• With an average of 0.54%, Germany drives the lowest amount of traffic to their websites via social media
EUROPE BEST OF THE BEST
United Kingdom leads in driving traffic via social media
ADOBE DIGITAL INSIGHTS | Europe Best of the Best 2015

• Top European performers withinevery industry arepresent on Twitter and Facebook
• EMEA social presence on Instagram, Pinterest, and Periscope is lower than its US counterpart
6
EUROPE TOP SOCIAL PERFORMERS
Top performers have significant social presence
ADOBE DIGITAL INSIGHTS | Europe Best of the Best 2015
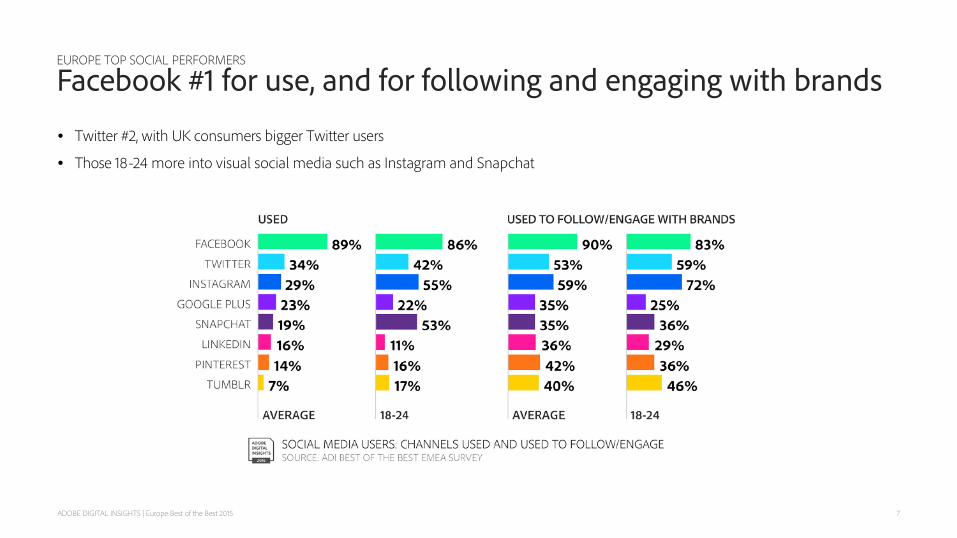
• Twitter #2, with UK consumers bigger Twitter users
• Those 18-24 more into visual social media such as Instagram and Snapchat
7
EUROPE TOP SOCIAL PERFORMERS
Facebook #1 for use, and for following and engaging with brands
ADOBE DIGITAL INSIGHTS | Europe Best of the Best 2015

8
EUROPE TOP SOCIAL PERFORMERS
Auto and Media & Entertainment have largest following
• Automotive and Media & Entertainment outperform the average social following by almost 2x
• Retail, Travel, Media & Entertainment, and Telecommunications are the most active verticals in terms of social authorship
• Retail has engaged the most with its audience – averaging over 6,000 engagements in its social lifetime
ADOBE DIGITAL INSIGHTS | Europe Best of the Best 2015
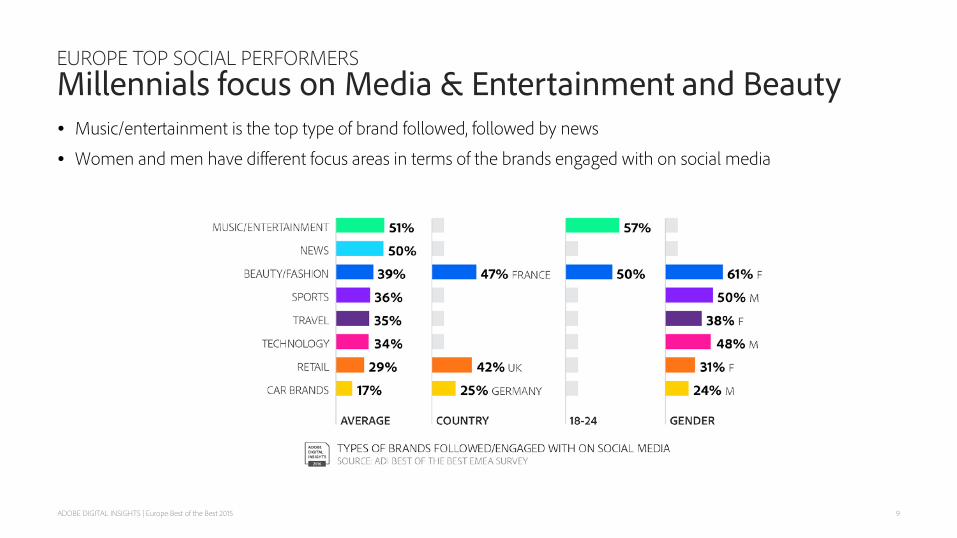
• Music/entertainment is the top type of brand followed, followed by news
• Women and men have different focus areas in terms of the brands engaged with on social media
9
EUROPE TOP SOCIAL PERFORMERSMillennials focus on Media & Entertainment and Beauty
ADOBE DIGITAL INSIGHTS | Europe Best of the Best 2015
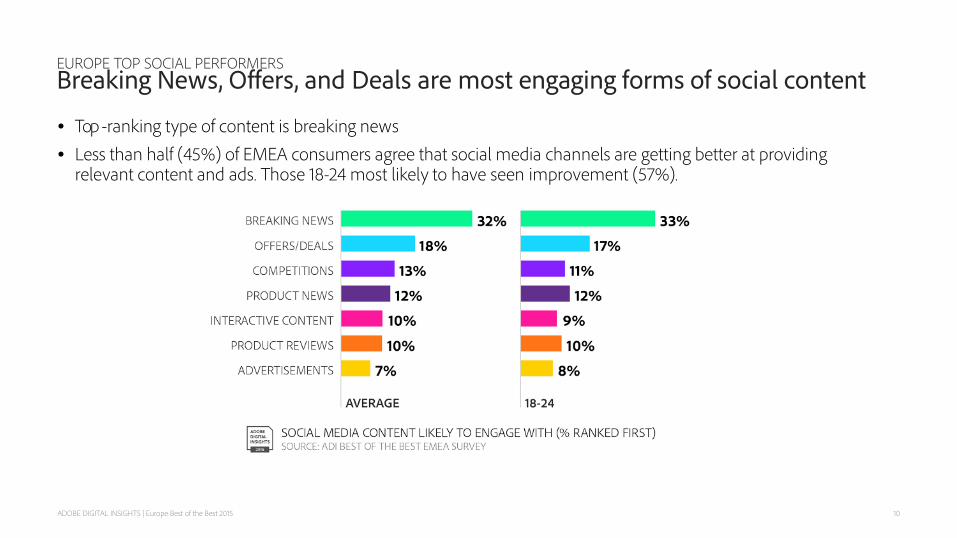
• Top -ranking type of content is breaking news• Less than half (45%) of EMEA consumers agree that social media channels are getting better at providing
relevant content and ads. Those 18-24 most likely to have seen improvement (57%).
10
EUROPE TOP SOCIAL PERFORMERSBreaking News, Offers, and Deals are most engaging forms of social content
ADOBE DIGITAL INSIGHTS | Europe Best of the Best 2015
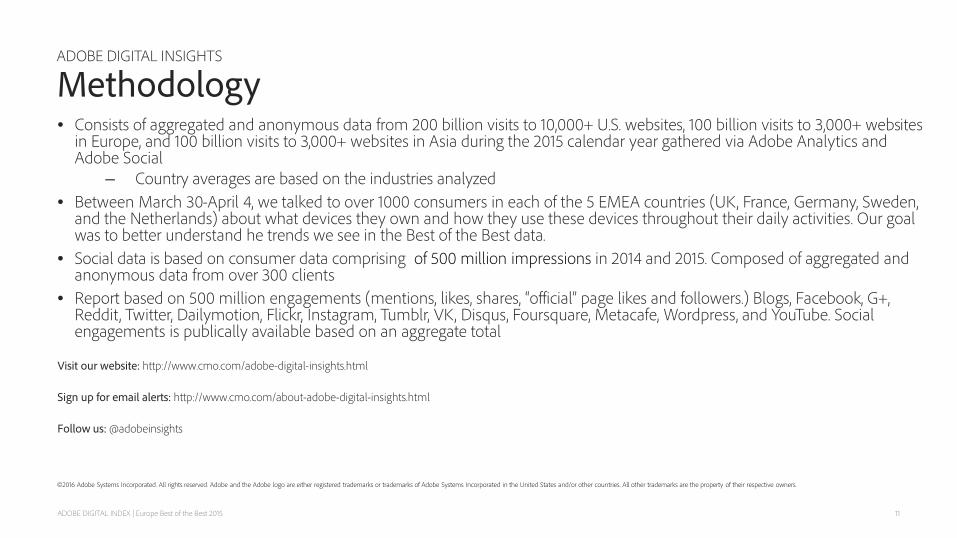
• Consists of aggregated and anonymous data from 200 billion visits to 10,000+ U.S. websites, 100 billion visits to 3,000+ websites in Europe, and 100 billion visits to 3,000+ websites in Asia during the 2015 calendar year gathered via Adobe Analytics and Adobe Social
– Country averages are based on the industries analyzed• Between March 30-April 4, we talked to over 1000 consumers in each of the 5 EMEA countries (UK, France, Germany, Sweden,
and the Netherlands) about what devices they own and how they use these devices throughout their daily activities. Our goal was to better understand he trends we see in the Best of the Best data.
• Social data is based on consumer data comprising of 500 million impressions in 2014 and 2015. Composed of aggregated and anonymous data from over 300 clients
• Report based on 500 million engagements (mentions, likes, shares, “official” page likes and followers.) Blogs, Facebook, G+, Reddit, Twitter, Dailymotion, Flickr, Instagram, Tumblr, VK, Disqus, Foursquare, Metacafe, Wordpress, and YouTube. Social engagements is publically available based on an aggregate total
Visit our website: http://www.cmo.com/adobe-digital-insights.html
Sign up for email alerts: http://www.cmo.com/about-adobe-digital-insights.html
Follow us: @adobeinsights
11
©2016 Adobe Systems Incorporated. All rights reserved. Adobe and the Adobe logo are either registered trademarks or trademarks of Adobe Systems Incorporated in the United States and/or other countries. All other trademarks are the property of their respective owners.
ADOBE DIGITAL INSIGHTS
Methodology
ADOBE DIGITAL INDEX | Europe Best of the Best 2015
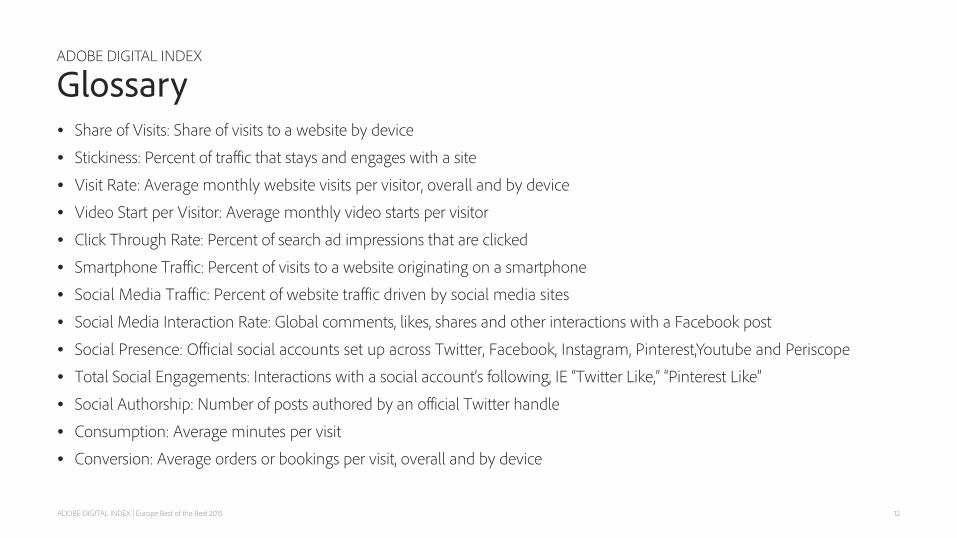
• Share of Visits: Share of visits to a website by device
• Stickiness: Percent of traffic that stays and engages with a site
• Visit Rate: Average monthly website visits per visitor, overall and by device
• Video Start per Visitor: Average monthly video starts per visitor
• Click Through Rate: Percent of search ad impressions that are clicked
• Smartphone Traffic: Percent of visits to a website originating on a smartphone
• Social Media Traffic: Percent of website traffic driven by social media sites
• Social Media Interaction Rate: Global comments, likes, shares and other interactions with a Facebook post
• Social Presence: Official social accounts set up across Twitter, Facebook, Instagram, Pinterest, Youtube and Periscope
• Total Social Engagements: Interactions with a social account’s following, IE “Twitter Like,” “Pinterest Like”
• Social Authorship: Number of posts authored by an official Twitter handle
• Consumption: Average minutes per visit
• Conversion: Average orders or bookings per visit, overall and by device
ADOBE DIGITAL INDEX
Glossary
12ADOBE DIGITAL INDEX | Europe Best of the Best 2015
13
ADOBE DIGITAL INDEX
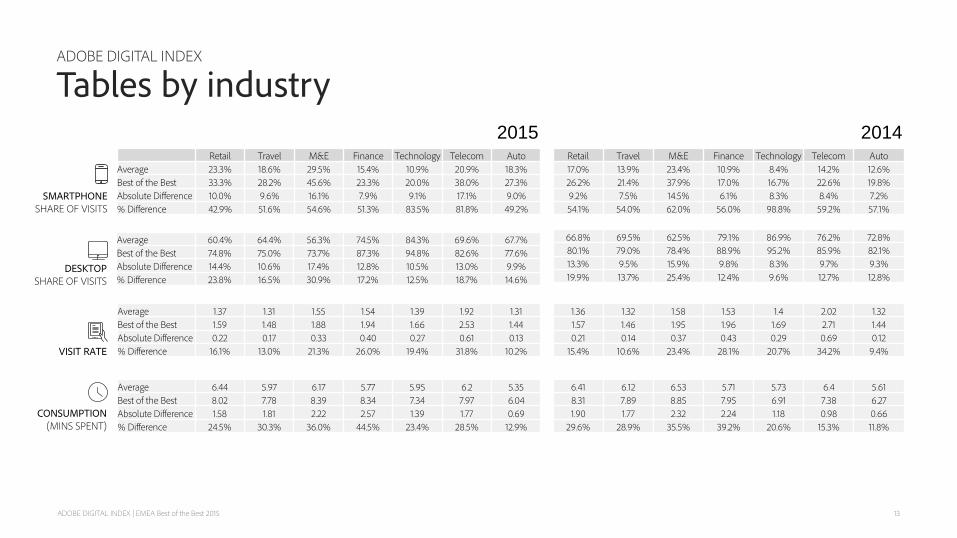
Tables by industry
Retail Travel M&E Finance Technology Telecom AutoAverage 23.3% 18.6% 29.5% 15.4% 10.9% 20.9% 18.3%Best of the Best 33.3% 28.2% 45.6% 23.3% 20.0% 38.0% 27.3%Absolute Difference 10.0% 9.6% 16.1% 7.9% 9.1% 17.1% 9.0%% Difference 42.9% 51.6% 54.6% 51.3% 83.5% 81.8% 49.2%
Average 60.4% 64.4% 56.3% 74.5% 84.3% 69.6% 67.7%Best of the Best 74.8% 75.0% 73.7% 87.3% 94.8% 82.6% 77.6%Absolute Difference 14.4% 10.6% 17.4% 12.8% 10.5% 13.0% 9.9%% Difference 23.8% 16.5% 30.9% 17.2% 12.5% 18.7% 14.6%
Average 6.44 5.97 6.17 5.77 5.95 6.2 5.35Best of the Best 8.02 7.78 8.39 8.34 7.34 7.97 6.04Absolute Difference 1.58 1.81 2.22 2.57 1.39 1.77 0.69% Difference 24.5% 30.3% 36.0% 44.5% 23.4% 28.5% 12.9%
Retail Travel M&E Finance Technology Telecom Auto17.0% 13.9% 23.4% 10.9% 8.4% 14.2% 12.6%26.2% 21.4% 37.9% 17.0% 16.7% 22.6% 19.8%9.2% 7.5% 14.5% 6.1% 8.3% 8.4% 7.2%54.1% 54.0% 62.0% 56.0% 98.8% 59.2% 57.1%
66.8% 69.5% 62.5% 79.1% 86.9% 76.2% 72.8%80.1% 79.0% 78.4% 88.9% 95.2% 85.9% 82.1%13.3% 9.5% 15.9% 9.8% 8.3% 9.7% 9.3%19.9% 13.7% 25.4% 12.4% 9.6% 12.7% 12.8%
6.41 6.12 6.53 5.71 5.73 6.4 5.618.31 7.89 8.85 7.95 6.91 7.38 6.271.90 1.77 2.32 2.24 1.18 0.98 0.66
29.6% 28.9% 35.5% 39.2% 20.6% 15.3% 11.8%
2015 2014
SMARTPHONESHARE OF VISITS
DESKTOPSHARE OF VISITS
Average 1.37 1.31 1.55 1.54 1.39 1.92 1.31Best of the Best 1.59 1.48 1.88 1.94 1.66 2.53 1.44Absolute Difference 0.22 0.17 0.33 0.40 0.27 0.61 0.13% Difference 16.1% 13.0% 21.3% 26.0% 19.4% 31.8% 10.2%
1.36 1.32 1.58 1.53 1.4 2.02 1.321.57 1.46 1.95 1.96 1.69 2.71 1.440.21 0.14 0.37 0.43 0.29 0.69 0.12
15.4% 10.6% 23.4% 28.1% 20.7% 34.2% 9.4%VISIT RATE
ADOBE DIGITAL INDEX | EMEA Best of the Best 2015
CONSUMPTION(MINS SPENT)
14
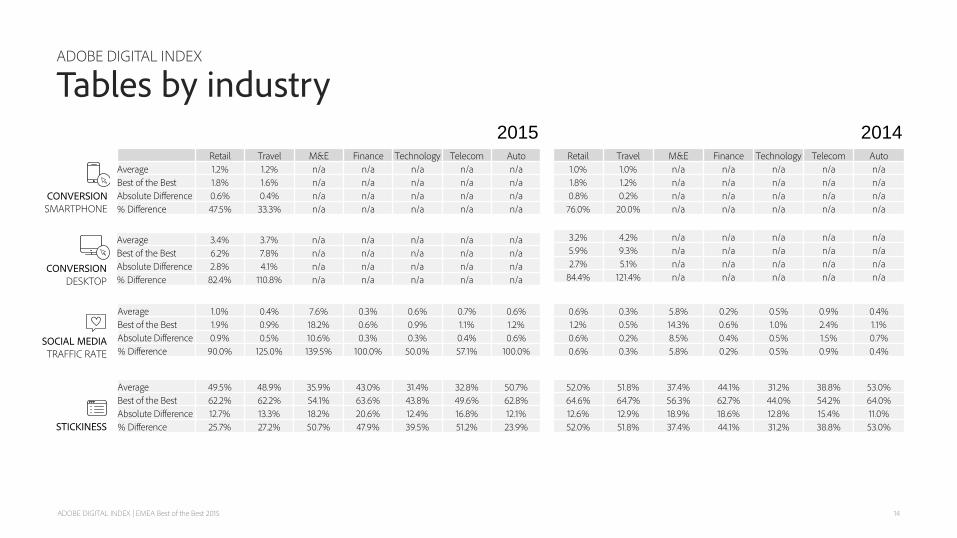
ADOBE DIGITAL INDEX
Tables by industry
STICKINESS
SOCIAL MEDIATRAFFIC RATE
ADOBE DIGITAL INDEX | EMEA Best of the Best 2015
CONVERSIONSMARTPHONE
CONVERSIONDESKTOP
Retail Travel M&E Finance Technology Telecom AutoAverage 1.2% 1.2% n/a n/a n/a n/a n/aBest of the Best 1.8% 1.6% n/a n/a n/a n/a n/aAbsolute Difference 0.6% 0.4% n/a n/a n/a n/a n/a% Difference 47.5% 33.3% n/a n/a n/a n/a n/a
Average 3.4% 3.7% n/a n/a n/a n/a n/aBest of the Best 6.2% 7.8% n/a n/a n/a n/a n/aAbsolute Difference 2.8% 4.1% n/a n/a n/a n/a n/a% Difference 82.4% 110.8% n/a n/a n/a n/a n/a
Average 49.5% 48.9% 35.9% 43.0% 31.4% 32.8% 50.7%Best of the Best 62.2% 62.2% 54.1% 63.6% 43.8% 49.6% 62.8%Absolute Difference 12.7% 13.3% 18.2% 20.6% 12.4% 16.8% 12.1%% Difference 25.7% 27.2% 50.7% 47.9% 39.5% 51.2% 23.9%
Retail Travel M&E Finance Technology Telecom Auto1.0% 1.0% n/a n/a n/a n/a n/a1.8% 1.2% n/a n/a n/a n/a n/a0.8% 0.2% n/a n/a n/a n/a n/a76.0% 20.0% n/a n/a n/a n/a n/a
3.2% 4.2% n/a n/a n/a n/a n/a5.9% 9.3% n/a n/a n/a n/a n/a2.7% 5.1% n/a n/a n/a n/a n/a
84.4% 121.4% n/a n/a n/a n/a n/a
52.0% 51.8% 37.4% 44.1% 31.2% 38.8% 53.0%64.6% 64.7% 56.3% 62.7% 44.0% 54.2% 64.0%12.6% 12.9% 18.9% 18.6% 12.8% 15.4% 11.0%52.0% 51.8% 37.4% 44.1% 31.2% 38.8% 53.0%
2015 2014
Average 1.0% 0.4% 7.6% 0.3% 0.6% 0.7% 0.6%Best of the Best 1.9% 0.9% 18.2% 0.6% 0.9% 1.1% 1.2%Absolute Difference 0.9% 0.5% 10.6% 0.3% 0.3% 0.4% 0.6%% Difference 90.0% 125.0% 139.5% 100.0% 50.0% 57.1% 100.0%
0.6% 0.3% 5.8% 0.2% 0.5% 0.9% 0.4%1.2% 0.5% 14.3% 0.6% 1.0% 2.4% 1.1%0.6% 0.2% 8.5% 0.4% 0.5% 1.5% 0.7%0.6% 0.3% 5.8% 0.2% 0.5% 0.9% 0.4%
15
ADOBE DIGITAL INDEX
Tables by country
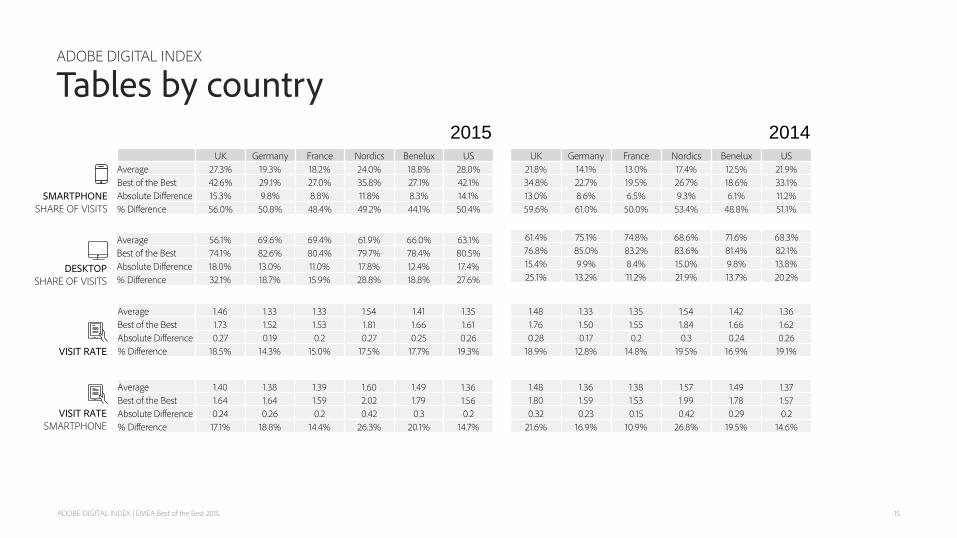
UK Germany France Nordics Benelux USAverage 27.3% 19.3% 18.2% 24.0% 18.8% 28.0%Best of the Best 42.6% 29.1% 27.0% 35.8% 27.1% 42.1%Absolute Difference 15.3% 9.8% 8.8% 11.8% 8.3% 14.1%% Difference 56.0% 50.8% 48.4% 49.2% 44.1% 50.4%
Average 56.1% 69.6% 69.4% 61.9% 66.0% 63.1%Best of the Best 74.1% 82.6% 80.4% 79.7% 78.4% 80.5%Absolute Difference 18.0% 13.0% 11.0% 17.8% 12.4% 17.4%% Difference 32.1% 18.7% 15.9% 28.8% 18.8% 27.6%
Average 1.40 1.38 1.39 1.60 1.49 1.36Best of the Best 1.64 1.64 1.59 2.02 1.79 1.56Absolute Difference 0.24 0.26 0.2 0.42 0.3 0.2% Difference 17.1% 18.8% 14.4% 26.3% 20.1% 14.7%
UK Germany France Nordics Benelux US21.8% 14.1% 13.0% 17.4% 12.5% 21.9%34.8% 22.7% 19.5% 26.7% 18.6% 33.1%13.0% 8.6% 6.5% 9.3% 6.1% 11.2%59.6% 61.0% 50.0% 53.4% 48.8% 51.1%
61.4% 75.1% 74.8% 68.6% 71.6% 68.3%76.8% 85.0% 83.2% 83.6% 81.4% 82.1%15.4% 9.9% 8.4% 15.0% 9.8% 13.8%25.1% 13.2% 11.2% 21.9% 13.7% 20.2%
1.48 1.36 1.38 1.57 1.49 1.371.80 1.59 1.53 1.99 1.78 1.570.32 0.23 0.15 0.42 0.29 0.2
21.6% 16.9% 10.9% 26.8% 19.5% 14.6%
2015 2014
SMARTPHONESHARE OF VISITS
DESKTOPSHARE OF VISITS
VISIT RATESMARTPHONE
Average 1.46 1.33 1.33 1.54 1.41 1.35Best of the Best 1.73 1.52 1.53 1.81 1.66 1.61Absolute Difference 0.27 0.19 0.2 0.27 0.25 0.26% Difference 18.5% 14.3% 15.0% 17.5% 17.7% 19.3%
1.48 1.33 1.35 1.54 1.42 1.361.76 1.50 1.55 1.84 1.66 1.620.28 0.17 0.2 0.3 0.24 0.26
18.9% 12.8% 14.8% 19.5% 16.9% 19.1%VISIT RATE
ADOBE DIGITAL INDEX | EMEA Best of the Best 2015

16
ADOBE DIGITAL INDEX
Tables by country
VISIT RATEDESKTOP
CONSUMPTION(MINS SPENT)
CONVERSIONDESKTOP
CONVERSIONSMARTPHONE
UK Germany France Nordics Benelux USAverage 1.44 1.40 1.38 1.66 1.55 1.43Best of the Best 1.75 1.61 1.59 2.16 1.92 1.74Absolute Difference 0.31 0.21 0.21 0.5 0.37 0.31% Difference 21.5% 15.0% 15.2% 30.1% 23.9% 21.7%
Average 5.53 5.97 6.51 6.08 6.25 5.04Best of the Best 7.31 8.09 8.36 7.91 8.58 6.75Absolute Difference 1.78 2.12 1.85 1.83 2.33 1.71% Difference 32.2% 35.5% 28.4% 30.1% 37.3% 33.9%
Average 3.8% 3.11% 3.15% 3.8% 3.49% 1.8%Best of the Best 7.9% 6.11% 4.54% 6.6% 8.36% 3.8%Absolute Difference 4.1% 3.0% 1.4% 2.8% 4.9% 2.0%% Difference 107.9% 96.5% 44.1% 73.8% 139.5% 110.1%
UK Germany France Nordics Benelux US1.54 1.39 1.39 1.71 1.54 1.441.91 1.60 1.59 2.26 1.85 1.750.37 0.21 0.2 0.55 0.31 0.31
24.0% 15.1% 14.4% 32.2% 20.1% 21.5%
5.67 6.03 6.51 6.15 6.57 5.147.34 8.27 8.40 7.98 9.57 6.881.67 2.24 1.89 1.83 3 1.74
29.5% 37.1% 29.0% 29.8% 45.7% 33.9%
3.7% 2.92% 3.22% 3.8% 2.9% 2.0%7.5% 5.74% 5.05% 6.5% 6.4% 3.8%3.8% 2.8% 1.8% 2.7% 3.5% 1.8%
102.7% 96.6% 56.8% 71.8% 120.8% 89.4%
2015 2014
Average 1.2% 1.13% 0.88% 1.19% 0.62% 0.6%Best of the Best 2.1% 2.12% 0.82% 1.99% 1.00% 1.2%Absolute Difference 0.9% 1.0% -0.1% 0.8% 0.4% 0.6%% Difference 75.0% 87.6% -6.8% 67.2% 61.3% 106.9%
1.0% 1.07% 0.93% 1.1% 0.4% 0.6%2.0% 2.06% 1.03% 2.1% 0.7% 1.1%1.0% 1.0% 0.1% 1.0% 0.3% 0.5%
100.0% 92.5% 10.8% 87.4% 61.0% 96.4%
ADOBE DIGITAL INDEX | EMEA Best of the Best 2015
17ADOBE DIGITAL INDEX | EMEA Best of the Best 2015
ADOBE DIGITAL INDEX
Tables by country
SOCIAL MEDIATRAFFIC RATE
STICKINESS
UK Germany France Nordics Benelux USAverage 4.6% 0.54% 0.69% 1.3% 1.1% 3.7%Best of the Best 6.3% 0.99% 1.25% 2.5% 1.7% 6.9%Absolute Difference 1.7% 0.5% 0.6% 1.2% 0.6% 3.2%% Difference 37.0% 83.3% 81.2% 92.3% 54.5% 86.5%
Average 39.6% 42.8% 42.2% 45.8% 44.0% 32.6%Best of the Best 59.7% 60.9% 59.0% 61.5% 56.8% 48.4%Absolute Difference 20.1% 18.1% 16.8% 15.7% 12.8% 15.8%% Difference 50.8% 42.3% 39.8% 34.2% 29.1% 48.5%
UK Germany France Nordics Benelux US3.4% 0.47% 0.55% 1.0% 0.92% 2.1%6.8% 0.85% 0.94% 1.8% 1.6% 4.3%3.4% 0.4% 0.4% 0.8% 0.7% 2.2%
100.0% 80.9% 70.9% 80.0% 73.9% 104.8%
41.9% 44.6% 43.6% 46.7% 47.2% 35.0%61.2% 61.2% 61.2% 61.5% 60.7% 51.4%19.3% 16.6% 17.6% 14.8% 13.5% 16.4%46.1% 37.2% 40.4% 31.8% 28.6% 46.9%
2015 2014