ADF Project Final Report Format - SaskCanola
45
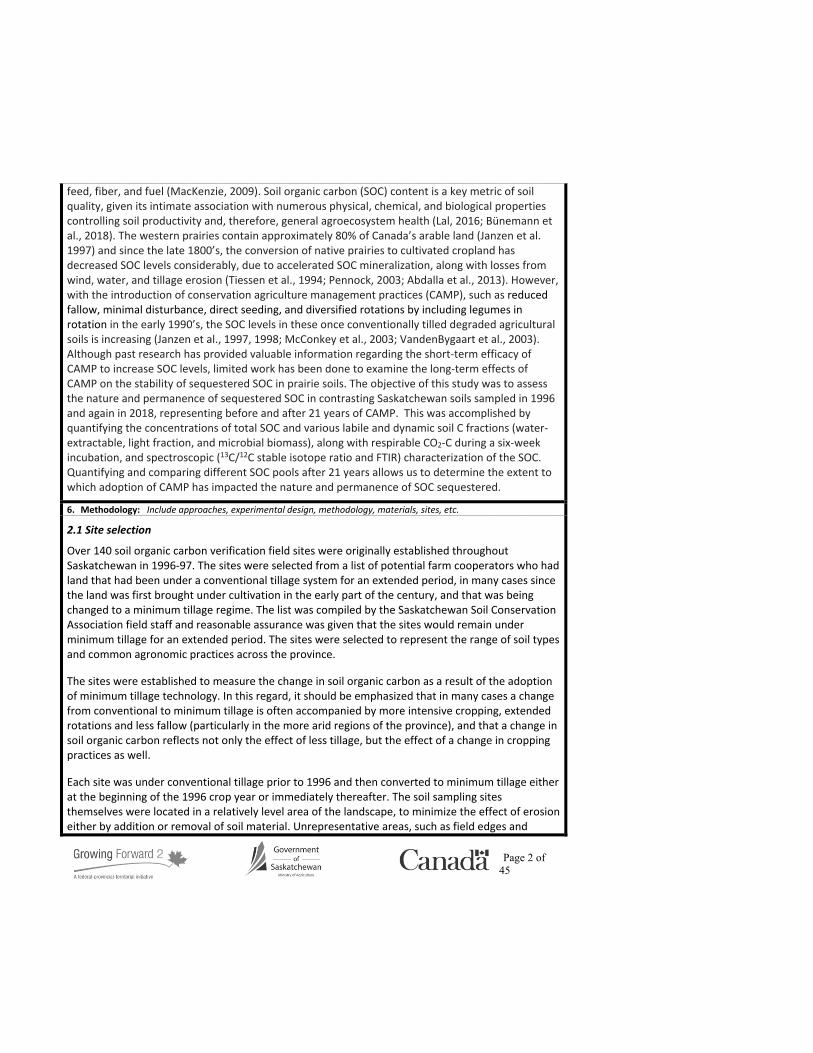
ADF Project Final Report Format 1. Project title and ADF file number. ADF# 20170232, Monitoring SOC on commercial direct-seeded fields across Saskatchewan - Phase 4 Soil Carbon Nature and Permanence Component 2. Name of the Principal Investigator and contact information. Dr. Jeff Schoenau Dept. of Soil Science, U of S 51 Campus Drive Saskatoon SK S7N 5A8 (306) 966-6844 [email protected] 3. Name of the collaborators and contact information. Dr. Ryan Hangs Dept. of Soil Science, U of S (306) 966-6838 [email protected] 4. Abstract/ Summary: This must include project objectives, results, and conclusions for use in publications and in the Ministry database. Maximum of 300 words in lay language. Soils are the largest terrestrial carbon sink on Earth and increasing soil organic carbon (SOC) content is a means of sequestering atmospheric CO2. Limited work has been done to examine the effect of long-term conservation agriculture management practices on the stability of SOC in prairie soils. The objective of this study was to assess the nature and permanence of sequestered SOC in contrasting Saskatchewan soils after 21 years of conservation management practices. Ninety fields were sampled in 1996 and again at the same locations in 2018. The fields represent a diverse collection of soil types from within the five soil zones of the province. Comparisons were made between the 1996 and 2018 soils (0-10 cm) in SOC concentration, along with various labile and dynamic SOC fractions: water-extractable (WEOC), light fraction (LF-C), microbial biomass (MB-C), and respirable CO2-C during a six-week incubation. Spectroscopy (isotope mass and FTIR) was also used to determine the chemical nature of the SOC. Regardless of soil zone, soils with the smallest initial SOC content accumulated more SOC (ranging from 4.7-9.8 Mg C/ha or 220-454 kg C/ha/year). There was a minor increase in WEOC content (3%), no change in LF-C content, and a substantial increase in MB-C content (41%). Except for greater CO2-C emissions from the 2018 Black soils, there was no difference in CO2-C emissions or percentage of SOC respired between the 2018 and 1996 soils, which suggests similar or greater permanence of the sequestered SOC. Our results suggest that after 21 years of conservation management practices, more of the SOC is present in an active, dynamic fraction that contributes to soil health and nutrient cycling. 5. Introduction: Brief project background and rationale. With Earth’s population expected to surpass nine billion by 2050, it is increasingly important to ensure that arable soil quality is maintained or enhanced, to sustainably produce adequate food,
Transcript of ADF Project Final Report Format - SaskCanola
ADF Project Final Report Format
1. Project title and ADF file number.
ADF# 20170232, Monitoring SOC on commercial direct-seeded fields across Saskatchewan - Phase 4
Soil Carbon Nature and Permanence Component
2. Name of the Principal Investigator and contact information.
Dr. Jeff Schoenau Dept. of Soil Science, U of S 51 Campus Drive Saskatoon SK S7N 5A8 (306) [email protected]
3. Name of the collaborators and contact information.
Dr. Ryan Hangs Dept. of Soil Science, U of S (306) [email protected]
4. Abstract/ Summary: This must include project objectives, results, and conclusions for use in publications and in the Ministry database. Maximum of 300 words in lay language.
Soils are the largest terrestrial carbon sink on Earth and increasing soil organic carbon (SOC) content is a means of sequestering atmospheric CO2. Limited work has been done to examine the effect of long-term conservation agriculture management practices on the stability of SOC in prairie soils. The objective of this study was to assess the nature and permanence of sequestered SOC in contrasting Saskatchewan soils after 21 years of conservation management practices. Ninety fields were sampled in 1996 and again at the same locations in 2018. The fields represent a diverse collection of soil types from within the five soil zones of the province. Comparisons were made between the 1996 and 2018 soils (0-10 cm) in SOC concentration, along with various labile and dynamic SOC fractions: water-extractable (WEOC), light fraction (LF-C), microbial biomass (MB-C), and respirable CO2-C during a six-week incubation. Spectroscopy (isotope mass and FTIR) was also used to determine the chemical nature of the SOC. Regardless of soil zone, soils with the smallest initial SOC content accumulated more SOC (ranging from 4.7-9.8 Mg C/ha or 220-454 kg C/ha/year). There was a minor increase in WEOC content (3%), no change in LF-C content, and a substantial increase in MB-C content (41%). Except for greater CO2-C emissions from the 2018 Black soils, there was no difference in CO2-C emissions or percentage of SOC respired between the 2018 and 1996 soils, which suggests similar or greater permanence of the sequestered SOC. Our results suggest that after 21 years of conservation management practices, more of the SOC is present in an active, dynamic fraction that contributes to soil health and nutrient cycling.
5. Introduction: Brief project background and rationale.
With Earth’s population expected to surpass nine billion by 2050, it is increasingly important to ensure that arable soil quality is maintained or enhanced, to sustainably produce adequate food,
Page 2 of 45
feed, fiber, and fuel (MacKenzie, 2009). Soil organic carbon (SOC) content is a key metric of soil quality, given its intimate association with numerous physical, chemical, and biological properties controlling soil productivity and, therefore, general agroecosystem health (Lal, 2016; Bünemann et al., 2018). The western prairies contain approximately 80% of Canada’s arable land (Janzen et al. 1997) and since the late 1800’s, the conversion of native prairies to cultivated cropland has decreased SOC levels considerably, due to accelerated SOC mineralization, along with losses from wind, water, and tillage erosion (Tiessen et al., 1994; Pennock, 2003; Abdalla et al., 2013). However, with the introduction of conservation agriculture management practices (CAMP), such as reduced fallow, minimal disturbance, direct seeding, and diversified rotations by including legumes in rotation in the early 1990’s, the SOC levels in these once conventionally tilled degraded agricultural soils is increasing (Janzen et al., 1997, 1998; McConkey et al., 2003; VandenBygaart et al., 2003). Although past research has provided valuable information regarding the short-term efficacy of CAMP to increase SOC levels, limited work has been done to examine the long-term effects of CAMP on the stability of sequestered SOC in prairie soils. The objective of this study was to assess the nature and permanence of sequestered SOC in contrasting Saskatchewan soils sampled in 1996 and again in 2018, representing before and after 21 years of CAMP. This was accomplished by quantifying the concentrations of total SOC and various labile and dynamic soil C fractions (water-extractable, light fraction, and microbial biomass), along with respirable CO2-C during a six-week incubation, and spectroscopic (13C/12C stable isotope ratio and FTIR) characterization of the SOC. Quantifying and comparing different SOC pools after 21 years allows us to determine the extent to which adoption of CAMP has impacted the nature and permanence of SOC sequestered.
6. Methodology: Include approaches, experimental design, methodology, materials, sites, etc.
2.1 Site selection
Over 140 soil organic carbon verification field sites were originally established throughout Saskatchewan in 1996-97. The sites were selected from a list of potential farm cooperators who had land that had been under a conventional tillage system for an extended period, in many cases since the land was first brought under cultivation in the early part of the century, and that was being changed to a minimum tillage regime. The list was compiled by the Saskatchewan Soil Conservation Association field staff and reasonable assurance was given that the sites would remain under minimum tillage for an extended period. The sites were selected to represent the range of soil types and common agronomic practices across the province.
The sites were established to measure the change in soil organic carbon as a result of the adoption of minimum tillage technology. In this regard, it should be emphasized that in many cases a change from conventional to minimum tillage is often accompanied by more intensive cropping, extended rotations and less fallow (particularly in the more arid regions of the province), and that a change in soil organic carbon reflects not only the effect of less tillage, but the effect of a change in cropping practices as well.
Each site was under conventional tillage prior to 1996 and then converted to minimum tillage either at the beginning of the 1996 crop year or immediately thereafter. The soil sampling sites themselves were located in a relatively level area of the landscape, to minimize the effect of erosion either by addition or removal of soil material. Unrepresentative areas, such as field edges and
Page 3 of 45
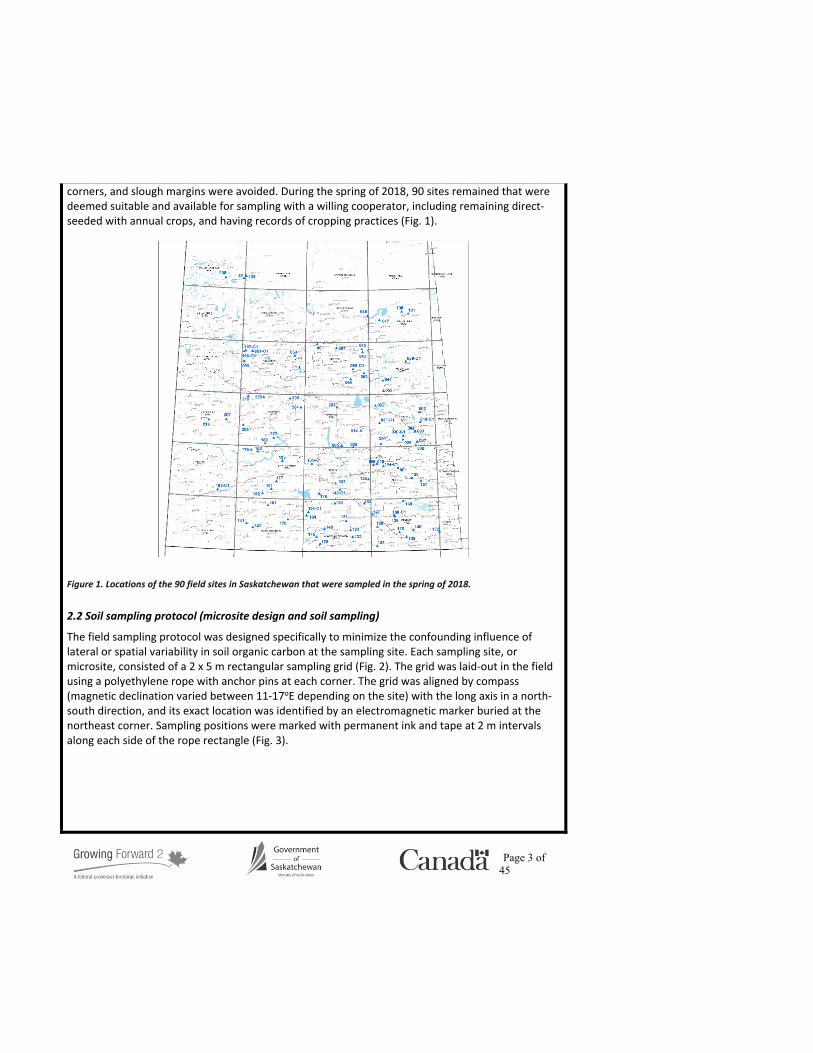
corners, and slough margins were avoided. During the spring of 2018, 90 sites remained that were deemed suitable and available for sampling with a willing cooperator, including remaining direct-seeded with annual crops, and having records of cropping practices (Fig. 1).
Figure 1. Locations of the 90 field sites in Saskatchewan that were sampled in the spring of 2018.
2.2 Soil sampling protocol (microsite design and soil sampling)
The field sampling protocol was designed specifically to minimize the confounding influence of lateral or spatial variability in soil organic carbon at the sampling site. Each sampling site, or microsite, consisted of a 2 x 5 m rectangular sampling grid (Fig. 2). The grid was laid-out in the field using a polyethylene rope with anchor pins at each corner. The grid was aligned by compass (magnetic declination varied between 11-17oE depending on the site) with the long axis in a north-south direction, and its exact location was identified by an electromagnetic marker buried at the northeast corner. Sampling positions were marked with permanent ink and tape at 2 m intervals along each side of the rope rectangle (Fig. 3).

Page 4 of 45
Figure 2. Microsite design showing the sampling locations for all years.
Figure 3. Microsite design set up prior to collecting the 2018 samples.

Page 5 of 45
The location of the microsite within the field was recorded relative to a permanent benchmark using standard surveying techniques as well as a GPS co-ordinates. In most cases a photograph showing the location of the microsite in relation to surrounding features was also taken. Pertinent information concerning the soil type and landscape characteristics of the field was recorded. Information was also solicited from the farmer cooperator regarding the past cropping and management history and yearly information regarding the type of crop, the yield, any tillage practices used (high or low disturbance), fertilizer, and pesticide applications.
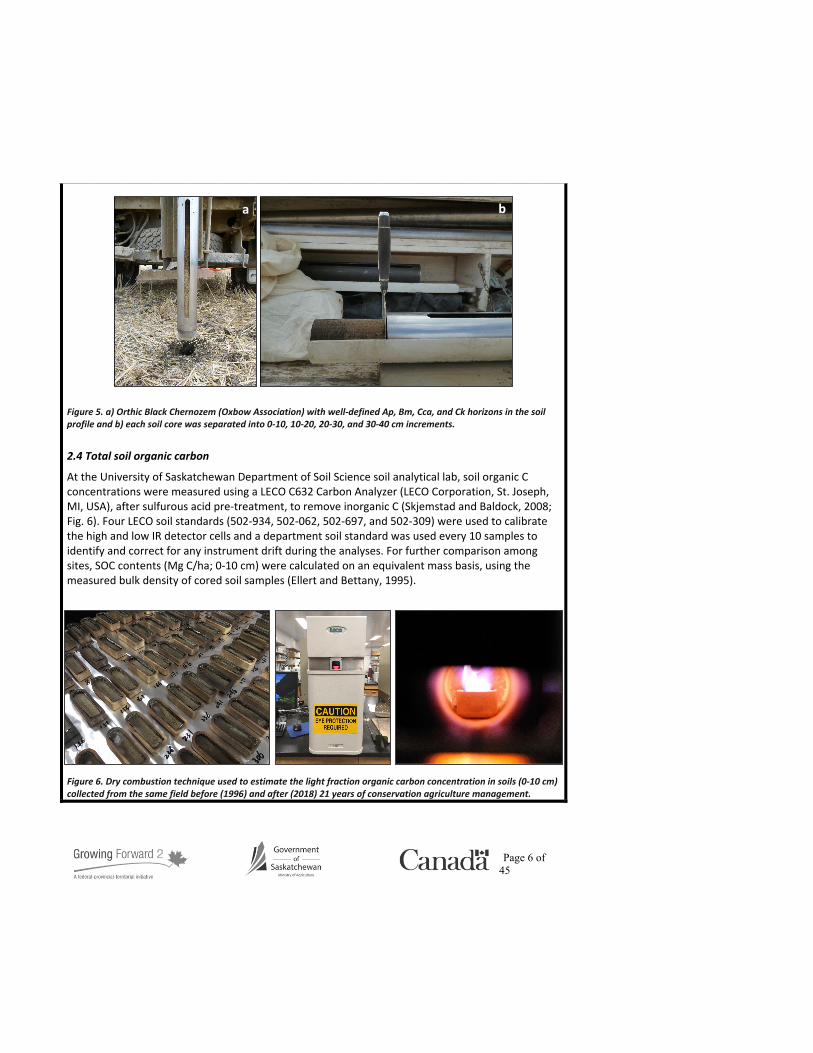
In the spring of 2018, two sampling crews travelled to the 90 sites, found the buried site locators, and collected core samples using punch trucks during a three-week period starting at the beginning of May (Fig. 4). The U of S sampling team drove more than 6500 kms during this period and the AAFC team a similar amount. At each microsite, six soil cores (approx. 7 cm in diameter and at least 40 cm deep), were taken at the prescribed 2 m intervals along each side of the grid using a Giddings hydraulic, truck-mounted soil coring machine (Fig. 5a). Each core was divided into four 10-cm segments (0-10, 10-20, 20-30, and 30-40 cm) and double-bagged for transit (Fig. 5b).
Figure 4. The AAFC (Elijah Atuku and Blair McCann) and U of S (Ranjan Kar and Ryan Hangs) soil sampling crews.
2.3 Soil sample preparation
All soil samples were air dried at room temperature and then a subsample was weighed before and after being in oven at 105oC overnight to determine oven-dry moisture content to calculate bulk density. For each site, the soil samples among the six sampling points were then composited by depth. The composited samples were ground through a 2-mm sieve in a barrel roller. The composited samples were divided between the AAFC and U of S research groups for their respective analyses and archiving.
Page 6 of 45
Figure 5. a) Orthic Black Chernozem (Oxbow Association) with well-defined Ap, Bm, Cca, and Ck horizons in the soil profile and b) each soil core was separated into 0-10, 10-20, 20-30, and 30-40 cm increments.
2.4 Total soil organic carbon
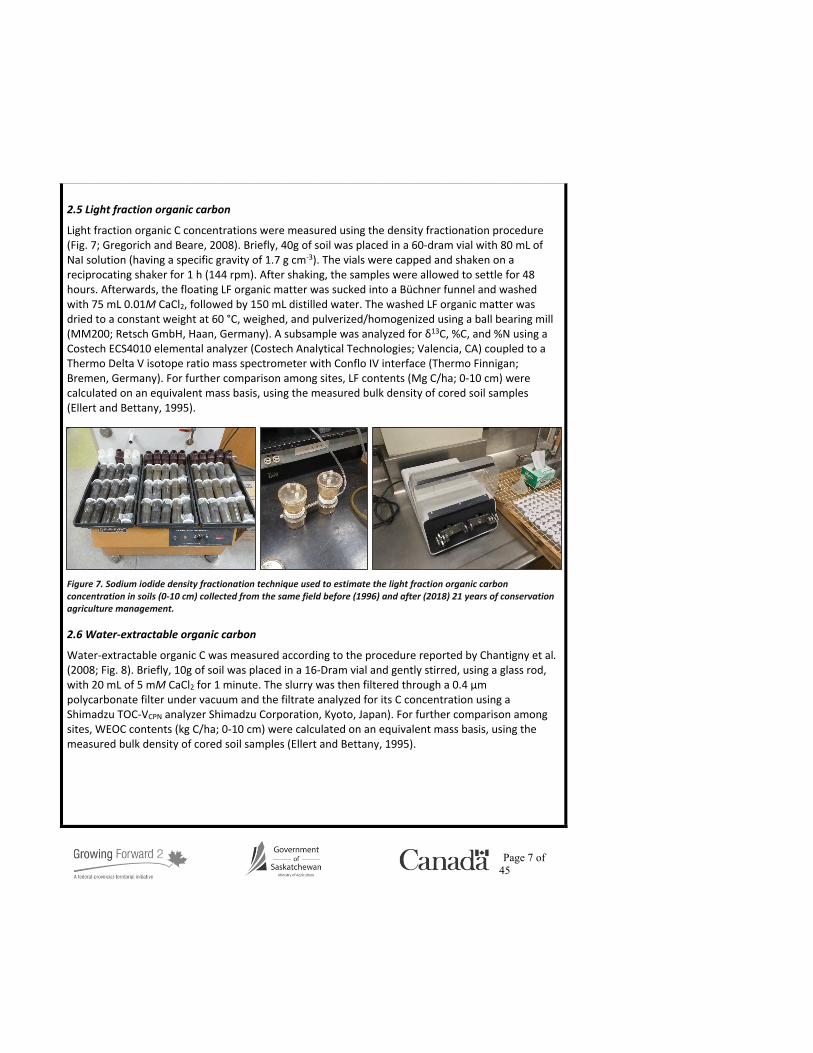
At the University of Saskatchewan Department of Soil Science soil analytical lab, soil organic C concentrations were measured using a LECO C632 Carbon Analyzer (LECO Corporation, St. Joseph, MI, USA), after sulfurous acid pre-treatment, to remove inorganic C (Skjemstad and Baldock, 2008; Fig. 6). Four LECO soil standards (502-934, 502-062, 502-697, and 502-309) were used to calibrate the high and low IR detector cells and a department soil standard was used every 10 samples to identify and correct for any instrument drift during the analyses. For further comparison among sites, SOC contents (Mg C/ha; 0-10 cm) were calculated on an equivalent mass basis, using the measured bulk density of cored soil samples (Ellert and Bettany, 1995).
Figure 6. Dry combustion technique used to estimate the light fraction organic carbon concentration in soils (0-10 cm) collected from the same field before (1996) and after (2018) 21 years of conservation agriculture management.
a b
Page 7 of 45
2.5 Light fraction organic carbon
Light fraction organic C concentrations were measured using the density fractionation procedure (Fig. 7; Gregorich and Beare, 2008). Briefly, 40g of soil was placed in a 60-dram vial with 80 mL of NaI solution (having a specific gravity of 1.7 g cm-3). The vials were capped and shaken on a reciprocating shaker for 1 h (144 rpm). After shaking, the samples were allowed to settle for 48 hours. Afterwards, the floating LF organic matter was sucked into a Büchner funnel and washed with 75 mL 0.01M CaCl2, followed by 150 mL distilled water. The washed LF organic matter was dried to a constant weight at 60 °C, weighed, and pulverized/homogenized using a ball bearing mill (MM200; Retsch GmbH, Haan, Germany). A subsample was analyzed for δ13C, %C, and %N using a Costech ECS4010 elemental analyzer (Costech Analytical Technologies; Valencia, CA) coupled to a Thermo Delta V isotope ratio mass spectrometer with Conflo IV interface (Thermo Finnigan; Bremen, Germany). For further comparison among sites, LF contents (Mg C/ha; 0-10 cm) were calculated on an equivalent mass basis, using the measured bulk density of cored soil samples (Ellert and Bettany, 1995).
Figure 7. Sodium iodide density fractionation technique used to estimate the light fraction organic carbon concentration in soils (0-10 cm) collected from the same field before (1996) and after (2018) 21 years of conservation agriculture management.
2.6 Water-extractable organic carbon
Water-extractable organic C was measured according to the procedure reported by Chantigny et al. (2008; Fig. 8). Briefly, 10g of soil was placed in a 16-Dram vial and gently stirred, using a glass rod, with 20 mL of 5 mM CaCl2 for 1 minute. The slurry was then filtered through a 0.4 μm polycarbonate filter under vacuum and the filtrate analyzed for its C concentration using a Shimadzu TOC-VCPN analyzer Shimadzu Corporation, Kyoto, Japan). For further comparison among sites, WEOC contents (kg C/ha; 0-10 cm) were calculated on an equivalent mass basis, using the measured bulk density of cored soil samples (Ellert and Bettany, 1995).

Page 8 of 45
Figure 8. Chemical extraction procedure and analytical instrument used to estimate the water-extractable organic carbon concentration in soils (0-10 cm) collected from the same field before (1996) and after (2018) 21 years of conservation agriculture management.
2.7 Microbial biomass carbon
Microbial biomass carbon is estimated using the fumigation-extraction method outlined by Voroney et al. (2008; Fig. 9). Briefly, after the incubation study, four 30 g subsamples soil of each soil were placed in 100 mL glass bottles. Two of the 30 g subsamples soil from each sample were extracted immediately by adding 0.5 M K2SO4 at a ratio of 4:1 (K2SO4 volume (mL): dry soil (g)), shaking @ 200 rpm on an Innova® 2300 platform shaker (New Brunswick Scientific, Edison, New Jersey, USA) for one hour, and then filtered through a Whatman 42 filter paper. Dry soil weights were estimated using two 20 g subsamples of each incubated soil that oven dried at 105 °C for 24h, to determine their moisture content. The remaining two 30 g subsamples of each soil were fumigated with chloroform under vacuum for 24h and then extracted using 0.5 M K2SO4 as the unfumigated samples. The underlying principle behind this technique is that chloroform kills all soil microorganisms, while concurrently lysing their cells and liberating the associated cellular carbon fraction for the subsequent 0.5 M K2SO4 extraction. Consequently, the difference in extractable organic carbon values between fumigated and unfumigated samples is a well-established method of estimating microbial biomass carbon in soil (Voroney et al., 2008). The K2SO4 extract was analyzed for its C concentration using a Shimadzu TOC-VCPN analyzer (Shimadzu Corporation, Kyoto, Japan). Microbial biomass C concentrations were calculated according to Alotaibi and Schoenau (2011), using a kEC value of 0.45. For further comparison among sites, MB-C contents (kg C/ha; 0-10 cm) were calculated on an equivalent mass basis, using the measured bulk density of cored soil samples (Ellert and Bettany, 1995).
There were two additional indices of microbial abundance and activity estimated in this study: i) microbial quotient (MiQ; % MB-C/SOC; Alotaibi and Schoenau, 2011) and ii) metabolic quotient (MeQ; mg CO2-C/hour/mg MB-C; Anderson and Domsch, 1993). Specifically, for each soil, MiQ was calculated by dividing the MB-C content by the SOC content, while MeQ was calculated by dividing the hourly microbial CO2-C respiration measurements from the incubation study by the MB-C content.

Page 9 of 45
Figure 9. Soil fumigation-extraction technique used to estimate microbial biomass carbon concentration in soils (0-10 cm) collected from the same field before (1996) and after (2018) 21 years of conservation agriculture management.
2.8 Incubation study (measuring respirable soil carbon)
An incubation study was conducted to estimate the respirable-C fraction within each soil by measuring CO2-C emissions over a six-week period. The incubation study followed the protocol reported in Hangs et al. (2013). Briefly, 500 g of each soil were placed in 0.5L pots and deionized water was added to bring the soil to 75 % field capacity and this moisture level was maintained by monitoring the soil moisture content every two days. In the absence of plants, water loss over the incubation period was minimal and gas samples were never collected less than 24 h after watering. The soils were incubated (20 oC) for six weeks.
At the end of each week, the pots were placed inside of sealed chambers (Fig. 10) for measuring CO2 fluxes. The chamber headspace air (≈ 2605 cm3) was continually mixed by an internal fan (0.037 m3 min−1, Sunon Inc., Brea, CA, USA) to prevent stratification of CO2 during the sampling period. Gas samples were collected after 30 and 60 min with a 20-mL syringe (via a rubber septum on the chamber lid) and transferred to pre-evacuated 12-mL Exetainer™ vials (Labco Ltd., High Wycombe, UK). Several ambient air samples were collected at the beginning of each sampling time, and the mean value was used as the time zero concentration. Gas sample concentrations of CO2 were measured using a LI-7000 CO2/H2O Gas Analyzer (LI-COR Biosciences, Lincoln, NE, USA). Estimates of CO2 flux were calculated as the change in gas concentration during the one-hour sampling period, as described by Ginting et al. (2003) and Agnew et al. (2010). Cumulative gas production over the six-week incubation study was calculated by interpolating between data points and integrating over time assuming a constant flux (Lemke et al., 1999).

Page 10 of 45
Figure 10. Gas-sampling chambers and analytical instrument used to measure CO2 gas emissions from soils (0-10 cm) collected from the same field before (1996) and after (2018) 21 years of conservation agriculture management.
2.9 FTIR spectroscopic characterization of soil organic carbon
Molecular speciation of SOC for finely ground soil samples was determined using ATR-FTIR spectroscopy (Fig. 11). A Bruker Optics Equinox 55 FTIR spectrometer equipped with a Mercury Cadmium Teluride detector was used for ATR-FTIR spectra acquisition. Spectra were collected by averaging 256 scans at 4 cm−1 resolutions over a spectral range of 4000-400 cm−1 and were corrected against the spectrum with ambient air as background. Baseline correction of the spectra was performed using OPUS (ver. 6.5, Bruker Optik GmbH, Ettlingen, Germany) spectral processing software. Individual bands were resolved by spectral deconvolution using a series of Gaussian curves fit in Fityk software (version 1.2.1; Wojdyr 2010) as described in Dhillon et al (2017). The curve parameters were constrained to ensure equal FWHM (full width at half maximum) of the curves. Individual spectral band identification was performed by using the available knowledge of characteristic infrared peak positions of soil organic compounds reported in the literature. The relative absorbance intensities of the ATR-FTIR bands depends on the amount of absorbing functional groups, and was used as a semi-quantitative estimate of the relative proportion of C functional groups on soil organic matter within each soil sample, such that high absorption intensity indicates high content of the corresponding functional group and vice versa (Ellerbrock et al. 1999).
Figure 11. Dr. Gurbir Singh provided his expertise with the FTIR spectroscopic technique for this study, to characterize the different soil organic carbon components in soils (0-10 cm) collected from the same field before (1996) and after (2018) 21 years of conservation agriculture management.
Page 11 of 45
3.0 Statistical analyses
All of the data were analyzed with the GLIMMIX procedure of SAS (Littell et al., 2006; SAS Institute, 2013) with the effect of Site as random (to increase the inference space of the analyses) and the effect of Year, Soil Zone and Week as fixed. For the CO2-C emissions data, further exploratory analyses were conducted to find the best covariance structure to model the repeated measurements across time (Week). The AICc (corrected Akaike’s information) model fit criterion confirmed that that a first-order antedependence was the best covariance structure. The covariance structure and a “_residual_” effect were included in a random statement to model repeated measurements. Contrasts were used to assess Week effects for different levels of Year and Soil Zone. The ‘lines’ option for the LSmeans statement of the GLIMMIX procedure was used to generate letter-based line display for all pair-wise comparisons of means. The letter-based pair-wise comparisons facilitated further exploration of mean differences and a 95% confidence level (i.e., alpha = 5%) was used for all analyses, unless otherwise noted. Finally, a non-linear regression model was fitted to all paired observations of SOC data for the 1996 and the percent change in SOC data for corresponding 2018 samples (n=90), for both concentration and content data, along with 95% confidence intervals created using JMP® (Version 10; SAS Institute, Cary, NC).
7. Research accomplishments: (Describe progress towards meeting objectives. Please use revised objectives ifMinistry-approved revisions have been made to original objectives.)
Objectives Progress
1) Quantify the nature ofsequestered soil carbon (C)on 90 Saskatchewan farmfields, to estimate itspermanence and potential,with the description:
Conduct detailed analysis of the nature and physical situation of soil organic C (SOC), to better understand the mechanisms of sequestration, for better estimation of SOC stability and future sequestration potential capacity using conservation agriculture management practices.
We have completed the desired analyses on the surface soil (0-10 cm increment) from all 90 sites sampled in 2018, along with their corresponding 1996 archived samples that were collected from the same field. Specifically, for each soil sample, we have quantified the concentrations of total SOC, along with various labile and dynamic soil C fractions (i.e., water-extractable, light fraction, microbial biomass, and respirable), and finally, the spectroscopic characterization of the SOC matter using mass spectrometry and FTIR spectroscopy.
8. Discussion: Provide discussion necessary to the full understanding of the results. Where applicable, results should be discussed in the context of existing knowledge and relevant literature. Detail any major concerns or project setbacks.

Page 12 of 45
2.4 Total soil organic carbon
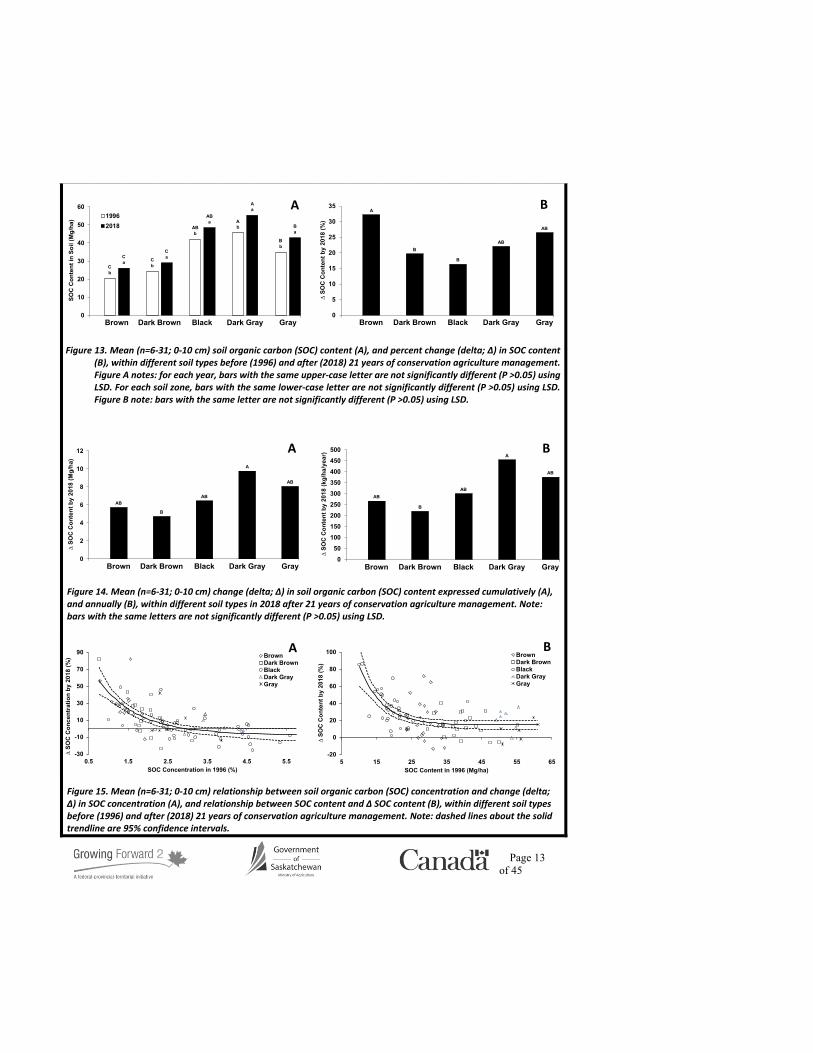
The measured SOC concentration and content ranged from 1.6-3.7% and 20.4-55.4 Mg/ha, respectively (Figs. 12a and 13a), in the 0-10 cm depth, and these values are consistent with published reports of similar Saskatchewan soils (Biederbeck et al., 1994; Lemke et al., 2012; Hangs et al., 2014). As expected, the SOC concentration and content in the Black, Dark Gray, and Gray soils was greater compared to the Brown and Dark Brown soils in 1996. This zonal SOC trend may be explained by environmental conditions and production practices that support higher yields and, therefore, greater above- and below-ground plant residue inputs especially in the moister Black, Dark Gray, and Gray soils, compared to the drier Brown and Dark Brown regions of the province. The SOC concentration for the Black, Dark Gray, and Gray soils under CAMP did not change following 21 years of CAMP, but increased in the Brown and Dark Brown soils (≈15%; Fig. 12a), which is likely a function of the comparatively smaller initial SOC concentrations in these regions, particularly the Brown soils (Fig. 12b). The SOC content within all soil types increased following 21 years of CAMP (≈25%; Fig 13b), ranging from 4.7-9.8 Mg C/ha or 220-454 kg C/ha/year (Fig. 14), which is consistent with values reported elsewhere (Six et al., 2002).
Figure 12. Mean (n=6-31; 0-10 cm) soil organic carbon (SOC) concentration (A), and percent change (delta; ∆) in SOC concentration (B), within different soil types before (1996) and after (2018) 21 years of conservation agriculture management. Figure A notes: for each year, bars with the same upper-case letter are not significantly different (P >0.05) using LSD. For each soil zone, bars with the same lower-case letter are not significantly different (P >0.05s) using LSD. Figure B note: bars with the same letter are not significantly different (P >0.05) using LSD.
Regardless of soil zone, there was a clear trend indicating the soils having the smallest initial SOC amounts being more responsive to the adoption of CAMP and accumulating more SOC over time (Fig. 15). Similar to this regional-scale pattern, the same relationship between initial SOC level and soil C sequestration potential has been reported at the landscape-scale along a catena, with low organic matter knolls accumulating more soil C than footslopes several years after converting marginal annual croplands to perennial forages (Nelson et al., 2008). This zonal trend in SOC level may also reflect historic differences in agronomic practices among the soil zones prior to 1996. Generally speaking, summerfallow was common in the drier Brown and Dark Brown regions into the 1990's, whereas the transition from fallow to continuous cropping was made sooner (i.e., early 80’s)
0
0.5
1
1.5
2
2.5
3
3.5
419962018
Brown Dark Brown Black Dark Gray Gray
SOC
Con
cent
ratio
n in
Soi
l (%
)
Db
Ca
Cb
BCa
Aa
Aa
Aa
Aa
Ba
Ba
A
-5
0
5
10
15
20
25
Brown Dark Brown Black Dark Gray Gray
∆ SO
C C
once
ntra
tion
by 2
018
(%)
A
B
C
BC
BC
B
Page 13 of 45
Figure 13. Mean (n=6-31; 0-10 cm) soil organic carbon (SOC) content (A), and percent change (delta; ∆) in SOC content (B), within different soil types before (1996) and after (2018) 21 years of conservation agriculture management. Figure A notes: for each year, bars with the same upper-case letter are not significantly different (P >0.05) using LSD. For each soil zone, bars with the same lower-case letter are not significantly different (P >0.05) using LSD. Figure B note: bars with the same letter are not significantly different (P >0.05) using LSD.
Figure 14. Mean (n=6-31; 0-10 cm) change (delta; ∆) in soil organic carbon (SOC) content expressed cumulatively (A), and annually (B), within different soil types in 2018 after 21 years of conservation agriculture management. Note: bars with the same letters are not significantly different (P >0.05) using LSD.
Figure 15. Mean (n=6-31; 0-10 cm) relationship between soil organic carbon (SOC) concentration and change (delta; ∆) in SOC concentration (A), and relationship between SOC content and ∆ SOC content (B), within different soil types before (1996) and after (2018) 21 years of conservation agriculture management. Note: dashed lines about the solid trendline are 95% confidence intervals.
0
10
20
30
40
50
6019962018
Brown Dark Brown Black Dark Gray Gray
SOC
Con
tent
in S
oil (
Mg/
ha)
Cb
Ca C
b
Ca
ABb
ABa A
b
Aa
Bb
Ba
A
0
5
10
15
20
25
30
35
Brown Dark Brown Black Dark Gray Gray∆
SOC
Con
tent
by
2018
(%)
A
B
B
AB
AB
B
0
2
4
6
8
10
12
Brown Dark Brown Black Dark Gray Gray
∆ SO
C C
onte
nt b
y 20
18 (M
g/ha
)
AB
B
AB
A
AB
A
050
100150200250300350400450500
Brown Dark Brown Black Dark Gray Gray
∆ SO
C C
onte
nt b
y 20
18 (k
g/ha
/yea
r)
AB
B
AB
A
AB
B
-30
-10
10
30
50
70
90
0.5 1.5 2.5 3.5 4.5 5.5
BrownDark BrownBlackDark GrayGray
SOC Concentration in 1996 (%)
∆ SO
C C
once
ntra
tion
by 2
018
(%)
A
-20
0
20
40
60
80
100
5 15 25 35 45 55 65
BrownDark BrownBlackDark GrayGray
SOC Content in 1996 (Mg/ha)
∆ SO
C C
onte
nt b
y 20
18 (%
)
B

Page 14 of 45
by growers in the Black, Dark Gray, and Gray soil zones and this likely contributed to SOC increases from the 80’s to the mid-90’s in these three zones that were not occurring in the two drier zones. Additionally, despite switching to continuous cropping back in the 80’s, Gray soils are often tilled more frequently, to facilitate soil warming and straw decomposition within these relatively cooler environments, which would have increased soil C mineralization losses. Lastly, our results appear to support the soil C-saturation concept of reaching a SOC equilibrium level (i.e., minimal change in steady-state SOC amount despite increasing C inputs) often reported in the literature (e.g., Stewart et al, 2007). Consequently, SOC levels are believed to stabilize at some point, depending on soil type and management system, with the greatest soil C sequestration potential occurring in low SOC content soils, which are further from their specific C saturation level (Lemke et al., 2012; Stewart et al, 2007 and 2009; Pravia et al., 2019).
2.5 Light fraction organic carbon amounts and stable carbon isotope ratios
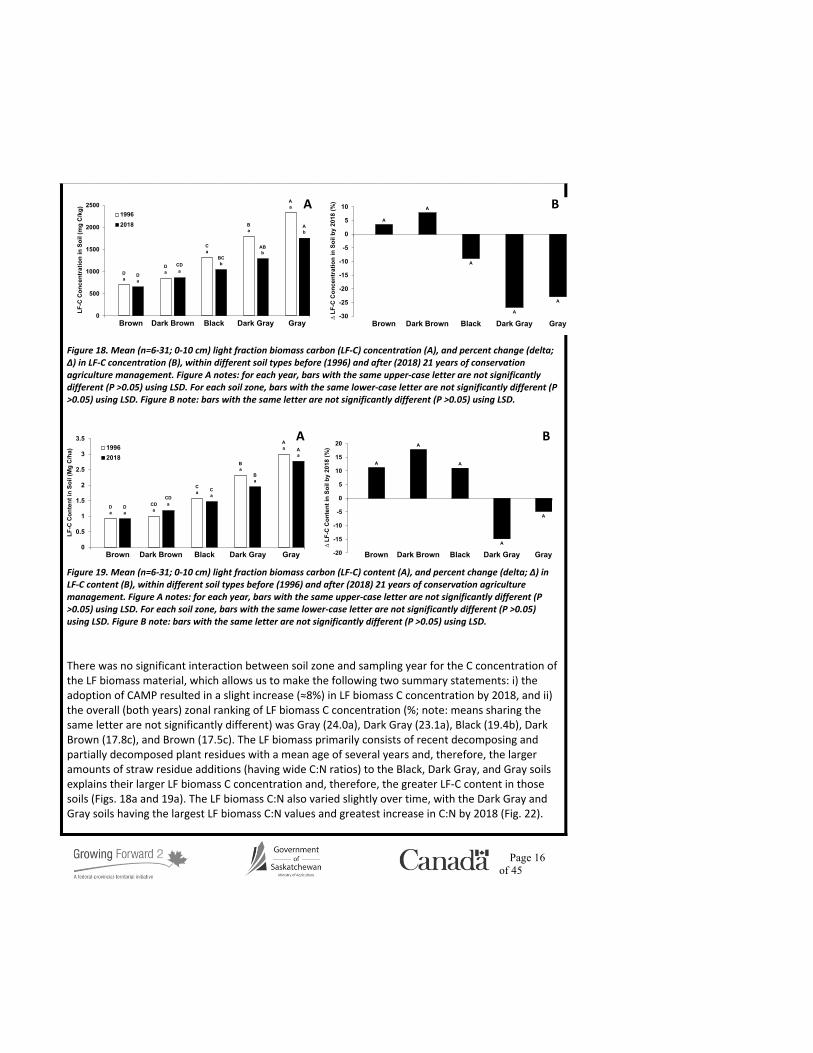
The measured LF biomass concentration and content ranged from 3,787-10,083 mg/kg and 5.3-13.0 Mg/ha, respectively (Figs. 16 and 17), and are consistent with values reported elsewhere (e.g. Janzen et al., 1992; Tan et al., 2007; Gosling et al., 2013). The observed trend in LF biomass concentration and content among soil zones is consistent with the geoclimatic trend in total SOC levels; namely, the LF biomass concentration and content in the Black, Dark Gray, and Gray soils was greater (≈80 and 75%, respectively) compared to the Brown and Dark Brown soils. The more favourable soil moisture conditions supported higher yields and, therefore, greater plant residue inputs to the Black, Dark Gray, and Gray soils, compared to the Brown and Dark Brown soils in 1996, but was less apparent in 2018 (≈45 and 20% greater, respectively, Figs. 16 and 17) that may be related to overall more moist conditions experienced across Saskatchewan in the past two decades compared to the 1980’s and 1990’s. The adoption of CAMP lead to a reduction in LF biomass concentration in all soils (Fig. 16b) and LF content in all soils except the Brown soils by 2018 (Figs. 16b and 17b). There was no significant interaction between soil zone and sampling year for the LF biomass concentration data, which allows us to report the following two summary statements: i) the adoption of CAMP resulted in a decreased LF biomass concentration (≈30%) after 21 years, and ii) the overall (both years) zonal ranking of LF biomass concentration (mg/kg; note: means sharingthe same letter are not significantly different) was Gray (8,583a), Dark Gray (6,714ab), Black(6,263b), Dark Brown (4,804c), and Brown (4,038c). These findings are consistent with theexpectations of both increased C mineralization rates under CAMP due to better surface soilmoisture conditions, albeit reduced in cooler environments, leading to greater LF-C accumulationwithin the Aspen Parkland and Boreal Transition ecoregions of Saskatchewan.
The measured LF-C concentration and content ranged from 652-2,328 mg C/kg and 0.9-3.0 Mg C/ha, respectively (Figs. 18a and 19a), and are consistent with values reported elsewhere (Janzen et al., 1992; Tan et al., 2007; Gosling et al., 2013). There was no change in LF-C concentration in the Brown or Dark Brown under CAMP, but the LF-C concentration within the Black, Dark Gray, and Gray soils decreased by 2018 (≈22; Fig. 18b). The LF-C concentration and content within the Black, Dark Gray, and Gray soils was greater than the Brown and Dark Brown soils in both 1996 (≈134 and 138%, respectively; Fig. 18a), but less distinct by 2018 (≈81 and 96%, respectively; Fig. 19a), which is attributed to an increased LF-C concentration and content in the Brown and Dark Brown soils,

Page 15 of 45
Figure 16. Mean (n=6-31; 0-10 cm) light fraction biomass concentration (A), and percent change (delta; ∆), in light fraction biomass concentration (B) within different soil types before (1996) and after (2018) 21 years of conservation agriculture management. Figure A notes: for each year, bars with the same upper-case letter are not significantly different (P >0.05) using LSD. For each soil zone, bars with the same lower-case letter are not significantly different (P >0.05) using LSD. Figure B note: bars with the same letter are not significantly different (P >0.05) using LSD.
Figure 17. Mean (n=6-31; 0-10 cm) light fraction biomass content (A), and percent change (delta; ∆), in light fraction biomass content (B) within different soil types before (1996) and after (2018) 21 years of conservation agriculture management. Figure A notes: for each year, bars with the same upper-case letter are not significantly different (P >0.05) using LSD. For each soil zone, bars with the same lower-case letter are not significantly different (P >0.05) using LSD. Figure B note: bars with the same letter are not significantly different (P >0.05) using LSD.
coupled with a decrease in LF-C concentration in the Black, Dark Gray, and Gray soils (Fig. 18b), and decreased LF-content in the Dark Gray and Gray soils (Fig. 19b) by 2018. The zonal trend in LF-C levels followed those of SOC levels, which is consistent with the LF-C fraction representing between 2.9-9.0% of the total SOC pool (Fig. 20a). However, for all soil types, the LF-C contribution to total SOC decreased by 2018 (up to 30%; Fig. 20b); presumably, due to changing LF biomass, considering the increased LF-C concentration by 2018 (except for Gray; Fig. 21). Decreased LF proportion suggests greater recalcitrance and resistance to further decomposition (Janzen et al., 1992). There was no significant interaction between soil zone and sampling year for the LF-C content data, which allows us to report the following two summary statements: i) the adoption of CAMP resulted in no change in LF-C content in soil after 21 years, and ii) the overall (both years) zonal ranking of soil LF-C content (Mg C/ha; note: means sharing the same letter are not significantly different) was Gray (2.9a), Dark Gray (2.1b), Black (1.5c), Dark Brown (1.1d), and Brown (0.9d).
0
2000
4000
6000
8000
10000
12000
Brown Dark Brown Black Dark Gray Gray
LFC
once
ntra
tion
in S
oil (
mg/
kg)
Ca B
a
Ca B
a
Ba
ABb
ABa
ABb
Aa
Ab
A
-30
-25
-20
-15
-10
-5
0
Brown Dark Brown Black Dark Gray Gray
A
AA
A A∆ LF
Con
cent
ratio
n in
Soi
l by
2018
(%)
B
0
2
4
6
8
10
12
14
Brown Dark Brown Black Dark Gray Gray
LFC
onte
nt in
Soi
l (M
g/ha
)
Cb
Aa
Ca B
a
Ba A
a
ABa
ABb
Aa
Aa
A
-60
-40
-20
0
20
40
60
80
Brown Dark Brown Black Dark Gray Gray
A
B
B
B
B
∆ LF
Con
tent
in S
oil b
y 20
18 (%
)
B
Page 16 of 45
Figure 18. Mean (n=6-31; 0-10 cm) light fraction biomass carbon (LF-C) concentration (A), and percent change (delta; ∆) in LF-C concentration (B), within different soil types before (1996) and after (2018) 21 years of conservation agriculture management. Figure A notes: for each year, bars with the same upper-case letter are not significantly different (P >0.05) using LSD. For each soil zone, bars with the same lower-case letter are not significantly different (P >0.05) using LSD. Figure B note: bars with the same letter are not significantly different (P >0.05) using LSD.
Figure 19. Mean (n=6-31; 0-10 cm) light fraction biomass carbon (LF-C) content (A), and percent change (delta; ∆) in LF-C content (B), within different soil types before (1996) and after (2018) 21 years of conservation agriculture management. Figure A notes: for each year, bars with the same upper-case letter are not significantly different (P >0.05) using LSD. For each soil zone, bars with the same lower-case letter are not significantly different (P >0.05) using LSD. Figure B note: bars with the same letter are not significantly different (P >0.05) using LSD.
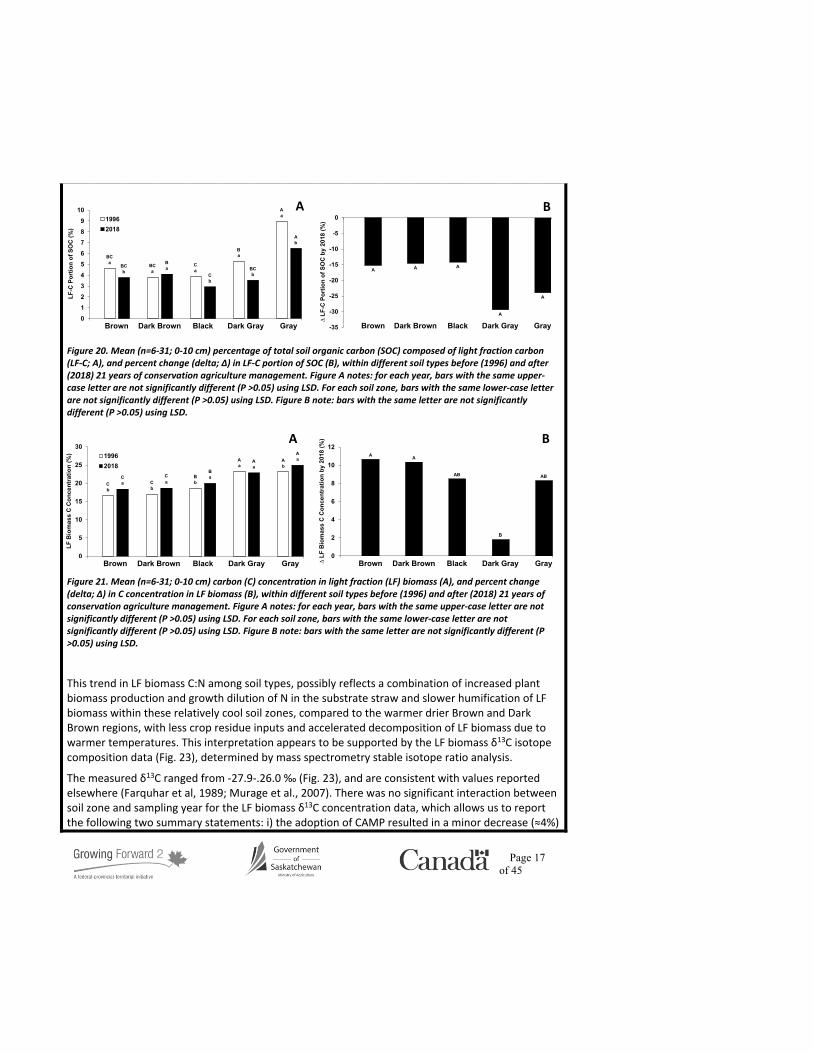
There was no significant interaction between soil zone and sampling year for the C concentration of the LF biomass material, which allows us to make the following two summary statements: i) the adoption of CAMP resulted in a slight increase (≈8%) in LF biomass C concentration by 2018, and ii) the overall (both years) zonal ranking of LF biomass C concentration (%; note: means sharing the same letter are not significantly different) was Gray (24.0a), Dark Gray (23.1a), Black (19.4b), Dark Brown (17.8c), and Brown (17.5c). The LF biomass primarily consists of recent decomposing and partially decomposed plant residues with a mean age of several years and, therefore, the larger amounts of straw residue additions (having wide C:N ratios) to the Black, Dark Gray, and Gray soils explains their larger LF biomass C concentration and, therefore, the greater LF-C content in those soils (Figs. 18a and 19a). The LF biomass C:N also varied slightly over time, with the Dark Gray and Gray soils having the largest LF biomass C:N values and greatest increase in C:N by 2018 (Fig. 22).
0
500
1000
1500
2000
250019962018
Brown Dark Brown Black Dark Gray Gray
LF-C
Con
cent
ratio
n in
Soi
l (m
g C
/kg)
Da
Da
Da
CDa
Ca
BCb
Ba
ABb
Aa
Ab
A
-30
-25
-20
-15
-10
-5
0
5
10
Brown Dark Brown Black Dark Gray Gray
A
A
A
A
A
∆ LF
-C C
once
ntra
tion
in S
oil b
y 20
18 (%
) B
0
0.5
1
1.5
2
2.5
3
3.519962018
Brown Dark Brown Black Dark Gray Gray
LF-C
Con
tent
in S
oil (
Mg
C/h
a)
Da
Da
CDa
CDa
Ca C
a
Ba
Ba
Aa A
a
A
-20
-15
-10
-5
0
5
10
15
20
Brown Dark Brown Black Dark Gray Gray
A
A
A
A
A
∆ LF
-C C
onte
nt in
Soi
l by
2018
(%)
B
Page 17 of 45
Figure 20. Mean (n=6-31; 0-10 cm) percentage of total soil organic carbon (SOC) composed of light fraction carbon (LF-C; A), and percent change (delta; ∆) in LF-C portion of SOC (B), within different soil types before (1996) and after (2018) 21 years of conservation agriculture management. Figure A notes: for each year, bars with the same upper-case letter are not significantly different (P >0.05) using LSD. For each soil zone, bars with the same lower-case letter are not significantly different (P >0.05) using LSD. Figure B note: bars with the same letter are not significantly different (P >0.05) using LSD.
Figure 21. Mean (n=6-31; 0-10 cm) carbon (C) concentration in light fraction (LF) biomass (A), and percent change (delta; ∆) in C concentration in LF biomass (B), within different soil types before (1996) and after (2018) 21 years of conservation agriculture management. Figure A notes: for each year, bars with the same upper-case letter are not significantly different (P >0.05) using LSD. For each soil zone, bars with the same lower-case letter are not significantly different (P >0.05) using LSD. Figure B note: bars with the same letter are not significantly different (P >0.05) using LSD.
This trend in LF biomass C:N among soil types, possibly reflects a combination of increased plant biomass production and growth dilution of N in the substrate straw and slower humification of LF biomass within these relatively cool soil zones, compared to the warmer drier Brown and Dark Brown regions, with less crop residue inputs and accelerated decomposition of LF biomass due to warmer temperatures. This interpretation appears to be supported by the LF biomass δ13C isotope composition data (Fig. 23), determined by mass spectrometry stable isotope ratio analysis.
The measured δ13C ranged from -27.9-.26.0 ‰ (Fig. 23), and are consistent with values reported elsewhere (Farquhar et al, 1989; Murage et al., 2007). There was no significant interaction between soil zone and sampling year for the LF biomass δ13C concentration data, which allows us to report the following two summary statements: i) the adoption of CAMP resulted in a minor decrease (≈4%)
0123456789
1019962018
Brown Dark Brown Black Dark Gray Gray
LF-C
Por
tion
of S
OC
(%)
BCa
BCb
BCa
Ba
Ca
Cb
Ba
BCb
Aa
Ab
A
-35
-30
-25
-20
-15
-10
-5
0
Brown Dark Brown Black Dark Gray Gray∆
LF-C
Por
tion
of S
OC
by
2018
(%)
A A A
A
A
B
0
5
10
15
20
25
3019962018
Brown Dark Brown Black Dark Gray Gray
Cb
Ca C
b
Ca
Bb
Ba
Aa
Aa
Ab
Aa
LFB
iom
ass
C C
once
ntra
tion
(%)
A
0
2
4
6
8
10
12
Brown Dark Brown Black Dark Gray Gray
A A
AB
B
AB
∆ LF
Bio
mas
s C
Con
cent
ratio
n by
201
8 (%
) B

Page 18 of 45
Figure 22. Mean (n=6-31; 0-10 cm) carbon to nitrogen concentration ratio (C:N) in light fraction biomass (A), and percent change (delta; ∆) in light fraction biomass C:N (B), within different soil types before (1996) and after (2018) 21 years of conservation agriculture management. Figure A notes: for each year, bars with the same upper-case letter are not significantly different (P >0.05) using LSD. For each soil zone, bars with the same lower-case letter are not significantly different (P >0.05) using LSD. Figure B note: bars with the same letter are not significantly different (P >0.05) using LSD.
Figure 23. Mean (n=6-31; 0-10 cm) per mil δ13C concentration of light fraction biomass (A), and percent change (delta; ∆) in light fraction biomass δ13C concentration (B), within different soil types before (1996) and after (2018) 21 years of conservation agriculture management. Figure A notes: for each year, bars with the same upper-case letter are not significantly different (P >0.05) using LSD. For each soil zone, bars with the same lower-case letter are not significantly different (P >0.05) using LSD. Figure B note: bars with the same letter are not significantly different (P >0.05) using LSD.
in LF biomass δ13C enrichment, and ii) the overall (both years) zonal ranking of LF biomass δ13C concentration (per mil; note: means sharing the same letter are not significantly different) was Brown (-26.7a), Black (-26.9ab), Dark Brown (-27.0bc), Gray (-27.4cd), and Dark Gray (-27.5d). The zonal trend in LF biomass δ13C values among the soil types is essentially opposite to the previous LF characteristics discussed, but is expected, given the relationship between δ13C and both plant tissue production and decomposition. Atmospheric CO2 is primarily composed of two stable isotopes of C (12C and 13C; 99 and 1%, respectively). During photosynthesis, plants discriminate against the heavier 13C isotope both physically (during stomal diffusion) and biochemically (during C-fixation reactions within chloroplasts). Likewise, heterotrophic soil organisms discriminate against 13C when metabolizing SOC as an energy source. As a result, the utility of isotopic fractionation (i.e., 13C/12C
0
5
10
15
20
2519962018
Brown Dark Brown Black Dark Gray Gray
Ligh
t Fra
ctio
n B
iom
ass
C:N
Ba B
b
Ba
Bb
Ca
Ba
ABb
Aa
Aa
Aa
A
-10-8-6-4-202468
10
Brown Dark Brown Black Dark Gray GrayD
CD
BC
A
AB
∆ Li
ght F
ract
ion
Bio
mas
s C
:N b
y 20
18 (%
) B
-28.5
-28
-27.5
-27
-26.5
-26
-25.5
-25
19962018
Brown Dark Brown Black Dark Gray Gray
aA
bA
aB
bA
aAB
bA
aC
bA
aC
aALi
ght F
ract
ion
Bio
mas
s δ1
3 C (
‰)
A
-6
-5
-4
-3
-2
-1
0
Brown Dark Brown Black Dark Gray GrayB
ABAB
AB
A
∆ Li
ght F
ract
ion
Bio
mas
s δ1
3 C b
y 20
18 (%
)
B

Page 19 of 45
or δ13C) as a proxy for water-use efficiency and degree of organic matter decomposition has been recognized within biological research for some time (O’Leary, 1988 and Farquhar et al, 1989). Generally speaking, plants growing under a wetter soil moisture regime are less stressed, resulting in greater plant 13C discrimination and smaller 13C/12C isotopic ratio, resulting in smaller (i.e., more negative) δ13C values (and vice versa). Similarly, the more humified the organic matter, the longer period of microbial 13C discrimination, the greater 13C concentration becomes in the residual organic matter, leading to larger (i.e., less negative) δ13C values.
Despite the large diversity in crops/varieties grown, each differing in their water-use efficiencies, the 1996 LF biomass δ13C values follow the expected trend among the geoclimatic gradient from the Brown to Gray soils; namely, progressively smaller (i.e., more negative) δ13C values, corresponding to wetter growing season conditions and decreasing plant stress moving from south west to north east across Saskatchewan (Fig. 23a). Interestingly, however, there was no difference in the LF biomass δ13C values among the soil climatic zones in 2018. Moreover, the δ13C values were smaller in 2018 compared to 1996 for all soil types except for the Gray soil, which would be consistent with that region historically receiving the most precipitation and least variance in soil moisture availability (Fig. 23). The lack of zonal trend in LF biomass δ13C values in 2018 may be explained by a few factors: i) relatively dry growing seasons prior to 1996 leading to water-stressed crops, compared to the comparatively wet years preceding 2018, ii) 13C discrimination during LF biomass decomposition causing 13C enrichment in the residual organic matter regardless of year, but the lower crop yields prior to 1996 would lead to reduced inputs of fresh 12C-rich crop residue, resulting in less dilution of the 13C-enriched decomposing LF biomass, iii) the widespread growth of superior yielding crop varieties during the last two decades, compared to those grown in the late 80s/early 90s, which added more 12C-rich residues and reduced the LF biomass δ13C values accordingly, and iv) the increased SOC content associated with the adoption of CAMP across all regions (Fig. 13),enhanced the soil water holding capacity, especially within the drier soil zones, which increasedcrop growth and residue inputs.
2.6 Water-extractable organic carbon
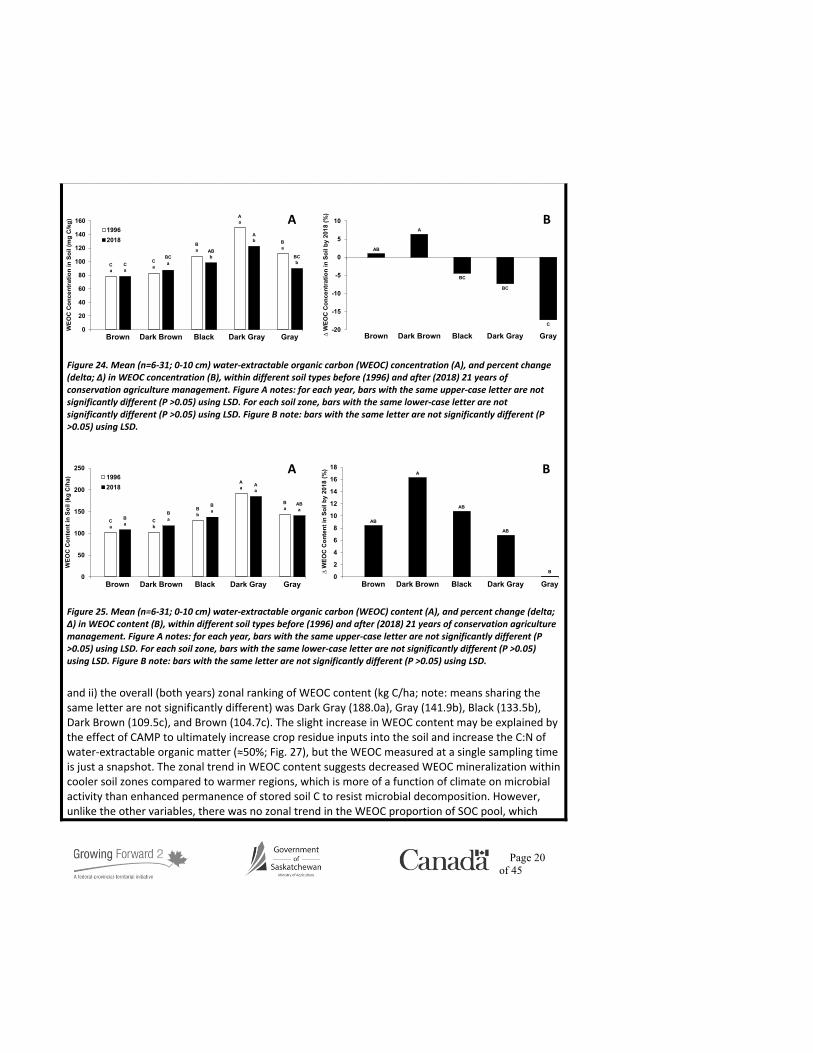
The measured WEOC concentration and content ranged from 78-150 mg C/kg and 101-190 kg C/ha, respectively (Figs. 24a and 25a), and are consistent with values reported elsewhere (Awale et al., 2017; Sun et al., 2017; Miller et al., 2019). The WEOC concentration and content within the Black, Dark Gray, and Gray soils was greater than the Brown and Dark Brown soils in 1996 (≈53 and 52%, respectively; Figs. 24a and 25a), but less distinct in 2018 (≈25 and 37%, respectively; Figs. 24a and 25a). There was no change in WEOC concentration by 2018 in the Brown or Dark Brown soils, but the WEOC concentration within the Black, Dark Gray, and Gray soils decreased under CAMP (≈10%; Fig. 24b), which agrees with the decreased contribution of WEOC to total SOC in the soils by 2018 (≈50%; Fig. 24b). It is important to note that WEOC is a dynamic fraction that can fluctuate greatly over time, influenced by time of year of sampling, immediately preceding environmental conditions or recent soil and residue management. Although the WEOC content within the Dark Brown and Black soils was higher in 2018 compared to 1996, their relative increase was no different compared to the other soils (≈14; Fig. 25b). There was no significant interaction between soil zone and sampling year for the WEOC content data, which allows us to report the following two summary statements: i) the adoption of CAMP resulted in a minor apparent increase (≈3%) in WEOC content,
Page 20 of 45
Figure 24. Mean (n=6-31; 0-10 cm) water-extractable organic carbon (WEOC) concentration (A), and percent change (delta; ∆) in WEOC concentration (B), within different soil types before (1996) and after (2018) 21 years of conservation agriculture management. Figure A notes: for each year, bars with the same upper-case letter are not significantly different (P >0.05) using LSD. For each soil zone, bars with the same lower-case letter are not significantly different (P >0.05) using LSD. Figure B note: bars with the same letter are not significantly different (P >0.05) using LSD.
Figure 25. Mean (n=6-31; 0-10 cm) water-extractable organic carbon (WEOC) content (A), and percent change (delta; ∆) in WEOC content (B), within different soil types before (1996) and after (2018) 21 years of conservation agriculture management. Figure A notes: for each year, bars with the same upper-case letter are not significantly different (P >0.05) using LSD. For each soil zone, bars with the same lower-case letter are not significantly different (P >0.05) using LSD. Figure B note: bars with the same letter are not significantly different (P >0.05) using LSD.
and ii) the overall (both years) zonal ranking of WEOC content (kg C/ha; note: means sharing the same letter are not significantly different) was Dark Gray (188.0a), Gray (141.9b), Black (133.5b), Dark Brown (109.5c), and Brown (104.7c). The slight increase in WEOC content may be explained by the effect of CAMP to ultimately increase crop residue inputs into the soil and increase the C:N of water-extractable organic matter (≈50%; Fig. 27), but the WEOC measured at a single sampling time is just a snapshot. The zonal trend in WEOC content suggests decreased WEOC mineralization within cooler soil zones compared to warmer regions, which is more of a function of climate on microbial activity than enhanced permanence of stored soil C to resist microbial decomposition. However, unlike the other variables, there was no zonal trend in the WEOC proportion of SOC pool, which
0
50
100
150
200
25019962018
Brown Dark Brown Black Dark Gray Gray
WEO
CC
onte
nt in
Soi
l (kg
C/h
a)
Ca
Ba C
b
Ba
Bb
Ba
Aa A
a
Ba
ABa
A
0
2
4
6
8
10
12
14
16
18
Brown Dark Brown Black Dark Gray Gray
AB
A
AB
AB
B∆ W
EOC
Con
tent
in S
oil b
y 20
18 (%
) B
0
20
40
60
80
100
120
140
16019962018
Brown Dark Brown Black Dark Gray Gray
WEO
C C
once
ntra
tion
in S
oil (
mg
C/k
g)
Ca
Ca
Ca
BCa
Ba AB
b
Aa
Ab B
a
BCb
A
-20
-15
-10
-5
0
5
10
Brown Dark Brown Black Dark Gray Gray
AB
A
BC
BC
C∆
WEO
C C
once
ntra
tion
in S
oil b
y 20
18 (%
) B
Page 21 of 45
points to the highly active nature of WEOC, especially compared to SOC, but also its utility as an index of short term SOC dynamics (Haney et al., 2012; Ćirić et al., 2016, Awale et al., 2017).
Figure 26. Mean (n=6-31; 0-10 cm) percentage of total soil organic carbon (SOC) composed of water-extractable organic carbon (WEOC; A), and percent change (delta; ∆) in light fraction portion of SOC (B), within different soil types before (1996) and after (2018) 21 years of conservation agriculture management. Figure A notes: for each year, bars with the same upper-case letter are not significantly different (P >0.05) using LSD. For each soil zone, bars with the same lower-case letter are not significantly different (P >0.05) using LSD. Figure B note: bars with the same letter are not significantly different (P >0.05) using LSD.
Figure 27. Mean (n=6-31; 0-10 cm) ratio of water-extractable organic carbon to nitrogen (WEOC:WEON; A), and percent change (delta; ∆) in WEOC:WEON (B), within different soil types before (1996) and after (2018) 21 years of conservation agriculture management. Figure A notes: for each year, bars with the same upper-case letter are not significantly different (P >0.05) using LSD. For each soil zone, bars with the same lower-case letter are not significantly different (P >0.05) using LSD. Figure B note: bars with the same letter are not significantly different (P >0.05) using LSD.
2.7 Microbial biomass carbon
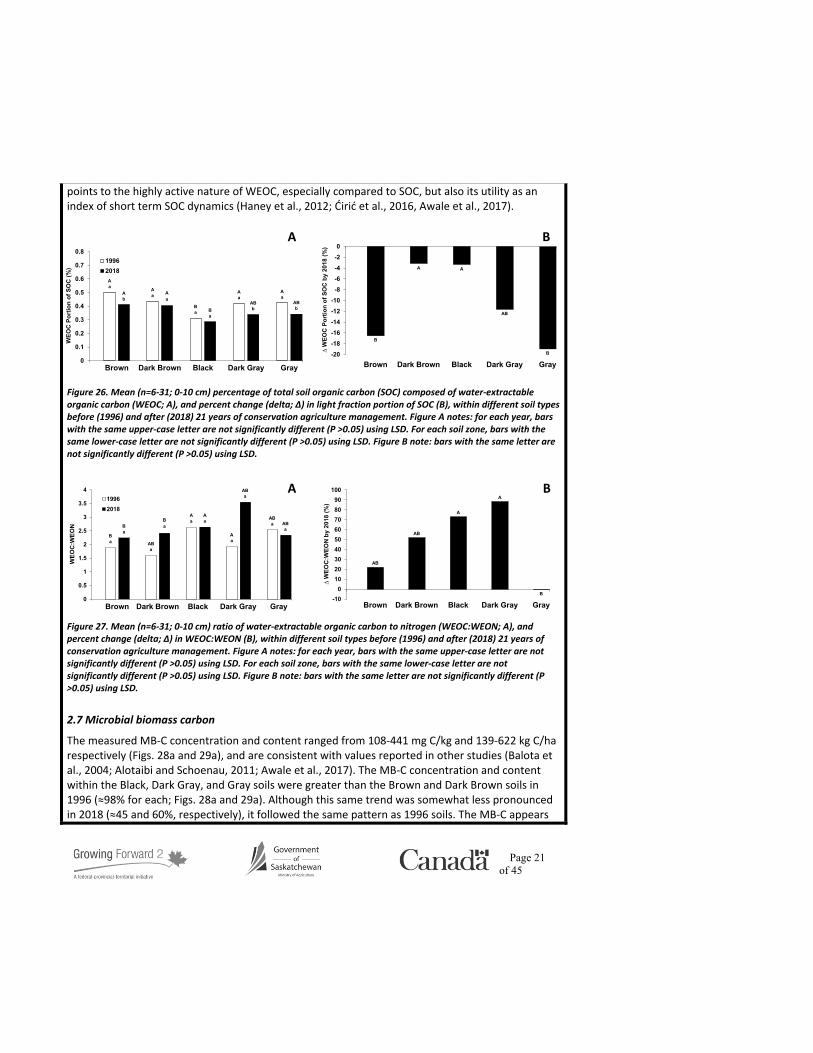
The measured MB-C concentration and content ranged from 108-441 mg C/kg and 139-622 kg C/ha respectively (Figs. 28a and 29a), and are consistent with values reported in other studies (Balota et al., 2004; Alotaibi and Schoenau, 2011; Awale et al., 2017). The MB-C concentration and content within the Black, Dark Gray, and Gray soils were greater than the Brown and Dark Brown soils in 1996 (≈98% for each; Figs. 28a and 29a). Although this same trend was somewhat less pronounced in 2018 (≈45 and 60%, respectively), it followed the same pattern as 1996 soils. The MB-C appears
0
0.1
0.2
0.3
0.4
0.5
0.6
0.7
0.819962018
Brown Dark Brown Black Dark Gray Gray
WEO
C P
ortio
n of
SO
C (%
)
Aa
Ab
Aa A
aBa B
a
Aa
ABb
Aa
ABb
A
-20-18-16-14-12-10
-8-6-4-20
Brown Dark Brown Black Dark Gray Gray
∆ W
EOC
Por
tion
of S
OC
by
2018
(%)
B
A A
AB
B
B
0
0.5
1
1.5
2
2.5
3
3.5
419962018
Brown Dark Brown Black Dark Gray Gray
WEO
C:W
EON
Ba
Ba
ABa
Ba
Aa
Aa
Aa
ABa
ABa AB
a
A
-100
102030405060708090
100
Brown Dark Brown Black Dark Gray Gray
AB
AB
A
A
B
∆ W
EOC
:WEO
N b
y 20
18 (%
)
B

Page 22 of 45
Figure 28. Mean (n=6-31; 0-10 cm) microbial biomass carbon (MB-C) concentration (A), and percent change (delta; ∆) in MB-C) concentration (B), within different soil types before (1996) and after (2018) 21 years of conservation agriculture management. Figure A notes: for each year, bars with the same upper-case letter are not significantly different (P >0.05) using LSD. For each soil zone, bars with the same lower-case letter are not significantly different (P >0.05) using LSD. Figure B note: bars with the same letter are not significantly different (P >0.05) using LSD.
Figure 29. Mean (n=6-31; 0-10 cm) microbial biomass carbon (MB-C) content (A), and percent change (delta; ∆) in MB-C content (B), within different soil types before (1996) and after (2018) 21 years of conservation agriculture management. Figure A notes: for each year, bars with the same upper-case letter are not significantly different (P >0.05) using LSD. For each soil zone, bars with the same lower-case letter are not significantly different (P >0.05) using LSD. Figure B note: bars with the same letter are not significantly different (P >0.05) using LSD.
related to the SOC levels of the soils, as the size and activity of the soil microbial community is typically directly proportional to the SOC content (Hamel et al., 2006), which supports a more abundant and active soil microbial community by providing a more favourable soil habitat (e.g., C source, nutrient availability, moisture, etc.). There were no changes in the MB-C concentration, MB-C content, or contribution of MB-C to total SOC within the Dark Gray and Gray soils under CAMP, but all three variables significantly increased in the Brown, Dark Brown, and Black soils (≈50, 75, and 35%, respectively; Figs. 28a, 29a, and 30a). The largest increase in MB-C concentration and MB-C content occurred with the Brown soils (81 and 112%, respectively, Figs. 28b and 29b), which had the lowest SOC concentration in 1996 and greatest SOC increase under CAMP (Fig. 12). The decreasing influence of CAMP on the soil microbial community along the geoclimatic gradient from the Brown to Gray soils was apparent as the naturally occurring higher levels of SOC and moisture availability render the CAMP benefits less relevant (Figs. 28b and 29b).
There was no significant interaction between soil zone and sampling year for the MB-C
050
100150200250300350400450500
19962018
Brown Dark Brown Black Dark Gray Gray
MB
-CC
once
ntra
tion
in S
oil (
mg
C/k
g)
Cb
Ba
BCb
Ba
Ab
Aa
ABa
Ba
BCa B
a
A
-100
102030405060708090
Brown Dark Brown Black Dark Gray Gray
A
AB
BB
B
∆ M
B-C
Con
cent
ratio
n in
Soi
l by
2018
(%) B
0
100
200
300
400
500
600
70019962018
Brown Dark Brown Black Dark Gray Gray
MB
-CC
onte
nt in
Soi
l (kg
C/h
a)
Cb
Ca BC
b
BCa
Ab
Aa
ABa
Ba
ABa
BCa
A
0
20
40
60
80
100
120
Brown Dark Brown Black Dark Gray Gray
A
ABAB
AB
B
∆ M
B-C
Con
tent
in S
oil b
y 20
18 (%
) B

Page 23 of 45
Figure 30. Mean (n=6-31; 0-10 cm) percentage of total soil organic carbon (SOC) composed of microbial biomass carbon (MB-C; A), and percent change (delta; ∆) in MB-C portion of SOC (B), within different soil types before (1996) and after (2018) 21 years of conservation agriculture management. Figure A notes: for each year, bars with the same upper-case letter are not significantly different (P >0.05) using LSD. For each soil zone, bars with the same lower-case letter are not significantly different (P >0.05) using LSD. Figure B note: bars with the same letter are not significantly different (P >0.05) using LSD.
concentration, MB-C content, or the contribution of MB-C to total SOC data, which allows us to report the following three summary statements: i) the adoption of CAMP resulted in a substantial increase in MB-C concentration, MB-C content, and contribution of MB-C to total SOC (≈23, 41, and 25%, respectively; Figs. 28b, 29b, and 30b), ii) the overall (both years) zonal ranking of MB-C concentration (mg C/ha; note: means sharing the same letter are not significantly different) was Black (390.0a), Dark Gray (291.8ab), Gray (226.0bc), Dark Brown (214.9bc), and Brown (150.1c), and iii) the overall (both years) zonal ranking of MB-C content (kg C/ha; note: means sharing the sameletter are not significantly different) was Black (513.0a), Dark Gray (410.2ab), Gray (315.7bc), DarkBrown (276.7c), and Brown (201.8c).
The microbial biomass C:N results are intriguing for two reasons: i) it lacks the zonal trend observed with the other measurement variables and, ii) the apparent effect of CAMP on microbial biomass C:N differed among soil types depending on the statistical perspective. Specifically, when viewing the overall zonal means, the only change in microbial biomass C:N under CAMP was a decrease with the Dark Gray soils (Fig. 31a). Conversely, when viewed from the perspective of individual site by site comparisons, the greatest relative increase in microbial C:N occurred with the Brown soils (Fig. 31b). An increase in microbial biomass C:N often reflects greater net primary production, while decreasing values indicates a changing microbial community structure (Griffiths et al., 2012 and Xu et al., 2013). The positive effect of CAMP on the SOC, LF-C, WEOC, and MB-C pools within the Brown soils is likely due to increased net primary productivity, which is consistent with an increased microbial biomass C:N (Fig. 31b). However, there was no significant interaction between soil zone and sampling year for the microbial biomass C:N data, which allows us to report the following two summary statements: i) the adoption of CAMP resulted in a modest decrease in microbial biomass C:N ratio (≈20; Fig. 31a), which is indicating a changing microbial community structure, however, further analyses (e.g., phospholipid fatty acid analysis) are required to confirm this assertion, and ii) the overall (both years) zonal ranking of microbial biomass C:N data (note: means sharing the same letter are not significantly different) was Dark Gray (11.2a), Gray (10.7a), Dark Brown (10.3a), Black (7.3b), and Brown (6.3b).
0
0.2
0.4
0.6
0.8
1
1.2
1.419962018
Brown Dark Brown Black Dark Gray Gray
MB
-C P
ortio
n of
SO
C (%
)
Bb
ABa
Ab
Aa
ABb
Aa
ABa
ABa
ABa B
a
A
-10-505
1015202530354045
Brown Dark Brown Black Dark Gray Gray
A
A
A
A
A∆ M
B-C
Por
tion
of S
OC
by
2018
(%) B
Page 24 of 45
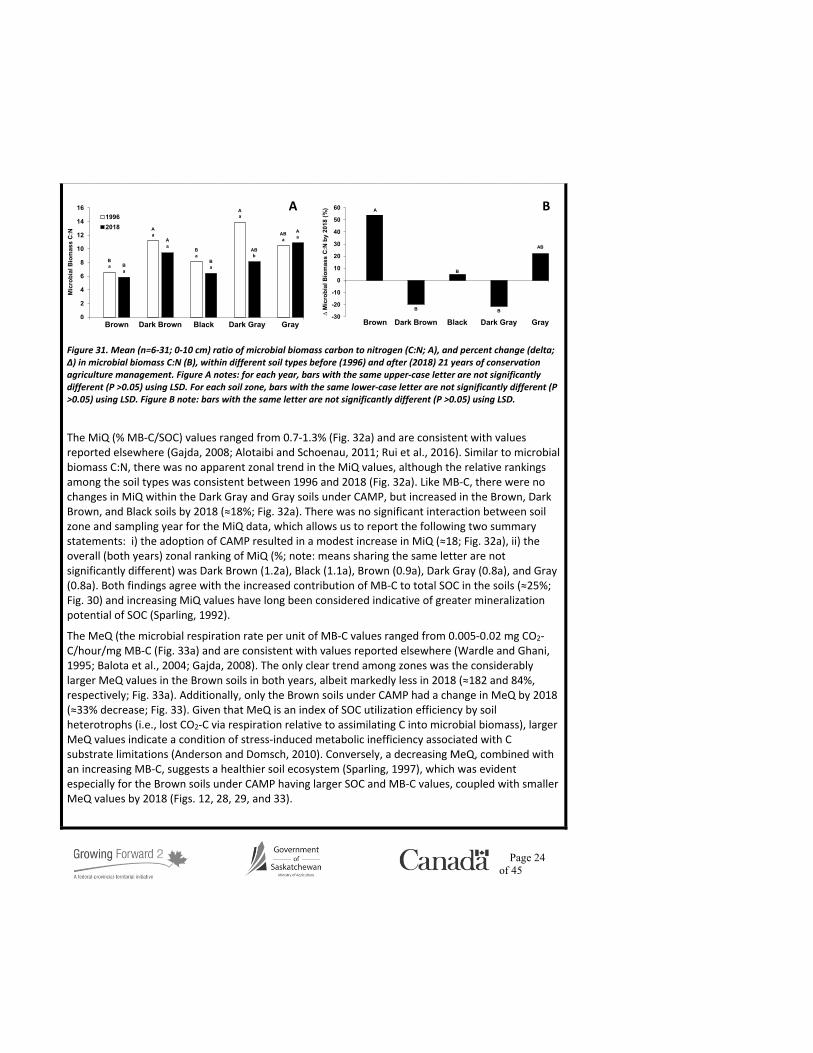
Figure 31. Mean (n=6-31; 0-10 cm) ratio of microbial biomass carbon to nitrogen (C:N; A), and percent change (delta; ∆) in microbial biomass C:N (B), within different soil types before (1996) and after (2018) 21 years of conservation agriculture management. Figure A notes: for each year, bars with the same upper-case letter are not significantly different (P >0.05) using LSD. For each soil zone, bars with the same lower-case letter are not significantly different (P >0.05) using LSD. Figure B note: bars with the same letter are not significantly different (P >0.05) using LSD.
The MiQ (% MB-C/SOC) values ranged from 0.7-1.3% (Fig. 32a) and are consistent with values reported elsewhere (Gajda, 2008; Alotaibi and Schoenau, 2011; Rui et al., 2016). Similar to microbial biomass C:N, there was no apparent zonal trend in the MiQ values, although the relative rankings among the soil types was consistent between 1996 and 2018 (Fig. 32a). Like MB-C, there were no changes in MiQ within the Dark Gray and Gray soils under CAMP, but increased in the Brown, Dark Brown, and Black soils by 2018 (≈18%; Fig. 32a). There was no significant interaction between soil zone and sampling year for the MiQ data, which allows us to report the following two summary statements: i) the adoption of CAMP resulted in a modest increase in MiQ (≈18; Fig. 32a), ii) the overall (both years) zonal ranking of MiQ (%; note: means sharing the same letter are not significantly different) was Dark Brown (1.2a), Black (1.1a), Brown (0.9a), Dark Gray (0.8a), and Gray (0.8a). Both findings agree with the increased contribution of MB-C to total SOC in the soils (≈25%; Fig. 30) and increasing MiQ values have long been considered indicative of greater mineralization potential of SOC (Sparling, 1992).
The MeQ (the microbial respiration rate per unit of MB-C values ranged from 0.005-0.02 mg CO2-C/hour/mg MB-C (Fig. 33a) and are consistent with values reported elsewhere (Wardle and Ghani, 1995; Balota et al., 2004; Gajda, 2008). The only clear trend among zones was the considerably larger MeQ values in the Brown soils in both years, albeit markedly less in 2018 (≈182 and 84%, respectively; Fig. 33a). Additionally, only the Brown soils under CAMP had a change in MeQ by 2018 (≈33% decrease; Fig. 33). Given that MeQ is an index of SOC utilization efficiency by soil heterotrophs (i.e., lost CO2-C via respiration relative to assimilating C into microbial biomass), larger MeQ values indicate a condition of stress-induced metabolic inefficiency associated with C substrate limitations (Anderson and Domsch, 2010). Conversely, a decreasing MeQ, combined with an increasing MB-C, suggests a healthier soil ecosystem (Sparling, 1997), which was evident especially for the Brown soils under CAMP having larger SOC and MB-C values, coupled with smaller MeQ values by 2018 (Figs. 12, 28, 29, and 33).
0
2
4
6
8
10
12
14
1619962018
Brown Dark Brown Black Dark Gray Gray
Mic
robi
al B
iom
ass
C:N
Ba B
a
Aa
Aa
Ba
Ba
Aa
ABb
ABa
Aa
A
-30
-20
-10
0
10
20
30
40
50
60
Brown Dark Brown Black Dark Gray Gray
A
B
B
B
AB
∆ M
icro
bial
Bio
mas
s C
:N b
y 20
18 (%
) B

Page 25 of 45
Figure 32. Mean (n=6-31; 0-10 cm) microbial quotient (A), and percent change (delta; ∆) in microbial quotient (B), within different soil types before (1996) and after (2018) 21 years of conservation agriculture management. Figure A notes: for each year, bars with the same upper-case letter are not significantly different (P >0.05) using LSD. For each soil zone, bars with the same lower-case letter are not significantly different (P >0.05) using LSD. Figure B note: bars with the same letter are not significantly different (P >0.05) using LSD.
Figure 33. Mean (n=6-31; 0-10 cm) metabolic quotient (A), and percent change (delta; ∆) in metabolic quotient (B), within different soil types before (1996) and after (2018) 21 years of conservation agriculture management. Figure A notes: for each year, bars with the same upper-case letter are not significantly different (P >0.05) using LSD. For each soil zone, bars with the same lower-case letter are not significantly different (P >0.05) using LSD. Figure B note: bars with the same letter are not significantly different (P >0.05) using LSD.
2.8 Incubation study to determine respirable carbon fraction in soil
Generally speaking, the CO2-C emissions were linear in nature, with estimated cumulative emissions at the end of the six-week incubation ranging from 657-990 and 705-904 kg C/ha/six weeks for the 1996 and 2018 soils, respectively (Fig. 34), and are consistent with values reported elsewhere (Liebig et al., 2005; Gregorich et al., 2005; Hangs et al., 2013 and 2016). There were minimal differences in CO2-C emissions by the different soil types among the weeks, with the greatest CO2-C emissions occurring from the Gray and Blacks soils in 1996 and 2018, respectively (Fig. 34). The greater LF-C concentration in the Gray soils, providing a C substrate for microbial respiration (Figs. 16a-20a), may help to explain the elevated CO2-C emissions in 1996 soils. The greater CO2-C emissions from the Black soils in 2018 could be due to their greater SOC content and microbial abundance (Figs. 12a, 28a, 29a, 30a, and 32a). Furthermore, the Black and Gray soils were the only soil types under CAMP with a change in CO2-C emissions and percentage of SOC respired during the
0
0.2
0.4
0.6
0.8
1
1.2
1.4
1.619962018
Brown Dark Brown Black Dark Gray Gray
Mic
robi
al Q
uotie
nt (%
)
Bb
ABa
Ab
Aa
ABb
Aa
ABa
ABa
ABa B
a
A
-10-505
1015202530354045
Brown Dark Brown Black Dark Gray Gray
A
A
A
A
A
∆ M
icro
bial
Quo
tient
by
2018
(%)
B
0
0.005
0.01
0.015
0.02
0.025
0.03
0.03519962018
Brown Dark Brown Black Dark Gray GrayMet
abol
ic Q
uotie
nt (m
g C
O2-C
/hr/m
g M
B-C
)
Aa
Ab B
a Ba B
aBa
Ba
Ba
Ba AB
a
A
-35
-30
-25
-20
-15
-10
-5
0
5
Brown Dark Brown Black Dark Gray GrayB
AB
A
AB
AB
∆ M
etab
olic
Quo
tient
by
2018
(%)
B

Page 26 of 45
Figure 34. Mean (n=6-31; 0-10 cm) cumulative CO2-C emissions during a six-week incubation by soil heterotrophs from different soil types before (1996; A) and after (2018; B) 21 years of conservation agriculture management. Note: for each week, soil types with the same letters are not significantly different (P >0.05) using LSD.
six-week incubation (a combined increase of ≈20% and 35% decrease, respectively) as shown in Figs. 35 and 36. The lack of relationship between SOC content and CO2-C respired during the six-week period (Fig. 37a), in addition to relatively steady-state CO2-C respiration rates independent of SOC content (Fig. 37b) could be attributed to the effects of CAMP to enhance soil aggregate size and stability allowing for SOC protection from heterotrophic mineralization (McConkey et al., 2000). Although all soils had higher SOC levels in 2018 (Fig. 13a), along with greater microbial abundance (Brown and Dark Brown only; Figs. 28, 29, 30, 32), the lack of increased CO2-C emissions and percentage of SOC respired after six weeks for all soil types in 2018, except for Black, suggests similar or greater permanence of the SOC following 21 years of CAMP compared to the SOC in the 1996 soils.
Figure 35. Mean (n=6-31; 0-10 cm) cumulative CO2-C respiration (A), and percent change (delta; ∆), in cumulative CO2-C respired (B) during a six-week incubation by soil heterotrophs from different soil types before (1996) and after (2018) 21 years of conservation agriculture management. Figure A notes: for each year, bars with the same upper-case letter are not significantly different (P >0.05) using LSD. For each soil zone, bars with the same lower-case letter are not significantly different (P >0.05) using LSD. Figure B note: bars with the same letter are not significantly different (P >0.05) using LSD.
0
200
400
600
800
1000
1200
1 2 3 4 5 6
1996BrownDark BrownBlackDark GrayGray
aaaaa
aaaaa
aa
ababb
aa
abab
b
a
bbcbcc
a
bbcbcc
Week
CO
2-C E
mis
sion
s (k
g C
/ha/
wee
k)
A
0100200300400500600700800900
1000
1 2 3 4 5 6
2018BrownDark BrownBlackDark GrayGray
a
aaaa
a
aaaa
a
ababbb
a
ababbb
a
abbbb
a
bbbb
WeekC
O2-C
Em
issi
ons
(kg
C/h
a/w
eek)
B
0
200
400
600
800
1000
1200 19962018
Brown Dark Brown Black Dark Gray Gray
CO
2-C E
mis
sion
s (k
g C
/ha/
six
wee
ks)
Ca
Ba BC
a
Ba
Bb
Aa
BCa
Ba
Aa
Bb
A
-15
-10
-5
0
5
10
15
20
25
Brown Dark Brown Black Dark Gray Gray
AB
AB
A
AB
B
∆ C
O2-C
Em
issi
ons
by 2
018
(%) B

Page 27 of 45
Figure 36. Mean (n=6-31; 0-10 cm) portion of soil organic carbon (SOC) respired as CO2-C (A), and percent change (delta; ∆) in portion of SOC respired as CO2-C (B), during a six-week incubation by soil heterotrophs from different soil types before (1996) and after (2018) 21 years of conservation agriculture management. Figure A notes: for each year, bars with the same upper-case letter are not significantly different (P >0.05) using LSD. For each soil zone, bars with the same lower-case letter are not significantly different (P >0.05) using LSD. Figure B note: bars with the same letter are not significantly different (P >0.05) using LSD.
Figure 37. Mean (n=6-31; 0-10 cm) relationship between soil organic carbon (SOC) content and respired CO2-C (A), and SOC concentration and portion of SOC respired as CO2-C (B), during a six-week incubation by soil heterotrophs from different soil types before (1996) and after (2018) 21 years of conservation agriculture management. Figure B note: the dashed lines about the solid trendline are 95% confidence intervals.
2.9 FTIR spectroscopic characterization of soil organic carbon
The wavenumbers in the range of 1800-900 cm−1 were considered for the analysis of C functional groups in this study. The relative intensity of the spectral region between 900 to 400 cm−1 were excluded from the analysis as they are predominantly attributed to soil minerals (Haberhauer et al. 2000), while the bands between 2700 and 1800 cm−1 was excluded because the information attributable to organic matter is masked by C-O noise from CO2. Similarly, the bands at about 3600-3000 cm−1 are strongly influenced by water content (Ellerbrock et al. 2005) and were excluded as it may vary between the analyzed soil samples. The FTIR analysis did not indicate a strong change in molecular composition of soil organic matter (SOM) resulting from long-term CAMP management of the soils. The FTIR bands at 1100 cm−1 (Figure 38) attributed to C-O stretching of polysaccharides, alcohols and ethers, and the bands at 1580 and 1630 cm−1 (Figs. 39 and 40) attributed to C=O stretching of carboxylates, and aromatic C=C vibrations, did not show a significant change due to
0
2
4
6
8
10
12
1419962018
Brown Dark Brown Black Dark Gray Gray
Port
ion
of S
OC
Res
pire
d (%
)
Aa A
aBa
ABa
Cb
Ca C
aCa
ABa
BCb
A
-15
-10
-5
0
5
10
15
20
25
Brown Dark Brown Black Dark Gray Gray
BB
A
B
B∆ Po
rtio
n of
SO
C R
espi
red
by 2
018
(%) B
0.0
0.2
0.4
0.6
0.8
1.0
1.2
1.4
1.6
1.0 6.0 11.0 16.0 21.0 26.0 31.0
19962018
Soil Organic Carbon Content (g)
Res
pire
d C
O2-C
Afte
r Six
Wee
ks (g
) A
0
5
10
15
20
25
0.5 1.5 2.5 3.5 4.5 5.5
19962018
SOC Concentration (%)
Port
ion
of S
OC
Res
pire
d (%
)
B

Page 28 of 45
Figure 38. Figure 1: A representative ATR-FTIR spectra showing the fitted Gaussian peaks. The peaks are identified as follows: 1 - 870 cm-1; 2 - 920 cm-1; 3 - 985 cm-1; 4 - 1035 cm-1; 5 - 1100 cm-1; 6 - 1160 cm-1; 7 - 1360 cm-1; 8 - 1430 cm-1; 9 - 1530 cm-1; 10 - 1580 cm-1; 11 - 1640 cm-1; and 12 - 1680 cm-1.
Figure 39: The average relative intensity of ATR-FTIR band at 1530 cm-1 for different soil zones in 1996 and 2018.

Page 29 of 45
Figure 40: The average relative intensity of ATR-FTIR band at 1580 cm-1 for different soil zones in 1996 and 2018
the long-term management. However, the bands at 1360, 1430, and 1510 cm−1 (Figs. 39-41), did show a trend of increase in abundance of these functional groups after long-term no-till management. These FTIR bands are attributed to aliphatic (C-H) bending of CH2 and CH3 groups. Higher abundance of these microbially-derived C functional groups after reduced tillage management practices indicates that these management practices may be leading to a higher degree of microbial activity and decomposition in the soils and is consistent with the higher content of microbial biomass observed in these soils. The processed-C forms may also be expected to less susceptible to further microbial decomposition, and thus more recalcitrant. It is important to note that the increase in the abundance of these groups was not statistically significant, but a similar trend was observed in all the soil zones (except for Gray soil zone for 1430 and 1510 cm−1 bands). The variability in SOM functional group composition was comparatively higher between the different soil zones. The FTIR bands at 1100, 1360, 1430, 1510, 1580, and 1630 cm−1 showed statistically significant differences (p < 0.05) in abundance amongst the different soil zones (Figs. 38-43), indicating that the molecular composition of SOM varies significantly within the different soil zones. This may be expected due to differences in long-term climate and soil properties of different soil zones, leading to the differences in the molecular decomposition and retention of SOM over time.

Page 30 of 45
Figure 41: The average relative intensity of ATR-FTIR band at 1100 cm-1 for different soil zones in 1996 and 2018.
Figure 42: The average relative intensity of ATR-FTIR band at 1360 cm-1 for different soil zones in 1996 and 2018.

Page 31 of 45
Figure 43: The average relative intensity of ATR-FTIR band at 1430 cm-1 for different soil zones in 1996 and 2018.
Figure 44: The average relative intensity of ATR-FTIR band at 1630 cm-1 for different soil zones in 1996 and 2018.

Page 32 of 45
9. Conclusions and Recommendations: Highlight significant conclusions based on the previous sections, with emphasison the project objectives specified above. Provide recommendations for the application and adoption of the project.
The observed trends in SOC, LF-C, WEOC, and MB-C among the 1996 soils generally followed an expected geoclimatic moisture gradient that supported higher crop yields and associated above- and below-ground residue inputs to the Black, Dark Gray, and Gray soils, compared to the drier Brown and Dark Brown soil regions of the province. The trend continued in 2018, but was less pronounced, due to increased SOC accumulation following the adoption of CAMP; particularly with the Brown and Dark Brown soils. Our results suggest that after 21 years of CAMP, the greatest soil C sequestration potential occurred with soils having the lowest initial SOC content. Soils represent the largest terrestrial carbon pool on Earth and augmenting SOC levels through the adoption of CAMP by Saskatchewan growers not only improves crop production by enhancing soil health and nutrient cycling, but also, appears to provide a natural means of sequestering more atmospheric CO2 within an active, dynamic SOC fraction, along with relatively stable recalcitrant SOC, which is resistant to loss as CO2 via heterotrophic microbial respiration. Finally, given the stabilizing effects of both soil mineralogy and microbial community structure on sequestered SOC permanence, future work on these field soils should examine differences in texture, quantities of occluded and heavy fraction SOC, and microbial community structure between the 1996 and 2018 samples. Such analyses and comparisons should help to clarifying the observed SOC trends before and after 21 years of CAMP and the associated mechanisms involved.
10. Success stories/ practical implications for producers or industry: Identify new innovations and /or technologiesdeveloped through this project; and elaborate on how they might impact the producers /industry.
Several methodologies to assess the nature of SOC were successfully applied to soil samples, collected before and after 21 years of CAMP, in a wide range of Saskatchewan farm fields. The results of these analyses point to positive changes in the amounts and quality of key SOC fractions in Saskatchewan soils that benefit the storage and cycling of C.
11. Patents/ IP generated/ commercialized products: List any products developed from this research.
None.
12. List technology transfer activities: Include presentations to conferences, producer groups or articles published in science journals or other magazines.
Hangs, R.D. and Schoenau, J.J. 2019. Soil respiration before and after 22 years of no-till management. 2019 Soils and Crops Workshop, March 5-6, Saskatoon, SK.
Hangs, R.D. and Schoenau, J.J. 2019. Soil carbon pools before and after 22 years of no-till management in prairie soils. 2019 Canadian Soil Science Society Annual Meetings, July 9-13, Saskatoon, SK.
13. List any industry contributions or support received.
None.
14. Is there a need to conduct follow up research? Detail any further research, development and/or communication needs arising from this project.

Page 33 of 45
More than half of the total SOC in temperate surface soils is believed to be associated with soil mineral particles (Six et al., 2002; Zimmermann et al., 2007; Wagai et al., 2009). With regard to mineral particle associations, there are three SOC pools, possessing varying degrees of soil mineral particle association and, therefore, having a progressively greater degree of stabilization and permanence (Christensen, 1992; Gregorich et al., 2006, 2009): i) free light fraction that was quantified in our study (no mineral association; active; residence time of several years), ii) occluded light fraction (intermediate; protected within soil aggregates, which limits its accessibility/susceptibility to heterotrophic mineralization; residence time of decades to hundreds of years), and iii) heavy fraction (passive; complexed with clay mineral particles; residence time of hundreds to thousands of years). Considering the critical role soil mineralogy plays in the relative stability of sequestered SOC, we recommend further examination of textural differences among the 90 soils, along with quantifying and comparing the occluded and heavy fractions of SOC within both the 1996 and 2018 samples. Such information would help to further clarify the underlying mechanistic pathways of SOC partitioning into these different SOC fractions and help identify and predict soils where greater permanence may be realized.
Soil microbes have long been recognized as the most sensitive indicators of disturbance-related impacts resulting from altering land management practices; and changes in microbial populations often occur much sooner than changes in total SOC levels can be measured (Powlson et al., 1987; Balota et al., 2004; Voroney et al., 2008). In our study, CAMP altered the microbial biomass C:N ratio, which is indicative of a modified microbial community structure. For example, a shift toward fungal dominance in the microbial community is often associated with enhance SOC sequestration, due to improved soil aggregation (Six et al., 2006; Malik et al., 2016). The phospholipid fatty acid analysis technique has been successfully used to profile microbial community structures for 40 years, to provide insight into the response of microbial populations to environmental disturbance (Willers et al., 2015) and we believe performing this analysis on both the 1996 and 2018 samples could also help to explain the observed SOC trends we have noted in our separated fractions, particularly if the greater permanence of the sequestered SOC following the adoption CAMP is related to the stabilizing effect of augmented organo-mineral-microbial complexes within the 2018 soils.
15. Acknowledgements. Include actions taken to acknowledge support by the Ministry of Agriculture and the Canada-Saskatchewan Growing Forward 2 bilateral agreement.
Funding support is always recognized at the end of presentations and papers on results of project.
16. Appendices: Include any additional materials supporting the previous sections, e.g. detailed data tables, maps, graphs, specifications, literature cited
Appendix I: Supplementary Study – Examining the nature and permanence of SOC in soils from a native prairie, along with a short-term (18 years) and long-term (40 years) CAMP field.
Introduction
Within Saskatchewan, approximately 80% of the native prairies have been lost, particularly in prime cropland areas, where less than two percent of the original native prairie grasslands remain (Hammermeister et al., 2001). Globally, the conversion of native grassland to annual cropland has

Page 34 of 45
depleted the SOC stock markedly, especially within temperate regions (Lal, 2004; Sanderman et al., 2017). The initial cultivation of native soils promotes SOC loss by physically disrupting soil aggregates and, therefore, enhancing the loss of once occluded SOC from soil as CO₂-C through heterotrophic respiration (Tiessen et al., 1994; Abdalla et al., 2013). One of the objectives of CAMP is to restore the SOC levels of degraded agricultural soil to their pre-cultivation state, or greater, by increasing the net balance of photosynthetically-fixed CO₂. The intent is to ensure the added C soil from above- and below-ground crop residues is greater than the CO₂-C emissions from the soil, which will then render these agroecosystems an atmospheric C sink (Janzen et al., 1998; Frank and Dugas, 2001; Paustian et al., 2002).
The objective of this supplemental study was to assess the nature and permanence of sequestered SOC in soils collected at adjacent locations with contrasting land management histories: i native prairie, ii) short-term (18 years), and iii) long-term (40 years) no-till continuous-cropping systems. This was accomplished by quantifying the concentrations of total SOC and two various labile and dynamic soil C fractions (water-extractable and microbial biomass), along with respirable CO2-C during a six-week incubation. Examining the SOC characteristics of these contrasting sites will provide insight into the timeframe required since the adoption of CAMP to restore these degraded agricultural soils to a pre-cultivated condition.
Methods
The soil samples used were collected from an area located ≈ 19 km SE of Indian Head, Saskatchewan (103.58° W, 50.42° N) owned and operated by Jim Halford (Fig. 45). Given the decreasing areal extent and increasing fragmentation of native grasslands throughout the prairies, this study area is extremely unique, given the close proximity of such contrasting land management histories. Specifically, the study site consists of two neighboring fields, only differing in their duration of CAMP: either short-term (ST; 18 years) or long-term (LT; 40 years), which are adjacent to a native prairie. The following information was originally reported in Hangs et al. (2013). Prior to adopting CAMP, the management of both fields consisted of a fallow-crop system involving frequent tillage operations. The soils are sandy loam Orthic Black Chernozem of the Oxbow Association, developed on medium-textured calcareous glacial till with gently rolling knob and kettle topography (Ellis et al., 1965). The climate is considered sub-humid continental (mean annual temperature of 2.5°C; approximate annual precipitation and moisture deficit of 427 and 180 mm, respectively), with ≈ 110 frost-free days (Lafond et al., 2011). Six intact soil cores were collected throughout each site, using sectioned PVC pipe (10 × 15 cm) inserted into the frozen soil and excavated. A 0-15 cm depth was selected, because it is the zone of greatest SOC accumulation within CAMP soils (Malhi et al., 2006). Six intact cores were also collected from the adjacent native prairie at the same landscape position. Near-level areas within the ST and LT fields were chosen to avoid the influence of water redistribution and past erosional events from confounding the data. In addition to the intact PVC soil core sample, separate soil samples were collected next to each extracted soil core. These soil samples were air-dried to constant a weight, ground with a rolling pin, mixed, and sieved (< 2-mm fraction retained) before being analyzed for their concentrations of SOC, WEOC, WEON, MB-C, and MB-N using the methods previously described (Sections 2.4, 2.6, and 2.7). An incubation study was conducted to estimate the respirable-C fraction within each PVC soil

Page 35 of 45
Figure 45: Field study area near Indian Head, SK providing contrasting land management histories: a native prairie adjacent to two cropped fields under CAMP for either 18 (short-term) or 40 (long-term) years (a), and Jim Halford (b).
core by measuring CO2-C emissions over a six-week period, following the method previously described (Section 2.8). At the end of the incubation period, the soil within each PVC core was removed, air-dried to constant weight, weighed, and divided by the core volume it occupied to determine its bulk density.
Statistical Analyses
All the data were analyzed with the GLIMMIX procedure of SAS (Littell et al., 2006; SAS Institute, 2013) Variance heterogeneity was modeled for all analyses with the “_residual_/grp=Site” effect included in a random statement, to increase the inference space of the analyses. Means comparisons were performed using least significant differences (LSD; equivalent to Fisher’s protected LSD) at a significance level of 0.05.
Results and Discussion
Soil Organic Carbon
The SOC concentration values ranged from 2.9-4.2% (Fig. 46a) and are consistent with values observed among the 90 PSCB sites (Figs. 12a and 13a) and reported elsewhere for these same sites (Hangs et al., 2013). The only difference among the three sites was the 45% greater SOC concentration within the native soil compared to the ST soil. Although the greater SOC concentration within native soils compared to degraded agriculture soils has been recognized for some time (Six et al, 1998), it is important to recognize that the most accurate comparisons between SOC levels are done when calculating SOC content on an equal mass basis (i.e., using their respective soil bulk density values; Ellert and Bettany, 1995). Accordingly, the SOC contents ranged from 41-48 Mg C/ha (Fig. 46b), which are consistent with values reported elsewhere for these same sites (Lafond et al., 2011), and indicate both the LT and native soils contain more SOC (≈20%) than the ST soil. The similarity in SOC content between the LT and native soils was recognized previously (Lafond et al., 2011; Hangs et al., 2013) and has been attributed to the effect of increased net
A B

Page 36 of 45
Figure 46. Mean (n=6; 0-15 cm) soil organic carbon (SOC) concentration (a) and content (b) of soils collected at adjacent locations with contrasting land management histories: a native prairie adjacent to two cropped fields under CAMP for either 18 (Short-term) or 40 (Long-term) years. Note: bars with the same letter are not significantly different (P >0.05) using LSD.
primary production under CAMP, resulting in larger above- and below-ground crop residue inputs, particularly from root-derived SOC (e.g., root biomass and rhizodeposition; Gale and Cambardella, 2000). Increased fungal-associated aggregation and protection of occluded SOC within aggregates is another proposed sequestration mechanism (Beare et al., 1993; Six et al., 2006, Malik et al., 2016). Finally, it is important to note that our SOC assessment work in this study and in the PSCB study has been limited to the surface soil (0-15 and 0-10 cm depths, respectively). Given the importance of root distribution with depth on below-ground inputs of SOC (Fan et al., 2016), along with other important root characteristics (e.g., root length density, biomass, and rhizodeposition), future work comparing CAMP and native soils should include SOC assessments of at least 1m in depth for a more realistic comparison of the SOC sequestration potential within each system.
Water-Extractable Organic Carbon
The WEOC concentration and WEOC content values ranged from 97-135 mg C/kg and 136-158 kg C/ha, respectively (Fig. 47), and are consistent with values observed among the 90 PSCB sites (Figs. 24a and 25a). The WEOC data followed a similar trend as the SOC concentration and WEOC content data (Fig. 46), with the lack of difference in measured WEOC among the three sites presumably reflects the larger annual contributions of decomposable root biomass occurring under CAMP, compared to the longer-lived roots and lower turnover rates characteristic of temperate perennial grassland ecosystems (Gill and Jackson, 2000).
Microbial Biomass Carbon
The measured MB-C concentration and content ranged from 578-794 mg C/kg and 814-913 kg C/ha respectively (Fig. 48), and are consistent with values reported previously (Figs. 28a and 29a). Although the native soils had a greater MB-C concentration than the cultivated soils (≈40%; Fig. 48a), there was no statistically significant difference in MB-C content among the three soils (Fig. 48b). It is encouraging to see that in less than 20 years, the increased net primary productivity associated with CAMP can restore the microbial biomass back to native levels.
0.00.51.01.52.02.53.03.54.04.5
Short-term Long-term Native
SOC
Con
cent
ratio
n (%
)
b
aba A
0
10
20
30
40
50
60
Short-term Long-term NativeSO
C C
onte
nt (M
g C
/ha)
ba a
B

Page 37 of 45
Figure 47. Mean (n=6; 0-15 cm) water-extractable organic carbon (WEOC) concentration (a), and content (b) of soils collected at adjacent locations with contrasting land management histories: a native prairie adjacent to two cropped fields under CAMP for either 18 (Short-term) or 40 (Long-term) years. Note: bars with the same letter are not significantly different (P >0.05) using LSD.
Figure 48. Mean (n=6; 0-15 cm) microbial biomass carbon (MB-C) concentration (a) and content (b) of soils collected at adjacent locations with contrasting land management histories: a native prairie adjacent to two cropped fields under CAMP for either 18 (Short-term) or 40 (Long-term) years. Note: bars with the same letter are not significantly different (P >0.05) using LSD.
Soil CO2-C Fluxes in Respiration Study
The CO2-C emissions were linear in nature, with estimated cumulative emissions at the end of the six-week incubation ranging from 1.9-2.8 Mg C/ha/six weeks (Fig. 49), and are considerably greater than the measured emissions from the PSCB soils (Fig. 38), which is likely due to the warmer incubation temperature used in this study (23 oC vs 20 oC for the PSCB study) and the profound effect soil temperature has on increasing heterotrophic respiration rates (Dilekoğlu and Sakin, 2017). There were no differences in cumulative CO2-C emissions among the soils after six weeks, however, by week four, the native soil had greater CO2-C emissions than ST soil and by the sixth week had greater CO2-C emissions than both the ST and LT agricultural soils (≈45 and 23%, respectively; Fig. 49), which is consistent with the trend in measured fluxes from these three sites
2.5
3.0Short-term
Long-term a
a
ba/w
eek)
0
20
40
60
80
100
120
140
160
Short-term Long-term Native
Wat
er-E
xtra
ctab
le C
(mg
C/k
g so
il)
b
aba
A
020406080
100120140160180
Short-term Long-term NativeW
EOC
Con
tent
(kg
C/h
a) aa a
B
0100200300400500600700800900
Short-term Long-term Native
Mic
robi
al B
iom
ass
C (µ
g C
/g s
oil)
bb
aA
0100200300400500600700800900
1000
Short-term Long-term Native
MB
-C C
onte
nt (k
g C
/ha)
aa
aB

Page 38 of 45
Figure 49. Mean (n=6; 0-15 cm) cumulative CO2-C emissions during a six-week incubation by soil heterotrophs from soils collected at adjacent locations with contrasting land management histories: a native prairie adjacent to two cropped fields under CAMP for either 18 (Short-term) or 40 (Long-term) years. Note: for each week, soil types with the same letters are not significantly different (P >0.05) using LSD.
reported earlier (Hangs et al., 2013), along with other comparisons between native soils and soils under CAMP (Carpenter-Boggs et al., 2003; Purakayastha et al., 2009). Given the similarity in measured SOC, WEOC, and MB-C contents of these soils (Figs. 46-48), the greater activity of the native soil microbial community could be due to the presence of a larger portion of labile SOC available for microbial consumption that was not measured (e.g., light fraction) that can be larger in native soil compared to cultivated Chernozemic soils (Malhi et al., 2003). Another possibility could be due to the characteristically tight nitrogen cycling within native grassland soils, given their relatively low nitrification levels compared to agricultural soils (Dell et al., 2005; Lafond et al., 2011). Consequently, the smaller CO2-C emissions from the agricultural soils could be simply due to enhanced CO2 consumption by autotrophic nitrifiers within the nitrogen fertilized agricultural soils during the incubation study (Hangs et al., 2016), which would agree with the larger water-extractable organic nitrogen content within the ST and LT soils compared to the native soil (Fig. 50).
0.0
0.5
1.0
1.5
2.0
2.5
3.0
1 2 3 4 5 6
Short-term
Long-term
Native
aa
a
aaa
a
aa
a
ab
b
a
ab
b
a
b
b
Week
CO
2-C E
mis
sion
s (k
g C
/ha/
wee
k)C
O2-C
Em
issi
ons
(Mg
C/h
a/w
eek)
Page 39 of 45
Figure 50. Mean (n=6; 0-15 cm) water-extractable organic nitrogen (WEON) content of soils collected at adjacent locations with contrasting land management histories: a native prairie adjacent to two cropped fields under CAMP for either 18 (Short-term) or 40 (Long-term) years. Note: bars with the same letter are not significantly different (P >0.05) using LSD.
Conclusion
The results of this supplemental work indicate that given enough time, the adoption of CAMP is able to restore the SOC levels, along with certain active, dynamic fractions within degraded agricultural soils, to approach that of adjacent native grassland soil in the 0-15cm depth.
Appendix II: Literature Cited
Abdalla, M., B. Osborne, G. Lanigan, D. Forristal, M. Williams, P. Smith, and M.B. Jones. 2013. Conservation tillage systems: a review of its consequences for greenhouse gas emissions. Soil Use Manage. 29:199-209.
Agnew, J., Laguë, C., Schoenau, J.J., Farrell, R. 2010. Greenhouse gas emissions measured 24 hours after surface and subsurface application of different manure types. T. ASABE 53:1689-1701.
Alotaibi, K.D. and Schoenau, J.J. 2011. Enzymatic activity and microbial biomass in soil amended with biofuel production by-products. Applied Soil Ecology 48:227-235.
Anderson, T.H. and Domsch, K.H. 2010. Soil microbial biomass: the eco-physiological approach, Soil Biol. Biochem. 42:2039-2043.
Anderson, T.H. and Domsch, K. 1993. The metabolic quotient for CO2 (qCO2) as a specific activity parameter to assess the effects of environmental conditions, such as pH, on the microbial biomass of forest soils. Soil Biol. Biochem. 25:393-395.
Awale, R., Emeson, M.A., and Machado, S. 2017. Soil organic carbon pools as early indicators for soil organic matter stock changes under different tillage practices in inland pacific northwest Front. Ecol. Evol. 5:96.
Balota, E.L., Filhoa, A.C., Andrade, D.S., and Dick, R.P. 2004. Long-term tillage and crop rotation effects on microbial biomass and C and N mineralization in a Brazilian Oxisol. Soil & Tillage Research 77:137-145.
0
5
10
15
20
25
Short-term Long-term Native
WEO
N C
onte
nt (
kg N
/ha)
aa
b

Page 40 of 45
Beare, M.H., Pohland, B.R. Wright, D.H. and Coleman, D.C. 1993. Residue placement and fungicide effects on fungal communities in conventional and no-tillage soils. Soil Sci. Soc. Am. J. 57:392-399.
Biederbeck, V.O, Janzen, H.H., Campbell, C.A., and Zentner, R.P. 1994. Labile soil organic matter as influenced by cropping practices in an arid environment. Soil Biol. Biochem. 26:1647-1656.
Bünemann, E.K., Bongiorno, G., Bai, Z., Creamer, R.E., De Deyn, G., de Goede, R., Fleskens, L., Geissen, V., Kuyper, T.W., Mäder, P., Pulleman, M., Sukkel, W., van Groenigen, J.W., and Brussaard, L. 2018. Soil quality - A critical review. Soil Biol. Biochem. 120:105-125.
Carpenter-Boggs, L., Stahl, P. D., Lindstrom, M. J., Schumacher, T. E. 2003. Soil microbial properties under permanent grass, conventional tillage, and no-till management in South Dakota. Soil Tillage Res. 71:15-23.
Chantigny, M.H., Angers, D.A, Kaiser, K., and Kalbitz, K. 2008. Extraction and characterization of dissolved organic matter. In:Carter, M.R. and Gregorich, E.G. eds, Soil Sampling and Methods of Analysis, second edition. CSSS Taylor and Francis Group LLC, CRC Press, Boca Raton, FL, USA. p. 617-635.
Christensen, B.T. 2001. Physical fractionation of soil and structural and functional complexity in organic matter turnover. Eur. J. Soil Sci. 52:345-353.
Christensen, B.T., 1992. Physical fractionation of soil and organic matter in primary particle size and density separates. Advances in Agronomy 20:1-90.
Ćirić, V., Belić, M., Nešić, L., Šeremešić, S., Pejić, B., Bezdan, A., and Manojlović, M. 2016. The sensitivity of water extractable soil organic carbon fractions to land use in three soil types. Archives of Agronomy and Soil Science. 62:1654-1664.
Dell, C.J., Williams, M.A., Rice, C.W. 2005. Partitioning of nitrogen over five growing seasons in tallgrass prairie. Ecology 86:1280-1287.
Dhillon, G.S., Gillespie, A., Peak, D., and Van Rees, K.C.J. 2017. Spectroscopic investigation of soil organic matter composition for shelterbelt agroforestry systems. Geoderma 298:1-13.
Dilekoglu, M.F. and Sakin, E. 2017. Effect of temperature and humidity in soil carbon dioxide emission. J. Anim. Plant Sci. 27:1596-1603.
Ellerbrock, R.H., Gerke, H.H., Bachmann, J., Goebel, M.-O., 2005. Composition of organic matter fractions for explaining wettability of three forest soils. Soil Sci. Soc. Am. J. 69:57-66.
Ellerbrock, R.H., Höhn, A., Gerke, H., 1999. Characterization of soil organic matter from a sandy soil in relation to management practice using FT-IR spectroscopy. Plant Soil 213:55-61.
Ellert, B.H. and Bettany, J.R. 1995. Calculation of organic matter and nutrients stored in soils under contrasting management regimes. Can. J. Soil Sci. 75:529-538.
Ellis, J.G., Acton, D.F., and Clayton, J.S. 1965. The Soils of the Regina Map Area-72 I. Saskatchewan Centre for Soil Research, Saskatoon, SK.
Farquhar, G.D.., Ehleringer, J.R., and Hubick, K.T. 1989. Carbon isotope discrimination and photosynthesis. Annu. Rev. Plant Physiol. Plant Mol. Biol. 40:503-37.

Page 41 of 45
Fan, J., McConkey, B., Wang, H., and Janzen, H. 2016. Root distribution by depth for temperate agricultural crops. Field Crops Research 189:68-7.
Frank, A.B. and Dugas, W.A. 2001. Carbon dioxide fluxes over a northern, semiarid, mixed-grass prairie. Agric. For. Meteorol. 108:317-326.
Gill, R.A. and Jackson, R.B. 2000. Global patterns of root turnover for terrestrial ecosystems. New Phytol. 147:13-31.
Gajda, A.M. 2008. Effect of different tillage systems on some microbiological properties of soils under winter wheat. Int. Agrophysics. 22:201-208.
Ginting, D., Anabayan, K., Eghball, B., and Doran, J. 2003. Greenhouse gas emissions and soil indicators four years after manure and compost applications. J. Environ. Qual. 32:23-23.
Gosling, P., Parsons, N., and Bending, G.D. 2013. What are the primary factors controlling the light fraction and particulate soil organic matter content of agricultural soils? Biol Fertil Soils. 49:1001-1014.
Gregorich, E.G., Rochette, P., VandenBygaart, A.J., and Angers, D.A. 2005. Greenhouse gas contributions of agricultural soils and potential mitigation practices in eastern Canada. Soil Tillage Res. 83:53-72.
Gregorich, E.G., Beare, M.H., McKim, U.F., and Skjemstad, J.O., 2006. Chemical and biological characteristics of physically uncomplexed organic matter. Soil Science Society of America Journal 70:975-985.
Gregorich, E.G., and Beare, M.H. 2008. Physically uncomplexed organic matter. In: Carter, M.R. and Gregorich, E.G. eds, Soil Sampling and Methods of Analysis, 2nd Edition. Taylor and Francis Group LLC, CRC Press, Boca Raton, FL, USA. p. 607-616.
Gregorich, E.G., Carter, M.R., Angers, D.A., and Drury, C.F. 2009. Using a sequential density and particle size fractionation to evaluate carbon and nitrogen storage in the profile of tilled and no-till soils in eastern Canada. Canadian Journal of Soil Science 89:255-267.
Griffiths, B.S., Spilles, A., and Bonkowski, M. 2012. C:N:P stoichiometry and nutrient limitation of the soil microbial biomass in a grazed grassland site under experimental P limitation or excess. Ecol Process 6:1-11.
Haberhauer, G., Feigl, B., Gerzabek, M., and Cerri, C. 2000. FT-IR spectroscopy of organic matter in tropical soils:changes induced through deforestation. Appl. Spectrosc. 54:221-224.
Hamel, C., Hanson, K., Selles, F., Cruz, A.F., Lemke, R., McConkey, B., and Zentner, R. 2006. Seasonal and long-term resource-related variations in soil microbial communities in wheat-based rotations of the Canadian prairies. Soil Biol. Biochem. 38:2104-2116.

Page 42 of 45
Hammermeister, A., Gauthier, D., and McGovern, K. 2001. Saskatchewan's Native Prairie: Statistics Of A Vanishing Ecosystem And Dwindling Resource. Native Plant Society of Saskatchewan Inc., Saskatoon SK. 20p.
Haney, R.L., Franzluebbers, A.J., Jin, V.L., Johnson, M.V., Haney, E.B., White, M.J., and Harmel, R.D. 2012. Soil organic C:N vs. water-extractable organic C:N. Open Journal of Soil Science 2:269-274.
Hangs, R.D., Schoenau, J.J., and Lafond, G.P. 2013. The effect of nitrogen fertilization and no-till duration on soil nitrogen supply power and post-spring thaw greenhouse-gas emissions. J. Plant Nutr. Soil Sci. 176:227-237.
Hangs, R.D., Schoenau, J.J., Van Rees, K.C.J., Bélanger, N., Volk, T., and Jensen, T. 2014. First rotation biomass production and nutrient cycling within short-rotation coppice willow plantations in Saskatchewan, Canada. BioEnergy Research 7:1091-1111.
Hangs, R.D., Ahmed, H.P., and Schoenau, J.J. 2016. Influence of willow biochar amendment on soil nitrogen availability and greenhouse gas production in two fertilized temperate prairie soils. Bioenerg. Res. 9:157-171.
Janzen, H.H., Campbell, C.A., Izaurralde, R.C., Ellert, B.H., Juma, N., McGill, W.B., and Zentner, R.P. 1998. Management effects on soil C storage on the Canadian prairies. Soil Tillage Res. 47:181-195.
Janzen, H.H., Campbell, C.A., Gregorich, E.G., and Ellert, B.H. 1997. Soil carbon dynamics in Canadian agroecosystems. p. 57-80 in Lal, R. Kimble, J., Follett, R., and Stewart, B.A. eds. Soil processes and the carbon cycle. CRC Press, Boca Raton, FL.
Janzen, H.H., Campbell, C.A., Brandt, S.A., Lafond, G.P., and Townley-Smith, L. 1992. Light-fraction organic matter in soils from long-term crop rotations Soil Sci. Soc. Am. J. 56:1799-1806.
Lafond, G.P., Walley, F., May, W.E., and Holzapfel, C.B. 2011. Long-term impact of no-till on soil properties and crop productivity on the Canadian prairies. Soil Tillage Res. 117:110-123.
Lal, R. 2016. Soil health and carbon management. Food and Energy Security. 5:212-222.
Lemke, R.L., Vandenbygaart, A.J., Campbell, C.A., Lafond, G.P., McConkey, B.G., and Grant, B. 2012. Long-term effects of crop rotations and fertilization on soil C and N in a thin Black Chernozem in southeastern Saskatchewan. Can. J. Soil Sci. 92:449-461.
Lemke, R.L., Izaurralde, R.C., Nyborg, M., Solberg, E.D. 1999. Tillage and N source influence soil-emitted nitrous oxide in the Alberta Parkland region. Can. J. Soil Sci. 79:15-24.
Liebig, M.A., Morgan, J.A., Reeder, J.D., Ellert, B.H., Gollany, H.T., Schuman, G.E. 2005. Greenhouse gas contributions and mitigation potential of agricultural practices in northwestern USA and western Canada. Soil Tillage Res. 83:25-52.
Littell, R.C., Milliken, G.A., Stroup, W.W., and Wolfinger, R.D. 2006. SAS® System for Mixed Models. Second ed. SAS Institute Inc, Cary, NC. SAS Institute. 2013. SAS/STAT 13.1 User's Guide. SAS Institute Inc., Cary, NC.
MacKenzie. D. 2009. Feeding the 9 billion. New Sci. 204:8-9.

Page 43 of 45
Malhi, S.S., Brandt, S. and Gill, K.S. 2003. Cultivation and grassland type effects on light fraction and total organic C and N in a Dark Brown Chernozemic soil. Can. J. Soil Sci. 83:145-153.
Malik, A.A., Chowdhury, S., Schlager, V., Oliver, A., Puissant, J., Vazquez, P.G.M., Jehmlich, N., von Bergen, M., Griffiths, R.I., and Gleixne, G. 2016. Soil Fungal: Bacterial Ratios Are Linked to Altered Carbon Cycling. Frontiers in Microbiology 7:1247.
McConkey, B.G., Liang B.C., Campbell, C.A., Moulin, A., Brandt, S.A., and Lafond, G.P. 2000. Long-term tillage and crop rotation effects on soil aggregation. p.626-641. In: Soils and Crops, Extension Division, University of Saskatchewan, Saskatoon, SK. 24, 25 Feb 2000.
McConkey, B.G., Liang, B.C., Campbell, C.A., Curtin, D., Moulin, A., Brandt, S.A., Lafond, G.P. 2003. Crop rotation and tillage impact on carbon sequestration in Canadian prairie soils. Soil Tillage Res. 74:81-90.
Miller, J.J., Owen, M.L., Hao X., Drury, C.F., and Chanasyk, D.S. 2019. Short-term legacy effects of feedlot manure amendments on water-extractable organic carbon in a clay loam soil profile. Canadian Journal of Soil Science. 99:36-45
Murage, E.W., Voroney, P., Beyaert, R.P. 2007. Turnover of carbon in the free light fraction with and without charcoal as determined using the 13C natural abundance method. Geoderma 138:133-143.
Nelson, J.D.J., Schoenau, J.J., and Malhi, S.S. 2008. Soil organic carbon changes and distribution in cultivated and restored grassland soils in Saskatchewan. Nutr. Cycl. Agroecosyst. 82:137-148.
O’Leary, M.H. 1988. Carbon Isotopes in Photosynthesis. BioScience 38:328-336.
Pennock, D.J. 2003. Multi-site assessment of cultivation-induced soil change using revised landform segmentation procedures. Can. J. Soil Sci. 83:565-580.
Pravia, M.V., Kemanian, A.R., Terra, J.A., Shi, Y., Macedoa, I., and Goslee, S. 2019 Soil carbon saturation, productivity, and carbon and nitrogen cycling in crop-pasture rotations. Agricultural Systems 171:13-22.
Powlson, D.S., Prookes, P.C., and Christensen., B.T. 1987. Measurement of soil microbial biomass provides an early indication of changes in total soil organic matter due to straw incorporation. Soil Biol. Biochem. 19:159-164.
Purakayastha, T.J., Smith, J.L., and Huggins, D.R. 2009. Microbial biomass and N cycling under native prairie, conservation reserve and no-tillage in Palouse soils. Geoderma 152:283-289.
Rui, Y., Murphy, D.V., Wang, X., and Hoyle, F.C. 2016. Microbial respiration, but not biomass, responded linearly to increasing light fraction organic matter input: Consequences for carbon sequestration Sci Rep. 6:35496.
Sanderman, J., Hengl, T., and Fiske, G.J. 2017. Soil carbon debt of 12,000 years of human land use. Proc. Natl. Acad. Sci. USA. 114:9575-9580.
Six, J., Elliott, E.T., Paustian, K., and Doran J.W. 1998. Aggregation and soil organic matter accumulation in cultivated and native grassland soils. Soil Sci. Soc. Am. J. 62:1367-1377.

Page 44 of 45
Six, J., Feller, C., Denef, K., Ogle, S.M., de Moraes, J.C., and Albrecht, A. 2002. Soil organic matter, biota and aggregation in temperate and tropical soils - Effects of no-tillage. Agronomie 22:755-775.
Six, J., Frey, S.D., Thiet, R.K., and Batten, K.M. 2006. Bacterial and fungal contributions to carbon sequestration in agroecosystems. Soil Sci. Soc. Am. J. 70:555-569.
Skjemstad, J.O. and Baldock, J.A. 2008. Total and organic carbon. In: Carter, M.R. Gregorich, E.G. eds, Soil sampling and methods of analysis. 2nd Edition. CRC Press, Boca Raton, FL. p. 225-239.
Sparling, G.P. 1997. Soil microbial biomass, activity and nutrient cycling as indicators of soil health. In: Pankhurst, C., Doube, B.M., Gupta, V.V.S.R. eds., Biological Indicators of Soil Health. CAB International, Wallingford; New York, p. 97-119.
Sparling, G.P. 1992. Ratio of microbial biomass carbon to soil organic carbon as a sensitive indicator of changes in soil organic matter. Aust. J. Soil Res. 30:195-207.
Stewart, C.E., Paustian, K. Conant, R.T. Plante, A.F. and Six, J. 2009. Soil carbon saturation: Implications for measurable carbon pool dynamics in long-term incubations. Soil Biology and Biochemistry 41:357-366.
Stewart, C.E., Paustian, K., Conant, R.T, Plante, A.F. and Six., J. 2007. Soil carbon saturation: concept, evidence and evaluation. Biogeochemistry 86:19-31.
Sun, H.Y., Koal, P., Gerl, G., Schroll, R., Joergensen, G., and Munch, J.C. 2017. Water-extractable organic matter and its fluorescence fractions in response to minimum tillage and organic farming in a Cambisol Chem. Biol. Technol. Agric. 4:15
Tan, Z., Lal, R., Owens, L., and Izaurrald, R.C. 2007. Distribution of light and heavy fractions of soil organic carbon as related to land use and tillage practice. Soil & Tillage Research 92:53-59.
Tiessen, H., Cuevas, E., and Chacon, P. 1994: The role of soil organic matter in sustaining soil fertility. Nature 371:783-785.
VandenBygaart, A.J., Gregorich, E.G., and Angers, D.A. 2003. Influence of agricultural management on soil organic carbon: A compendium and assessment of Canadian studies. Can. J. Soil Sci. 83:363-380.
von Lutzowa M., Kogel-Knabner I., Ekschmitt K., Flessa H., and Guggenberger G., 2007. SOM fractionation methods: Relevance to functional pools and to stabilization mechanisms. Soil Biology & Biochemistry 39:2183-2207.
Voroney, R.P., Brookes, P.C., and Beyaert, R.P. 2008. Soil Microbial Biomass C, N, P, and S. In: M.R. Carter and E.G. Gregorich (eds), Soil Sampling and Methods of Analysis, 2nd Edition. CSSS. Taylor and Francis Group LLC, CRC Press, Boca Raton, FL, USA. p. 637-651.
Wardle, D.A. and Ghani, A. 1995. A critique of the microbial metabolic quotient (qCO2) as a bio-indicator of disturbance and ecosystem development. Soil Biology and Biochemistry 27:1601-1610.
Willers, C., Jansen van Rensburg, P.J., and Claassens, S. 2015. Phospholipid fatty acid profiling of microbial communities–a review of interpretations and recent applications. Journal of Applied Microbiology 119:1207-1218.

Page 45 of 45
Wojdyr, M., 2010. Fityk: a general-purpose peak fitting program. J. Appl. Crystallogr. 43:1126-1128.
Xu, X., Thornton, P.E., and Post, W.M. 2013. A global analysis of soil microbial biomass carbon, nitrogen and phosphorus in terrestrial ecosystems. Global Ecol. Biogeogr. 22:737-74.
Zimmermann, M., Leifeld, J., Schmidt, M.W.I., Smith, P., and Fuhrer, J. 2007. Measured soil organic matter fractions can be related to pools in the RothC model. Eur. J. Soil Sci. 58:658-667.


![[ A ] SPIRITS ADF [ADF] VODKA - BASICabc.utah.gov/products/documents/CategoryPriceList.pdf · [ a ] spirits adf [adf] vodka - basic 037993 200 48 smirnoff vodka 200ml adw 1 0.81 5.49](https://static.fdocuments.us/doc/165x107/5b1b4d4d7f8b9a28258e6b02/-a-spirits-adf-adf-vodka-a-spirits-adf-adf-vodka-basic-037993.jpg)