Adex benchmark report 2015 programmatique marketing
35
AdEx Benchmark 2015 Interact Presentation 11th May 2016 Daniel Knapp, IHS Eleni Marouli, IHS
-
Upload
raphael-glatz -
Category
Marketing
-
view
320 -
download
2
Transcript of Adex benchmark report 2015 programmatique marketing
AdEx Benchmark 2015 Interact Presentation11th May 2016
Daniel Knapp, IHSEleni Marouli, IHS

About the study
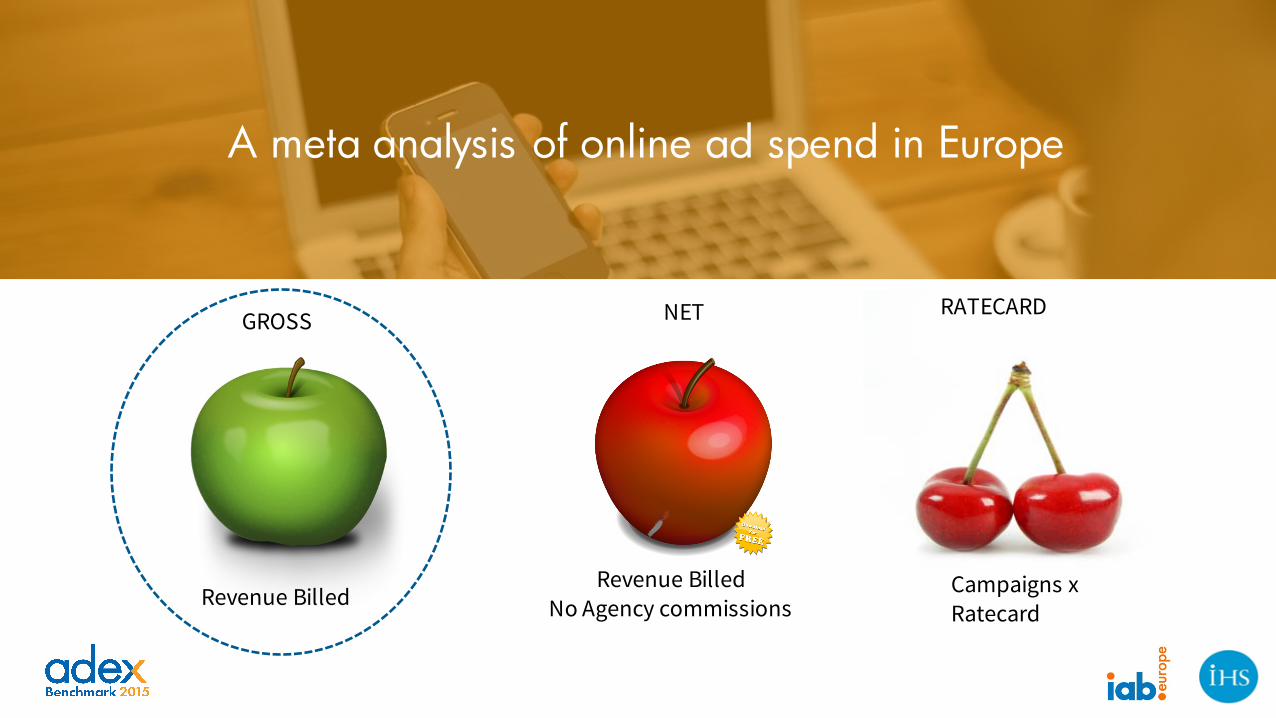
A meta analysis of online ad spend in Europe
RATECARD
Campaigns x Ratecard
GROSS
Revenue Billed
NET
Revenue Billed No Agency commissions
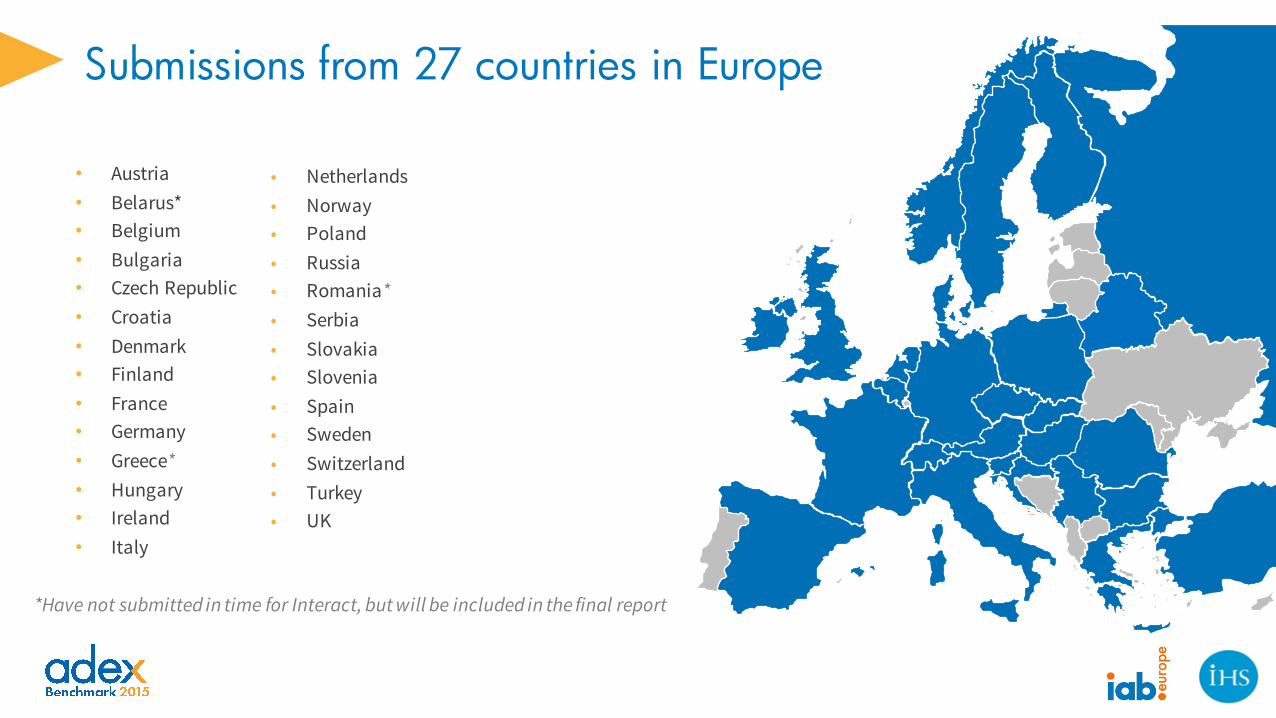
Submissions from 27 countries in Europe
• Austria• Belarus*• Belgium• Bulgaria• Czech Republic• Croatia• Denmark• Finland• France• Germany• Greece*• Hungary• Ireland• Italy
• Netherlands• Norway• Poland• Russia• Romania*• Serbia• Slovakia• Slovenia• Spain• Sweden• Switzerland• Turkey• UK
*Have not submitted in time for Interact, but will be included in the final report

Big picture and context
The value of online advertising in 2015
�36.2bn
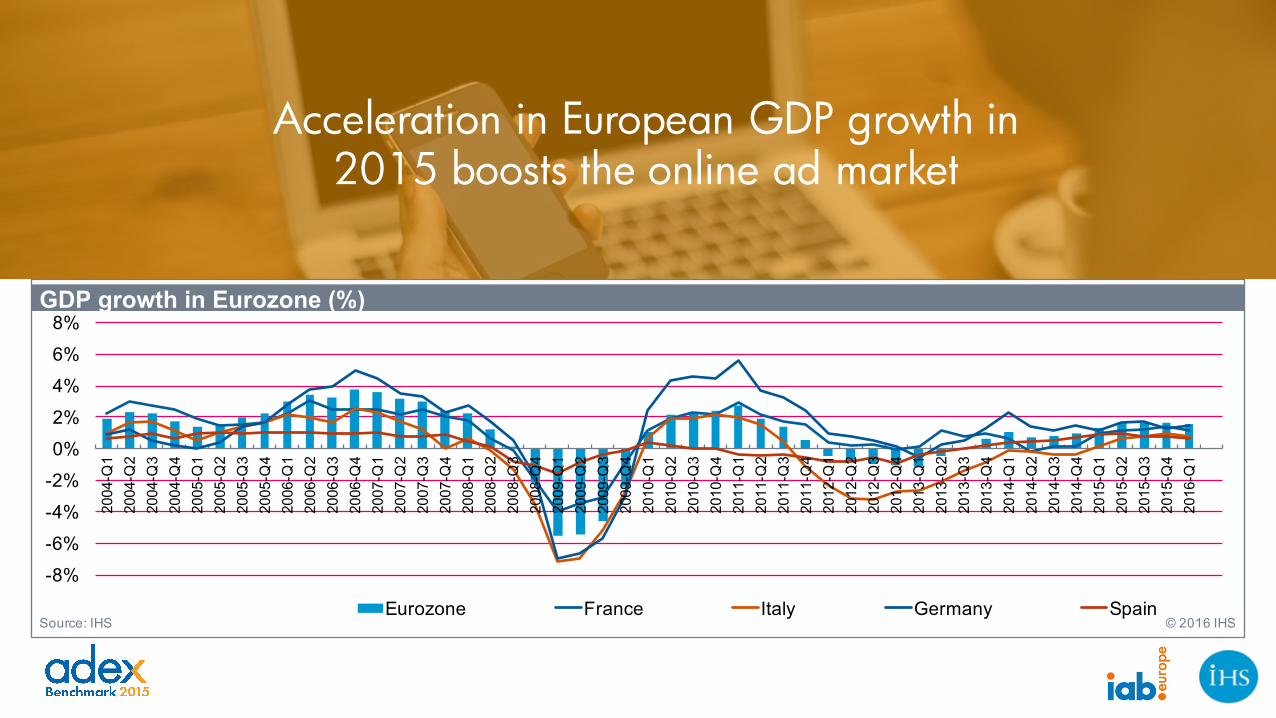
Acceleration in European GDP growth in 2015 boosts the online ad market
-8%
-6%
-4%
-2%
0%
2%
4%
6%
8%
2004
-Q1
2004
-Q2
2004
-Q3
2004
-Q4
2005
-Q1
2005
-Q2
2005
-Q3
2005
-Q4
2006
-Q1
2006
-Q2
2006
-Q3
2006
-Q4
2007
-Q1
2007
-Q2
2007
-Q3
2007
-Q4
2008
-Q1
2008
-Q2
2008
-Q3
2008
-Q4
2009
-Q1
2009
-Q2
2009
-Q3
2009
-Q4
2010
-Q1
2010
-Q2
2010
-Q3
2010
-Q4
2011
-Q1
2011
-Q2
2011
-Q3
2011
-Q4
2012
-Q1
2012
-Q2
2012
-Q3
2012
-Q4
2013
-Q1
2013
-Q2
2013
-Q3
2013
-Q4
2014
-Q1
2014
-Q2
2014
-Q3
2014
-Q4
2015
-Q1
2015
-Q2
2015
-Q3
2015
-Q4
2016
-Q1
Eurozone France Italy Germany Spain
GDP growth in Eurozone (%)
Source: IHS © 2016 IHS
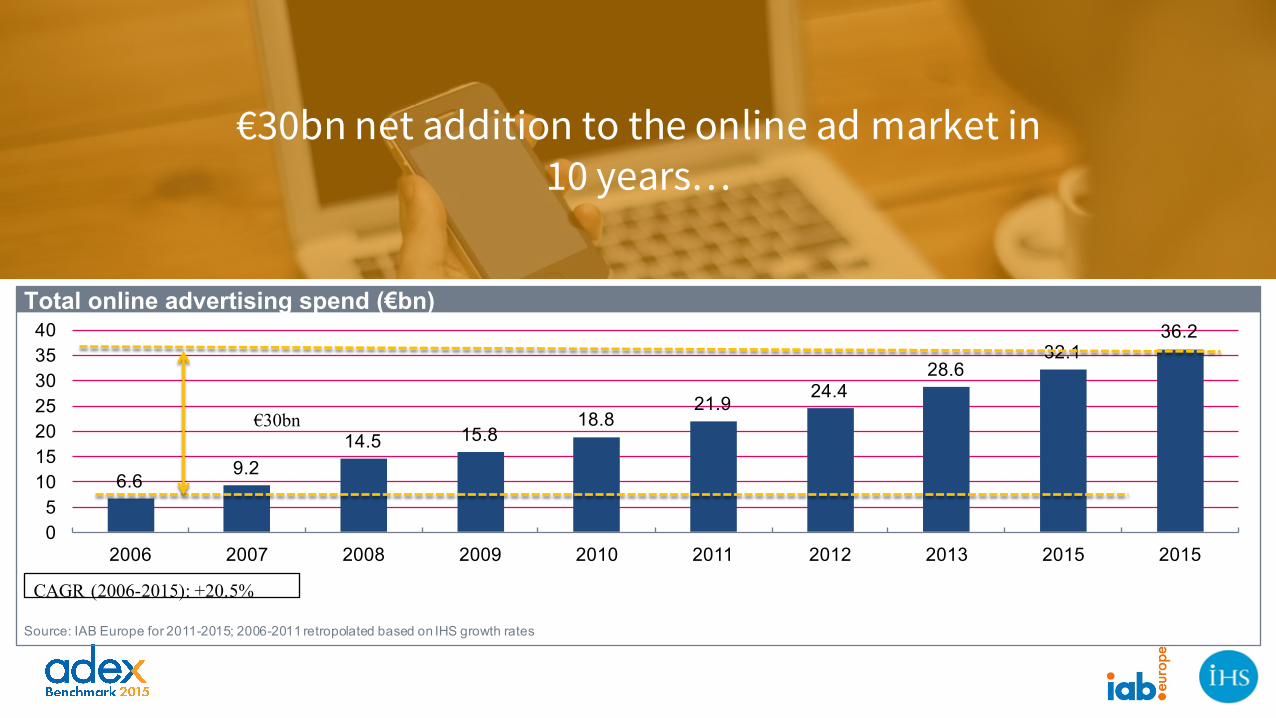
€30bn net addition to the online ad market in 10 years…
6.69.2
14.5 15.818.8
21.924.4
28.632.1
36.2
05
10152025303540
2006 2007 2008 2009 2010 2011 2012 2013 2015 2015
Total online advertising spend (€bn)
Source: IAB Europe for 2011-2015; 2006-2011 retropolated based on IHS growth rates
CAGR (2006-2015): +20.5%
€30bn
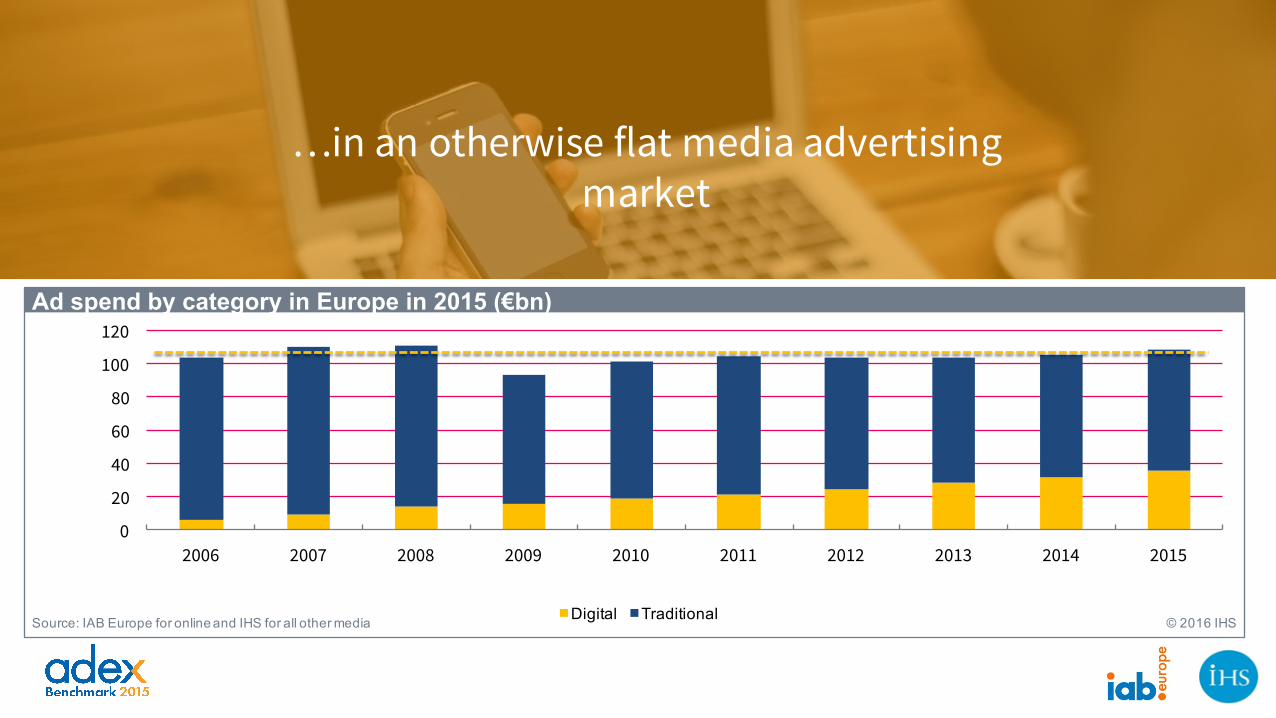
…in an otherwise flat media advertising market
0
20
40
60
80
100
120
2006 2007 2008 2009 2010 2011 2012 2013 2014 2015
Digital Traditional
Ad spend by category in Europe in 2015 (€bn)
Source: IAB Europe for online and IHS for all other media © 2016 IHS
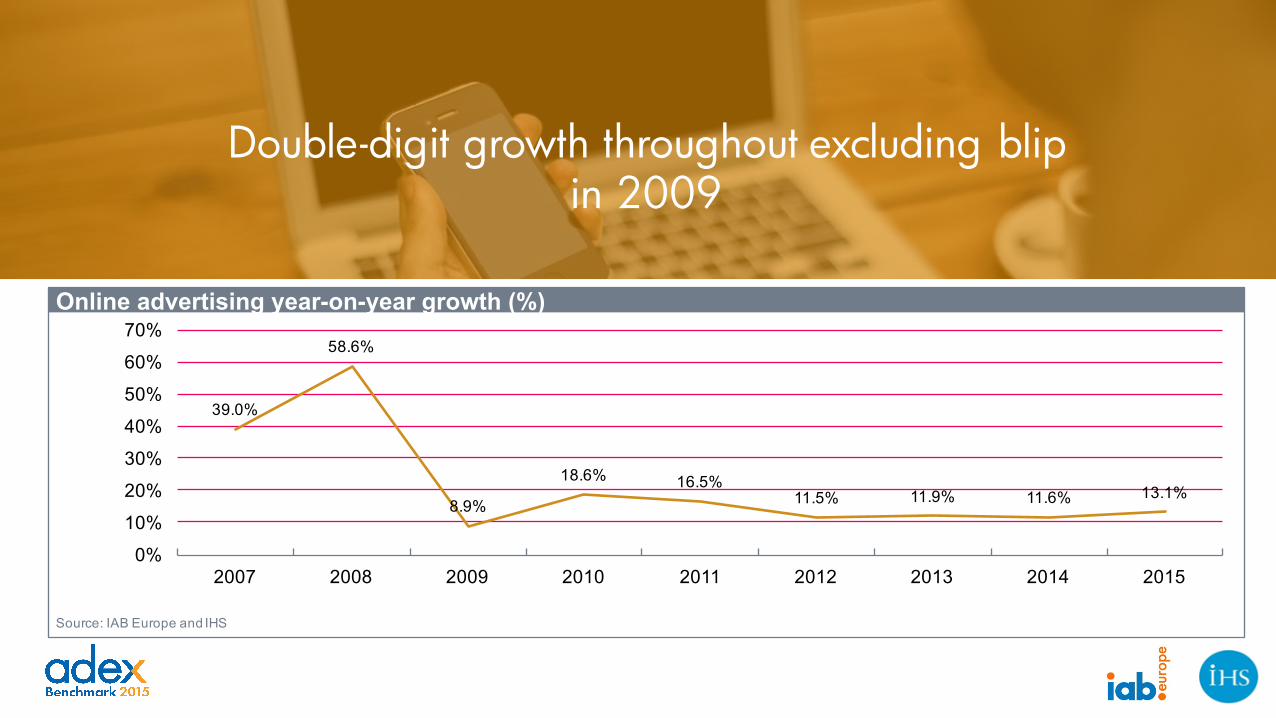
Double-digit growth throughout excluding blip in 2009
39.0%
58.6%
8.9%
18.6% 16.5%11.5% 11.9% 11.6% 13.1%
0%
10%
20%
30%
40%
50%
60%
70%
2007 2008 2009 2010 2011 2012 2013 2014 2015
Online advertising year-on-year growth (%)
Source: IAB Europe and IHS

Online lifts a declining media advertising market in 2015
1.0%
-28.2%
-3.9%
12.9% 15.9% 13.1%
4.8%
-19.5%
1.1%
-35%-30%-25%-20%-15%-10%
-5%0%5%
10%15%20%
Western Europe CEE Total Europe
Total excluding online Online Total
2015: advertising year-on-year growth (%)
Source: IAB Europe for online and IHS for all other media
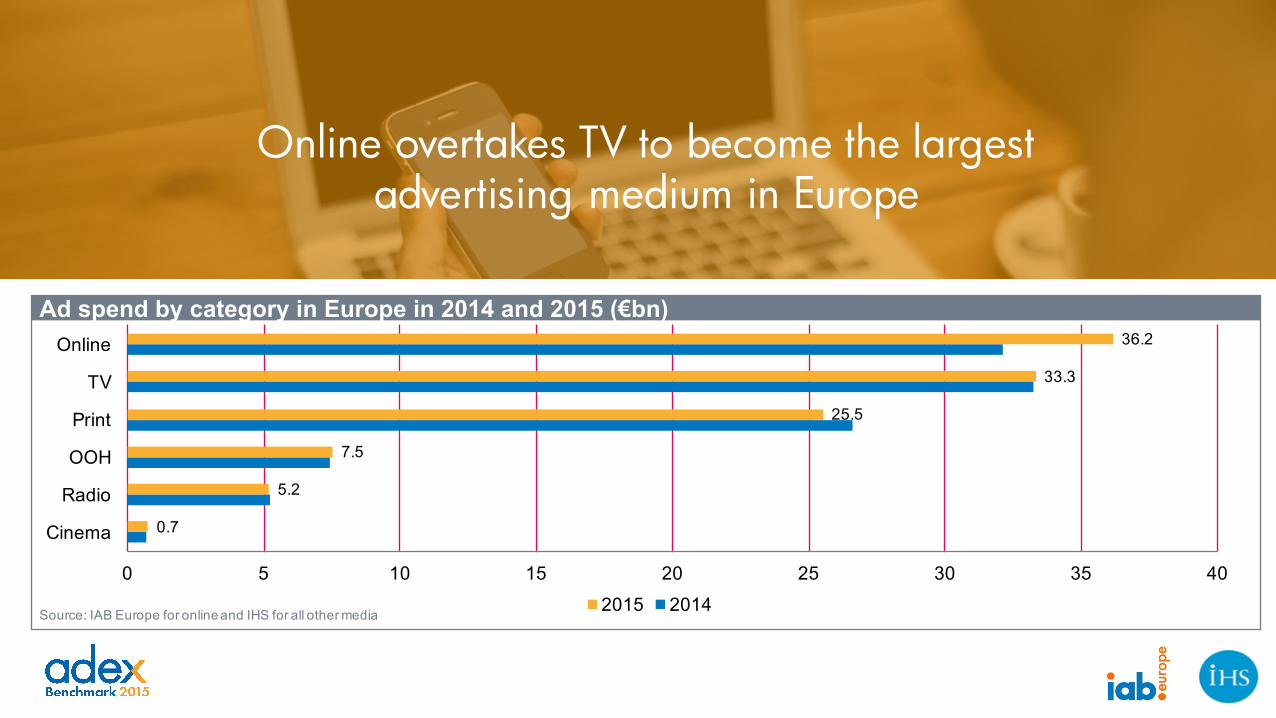
Online overtakes TV to become the largest advertising medium in Europe
0.7
5.2
7.5
25.5
33.3
36.2
0 5 10 15 20 25 30 35 40
Cinema
Radio
OOH
TV
Online
2015 2014
Ad spend by category in Europe in 2014 and 2015 (€bn)
Source: IAB Europe for online and IHS for all other media

Markets
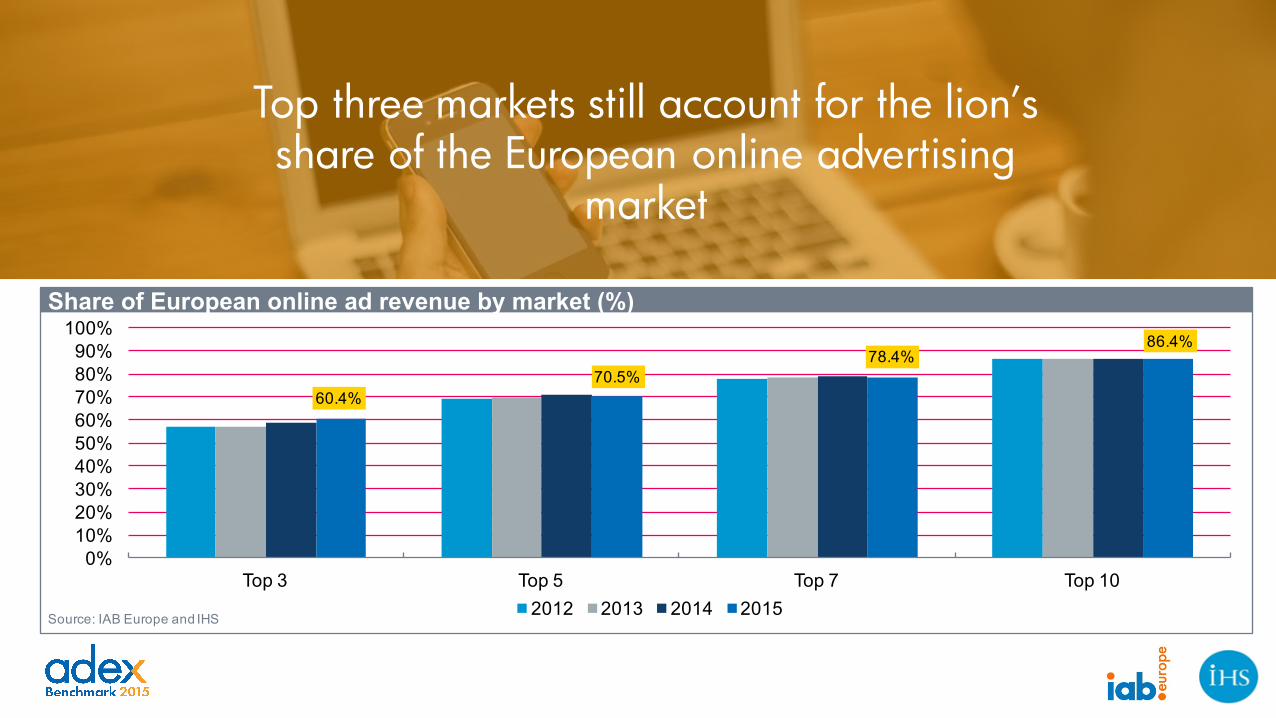
Top three markets still account for the lion’s share of the European online advertising
market
60.4%70.5%
78.4%86.4%
0%10%20%30%40%50%60%70%80%90%
100%
Top 3 Top 5 Top 7 Top 102012 2013 2014 2015
Share of European online ad revenue by market (%)
Source: IAB Europe and IHS
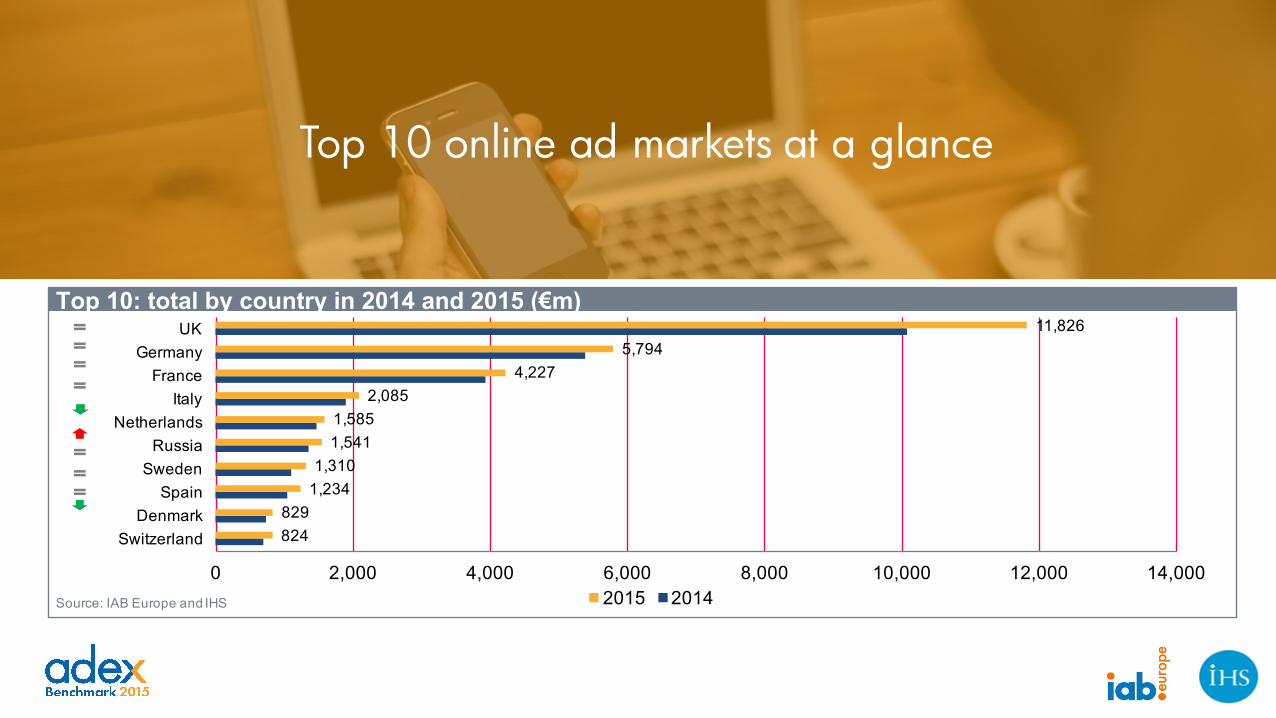
Top 10 online ad markets at a glance
824829
1,2341,310
1,5411,585
2,0854,227
5,79411,826
0 2,000 4,000 6,000 8,000 10,000 12,000 14,000
SwitzerlandDenmark
SpainSweden
RussiaNetherlands
ItalyFrance
GermanyUK
2015 2014
Top 10: total by country in 2014 and 2015 (€m)
Source: IAB Europe and IHS
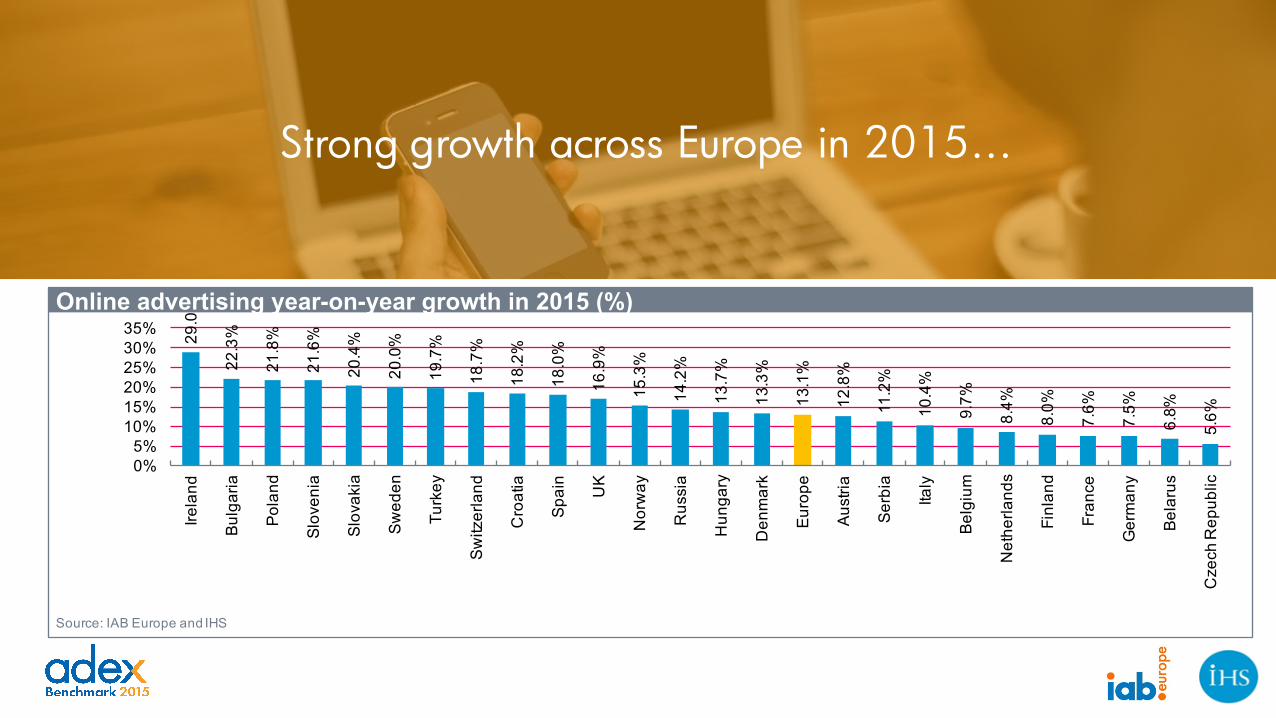
Strong growth across Europe in 2015…29
.0%
22.3
%
21.8
%
21.6
%
20.4
%
20.0
%
19.7
%
18.7
%
18.2
%
18.0
%
16.9
%
15.3
%
14.2
%
13.7
%
13.3
%
13.1
%
12.8
%
11.2
%
10.4
%
9.7%
8.4%
8.0%
7.6%
7.5%
6.8%
5.6%
0%5%
10%15%20%25%30%35%
Irela
nd
Bul
garia
Pol
and
Slo
veni
a
Slo
vaki
a
Sw
eden
Turk
ey
Sw
itzer
land
Cro
atia
Spa
in UK
Nor
way
Rus
sia
Hun
gary
Den
mar
k
Eur
ope
Aus
tria
Ser
bia
Italy
Bel
gium
Net
herla
nds
Finl
and
Fran
ce
Ger
man
y
Bel
arus
Cze
ch R
epub
lic
Online advertising year-on-year growth in 2015 (%)
Source: IAB Europe and IHS
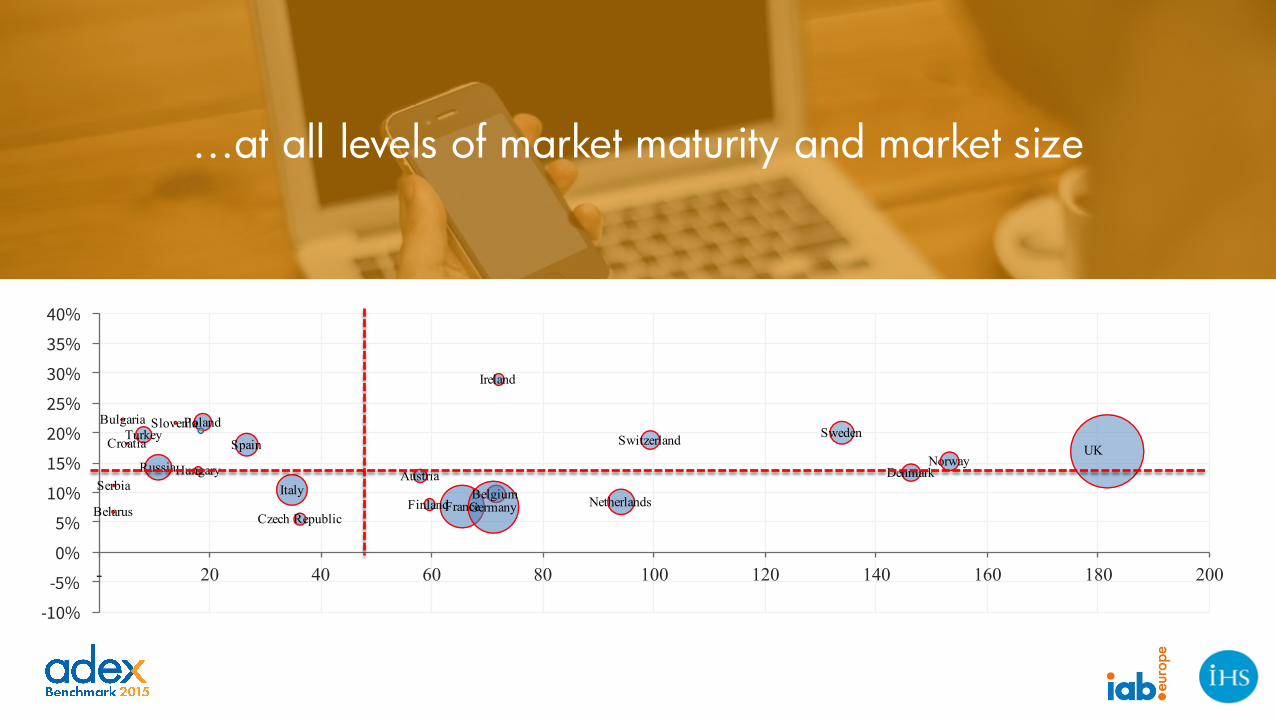
…at all levels of market maturity and market size
Belgium
Bulgaria
Croatia
Czech Republic
Denmark
FinlandFranceGermany
Hungary
Ireland
ItalyNetherlands
Norway
Poland
RussiaSerbia
Slovenia
Spain
Austria
Belarus
SwedenSwitzerlandTurkeyUK
-10%-5%0%5%
10%15%20%25%30%35%40%
- 20 40 60 80 100 120 140 160 180 200
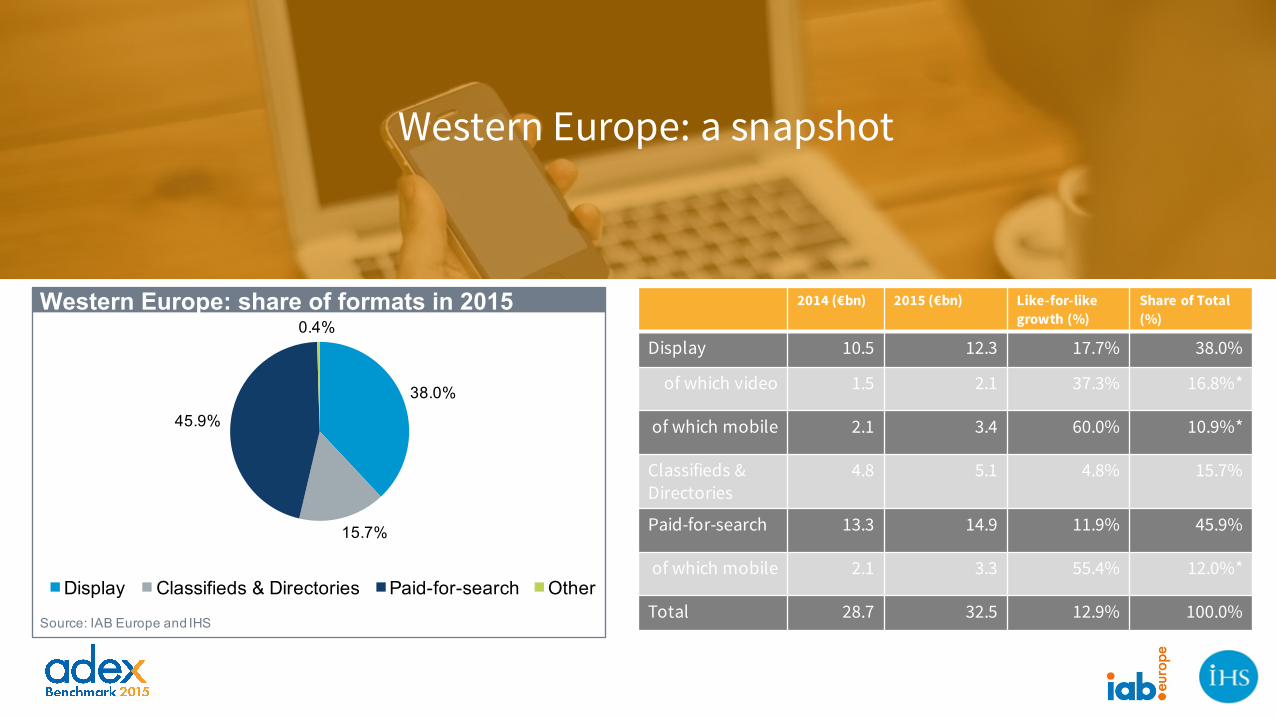
Western Europe: a snapshot
38.0%
15.7%
45.9%
0.4%
Display Classifieds & Directories Paid-for-search Other
Western Europe: share of formats in 2015
Source: IAB Europe and IHS
2014 (€bn) 2015 (€bn) Like-for-like growth (%)
Share of Total (%)
Display 10.5 12.3 17.7% 38.0%
of which video 1.5 2.1 37.3% 16.8%*
of which mobile 2.1 3.4 60.0% 10.9%*
Classifieds & Directories
4.8 5.1 4.8% 15.7%
Paid-for-search 13.3 14.9 11.9% 45.9%
of which mobile 2.1 3.3 55.4% 12.0%*
Total 28.7 32.5 12.9% 100.0%
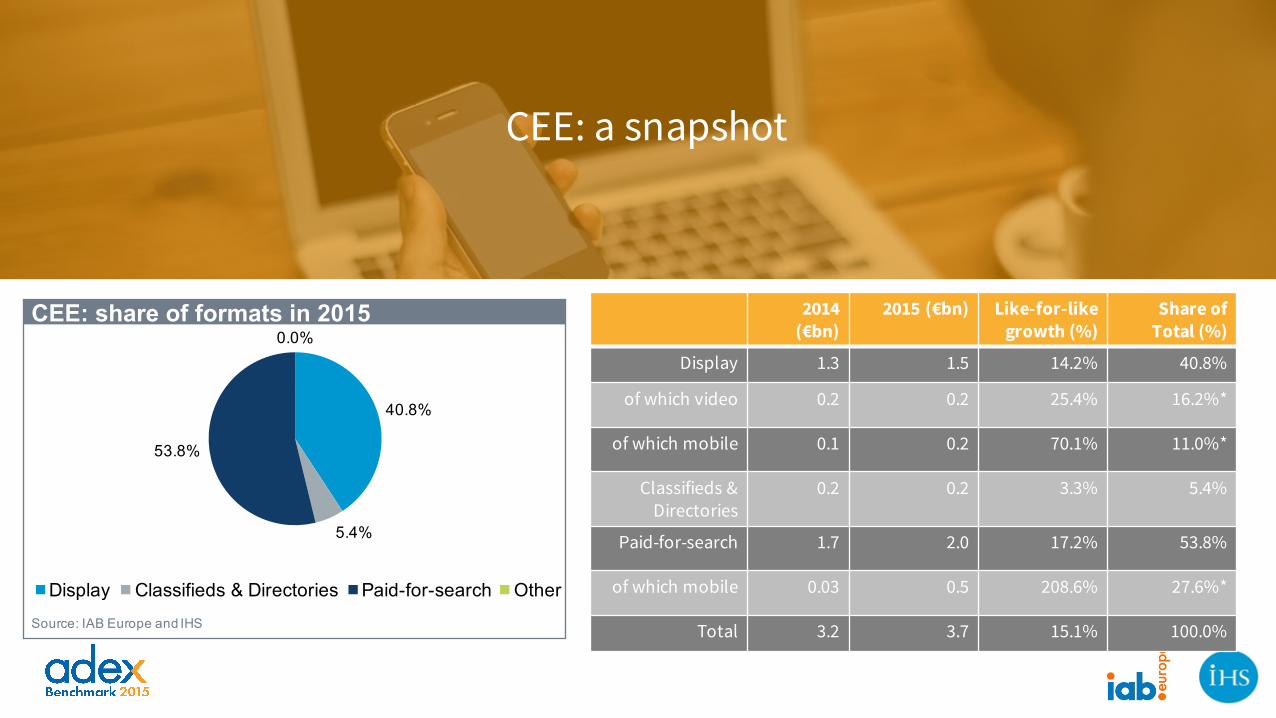
CEE: a snapshot
40.8%
5.4%
53.8%
0.0%
Display Classifieds & Directories Paid-for-search Other
CEE: share of formats in 2015
Source: IAB Europe and IHS
2014 (€bn)
2015 (€bn) Like-for-like growth (%)
Share of Total (%)
Display 1.3 1.5 14.2% 40.8%
of which video 0.2 0.2 25.4% 16.2%*
of which mobile 0.1 0.2 70.1% 11.0%*
Classifieds & Directories
0.2 0.2 3.3% 5.4%
Paid-for-search 1.7 2.0 17.2% 53.8%
of which mobile 0.03 0.5 208.6% 27.6%*
Total 3.2 3.7 15.1% 100.0%
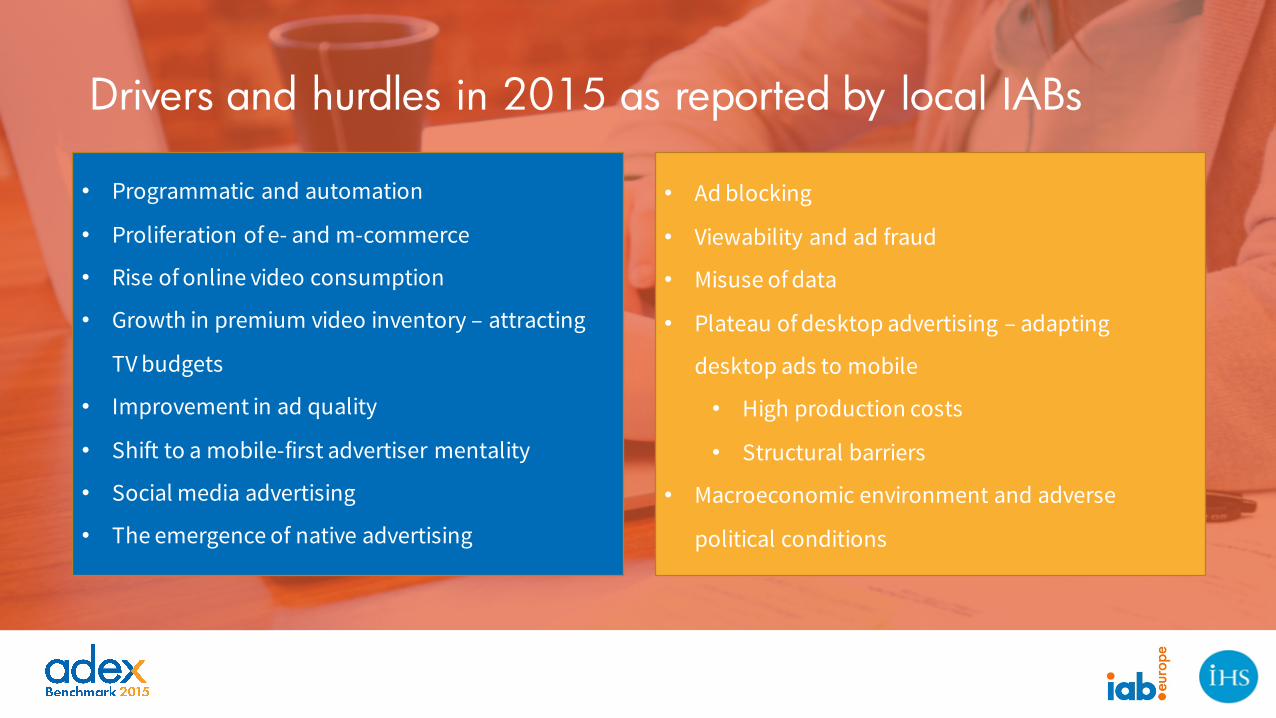
• Programmatic and automation
• Proliferation of e- and m-commerce
• Rise of online video consumption
• Growth in premium video inventory – attracting
TV budgets
• Improvement in ad quality
• Shift to a mobile-first advertiser mentality
• Social media advertising
• The emergence of native advertising
• Ad blocking
• Viewability and ad fraud
• Misuse of data
• Plateau of desktop advertising – adapting
desktop ads to mobile
• High production costs
• Structural barriers
• Macroeconomic environment and adverse
political conditions
Drivers and hurdles in 2015 as reported by local IABs
Formats
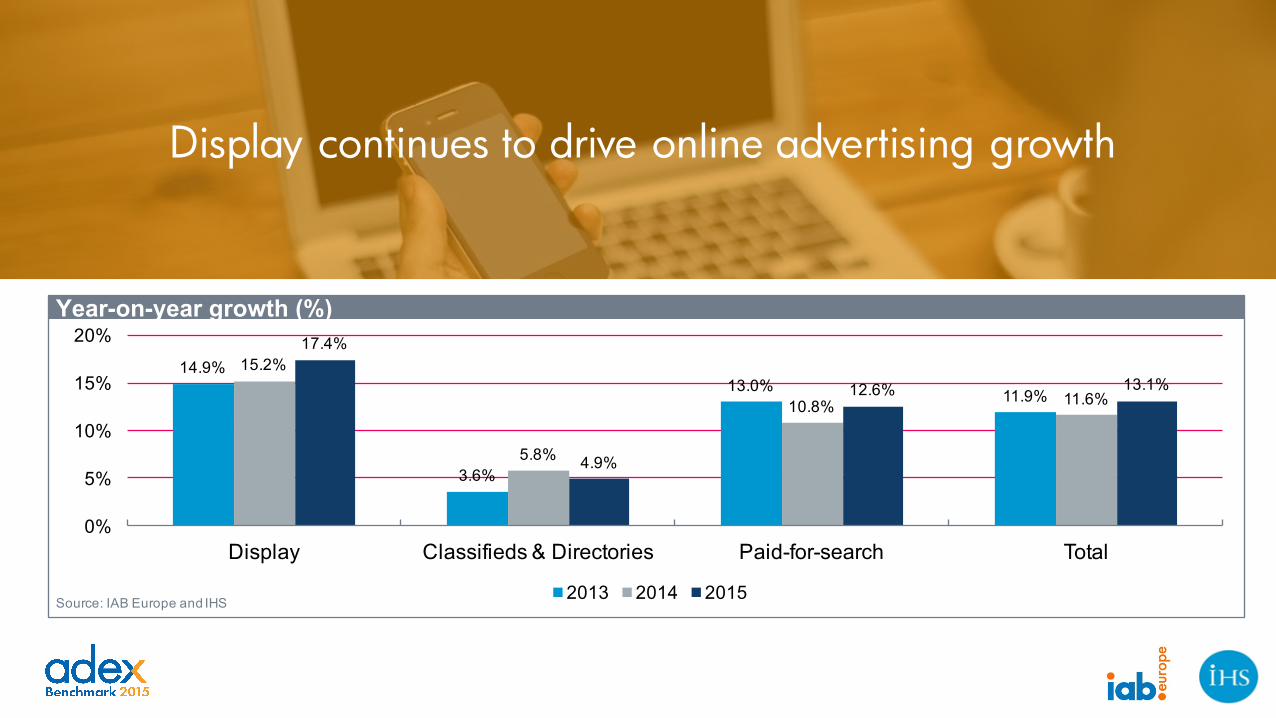
Display continues to drive online advertising growth
14.9%
3.6%
13.0% 11.9%
15.2%
5.8%
10.8% 11.6%
17.4%
4.9%
12.6% 13.1%
0%
5%
10%
15%
20%
Display Classifieds & Directories Paid-for-search Total
2013 2014 2015
Year-on-year growth (%)
Source: IAB Europe and IHS
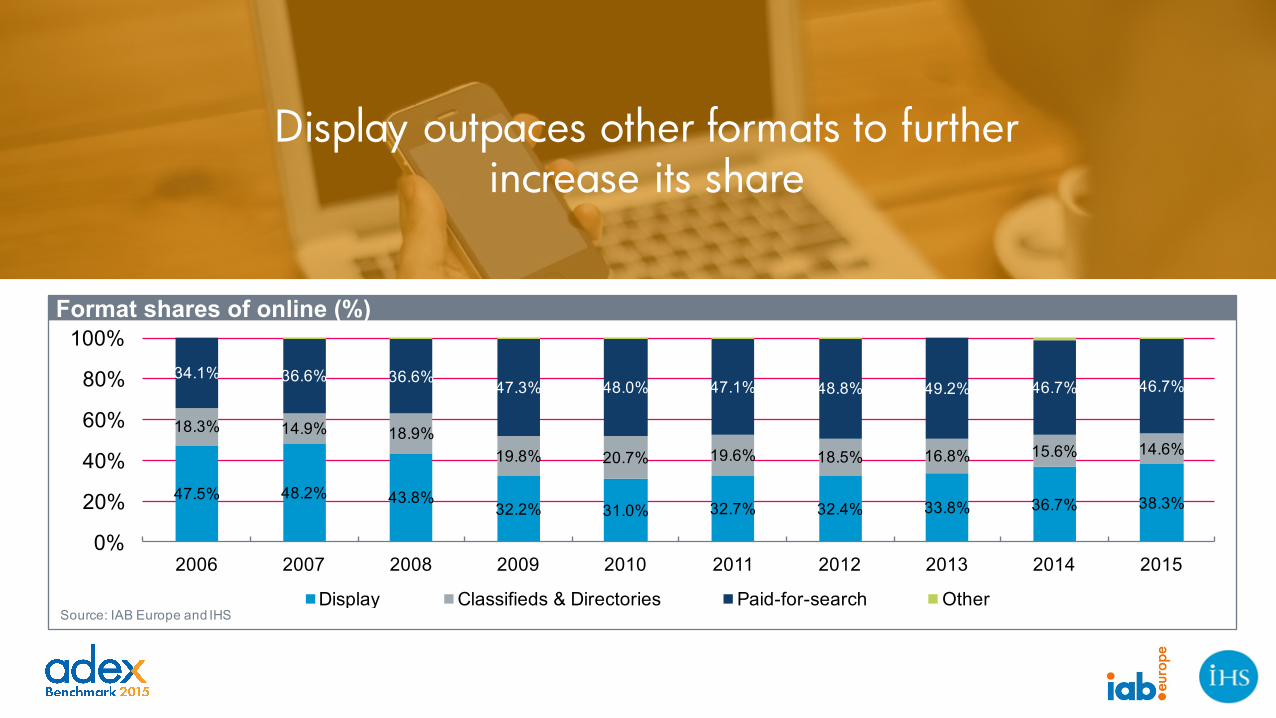
Display outpaces other formats to further increase its share
47.5% 48.2% 43.8%32.2% 31.0% 32.7% 32.4% 33.8% 36.7% 38.3%
18.3% 14.9% 18.9%19.8% 20.7% 19.6% 18.5% 16.8% 15.6% 14.6%
34.1% 36.6% 36.6%47.3% 48.0% 47.1% 48.8% 49.2% 46.7% 46.7%
0%
20%
40%
60%
80%
100%
2006 2007 2008 2009 2010 2011 2012 2013 2014 2015
Display Classifieds & Directories Paid-for-search Other
Format shares of online (%)
Source: IAB Europe and IHS
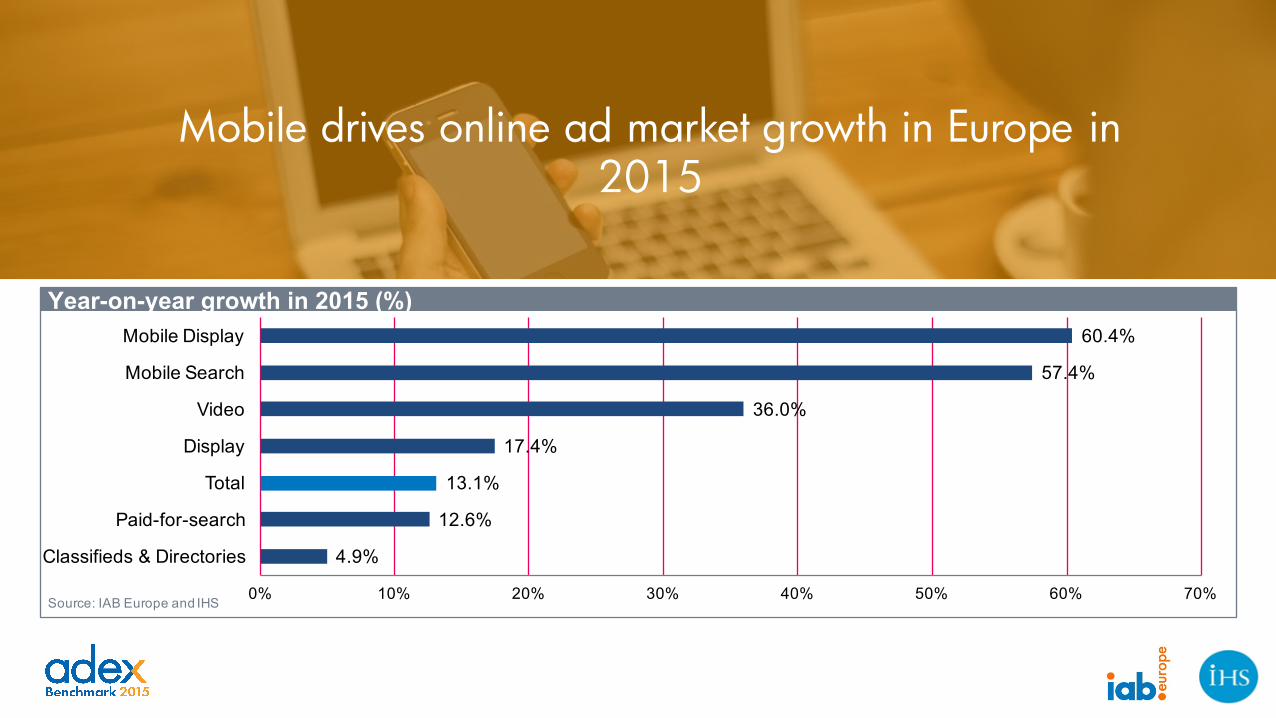
Mobile drives online ad market growth in Europe in 2015
4.9%
12.6%
13.1%
17.4%
36.0%
57.4%
60.4%
0% 10% 20% 30% 40% 50% 60% 70%
Classifieds & Directories
Paid-for-search
Total
Display
Video
Mobile Search
Mobile Display
Year-on-year growth in 2015 (%)
Source: IAB Europe and IHS
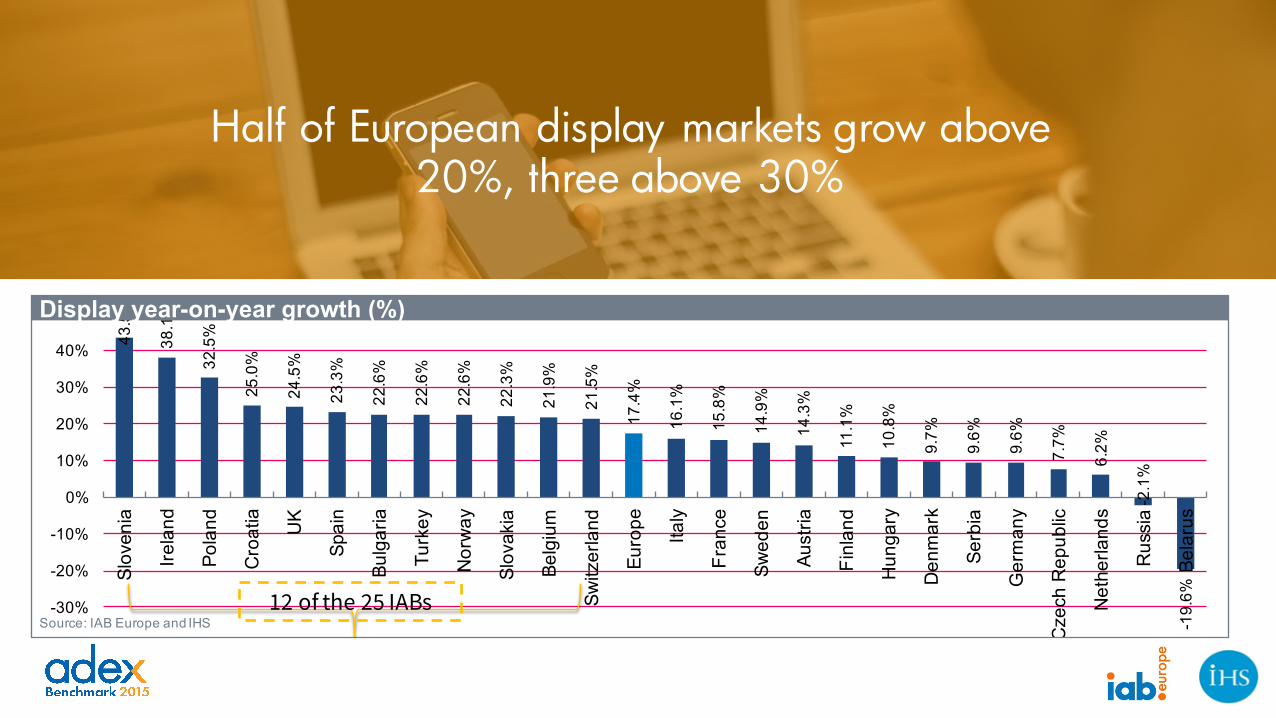
Half of European display markets grow above 20%, three above 30%
43.5
%
38.1
%
32.5
%
25.0
%
24.5
%
23.3
%
22.6
%
22.6
%
22.6
%
22.3
%
21.9
%
21.5
%
17.4
%
16.1
%
15.8
%
14.9
%
14.3
%
11.1
%
10.8
%
9.7%
9.6%
9.6%
7.7%
6.2%
-2.1
%
-19.
6%
-30%
-20%
-10%
0%
10%
20%
30%
40%
50%
Slov
enia
Irela
nd
Pola
nd
Cro
atia UK
Spai
n
Bulg
aria
Turk
ey
Nor
way
Slov
akia
Belg
ium
Switz
erla
nd
Euro
pe
Italy
Fran
ce
Swed
en
Aust
ria
Finl
and
Hun
gary
Den
mar
k
Serb
ia
Ger
man
y
Cze
ch R
epub
lic
Net
herla
nds
Rus
sia
Bela
rus
Display year-on-year growth (%)
Source: IAB Europe and IHS12 of the 25 IABs
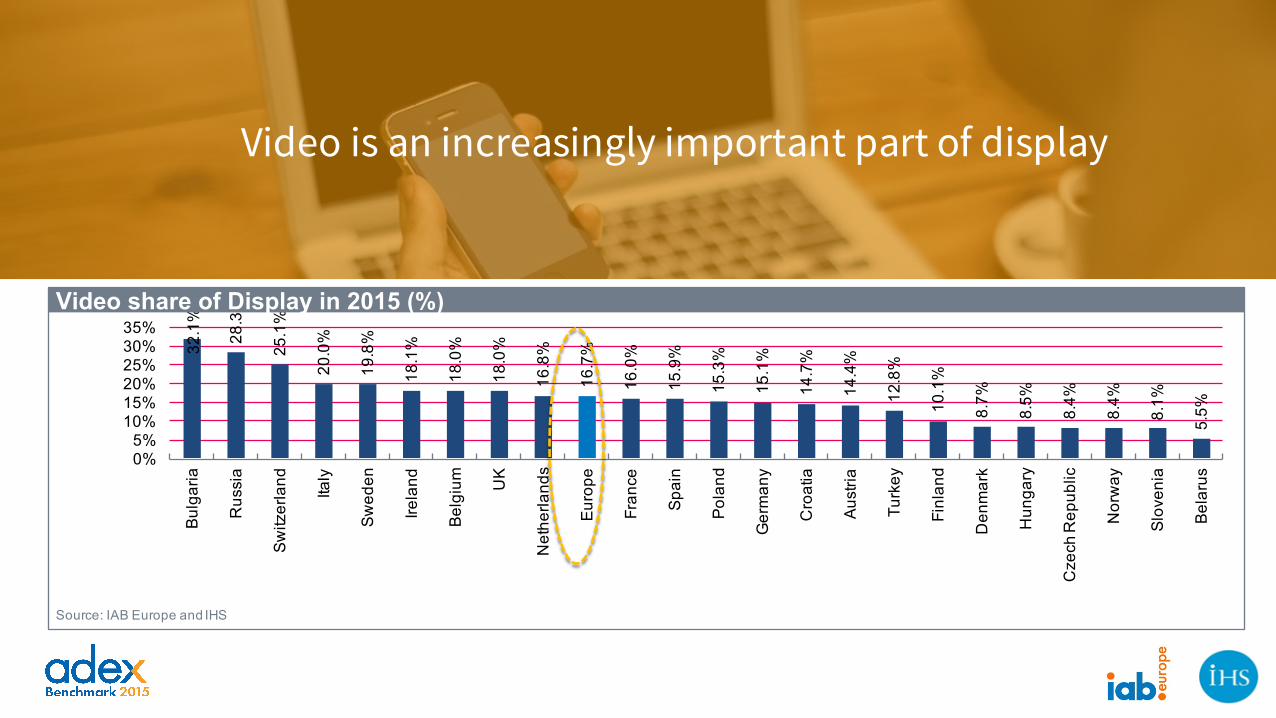
Video is an increasingly important part of display32
.1%
28.3
%
25.1
%
20.0
%
19.8
%
18.1
%
18.0
%
18.0
%
16.8
%
16.7
%
16.0
%
15.9
%
15.3
%
15.1
%
14.7
%
14.4
%
12.8
%
10.1
%
8.7%
8.5%
8.4%
8.4%
8.1%
5.5%
0%5%
10%15%20%25%30%35%
Bul
garia
Rus
sia
Sw
itzer
land
Italy
Sw
eden
Irela
nd
Bel
gium U
K
Net
herla
nds
Eur
ope
Fran
ce
Spa
in
Pol
and
Ger
man
y
Cro
atia
Aus
tria
Turk
ey
Finl
and
Den
mar
k
Hun
gary
Cze
ch R
epub
lic
Nor
way
Slo
veni
a
Bel
arus
Video share of Display in 2015 (%)
Source: IAB Europe and IHS
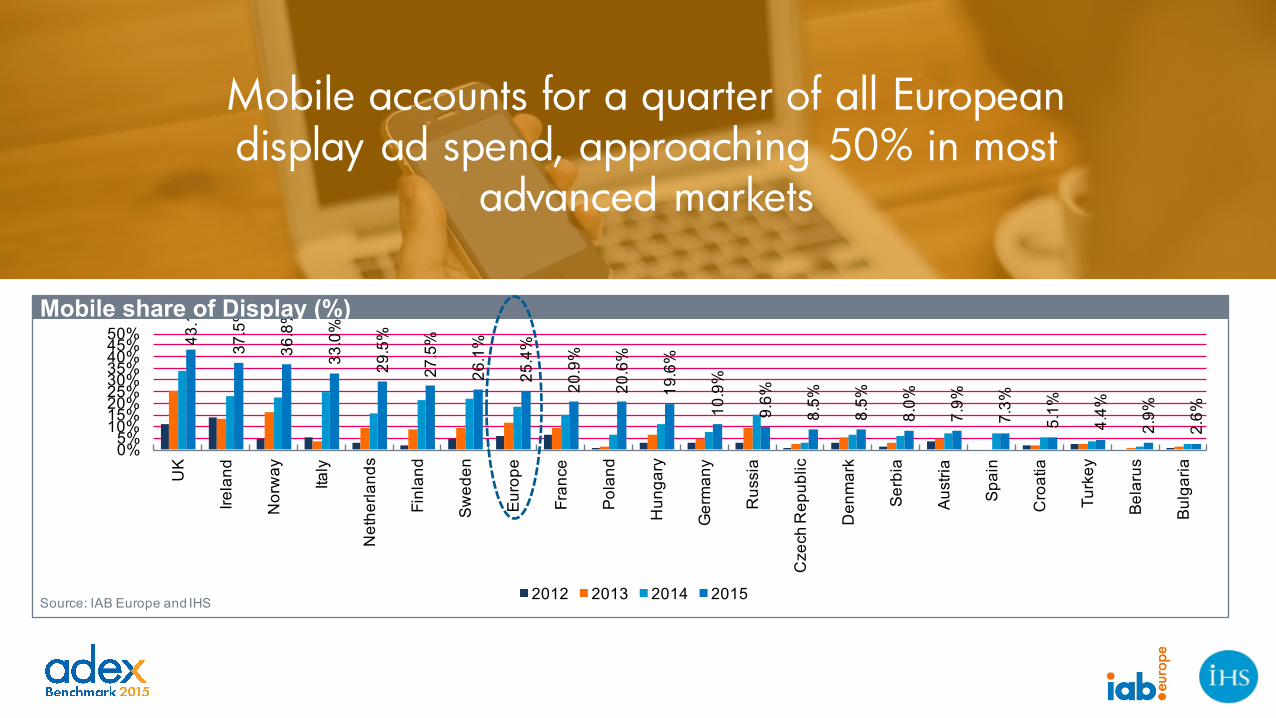
Mobile accounts for a quarter of all European display ad spend, approaching 50% in most
advanced markets43
.1%
37.5
%
36.8
%
33.0
%
29.5
%
27.5
%
26.1
%
25.4
%
20.9
%
20.6
%
19.6
%
10.9
%
9.6%
8.5%
8.5%
8.0%
7.9%
7.3%
5.1%
4.4%
2.9%
2.6%
0%5%
10%15%20%25%30%35%40%45%50%
UK
Irela
nd
Nor
way
Italy
Net
herla
nds
Finl
and
Sw
eden
Eur
ope
Fran
ce
Pol
and
Hun
gary
Ger
man
y
Rus
sia
Cze
ch R
epub
lic
Den
mar
k
Ser
bia
Aus
tria
Spa
in
Cro
atia
Turk
ey
Bel
arus
Bul
garia
2012 2013 2014 2015
Mobile share of Display (%)
Source: IAB Europe and IHS
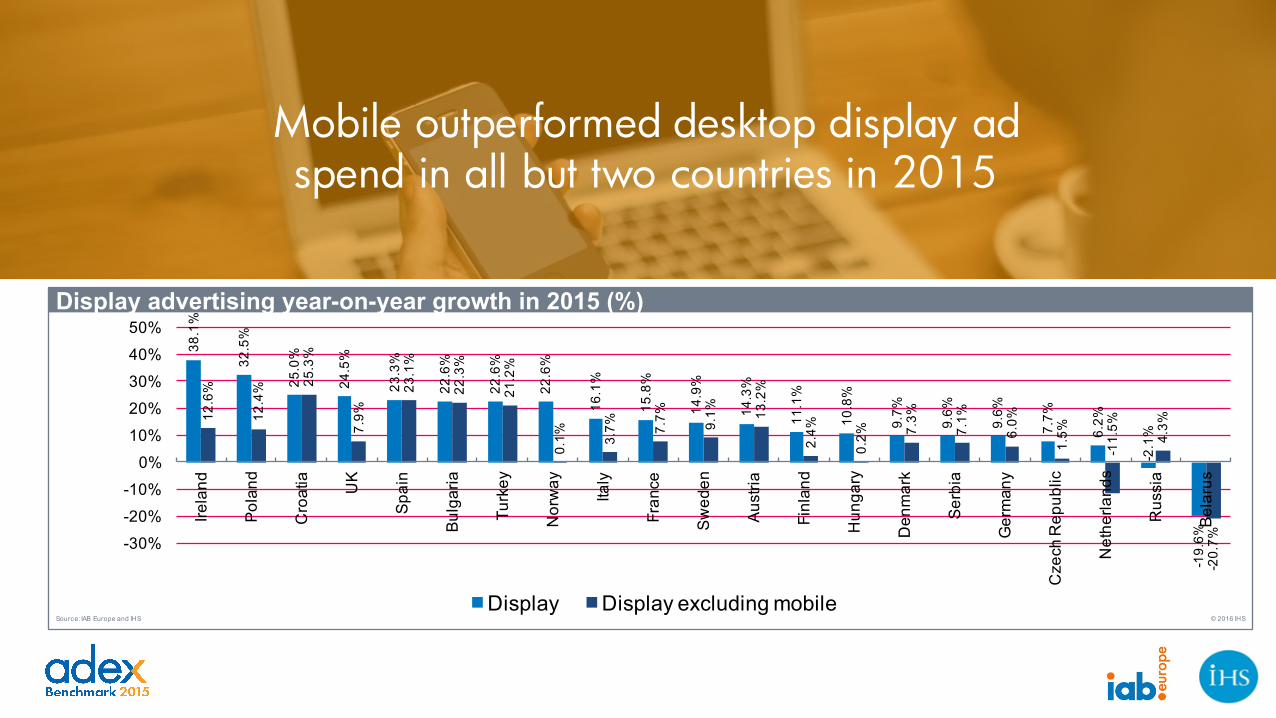
Mobile outperformed desktop display ad spend in all but two countries in 2015
38.1
%
32.5
%
25.0
%
24.5
%
23.3
%
22.6
%
22.6
%
22.6
%
16.1
%
15.8
%
14.9
%
14.3
%
11.1
%
10.8
%
9.7%
9.6%
9.6%
7.7%
6.2%
-2.1
%
-19.
6%
12.6
%
12.4
% 25.3
%
7.9%
23.1
%
22.3
%
21.2
%
0.1% 3.
7% 7.7% 9.1% 13
.2%
2.4%
0.2% 7.
3%
7.1%
6.0%
1.5%
-11.
5%
4.3%
-20.
7%-30%
-20%
-10%
0%
10%
20%
30%
40%
50%
Irela
nd
Pol
and
Cro
atia UK
Spa
in
Bul
garia
Turk
ey
Nor
way
Italy
Fran
ce
Sw
eden
Aus
tria
Finl
and
Hun
gary
Den
mar
k
Ser
bia
Ger
man
y
Cze
ch R
epub
lic
Net
herla
nds
Rus
sia
Bel
arus
Display Display excluding mobile
Display advertising year-on-year growth in 2015 (%)
Source: IAB Europe and IHS © 2016 IHS
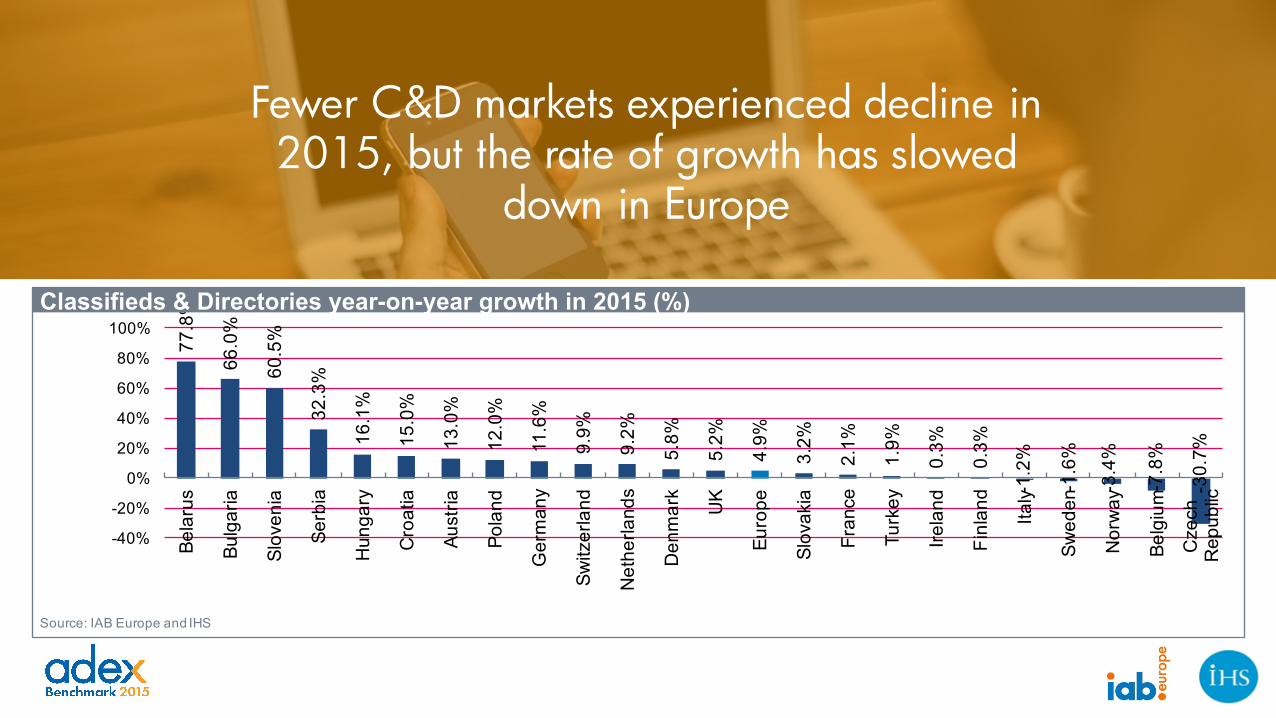
Fewer C&D markets experienced decline in 2015, but the rate of growth has slowed
down in Europe77
.8%
66.0
%
60.5
%
32.3
%
16.1
%
15.0
%
13.0
%
12.0
%
11.6
%
9.9%
9.2%
5.8%
5.2%
4.9%
3.2%
2.1%
1.9%
0.3%
0.3%
-1.2
%
-1.6
%
-3.4
%
-7.8
%
-30.
7%
-40%
-20%
0%
20%
40%
60%
80%
100%
Bela
rus
Bulg
aria
Slov
enia
Serb
ia
Hun
gary
Cro
atia
Aust
ria
Pola
nd
Ger
man
y
Switz
erla
nd
Net
herla
nds
Den
mar
k
UK
Euro
pe
Slov
akia
Fran
ce
Turk
ey
Irela
nd
Finl
and
Italy
Swed
en
Nor
way
Belg
ium
Cze
ch
Rep
ublic
Classifieds & Directories year-on-year growth in 2015 (%)
Source: IAB Europe and IHS
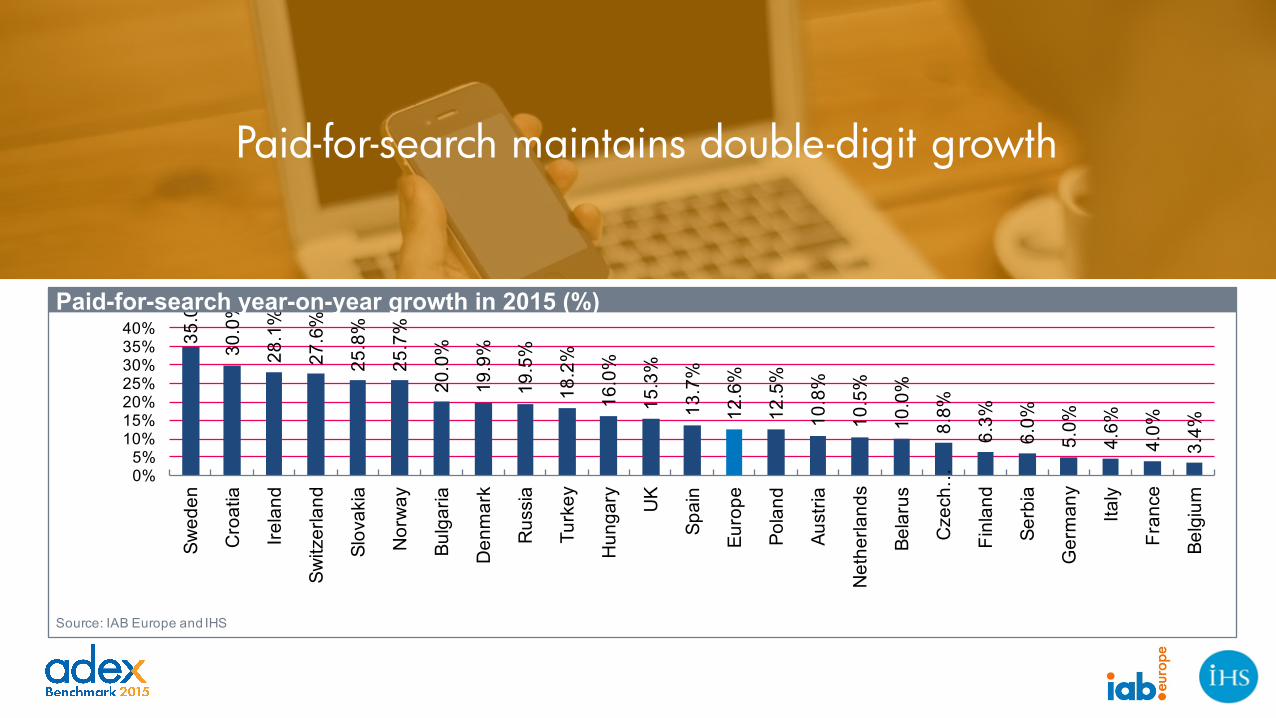
Paid-for-search maintains double-digit growth35
.0%
30.0
%
28.1
%
27.6
%
25.8
%
25.7
%
20.0
%
19.9
%
19.5
%
18.2
%
16.0
%
15.3
%
13.7
%
12.6
%
12.5
%
10.8
%
10.5
%
10.0
%
8.8%
6.3%
6.0%
5.0%
4.6%
4.0%
3.4%
0%5%
10%15%20%25%30%35%40%
Swed
en
Cro
atia
Irela
nd
Switz
erla
nd
Slov
akia
Nor
way
Bulg
aria
Den
mar
k
Rus
sia
Turk
ey
Hun
gary UK
Spai
n
Euro
pe
Pola
nd
Aust
ria
Net
herla
nds
Bela
rus
Cze
ch …
Finl
and
Serb
ia
Ger
man
y
Italy
Fran
ce
Belg
ium
Paid-for-search year-on-year growth in 2015 (%)
Source: IAB Europe and IHS
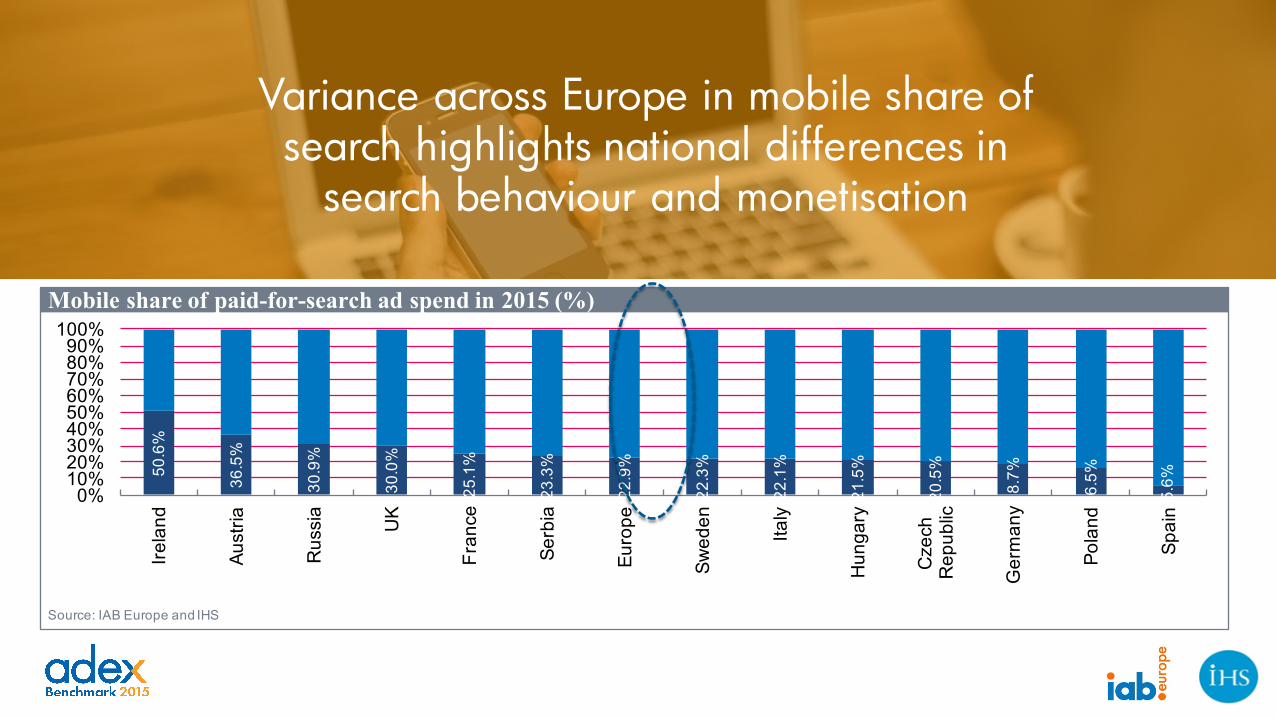
Variance across Europe in mobile share of search highlights national differences in
search behaviour and monetisation50
.6%
36.5
%
30.9
%
30.0
%
25.1
%
23.3
%
22.9
%
22.3
%
22.1
%
21.5
%
20.5
%
18.7
%
16.5
%
5.6%
0%10%20%30%40%50%60%70%80%90%
100%
Irela
nd
Aust
ria
Rus
sia
UK
Fran
ce
Serb
ia
Euro
pe
Swed
en
Italy
Hun
gary
Cze
ch
Rep
ublic
Ger
man
y
Pola
nd
Spai
n
Mobile share of paid-for-search ad spend in 2015 (%)
Source: IAB Europe and IHS
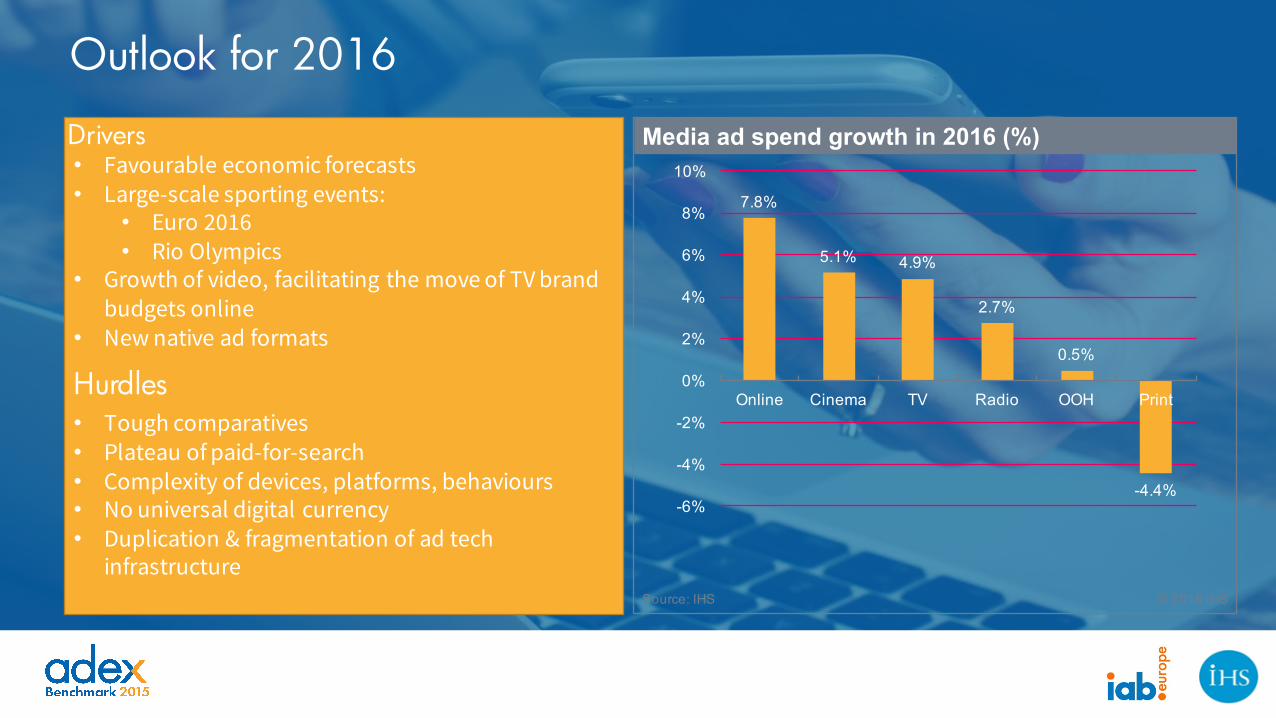
Outlook for 2016
• Favourable economic forecasts• Large-scale sporting events:
• Euro 2016• Rio Olympics
• Growth of video, facilitating the move of TV brand budgets online
• New native ad formats
• Tough comparatives • Plateau of paid-for-search• Complexity of devices, platforms, behaviours• No universal digital currency• Duplication & fragmentation of ad tech
infrastructure
Drivers
Hurdles
7.8%
5.1% 4.9%
2.7%
0.5%
-4.4%-6%
-4%
-2%
0%
2%
4%
6%
8%
10%
Online Cinema TV Radio OOH Print
Media ad spend growth in 2016 (%)
Source: IHS © 2016 IHS
Outlook for 2016
The data and charts shown in this report cannot be used without the
expressed permission of IAB Europe and IHS

Contact:
Daniel Knapp, [email protected], @_dknappEleni Marouli, [email protected], @EMarouli_Ad
Connect with us:
@IABEurope IAB Europe
www.iabeurope.eu