Addressing Student Loan Repayment Burdens · 2014-02-28 · Addressing Student Loan Repayment...
52
Addressing Student Loan Repayment Burdens WHITE PAPER Strengths and Weaknesses of the Current System February 2006
Transcript of Addressing Student Loan Repayment Burdens · 2014-02-28 · Addressing Student Loan Repayment...

Addressing Student Loan Repayment Burdens
W H I T E P A P E R
Strengths and Weaknesses of the Current System
February 2006

For Americans of all socioeconomic backgrounds, borrowing has become a primary way to pay for higher education. The Project on Student Debt works to increase public understanding of this trend and its implications for our families, economy, and society. Recognizing that loans play a critical role in making college possible, the Project's goal is to identify cost-effective solutions that expand educational opportunity, protect family financial security, and advance economic competitiveness. The Project on Student Debt is supported by the Partnership to Reduce the Burden of Student Debt, an initiative of The Pew Charitable Trusts. The Project’s other funders include the William and Flora Hewlett Foundation, the Rosalinde and Arthur Gilbert Foundation, the Open Society Institute, the Stern Family Fund, and the Level Playing Field Institute. The views expressed in this white paper do not necessarily reflect the views of the funders. The Project on Student Debt is a project of The Institute for College Access and Success (TICAS).
The White Paper
This paper was researched and written by the staff of the Project on Student Debt: Robert Shireman, Lauren J. Asher, Ajita Talwalker, Shu-Ahn Li, Edie Irons, and Rowan Cota. The authors are indebted to a number of experts who reviewed drafts of the paper and provided suggestions.

Table of Contents
1 Executive Summary
4 Introduction
6 Section I: The Components of Student Loan Repayment Policy
12 Section II: Current U.S. Policies and How They Could Be Improved
23 Section III: Issues for Consideration
Appendices
25 A: The Tyranny of Averages: Education and Earnings
32 B: Repayment Burden
46 C: Resources by Topic

WHITE PAPER: STUDENT LOAN REPAYMENT 1
WHITE PAPER
Addressing Student Loan Repayment Burdens FEBRUARY 2006
Executive Summary
At a November 2005 symposium jointly sponsored by the American Enterprise Institute and the Project on Student Debt, leading researchers and policy experts explored the implications of rising student debt and presented several innovative proposals. In response to interest generated by the symposium, the Project on Student Debt conducted a review of U.S. student loan repayment policies and analyzed the extent to which borrowers are subjected to excessive repayment burdens. The review and analysis found that existing safeguards are well intentioned but flawed, leaving many borrowers without adequate protection. This white paper describes the current system, assesses its strengths and weaknesses, and identifies practical ways to achieve a more rational and effective balance of borrower obligations and protections.
Context: rising debt, higher interest rates. More students are borrowing larger amounts to pay for college than ever before. About two-thirds of recent graduates carry student loans, and their average debt has increased by more than 50 percent over the past decade after accounting for inflation. Even if tuition levels rise more slowly than they have in recent years, borrowing will continue to expand. In addition, interest rates are now rising, adding significantly to the size and duration of borrower payments. In 2004-05, recent college graduates could consolidate their federal loans at low, fixed rates, which served as a safety net for those struggling to make their payments. That low-interest option is gone, and the new interest rate scheduled for July 2006 will result in payments that are 20 percent higher than the 2004-05 rates, more than doubling the total interest paid over the life of the loan.
Effective student loan policies. In general, the economic returns to a college education have proved to be high. But for individual college graduates, the financial benefits are both variable and unpredictable. One important role of government is to provide some protection against those risks so that qualified citizens, regardless of wealth, can and will advance their education. Toward that end, well-designed student loan repayment policies should aim to ensure that borrowers with low post-college earnings do not face unmanageable payment expectations, and that those who are responsible and make manageable payments are not burdened with indefinite repayment obligations.
Such policies would help limit the risks of student loan debt for teachers, public health workers, members of the clergy, and others in lower paying but important jobs that
WHITE PAPER: STUDENT LOAN REPAYMENT 2
require higher education, as well as borrowers faced with family medical crises and other unanticipated circumstances that contribute to unmanageable repayment burdens. However, the protections should not be so generous that they give borrowers an incentive to work less, earn less, or avoid repaying their loans.
U.S. policies fall short. The student loan system in the United States includes a number of provisions that aim to ease repayment burdens. However, the protections are inconsistent and sometimes irrational, highly complex, and too narrow in scope when compared to legitimate needs. The analysis finds that:
• Many borrowers who clearly should qualify for assistance do not.
• Some provisions counter-productively reward borrowers for working less or earning less, or for borrowing more.
• Some programs fail to consider family size in assessing the amount the borrower can afford to repay.
• There is insufficient assistance for borrowers who have low incomes relative to their debt over a long period of time.
• Even when formulas for repayment assistance are designed appropriately, borrowers often are not informed that the assistance is available.
Policy options. Significantly improving loan repayment policies in the U.S. does not require a radical overhaul of our student loan system. The building blocks are there, but need to be assembled in ways that makes sense and that reach out to those who are eligible. Some improvements could be implemented through regulatory changes; others would require congressional action. Some of the options identified in this white paper include:
Expanded “economic hardship” provisions. Some federal loans offer interest subsidies for periods of “economic hardship.” However, the current formulas and processes fail to reach borrowers who should qualify, and lead to situations in which borrowers in similar situations receive vastly different treatment. These provisions could be improved by establishing a more uniform definition of hardship, and phasing out the benefits as borrower incomes rise. Other potential improvements include adjusting the benefits for family size, eliminating the three-year limit, and making other loans eligible for interest assistance. In addition, information about the assistance needs to be more readily available and the process for applying less burdensome. Tax credit for student loan interest. This proposal would provide taxpayers with incomes below a certain threshold with a refundable credit for their actual interest payments on student loans. The income threshold would take family size into account. Borrowers with incomes above the threshold would receive a partial
WHITE PAPER: STUDENT LOAN REPAYMENT 3
credit. A tax credit gives borrowers a financial incentive to make payments on their loans. By using a sliding scale linked to repayment burdens, borrowers would also have a financial incentive to earn more. The credit could replace the current interest deduction, under which lenders already provide taxpayers and the IRS with information on student loan interest paid. Providing relief through a tax provision could also be more effective than other programs in reaching qualified borrowers and would be simpler to administer, since lenders do not need to become involved in confirming borrower’s incomes. Simplify income-based repayment. Some borrowers with federal loans have a repayment option called “income-contingent repayment,” or ICR. It is the only current plan that allows for eventual forgiveness of remaining loan balances, after 25 years of income-based payments. This program could be improved by making it available to all borrowers, reducing the maximum repayment period, and ensuring that amounts forgiven are not treated as taxable income.
The purpose of this white paper is to prompt discussion among analysts, higher education and industry leaders, and policy makers about ways to improve student loan repayment policies. The Project on Student Debt welcomes feedback and commentary on these and other policy improvements that could provide more consistent and meaningful protections for borrowers.
WHITE PAPER: STUDENT LOAN REPAYMENT 4
Introduction
In general, the economic returns to a college education have proved to be high. But for individual college graduates, the financial benefits are both variable and unpredictable. One important role of government is to provide some protection against those risks so that qualified citizens, regardless of wealth, can and will advance their education. Toward that end, well-designed student loan repayment policies should aim to ensure that borrowers with low post-college earnings do not face unmanageable payment expectations, and that those who are responsible and make manageable payments are not burdened with indefinite repayment obligations.
Such policies would help limit the risks of student loan debt for teachers, public health workers, members of the clergy, and others in lower paying but important jobs that require higher education, as well as borrowers faced with family medical crises and other unanticipated circumstances that contribute to unmanageable repayment burdens. However, the protections should not be so generous that they give borrowers an incentive to work less, earn less, or avoid repaying their loans.
The purpose of this white paper is to promote discussion among analysts, higher education and loan industry leaders, and policy makers from across the ideological spectrum about how to achieve a more rational and effective balance of borrower obligations and protections within our student loan system. This paper identifies some possible changes to current U.S. policies as a way of prompting constructive critiques and the development of additional ideas for practical reforms.
Attention to loan repayment burdens is important at this juncture for three reasons. First, more students are borrowing more for college than ever before. About two-thirds of baccalaureate recipients now graduate with debt, and their average debt has increased by more than 50 percent over the past decade after accounting for inflation. Even if tuition levels rise more slowly than they have in recent years, borrowing will continue to expand.
Second, interest rates are rising, adding significantly to borrower payment levels. The federal consolidation loans available in 2004-05, at rates below 3 percent for some, provided a welcome reprieve for many borrowers who were struggling with their payments (as well as a windfall for many who were not struggling). Those low, fixed rates are no longer available. A 6.8 percent interest rate on federal student loans, scheduled to take effect this coming July, will result in payments on a 10-year loan that are 20 percent higher than at last year’s low interest rate, more than doubling the total interest paid. In addition, some students are bumping up against aggregate loan limits in the federal loan programs. This causes them to turn to private loans, which generally carry much higher interest rates.
Finally, with these two trends come increasing concerns about the ability of students from low-income families to afford college. While grant aid is a more effective way of providing access to higher education, most low-income students find that they do
WHITE PAPER: STUDENT LOAN REPAYMENT 5
need to borrow to get their degrees (88 percent of graduating Pell grant recipients carry student loan debt). In order to maintain and increase low-income enrollment in higher education, potential students – and those who advise them – need to have some confidence that borrowing for college will not drive them or their families to financial ruin.
The United States does provide relief to some borrowers in some circumstances. However, these policies are inconsistent, inadequate, and often difficult to understand. At the same time, this paper finds that significant improvements in consistency and effectiveness can be achieved without a radical overhaul of the current system. Building on the foundation of current borrower protections, options discussed include:
• Expanding upon current “economic hardship” protections for Stafford borrowers so they cover more borrowers and provide a sliding scale of interest subsidies based on need.
• Converting the current tax deduction for student loan interest into a refundable tax credit that provides relief to borrowers with high repayment burdens.
• Making income-contingent repayment more accessible to all borrowers, and adjusting the terms so they are simpler and more helpful to those who have high repayment burdens over long periods.
Section I of this paper examines the major components of student loan repayment policy: protected income, payment amount, subsidy, and scope. Examples from the United States and other countries illustrate how each of these components can affect repayment burdens.
Section II focuses on current U.S. repayment programs and policies, their strengths and weaknesses, and how they could be improved. These programs include: economic hardship; income contingent repayment; student loan interest tax deduction; extended, graduated and income sensitive repayment; loan forgiveness; and bankruptcy protections.
Section III offers questions that can guide further consideration of reforms. Appendices provide additional background information:
Appendix A provides data on salaries of Americans with different levels of educational backgrounds, ethnicity, gender, and occupations. These data provide the reader with a sense of the likelihood that borrowers could end up with particular repayment burdens.
Appendix B offers tables that show repayment burdens under the various current policies. They are compared against the benchmarks for manageable loan repayment developed by Sandy Baum and Saul Schwartz in a recent paper for the Project on Student Debt and the College Board.
Appendix C provides a listing of sources and resources on the topics in this paper.

WHITE PAPER: STUDENT LOAN REPAYMENT 6
I. The Components of Student Loan Repayment Policy
There are four major components of any student loan repayment policy. Decisions about each one, and how they interact, determine the extent to which a student loan system provides meaningful relief to borrowers with high repayment burdens. They are:
A. The existence of some amount of protected income (an acknowledgement that some borrowers are too poor to make a payment, at least temporarily).
B. The method for determining the monthly or annual payment amount.
C. The availability of a subsidy to borrowers whose payments are not manageable (generally a limitation on the accrual of interest).
D. The scope of the benefits in terms of types of loans and types of borrowers who are eligible.
Below we describe each of these components in greater detail, providing examples of how they do or don’t apply in the current U.S. system. In some cases, we provide comparisons to systems in other countries.
A. Protected income.
Student loan policies generally include provisions that acknowledge that some borrowers simply do not have the resources to make anything more than token payments, at least temporarily. The “protected” amount of income may be set quite low, at a level of severe hardship such as poverty, unemployment, or disabling illness, or it can be set at a more moderate level that allows for basic living expenses. The United Kingdom and Australia promise borrowers that they will not have to start making payments on their student loans until they are earning a decent living, which they have set at a level that is currently about $26,000 in U.S. terms.
In the U.S., there is no clear policy. An “economic hardship” deferment is aimed at staving off poverty. However, it has inconsistent income eligibility rules (see table below), does not take children into account, and is available for no more than three years. An income-contingent repayment (ICR) option uses a poverty measure that is adjusted for family size. Interestingly, the U.S. policy that allows borrowers to keep the largest amount of their income is post-default wage garnishment.

WHITE PAPER: STUDENT LOAN REPAYMENT 7
How much U.S. borrowers can earn before student loan payments are required
Situation Protected Income
Full-time worker with $15,000 in loans, earning $12,000/year, applying for “economic hardship” relief.
None.
Same as full-time worker above, but working part-time. Fully protected (up to $14,055).
Full-time worker with $79,000 in loans, earning $37,500/year, applying for “economic hardship” relief.
None.
Same as full-time worker above, but with $80,000 in loans. Fully protected.
Single person using the income-contingent repayment option.
$9,750 (token $5 monthly payments required)
Single person whose wages are being garnished after defaulting.
Up to $32,328 in documented living expenses.
Family of four using the income-contingent repayment option.
$19,350 (token $5 monthly payments required)
Family of four whose wages are being garnished after defaulting.
Up to $47,940 in documented living expenses.
Family of four on two minimum-wage incomes, seeking economic hardship relief for a fourth year.
None.
Defaulted borrowers are allowed to document and maintain living expenses up to levels that are adjusted for geographic area, family size, and household income. (These are the same criteria that are used for collection of unpaid taxes.) That does not mean that default is a good option for the borrowers. While their payments may be lower, they are charged penalties and interest that will be added to their amount due and extend their repayment. In addition, their credit is ruined, eligibility for further college aid is suspended, and professional licenses can be denied. But the guidelines give an indication that the levels of income protected under ICR and economic hardship may be too low.
In their paper, “How Much Debt is Too Much?” Sandy Baum and Saul Schwartz suggest that U.S. policy should protect a level of income equal to half of median earnings.* Currently that would be about $18,800 (the median income for all U.S. workers is just under $39,000). Others recommend that the amount of protected income should reflect family size. * The paper, commissioned by the College Board and the Project on Student Debt, is available at www.projectonstudentdebt.org.

WHITE PAPER: STUDENT LOAN REPAYMENT 8
B. Payment amount
Associated with every loan is some method for determining the amount a borrower is expected to pay during a particular month or year. The common approach in the United States is to use a flat monthly amount that fully repays the loan, with interest, over a particular number of years. This is often referred to as a mortgage-style loan, or a standard amortization schedule. In contrast to that approach, there are also income-based systems, in which the payment amount is set at a percentage of the borrower’s income after leaving college (or a percentage of income above a protected amount). With that method, rather than paying for a fixed number of years, those with high incomes finish repaying their loans more quickly than those with lower incomes. Other systems for setting payment amounts, such as the U.S. income-contingent repayment (ICR) option, combine or adjust these two basic mortgage-style and income-based approaches.
The table below shows payments as a percentage of income under various repayment plans. Under the U.S. system, it shows fixed payments over 10 and 20 years and under the ICR plan (all assuming $20,000 in debt at 6.8 percent interest for a single borrower). In three countries where payments are based on a set percentage of income above a protected amount, it shows that percentage.
Repayment Expectations as a Percentage of Income U.S. (Assumes $20K Debt) Other Countries' ICR Systems Income (US$)
10-Year Plan
20-Year Plan ICR
United Kingdom Australia New Zealand
$10,000 28% 19% 0.9% 0.0% 0.0% 0.0% $20,000 14% 9% 8.8% 0.0% 0.0% 4.2% $30,000 9% 6% 7.3% 1.1% 4.5% 6.2% $40,000 7% 5% 6.3% 3.1% 6.0% 7.1% $50,000 6% 4% 5.3% 4.2% 8.0% 7.7% $60,000 5% 3% 4.8% 5.0% 8.0% 8.1% $70,000 4% 3% 4.4% 5.6% 8.0% 8.4% $80,000 4% 2% 4.1% 6.0% 8.0% 8.6%
Compared to the other countries we demand much higher payments of borrowers who are below median income, even in our ICR system. Above incomes of $40,000 or so, our monthly or annual payment expectations are similar or lower for a debt of $20,000. This is not to imply that the other countries’ systems could be replicated in the United States. Their student loan programs were launched or restructured in the context of implementing national rules for new tuition charges at public universities. They do not generally have the diversity of types of colleges found in the United States, and their levels of borrowing are not the same.
WHITE PAPER: STUDENT LOAN REPAYMENT 9
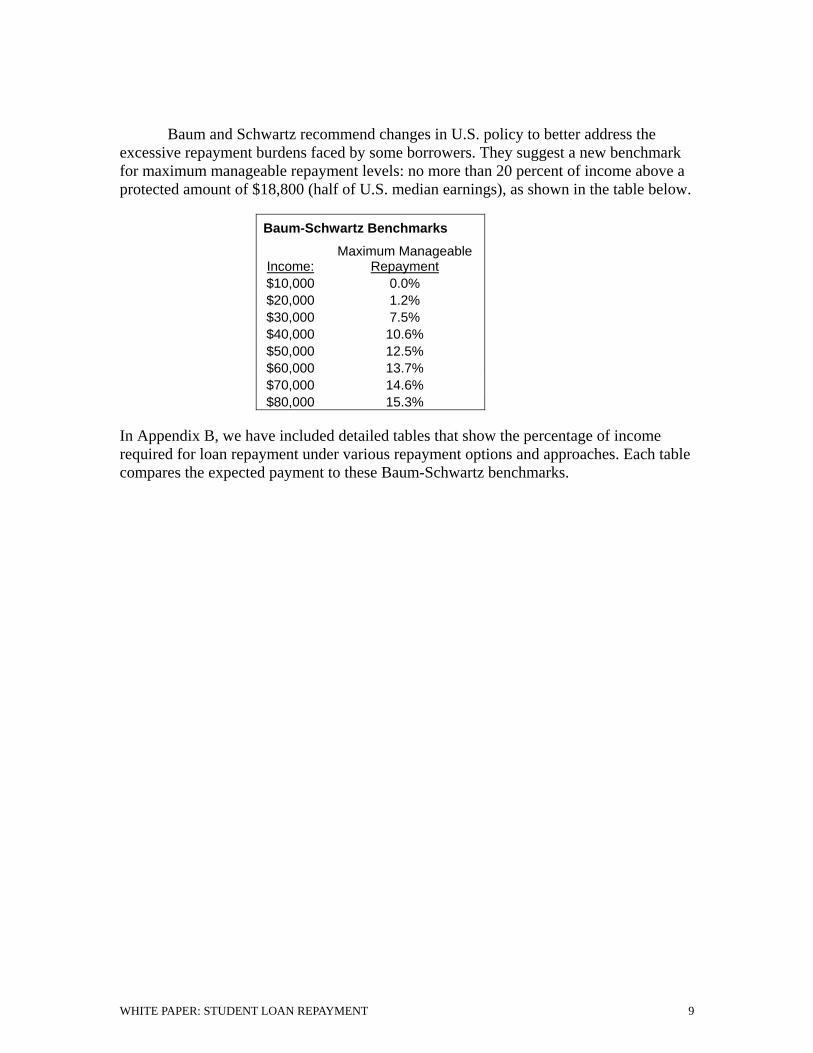
Baum and Schwartz recommend changes in U.S. policy to better address the excessive repayment burdens faced by some borrowers. They suggest a new benchmark for maximum manageable repayment levels: no more than 20 percent of income above a protected amount of $18,800 (half of U.S. median earnings), as shown in the table below.
Baum-Schwartz Benchmarks
Income: Maximum Manageable
Repayment $10,000 0.0% $20,000 1.2% $30,000 7.5% $40,000 10.6% $50,000 12.5% $60,000 13.7% $70,000 14.6% $80,000 15.3%
In Appendix B, we have included detailed tables that show the percentage of income required for loan repayment under various repayment options and approaches. Each table compares the expected payment to these Baum-Schwartz benchmarks.

WHITE PAPER: STUDENT LOAN REPAYMENT 10
C. Subsidies
As shown above, student loan repayment policies can protect some base level of income and/or limit payments to some percentage of income. In addition, policies determine when and how much interest is charged while borrower payments are low or absent. Borrowers are generally not comfortable with the prospect of interest being added to interest, with the total debt growing rather than shrinking over time. It can easily double a debt over 10 years, depending on the interest rate.
The Effects of Compounding Interest
1
1.5
2
2.5
3
3.5
1 2 3 4 5 6 7 8 9 10 11 12 13 14 15 16
Years
Mul
tiple
of O
rigin
al P
rinci
pal
at 8.25%
at 6.8%
at 3.0%
Because of the specter of added interest costs in our student loan system, U.S. policy tends to focus on helping borrowers cover interest payments. Borrower costs during repayment are currently subsidized in four different ways:
• Federal backing of loans reduces the interest rates paid by borrowers in general. Fixed-rate loans and caps on variable-rate loans protect borrowers from potentially high interest rates in the future.
• The government pays the entire annual interest charge on some Stafford loans during economic hardship and other official deferment periods.
• A student loan interest tax deduction subsidizes interest payments for those who qualify.
• While interest accrues in the income-contingent repayment (ICR) program, any amount still owed after 25 years is forgiven. For the few who will ultimately qualify, the amounts forgiven will consist mostly or entirely of interest.
WHITE PAPER: STUDENT LOAN REPAYMENT 11
Some countries, including, Australia and the United Kingdom, have taken a somewhat different approach to interest charges. They adjust the principal amount upward by a percentage equal to the annual rate of inflation, so that in “real” terms the borrower pays back only the amount borrowed. While this policy still entails a government subsidy, it also has a benefit to the government: in the event of rising inflation, the government will not have to subsidize borrower interest rates that turn out, in hindsight, to be very low. (Australia also offers a substantial tuition discount to students who pay without borrowing. In effect, this is an up-front interest charge imposed on all borrowers).
D. Scope
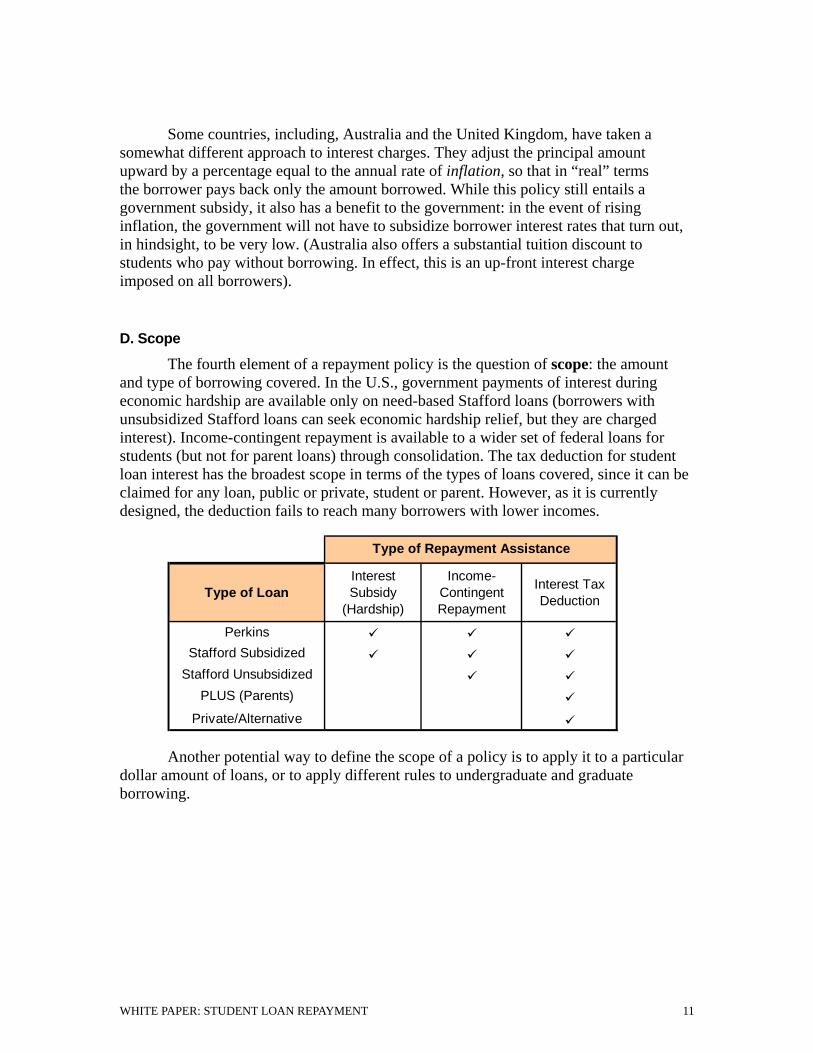
The fourth element of a repayment policy is the question of scope: the amount and type of borrowing covered. In the U.S., government payments of interest during economic hardship are available only on need-based Stafford loans (borrowers with unsubsidized Stafford loans can seek economic hardship relief, but they are charged interest). Income-contingent repayment is available to a wider set of federal loans for students (but not for parent loans) through consolidation. The tax deduction for student loan interest has the broadest scope in terms of the types of loans covered, since it can be claimed for any loan, public or private, student or parent. However, as it is currently designed, the deduction fails to reach many borrowers with lower incomes.
Type of LoanInterest Subsidy
(Hardship)
Income-Contingent Repayment
Interest Tax Deduction
PerkinsStafford Subsidized
Stafford UnsubsidizedPLUS (Parents)
Private/Alternative
Type of Repayment Assistance
Another potential way to define the scope of a policy is to apply it to a particular dollar amount of loans, or to apply different rules to undergraduate and graduate borrowing.
WHITE PAPER: STUDENT LOAN REPAYMENT 12
II. Current U.S. Policies and How They Could Be Improved
At first glance, the U.S. student loan system seems dramatically different from the systems that have been created more recently in Australia, New Zealand, and next year in England. In those systems, students are provided with government loans. When they leave school, they are not expected to make payments until they earn a certain level of income. And when they reach that income level, they pay a percentage of their income – from 4 to 10 percent – through the tax system until the loan is repaid. Interest charges are capped or limited to the inflation rate.
In contrast, we tend to think of the U.S. system as operating more like other traditional loans. Students borrow from a bank. While interest may be subsidized while they are in school, students are otherwise expected to pay interest. And they are generally expected to make equal loan payments over a fixed period (such as 10 years), whether or not they are making healthy incomes.
While that description of the U.S. system is basically accurate, it is incomplete.
Our system has elements similar to pay-as-you-earn approaches that have developed elsewhere. The U.S. does offer some relief, to some borrowers, in some circumstances related to their earnings. For example, interest subsidies for economic hardship are based in part on income. An income-contingent repayment option attempts to produce something like the income-based payments that are the norm in some other countries. Other repayment options give borrowers some ability to adjust the flat repayment schedule to address their specific income situations. And many borrowers are subsidized through a reduction in taxes when they claim a deduction for the interest they paid on their student loans.
The problem is that our policies are fractured, confusing, and sometimes contradictory. The next few sections describe how various loan repayment options and assistance work in the current U.S. system, and offer ideas for improvement.
A. Economic Hardship
Apart from some loan forgiveness programs (described below in section E), the most valuable repayment assistance offered by the federal government is hardship relief. Borrowers with need-based Stafford and Perkins loans can have their full interest charges paid by the government during up to three years of unemployment (without an income test) or income-related “economic hardship.” (Borrowers with unsubsidized federal loans can also defer their payments, but interest continues to accrue.)
To qualify for the deferral, borrowers must acquire and complete a deferment request form and submit documentation of their situation. They must reapply at least annually. Borrowers who are on food stamps or other similar public assistance programs are assumed to be eligible for hardship relief. That is the simplest part of the definition of

WHITE PAPER: STUDENT LOAN REPAYMENT 13
hardship. The other two tests for hardship seem logical at first glance, but are in fact somewhat convoluted. Economic hardship is defined as:
• the borrower is working full-time (at least 30 hours) and:
o has income below the poverty line, or o has loan payments that exceed 20 percent of his income, and his
income is not more than 2.2 times the poverty line plus the amount of the loan payments; or,
• the borrower is not working full-time, his loan payments place him below the poverty line, and his total income is not more than twice the poverty line.
Under economic hardship, interest relief is all-or-nothing: either the borrower
qualifies and the government pays all of the interest during the hardship period, or the borrower gets no relief. This creates the “cliff effect” shown below.
Hardship "Cliff Effect" Makes Some Borrowers Better Off If They Have Higher Debt or Lower Income
Full Interest Subsidy
No Interest Subsidy
0
10,000
20,000
30,000
40,000
50,000
0 10,000 20,000 30,000 40,000 50,000 60,000 70,000 80,000 90,000 100,000 110,000 120,000
Total Debt
Inco
me
The formulas (written by Congress), along with the all-or-nothing nature of the benefit, create situations where people with very similar incomes and debt have drastically different repayment obligations. These “cliffs” in the formula mean that some borrowers can lose thousands of dollars in benefits simply by earning one dollar more (placing them on the wrong side of the line in the above chart). In addition, borrowers with the same income, but with slightly different debt levels, can also find themselves treated as if one is far more burdened than the other. For example:
WHITE PAPER: STUDENT LOAN REPAYMENT 14
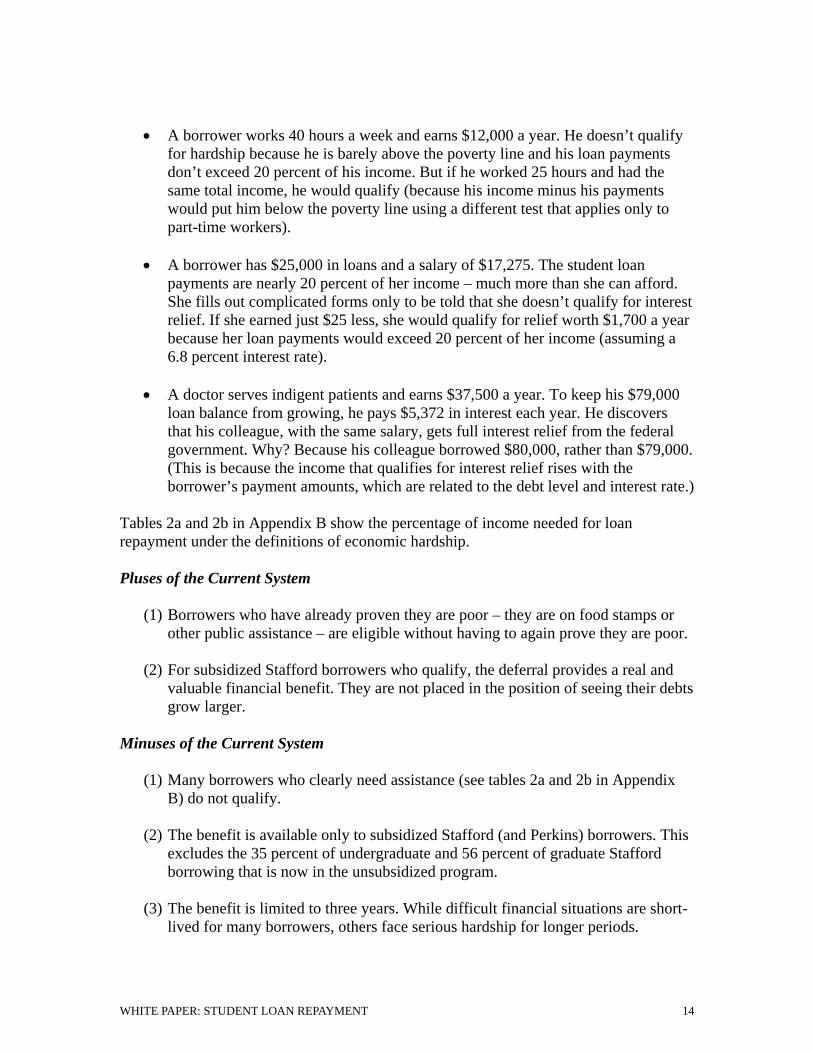
• A borrower works 40 hours a week and earns $12,000 a year. He doesn’t qualify for hardship because he is barely above the poverty line and his loan payments don’t exceed 20 percent of his income. But if he worked 25 hours and had the same total income, he would qualify (because his income minus his payments would put him below the poverty line using a different test that applies only to part-time workers).
• A borrower has $25,000 in loans and a salary of $17,275. The student loan
payments are nearly 20 percent of her income – much more than she can afford. She fills out complicated forms only to be told that she doesn’t qualify for interest relief. If she earned just $25 less, she would qualify for relief worth $1,700 a year because her loan payments would exceed 20 percent of her income (assuming a 6.8 percent interest rate).
• A doctor serves indigent patients and earns $37,500 a year. To keep his $79,000
loan balance from growing, he pays $5,372 in interest each year. He discovers that his colleague, with the same salary, gets full interest relief from the federal government. Why? Because his colleague borrowed $80,000, rather than $79,000. (This is because the income that qualifies for interest relief rises with the borrower’s payment amounts, which are related to the debt level and interest rate.)
Tables 2a and 2b in Appendix B show the percentage of income needed for loan repayment under the definitions of economic hardship. Pluses of the Current System
(1) Borrowers who have already proven they are poor – they are on food stamps or other public assistance – are eligible without having to again prove they are poor.
(2) For subsidized Stafford borrowers who qualify, the deferral provides a real and
valuable financial benefit. They are not placed in the position of seeing their debts grow larger.
Minuses of the Current System
(1) Many borrowers who clearly need assistance (see tables 2a and 2b in Appendix B) do not qualify.
(2) The benefit is available only to subsidized Stafford (and Perkins) borrowers. This
excludes the 35 percent of undergraduate and 56 percent of graduate Stafford borrowing that is now in the unsubsidized program.
(3) The benefit is limited to three years. While difficult financial situations are short-
lived for many borrowers, others face serious hardship for longer periods.
WHITE PAPER: STUDENT LOAN REPAYMENT 15
(4) Many borrowers who are eligible are not receiving the benefit because they do not realize they are eligible and do not know how to apply.
(5) The formula encourages qualified borrowers to make no payment at all, even
when they could afford partial payments.
(6) The formula does not take into consideration a borrower’s responsibilities in raising children.
Possible fixes
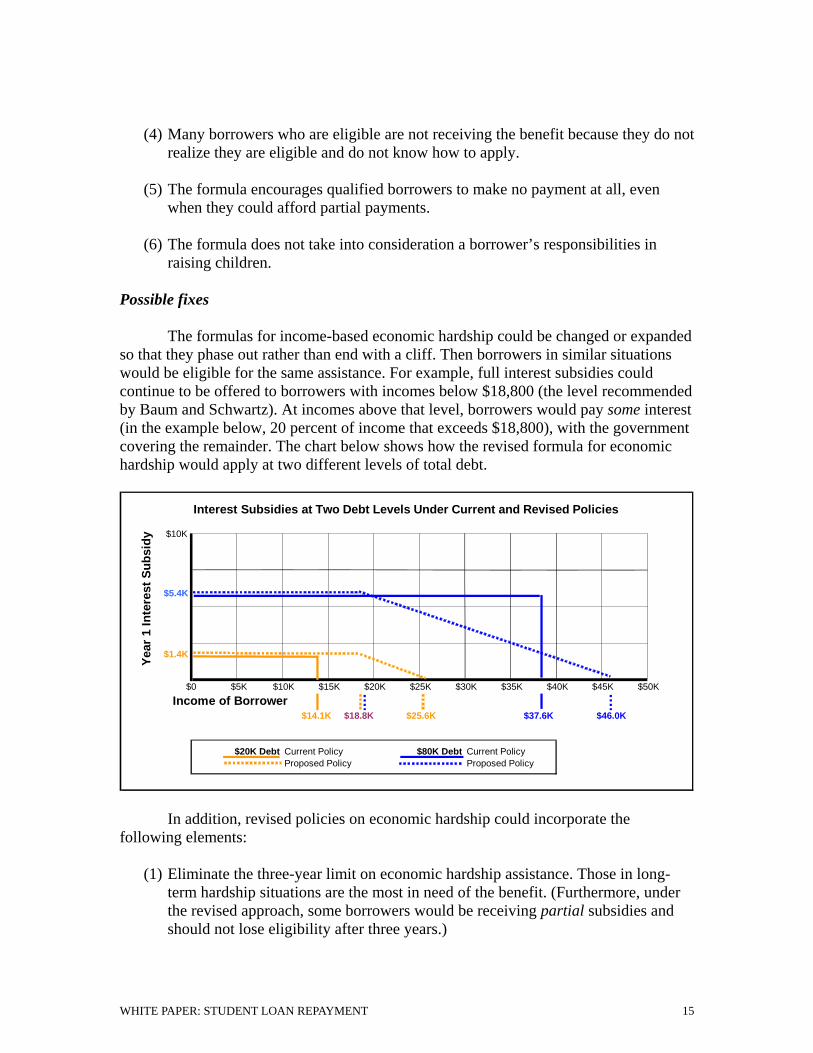
The formulas for income-based economic hardship could be changed or expanded so that they phase out rather than end with a cliff. Then borrowers in similar situations would be eligible for the same assistance. For example, full interest subsidies could continue to be offered to borrowers with incomes below $18,800 (the level recommended by Baum and Schwartz). At incomes above that level, borrowers would pay some interest (in the example below, 20 percent of income that exceeds $18,800), with the government covering the remainder. The chart below shows how the revised formula for economic hardship would apply at two different levels of total debt.
Interest Subsidies at Two Debt Levels Under Current and Revised Policies
$10K
$5.4K
$1.4K
$0 $5K $10K $15K $20K $25K $30K $35K $40K $45K $50KIncome of Borrower
$14.1K $18.8K $25.6K $37.6K $46.0K
$20K Debt Current Policy $80K Debt Current PolicyProposed Policy Proposed Policy
Ye
ar 1
Inte
rest
Sub
sidy
In addition, revised policies on economic hardship could incorporate the
following elements:
(1) Eliminate the three-year limit on economic hardship assistance. Those in long-term hardship situations are the most in need of the benefit. (Furthermore, under the revised approach, some borrowers would be receiving partial subsidies and should not lose eligibility after three years.)
WHITE PAPER: STUDENT LOAN REPAYMENT 16
(2) Make interest subsidies available to borrowers with “unsubsidized” loans. To reduce the costs of this expansion, the subsidy could be provided only after two or three years of hardship in which the borrower makes the interest payments or allows them to accrue.
(3) Encourage borrowers to make payments to reduce principal even when they
receive interest subsidies.
(4) Include some consideration of family size in determining economic hardship.
(5) Establish procedures for borrowers to apply online for economic hardship, and to use IRS Form 4506-T or another electronic method for income verification rather than having to provide hard copies of tax forms and other documentation.
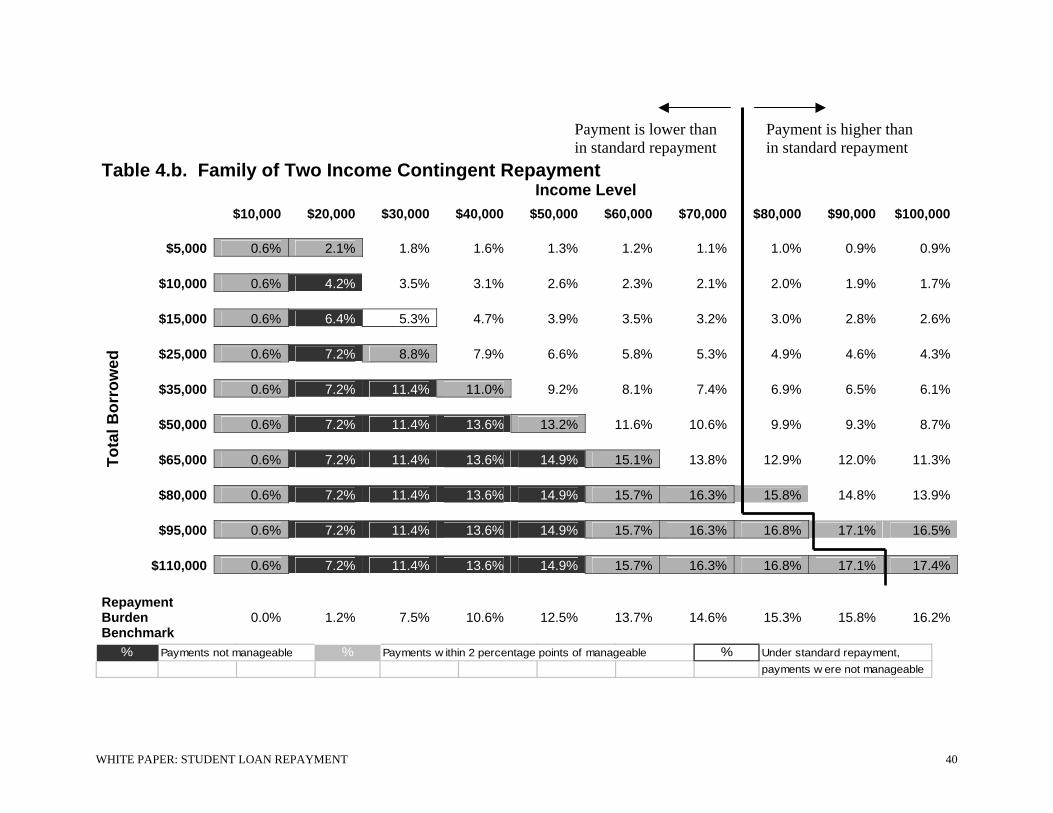
B. Income Contingent Repayment
The income-contingent repayment (ICR) option in the Direct Loan Program has been a critically important refuge for some struggling borrowers. Borrowers make only token payments if they are below poverty income (taking family size into account) and the required payments are capped at 20 percent of any earnings above the poverty level. Of the various examples of current repayment options shown in Appendix B, the ICR option for a family of four is the only one that consistently provides for a manageable payment at all levels of income and debt.
But there is a caveat: when the borrower’s payments fail to cover interest, the size of the debt grows. Unlike the economic hardship deferment, there is no significant interest relief in the near term.* This makes it harder and harder for the borrower to catch up and finish paying off the loan. Their only solace is that if they keep making ICR payments for 25 years, any debt that remains (likely to be largely interest) will be forgiven. However, under current tax law, the amount forgiven will count as taxable income – a further debt to be paid.
Why is the ICR option available only in the Direct Loan Program? Originally, it was confined to that program because the assumption was that income data from the IRS could only be shared within the government. As it turns out, Direct Loans are serviced by private contractors who acquire borrower permission to verify income with the IRS. Those servicers could just as easily administer ICR for a private lender in the FFEL program. The question of the formula for ICR need not be tangled up with the politics of direct versus guaranteed loans.
* The first 10 percent of interest that is not covered by borrower payments is added to the loan amount (“capitalized”) so that the interest compounds. Above 10 percent, any additional unpaid interest is added to the amount owed but does not compound while the borrower is in ICR.
WHITE PAPER: STUDENT LOAN REPAYMENT 17
Pluses of the Current System
(1) Because it considers income, ICR provides an important safeguard – a form of insurance – for struggling borrowers. Fewer than 10 percent of borrowers are in ICR. But for many of them, it is the only available relief from a situation of severe struggle and/or likely default. In addition, many former defaulters are placed in ICR because of the assurance that payment amounts will be manageable given their income.
(2) The ICR option does not lock a borrower into remaining in the repayment plan. Borrowers have the option of moving out of the repayment plan. (However, if a borrower makes payments under a graduated or alternative repayment plan, those payments do not count toward the 25 year limit in ICR.)
(3) The ICR formula is sensitive to family size.
Minuses of the Current System
(1) Most borrowers are in the FFEL program and are likely not aware of ICR. Further, in order to access it, they have to go through the process of consolidating into direct lending. A provision in the budget reconciliation legislation currently in Congress would make it even more difficult for FFEL borrowers to access ICR.
(2) The lack of any significant interest relief for 25 years is daunting to many who might otherwise be good candidates for ICR.
(3) Treating forgiven amounts as income for tax purposes makes the 25-year “forgiveness” somewhat disingenuous, and potentially problematic for someone who has already had a lifetime of low earnings. Essentially, this could generate significant tax liability for borrowers with very low incomes who lack the funds to pay the tax owed, particularly because this is “income” that they do not actually receive.
Possible Fixes
The following three changes would make ICR more accessible and more helpful, particularly to those who borrowed modestly and found themselves in lower-paying jobs:
(1) Make ICR equally available in both major federal loan programs.
(2) For borrowers with smaller amounts of debt (such as undergraduate borrowing), reduce the number of years of repayment required before forgiveness, perhaps to 15 years.
(3) Exempt forgiven amounts from the definition of income for the purpose of income taxes.

WHITE PAPER: STUDENT LOAN REPAYMENT 18
Additional changes to ICR could be considered in the context of a broader review of interest subsidies under economic hardship. With a more comprehensive economic hardship program as described in the previous section, ICR as a totally separate option may no longer make sense. Instead, the U.S. could establish policies that would allow for some forgiveness of remaining debts after borrowers have made regular or hardship payments for some defined period(s). These protections could apply to all similarly-situated borrowers, rather than to borrowers in a particular ICR repayment track.
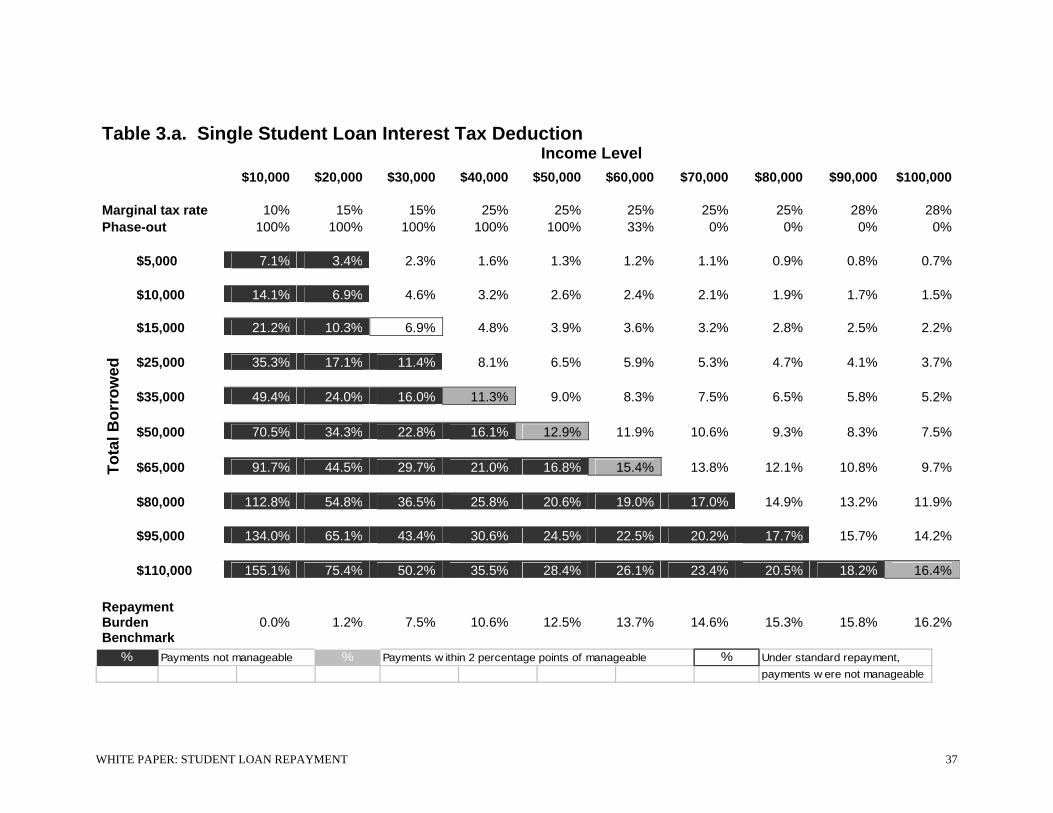
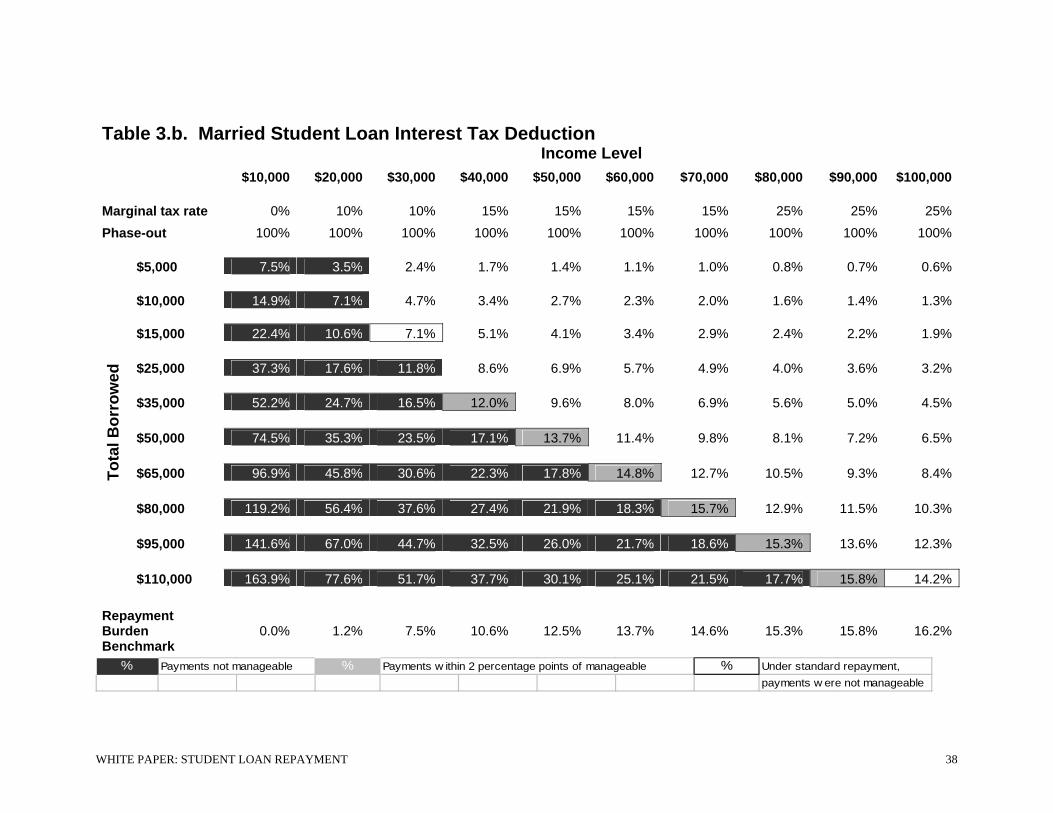
C. Student Loan Interest Tax Deduction
Each year, borrowers can deduct from their income up to $2,500 in interest on any loans, federal or private, that they have taken out for the purpose of paying for postsecondary education and training. Loans to students and to parents are included. The deduction is available “above the line,” meaning that the borrower does not need to itemize in order to take advantage of it. However, low-income borrowers with insufficient tax liability do not receive a benefit.
This type of partial interest relief does not necessarily result in a significant reduction in the borrower’s payment burden. This is because interest payments can be either a large or small portion of a payment in a particular year. For example, for a $10,000 loan at an 8 percent interest rate, the payment amounts and interest are as follows:
Year Payment Interest1 $1,490 $8005 $1,490 $55110 $1,490 $110
This means that two borrowers in the same financial situation, facing identical loan payment burdens in a particular year, are able to claim very different amounts of interest when they file their taxes. (This is also true of economic hardship, but the hardship deferment is connected to a delay in the required payment of principal.) Pluses of the Current System
(1) The concept of deducting interest is a familiar one to taxpayers, so the deduction is not difficult for most borrowers to understand.
(2) People who qualify are likely to receive the benefit with minimal hassle. Unlike
the economic hardship deferrals, which require a borrower to proactively seek out relief, the interest deduction is prompted by both the 1040 tax form as well as the interest statement provided to borrowers by their lenders.

WHITE PAPER: STUDENT LOAN REPAYMENT 19
Minuses of the Current System
(1) As currently designed the benefit is small, generally affecting the net repayment burden by less than one or two percentage points (see Appendix B).
(2) The tax benefit is not well targeted. Because it is structured as a deduction, higher
income borrowers receive a larger benefit than those with lower incomes. For example, if there are two single borrowers with the same $10,000 in debt, one with an income of $15,000 and the other earning $40,000, the high-income borrower’s taxes are reduced by $200 while the lower-income borrower’s taxes are reduced by only $80, or 60 percent less.
(3) Borrowers still have to come up with the money for the interest, even if they are
able to later receive the tax subsidy (however, they can adjust their tax withholding to reflect the benefit).
Possible fixes
Addressing loan repayment burdens through a tax provision could achieve much the same result as the revision of economic hardship described above. In fact, it could be administratively simpler, because getting accurate information regarding borrower incomes is automatic – lenders do not need to acquire copies of tax returns or authority to match IRS data. Further, lenders already send loan information to borrowers and to the IRS. We describe two possible approaches, both requiring converting this provision into a refundable tax credit rather than a deduction.
(1) Student Loan Interest Tax Credit. Taxpayers with incomes below a threshold ($18,800 for example, or a level that considers family size) would be able to claim a credit equal to 100% of their interest payments on student loans. Above the threshold income, the credit would be reduced as income rises (similar to the suggestion for economic hardship) until it reaches a minimum credit. (A minimum credit of 25% of interest would provide a benefit similar to the amount that many borrowers currently receive through the deduction).
(2) Student Loan Repayment Tax Credit. This would operate in the same way as the interest credit, except that the credit could cover both interest and principal payments to the extent they exceed the manageable payment threshold. This is similar to a recent proposal by economist Tom Kane (see http://www.projectonstudentdebt.org/fckfiles/File/tax_credit_proposal_summary.doc).
WHITE PAPER: STUDENT LOAN REPAYMENT 20
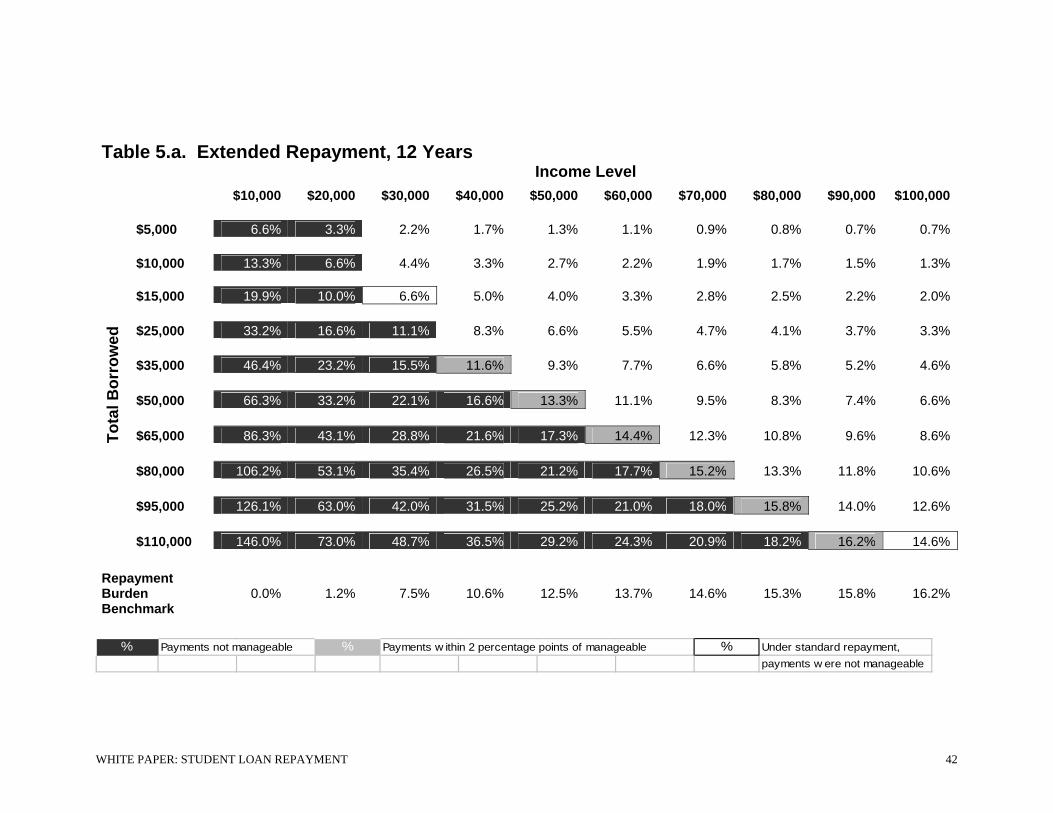
D. Extended, Graduated and Income Sensitive Repayment
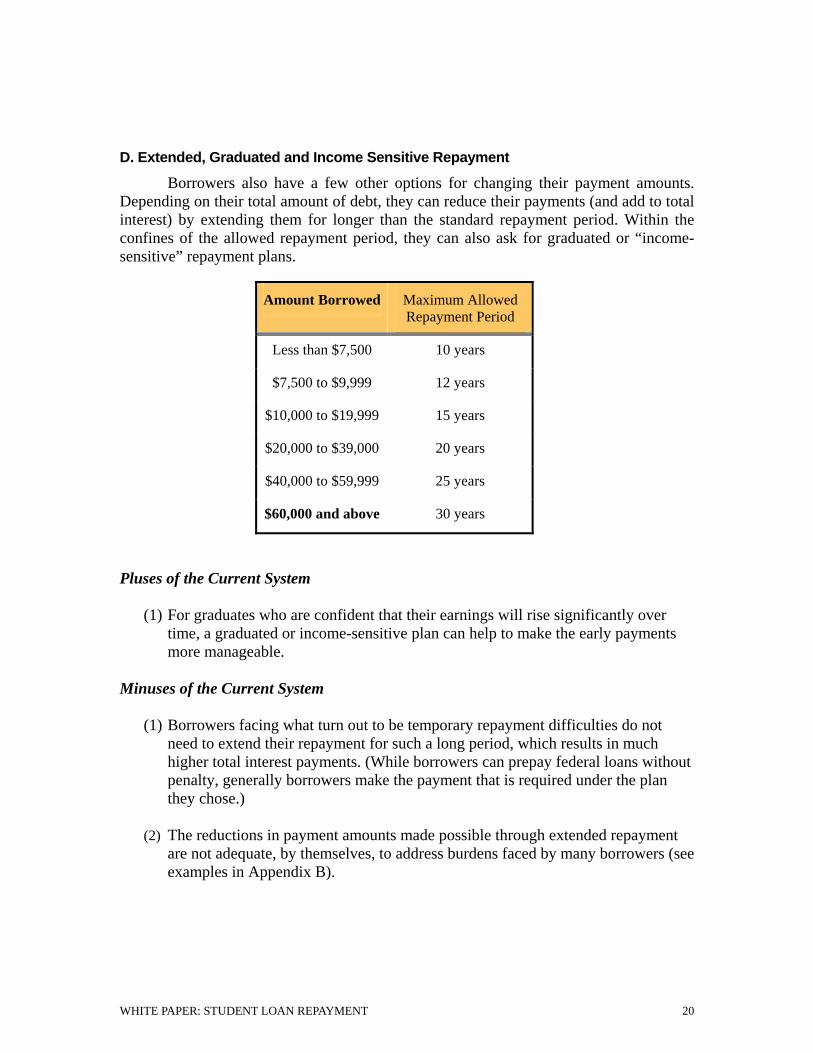
Borrowers also have a few other options for changing their payment amounts. Depending on their total amount of debt, they can reduce their payments (and add to total interest) by extending them for longer than the standard repayment period. Within the confines of the allowed repayment period, they can also ask for graduated or “income-sensitive” repayment plans.
Amount Borrowed Maximum Allowed Repayment Period
Less than $7,500 10 years
$7,500 to $9,999 12 years
$10,000 to $19,999 15 years
$20,000 to $39,000 20 years
$40,000 to $59,999 25 years
$60,000 and above 30 years
Pluses of the Current System
(1) For graduates who are confident that their earnings will rise significantly over time, a graduated or income-sensitive plan can help to make the early payments more manageable.
Minuses of the Current System
(1) Borrowers facing what turn out to be temporary repayment difficulties do not need to extend their repayment for such a long period, which results in much higher total interest payments. (While borrowers can prepay federal loans without penalty, generally borrowers make the payment that is required under the plan they chose.)
(2) The reductions in payment amounts made possible through extended repayment
are not adequate, by themselves, to address burdens faced by many borrowers (see examples in Appendix B).

WHITE PAPER: STUDENT LOAN REPAYMENT 21
E. Loan Forgiveness Programs
A variety of federal, state, and private programs eliminate some or all of borrowers’ student loan debt if they serve for a certain length of time in a particular type of job. Intended as an incentive for recruitment and retention, federal loan forgiveness programs attempt to reduce the potential negative impact of student debt on borrowers’ ability to enter public service careers. In most cases the amount forgiven is treated as taxable income.
For their service, members of the military receive education benefits that can
include repayment of outstanding student loans. Listed below are some of the other federal policies that provide for partial or full forgiveness of Stafford loans and, in some cases, other loans as well. (This list does not include the various loan forgiveness provisions that are restricted to the small Perkins loan program.)
Target Group Benefit Length of Service Required Elementary and High School Teachers at high-poverty schools
Total of $5,000 ($17,500 for math, science, and special ed only)
5 consecutive years
Child Care Providers in low-income communities
20% of Stafford loans after 2 years, up to 100% after 5 years
2 consecutive years
Registered Nurses at critical shortage facilities
60% of eligible loans after 2 years, 85% after 3 years
2-year contract
Health Service Corps members working in underserved communities
Up to $50,000 2-year contract
Health Researchers with NIH grants
Up to $35,000/year if debt exceeds 20% of salary.
2-year contract
AmeriCorps and VISTA Volunteers
$4,725/year for up to 2 years
1 year of service
House and Senate Staff Up to $6,000/year, $40,000 aggregate maximum
1-year contract
Federal Agency Employees (plus GAO, GPO, and Library of Congress)
Up to $10,000/year, $60,000 aggregate maximum
3-year contract
These loan forgiveness programs provide benefits to people who make choices
deemed valuable to society, such as teaching in the public schools or working in a rural health clinic. This kind of exchange for service is easy to explain and has positive associations, both for recipients and the general public.

WHITE PAPER: STUDENT LOAN REPAYMENT 22
However, loan forgiveness programs, as currently configured, reach only a small
proportion of worthy borrowers. Because the programs are limited in size, they cannot provide students before and during college with any confidence that they will be protected from excessive loan burden. To benefit from loan forgiveness, you must already have made a series of choices that involve substantial risk, especially for those with limited resources. Most importantly, you must decide to go to college without knowing if you will succeed in a particular field of study; and you must decide to take out student loans without knowing what your income will be after graduation or if you will actually qualify for loan forgiveness. In many cases, you must also go to graduate school and take on more debt, again without a guarantee of success or forgiveness. In addition, many of the programs have a limited amount of funds and are therefore only able to provide forgiveness to a fraction of the eligible borrowers.
A broader approach to public-service loan forgiveness was proposed in the U.S.
Senate but has not been enacted. It would have allowed borrowers who are using income-contingent repayment to have any remaining loan balances forgiven after 10 years in a public service job.
F. Bankruptcy
One area that needs further exploration is the treatment of student loans under bankruptcy. The policies and formulas described above cannot account for the all of the circumstances that may make student loan repayment excessively burdensome for borrowers. In the most extreme situations, a court’s involvement may be necessary to assess the borrower’s situation and the competing claims on the borrower’s assets and future income. Current law makes it extremely difficult to discharge student loans in bankruptcy, including private loans. These provisions should be evaluated to assess whether they treat student loans appropriately in the context of our national interest in higher education, and in relation to other types of financial obligations.

WHITE PAPER: STUDENT LOAN REPAYMENT 23
III. Issues for Consideration
The student loan system in the United States includes a number of provisions that aim to ease repayment burdens. However, they are inconsistent and sometimes irrational, highly complex, and too narrow in scope when compared to legitimate needs.
• Many borrowers who clearly should qualify for assistance do not.
• Some provisions counter-productively reward borrowers for working less or earning less, or for borrowing more.
• Some programs fail to consider family size in assessing the amount that borrowers can afford to repay.
• There is insufficient assistance for borrowers who have low incomes relative to their debt over a long period of time.
• Even when formulas for repayment assistance are designed appropriately, borrowers often are not informed that the assistance is available.
It is not difficult to imagine a better, more rational system of student loan repayment in the United States. The building blocks are there, but need to be assembled in a way that makes sense to borrowers and reaches those who are eligible. Some of the adjustments that could lead to significant improvements include:
Expanded “economic hardship” provisions. Some federal loans offer interest subsidies for periods of “economic hardship.” However, the current formulas and processes fail to reach borrowers who should qualify, and lead to situations in which borrowers in similar situations receive vastly different treatment. These provisions could be improved by establishing a more uniform definition of hardship, and phasing out the benefits as borrower incomes rise. Other potential improvements include adjusting the benefits for family size, eliminating the three-year limit, and making other loans eligible for interest assistance. In addition, information about the assistance needs to be more readily available and the process for applying less burdensome.
Tax credit for student loan interest. This proposal would provide taxpayers with incomes below a certain threshold with a refundable credit for their actual interest payments on student loans. The income threshold would take family size into account. Borrowers with incomes above the threshold would receive a partial credit. A tax credit gives borrowers a financial incentive to make payments on their loans. By using a sliding scale linked to repayment burdens, borrowers would also have a financial incentive to earn more.
The credit could replace the current interest deduction, under which lenders already provide taxpayers and the IRS with information on student loan interest paid. Providing relief through a tax provision could also be more effective than other
WHITE PAPER: STUDENT LOAN REPAYMENT 24
programs in reaching qualified borrowers and would be simpler to administer, since lenders do not need to become involved in confirming borrower’s incomes.
Simplify income-based repayment. Some borrowers with federal loans have a repayment option called “income-contingent repayment,” or ICR. It is the only current plan that allows for eventual forgiveness of remaining loan balances, after 25 years of income-based payments. This program could be improved by making it available to all borrowers, reducing the maximum repayment period, and ensuring that amounts forgiven are not treated as taxable income.
The following questions can help inform decisions about which approach to take and what specific elements to include in potential reforms:
A. How much income should be protected? There seems to be widespread agreement that below a particular level of income, probably adjusted for family size, either no payments or only token payments should be required of borrowers.
B. What proportion of discretionary income is too much? Above the threshold of protected income, what is a reasonable percentage of income to assign to student loan payments?
C. Under what circumstances should interest or payments be subsidized? The protections offered by the answers to questions A and B (above) are not meaningful if borrowers face unlimited accrual of interest.
D. Which loans, or how much in loans, should qualify? Policies can be targeted to certain types of loans (e.g. Stafford subsidized), to a total amount of borrowing, and/or to loans taken out for particular levels of study.
E. How should the benefit be delivered? Assistance can be provided through provisions in the loan promissory note (such as hardship provisions), or through the income tax system.
In moving toward a more rational system, some issues to consider include:
1. Can the system be explained in a way that provides some assurance to low-income borrowers that student loans will not be unduly burdensome?
2. How will borrowers know that help may be available in their particular situations?
3. How much will the new system cost? How could the cost be addressed? How could it be implemented most efficiently?
One danger in describing the shortcomings of the existing system is that some may use this as justification for eliminating rather than improving upon current policies. Borrowers are in need of greater protections than are now offered, and nothing in this paper should be construed as suggesting changes that would make loan repayments more burdensome.
WHITE PAPER: STUDENT LOAN REPAYMENT 25
Appendix A The Tyranny of Averages: Education and Earnings The case for taking out a loan to go to college can seem like a no-brainer. As advocates and researchers point out time and time again, the average American with a four-year college degree earns nearly a million dollars more over a lifetime than someone with only a high school diploma. Taking into consideration the time value of money, lost wages during the college years, and tuition and fees, economists say that the value “today” of that lifetime of larger earnings is still quite large: about $300,000, on average.1
Does that mean that there is no risk in borrowing money to pay for college? Hardly. Those average economic returns to a college education tell only part of the story. More than one-third of those who enter a four-year college do not actually earn that valuable Bachelor’s degree. And of those who do graduate, fewer than half earn the million-dollar bonus or more. Furthermore, as every mutual fund is required to point out to potential investors: past returns are no guarantee of future performance.
Here’s another way of looking at the risk. Let’s define a major debt burden as a
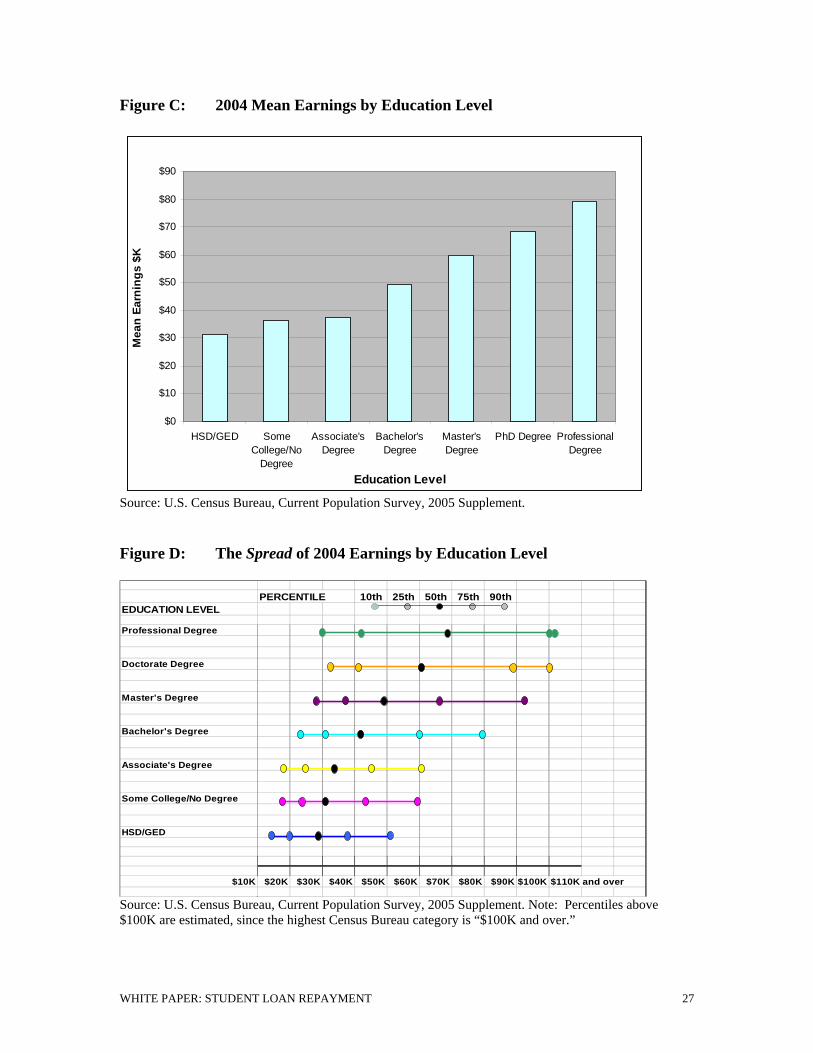
loan that takes more than 10 percent of income to repay.2 By that measure, more than half of full-time workers with only a high school diploma would find a $20,000 debt to be a major burden.3 Among those with Bachelor’s degrees, the proportion is one in every five—a much lower number, but still significant. Among women and African Americans with degrees, who tend to have lower salaries, the proportion is closer to one out of every four. For those with some college or an Associate’s degree, more than one-third would find their $20,000 debt taking more than 10 percent of their income. Education improves the odds, but doesn’t eliminate the risk. Worrying about taking on debt for college is perfectly rational, particularly for families without assets to fall back on.
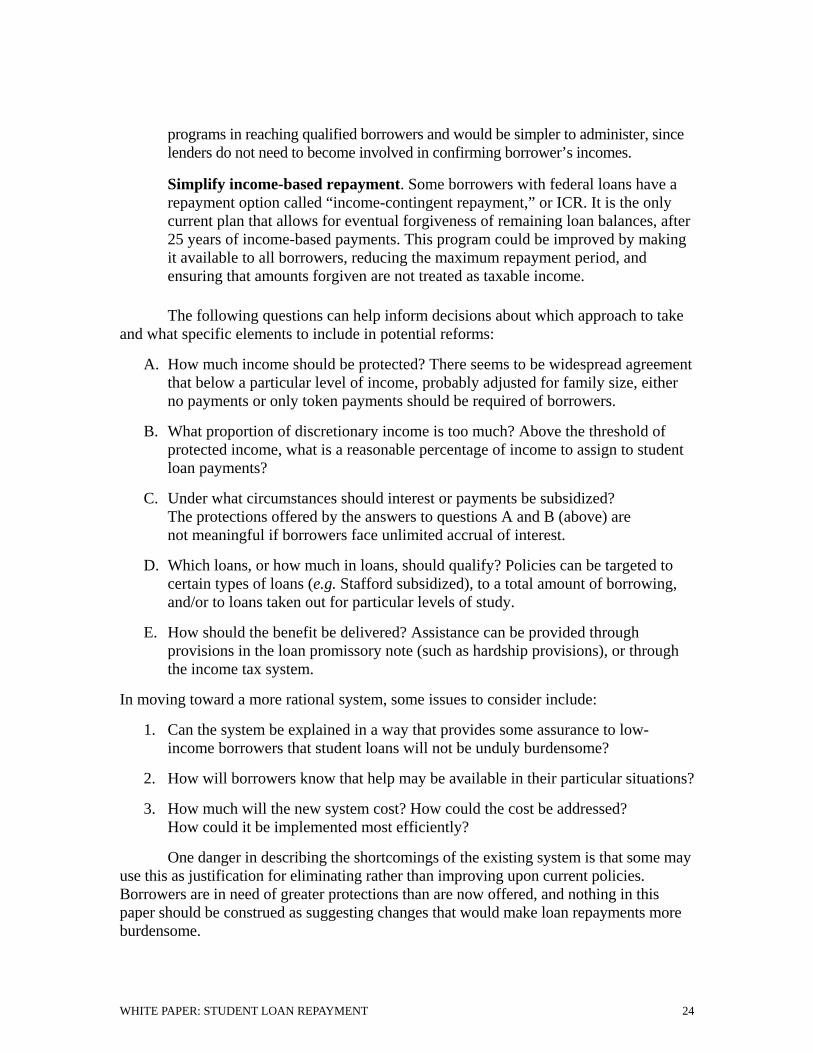
The charts that follow provide further background on the relationship between education and earnings, and the differences in earnings associated with race and ethnicity, gender, geography, and job type. Unless otherwise noted, all data includes males and females, age 25-34 years old, working full-time in 2004.
1 Lisa Barrow and Cecilia Rouse, “Does College Still Pay,” The Economists’ Voice, Vol. 2, Issue 5, 2005, http://www.bepress.com/ev/vol2/iss4/art3. 2 For an in-depth analysis of what constitutes a manageable student debt burden, see Sandy Baum and Saul Schwartz, “How Much Debt is Too Much?” Project on Student Debt and the College Board, November 2005. http://projectonstudentdebt.org/. 3 With an interest rate of 6.8 percent and a repayment period of 10 years, borrowers with incomes below $28,200 would be paying more than 10 percent of their income. The figures are derived from Census Bureau data for all full-time workers age 25-34, by level of education.

WHITE PAPER: STUDENT LOAN REPAYMENT 26
Figure A: Proportion of Workers Who Would Have to Devote More than 10%
of Income to Repay a $20,000 Debt, by Education Level
0% 10% 20% 30% 40% 50% 60%
HSD/GED
Some College/NoDegree
AA Degree
BA Degree
Source: U.S. Census Bureau, Current Population Survey, 2005 Supplement.
Figure B: Proportion of Workers with a BA Degree, Who Would Have to Devote More than 10% of Income to Repay a $20,000 Debt, by Gender and by Race/Ethnicity
Source: U.S. Census Bureau, Current Population Survey, 2005 Supplement.
All 19%Males 16%Females 23%White 19%Black 24%Asian 15%Hispanic 25%
WHITE PAPER: STUDENT LOAN REPAYMENT 27
Figure C: 2004 Mean Earnings by Education Level
$0
$10
$20
$30
$40
$50
$60
$70
$80
$90
HSD/GED SomeCollege/No
Degree
Associate'sDegree
Bachelor'sDegree
Master'sDegree
PhD Degree ProfessionalDegree
Education Level
Mea
n Ea
rnin
gs $
K
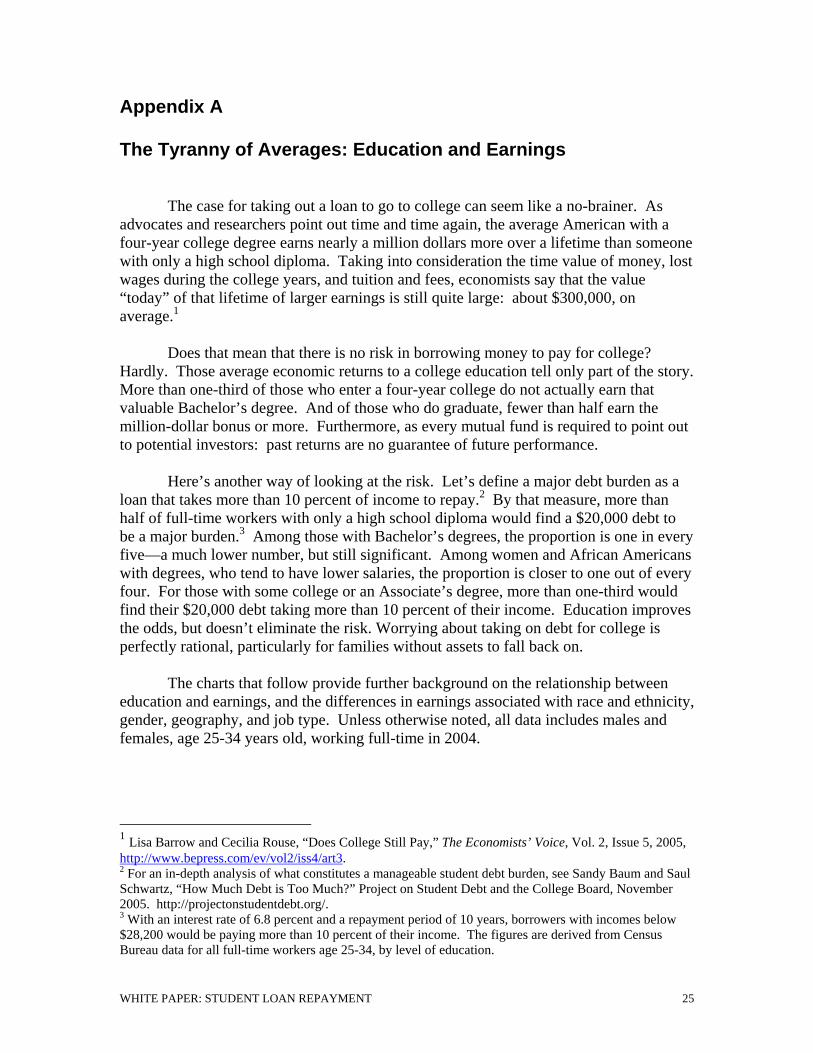
Source: U.S. Census Bureau, Current Population Survey, 2005 Supplement. Figure D: The Spread of 2004 Earnings by Education Level
PERCENTILE 10th 25th 50th 75th 90thEDUCATION LEVEL
Professional Degree
Doctorate Degree
Master's Degree
Bachelor's Degree
Associate's Degree
Some College/No Degree
HSD/GED
$10K $20K $30K $40K $50K $60K $70K $80K $90K $100K $110K and over
Source: U.S. Census Bureau, Current Population Survey, 2005 Supplement. Note: Percentiles above $100K are estimated, since the highest Census Bureau category is “$100K and over.”
WHITE PAPER: STUDENT LOAN REPAYMENT 28
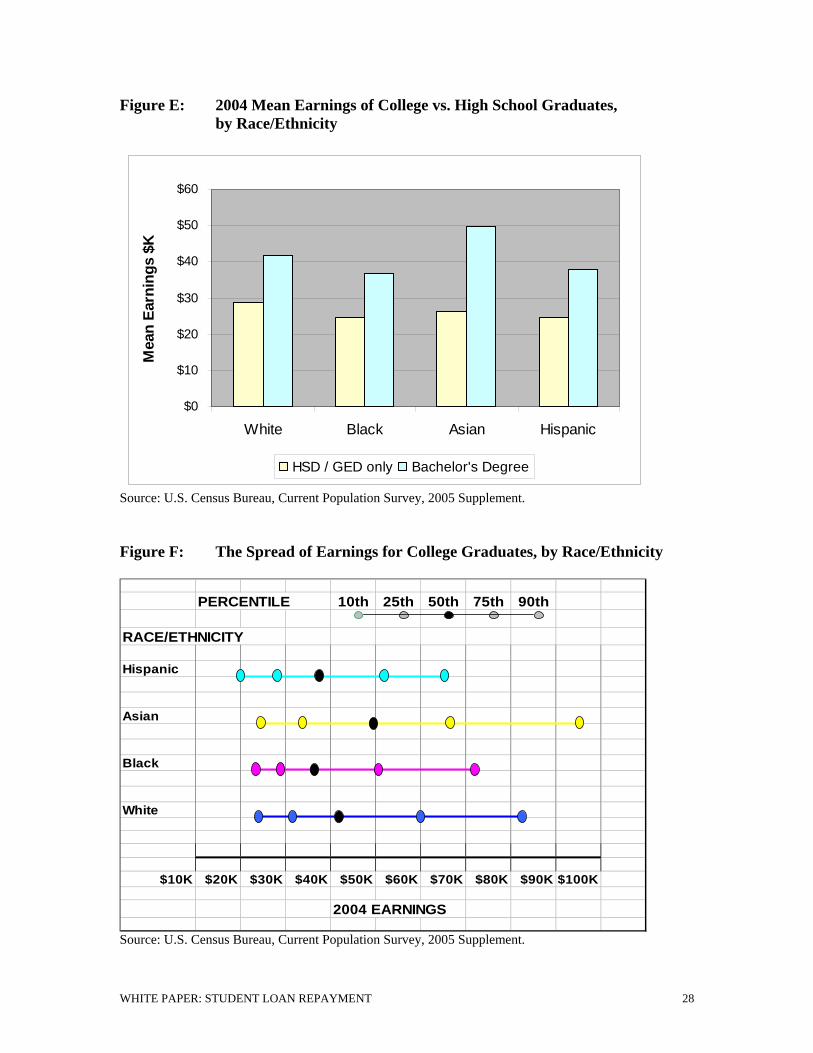
Figure E: 2004 Mean Earnings of College vs. High School Graduates, by Race/Ethnicity
$0
$10
$20
$30
$40
$50
$60
White Black Asian Hispanic
Mea
n Ea
rnin
gs $
K
HSD / GED only Bachelor's Degree
Source: U.S. Census Bureau, Current Population Survey, 2005 Supplement. Figure F: The Spread of Earnings for College Graduates, by Race/Ethnicity
PERCENTILE 10th 25th 50th 75th 90th
RACE/ETHNICITY
Hispanic
Asian
Black
White
$10K $20K $30K $40K $50K $60K $70K $80K $90K $100K
2004 EARNINGS
Source: U.S. Census Bureau, Current Population Survey, 2005 Supplement.

WHITE PAPER: STUDENT LOAN REPAYMENT 29
Figure G. The Spread of Earnings for College Graduates, by Gender
PERCENTILE 10th 25th 50th 75th 90th
GENDER
Females
Males
$10K $20K $30K $40K $50K $60K $70K $80K $90K $100K
2004 EARNINGS
Source: U.S. Census Bureau, Current Population Survey, 2005 Supplement. Figure H. 2004 Median Earnings of College vs. High School Graduates,
Age 25 Years and Over, by State Median earnings in the past 12 months are in 2004 inflation-adjusted dollars. State HSD/GED BA % DifferenceAlabama 22,025$ 39,113$ 77.6%Alaska 29,525$ 42,439$ 43.7%Arizona 24,415$ 41,222$ 68.8%Arkansas 21,412$ 37,911$ 77.1%California 26,541$ 48,507$ 82.8%Colorado 26,429$ 42,338$ 60.2%Connecticut 30,776$ 51,088$ 66.0%Delaware 27,774$ 43,618$ 57.0%District of Columbia 23,911$ 46,631$ 95.0%Florida 22,919$ 40,402$ 76.3%Georgia 25,342$ 45,469$ 79.4%Hawaii 25,518$ 39,028$ 52.9%Idaho 22,222$ 38,474$ 73.1%Illinois 26,423$ 44,336$ 67.8%Indiana 25,331$ 40,653$ 60.5%
continued

WHITE PAPER: STUDENT LOAN REPAYMENT 30
Figure H. Continued - 2004 Median Earnings of College vs. High School
Graduates, Age 25 Years and Over, by State State HSD/GED BA % DifferenceKansas 25,075 36,977 47.5%Kentucky 22,828 38,141 67.1%Louisiana 22,576 40,079 77.5%Maine 25,051 36,221 44.6%Maryland 29,506 48,954 65.9%Massachusetts 30,600 47,005 53.6%Michigan 25,825 45,135 74.8%Minnesota 27,330 43,045 57.5%Mississippi 21,093 36,140 71.3%Missouri 24,498 36,819 50.3%Montana 20,753 29,606 42.7%Nebraska 21,937 34,263 56.2%Nevada 26,924 40,402 50.1%New Hampshire 29,118 42,940 47.5%New Jersey 30,605 51,738 69.1%New Mexico 23,178 35,317 52.4%New York 26,525 45,244 70.6%North Carolina 22,687 40,077 76.7%North Dakota 21,704 33,154 52.8%Ohio 25,751 42,159 63.7%Oklahoma 22,682 36,130 59.3%Oregon 23,477 37,923 61.5%Pennsylvania 25,605 42,956 67.8%Rhode Island 28,819 41,786 45.0%South Carolina 22,487 40,082 78.2%South Dakota 22,553 30,615 35.7%Tennessee 23,720 39,623 67.0%Texas 23,719 42,361 78.6%Utah 25,252 36,066 42.8%Vermont 25,077 33,120 32.1%Virginia 26,527 45,447 71.3%Washington 26,893 43,529 61.9%West Virginia 22,165 35,696 61.0%Wisconsin 25,521 40,485 58.6%Wyoming 26,539 34,613 30.4%
Source: 2004 American Community Survey (ACS), U.S. Census Bureau.

WHITE PAPER: STUDENT LOAN REPAYMENT 31
Figure I. Starting Salary Offers for Bachelor’s Degree Candidates in 2005, by Field
Percentiles
Field 25th 50th 75th(Median)
CommunicationsDesign/Graphic Arts $27,000 $33,500 $37,500Public Relations $26,700 $30,000 $32,500
Computers:Computer Programming $41,000 $48,000 $53,000Technical/Computer Support $33,000 $43,000 $48,000
EducationPre-Elementary School Teacher $23,900 $29,000 $33,000Secondary Education Teacher $29,000 $31,750 $35,000
Engineering:Process Engineering (Chemical) $52,000 $55,000 $58,000Environmental/Sanitation Engineering $35,905 $41,600 $46,000
Finance:Investment Banking (Mergers & Acquisitions) $50,000 $55,000 $55,000Commercial Banking (Consumer) $25,000 $33,700 $40,000
Healthcare:Administrative (Healthcare) $25,000 $31,000 $40,000Registered Nurse $37,440 $40,000 $45,000
Marketing:Buyer/Merchandising $35,000 $40,000 $43,000Customer Service $24,000 $29,000 $35,000
Public Administration:National Security $35,323 $40,570 $55,200Law Enforcement $32,000 $38,000 $43,500
Social ServicesAdministration (Social Services) $20,800 $29,000 $32,700Counseling $22,000 $25,000 $28,000
Other:Consulting $45,000 $48,500 $53,000Agricultural/Natural Resources $25,000 $30,000 $34,000
Source: NACE Salary Survey A Study of 2004-2005 Beginning Offers, Fall 2005.

WHITE PAPER: STUDENT LOAN REPAYMENT 32
Appendix B Repayment Burden Tables The tables that follow show payments as a percentage of the borrower’s income at various levels of student loan debt. Except as otherwise noted, the figures are determined assuming equal payments over a 10-year period, with an interest rate of 8.0 percent. The tables show the repayment burdens (payment divided by income) for a single year under the following circumstances:
1. Standard repayment a. 8% interest rate b. 4% interest rate
2. Economic Hardship a. Not working full-time b. Working full-time
3. Student Loan Interest Tax Deduction a. Single b. Married
4. Income-contingent repayment a. Single b. Married c. Family of 4
5. Extended repayment a. 12 years b. 15 years c. 20 years d. 25 years
In order to assist readers in comparing the various approaches, repayment levels that are unmanageable are highlighted. If they are within two percentage points of the benchmark, they are shaded gray. If they were unmanageable under standard repayment but are manageable or within two percentage points under the described plan they are boxed. The definition of a manageable payment is one that does not exceed the Baum-Schwartz1 recommended benchmarks. (Under that approach, borrowers who earn less than $18,772 -- half the median wage for full-time workers in the U.S. -- are not expected to make any payment. Above that level, they are assumed to be able to commit 20 percent of their income to student loan repayment.)
1Sandy Baum and Saul Schwartz, How Much Debt Is Too Much? Defining Benchmarks for Manageable Student Debt, Novermber 2005, Project on Student Debt and the College Board, http://www.projectonstudentdebt.org/fckfiles/File/Debt_is_Too_Much_November_10.pdf.

WHITE PAPER: STUDENT LOAN REPAYMENT 33
Table 1.a. Standard Repayment
Income Level $10,000 $20,000 $30,000 $40,000 $50,000 $60,000 $70,000 $80,000 $90,000 $100,000
$5,000 7.5% 3.7% 2.5% 1.9% 1.5% 1.2% 1.1% 0.9% 0.8% 0.7% $10,000 14.9% 7.5% 5.0% 3.7% 3.0% 2.5% 2.1% 1.9% 1.7% 1.5% $15,000 22.4% 11.2% 7.5% 5.6% 4.5% 3.7% 3.2% 2.8% 2.5% 2.2% $25,000 37.3% 18.6% 12.4% 9.3% 7.5% 6.2% 5.3% 4.7% 4.1% 3.7% $35,000 52.2% 26.1% 17.4% 13.0% 10.4% 8.7% 7.5% 6.5% 5.8% 5.2% $50,000 74.5% 37.3% 24.8% 18.6% 14.9% 12.4% 10.6% 9.3% 8.3% 7.5%
Tota
l Bor
row
ed
$65,000 96.9% 48.4% 32.3% 24.2% 19.4% 16.1% 13.8% 12.1% 10.8% 9.7% $80,000 119.2% 59.6% 39.7% 29.8% 23.8% 19.9% 17.0% 14.9% 13.2% 11.9% $95,000 141.6% 70.8% 47.2% 35.4% 28.3% 23.6% 20.2% 17.7% 15.7% 14.2% $110,000 163.9% 82.0% 54.6% 41.0% 32.8% 27.3% 23.4% 20.5% 18.2% 16.4% Repayment Burden Benchmark
0.0% 1.2% 7.5% 10.6% 12.5% 13.7% 14.6% 15.3% 15.8% 16.2%
% Payments not manageable % Payments w ithin 2 percentage points of manageable % Under standard repayment,
payments w ere not manageable

WHITE PAPER: STUDENT LOAN REPAYMENT 34
Table 1.b. Standard Repayment, 4% Interest Rate
Income Level $10,000 $20,000 $30,000 $40,000 $50,000 $60,000 $70,000 $80,000 $90,000 $100,000
$5,000 6.2% 3.1% 2.1% 1.5% 1.2% 1.0% 0.9% 0.8% 0.7% 0.6% $10,000 12.3% 6.2% 4.1% 3.1% 2.5% 2.1% 1.8% 1.5% 1.4% 1.2% $15,000 18.5% 9.2% 6.2% 4.6% 3.7% 3.1% 2.6% 2.3% 2.1% 1.8% $25,000 30.8% 15.4% 10.3% 7.7% 6.2% 5.1% 4.4% 3.9% 3.4% 3.1% $35,000 43.2% 21.6% 14.4% 10.8% 8.6% 7.2% 6.2% 5.4% 4.8% 4.3% $50,000 61.6% 30.8% 20.5% 15.4% 12.3% 10.3% 8.8% 7.7% 6.8% 6.2%
Tota
l Bor
row
ed
$65,000 80.1% 40.1% 26.7% 20.0% 16.0% 13.4% 11.4% 10.0% 8.9% 8.0% $80,000 98.6% 49.3% 32.9% 24.7% 19.7% 16.4% 14.1% 12.3% 11.0% 9.9% $95,000 117.1% 58.6% 39.0% 29.3% 23.4% 19.5% 16.7% 14.6% 13.0% 11.7% $110,000 135.6% 67.8% 45.2% 33.9% 27.1% 22.6% 19.4% 17.0% 15.1% 13.6% Repayment Burden Benchmark
0.0% 1.2% 7.5% 10.6% 12.5% 13.7% 14.6% 15.3% 15.8% 16.2%
% Payments not manageable % Payments w ithin 2 percentage points of manageable % Under standard repayment,
payments w ere not manageable

WHITE PAPER: STUDENT LOAN REPAYMENT 35
Table 2.a. Economic Hardship, Not Working Full-Time
Income Level $10,000 $20,000 $30,000 $40,000 $50,000 $60,000 $70,000 $80,000 $90,000 $100,000
$5,000 0.0% 3.7% 2.5% 1.9% 1.5% 1.2% 1.1% 0.9% 0.8% 0.7% $10,000 0.0% 7.5% 5.0% 3.7% 3.0% 2.5% 2.1% 1.9% 1.7% 1.5% $15,000 0.0% 11.2% 7.5% 5.6% 4.5% 3.7% 3.2% 2.8% 2.5% 2.2% $25,000 0.0% 18.6% 12.4% 9.3% 7.5% 6.2% 5.3% 4.7% 4.1% 3.7% $35,000 0.0% 26.1% 17.4% 13.0% 10.4% 8.7% 7.5% 6.5% 5.8% 5.2% $50,000 0.0% 37.3% 24.8% 18.6% 14.9% 12.4% 10.6% 9.3% 8.3% 7.5%
Tota
l Bor
row
ed
$65,000 0.0% 0.0% 32.3% 24.2% 19.4% 16.1% 13.8% 12.1% 10.8% 9.7% $80,000 0.0% 0.0% 39.7% 29.8% 23.8% 19.9% 17.0% 14.9% 13.2% 11.9% $95,000 0.0% 0.0% 47.2% 35.4% 28.3% 23.6% 20.2% 17.7% 15.7% 14.2% $110,000 0.0% 0.0% 54.6% 41.0% 32.8% 27.3% 23.4% 20.5% 18.2% 16.4% Repayment Burden Benchmark
0.0% 1.2% 7.5% 10.6% 12.5% 13.7% 14.6% 15.3% 15.8% 16.2%
% Payments not manageable % Payments w ithin 2 percentage points of manageable % Under standard repayment,
payments w ere not manageable

WHITE PAPER: STUDENT LOAN REPAYMENT 36
Table 2.b. Economic Hardship, Working Full-Time
Income Level $10,000 $20,000 $30,000 $40,000 $50,000 $60,000 $70,000 $80,000 $90,000 $100,000
$5,000 0.0% 3.7% 2.5% 1.9% 1.5% 1.2% 1.1% 0.9% 0.8% 0.7% $10,000 0.0% 7.5% 5.0% 3.7% 3.0% 2.5% 2.1% 1.9% 1.7% 1.5% $15,000 0.0% 11.2% 7.5% 5.6% 4.5% 3.7% 3.2% 2.8% 2.5% 2.2% $25,000 0.0% 18.6% 12.4% 9.3% 7.5% 6.2% 5.3% 4.7% 4.1% 3.7% $35,000 0.0% 0.0% 17.4% 13.0% 10.4% 8.7% 7.5% 6.5% 5.8% 5.2% $50,000 0.0% 0.0% 0.0% 18.6% 14.9% 12.4% 10.6% 9.3% 8.3% 7.5%
Tota
l Bor
row
ed
$65,000 0.0% 0.0% 0.0% 24.2% 19.4% 16.1% 13.8% 12.1% 10.8% 9.7% $80,000 0.0% 0.0% 0.0% 29.8% 23.8% 19.9% 17.0% 14.9% 13.2% 11.9% $95,000 0.0% 0.0% 0.0% 0.0% 28.3% 23.6% 20.2% 17.7% 15.7% 14.2% $110,000 0.0% 0.0% 0.0% 0.0% 32.8% 27.3% 23.4% 20.5% 18.2% 16.4% Repayment Burden Benchmark
0.0% 1.2% 7.5% 10.6% 12.5% 13.7% 14.6% 15.3% 15.8% 16.2%
% Payments not manageable % Payments w ithin 2 percentage points of manageable % Under standard repayment,
payments w ere not manageable
WHITE PAPER: STUDENT LOAN REPAYMENT 37
Table 3.a. Single Student Loan Interest Tax Deduction
Income Level $10,000 $20,000 $30,000 $40,000 $50,000 $60,000 $70,000 $80,000 $90,000 $100,000
Marginal tax rate 10% 15% 15% 25% 25% 25% 25% 25% 28% 28%Phase-out 100% 100% 100% 100% 100% 33% 0% 0% 0% 0%
$5,000 7.1% 3.4% 2.3% 1.6% 1.3% 1.2% 1.1% 0.9% 0.8% 0.7% $10,000 14.1% 6.9% 4.6% 3.2% 2.6% 2.4% 2.1% 1.9% 1.7% 1.5% $15,000 21.2% 10.3% 6.9% 4.8% 3.9% 3.6% 3.2% 2.8% 2.5% 2.2% $25,000 35.3% 17.1% 11.4% 8.1% 6.5% 5.9% 5.3% 4.7% 4.1% 3.7% $35,000 49.4% 24.0% 16.0% 11.3% 9.0% 8.3% 7.5% 6.5% 5.8% 5.2% $50,000 70.5% 34.3% 22.8% 16.1% 12.9% 11.9% 10.6% 9.3% 8.3% 7.5%
Tota
l Bor
row
ed
$65,000 91.7% 44.5% 29.7% 21.0% 16.8% 15.4% 13.8% 12.1% 10.8% 9.7% $80,000 112.8% 54.8% 36.5% 25.8% 20.6% 19.0% 17.0% 14.9% 13.2% 11.9% $95,000 134.0% 65.1% 43.4% 30.6% 24.5% 22.5% 20.2% 17.7% 15.7% 14.2% $110,000 155.1% 75.4% 50.2% 35.5% 28.4% 26.1% 23.4% 20.5% 18.2% 16.4% Repayment Burden Benchmark
0.0% 1.2% 7.5% 10.6% 12.5% 13.7% 14.6% 15.3% 15.8% 16.2%
% Payments not manageable % Payments w ithin 2 percentage points of manageable % Under standard repayment, payments w ere not manageable
WHITE PAPER: STUDENT LOAN REPAYMENT 38
Table 3.b. Married Student Loan Interest Tax Deduction
Income Level $10,000 $20,000 $30,000 $40,000 $50,000 $60,000 $70,000 $80,000 $90,000 $100,000
Marginal tax rate 0% 10% 10% 15% 15% 15% 15% 25% 25% 25%Phase-out 100% 100% 100% 100% 100% 100% 100% 100% 100% 100%
$5,000 7.5% 3.5% 2.4% 1.7% 1.4% 1.1% 1.0% 0.8% 0.7% 0.6% $10,000 14.9% 7.1% 4.7% 3.4% 2.7% 2.3% 2.0% 1.6% 1.4% 1.3% $15,000 22.4% 10.6% 7.1% 5.1% 4.1% 3.4% 2.9% 2.4% 2.2% 1.9% $25,000 37.3% 17.6% 11.8% 8.6% 6.9% 5.7% 4.9% 4.0% 3.6% 3.2% $35,000 52.2% 24.7% 16.5% 12.0% 9.6% 8.0% 6.9% 5.6% 5.0% 4.5% $50,000 74.5% 35.3% 23.5% 17.1% 13.7% 11.4% 9.8% 8.1% 7.2% 6.5%
Tota
l Bor
row
ed
$65,000 96.9% 45.8% 30.6% 22.3% 17.8% 14.8% 12.7% 10.5% 9.3% 8.4% $80,000 119.2% 56.4% 37.6% 27.4% 21.9% 18.3% 15.7% 12.9% 11.5% 10.3% $95,000 141.6% 67.0% 44.7% 32.5% 26.0% 21.7% 18.6% 15.3% 13.6% 12.3% $110,000 163.9% 77.6% 51.7% 37.7% 30.1% 25.1% 21.5% 17.7% 15.8% 14.2% Repayment Burden Benchmark
0.0% 1.2% 7.5% 10.6% 12.5% 13.7% 14.6% 15.3% 15.8% 16.2%
% Payments not manageable % Payments w ithin 2 percentage points of manageable % Under standard repayment, payments w ere not manageable

WHITE PAPER: STUDENT LOAN REPAYMENT 39
Payment is lower than Payment is higher than in standard repayment in standard repayment Table 4.a. Single Income Contingent Repayment
Income Level $10,000 $20,000 $30,000 $40,000 $50,000 $60,000 $70,000 $80,000 $90,000 $100,000
$5,000 0.9% 2.2% 1.8% 1.6% 1.3% 1.2% 1.1% 1.0% 0.9% 0.9%
$10,000 0.9% 4.4% 3.7% 3.2% 2.6% 2.4% 2.2% 2.0% 1.9% 1.8%
$15,000 0.9% 6.6% 5.5% 4.7% 3.9% 3.6% 3.3% 3.1% 2.8% 2.7%
$25,000 0.9% 10.4% 9.2% 7.9% 6.6% 6.0% 5.5% 5.1% 4.7% 4.4%
$35,000 0.9% 10.4% 12.8% 11.1% 9.2% 8.4% 7.7% 7.1% 6.6% 6.2%
$50,000 0.9% 10.4% 13.6% 15.2% 13.2% 12.0% 11.0% 10.2% 9.4% 8.8%
Tota
l Bor
row
ed
$65,000 0.9% 10.4% 13.6% 15.2% 16.2% 15.6% 14.3% 13.2% 12.3% 11.5% $80,000 0.9% 10.4% 13.6% 15.2% 16.2% 16.8% 17.3% 16.3% 15.1% 14.1% $95,000 0.9% 10.4% 13.6% 15.2% 16.2% 16.8% 17.3% 17.6% 17.9% 16.8% $110,000 0.9% 10.4% 13.6% 15.2% 16.2% 16.8% 17.3% 17.6% 17.9% 18.1% Repayment Burden Benchmark
0.0% 1.2% 7.5% 10.6% 12.5% 13.7% 14.6% 15.3% 15.8% 16.2%
% Payments not manageable % Payments w ithin 2 percentage points of manageable % Under standard repayment, payments w ere not manageable
WHITE PAPER: STUDENT LOAN REPAYMENT 40
Payment is lower than Payment is higher than in standard repayment in standard repayment Table 4.b. Family of Two Income Contingent Repayment
Income Level $10,000 $20,000 $30,000 $40,000 $50,000 $60,000 $70,000 $80,000 $90,000 $100,000
$5,000 0.6% 2.1% 1.8% 1.6% 1.3% 1.2% 1.1% 1.0% 0.9% 0.9%
$10,000 0.6% 4.2% 3.5% 3.1% 2.6% 2.3% 2.1% 2.0% 1.9% 1.7%
$15,000 0.6% 6.4% 5.3% 4.7% 3.9% 3.5% 3.2% 3.0% 2.8% 2.6%
$25,000 0.6% 7.2% 8.8% 7.9% 6.6% 5.8% 5.3% 4.9% 4.6% 4.3%
$35,000 0.6% 7.2% 11.4% 11.0% 9.2% 8.1% 7.4% 6.9% 6.5% 6.1%
$50,000 0.6% 7.2% 11.4% 13.6% 13.2% 11.6% 10.6% 9.9% 9.3% 8.7%
Tota
l Bor
row
ed
$65,000 0.6% 7.2% 11.4% 13.6% 14.9% 15.1% 13.8% 12.9% 12.0% 11.3% $80,000 0.6% 7.2% 11.4% 13.6% 14.9% 15.7% 16.3% 15.8% 14.8% 13.9% $95,000 0.6% 7.2% 11.4% 13.6% 14.9% 15.7% 16.3% 16.8% 17.1% 16.5% $110,000 0.6% 7.2% 11.4% 13.6% 14.9% 15.7% 16.3% 16.8% 17.1% 17.4% Repayment Burden Benchmark
0.0% 1.2% 7.5% 10.6% 12.5% 13.7% 14.6% 15.3% 15.8% 16.2%
% Payments not manageable % Payments w ithin 2 percentage points of manageable % Under standard repayment, payments w ere not manageable

WHITE PAPER: STUDENT LOAN REPAYMENT 41
Payment is lower than Payment is higher than in standard repayment in standard repayment Table 4.c. Family of Four Income Contingent Repayment
Income Level $10,000 $20,000 $30,000 $40,000 $50,000 $60,000 $70,000 $80,000 $90,000 $100,000
$5,000 0.6% 0.6% 1.8% 1.6% 1.3% 1.2% 1.1% 1.0% 0.9% 0.9%
$10,000 0.6% 0.6% 3.5% 3.1% 2.6% 2.3% 2.1% 2.0% 1.9% 1.7%
$15,000 0.6% 0.6% 5.3% 4.7% 3.9% 3.5% 3.2% 3.0% 2.8% 2.6%
$25,000 0.6% 0.6% 7.1% 7.9% 6.6% 5.8% 5.3% 4.9% 4.6% 4.3%
$35,000 0.6% 0.6% 7.1% 10.3% 9.2% 8.1% 7.4% 6.9% 6.5% 6.1%
$50,000 0.6% 0.6% 7.1% 10.3% 12.3% 11.6% 10.6% 9.9% 9.3% 8.7%
Tota
l Bor
row
ed
$65,000 0.6% 0.6% 7.1% 10.3% 12.3% 13.6% 13.8% 12.9% 12.0% 11.3% $80,000 0.6% 0.6% 7.1% 10.3% 12.3% 13.6% 14.5% 15.2% 14.8% 13.9% $95,000 0.6% 0.6% 7.1% 10.3% 12.3% 13.6% 14.5% 15.2% 15.7% 16.1% $110,000 0.6% 0.6% 7.1% 10.3% 12.3% 13.6% 14.5% 15.2% 15.7% 16.1% Repayment Burden Benchmark
0.0% 1.2% 7.5% 10.6% 12.5% 13.7% 14.6% 15.3% 15.8% 16.2%
% Payments not manageable % Payments w ithin 2 percentage points of manageable % Under standard repayment, payments w ere not manageable
WHITE PAPER: STUDENT LOAN REPAYMENT 42
Table 5.a. Extended Repayment, 12 Years
Income Level $10,000 $20,000 $30,000 $40,000 $50,000 $60,000 $70,000 $80,000 $90,000 $100,000
$5,000 6.6% 3.3% 2.2% 1.7% 1.3% 1.1% 0.9% 0.8% 0.7% 0.7% $10,000 13.3% 6.6% 4.4% 3.3% 2.7% 2.2% 1.9% 1.7% 1.5% 1.3% $15,000 19.9% 10.0% 6.6% 5.0% 4.0% 3.3% 2.8% 2.5% 2.2% 2.0% $25,000 33.2% 16.6% 11.1% 8.3% 6.6% 5.5% 4.7% 4.1% 3.7% 3.3% $35,000 46.4% 23.2% 15.5% 11.6% 9.3% 7.7% 6.6% 5.8% 5.2% 4.6% $50,000 66.3% 33.2% 22.1% 16.6% 13.3% 11.1% 9.5% 8.3% 7.4% 6.6%
Tota
l Bor
row
ed
$65,000 86.3% 43.1% 28.8% 21.6% 17.3% 14.4% 12.3% 10.8% 9.6% 8.6% $80,000 106.2% 53.1% 35.4% 26.5% 21.2% 17.7% 15.2% 13.3% 11.8% 10.6% $95,000 126.1% 63.0% 42.0% 31.5% 25.2% 21.0% 18.0% 15.8% 14.0% 12.6% $110,000 146.0% 73.0% 48.7% 36.5% 29.2% 24.3% 20.9% 18.2% 16.2% 14.6% Repayment Burden Benchmark
0.0% 1.2% 7.5% 10.6% 12.5% 13.7% 14.6% 15.3% 15.8% 16.2%
% Payments not manageable % Payments w ithin 2 percentage points of manageable % Under standard repayment,
payments w ere not manageable

WHITE PAPER: STUDENT LOAN REPAYMENT 43
Table 5.b. Extended Repayment, 15 Years
Income Level $10,000 $20,000 $30,000 $40,000 $50,000 $60,000 $70,000 $80,000 $90,000 $100,000
$5,000 5.8% 2.9% 1.9% 1.5% 1.2% 1.0% 0.8% 0.7% 0.6% 0.6% $10,000 11.7% 5.8% 3.9% 2.9% 2.3% 1.9% 1.7% 1.5% 1.3% 1.2% $15,000 17.5% 8.8% 5.8% 4.4% 3.5% 2.9% 2.5% 2.2% 1.9% 1.8% $25,000 29.2% 14.6% 9.7% 7.3% 5.8% 4.9% 4.2% 3.7% 3.2% 2.9% $35,000 40.9% 20.4% 13.6% 10.2% 8.2% 6.8% 5.8% 5.1% 4.5% 4.1% $50,000 58.4% 29.2% 19.5% 14.6% 11.7% 9.7% 8.3% 7.3% 6.5% 5.8%
Tota
l Bor
row
ed
$65,000 75.9% 38.0% 25.3% 19.0% 15.2% 12.7% 10.8% 9.5% 8.4% 7.6% $80,000 93.5% 46.7% 31.2% 23.4% 18.7% 15.6% 13.4% 11.7% 10.4% 9.3% $95,000 111.0% 55.5% 37.0% 27.7% 22.2% 18.5% 15.9% 13.9% 12.3% 11.1% $110,000 128.5% 64.3% 42.8% 32.1% 25.7% 21.4% 18.4% 16.1% 14.3% 12.9% Repayment Burden Benchmark
0.0% 1.2% 7.5% 10.6% 12.5% 13.7% 14.6% 15.3% 15.8% 16.2%
% Payments not manageable % Payments w ithin 2 percentage points of manageable % Under standard repayment,
payments w ere not manageable

WHITE PAPER: STUDENT LOAN REPAYMENT 44
Table 5.c. Extended Repayment, 20 Years
Income Level $10,000 $20,000 $30,000 $40,000 $50,000 $60,000 $70,000 $80,000 $90,000 $100,000
$5,000 5.1% 2.5% 1.7% 1.3% 1.0% 0.8% 0.7% 0.6% 0.6% 0.5% $10,000 10.2% 5.1% 3.4% 2.5% 2.0% 1.7% 1.5% 1.3% 1.1% 1.0% $15,000 15.3% 7.6% 5.1% 3.8% 3.1% 2.5% 2.2% 1.9% 1.7% 1.5% $25,000 25.5% 12.7% 8.5% 6.4% 5.1% 4.2% 3.6% 3.2% 2.8% 2.5% $35,000 35.6% 17.8% 11.9% 8.9% 7.1% 5.9% 5.1% 4.5% 4.0% 3.6% $50,000 50.9% 25.5% 17.0% 12.7% 10.2% 8.5% 7.3% 6.4% 5.7% 5.1%
Tota
l Bor
row
ed
$65,000 66.2% 33.1% 22.1% 16.6% 13.2% 11.0% 9.5% 8.3% 7.4% 6.6% $80,000 81.5% 40.7% 27.2% 20.4% 16.3% 13.6% 11.6% 10.2% 9.1% 8.1% $95,000 96.8% 48.4% 32.3% 24.2% 19.4% 16.1% 13.8% 12.1% 10.8% 9.7% $110,000 112.0% 56.0% 37.3% 28.0% 22.4% 18.7% 16.0% 14.0% 12.4% 11.2% Repayment Burden Benchmark
0.0% 1.2% 7.5% 10.6% 12.5% 13.7% 14.6% 15.3% 15.8% 16.2%
% Payments not manageable % Payments w ithin 2 percentage points of manageable % Under standard repayment,
payments w ere not manageable

WHITE PAPER: STUDENT LOAN REPAYMENT 45
Table 5.d. Extended Repayment, 25 Years
Income Level $10,000 $20,000 $30,000 $40,000 $50,000 $60,000 $70,000 $80,000 $90,000 $100,000
$5,000 4.7% 2.3% 1.6% 1.2% 0.9% 0.8% 0.7% 0.6% 0.5% 0.5% $10,000 9.4% 4.7% 3.1% 2.3% 1.9% 1.6% 1.3% 1.2% 1.0% 0.9% $15,000 14.1% 7.0% 4.7% 3.5% 2.8% 2.3% 2.0% 1.8% 1.6% 1.4% $25,000 23.4% 11.7% 7.8% 5.9% 4.7% 3.9% 3.3% 2.9% 2.6% 2.3% $35,000 32.8% 16.4% 10.9% 8.2% 6.6% 5.5% 4.7% 4.1% 3.6% 3.3% $50,000 46.8% 23.4% 15.6% 11.7% 9.4% 7.8% 6.7% 5.9% 5.2% 4.7%
Tota
l Bor
row
ed
$65,000 60.9% 30.4% 20.3% 15.2% 12.2% 10.1% 8.7% 7.6% 6.8% 6.1% $80,000 74.9% 37.5% 25.0% 18.7% 15.0% 12.5% 10.7% 9.4% 8.3% 7.5% $95,000 89.0% 44.5% 29.7% 22.2% 17.8% 14.8% 12.7% 11.1% 9.9% 8.9% $110,000 103.0% 51.5% 34.3% 25.8% 20.6% 17.2% 14.7% 12.9% 11.4% 10.3% Repayment Burden Benchmark
0.0% 1.2% 7.5% 10.6% 12.5% 13.7% 14.6% 15.3% 15.8% 16.2%
% Payments not manageable % Payments w ithin 2 percentage points of manageable % Under standard repayment,
payments w ere not manageable

WHITE PAPER: STUDENT LOAN REPAYMENT 46
Appendix C Resources by Topic
All links current as of January 14, 2006 International Loan Program Information Global Debt Patterns, An International Comparison of Student Loan Burdens and Repayment Conditions. Alex Usher, September 2005. Available on the Educational Policy Institute Website: http://www.educationalpolicy.org/globaldebt.html Student Loan Programs: An International Comparison. Available on the International Comparative Higher Education Finance and Accessibility Project Website: http://www.gse.buffalo.edu/org/inthigheredfinance/publications_LoanChart.xls Higher Educational Accessibility and Financial Viability: The Role of Student Loans. D. Bruce Johnstone. 2005. Available on the International Education Finance and Accessibility Project Website: http://www.gse.buffalo.edu/org/inthigheredfinance/Publications/publications_HED_Accessibility_Viability_Student_Loans.pdf Australia Government of Australia Website: http://www.centrelink.gov.au/internet/internet.nsf/payments/sfss.htm Want to Know About Changes to HECS & PELS? Australian Government Department of Education, Science and Training. Available on the Going to Uni Website: http://www.goingtouni.gov.au/NR/rdonlyres/833E6C74-1D77-4088-ABA2-5B39647F1734/0/pre2005_brochure.pdf Our Universities, Backing Australia’s Future Fact Sheet. March 2004. Australian Government Department of Education Science and Training. Available on Our Universities, Backing Australia’s Future Website: http://www.backingaustraliasfuture.gov.au/fact_sheets/5.htm#d Higher Education Support Act of 200, Act 149 of 2003 with amendments 157 of 2004. Australian Government Attorney-General’s Department. Available on Comlaw (Commonwealth Law) Federal Register of Legislative Instruments Website: http://www.comlaw.gov.au/comlaw/Legislation/ActCompilation1.nsf/0/41340DD19F1E23F4CA256F840081C269/$file/HigherEducationSupport2003WD02.doc New Zealand 2005 Student Loan Repayment Worksheet. June 2005. Available on the New Zealand Inland Revenue Website: http://www.ird.govt.nz/resources/file/eb3f1a473d8ad06/ir767-2005.pdf Student Loan Repayment Threshold to Rise. December 22, 2005. Government media statement available on Scoop Independent News Website: http://www.scoop.co.nz/stories/PA0512/S00341.htm United Kingdom Student Finance Direct Website: http://www.studentsupportdirent.co.uk

WHITE PAPER: STUDENT LOAN REPAYMENT 47
Student Loans Company Limited Website: http://www.slc.co.uk/noframe/faqs/msrepay.html#defer Addendum to the Country Profile on Financing Higher Education in the United Kingdom. Available on the International Comparative Higher Education Finance and Accessibility Project Website: http://www.gse.buffalo.edu/org/IntHigherEdFinance/PDF/Addendum%20to%20UK%20country%20profile.pdf United Kingdom Department for Education and Skills Website: http://www.dfes.gov.uk/hegateway/ Higher Education Act of 2004, Chapter 8. Available on the United Kingdom Office of Public Sector Information Website: http://www.opsi.gov.uk/acts/acts2004/20040008.htm The Future of Higher Education and the Higher Education Bill 2004: Regulatory Impact Assessment. Available on the Department for Education and Skills Website: http://www.dfes.gov.uk/hegateway/uploads/final%20RIA%20V8.pdf Current U.S. Student Loan Programs and Policies General Information and Analysis Information for Financial Aid Professionals (IFAP) Library. Available on the Department of Education Website: http://www.ifap.ed.gov/IFAPWebApp/index.jsp Trends in Student Aid and Trends in Higher Education, The College Board. 2005. How Much Debt is Too Much? Defining Benchmarks for Manageable Student Debt. Sandy Baum and Saul Schwartz. November 2005. The Project on Student Debt and The College Board. Available on the Project on Student Debt Website: http://projectonstudentdebt.org/pub_home.php Options for Financially-Challenged Borrowers in Default, U.S. Department of Education, October 2004. Educational Attainment—People 25 Years Old and Over, by Total Money Earnings in 2004, Work Experience in 2004, Age, Race, Hispanic Origin and Sex. U.S. Census Bureau Current Population Survey (CPS). 2005 Supplement. Available on the U.S. Census Bureau Website: http://pubdb3.census.gov/macro/032005/perinc/new03_000.htm Median Earnings in the Past 12 Months by Sex by Educational Attainment for the Population 25 Years and Over. U.S. Census Bureau 2004 American Community Survey (ACS). Available on the U.S. Census Bureau Website: http://factfinder.census.gov/servlet/DTGeoSearchByListServlet?_lang=en&_ts=155245692177 A Study of 2004-2005 Beginning Officers, National Association of College and Employers (NACE). Volume 44, Issue 4. Fall 2005. Available on the NACE Website: http://www.naceweb.org Economic Hardship Economic Hardship Deferment Request, Information for Financial Aid Professionals (IFAP) Library. Available on the Department of Education Website: http://www.ifap.ed.gov/dpcletters/attachments/GEN0208NewAttFINALHRD2.pdf Medical Student Section, Economic Hardship Deferment. Available on the American Medical Association Website: http://www.ama-assn.org/ama/pub/category/12679.html Income Contingent Repayment Department of Education, Information for Financial Aid Professionals, Code of Federal Regulations (GPO Compilation), Website: http://www.ifap.ed.gov
WHITE PAPER: STUDENT LOAN REPAYMENT 48
Income Contingent Repayment Calculator. Available at the Finaid.org Website: http://www.finaid.org/calculators/icr.phtml. CBO Memorandum, Issues in Designing a Federal Program of Income-Contingent Student Loans. Congressional Budget Office, January 1994. Much Ado About a Very Small Idea, Straight Talk on Income-Contingent Loans. Alex Usher. January 2005. Available on the Educational Policy Institute Website: http://www.educationalpolicy.org/pdf/ICR.pdf Repay As You Earn. Philip G. Schrag. Bergin & Garvey: 2002. New Patterns For College Lending, Income Contingent Loans. D. Bruce Johnstone. A Ford Foundation Report. Columbia University Press, New York and London: 1972. Student Loan Interest Tax Deduction Student Loan Interest Deduction, Publication 970 (2005), Tax Benefits for Education. Available on the U.S. Internal Revenue Service Website: http://www.irs.gov/publications/p970/ch04.html An Income Contingent Student Loan Tax Credit. Thomas Kane. Presentation, Advancing America’s Competitiveness: The Role of Student Loans. Available on the Project on Student Debt Website: http://www.projectonstudentdebt.org/evt_view.php?idx=3 Extended, Graduated, and Income Sensitive Repayment Repayment Plans. Code of Federal Regulations (GPO Compilation), Title 34—Education, Chapter VI—Office of Postsecondary Education, Department of Education, Part 685—William D. Ford Federal Direct Loan Program, Section 685.208. pps.832-834. Available on the Department of Education Website: http://a257.g.akamaitech.net/7/257/2422/12feb20041500/edocket.access.gpo.gov/cfr_2004/julqtr/pdf/34cfr685.208.pdf Repayment of a Loan. Code of Federal Regulations (GPO Compilation), Title 34—Education, Chapter VI—Office of Postsecondary Education, Department of Education, Part 682 Federal Family Education Loan (FFEL) Program, Section 682.209. pps. 657-663. Available on the Department of Education Website: http://a257.g.akamaitech.net/7/257/2422/12feb20041500/edocket.access.gpo.gov/cfr_2004/julqtr/pdf/34cfr682.209.pdf Loan Consolidation, Income Sensitive Repayment. Available on the Sallie Mae Website: http://www.salliemae.com/school/faqs/consolidation_faq.html?Q=Q11#Q11 Loan Forgiveness Student Loan Forgiveness Programs. Gail McCallion. February 1, 2005. Congressional Research Service, The Library of Congress. Loan Forgiveness Programs. Available on the FinAid Website: http://finaid.org/loans/forgiveness.phtml Federal Perkins Loan Teacher Cancellation. Available on the U.S. Department of Education Federal Student Aid Website: http://studentaid.ed.gov/PORTALSWebApp/students/english/cancelperk.jsp?tab=repaying Teacher Loan Forgiveness Program-FFEL and Direct Loan Programs. Available on the U.S. Department of Education Federal Student Aid Website: http://studentaid.ed.gov/PORTALSWebApp/students/english/cancelstaff.jsp?tab=repaying

WHITE PAPER: STUDENT LOAN REPAYMENT 49
Nursing Education Loan Repayment Program. Available on the U.S. Department of Health and Human Services, Health Resources and Services Administration, Bureau of Health Professionals Website: http://bhpr.hrsa.gov/nursing/loanreguidance.htm#costs National Health Service Corps. Available on the U.S. Department of Health and Human Services, Health Resources and Services Administration, Bureau of Health Professionals Website: http://nhsc.bhpr.hrsa.gov/members/loan_repayors/ NIH Loan Repayment Programs. Available on the National Institute of Health Website: http://www.lrp.nih.gov/HomePage.aspx Americorps Education Award. Available on the Corporation for National and Community Service Website: http://www.americorps.org/for_individuals/benefits/benefits_ed_award.asp Benefits and Resources, Education in the Military. Available on the Military.com Website: http://www.military.com/Resources/ResourcesContent/0,13964,30833,00.html Enlisted and Officer Education, Money for School. Available on the U.S. Airforce Website: http://www.airforce.com Benefits, Money for Your Education. Available on the U.S. Army Website: http://www.goarmy.com/benefits/education_money.jsp Student Loan Repayment, Higher Education is Within Your Reach. Available on the U.S. National Guard Website: http://www.1800goguard.com/education/edu_student_loan.html ARNG Guide to Education Benefits. Servicemembers Opportunity College SOCGuard. February 2005. Available on the American Association of State Colleges and Universities Website: http://www.soc.aascu.org/pubfiles/gdmisc/EdGuide2005.pdf U.S. Military College Loan Repayment Program (CLRP). Available on the About Website: http://usmilitary.about.com/cs/joiningup/a/clrp.htm Federal Student Loan Repayment Program, Fiscal Year 2004 Report to the Congress. US Office of Personnel Management, April 2005. Student Loan Repayment for Federal Employees, CRS Report for Congress. Barbara L. Schwemle and Lorraine H. Tong. July 15, 2005. Congressional Research Service, The Library of Congress. Related Income Standards and Benchmarks Collection Financial Standards. Internal Revenue Service, U.S. Department of the Treasury. Available on the Internal Revenue Service Website: http://www.irs.gov/individuals/article/0,,id=96543,00.html HHS 2005 Poverty Guidelines. Available on the Department of Health and Human Services Website: http://aspe.hhs.gov/poverty/05poverty.shtml IRS 2005 Standard Deduction and Exemptions. Available on the Internal Revenue Service Website: http://www.irs.gov/publications/p501/ar02.html#d0e5825 and http://www.irs.gov/publications/p501/ar02.html#d0e3130 IRS 2005 Tax Rate Schedules, Single and Married. Available on the Internal Revenue Service Website: http://www.irs.gov/formspubs/article/0,,id=133517,00.html


![BURDENS OF PROOF AND QUALIFIED IMMUNITY€¦ · 2012] Burdens of Proof and Qualified Immunity 137 A. Burdens of Proof The first observation that must be made when discussing burdens](https://static.fdocuments.us/doc/165x107/5b408ec47f8b9a2f138d5242/burdens-of-proof-and-qualified-2012-burdens-of-proof-and-qualified-immunity.jpg)