Addressing Challenges of Equitable Health, … PublicHealthLecture.pdf · Addressing Challenges of...
70
Addressing Challenges of Equitable Health, Nutrition and Well-being in a rapidly Urbanizing India: An Imperative for Government, NGOs and Citizens September 6, 2013 Public Health Lecture, National Institute of Health and Family Welfare, Delhi Siddharth Agarwal Director Urban Health Resource Centre, India
Transcript of Addressing Challenges of Equitable Health, … PublicHealthLecture.pdf · Addressing Challenges of...

Addressing Challenges of Equitable
Health, Nutrition and Well-being in a
rapidly Urbanizing India: An
Imperative for Government, NGOs
and CitizensSeptember 6, 2013
Public Health Lecture,
National Institute of Health and Family Welfare,
Delhi
Siddharth Agarwal
Director
Urban Health Resource Centre, India
and Citizens
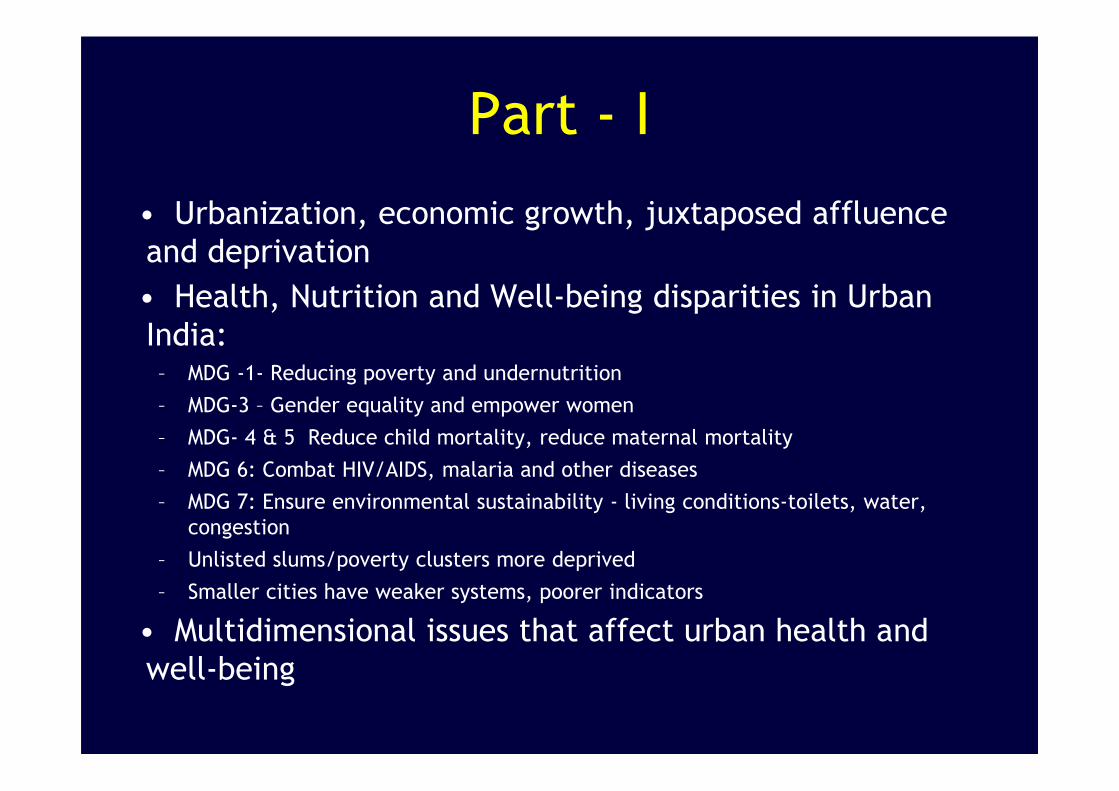
Part - I
• Urbanization, economic growth, juxtaposed affluence
and deprivation
• Health, Nutrition and Well-being disparities in Urban
India: – MDG -1- Reducing poverty and undernutrition
– MDG-3 – Gender equality and empower women– MDG-3 – Gender equality and empower women
– MDG- 4 & 5 Reduce child mortality, reduce maternal mortality
– MDG 6: Combat HIV/AIDS, malaria and other diseases
– MDG 7: Ensure environmental sustainability - living conditions-toilets, water,
congestion
– Unlisted slums/poverty clusters more deprived
– Smaller cities have weaker systems, poorer indicators
• Multidimensional issues that affect urban health and
well-being

India’s Urbanizing economy: Affluence and Deprivation Juxtaposed
• In India’s glittering cities opulence grows along with deprivation and poverty– 60% of Mumbai’s population lives on 8% of land [Parsuraman, S.
2007] and contribute to economy in diverse ways, living in severe congestion
– In Delhi, water-supply for planned colonies is 225 lpcd (liter per capita daily) and 50 lpcd for listed slums daily) and 50 lpcd for listed slums
• Urban poor contribute substantially to India’s economic growth:– Between 60- 90% of urban poor are involved in urban informal sector.– Urban sector contributes 60% -70% of GDP
Parsuraman, S - http://www.karmayog.org/urbandvlp/upload/21756/Newspaper-essays_Prarsuraman.pdf.
This indicates high density of living space for 60% living in slums, chawls, informal settlements.
Population density of Greater Mumbai (area under Municipal Corporation of Greater Mumbai) estimated at
24,812 (Mumbai Suburban district & Mumbai City district) persons per sq. km. as per Census 2011 .
Density of Mumbai City – 43,447 per sq. km.

Urban Population Growth in India
� During the 20th century, urban population multiplied more than 10 times.� Urban population projected to reach 535 million by 2026 (first quarter of 21st century).
MDG-1: Urban Poor- the fastest growing
segment of India’s Population
MDG-1: Urban Poor- the fastest growing
segment of India’s Population
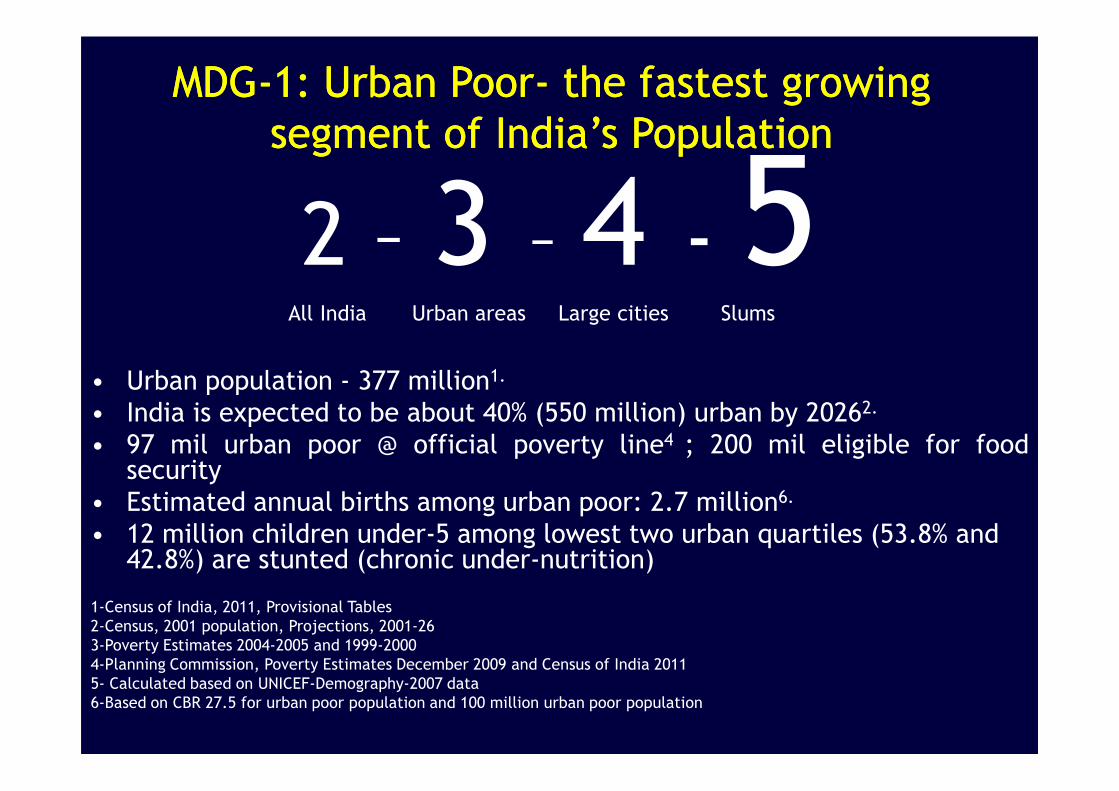
2 – 3 – 4 - 5All India Urban areas Large cities Slums
• Urban population - 377 million1.
• India is expected to be about 40% (550 million) urban by 2026
• Urban population - 377 million
• India is expected to be about 40% (550 million) urban by 20262.
• 97 mil urban poor @ official poverty line4 ; 200 mil eligible for foodsecurity
• Estimated annual births among urban poor: 2.7 million6.
• 12 million children under-5 among lowest two urban quartiles (53.8% and 42.8%) are stunted (chronic under-nutrition)
1-Census of India, 2011, Provisional Tables
2-Census, 2001 population, Projections, 2001-26
3-Poverty Estimates 2004-2005 and 1999-2000
4-Planning Commission, Poverty Estimates December 2009 and Census of India 2011
5- Calculated based on UNICEF-Demography-2007 data
6-Based on CBR 27.5 for urban poor population and 100 million urban poor population

MDG-1: Nutrition Health Disparities:
Nutrition Inequities among<5 yrs
6
Source: Re-analysis of NFHS-3(2005-06) by Wealth Index;UHRC,08
Household food insecurity is also as high as 50% among slum/informal settlements

MDG-2: 40 % urban poor children (6-17 years)
not attending school
MDG-2: 40 % urban poor children (6-17 years)
not attending school
60.3
83.476.6
50
60
70
80
90
%
50% boy and 54% girl children among urban poor in Delhi attended school.
0
10
20
30
40
50
Urban Poor Urban Non Poor Urban Average
NFHS-3, 2005

MDG-3: Gender Equality and Women’s
Empowerment
MDG-3: Gender Equality and Women’s
Empowerment
Women’s autonomy
• In Urban India, among poorest quartile, 42%women
had money for their own use, while among the rest of
the urban population 53% had money for use.
• Urban NFHS-3 analysis shows mothers’ education • Urban NFHS-3 analysis shows mothers’ education
attainment (secondary/higher education), financial
autonomy, and employment were associated with
increased probability of children's immunization

62.1
81.9
51.954.6
72.7
60
70
80
90
Per
cent
age(
%)
Evidence about Health Disparities:
MDG- 4: Low Child Survival among the Urban Poor
1.3 lakh children die each year before reaching the age of five
41.7
51.9
35.541.8
0
10
20
30
40
50
60
Infant Mortality Under-5 Mortality
Per
cent
age(
%)
Rural Average Urban Average Urban Poor Urban Non-poor
Source: Re-analysis of NFHS-3(2005-06) by Wealth Index;UHRC,08

<5 Mortality Across Different States:Poorest urban quartile vs urban overall
72.7
84.8
51.8
110.1
51.9
74.5
50.8
82.4
60.0
80.0
100.0
120.0
10
51.8
40.3
21
43.6
51.9 50.8
41.8
32.326.4
0.0
20.0
40.0
India Bihar Orrisa Uttar Pradesh Andhra Pradesh Maharashra Tamil Nadu
Urban Poor Urban
Source : UHRC’s analysis of National Family Health Survey, 2005-06
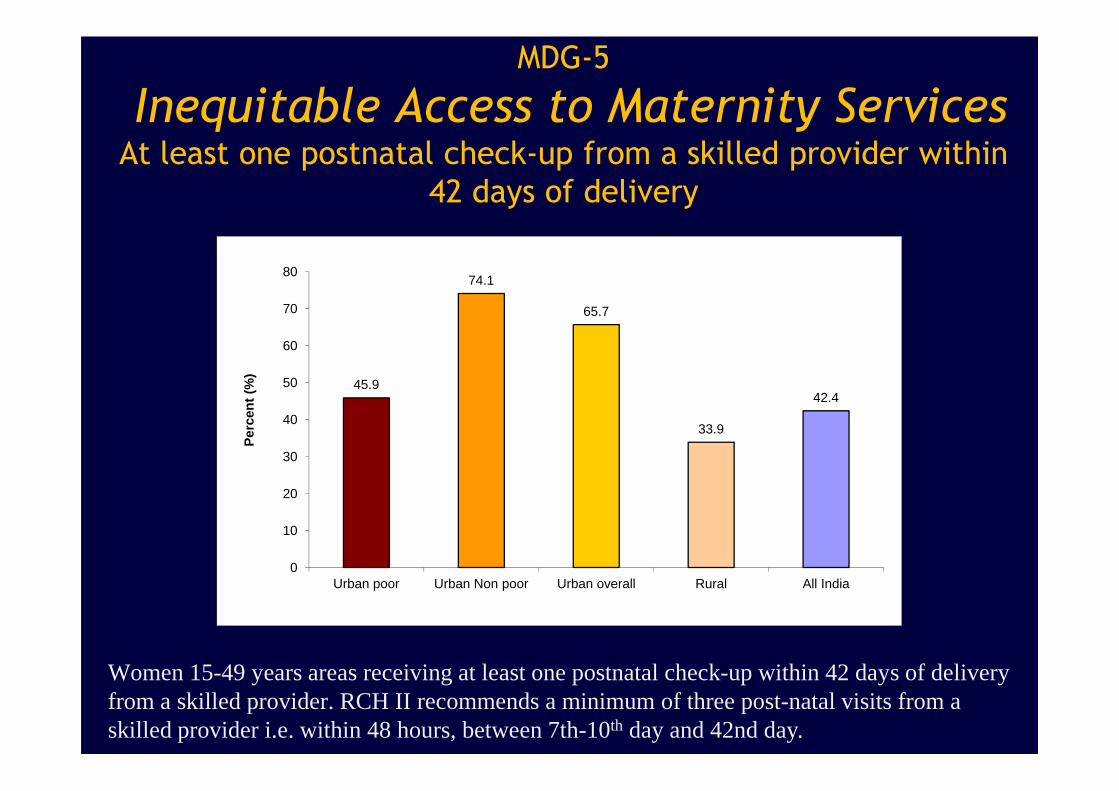
MDG-5
Inequitable Access to Maternity Services At least one postnatal check-up from a skilled provider within
42 days of delivery
45.9
74.1
65.7
42.450
60
70
80
Per
cent
(%
)
33.9
42.4
0
10
20
30
40
Urban poor Urban Non poor Urban overall Rural All India
Per
cent
(%
)
Women 15-49 years areas receiving at least one postnatal check-up within 42 days of delivery from a skilled provider. RCH II recommends a minimum of three post-natal visits from a skilled provider i.e. within 48 hours, between 7th-10th day and 42nd day.
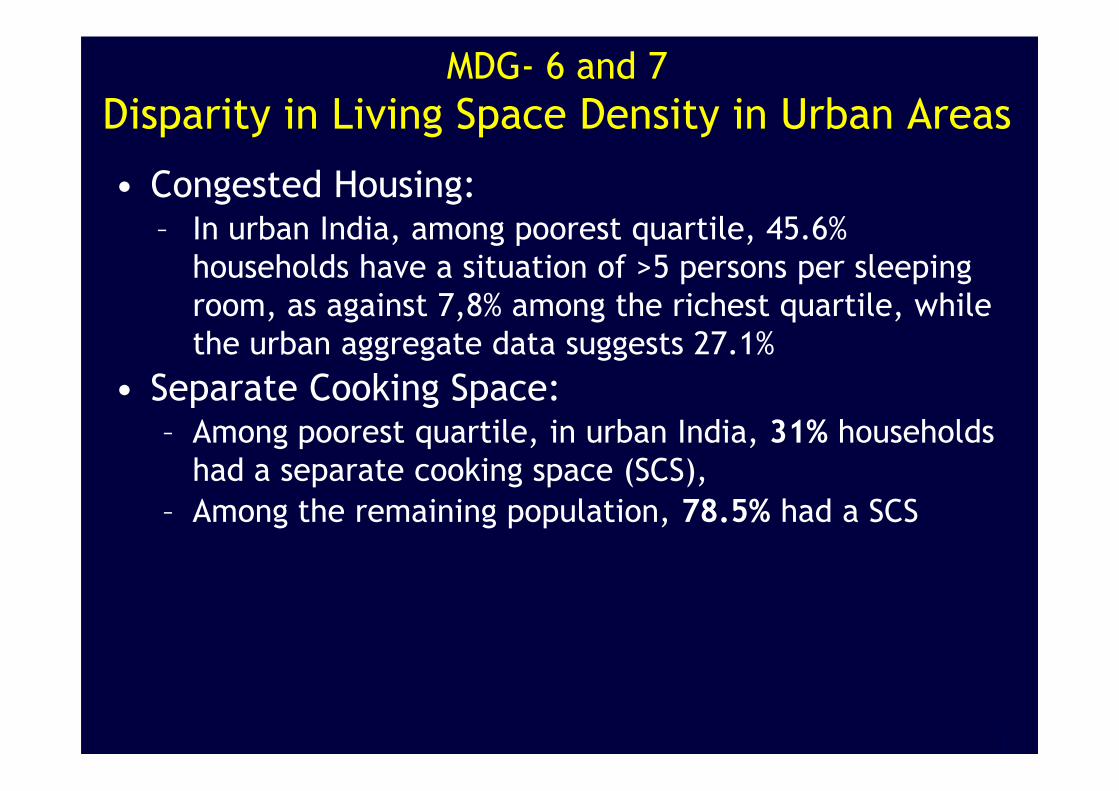
MDG- 6 and 7
Disparity in Living Space Density in Urban Areas
• Congested Housing: – In urban India, among poorest quartile, 45.6%
households have a situation of >5 persons per sleeping
room, as against 7,8% among the richest quartile, while
the urban aggregate data suggests 27.1%
• Separate Cooking Space:
1
• Separate Cooking Space:– Among poorest quartile, in urban India, 31% households
had a separate cooking space (SCS),
– Among the remaining population, 78.5% had a SCS

MDG-7
Percent of Households with NO Toilet facility
60
80
100City total Non-Slum Slum Poorest Quartile
0
20
40
Source: IIPS 8 cities study; 2009Slum/Non-slum denotes Census slum/non-slum.
In Urban India, among the poorest quartile, 52.8% households did not use a sanitary or pit toilet, while among the rest of the urban population 96% used a sanitary toilet.

More than three-fourth(82.5%)
of urban poor households do not
have access to piped water
supply
Poor Access to Piped Water SupplyPoor Access to Piped Water Supply
Source: Re-analysis of NFHS-3(2005-06) by Wealth Index;UHRC,2008

Housing and Physical Infrastructure
affects Health, Disease
• Tuberculosis prevalence among people living in houses
with >5 persons/sleeping-room is twice as high as those
living in houses with <4 persons/sleeping-room (423 vs
268 per 100,000).
• Tuberculosis prevalence among people living in houses • Tuberculosis prevalence among people living in houses
without separate cooking space was 2.2 times higher
than those living in houses with separate cooking space
(494 vs 223 per 100,000).
• Water collection in slums, homes leading to increased
incidence of dengue, chikungunya
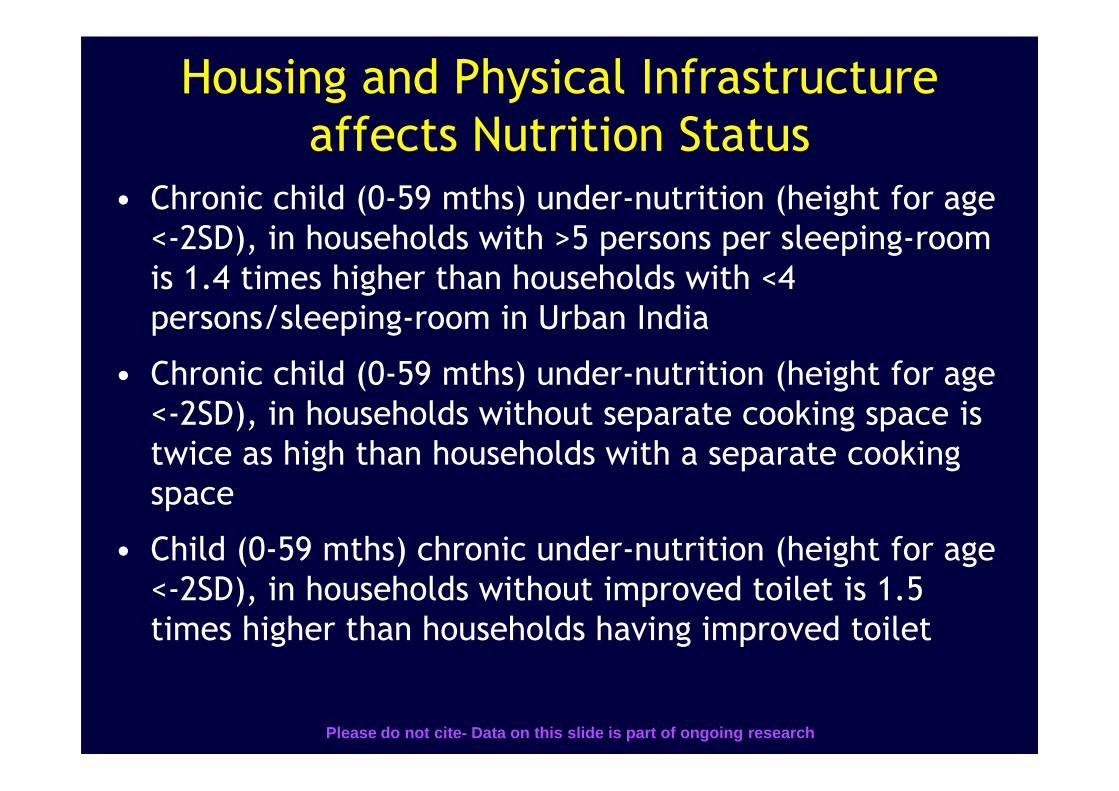
Housing and Physical Infrastructure
affects Nutrition Status
• Chronic child (0-59 mths) under-nutrition (height for age
<-2SD), in households with >5 persons per sleeping-room
is 1.4 times higher than households with <4
persons/sleeping-room in Urban India
• Chronic child (0-59 mths) under-nutrition (height for age
<-2SD), in households without separate cooking space is <-2SD), in households without separate cooking space is
twice as high than households with a separate cooking
space
• Child (0-59 mths) chronic under-nutrition (height for age
<-2SD), in households without improved toilet is 1.5
times higher than households having improved toilet
Please do not cite- Data on this slide is part of on going research
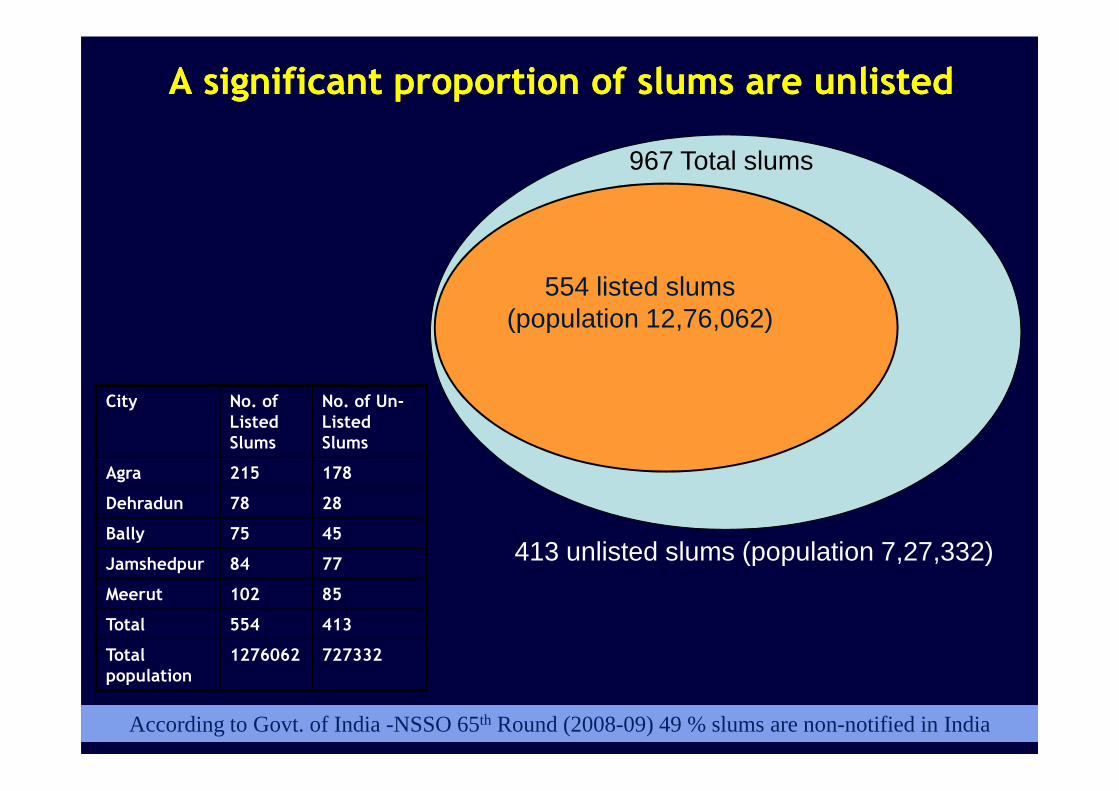
A significant proportion of slums are unlisted A significant proportion of slums are unlisted
554 listed slums (population 12,76,062)
967 Total slums
City No. of No. of Un-
17
413 unlisted slums (population 7,27,332)
According to Govt. of India -NSSO 65th Round (2008-09) 49 % slums are non-notified in India
City No. of Listed Slums
No. of Un-Listed Slums
Agra 215 178
Dehradun 78 28
Bally 75 45
Jamshedpur 84 77
Meerut 102 85
Total 554 413
Total population
1276062 727332
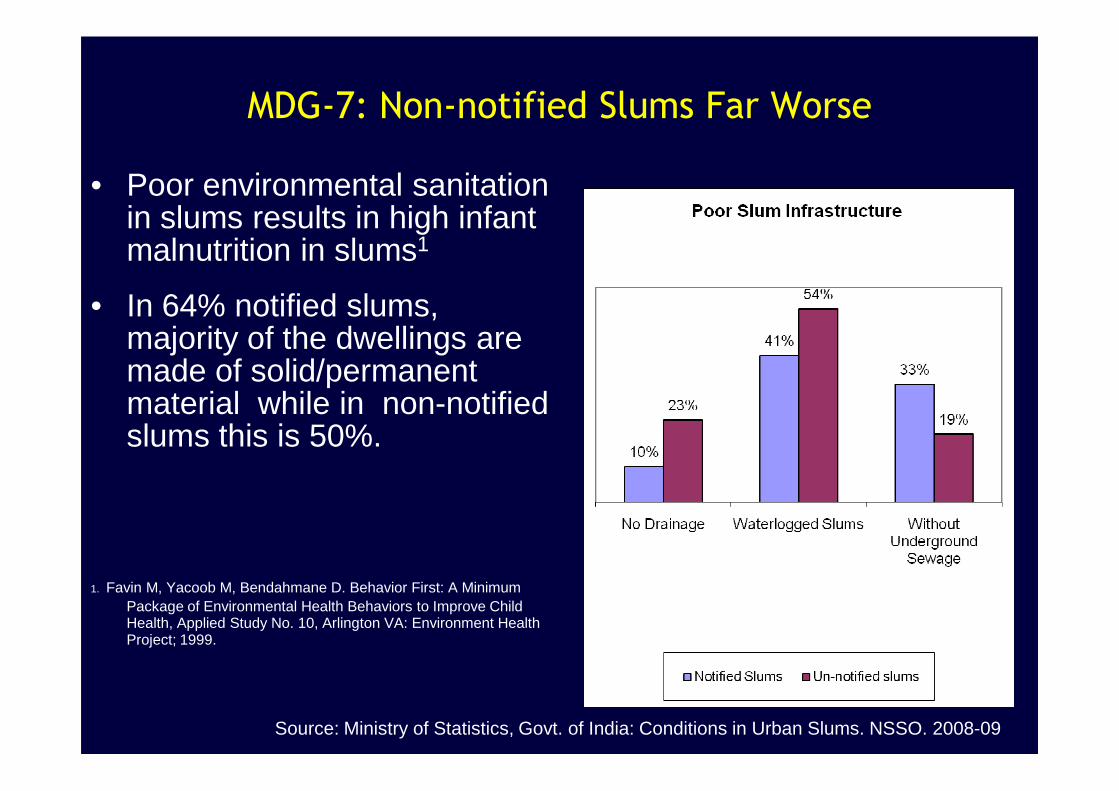
MDG-7: Non-notified Slums Far Worse
• Poor environmental sanitation in slums results in high infant malnutrition in slums1
• In 64% notified slums, majority of the dwellings are made of solid/permanent material while in non-notified material while in non-notified slums this is 50%.
1. Favin M, Yacoob M, Bendahmane D. Behavior First: A Minimum Package of Environmental Health Behaviors to Improve Child Health, Applied Study No. 10, Arlington VA: Environment Health Project; 1999.
Source: Ministry of Statistics, Govt. of India: Conditions in Urban Slums. NSSO. 2008-09

Smaller Cities and Towns more vulnerable
U5 MR among Urban Poor Across Different City Sizes
Under-five Mortality Rate Among the Urban Poor Acro ss Different Size Class of Cities, India, 2005-06.
57.7 61.3
74.7
50
60
70
80
19
0
10
20
3040
50
Large / Capital cities Small cities Towns
Source : UHRC’s analysis of National Family Health Survey, 2005-06
Large city - more than 1 million; Small City – 100,000 to 1 million; Town - less than 100,000
The category of large city / capital city includes all capital cities of Indian States

43.8
52.357.7
50
60
70
Infant Mortality Rate Across Different Size Class of Cities
Smaller Cities and Towns more vulnerable
IMR among Urban Poor Across Different City Sizes
20
0
10
20
30
40
Large / Capital cities Small cities Towns
Source : UHRC’s analysis of National Family Health Survey, 2005-06

47.2
62.3
50
60
70
% Households having no toilet facility
68.1
55.457.1
50
60
70
80
% Households having piped water supply
Smaller Cities and Towns more vulnerable
MDG-7: Differential Access of Urban Poor to Water and
Sanitation Across Different City Sizes
2
34.1
0
10
20
30
40
Large / Capital City Small City Town0
10
20
30
40
Large / Capital City Small City Town
Large city - more than 1 million; Small City – 100,000 to 1 million; Town - less than 100,000
The category of large city / capital city includes all capital cities of Indian States
Source : UHRC’s analysis of National Family Health Survey, 2005-06
Multidimensional issues that
affect sustainable urban
development development

FactorsFactorsFactorsFactors Situation Affecting Vulnerability in SlumsSituation Affecting Vulnerability in SlumsSituation Affecting Vulnerability in SlumsSituation Affecting Vulnerability in SlumsHousing Permanent, less permanent, not permanent material, separate cooking
space, ventilation, overcrowdingServices Water supply, Toilet, drainage, Electricity
Land status, location Secure or insecure land tenure, location on Municipal/Govt. land, or private land, hazardous location, low-lying areas
Access and use of public health services
Lack of access to primary health and Hospital services, poor quality of health services, nutrition, food security services
Multi-factorial Vulnerability in Slums1
Hidden / Unlisted Slums Many slums are not notified in official records and remain outside the purview of civic and health services
Past Infrastructure intervention in the slums
If an infrastructure project ahs been implemented reasonably well, some slums have better roads, community halls, other infrastructure
Alcohol, gambling joints, gender inequity
These affect the extent of depletion from alcohol, domestic violence, gender inequity, uncomfortable social environment
Negotiating Capacity Lack of organized community collective efforts in slums and absence of active, aware individuals who can be the voice of the community.
1Taneja S and Agarwal S. 2005, All Slums are Not Equal, Indian Pediatircs

Feasible Indicators & definitions to compare neighbourhoods
Domain 1:Housing & Physical
Environment
Domain 2:Social and Human
Development
Domain 3:Poverty & Economics
Domain 4:Governance
1. Sanitation facility(At home/community toilet)2. Water facility(At home/community)
1. Coverage of outreach health services
2. Number of hospital deliveries
3. Coverage by AWC4. No. of Families with
1. Regularity in getting livelihood
2. Access to fair credit3. Working women (at
home/outside) to support family income
1. Active community group in slum
2. Slum map available with Community group
3. Community group supports
So
cia
l D
ete
rmin
an
ts o
f H
ea
lth
Social Determinants of Urban Health and Well-Being
(At home/community)3. Road Condition4. Drain Condition5. Garbage collected regularly 6. Solid waste disposal7. Use of coal/wood as cooking fuel8. HH Electricity Connection
4. No. of Families with food subsidy cards (Ration Cards)
5. Children completing primary education
6. Tobacco consumption (smoking and chewing)
7. Alcohol consumption8. Gambling9. Access to ration Shop10. Tuberculosis11. Domestic Violence12. Pregnancy < 18 years
support family income4. Secure Tenure5. Families having ID6. Type of Roof/wall of
House
3. Community group supports government machinery in improving access to schemes/services
4. Community grouphave submitted collective application to civic authorities in past year
5. Community groupparticipated and discussed problem in Jan Sunvai (Public Hearing)
6. Community group succeed in improving household service/entitlement
So
cia
l D
ete
rmin
an
ts o
f H
ea
lth
Indian adaptation of WHO’s Urban Health Equity and Response Tool by UHRC

HealthDept.
Municipal CorporationWater, Sanitation, roads
Ward level Politicians
Inter-play of Different Sectors and Actors
Labour Dept
Dept. Women & Child Welfare Ministry
NGOs working for Slum well-being
Slum Women’s Grps/CBOs
Ward level Politicians
Urban Planners
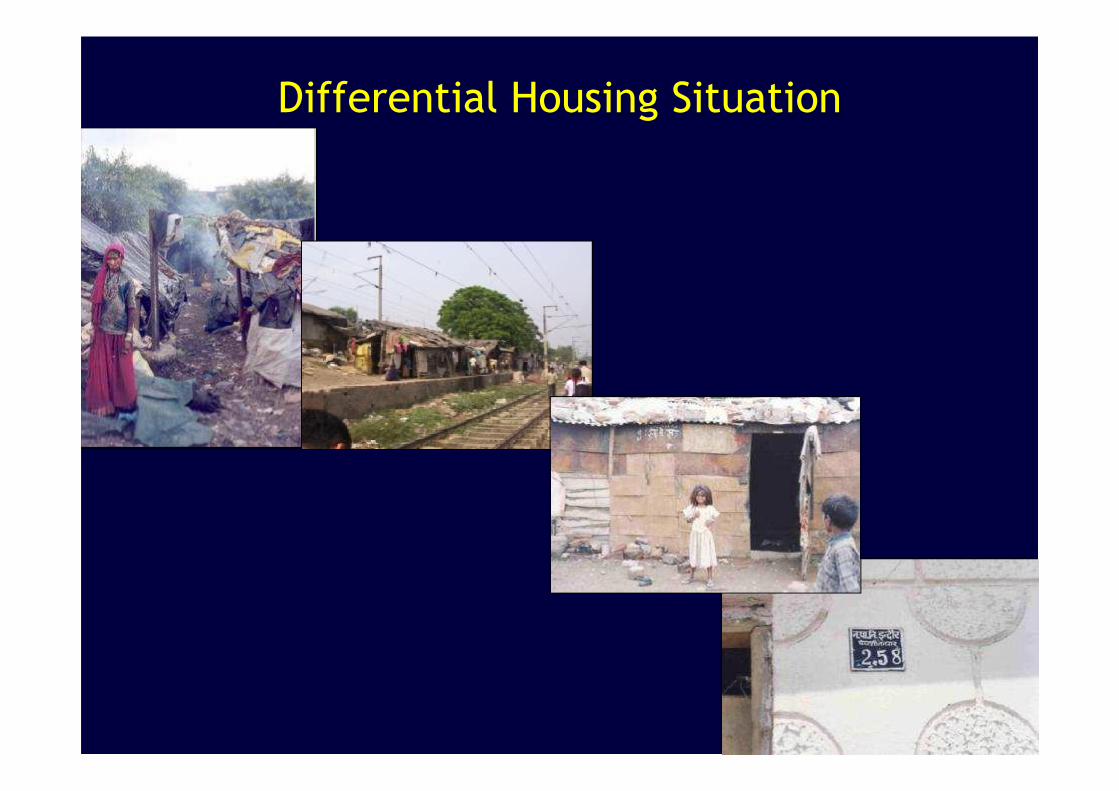
Differential Housing Situation

Environmental Scenes of an Urbanizing World
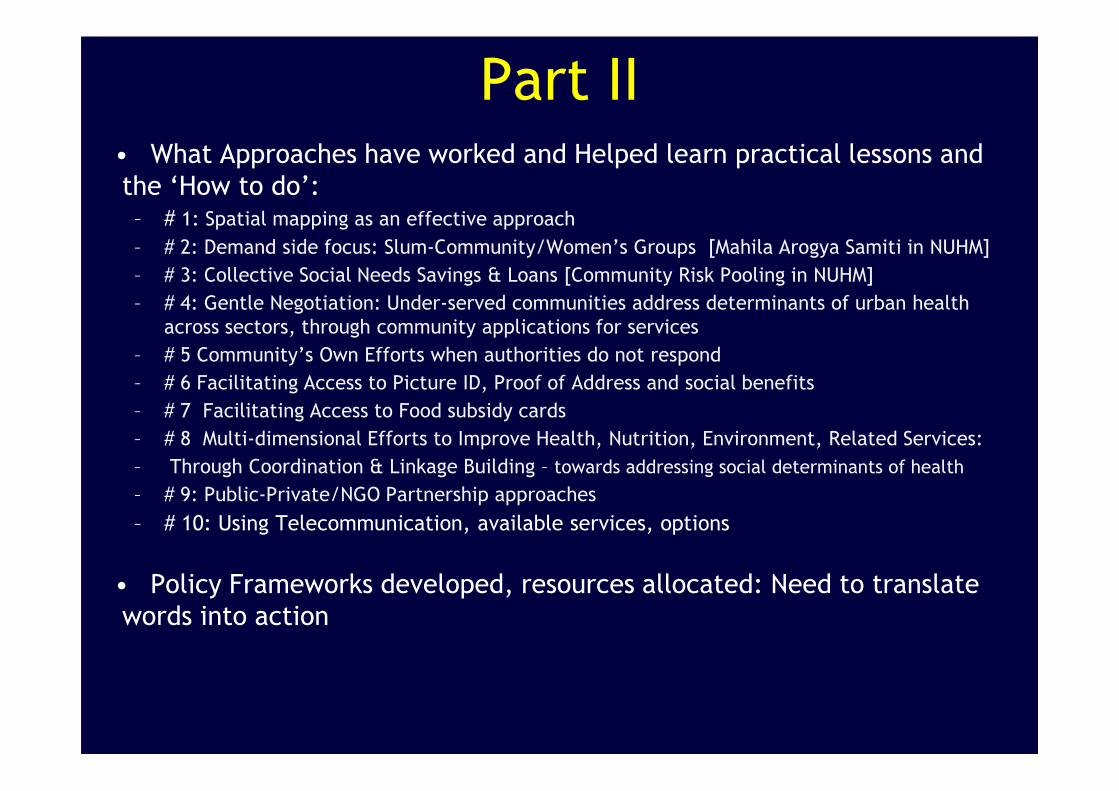
Part II• What Approaches have worked and Helped learn practical lessons and
the ‘How to do’:– # 1: Spatial mapping as an effective approach
– # 2: Demand side focus: Slum-Community/Women’s Groups [Mahila Arogya Samiti in NUHM]
– # 3: Collective Social Needs Savings & Loans [Community Risk Pooling in NUHM]
– # 4: Gentle Negotiation: Under-served communities address determinants of urban health
across sectors, through community applications for services
– # 5 Community’s Own Efforts when authorities do not respond
– # 6 Facilitating Access to Picture ID, Proof of Address and social benefits
– # 7 Facilitating Access to Food subsidy cards
– # 8 Multi-dimensional Efforts to Improve Health, Nutrition, Environment, Related Services:
– Through Coordination & Linkage Building – towards addressing social determinants of health
– # 9: Public-Private/NGO Partnership approaches
– # 10: Using Telecommunication, available services, options
• Policy Frameworks developed, resources allocated: Need to translate
words into action

Approach 1 (a): Spatial City Mapping
Mapping helps inclusion of unlisted slums/ clusters
LOCATION OF SLUMS
Slum Number Population
Listed 215 538322
Unlisted 178 303251
Total 393 841573Agra City

Mapping Helps Inclusion of Unlisted Slums/Clusters
Contd….
SLUM NUMBER POPULATION
LISTED 102 455923
UNLISTED 85 216935
TOTAL 187 672858
LOCATION OF SLUMS
Meerut City
3Spatial city mapping of vulnerable clusters integral strategy of NUHM
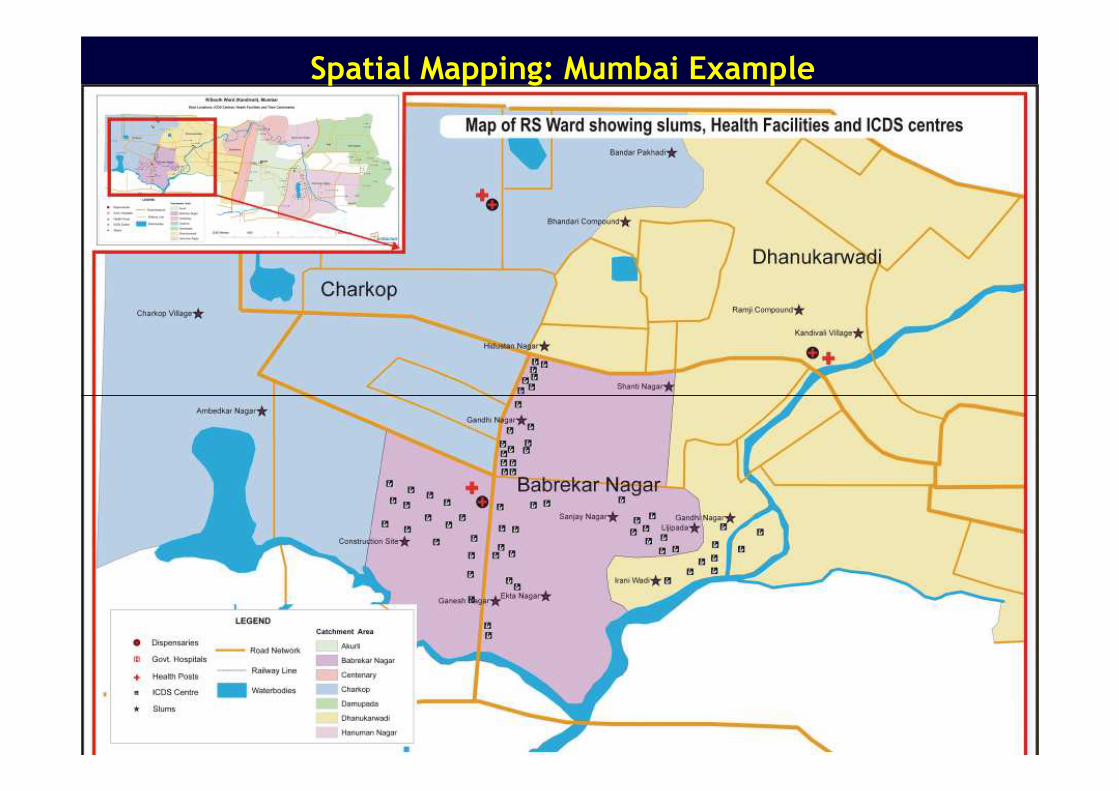
Spatial Mapping: Mumbai Example
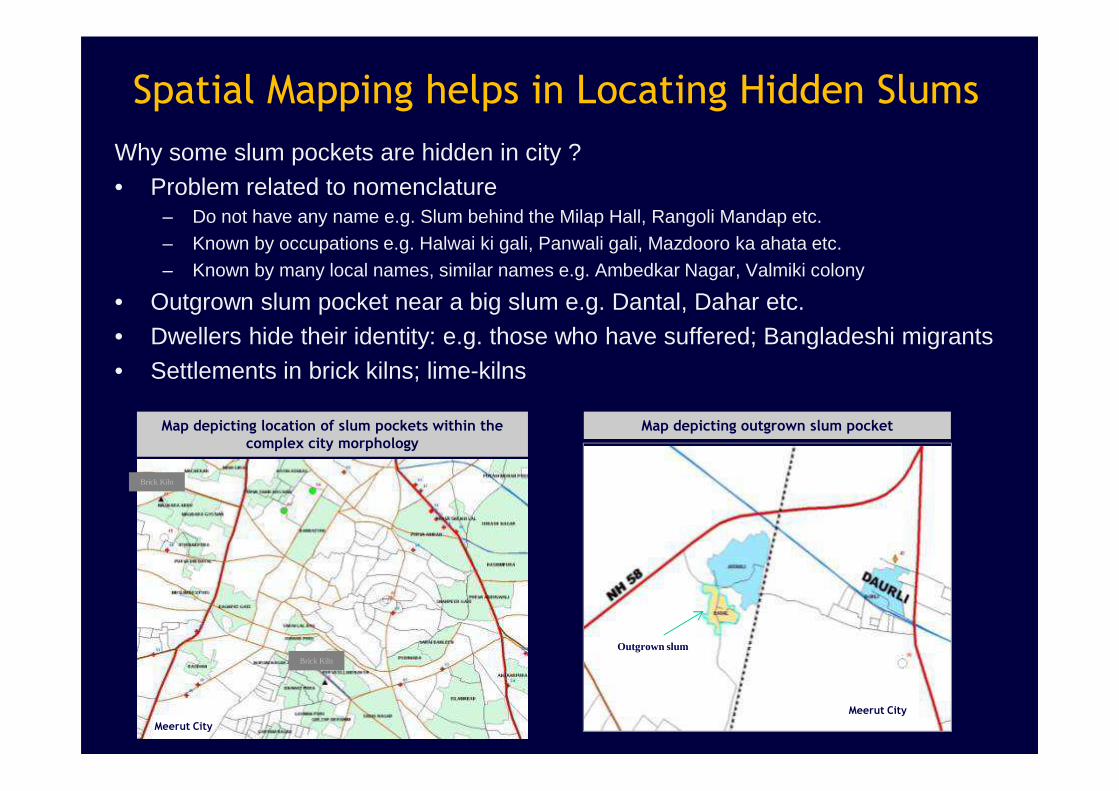
Spatial Mapping helps in Locating Hidden Slums
Why some slum pockets are hidden in city ?• Problem related to nomenclature
– Do not have any name e.g. Slum behind the Milap Hall, Rangoli Mandap etc.– Known by occupations e.g. Halwai ki gali, Panwali gali, Mazdooro ka ahata etc.– Known by many local names, similar names e.g. Ambedkar Nagar, Valmiki colony
• Outgrown slum pocket near a big slum e.g. Dantal, Dahar etc.• Dwellers hide their identity: e.g. those who have suffered; Bangladeshi migrants• Settlements in brick kilns; lime-kilns
Map depicting outgrown slum pocket
Meerut City
Map depicting location of slum pockets within the complex city morphology
Meerut City
Outgrown slumBrick Kiln
Brick Kiln

Community groups in slums prepare maps to
a) Ensure that no family is left out from lists used for housing, food
subsidy, other entitlements;
b) Track access to health services e.g. Immunization and ANC , HIV
testing,
c) Help identifying and providing services/linkage to recent migrants
Approach:1 (b)
Demonstrate uses of Neighborhood Mapping
3


Map showing community & household Infrastructure

Federation or Congress of slum women’s groups gives stronger voice and greater negotiation power
Approach 2: Demand side strategies:Slum-Community/Women’s Groups as agents of change
Federations of Women’s Groups
Women’s groups are Mahila Arogya Samitis mandated in NUHM

Network of slum-based community groups in Indore and Agra
UHRC Indore/Agra
Training, Monitoring, Supervision &
problem solving
1 Project coordinator 2 Field coordinators
Linkage with Civic Authorities
• 8 to 23 women groups in a large slum cluster
• 10-14 members per group• 30 to 70,000 slum
population per federation
5 Federation 7-37 members (1 per
group)(has office bearers,
bank account, registered NGO)
UHRC Delhi
Grant to Federation
ProgrammeMonitoring

(for Health and related Emergency, Child Education, Starting a small business, purchasing food grains, Marriage, getting assets back from money lenders)
Approach 3: Building skills, self-reliance, confidence:Collective Social Needs Savings and Loans
This approach is a mandated in NUHM as ‘Collective Risk Pooling’
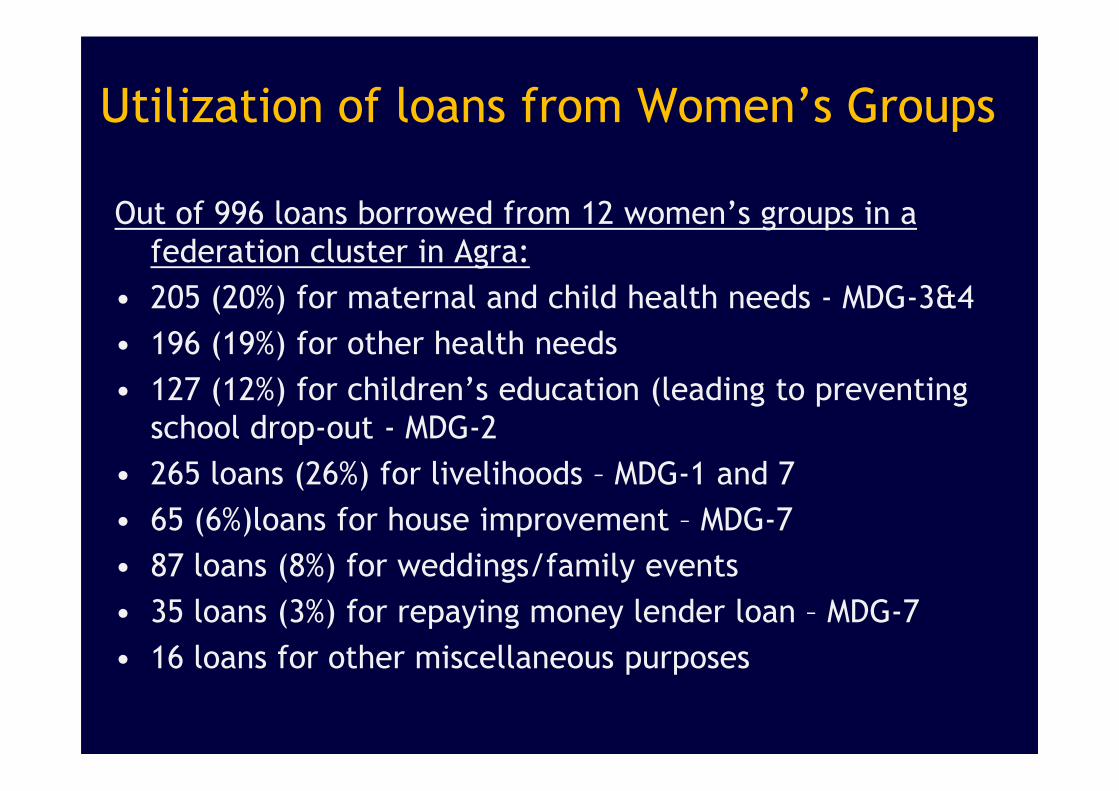
Utilization of loans from Women’s Groups
Out of 996 loans borrowed from 12 women’s groups in a
federation cluster in Agra:
• 205 (20%) for maternal and child health needs - MDG-3&4
• 196 (19%) for other health needs
• 127 (12%) for children’s education (leading to preventing • 127 (12%) for children’s education (leading to preventing
school drop-out - MDG-2
• 265 loans (26%) for livelihoods – MDG-1 and 7
• 65 (6%)loans for house improvement – MDG-7
• 87 loans (8%) for weddings/family events
• 35 loans (3%) for repaying money lender loan – MDG-7
• 16 loans for other miscellaneous purposes

Approach 4: Gentle Negotiation through Collective PetitionsWritten requests to officers of Health Dept, Nutrition Dept, Environmental
Petition
Response of Civic Authority

Letter in support of petition/request by politician


Cleaner Drains
During 2012-2013: 120,000 slum population benefited (Agra + Indore) from cleaning of drains

During 2012-2013: 4000 slum population benefited (Agra + Indore) from electricity connections

Improvement of Slum Pathways, Lanes
During 2012-2013: 33,800 slum population benefited (Agra + Indore) from roads paved

During 2012-2013: 6832 slum populationbenefited (Agra) from water supply
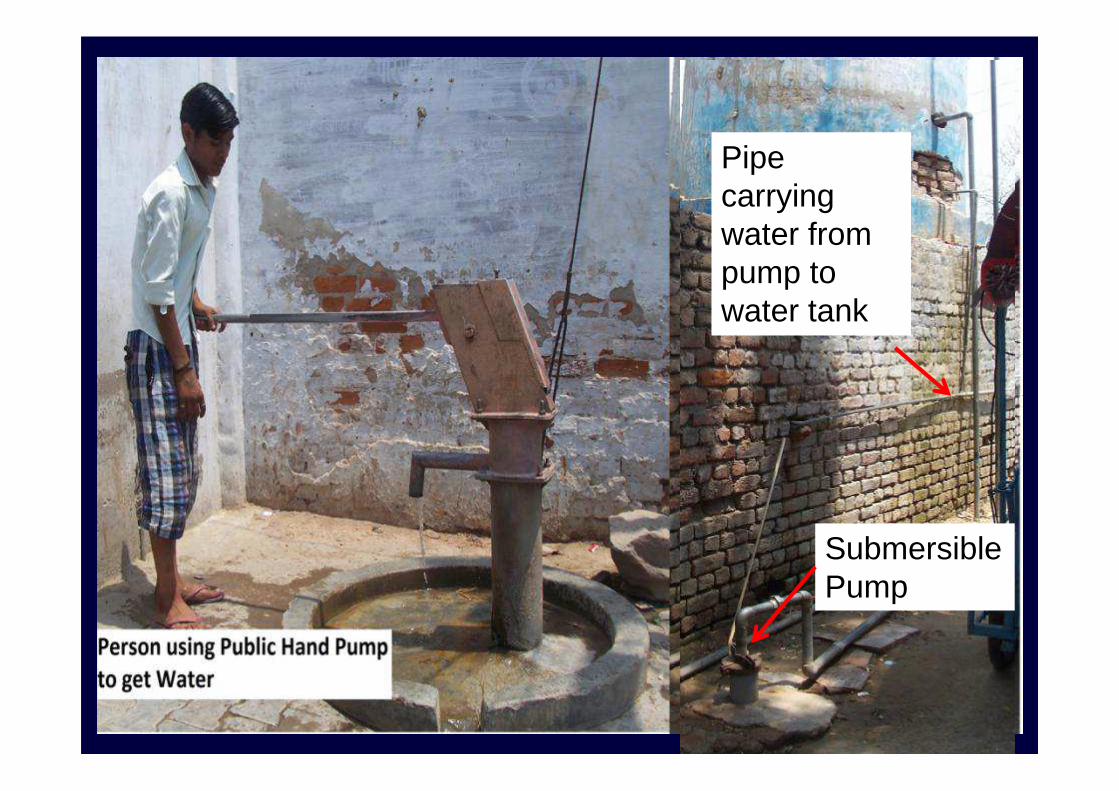
Pipe carrying water from pump to water tank
Submersible Pump

Approach # 5 Community’s Own Efforts
Community Contributes to build, re-build vital bridge
in Banganga Area, Indore
Before Oct’11
Oct’11 Aug’11 Oct’12

Elevating House Plinth to prevent rain-
water entering house
Rain water enters house
Rain water does not enter elevated house

Approach # 6
Perseverant Efforts to enable
Picture ID, Proof of Address, Picture ID, Proof of Address,
Certificate of Birth Date

Women showing their UID-Aadhaar CardsPicture ID and Proof of Address
During Apr 12 – Mar 13: 2000 persons applied for UID Adhaar
cards, 1200 received UID cards.
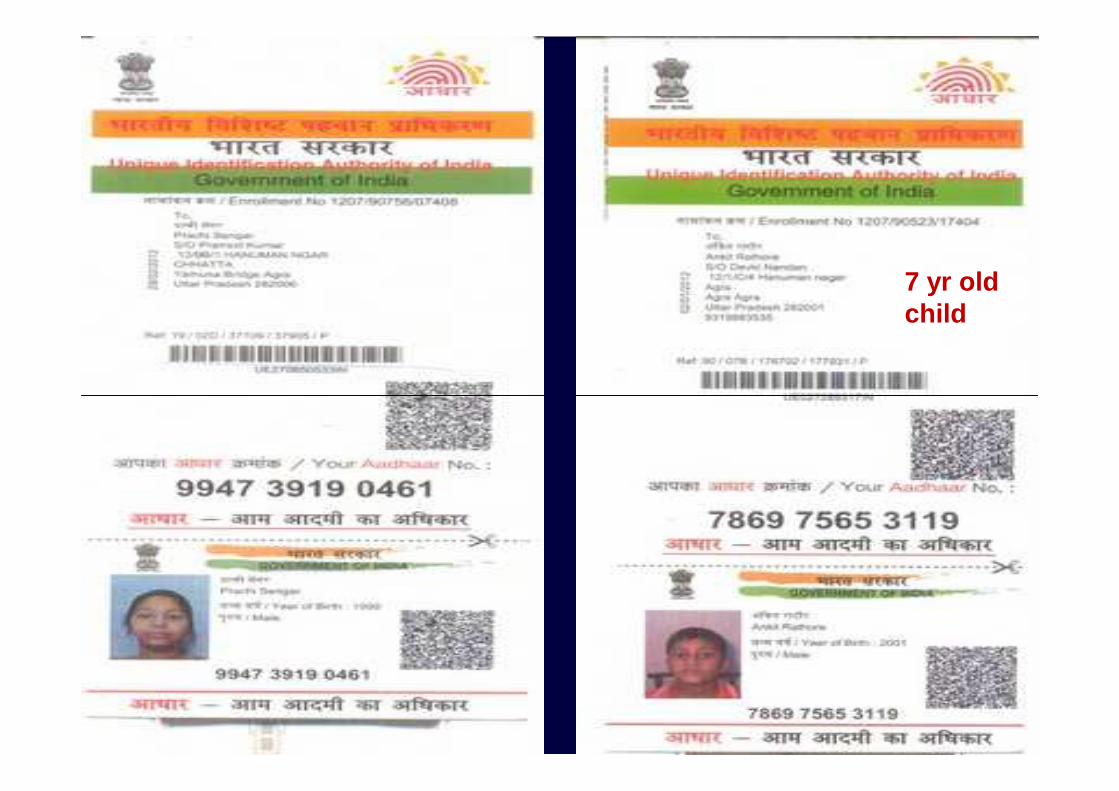
7 yr old child


Voter ID Card Another Picture ID and Proof of Address
During Apr 12 – Mar 13: 700 persons applied for Voter ID Cards, 452 received

Birth Certificate[Required to applying for child education related benefits

Approach # 7
Efforts towards Translating
Mandate into Reality: Food Mandate into Reality: Food
Subsidy Cards and Social
Benefit Schemes

Below Poverty Line Food Subsidy Card

Above Poverty Line Food Subsidy Card
During 2012-2013: applications of 88 families were facilitated. 51 received APL cards
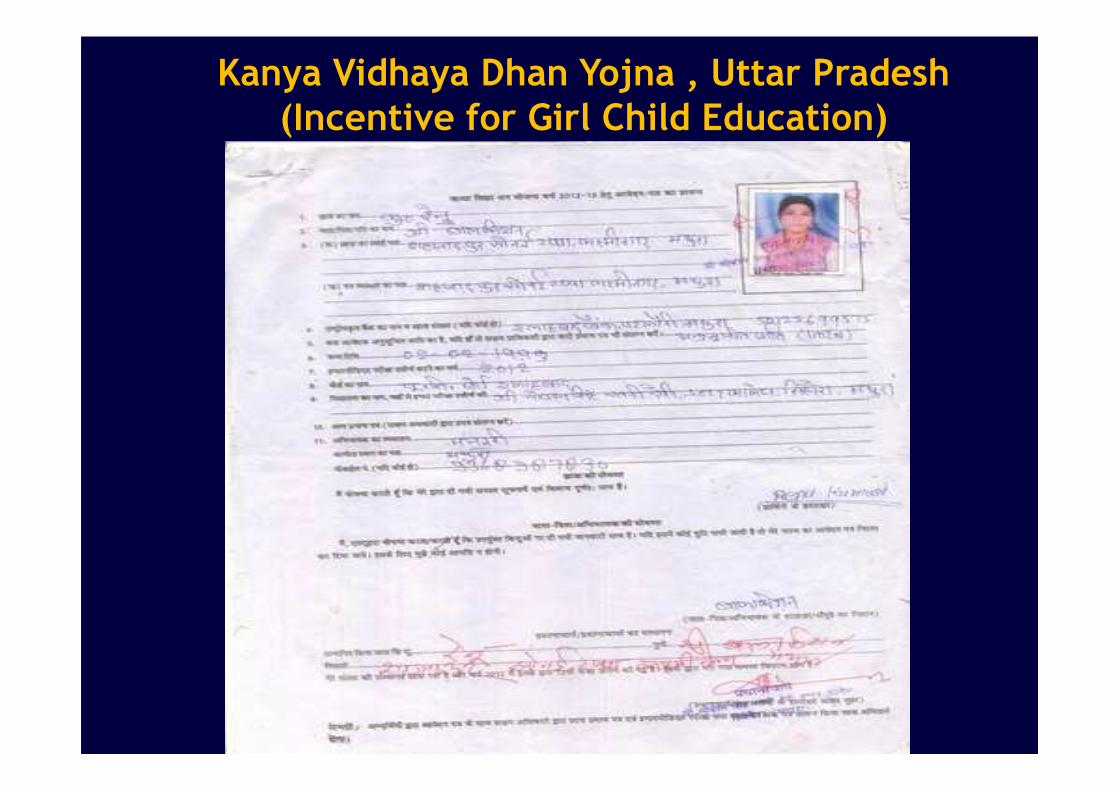
Kanya Vidhaya Dhan Yojna , Uttar Pradesh(Incentive for Girl Child Education)

Ladili Laxmi Yojna, Indore, M.P(Incentive for Girl Child Education)

Dept. WCDICDS, Girl Child Benefit,
Others
Health DeptANC, Immunization
JSY,Other services
PoliticiansVoice, support for
# 8: Multi-dimensional Efforts to Improve Health
and Related Services:
Through Coordination & Linkage Building
Municipal Corprn/JNNUR-
Roads, drains,
Federation of Women’s Groups
Dist. Magistrate’s OfficeSocial Assistance ProgramsOld Age & Widow Pension
Food Subsidy BPL, APL Cards
Labour DeptDomestic worker
registration
Voice, support for applications
Roads, drains,water., toilet, tenure,
housing
OthersVoter ID, Adhar,
Domicile Certificate,
caste Certificate
UHRC Indore/Agra

Outreach
8-10,000urban poor
Outreach
8-10,000
Outreach
Approach 9:Public-Private Partnership Approach (a)
NGOs Providing Primary and Second tier Health Services
Govt. contracts hospital toprovide outreach, OPD and
Referral services
6e.g., Govt. of Assam’s partnership with Marwari Mat ernity Hospital (Guwahati), Govt. of Tamil Nadu’s & Chennai Corporation’s partnership wi th Voluntary Health Services
Outreach
8-10,000
Outreach
8-10,000
Outreach
8-10,000
Government
1. Equipment costs2. Vaccine3. Other supplies4. Coordination

Public-Private Partnership Approach (b)NGOs rent Private Building & provide Urban Health Centre Services
NGO
na
gement o f UHC (rentedANM and all servi
Periodic CoordinationPeriodic CoordinationPeriodic CoordinationPeriodic Coordination
Outreach
8-10,000
Outreach
8-10,000
Outreach
SuppliesMonitoring
Demand Generation
6
Man
a ted),
MO, A
N services
GOVERNMENTOutreach
8-10,000
Outreach
8-10,000
Outreach
8-10,000
Monthly Reports
Technical support for capacity building, coordinati on and system strengthening
Referral to Identified FRUs/Charitable Trust
Demand Generation
Six NGOs run 21 UHCs in 4 cities in Uttrakhand, India

# 10: Using Telecommunication, available services, options
Trained slum volunteersprovide preventive, health education and referral
Prompt transport
Health Facility
education and referral
services for the poor
UHC with newborn care
facility
Socially committed private doctors
Upgraded hospitals with Maternity care
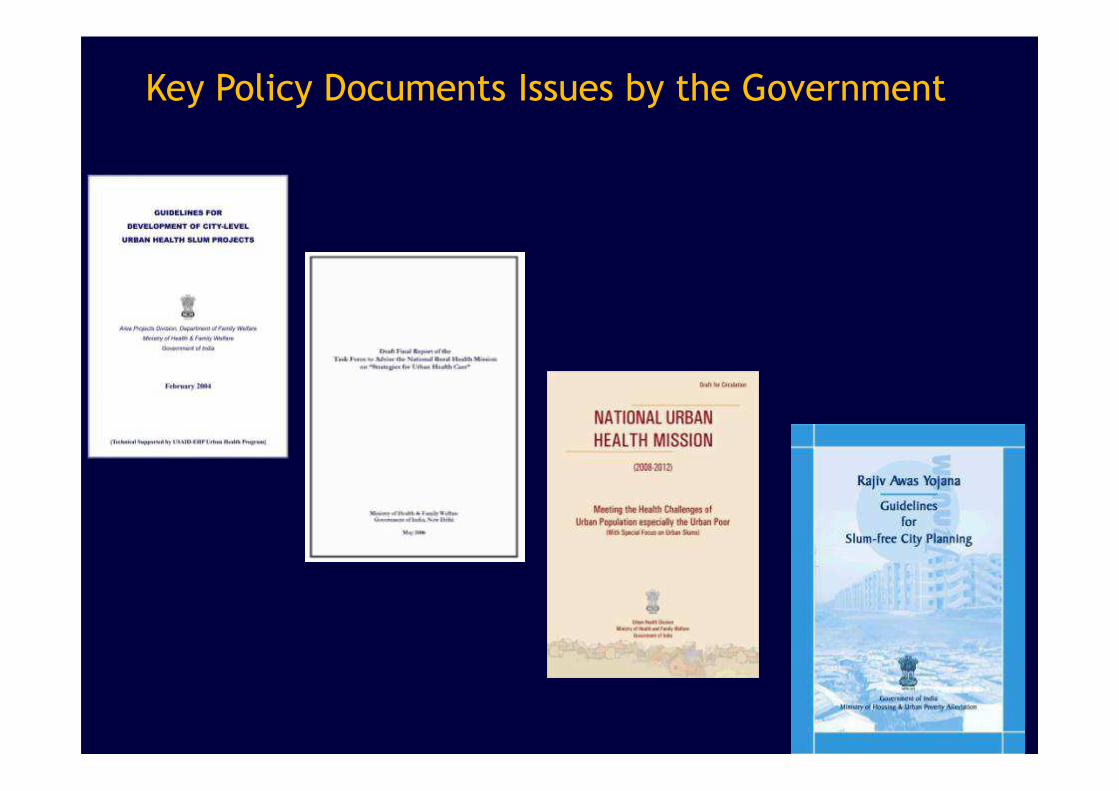
Key Policy Documents Issues by the Government

– Circular from Health Ministry to States to prepare city maps with listed and unlisted poverty clusters, 2008
– Mandate for including unlisted poverty clusters for Govt. of India’s urban poor housing initiative (Rajiv Awas Yojana, Dec. 2010)
Positive Policy Environment towards Urban
Services and Inclusion of Urban Poor
66
– National Urban Health Mission included in 11the Five Yr plan and re-launched in 12th Five Yr Plan (2012) mandates inclusion of unlisted slums
– Ministry of Women and Child Development directive in March 2012 states extension of ICDS services to unlisted slums

Policy Frameworks developed, Resources
Allocated
• Policy frameworks are in place, resources have been
announced: 12th Five Yr Plan, NUHM, Rajiv Awas
Yojana, Revamped ICDS
• Let us not forget the realities:
– Urban poor constitute the fastest growing
segment of India’s populationsegment of India’s population
– Approx 2.3 million births take place among the
urban poor every year in India
• Are we missing something?
6

Urgent need to Urgent need to
Translate Words Translate Words
into Real Actioninto Real Action
Recall the face of the poorest and the weakest man/womanwhom you may have seen and ask yourself,
if the step you contemplate is going to be of any use to her/him.
Will s/he gain anything by it?Will it restore him/her to a control over his/her own life and
destiny?In other words,
will it lead to Swaraj (freedom) for the hungry and starving millions?
-- Gandhi ji, 1947

Functioning,Accountable Program for
Urban Health,
With Hope and ConfidenceWith Hope and Confidence
70
Urban Health, Nutrition and
Well-being
Long Lever of :a) Complementary skills, Knowledge, Experiencea) Commitment , Motivationb) Understanding of problemsc) Accountability, responsibility
“A small body of determined spirits fired by an “A small body of determined spirits fired by an unquenchable faith in their mission, can alter the unquenchable faith in their mission, can alter the course of history”course of history” -- Mohandas Mohandas KaramchandKaramchand Gandhi Gandhi
www.uhrc.in ; [email protected]
Public Health Professionals, Govt. Managers, Public & Private
Sectors, slum CBOs,Civil Society