Adding Value from Fiber to Fabric · USTER ® QUANTUM clearer. • Launch of a new USTER ® ZWEIGLE...
132
Uster Technologies Ltd | Annual Report 2010 Adding Value from Fiber to Fabric Uster Technologies AG | Geschäftsbericht 2010 Wertschöpfung von der Faser bis zum Stoff
Transcript of Adding Value from Fiber to Fabric · USTER ® QUANTUM clearer. • Launch of a new USTER ® ZWEIGLE...
Uster Technologies Ltd | Annual Report 2010Adding Value from Fiber to Fabric
Uster Technologies AG | Geschäftsbericht 2010Wertschöpfung von der Faser bis zum Stoff
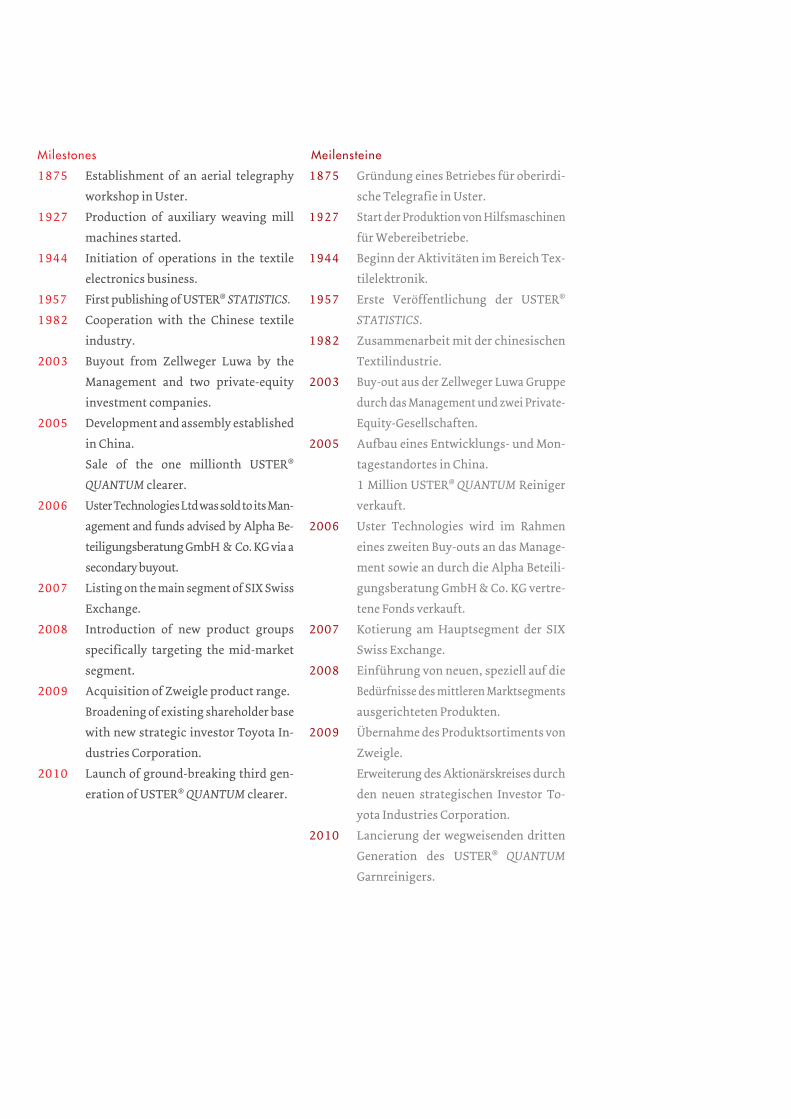
Milestones
1875 Establishment of an aerial telegraphy
workshop in Uster.
1927 Production of auxiliary weaving mill
machines started.
1944 Initiation of operations in the textile
electronics business.
1957 First publishing of USTER® STATISTICS.
1982 Cooperation with the Chinese textile
industry.
2003 Buyout from Zellweger Luwa by the
Management and two private-equity
investment companies.
2005 Development and assembly established
in China.
Sale of the one millionth USTER®
QUANTUM clearer.
2006 Uster Technologies Ltd was sold to its Man-
agement and funds advised by Alpha Be-
teiligungsberatung GmbH & Co. KG via a
secondary buyout.
2007 Listing on the main segment of SIX Swiss
Exchange.
2008 Introduction of new product groups
specifically targeting the mid-market
segment.
2009 Acquisition of Zweigle product range.
Broadening of existing shareholder base
with new strategic investor Toyota In-
dustries Corporation.
2010 Launch of ground-breaking third gen-
eration of USTER® QUANTUM clearer.
Meilensteine
1875 Gründung eines Betriebes für oberirdi-
sche Telegrafie in Uster.
1927 Start der Produktion von Hilfsmaschinen
für Webereibetriebe.
1944 Beginn der Aktivitäten im Bereich Tex-
tilelektronik.
1957 Erste Veröffentlichung der USTER®
STATISTICS.
1982 Zusammenarbeit mit der chinesischen
Textilindustrie.
2003 Buy-out aus der Zellweger Luwa Gruppe
durch das Management und zwei Private-
Equity-Gesellschaften.
2005 Aufbau eines Entwicklungs- und Mon-
tagestandortes in China.
1 Million USTER® QUANTUM Reiniger
verkauft.
2006 Uster Technologies wird im Rahmen
eines zweiten Buy-outs an das Manage-
ment sowie an durch die Alpha Beteili-
gungsberatung GmbH & Co. KG vertre-
tene Fonds verkauft.
2007 Kotierung am Hauptsegment der SIX
Swiss Exchange.
2008 Einführung von neuen, speziell auf die
Bedürfnisse des mittleren Marktsegments
ausgerichteten Produkten.
2009 Übernahme des Produktsortiments von
Zweigle.
Erweiterung des Aktionärskreises durch
den neuen strategischen Investor To-
yota Industries Corporation.
2010 Lancierung der wegweisenden dritten
Generation des USTER® QUANTUM
Garnreinigers.
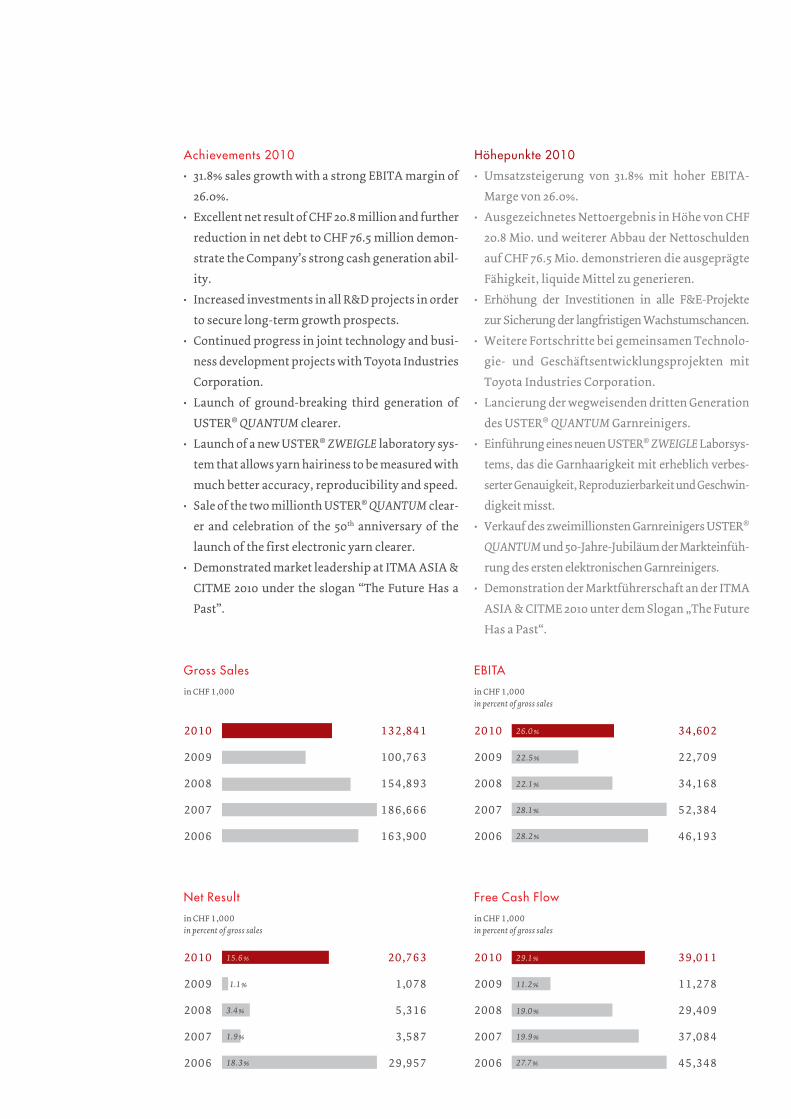
Gross Sales
in CHF 1,000
2010 132,841
2009 100,763
2008 154,893
2007 186,666
2006 163,900
Net Result
in CHF 1,000
in percent of gross sales
2010 20,763
2009 1,078
2008 5,316
2007 3,587
2006 29,957
EBITA
in CHF 1,000
in percent of gross sales
2010 34,602
2009 22,709
2008 34,168
2007 52,384
2006 46,193
Free Cash Flow
in CHF 1,000
in percent of gross sales
2010 39,011
2009 11,278
2008 29,409
2007 37,084
2006 45,348
Achievements 2010
• 31.8% sales growth with a strong EBITA margin of
26.0%.
• Excellent net result of CHF 20.8 million and further
reduction in net debt to CHF 76.5 million demon-
strate the Company’s strong cash generation abil-
ity.
• Increased investments in all R&D projects in order
to secure long-term growth prospects.
• Continued progress in joint technology and busi-
ness development projects with Toyota Industries
Corporation.
• Launch of ground-breaking third generation of
USTER® QUANTUM clearer.
• Launch of a new USTER® ZWEIGLE laboratory sys-
tem that allows yarn hairiness to be measured with
much better accuracy, reproducibility and speed.
• Sale of the two millionth USTER® QUANTUM clear-
er and celebration of the 50th anniversary of the
launch of the first electronic yarn clearer.
• Demonstrated market leadership at ITMA ASIA &
CITME 2010 under the slogan “The Future Has a
Past”.
Höhepunkte 2010
• Umsatzsteigerung von 31.8% mit hoher EBITA-
Marge von 26.0%.
• Ausgezeichnetes Nettoergebnis in Höhe von CHF
20.8 Mio. und weiterer Abbau der Nettoschulden
auf CHF 76.5 Mio. demonstrieren die ausgeprägte
Fähigkeit, liquide Mittel zu generieren.
• Erhöhung der Investitionen in alle F&E-Projekte
zur Sicherung der langfristigen Wachstumschancen.
• Weitere Fortschritte bei gemeinsamen Technolo-
gie- und Geschäftsentwicklungsprojekten mit
Toyota Industries Corporation.
• Lancierung der wegweisenden dritten Generation
des USTER® QUANTUM Garnreinigers.
• Einführung eines neuen USTER® ZWEIGLE Laborsys-
tems, das die Garnhaarigkeit mit erheblich verbes-
serter Genauigkeit, Reproduzierbarkeit und Geschwin-
digkeit misst.
• Verkauf des zweimillionsten Garnreinigers USTER®
QUANTUM und 50-Jahre-Jubiläum der Markteinfüh-
rung des ersten elektronischen Garnreinigers.
• Demonstration der Marktführerschaft an der ITMA
ASIA & CITME 2010 unter dem Slogan „The Future
Has a Past“.
22.5 %
11.2 %
26.0 %
29.1 %
22.1 %
19.0 %
28.1 %
19.9 %
28.2 %
27.7 %
1.9 %
18.3 %
3.4 %
15.6 %
1.1 %
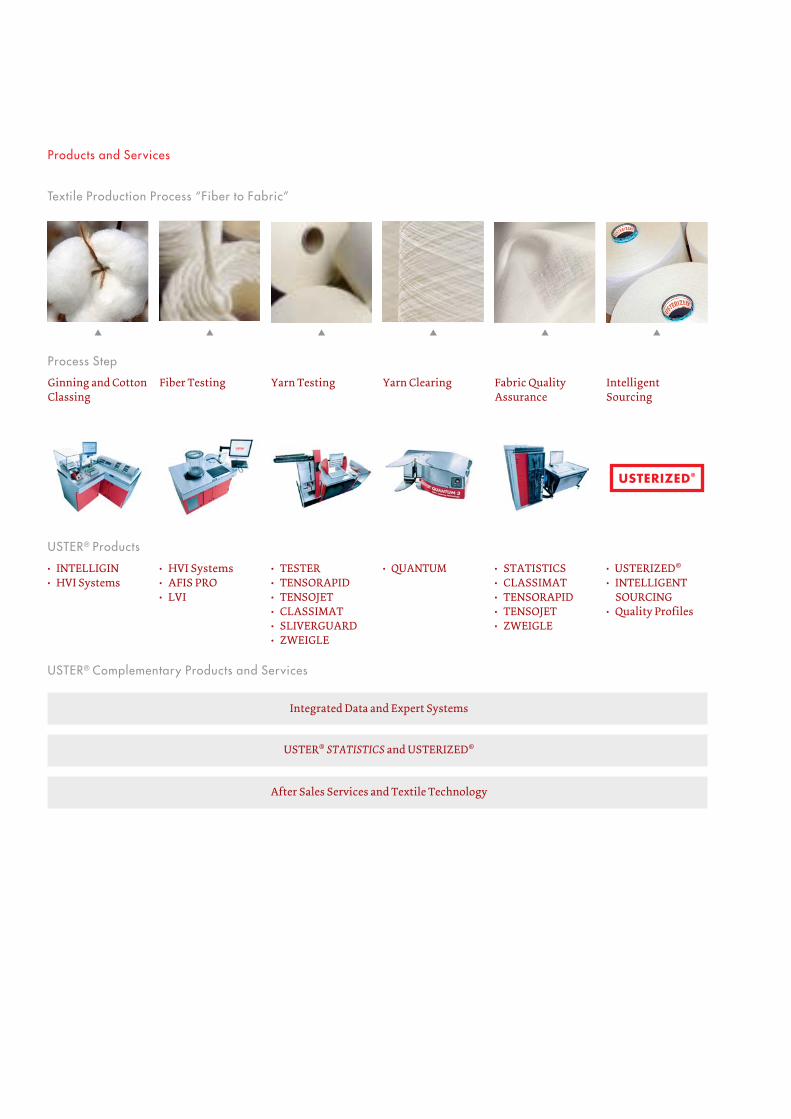
USTERIZED®
After Sales Services and Textile Technology
i i i i i i
Textile Production Process “Fiber to Fabric”
Process Step
USTER® Products
USTER® Complementary Products and Services
Products and Services
Ginning and Cotton Classing
Fiber Testing Yarn Testing Yarn Clearing Fabric QualityAssurance
Intelligent Sourcing
• INTELLIGIN• HVI Systems
• HVI Systems• AFIS PRO• LVI
• TESTER• TENSORAPID• TENSOJET• CLASSIMAT• SLIVERGUARD• ZWEIGLE
• QUANTUM • STATISTICS• CLASSIMAT• TENSORAPID• TENSOJET• ZWEIGLE
• USTERIZED®
• INTELLIGENT SOURCING
• Quality Profiles
USTER® STATISTICS and USTERIZED®
Integrated Data and Expert Systems

Portrait
The Uster Group is the leading high technology
instrument manufacturer of products for qual-
ity measurement and certification for the textile
industry. The Group provides testing and moni-
toring instruments, systems and services that
allow optimization and certification of quality
through each individual stage of textile produc-
tion; from the raw textile fiber, such as cotton,
wool or synthetic filament yarns, to the final fin-
ished fabric. The Uster Group provides benchmarks
that are the basis for the trading of textile products
at assured levels of quality across global markets.
Uster Technologies Ltd was established in 1875
as an aerial telegraphy workshop in Uster (Swit-
zerland) and became an independent company
in 2003 following the acquisition of the Zellweger
Uster division of Zellweger Luwa by the Manage-
ment and funds advised by two private-equity
investment companies. In 2006 Uster Technolo-
gies Ltd was acquired by its Management and
funds advised by Alpha Beteiligungsberatung
GmbH & Co. KG. In 2007 Uster Technologies Ltd
became a public company by listing its shares on
the SIX Swiss Exchange.
Kurzportrait
Uster Technologies AG ist der weltweit führende
Hersteller von Hightech-Produkten für die Qua-
litätsprüfung und Zertifizierungen in der Textil-
industrie. Das Unternehmen bietet technologisch
anspruchsvolle Systeme und Dienstleistungen
an, welche die Herstellung von Produkten in op-
timaler Qualität auf jeder Stufe der Textilverar-
beitung gewährleisten; von der rohen Textilfaser
wie Baumwolle, Wolle oder synthetischen Garnen
bis zum fertigen Gewebe. Uster Technologies legt
Qualitätsstandards fest, die als Grundlage für den
globalen Handel mit Textilprodukten dienen.
Uster Technologies AG wurde 1875 als Betrieb für
oberirdische Telegrafie in Uster (Schweiz) gegrün-
det. Seine Selbständigkeit erlangte das Unterneh-
men nach der Übernahme der Division Zellweger
Uster der Zellweger Luwa Gruppe durch das
Management sowie durch von zwei Private-Equi-
ty-Gesellschaften vertretene Fonds. 2006 wurde
Uster Technologies AG durch ihr Management
sowie durch von der Alpha Beteiligungsberatung
GmbH & Co. KG betreute Fonds erworben. Im Jahr
2007 wurde das Unternehmen durch die Kotierung
seiner Aktien an der SIX Swiss Exchange zu einer
Publikumsgesellschaft.
Knoxville, USA Charlotte, USA
Technology Centers
Regional Service Centers
Representative Offices
S
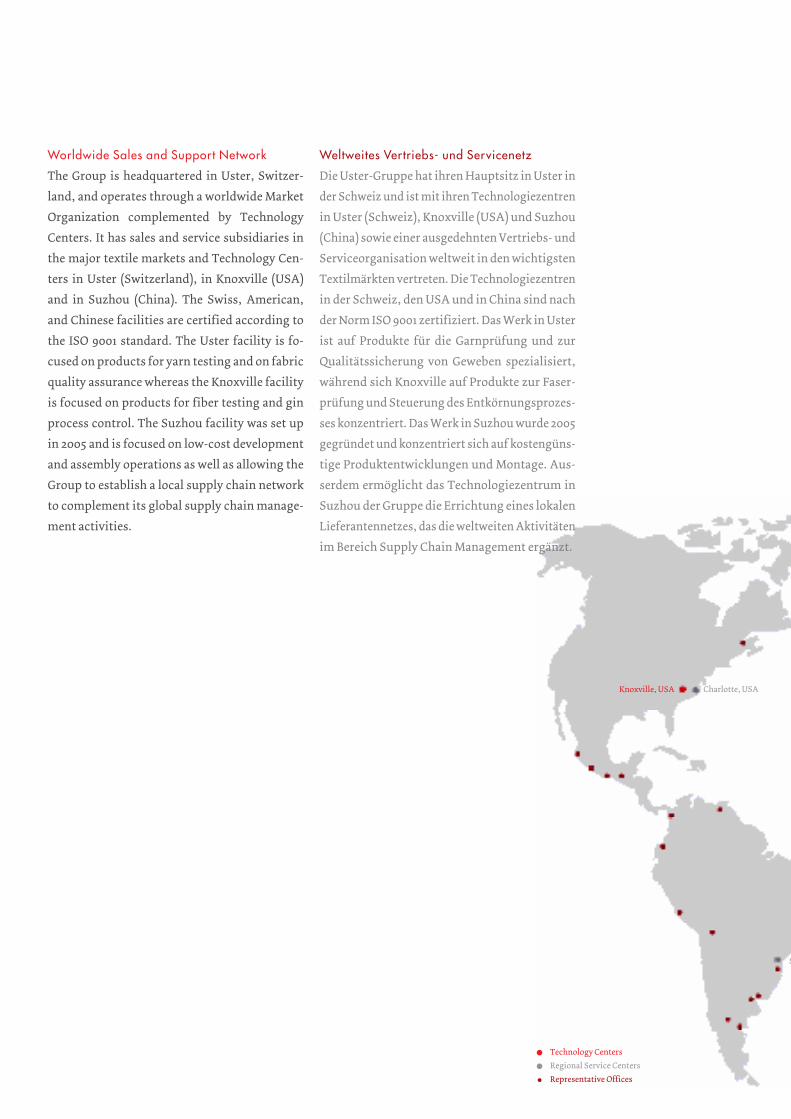
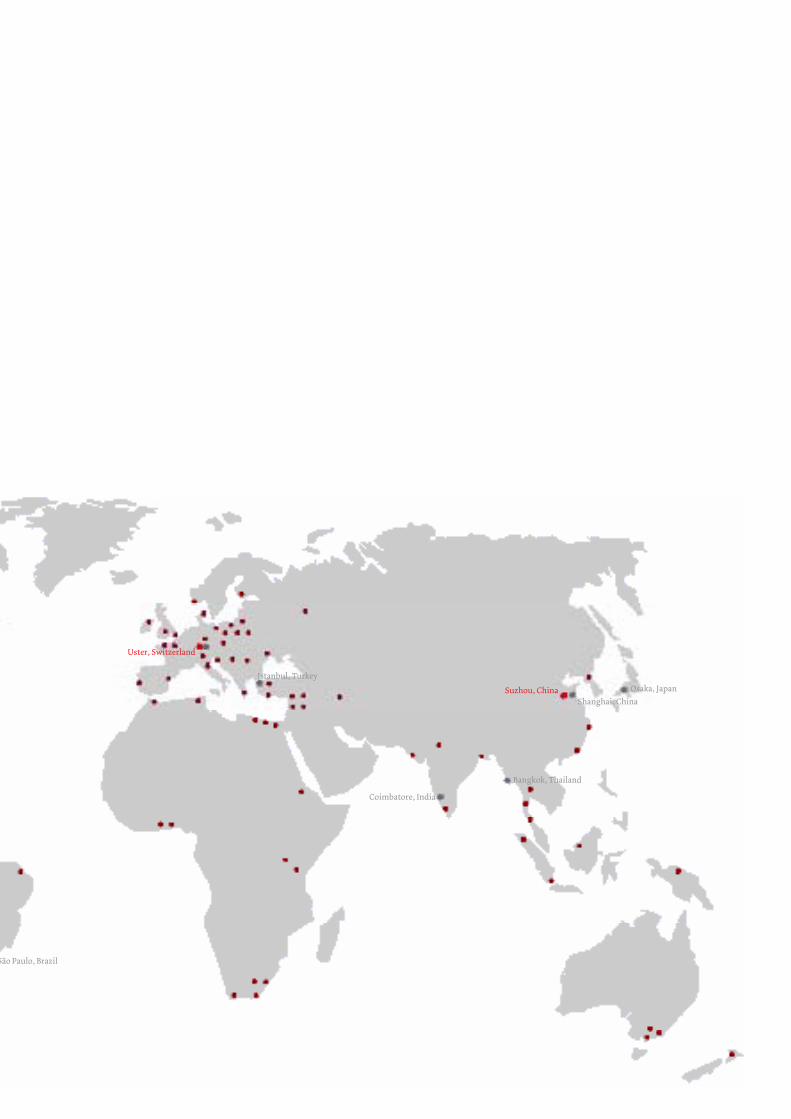
Worldwide Sales and Support Network
The Group is headquartered in Uster, Switzer-
land, and operates through a worldwide Market
Organization complemented by Technology
Centers. It has sales and service subsidiaries in
the major textile markets and Technology Cen-
ters in Uster (Switzerland), in Knoxville (USA)
and in Suzhou (China). The Swiss, American,
and Chinese facilities are certified according to
the ISO 9001 standard. The Uster facility is fo-
cused on products for yarn testing and on fabric
quality assurance whereas the Knoxville facility
is focused on products for fiber testing and gin
process control. The Suzhou facility was set up
in 2005 and is focused on low-cost development
and assembly operations as well as allowing the
Group to establish a local supply chain network
to complement its global supply chain manage-
ment activities.
Weltweites Vertriebs- und Servicenetz
Die Uster-Gruppe hat ihren Hauptsitz in Uster in
der Schweiz und ist mit ihren Technologie zentren
in Uster (Schweiz), Knoxville (USA) und Suzhou
(China) sowie einer ausgedehnten Vertriebs- und
Serviceorganisation weltweit in den wichtigsten
Textilmärkten vertreten. Die Technologiezentren
in der Schweiz, den USA und in China sind nach
der Norm ISO 9001 zertifiziert. Das Werk in Uster
ist auf Produkte für die Garnprüfung und zur
Qualitätssicherung von Geweben spezialisiert,
während sich Knoxville auf Produkte zur Faser-
prüfung und Steuerung des Entkörnungsprozes-
ses konzentriert. Das Werk in Suzhou wurde 2005
gegründet und konzentriert sich auf kostengüns-
tige Produktentwicklungen und Montage. Aus-
serdem ermöglicht das Technologie zentrum in
Suzhou der Gruppe die Errichtung eines lokalen
Lieferan tennetzes, das die weltweiten Aktivitäten
im Bereich Supply Chain Management ergänzt.
Uster, Switzerland
Istanbul, Turkey
Bangkok, Thailand
Coimbatore, India
Suzhou, China
Shanghai, China
São Paulo, Brazil
Osaka, Japan

Table of ContentsInhaltsverzeichnis
Foreword / Vorwort ......................................................................................................................................... 3
Operational Review / Operativer Rückblick .................................................................................................. 10
Sales and Marketing / Vertrieb und Marketing .............................................................................................. 16
Research and Innovation / Forschung und Entwicklung .............................................................................. 22
Operations / Produktion und Logistik .......................................................................................................... 26
Outlook / Ausblick ........................................................................................................................................ 28
Corporate Governance ................................................................................................................................. 32
Comment on the Consolidated Financial Statements .................................................................................. 58
Uster Group – Consolidated Financial Statements ...................................................................................... 60
Uster Group – Notes to the Consolidated Financial Statements .................................................................. 65
Report of the Statutory Auditor on the Consolidated Financial Statements ............................................. 107
Uster Technologies Ltd – Financial Statements ......................................................................................... 109
Uster Technologies Ltd – Notes to the Financial Statements ...................................................................... 111
Report of the Statutory Auditor on the Financial Statements .................................................................... 117
Information for Investors ........................................................................................................................... 119
Foreword | Vorwort 3
ForewordVorwort
Dear Fellow Shareholders
“Adding value from fiber to fabric” is the theme of
this year’s report. In each step of the value chain, from
the classing of the raw material to the spinning of
yarns and the finished textile product, Uster Tech-
nologies Ltd helps to increase the efficiency of the
textile manufacturing process while ensuring con-
sistent standards of quality in the final products that
are supplied to customers.
Back on the Growth Track
In the financial year 2010, Uster Technologies Ltd busi-
nesses emerged from the crisis caused by the combina-
tion of the collapse in the textile industry and the
global financial crisis. There were many positive signs
of market recovery in the first half of the year. This
trend continued in the second half, driven by further
improved overall economic conditions in all major
markets and the recovery in textile machinery invest-
ments spearheaded by Asian markets, most notably
China. Our organization is in good shape again and
business momentum is returning to levels last seen
during our record year 2007. Uster Technologies Ltd is
moving back into the growth track. Looking ahead, we
will further exploit the Group’s solid business model
demonstrated by the Company’s strong cash generation
power even in difficult times, allowing us to further
reduce net debt and grow the business at the same time.
In light of the generally improved economic environ-
ment, the Uster Group took action to profit from the
anticipated market upswing by:
• Focusing on the fast growing Chinese and Indian
markets along with pursuing other growth oppor-
tunities such as new classing business. The Group
continued to expand its sales and service network,
particularly in China. Nowadays it is extremely im-
portant to be well positioned in Asian markets and
to possess the innovation power to rapidly adapt
products to the needs of these markets. Beside the
global textile machinery manufacturers, with whom
Uster Technologies Ltd maintains close client rela-
tionships, local equipment producers are rapidly
growing their businesses.
Sehr geehrte Aktionärinnen und Aktionäre
„Wertschöpfung von der Faser bis zum Stoff“ – so
lautet das Motto unseres diesjährigen Geschäftsbe-
richts. In jeder Stufe der Wertschöpfungskette –
von der Klassierung des Rohstoffs über das Spinnen
der Garne bis zum fertigen Textilprodukt – trägt
Uster Technologies AG zur Verbesserung der Effizienz
im Textilherstellungsprozess bei und gewährleistet
gleichzeitig einheitliche Qualitätsstandards der End-
produkte, die an die Kunden geliefert werden.
Zurück auf Wachstumskurs
Im Geschäftsjahr 2010 erholte sich Uster Technolo-
gies AG von der Krise, die durch den Einbruch der
Textilindustrie in Kombination mit der globalen Fi-
nanzkrise ausgelöst worden war. Bereits im ersten
Halbjahr zeigte der Markt viele positive Signale einer
Erholung. Dieser Trend setzte sich im zweiten Halb-
jahr fort, angetrieben durch die allgemeine Erholung
der wirtschaftlichen Rahmenbedingungen in allen
grossen Märkten und die wieder erwachte Investi-
tionsbereitschaft der Textilproduzenten. Sie wurde
von den asiatischen Märkten angeführt, allen voran
von China. Das Unternehmen befindet sich wieder in
gutem Zustand. Das Geschäft gewinnt an Fahrt und
kehrt allmählich auf das Niveau zurück, das wir zu-
letzt in unserem Rekordjahr 2007 erreicht hatten.
Uster Technologies AG ist zurück auf Wachstums-
kurs. Mit Blick in die Zukunft werden wir an dem so-
liden Geschäftsmodell der Gruppe festhalten. Dank
ihm gelang es uns selbst in schwierigen Zeiten liqui-
de Mittel zu generieren, sodass wir unsere Netto-
schulden reduzieren und gleichzeitig unser Geschäft
ausbauen konnten.
Angesichts der allgemeinen Verbesserung des wirt-
schaftlichen Umfelds ergriff die Uster-Gruppe Mass-
nahmen, um vom erwarteten Marktaufschwung zu
profitieren:
• Sie konzentrierte sich in erster Linie auf die wachs-
tumsstarken Märkte in China und Indien bei
gleichzeitiger Erschliessung weiterer Wachstums-
potenziale, wie zum Beispiel neue Aufträge im
Klassierungsgeschäft. Die Gruppe baute ihr Ver-
4 Uster Technologies Ltd | Annual Report 2010
• Immediately restoring all R&D projects back to full
speed with the goal of providing new offerings once
the market recovers and being ready to invest in new
growth. This strategy enabled Uster Technologies
Ltd to launch its ground-breaking third generation
of USTER® QUANTUM clearer at the end of Septem-
ber at a point in time when momentum in the textile
market was picking up worldwide, especially in the
textile machinery market.
• Emphasizing strong cash generation in order to
further reduce debt while at the same time enhanc-
ing the Group’s operational and financial flexibili-
ty to take advantage of future growth opportunities.
In order to ensure that the organization is prepared
to fully benefit from the market upswing, it is neces-
sary to make timely investments in new growth
projects. Increases in expenditures were seen in many
areas of the business, including capital investments
in improved production facilities for the new USTER®
QUANTUM 3 clearer. With our business capabilities
restored to full power, we are pleased to have again
demonstrated our ability to maintain profitability
at a high level. After reporting an EBITA margin of
25.5 % in the first half of 2010, the margin increased
to 26.0 % thanks to the higher sales, clearly exceeding
the target of around 25 %. The net result was enhanced
by one-off effects arising from the resolution of tax
issues from earlier years.
triebs- und Servicenetz, vor allem in China, weiter
aus. Eine gute Wettbewerbsposition in den asiati-
schen Märkten, kombiniert mit der Innovations-
kraft, Produkte rasch an die Anforderungen dieser
Märkte anzupassen, erweist sich heute als erfolgs-
entscheidend. Neben den internationalen Textil-
maschinenproduzenten, zu denen Uster Techno-
logies AG enge Kundenbeziehungen unterhält,
weiten auch lokale Hersteller ihre Geschäftstä-
tigkeit schnell aus.
• Weiter nahm sie unverzüglich alle F&E-Projekte
wieder auf, um mit der einsetzenden Markterho-
lung neue Produkte anbieten zu können und für
Investitionen ihrer Kunden in neues Wachstum be-
reit zu sein. Dank dieser Strategie konnte Uster
Technologies AG Ende September die wegweisen-
de dritte Generation des Garnreinigungssystems
USTER® QUANTUM auf den Markt bringen – genau
zu dem Zeitpunkt, als die Belebung der weltweiten
Textilmärkte, insbesondere im Textilmaschinen-
markt, verstärkt einsetzte.
• Schliesslich legte sie einen Schwerpunkt auf die
Generierung liquider Mittel, um weiter Schulden
abzubauen, die operative und finanzielle Flexibili-
tät der Gruppe zu stärken und damit für zukünftige
Wachstumschancen nutzen zu können.
Damit das Unternehmen in vollem Umfang vom
Marktaufschwung profitiert, investierte das Ma-
nagement rechtzeitig in neue Wachstumsprojekte.
In vielen Geschäftsbereichen wurden die Ausgaben
erhöht. Ein Beispiel hierfür sind die Investitionen
zur Verbesserung der Produktionsanlagen für den
neuen USTER® QUANTUM 3 Garnreiniger. Wir freu-
en uns, dass es uns parallel zur Rückkehr auf den
Wachstumspfad gelungen ist, das hohe Profitabili-
tätsniveau zu halten. Nach dem Ausweis einer
EBITA-Marge von 25.5% im ersten Halbjahr 2010
konnte die Marge dank höherer Umsatzerlöse auf
26.0 % gesteigert werden und übertraf damit die Ziel-
vorgabe von rund 25 % deutlich. Das Nettoergebnis
wurde durch einmalige Effekte aufgrund der Lösung
von Steuerfragen aus früheren Jahren verbessert.
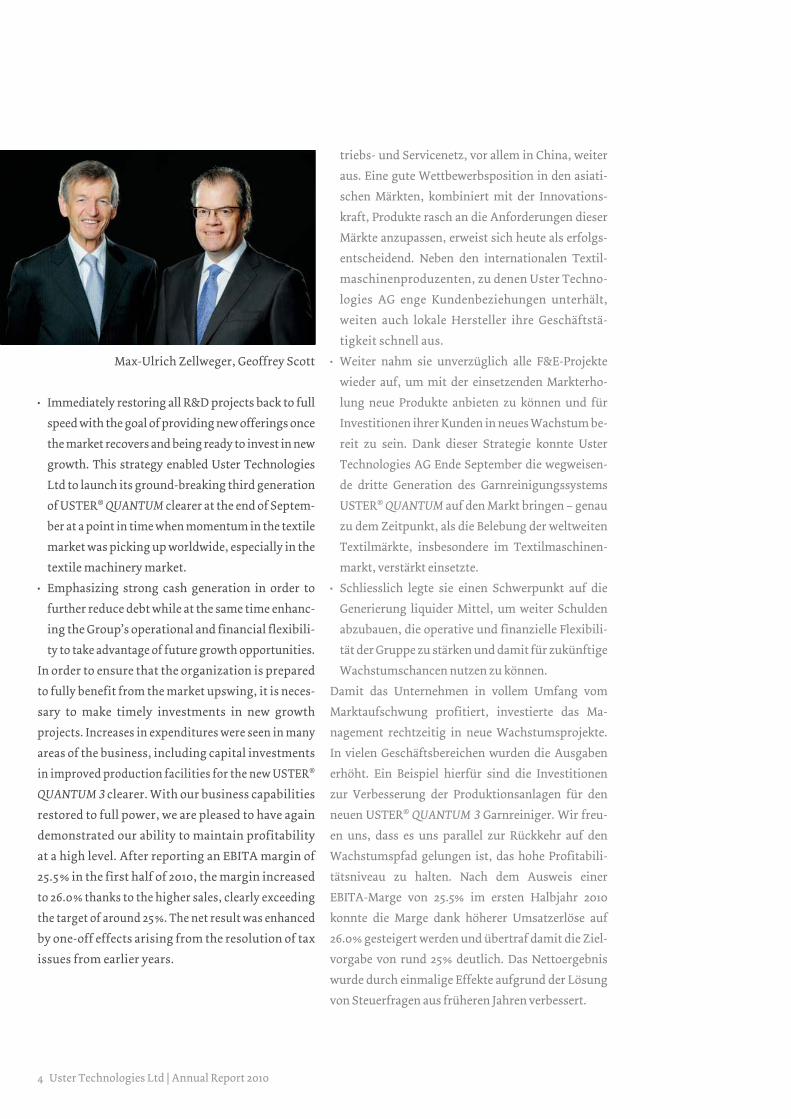
Max-Ulrich Zellweger, Geoffrey Scott
Unique Expertise as Basis for Above-Average
Growth
We are encouraged by the positive market develop-
ments during the past several months and, at the
same time, we are proud to have made the most of
the crisis by expanding and strengthening our mar-
ket leadership relative to the performance of our
competitors. Going forward, we will continue to do
our utmost to outperform the markets. We will con-
centrate on the extensive skills already available in
our organization. In addition, we will further exploit
the synergies and joint development opportunities
emerging from the strategic partnership with Toyo-
ta Industries Corporation, a leading manufacturer
of textile machines for the weaving and spinning
sectors. In the mid-term perspective, the combined
expertise creates new joint growth opportunities
that will help us to achieve our goal of gradually
bringing the Company’s top and bottom-line per-
formance back to the levels achieved prior to the
crisis.
Einzigartige Expertise als Grundlage für über-
durchschnittliches Wachstum
Wir sind von den positiven Marktentwicklungen der
letzten Monate ermutigt. Gleichzeitig sind wir stolz,
dass wir die Krise als Chance genutzt haben, unsere
Marktführerschaft gegenüber anderen Mitbewerbern
auszubauen und zu festigen. Wir werden auch zu-
künftig alles daransetzen, Ergebnisse über dem
Marktdurchschnitt zu erzielen. Dabei konzentrieren
wir uns auf die Stärken, die in unserem Unternehmen
vorhanden sind. Zusätzlich werden wir Synergien und
gemeinsame Entwicklungsmöglichkeiten nutzen, die
sich durch die strategische Zusammenarbeit mit
Toyota Industries Corporation ergeben. Toyota zählt
zu den führenden Textilmaschinenproduzenten für
die Weberei- und Spinnerei-Industrie. Wir sind über-
zeugt, dass aus dem vereinigten Wissen mittelfristig
neue gemeinsame Wachstumsmöglichkeiten entste-
hen, die unser Ziel unterstützen sowie das Umsatz-
und Gesamtergebnis des Unternehmens auf das
Niveau vor der Krise zurückbringen.
Foreword | Vorwort 5
6 Uster Technologies Ltd | Annual Report 2010
Thanks
We are very happy that market demand has recovered
and that all staff members, in particular our colleagues
at the Technology Center in Uster, have returned to
their regular work schedules and are highly moti-
vated to seize the oncoming opportunities. Our em-
ployees at all levels worldwide demonstrated a high
degree of flexibility and steadfast dedication during
the long months of market uncertainty. On behalf of
the Board of Directors and the Executive Committee,
we cordially thank all our employees for their efforts
and strong commitment.
Special thanks go to Deniz Bütüner, Executive Vice-
President Marketing and Business Development of
the Uster Group since 2007, who stepped down from
her position as of 31st December 2010. Her responsi-
bilities were assumed by Reine Wasner, who joined
Uster Technologies Ltd at the beginning of January
2011 and whom we cordially welcome to the Group’s
Executive Committee.
We also thank our business partners, customers and
suppliers for their excellent collaboration with our
teams. Finally, we express our thanks to our Share-
holders for their confidence in our business. We are
now again in the position to reward our shareholders
for their loyalty and support. At the General Meeting
in March, the Board of Directors will propose a divi-
dend of CHF 1.20 per share.
Max-Ulrich Zellweger
Chairman of the Board of Directors
Dank
Wir freuen uns sehr, dass sich die Marktnachfrage
erhöht hat und alle Mitarbeitenden, insbesondere
unsere Kollegen im Technologiezentrum Uster,
wieder zu ihren normalen Arbeitszeiten zurückkeh-
ren konnten. Sie alle sind hoch motiviert, neue
Wachstumschancen wahrzunehmen. In den langen
Monaten der Marktunsicherheiten hat unsere Be-
legschaft weltweit auf allen Ebenen sehr grosse Fle-
xibilität und Standhaftigkeit bewiesen. Im Namen
des Verwaltungsrates und des Executive Committee
möchten wir allen für ihren Einsatz und ihr starkes
Engagement danken.
Ein besonderer Dank geht an Deniz Bütüner. Sie war
seit 2007 Executive Vice-President Marketing und
Business Development der Uster-Gruppe und trat
per 31. Dezember 2010 von ihrer Funktion zurück.
Ihre Aufgaben werden von Reine Wasner übernom-
men, der Anfang Januar 2011 in die Uster Technolo-
gies AG eintrat und den wir herzlich in der Geschäfts-
leitung begrüssen.
Ausserdem danken wir unseren Geschäftspartnern,
Kunden und Lieferanten für die ausgezeichnete Zu-
sammenarbeit mit unseren Teams. Nicht zuletzt
geht ein herzliches Dankeschön an unsere Aktionä-
rinnen und Aktionäre für ihr Vertrauen in unser
Unternehmen. Wir sind jetzt wieder in der Lage, die
Aktionäre für ihre Treue und Unterstützung zu
belohnen. Der Verwaltungsrat schlägt der General-
versammlung im März die Ausrichtung einer Divi-
dende von CHF 1.20 je Aktie vor.
Dr. Geoffrey Scott
Chief Executive Officer

Foreword | Vorwort 7
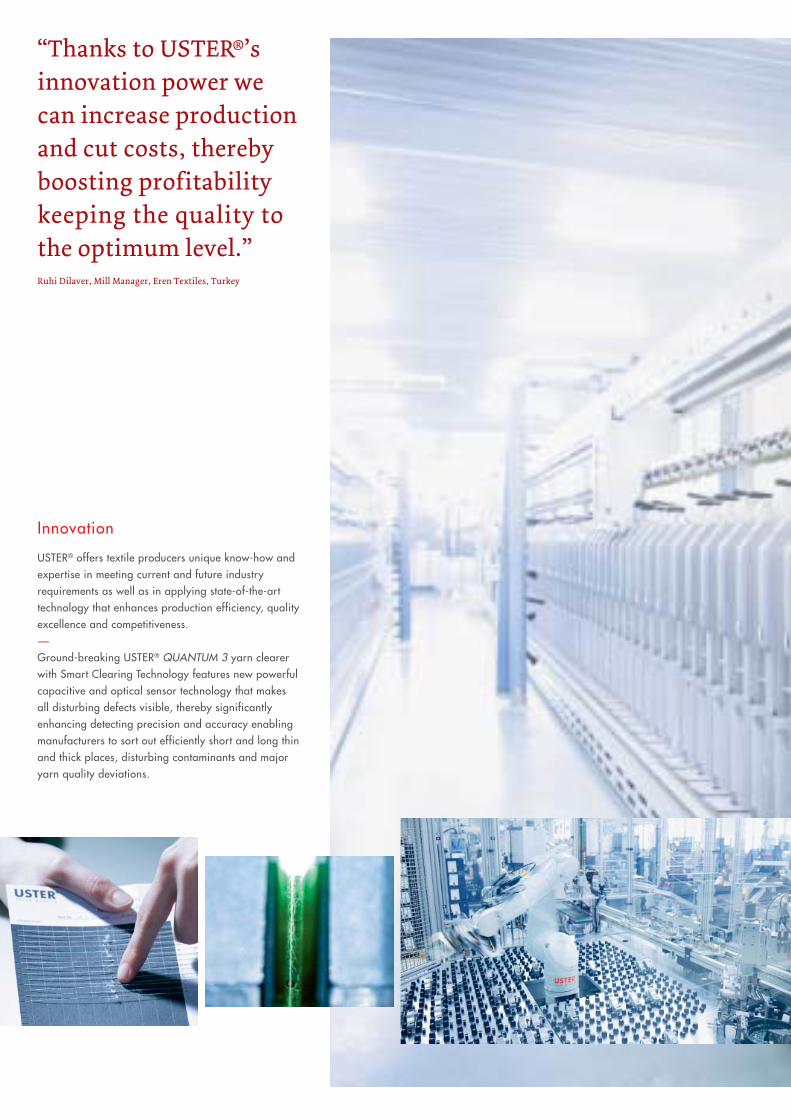
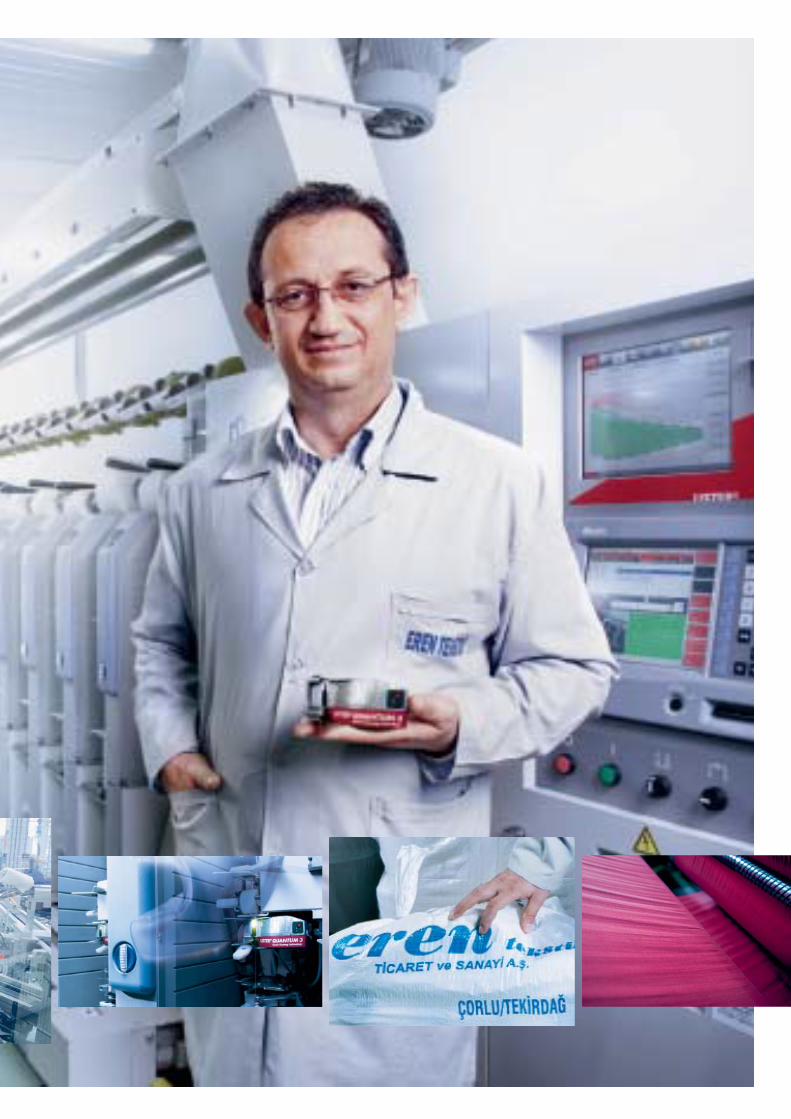
Innovation
USTER® offers textile producers unique know-how and
expertise in meeting current and future industry
requirements as well as in applying state-of-the-art
technology that enhances production efficiency, quality
excellence and competitiveness.
−
Ground-breaking USTER® QUANTUM 3 yarn clearer
with Smart Clearing Technology features new powerful
capacitive and optical sensor technology that makes
all disturbing defects visible, thereby significantly
enhancing detecting precision and accuracy enabling
manufacturers to sort out efficiently short and long thin
and thick places, disturbing contaminants and major
yarn quality deviations.
“Thanks to USTER®’s innovation power we can increase production and cut costs, thereby boosting profitability keeping the quality to the optimum level.”Ruhi Dilaver, Mill Manager, Eren Textiles, Turkey
10 Uster Technologies Ltd | Annual Report 2010
Uster Technologies AG blickt auf ein Jahr zurück, in
dem sich die Textilindustrie deutlich erholt hat. Die
erfreuliche Entwicklung veranlasste die Textilprodu-
zenten, wieder in die Zukunft zu blicken und in neue
Geschäftsprojekte und Qualitätsverbesserungen zu
investieren. Gleichzeitig stiegen die Rohstoffpreise,
insbesondere für Baumwolle, und die Garnpreise klet-
terten gegenüber dem Niveau am Jahresanfang sprung-
haft in die Höhe. Diese Entwicklung unterstrich die
Wichtigkeit von Qualität und erhöhte das Interesse
der Hersteller, Ausschuss zu minimieren und vor al-
lem für die Produktqualität angemessene Preise zu
erzielen. Letztlich sind sie bestrebt, die Erwartungen
der Endkunden zu erfüllen oder gar zu übertreffen,
anstatt Gefahr zu laufen, Reklamationen aufgrund
mangelhafter Rohmaterial- und Garnqualität wie auch
Gewebefehler zu erhalten. Beanstandungen schmälern
den Gewinn und, was weitaus gravierender ist, können
den Ruf einer Marke nachhaltig schädigen.
Eine weitere bedeutende Veränderung, welche die
Marktdynamik während der Berichtsperiode revita-
lisierte, war die allgemeine Konjunkturerholung. Sie
führte dazu, dass Textilproduzenten wieder investier-
ten und ihr Interesse an Mess- und Prüfsystemen
zurückkehrte. Als Folge begannen die Textilprodu-
zenten, neue Maschinen zur Erhöhung ihrer Effizienz
und Profitabilität anzuschaffen. Diese positive Ent-
wicklung wurde durch bessere Rahmenbedingungen
für Kredit- und Investitionsfinanzierungen für die
Kunden der Gruppe in allen wichtigen Märkten un-
terstützt.
Starke Position in asiatischen Märkten
China ist weiterhin das führende Land in der Tex-
tilindustrie. Dieser Markt ist nach wie vor stark
fragmentiert. Tausende Spinnereien werden von
internationalen Textilmaschinenherstellern und in
zunehmendem Masse von den schnell wachsenden
lokalen Produzenten beliefert. Gegenwärtig vollzieht
sich im chinesischen Markt ein schneller Moderni-
sierungsprozess, der von staatlicher Seite unterstützt
wird. Die Politiker haben erkannt, dass die Textilin-
dustrie einen wichtigen Beitrag zur Wirtschaftsent-
wicklung leistet. Steuererleichterungen sind nur ein
Operational ReviewOperativer Rückblick
Uster Technologies Ltd looks back on a year in which
the textile industry experienced a sharp recovery,
encouraging textile producers to again direct their
focus on the future and to invest in new business pro-
jects and quality improvements. At the same time raw
material prices, especially cotton, and yarn prices
increased compared to their levels at the beginning
of the year. The result was further emphasis on the
importance of quality and sharpened producer inter-
est in minimizing waste and, in particular, in achiev-
ing adequate prices relative to the corresponding
quality level. Their ultimate goal is to meet or surpass
end-consumer expectations rather than to risk pro-
duct returns due to fabric failures and faulty quality,
which reduces profits and, even worse, can damage
a brand’s reputation.
A further significant change that revitalized market
dynamics during the reporting period was the gen-
eral economic recovery, which stimulated investment
spending by textile producers and rekindled their
interest in measuring and testing systems. As a result,
textile manufacturers started to buy new equipment
to enhance efficiency and profitability. This positive
development was supported by an improvement in
credit and trade financing terms for the Group’s cus-
tomers in all major markets.
Strong Anchor in Asian Markets
China continued to take the lead in the textile indus-
try. This market is still highly fragmented. Thousands
of spinning mills are supplied by global textile ma-
chinery producers and, increasingly, by fast growing
local manufacturers. Currently, the Chinese market
is experiencing rapid modernization thanks to gov-
ernment support, as policymakers continue to re-
cognize that the textile industry is an important con-
tributor to the country’s economic development.
Favorable tax incentives are an example of the various
programs designed to facilitate the transition from
labor-intensive manual production to automated
production. This paradigm shift in production tech-
nology further boosted demand for quality measure-
ment and testing equipment. In response to the ra pidly
emerging local Chinese manufacturers, Uster Tech-
Operational Review | Operativer Rückblick 11
Beispiel für die verschiedenen Programme, mit denen
die Umstellung von der arbeitsintensiven manuellen
Herstellung auf automatisierte Produktionsverfah-
ren gefördert wird. Dieser Paradigmenwechsel in der
Produktionstechnologie steigerte zusätzlich die
Nachfrage nach Qualitätsmess- und -prüfsystemen.
Als Reaktion auf das rasche Wachstum lokaler chi-
nesischer Hersteller hat Uster Technologies AG ihr
Produktangebot im mittleren Marktsegment ausge-
baut und Systeme eingeführt, die speziell auf die
Anforderungen dieses wichtigen Wachstumssektors
zugeschnitten sind. Es ist eines der zentralen Ziele
der Gruppe, bei diesen Kunden die Nachfrage nach
Qualitätsverbesserungen zu forcieren. Letztere er-
möglichen es ihnen, ihre betriebliche Effizienz zu
verbessern und dadurch weiter zu wachsen.
Im vergangenen Jahr erholten sich auch die mittel-
asiatischen Märkte von den Folgen der wirtschaft-
lichen Instabilität früherer Jahre, darunter Indien,
die Türkei, Bangladesch und Pakistan.
Deutlich höherer Umsatz und Gewinn
Parallel zur Erholung des Textilmarktes erzielte Uster
Technologies AG im Geschäftsjahr 2010 einen Brut-
toumsatz von CHF 132.8 Mio., ein deutlicher Anstieg
von 31.8 % gegenüber dem Vorjahr. Dank der starken
Marktposition kann Uster Technologies AG die meis-
ten Aufträge in Schweizer Franken verrechnen, sodass
die Gruppe einem minimalen Wechselkursrisiko
ausgesetzt ist. Das operative Ergebnis (EBITA) erhöh-
te sich auf CHF 34.6 Mio. und lag damit um 52.4 % über
dem Vorjahreswert von CHF 22.7 Mio. Die EBITA-
Marge konnte ebenfalls auf dem hohen Niveau von
26.0 % (2009: 22.5 %) gehalten werden. Das Netto-
ergebnis stieg von CHF 1.2 Mio. im Jahr 2009 auf
CHF 20.8 Mio. im Jahr 2010.
2010 reduzierte Uster Technologies AG ihre Netto-
schulden weiter auf CHF 76.5 Mio. und erhöhte damit
ihre operative und finanzielle Flexibilität. Das Ge-
samtergebnis unterstreicht erneut das schlanke,
flexible Geschäftsmodell des Unternehmens und
demonstriert die ausgeprägte Fähigkeit des Unter-
nehmens, liquide Mittel zu generieren.
nologies Ltd continued to expand its product range
in the mid-segment market by addressing the spe-
cific needs of this important growth sector. Looking
forward, it is the Group’s goal to move their needs to
enhanced quality levels, allowing them to further
improve operational efficiency and thereby grow their
business.
Also during the past year the mid-Asian markets in-
cluding India, Turkey, Bangladesh and Pakistan re-
covered from the economic instability of previous
years.
Significantly Higher Sales and Profits
With the revival of the textile market, Uster Tech-
nologies Ltd posted gross sales of CHF 132.8 million
in financial year 2010, a strong increase of 31.8 % com-
pared to the previous year. The strong market position
allows Uster Technologies Ltd to invoice in Swiss
Francs for the majority of its business reducing ex-
change rate impacts to a minimum. EBITA increased
to CHF 34.6 million, 52.4 % above the CHF 22.7 million
reported in financial year 2009, and the EBITA margin
improved to the high level of 26.0 % compared to
22.5 % in 2009. The Group’s net result increased from
CHF 1.2 million in 2009 to CHF 20.8 million in 2010.
In 2010 Uster Technologies Ltd further decreased its
net debt to CHF 76.5 million, thereby enhancing its
operational and financial flexibility. Once again, the
bottom-line performance underlines the Company’s
lean and flexible business model and demonstrates
the Company’s strong cash generation power.
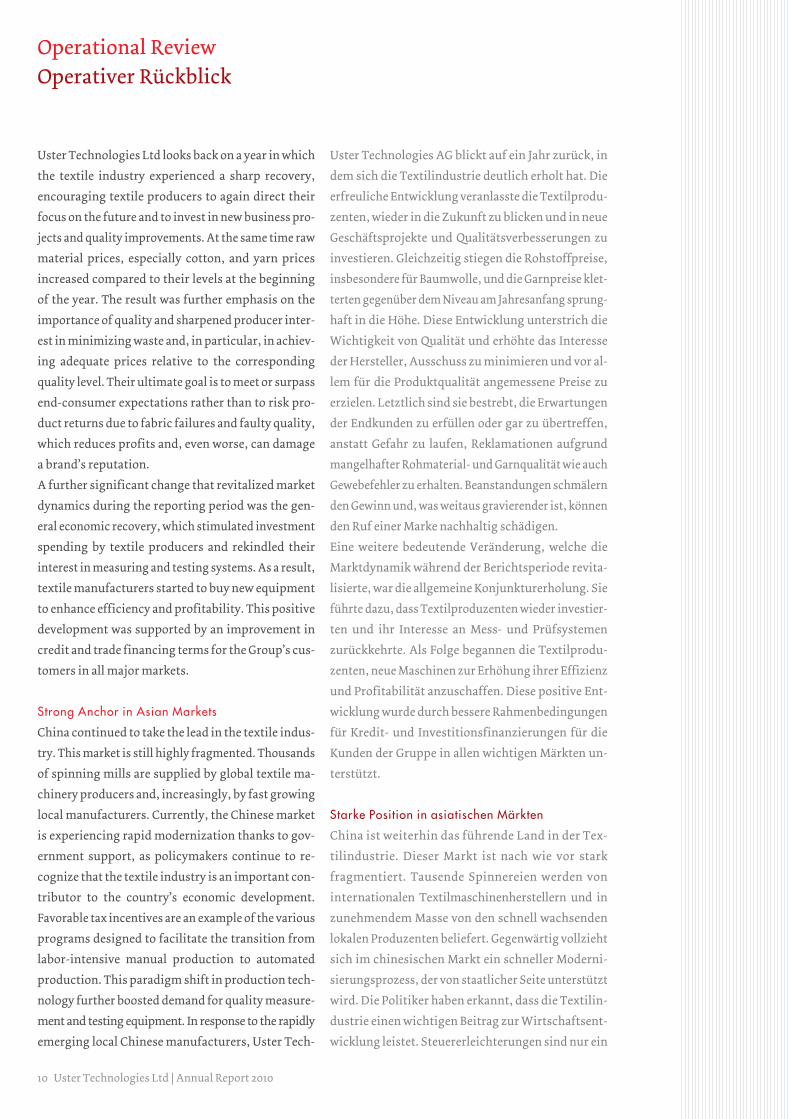
Strong Testing Instrument Sales and Service
Business
Strong growth in the testing instrumentation seg-
ment was based on several factors. The sharp increase
in raw material prices since the beginning of 2010
led to a greater emphasis on raw material quality
and enhanced sales of classing systems ordered from
government agencies including China and the US
in order to update the equipment in their quality
control laboratories. Additional business for the HVI
cotton classing systems was secured in other cotton

12 Uster Technologies Ltd | Annual Report 2010
Starker Umsatz mit Prüfsystemen und Service
Im Segment Prüfsysteme trugen mehrere Effekte zu
einem starken Umsatzwachstum bei. Durch den
massiven Anstieg der Rohstoffpreise seit Anfang
2010 rückte die Rohstoffqualität wieder stärker in
den Mittelpunkt. Davon profitierte der Umsatz mit
Klassierungssystemen. Die staatlichen Behörden,
einschliesslich derjenigen in China und den USA,
erteilten neue Aufträge, um ihre Qualitätsprüfungs-
labors zu modernisieren. Darüber hinaus erhielt
Uster Technologies AG neue Bestellungen für Baum-
wollklassierungssysteme aus anderen Baumwollre-
gionen wie Indien, Afrika und Mittelasien. Sie trugen
zu einer weiteren Diversifizierung der Kundenbasis
im Klassierungsgeschäft bei.
Die Erholung der Nachfrage nach Textilprodukten
löste auch einen starken Anstieg der Garnpreise aus.
Als Folge legten Textilproduzenten noch grösseren
Wert darauf, eine hohe Rohstoffqualität und ange-
messene Preise für die gewünschte Qualität zu erzie-
len. Den Schwerpunkt bildete dabei die Reduzierung
von Ausschuss mit dem Ziel, Produktivitätssteige-
rungen und Kostenreduktionen zu erreichen. Dies
führte zu einem spürbaren Umsatzwachstum bei den
Garn- und Faserprüfsystemen für Labors.
Im Geschäft mit Garnreinigern profitierte Uster Tech-
nologies AG von einem deutlich höheren Auftrags-
eingang von Maschinenherstellern. Hier werden die
Wachstumsraten in den kommenden Jahren voraus-
sichtlich deutlich über den anderen Produktgruppen
liegen. Zu einem optimistischen Umsatzausblick für
die Garnreinigungssysteme trägt ausserdem die weg-
weisende dritte Generation des USTER® QUANTUM
Garnreinigers bei. Sie wurde Ende September 2010
lanciert. Der Auftragsbestand am Jahresende war
aussergewöhnlich hoch, was auf einen weiteren hohen
Umsatz für das Jahr 2011 hindeutet.
Im Segment Service stärkte die Uster-Gruppe ihre
Beziehungen zu einem breiten Kreis von Textilhänd-
lern und förderte deren Interesse an wertsteigernden
Dienstleistungen inklusive des Intelligent Sourcing,
dem USTERIZED®-Label und den USTER® STATISTICS.
Das After-Sales-Geschäft stieg proportional zum
Wachstum der Prüfsysteme an.
growing regions across India, Africa and Central Asia
and further diversified the customer base in the class-
ing business.
The recovery in demand for textile products also led
to a strong increase in yarn prices.
Textile producers attached even greater importance
to attaining adequate raw material quality and pri-
ces for the desired quality level. Their main focus
lay on reducing waste, thereby achieving efficiency
improvements and cost reductions. The result was
significant growth in sales for the laboratory yarn
and fiber testing systems.
In the yarn clearer business Uster Technologies Ltd
benefited from the sharp increase in orders from ma-
chinery manufacturers with growth rates estimated
to clearly outperform other product groups in the
coming year. The sales outlook for yarn clearers has
been further brightened by the launch of the ground-
breaking third generation USTER® QUANTUM clear-
er at the end of September 2010. Order levels at the
end of the year were exceptionally high, indicating
future strong sales in 2011.
In the service segment the Uster Group continued to
develop strong relationships with a wider textile retailer
base, enhancing interest in a number of value-adding
services, including Intelligent Sourcing, USTERIZED®
certification and USTER® STATISTICS. The after sales
service business grew in line with instrumentation
sales.

Operative Verbesserungen und Erweiterung des
Produktangebots
2010 liess Uster Technologies AG eine der schwie-
rigsten Phasen der Unternehmensgeschichte er-
folgreich hinter sich. Die Geschäftsleitung konzen-
trierte sich darauf, die mittel- und langfristigen
Aussichten des Unternehmens durch rigorose Kos-
teneinsparungen sicherzustellen und leitete weitere
operative Verbesserungen ein. Das schlanke, flexib-
le Geschäftsmodell wurde durch Reorganisationen
und Prozessoptimierungen weltweit an allen Stand-
orten weiter gefestigt.
Der wichtigste Eckpfeiler der Wachstumsstrategie
von Uster Technologies AG – sie erhielt durch das
deutlich verbesserte wirtschaftliche Umfeld neue
Impulse – ist der Ausbau des Vertriebs- und Service-
netzwerks im wichtigen chinesischen Markt sowie
die Erweiterung des USTER®-Produktangebots und
dessen massgeschneiderte Anpassung an die sich
kontinuierlich verändernden Kundenbedürfnisse. In
der Berichtsperiode machte Uster Technologies AG
wiederum Schlagzeilen mit der Einführung neuer
Produkte. Erstens brachte die Gruppe ein neues
USTER® ZWEIGLE Laborsystem auf den Markt, das
die Garnhaarigkeit mit erheblich verbesserter Genau-
igkeit, Reproduzierbarkeit und Geschwindigkeit
misst. Zweitens lancierte Uster Technologies AG ihre
wegweisende dritte Generation des USTER® QUANTUM
Garnreinigers. Drittens wurde im chinesischen Markt
eine neue Generation des Systems USTER® SLIVER-
GUARD eingeführt. Es ist auf die Bedürfnisse lokaler
Hersteller zugeschnitten und erweitert die Präsenz
der Uster Technologies AG im Bereich der Spinne-
reivorbereitung. Ausserdem arbeitete die Gruppe
weiter an der Nutzung von Synergien, die sich aus
der strategischen Zusammenarbeit mit Toyota In-
dustries Corporation ergeben – eine Partnerschaft,
von der sich Uster Technologies AG weiteres Wachs-
tumspotenzial erhofft.
Operational Review | Operativer Rückblick 13
Operational Improvements and Further
Expansion of Product Offering
In 2010 Uster Technologies Ltd successfully emerged
from one of the most challenging periods in the or-
ganization’s history. Whilst securing the mid- and
long-term prospects of the Company by implement-
ing sweeping cost-cutting measures, management
concentrated on initiating further operational im-
provements. It further strengthened its lean and flex-
ible business model through reorganization and
process optimization throughout the worldwide
organization.
The most important pillar of Uster Technologies Ltd’s
growth strategy, which is gaining fresh momentum
in the significantly improved economic environment,
is the extension of the sales and service network in
the important Chinese market as well as the expansion
of the USTER® offering and its tailor-made adaptation
to the evolving needs of customers. In the reporting
period Uster Technologies Ltd again made headlines
with the launch of new products. First, the Group
introduced a new USTER® ZWEIGLE laboratory system
that allows yarn hairiness to be measured with much
better accuracy, reproducibility and speed. Second,
Uster Technologies Ltd launched its ground-breaking
third generation of USTER® QUANTUM clearer. Third,
a new generation of USTER® SLIVERGUARD was in-
troduced to the Chinese market. It addresses the needs
of the local manufacturers and expands Uster Tech-
nologies Ltd’s foothold in the spinning preparation
area. In addition, the Group continued to work on
technical synergies arising from the strategic col-
laboration with Toyota Industries Corporation, a
partnership which is expected to yield further growth
potential.
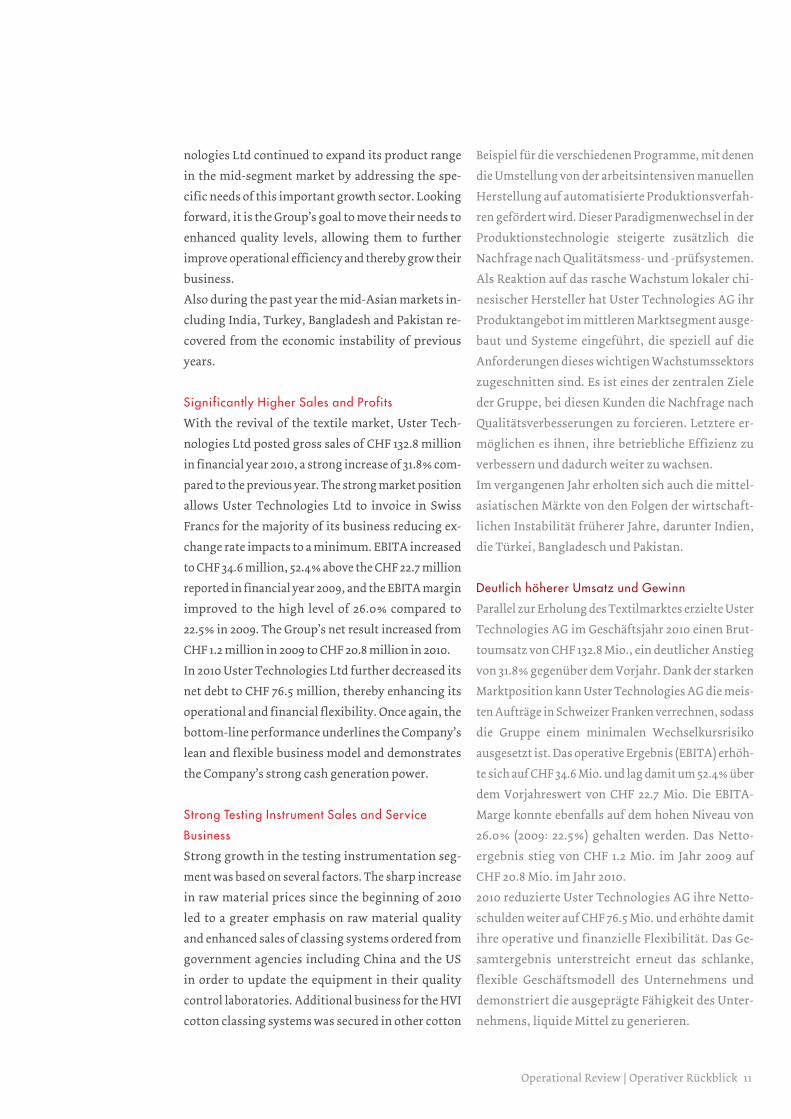
Cotton classing
Government regulatory bodies worldwide rely on
USTER® HVI and its standards in their active oversight
of growers and ginners, mitigating the risk of textile
producers purchasing poor quality or inconsistent and
deceptive products.
−
The USTER® HVI measures all the important fiber quality
parameters currently used in cotton trading to obtain
the proper mix of cotton in spinning mills: micronaire,
fiber length, length uniformity, strength, color, maturity,
and short fiber content.
“USTER® classing systems allow us to precisely define cotton quality, ensuring fair prices for producers and value transparency for buy-ers. When faced with grading the entire U.S. cotton crop each year, we need instru-ments that are accurate, pre-cise and fast, and USTER® provides a quality instrument that fits the bill.”Darryl W. Earnest, Deputy Administrator, U.S. Department of Agriculture (USDA), USA
16 Uster Technologies Ltd | Annual Report 2010
2010 profitierten alle grossen Märkte von der Kon-
junkturerholung, die den Fokus der Branche wieder
auf neue Wachstumsmöglichkeiten lenkte. Während
China auch mitten in der Krise robust blieb, erholten
sich die mittelasiatischen Märkte von der wirtschaft-
lichen Instabilität früherer Jahre, darunter Indien,
die Türkei, Bangladesch und Pakistan. Das Auftrags-
volumen wird sich 2011 voraussichtlich weiter erhö-
hen. Darüber hinaus hat die Kapazität der Spinnerei-
en weltweit zugenommen, ausgelöst durch die
Ersetzung älterer Spinn- und Spulmaschinen durch
neue hocheffiziente Systeme, die einen geringeren
Arbeitsaufwand erfordern. Ein weiterer Aspekt sind
die gestiegenen Faserpreise. Sie setzen Spinnereien
und vertikale Produzenten unter Druck, die Qualität
zu verbessern und Ausschuss zu vermeiden – eine
Aufgabe, bei deren Bewältigung Uster Technologies
AG wie kein anderer Anbieter massgeblich unterstüt-
zen kann.
Insgesamt trugen die asiatischen Länder 67.3 % zum
Gesamtbruttoumsatz bei (2009: 71.1 %); auf Europa
und Nordamerika entfielen 21.7 % bzw. 11.0 % (2009:
15.7 % bzw. 13.1 %). Das relative Umsatzwachstum in
Europa spiegelt die deutliche Auftragszunahme sei-
tens der europäischen Maschinenhersteller wider.
Insgesamt ist Asien weiterhin der dominante End-
verbrauchermarkt.
Dynamisches mittleres Marktsegment in China
Das mittlere Marktsegment in China wächst weiterhin
aufgrund der starken Inlandsnachfrage und der wach-
senden Kaufkraft sowie den steigenden Qualitätsan-
forderungen der chinesischen Käufer. Uster Techno-
logies AG setzte ihre Strategie fort, Produkte und
Hilfsmittel anzubieten, die speziell auf das mittlere
Marktsegment zugeschnitten sind. Auf der ITMA ASIA
2010 in Schanghai stellte das Unternehmen das neue
System USTER® ML100 vor, dass die Länge von Baum-
wollfasern misst. Dieses neue Produkt bildet in Kom-
bination mit dem bestehenden USTER® MN100 eine
komplette Einstiegslösung für die Prozesssteuerung
von Baumwollfasern in der Spinnerei. Gleichzeitig
führte Uster Technologies AG ihre umfangreichen
Sales and MarketingVertrieb und Marketing
In 2010 all major markets profited from the improving
economic environment, which turned the industry’s
focus back to new growth opportunities. Whilst
China performed strongly even in the midst of the
crisis, the mid-Asian markets including India, Turkey,
Bangladesh and Pakistan recovered from the eco-
nomic instability of previous years. Order levels are
expected to increase further in 2011. In addition, spin-
ning capacity expanded worldwide, driven by the
replacement of older generation spinning and wind-
ing machinery with new highly efficient equipment
requiring less labor input. Furthermore, increased
fiber prices put pressure on spinners and vertical
manufacturers to improve quality and reduce waste,
a role for which Uster Technologies Ltd is uniquely
qualified to assist.
Overall sales in the Asian markets contributed 67.3 %
to total gross sales (2009: 71.1 %); Europe and Americas
generated 21.7 % and 11.0 % of total sales (2009: 15.7 %
and 13.1 %). The relative increase in sales in Europe
reflects the strong surge in business with the Euro-
pean machinery manufacturers. Overall, Asia remains
as the dominant end-user market.
Dynamic Chinese Mid-Market
The Chinese mid-market continues to grow due to
strong domestic demand and increasing purchasing
power and quality demands of the domestic purchas-
er. Uster Technologies Ltd continued with its strat-
egy of providing products and tools customized for
the mid-market. At last year’s ITMA ASIA in Shanghai
the Company launched the new USTER® ML100 which
measures cotton fiber length. This new product in
combination with the existing USTER® MN100 pro-
vides a complete entry level solution for cotton fiber
process control in the spinning mill. In addition, Uster
Technologies Ltd continued with extensive promo-
tional and educational programs for this market. These
programs were specifically designed to enhance cus-
tomers’ understanding of the management of qual-
ity, productivity and profitability with the help of
USTER® instruments, USTER® best practices and
USTER® STATISTICS. Finally Uster Technologies Ltd
Marketing- und Schulungsprogramme für diesen
Markt fort. Diese Programme wurden speziell ent-
wickelt, um Kunden einen besseren Einblick in die
Steuerung der Qualität, Produktivität und Rentabi-
lität mit Hilfe von USTER®-Systemen, USTER® Best
Practices und USTER® STATISTICS zu geben. Schliess-
lich erweiterte die Gruppe ihr Vertriebsnetz und
damit ihre Präsenz, um die steigende Nachfrage in
diesem wichtigen Markt gezielt zu adressieren und
zu erfüllen.
USTER® QUANTUM 3:
Neuer Industriestandard für die Qualitätsprüfung
Das wichtigste Ereignis in der Berichtsperiode war
die Einführung der dritten Generation des Garnrei-
nigungssystems USTER® QUANTUM. Die Anwendung
neuester Qualitätssicherungstechnologie ermöglicht
den Textilherstellern, ihre Fertigungseffizienz und
Kostenstruktur zu optimieren. Damit wird dieses
System zu einem unverzichtbaren Bestandteil des
Qualitätsmanagements von Spinnereibetrieben. Das
System zeichnet sich durch eine neue kapazitive und
optische Hochleistungssensortechnologie aus, mit
der sämtliche Garnfehler und Unregelmässigkeiten
sichtbar gemacht werden können. Dadurch wird nicht
nur die Erkennungsgenauigkeit erheblich verbessert,
sondern der Hersteller kann auch Dünn- und Dick-
stellen, Farbabweichungen und andere unerwünsch-
te Eigenschaften identifizieren.
Das mit Spannung erwartete neue Garnreinigungs-
system wurde von den Kunden und Industriepartnern
äusserst positiv aufgenommen und kam zu einem
Zeitpunkt auf den Markt, als die Maschinenherstel-
ler sich gerade vom Konjunkturabschwung erholten.
Der anschliessende Nachfrageanstieg übertraf die
Erwartungen bei Weitem und schaffte die Voraus-
setzungen für einen erneuten Umsatzsprung 2011.
Der Produktionsaufbau und die Schulungen der
weltweiten Vertriebs- und Serviceteams begannen
im September.
Vor der Markteinführung dieser neuen Produktge-
neration feierte die Gruppe das 50-Jahre-Jubiläum
der Entwicklung des ersten elektronischen Garnrei-
Sales and Marketing | Vertrieb und Marketing 17
further strengthened its sales network thereby increas-
ing sales presence to address and to cover the growing
demand in this important market.
USTER® QUANTUM 3:
New Industry Standard in Quality Measurement
The major event during the reporting period was the
launch of the third generation of the USTER® QUAN-
TUM clearer system. This latest state-of-the-art qual-
ity assurance technology allows textile manufactur-
ers to optimize production efficiency and reduce costs,
making the device an indispensable quality manage-
ment tool in spinning plants. The system features new
powerful capacitive and optical sensor technology
that makes all disturbing defects visible, thereby sig-
nificantly enhancing detecting accuracy and enabling
manufacturers to sort out thin and thick places, in-
consistent colors or other unwanted properties.
The eagerly anticipated new yarn clearer system was
very well received by customers and industry partners
and was introduced at a time when machinery manu-
facturers were recovering from an economic down-
cycle. The subsequent surge in demand by far ex-
ceeded the expectations setting the stage for a further
jump in sales in 2011. The ramp-up of production and
the training of sales and services teams worldwide
commenced in September.
Before the launch of this new-generation product, the
Group celebrated the 50th anniversary of its develop-
ment of the first electronic yarn clearer and, even more
impressively, passed the milestone of two million
USTER® QUANTUM clearers sold.
18 Uster Technologies Ltd | Annual Report 2010
New USTER® ZWEIGLE Laboratory System:
Eight Times Faster
At the important industry fair ITMA ASIA & CITME
2010 in Shanghai, China, USTER® presented its latest
range of testing instruments under the slogan “The
Future Has a Past”, sending a powerful statement to
the market of the Group’s unrivalled record of in-
novation. In addition, the Group launched a totally
new USTER® ZWEIGLE HL400 laboratory system that
allows the measurement of yarn hairiness with im-
proved accuracy and reproducibility, and at speeds
that are eight times faster than those of previous
devices.
USTER® STATISTICS and USTERIZED®:
Enhancing the Brand
USTER® STATISTICS are used throughout the indus-
try as benchmarks for trading textile products at as-
sured levels of quality across global markets. Addi-
tional new sections for the USTER® STATISTICS were
published along with guidance on best practices. The
USTERIZED® concept (a seal of quality for yarns
tested and cleared with USTER® products) is increas-
ingly used by well-known consumer companies to
assure a consistent level of quality in support of
their own branded products. During 2010, existing
USTERIZED® mills were re-certified and addition-
al members were added to the USTERIZED® com-
munity, supported by a dedicated website that was
launched to allow promotion of information about
certified USTERIZED® customers.
nigers und erreichte den beeindruckenden Meilen -
stein von zwei Millionen verkaufter USTER® QUANTUM
Garnreiniger.
Neues USTER® ZWEIGLE Laborsystem:
acht Mal schneller
Anlässlich der wichtigen Fachmesse ITMA ASIA &
CITME 2010 in Schanghai, China, präsentierte USTER®
unter dem Motto „The Future Has a Past“ sein Sorti-
ment an Prüfsystemen. Damit setzte die Gruppe ein
starkes Zeichen im Markt, indem sie ihre unübertrof-
fene Innovationskraft demonstrierte. Gleichzeitig
brachte die Gruppe mit dem USTER® ZWEIGLE HL400
ein neues Laborsystem auf den Markt, das die Haa-
rigkeit von Garnen mit höherer Präzision und Repro-
duzierbarkeit und acht Mal schneller als bisherige
Systeme misst.
USTER® STATISTICS und USTERIZED®:
Erhöhung der Markenbekanntheit
USTER® STATISTICS werden in der gesamten Branche
und an allen Weltmärkten als Massstab für den Han-
del mit Textilprodukten von verbürgter Qualität he-
rangezogen. Es wurden neue Kapitel für USTER®
STATISTICS zusammen mit Best-Practices-Leitlinien
veröffentlicht. Immer mehr bekannte Konsumunter-
nehmen verwenden das Label USTERIZED® – ein Gü-
tesiegel für Garne, die mit USTER®-Produkten geprüft
und gereinigt wurden. Es signalisiert den Kunden die
konsequente Einhaltung hoher Qualitätsstandards.
2010 wurden bestehende USTERIZED®-Betriebe erneut
zertifiziert und neue Mitglieder in den Kreis der Un-
ternehmen mit dem Siegel USTERIZED® aufgenommen.
Ihnen allen steht eine eigene neue Website zur Ver-
fügung, auf der Angebote und Informationen über
zertifizierte USTERIZED®-Kunden abgerufen werden
können.

Sales and Marketing | Vertrieb und Marketing 19
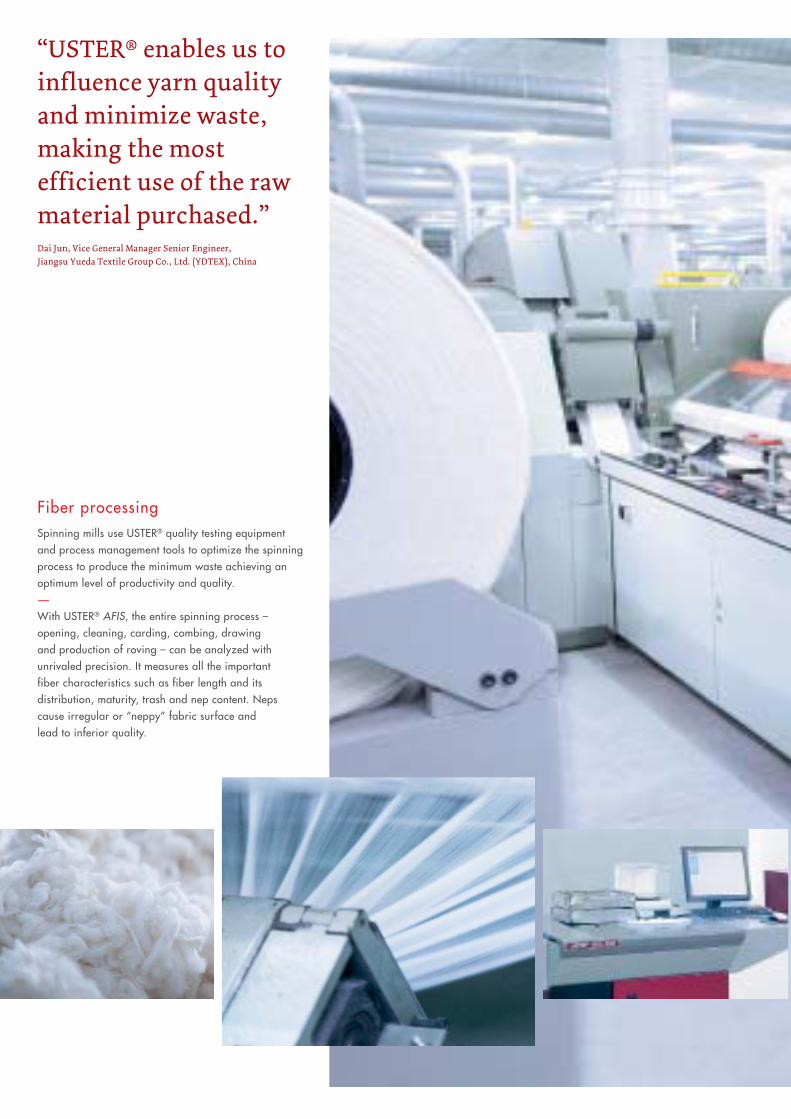
Fiber processing
Spinning mills use USTER® quality testing equipment
and process management tools to optimize the spinning
process to produce the minimum waste achieving an
optimum level of productivity and quality.
−
With USTER® AFIS, the entire spinning process –
opening, cleaning, carding, combing, drawing
and production of roving – can be analyzed with
unrivaled precision. It measures all the important
fiber characteristics such as fiber length and its
distribution, maturity, trash and nep content. Neps
cause irregular or “neppy” fabric surface and
lead to inferior quality.
“USTER® enables us to influence yarn quality and minimize waste, making the most efficient use of the raw material purchased.”Dai Jun, Vice General Manager Senior Engineer,Jiangsu Yueda Textile Group Co., Ltd. (YDTEX), China

22 Uster Technologies Ltd | Annual Report 2010
Innovation ist ein wichtiger Motor für künftiges
Wachstum und ein wesentlicher Grund für die ausge-
zeichnete Marktposition von Uster Technologies AG.
Die Geschäftsleitung hat sich das Ziel gesetzt, wei-
terhin rund 10 % des Gesamtumsatzes in F&E zu in-
vestieren. 2010 beliefen sich die F&E-Aufwendungen
auf CHF 14.9 Mio. Dies entspricht einem Umsatz-
anteil von 11.2 % (2009: CHF 11.0 Mio.; 10.9 %). Dieser
hohe F&E-Aufwand widerspiegelt die frühzeitige
Antizipation der sich erholenden Märkte und die
unverzügliche Wiederaufnahme aller zuvor zu-
rückgestellten Projekte. Die Massnahmen verfolg-
ten das Ziel, durch die schnelle Markteinführung
neuer innovativer Produkte in vollem Umfang vom
Marktaufschwung profitieren zu können.
Technologiezentrum Uster:
Fokus auf Produkteinführungen
Während der Berichtsperiode konzentrierte sich das
F&E-Team in Uster auf die neue, dritte Generation
des Garnreinigungssystems USTER® QUANTUM.
Nach intensiven, umfassenden Tests brachten Ver-
kauf und Marketing dieses Produkt Ende September
2010 auf den Markt. Es bietet den Kunden neue ein-
zigartige Möglichkeiten, ihre Wertschöpfung zu
steigern. Neben der Einführung von USTER® QUAN-
TUM 3 stellten die F&E-Spezialisten eine komplett
neue Software für Expert-Systeme der Gruppe fer-
tig. Sie basiert auf neuesten Entwicklungstools und
-prozessen. Ferner wurde an der ITMA ASIA 2010 das
neue System USTER® ZWEIGLE HL400 zur Haarig-
keitslängenklassierung präsentiert. Kernstück ist
eine neue Sensortechnologie, mit der sich Messun-
gen acht Mal schneller als mit bisherigen Systemen
durchführen lassen.
Ein zweiter Schwerpunkt lag auf der Nutzung von
Synergien, die sich aus der strategischen Zusam-
menarbeit mit der Toyota Industries Corporation
ergeben. Durch den gegenseitigen Austausch von
Know-how soll internes Wissen für die Entwick-
lung neuer innovativer Produkte genutzt werden.
Diese sollen den Kunden einen Zusatznutzen lie-
fern, indem sie ihnen ermöglichen, ihre Qualität zu
steigern, effizienter zu produzieren und die Kosten
zu senken.
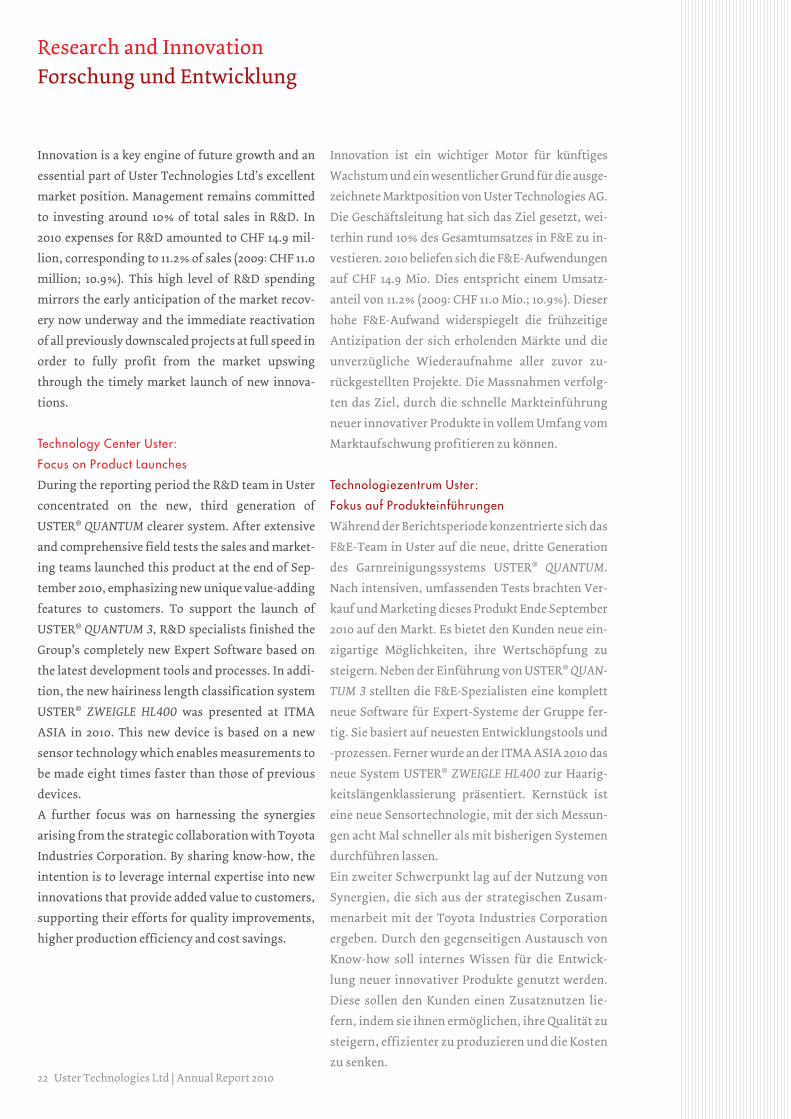
Research and InnovationForschung und Entwicklung
Innovation is a key engine of future growth and an
essential part of Uster Technologies Ltd’s excellent
market position. Management remains committed
to investing around 10 % of total sales in R&D. In
2010 expenses for R&D amounted to CHF 14.9 mil-
lion, corresponding to 11.2 % of sales (2009: CHF 11.0
million; 10.9 %). This high level of R&D spending
mirrors the early anticipation of the market recov-
ery now underway and the immediate reactivation
of all previously downscaled projects at full speed in
order to fully profit from the market upswing
through the timely market launch of new innova-
tions.
Technology Center Uster:
Focus on Product Launches
During the reporting period the R&D team in Uster
concentrated on the new, third generation of
USTER® QUANTUM clearer system. After extensive
and comprehensive field tests the sales and market-
ing teams launched this product at the end of Sep-
tember 2010, emphasizing new unique value-adding
features to customers. To support the launch of
USTER® QUANTUM 3, R&D specialists finished the
Group’s completely new Expert Software based on
the latest development tools and processes. In addi-
tion, the new hairiness length classification system
USTER® ZWEIGLE HL400 was presented at ITMA
ASIA in 2010. This new device is based on a new
sensor technology which enables measurements to
be made eight times faster than those of previous
devices.
A further focus was on harnessing the synergies
arising from the strategic collaboration with Toyota
Industries Corporation. By sharing know-how, the
intention is to leverage internal expertise into new
innovations that provide added value to customers,
supporting their efforts for quality improvements,
higher production efficiency and cost savings.
Technologiezentrum Knoxville:
Schwerpunkt Klassierungsprojekte
Klassierungsprojekte und neue Entwicklungen sind
weiterhin die Haupttätigkeitsfelder des Technolo-
giezentrums in Knoxville. Die technische Unterstüt-
zung des US-Landwirtschaftsministeriums (USDA)
und der chinesischen Behörde für Faserprüfung
(CFIB) sowie andere internationale Klassierungspro-
jekte wurden auf unvermindert hohem Niveau fort-
gesetzt. Der Schwerpunkt lag dabei auf der nächsten
Generation von HVI-Systemen für die USDA.
Die Technologiezentren in Suzhou und Knoxville
nahmen ein gemeinsames Projekt zur Adressierung
neuer Anforderungen des CFIB auf, in das die globa-
len Entwicklungskompetenzen der Gruppe einflies-
sen werden.
Technologiezentrum Suzhou:
Fokus auf USTER® SLIVERGUARD
Das F&E-Team in Suzhou schloss mit umfangrei-
cher Unterstützung durch das Technologiezentrum
in Uster die Entwicklung des USTER® SLIVERGUARD
ab, eines hochmodernen Online-Systems zur Über-
wachung der Qualität von Bändern. Dieses System
wurde im zweiten Halbjahr 2010 erfolgreich im
chinesischen Markt eingeführt.
Research and Innovation | Forschung und Entwicklung 23
Technology Center Knoxville:
Focus on Classing Projects
Classing projects and new developments continue
to be the major focus of the Technology Center in
Knoxville. Technical support to the United States
Department of Agriculture (USDA) and China Fiber
Inspection Bureau (CFIB) and other international
classing projects continued at high levels. The fo-
cus was on the next generation of HVI for the
USDA.
A joint project between the Technology Centers in
Suzhou and Knoxville to address new requirements
for CFIB was started to leverage the Group’s global
development capabilities.
Technology Center Suzhou:
Focus on USTER® SLIVERGUARD
The R&D team in Suzhou, with strong support
provided by the Technology Center in Uster, com-
pleted the development of a new generation of the
online sliver quality monitoring system USTER®
SLIVERGUARD. This system was successfully in-
troduced to the Chinese market in the second half
of 2010.
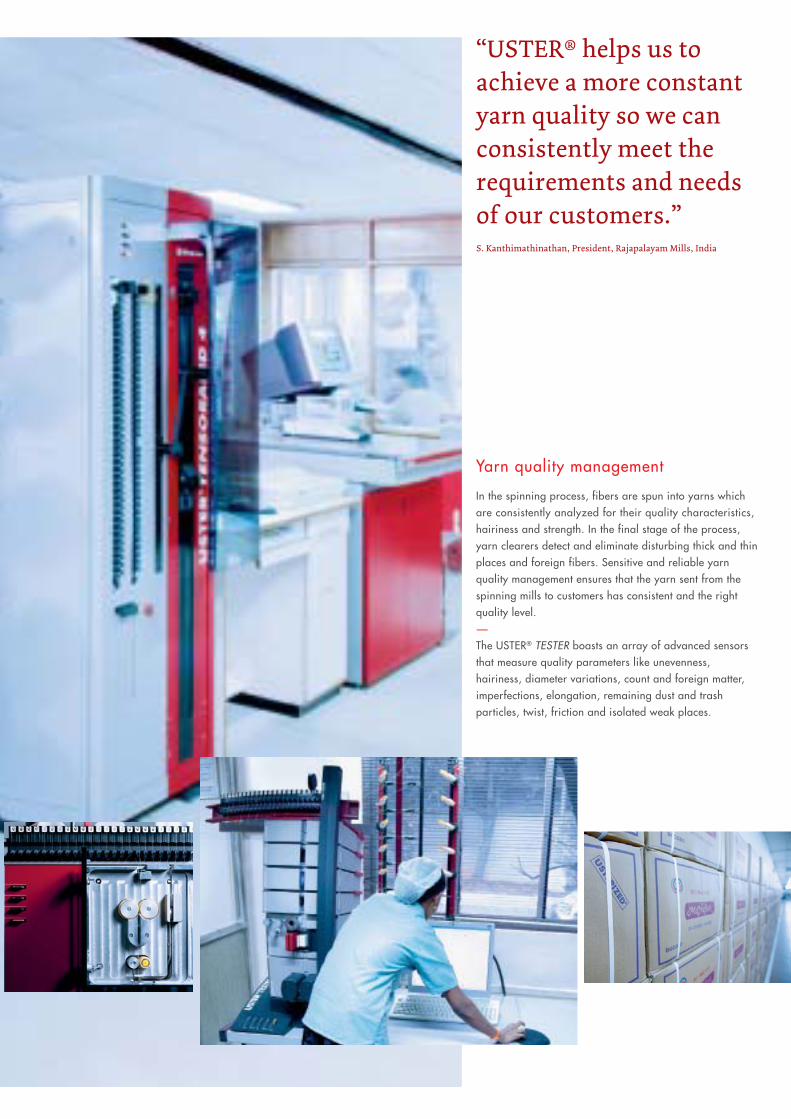
“USTER® helps us to achieve a more constant yarn quality so we can consistently meet the requirements and needs of our customers.”S. Kanthimathinathan, President, Rajapalayam Mills, India
Yarn quality management
In the spinning process, fibers are spun into yarns which
are consistently analyzed for their quality characteristics,
hairiness and strength. In the final stage of the process,
yarn clearers detect and eliminate disturbing thick and thin
places and foreign fibers. Sensitive and reliable yarn
quality management ensures that the yarn sent from the
spinning mills to customers has consistent and the right
quality level.
−
The USTER® TESTER boasts an array of advanced sensors
that measure quality parameters like unevenness,
hairiness, diameter variations, count and foreign matter,
imperfections, elongation, remaining dust and trash
particles, twist, friction and isolated weak places.
26 Uster Technologies Ltd | Annual Report 2010
2010 erzielte Uster Technologies AG weitere Fortschrit-
te bei der Erhöhung der betrieblichen Produktivität.
Die Gruppe fuhr fort, ihr globales Supply-Chain-
Management weiterzuentwickeln und bezog vermehrt
Materialien aus Niedrigkostenländern. Gleichzeitig
arbeiteten die Technologiezentren in gemeinsamen
Projekten mit ihren weltweiten Outsourcing-Partnern
daran, die Prozessabläufe zu vereinfachen und die
Effizienz zu erhöhen. Auf der Basis des schlanken,
flexiblen Geschäftsmodells der Gruppe war die Ge-
schäftsleitung dank dieser Massnahmen in der Lage,
die Ressourcen – in Erwartung des Marktaufschwungs
– schnell an die wieder belebte Nachfrage in der Tex-
tilindustrie anzupassen.
Optimierte globale Beschaffung
Da das Material einen Grossteil der Produktionskos-
ten der Gruppe ausmacht, zählt die Bewertung der
Lieferantenleistung und die Identifizierung poten-
zieller neuer Lieferanten weiterhin zu den wichtigs-
ten Aufgaben. Uster Technologies AG baute die glo-
bale Beschaffungsorganisation weiter aus. Dabei
konzentrierten sich die Spezialisten auf die Überar-
beitung ausgewählter Komponenten und die Erschlies-
sung neuer Bezugsquellen in China und anderen
Niedrigkostenländern. Neben der Ausnutzung von
Währungsschwankungen führte diese Strategie zu
einem bedeutenden Anstieg der weltweiten Einkaufs-
volumen und erheblichen Kosteneinsparungen.
Eine weitere wichtige Aufgabe im Berichtszeitraum
war das Management und die Neuausrichtung der
Lieferkette, um das Unternehmen schnell vom vola-
tilen Marktumfeld auf den unerwartet rasanten Nach-
frageanstieg nach der Markterholung umzustellen.
Insbesondere die grosse Nachfrage nach dem neuen
USTER® QUANTUM 3 Garnreiniger stellte das Einkaufs-
team der Gruppe vor aussergewöhnliche Herausfor-
derungen und führte zu verlängerten Lieferzeiten und
begrenzten Liefermengen. Hier war trotz der Verwen-
dung alternativer Lieferanten und der täglichen Über-
prüfung der Montagepläne auf Basis der Materialver-
fügbarkeit ein hohes Mass an Flexibilität erforderlich.
OperationsProduktion und Logistik
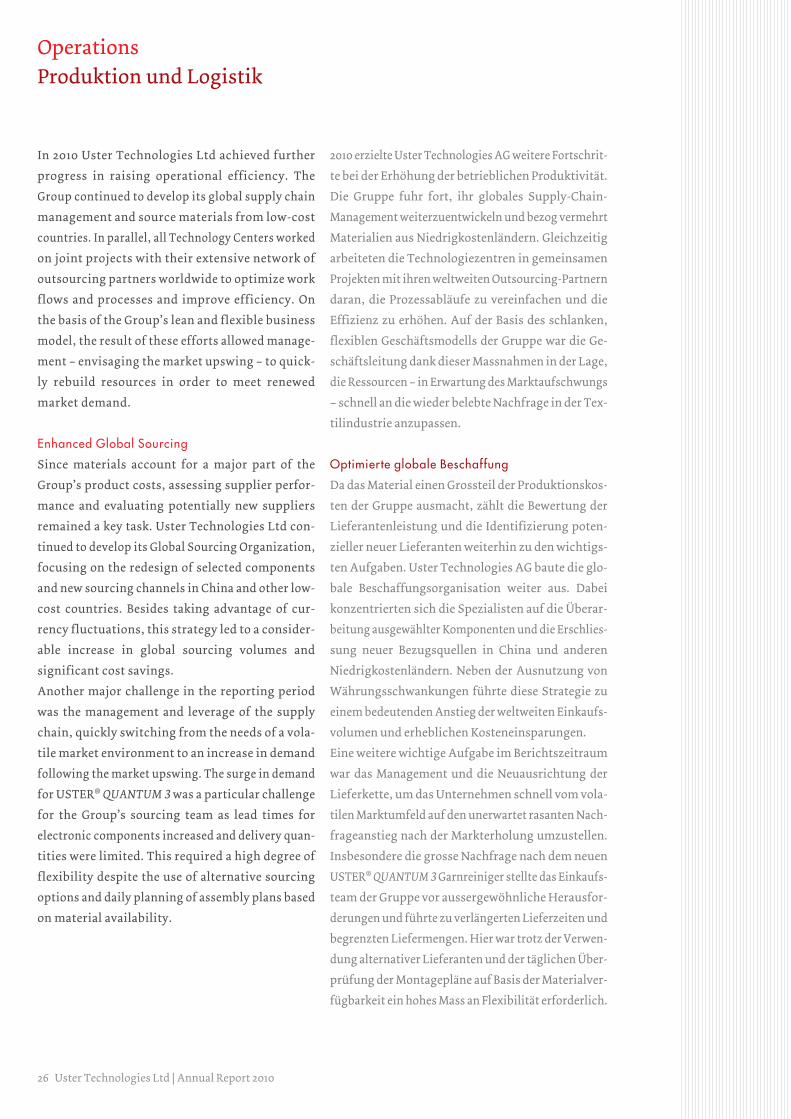
In 2010 Uster Technologies Ltd achieved further
progress in raising operational efficiency. The
Group continued to develop its global supply chain
management and source materials from low-cost
countries. In parallel, all Technology Centers worked
on joint projects with their extensive network of
outsourcing partners worldwide to optimize work
flows and processes and improve efficiency. On
the basis of the Group’s lean and flexible business
model, the result of these efforts allowed manage-
ment – envisaging the market upswing – to quick-
ly rebuild resources in order to meet renewed
market demand.
Enhanced Global Sourcing
Since materials account for a major part of the
Group’s product costs, assessing supplier perfor-
mance and evaluating potentially new suppliers
remained a key task. Uster Technologies Ltd con-
tinued to develop its Global Sourcing Organization,
focusing on the redesign of selected components
and new sourcing channels in China and other low-
cost countries. Besides taking advantage of cur-
rency fluctuations, this strategy led to a consider-
able increase in global sourcing volumes and
significant cost savings.
Another major challenge in the reporting period
was the management and leverage of the supply
chain, quickly switching from the needs of a vola-
tile market environment to an increase in demand
following the market upswing. The surge in demand
for USTER® QUANTUM 3 was a particular challenge
for the Group’s sourcing team as lead times for
electronic components increased and delivery quan-
tities were limited. This required a high degree of
flexibility despite the use of alternative sourcing
options and daily planning of assembly plans based
on material availability.
Aufbau der Lieferkette für USTER® QUANTUM 3
Eine weitere Herausforderung stellte die Anlauf phase
in der Produktion der neuen Generation von Garnrei-
nigern dar. Sie erforderte den Aufbau einer neuen
Lieferkette für diese Produktgruppe und die Einrich-
tung und Etablierung der entsprechenden Herstell-
und Qualitätsprozesse. Die ehrgeizigen Kostenvor-
gaben für den neuen Reiniger wurden dank dem
konsequenten Einkauf aller Materialien in Niedrig-
kostenmärkten eingehalten. Ausserdem wurde für
diese USTER® QUANTUM 3 Reinigergeneration in
Uster ein halbautomatisches Montagesystem instal-
liert, das grosse Flexibilität bei der Mengenanpassung
und eine strenge Kontrolle des Fertigungsprozesses
ermöglicht. Eine neue Prüf- und Kalibrierungsinfra-
struktur gewährleistet zudem, dass alle ausgeliefer-
ten Garnreiniger die USTER®-Qualitätsstandards
erfüllen.
Operations | Produktion und Logistik 27
New Supply Chain for USTER® QUANTUM 3
Another major challenge was the phase-in-process
of the new yarn clearer generation, which entailed
the setting-up of a new supply chain for this prod-
uct group as well as tooling and quality processes.
Demanding cost targets for the new clearer family
were met by sourcing all material from low-cost
markets. Furthermore, a semi-automatic assembly
system for the USTER® QUANTUM 3 clearer gen-
eration was installed in Uster that offers greater
flexibility to adjust volumes and ensures tight
manufacturing process control. In addition, new
testing and calibration infrastructure ensures that
all delivered clearers comply with the USTER® qual-
ity standards.
28 Uster Technologies Ltd | Annual Report 2010
In Anbetracht der starken Nachfrage in den asiati-
schen Märkten, vor allem in China und Indien, und
der Trends zu Qualität und Automatisierung in den
Schwellenländern geht Uster Technologies AG ge-
genwärtig davon aus, dass der Aufwärtstrend des
Marktes anhalten wird.
Vor diesem Hintergrund erwartet die Unternehmens-
leitung, dass sich die Gruppe mit ihrer erfolgreichen
Strategie, die auf den Basispfeilern Innovationsfüh-
rerschaft, aktives Kostenmanagement und Erweite-
rung des modernen Produkt- und Serviceangebots
beruht, ihre Marktposition weiter ausbauen kann.
Für das Geschäftsjahr 2011 ist die Unternehmens-
führung zuversichtlich, ihr Geschäft auf vergleich-
barem Niveau wie 2010 mit einer EBITA-Marge über
25 % auszuweiten.
Auch zukünftig räumt Uster Technologies AG der
weiteren Stärkung ihrer Wettbewerbsposition hohe
Priorität ein. Das Unternehmen beabsichtigt, neue,
innovative Produkte in allen Marktsegmenten ein-
zuführen und die globale Vertriebsorganisation zu
erweitern. Gleichzeitig wird die Gruppe attraktive
Geschäftsmöglichkeiten ergreifen, die über das Po-
tenzial verfügen, den Mehrwert für die Kunden zu
steigern.
OutlookAusblick
Uster Technologies Ltd is currently expecting on-
going market growth in view of the strong demand
from Asian markets, especially from China and India,
and the increased move towards quality and auto-
mation in emerging markets.
Based on its successful strategy of innovation lead-
ership, proactive cost management and the expansion
of its state-of-the-art product and service offering,
Uster Technologies Ltd is confident it will further
strengthen its market position.
For the financial year 2011 management is confident
that the business will grow at similar levels as 2010
with EBITA margins above 25 %.
Going forward, Uster Technologies Ltd will maintain
its focus on strengthening its competitive position-
ing by introducing new state-of-the-art products in
all market segments and expanding its global sales
organization. At the same time the Group will seize
attractive business opportunities with the potential
to increase the added value of its offering to clients.
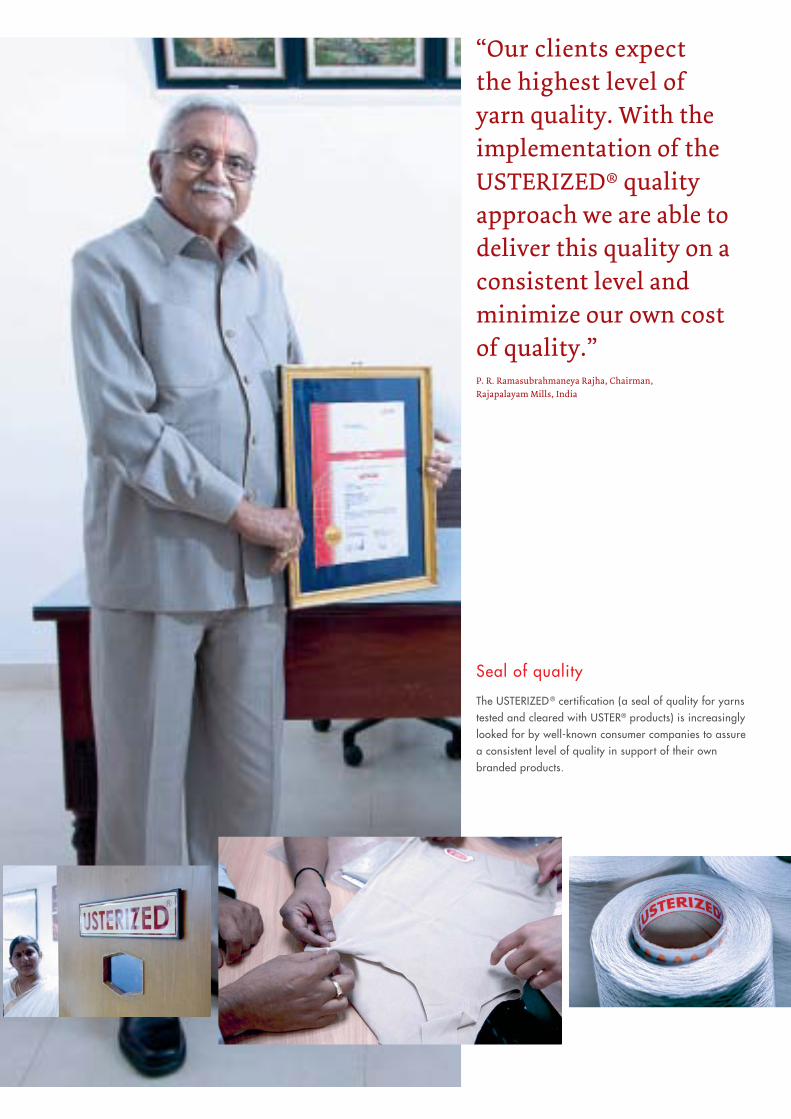
“Our clients expect the highest level of yarn quality. With the implementation of the USTERIZED® quality approach we are able to deliver this quality on a consistent level and minimize our own cost of quality.”P. R. Ramasubrahmaneya Rajha, Chairman,Rajapalayam Mills, India
Seal of quality
The USTERIZED ® certification (a seal of quality for yarns
tested and cleared with USTER® products) is increasingly
looked for by well-known consumer companies to assure
a consistent level of quality in support of their own
branded products.
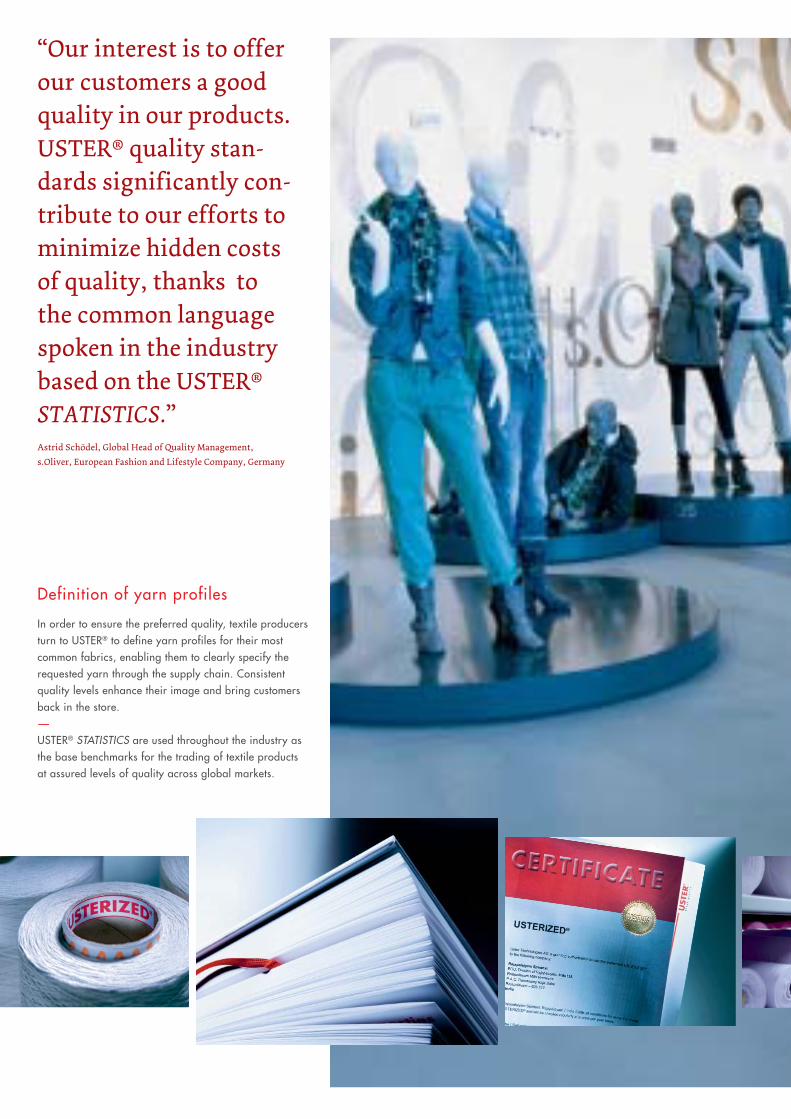
Definition of yarn profiles
In order to ensure the preferred quality, textile producers
turn to USTER® to define yarn profiles for their most
common fabrics, enabling them to clearly specify the
requested yarn through the supply chain. Consistent
quality levels enhance their image and bring customers
back in the store.
−
USTER® STATISTICS are used throughout the industry as
the base benchmarks for the trading of textile products
at assured levels of quality across global markets.
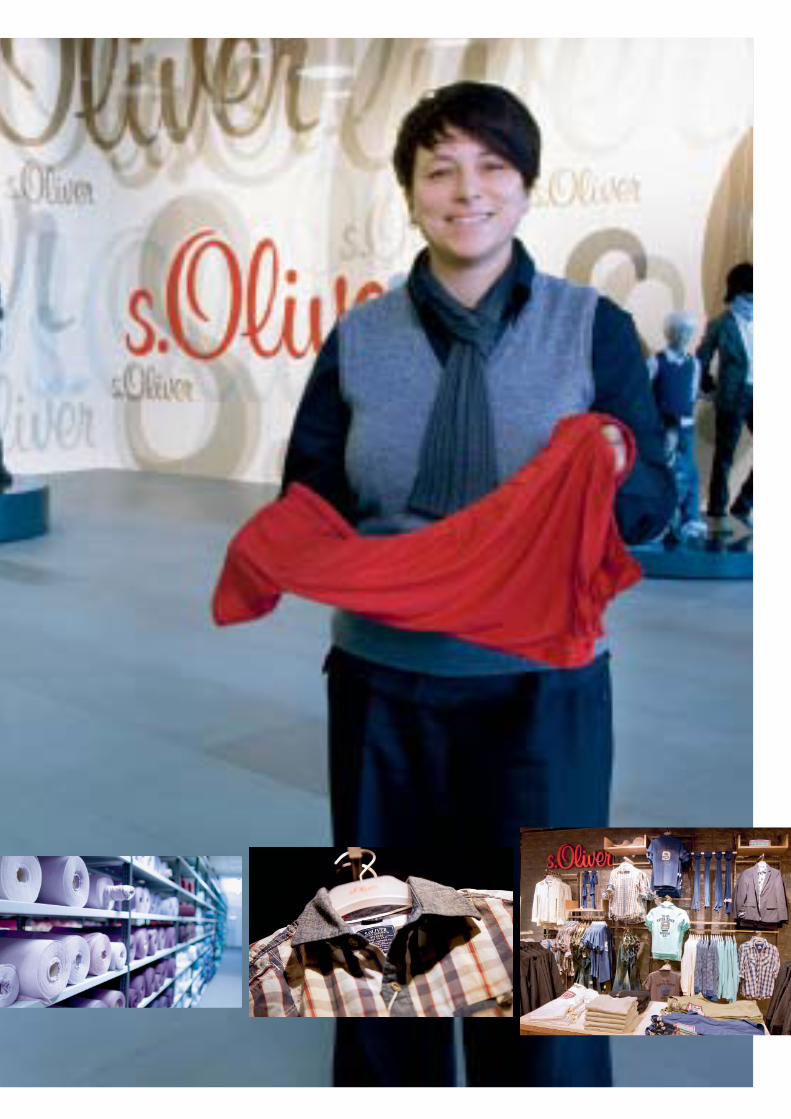
“Our interest is to offer our customers a good quality in our products.USTER® quality stan-dards significantly con-tribute to our efforts to minimize hidden costs of quality, thanks to the common language spoken in the industry based on the USTER® STATISTICS.”Astrid Schödel, Global Head of Quality Management,
s.Oliver, European Fashion and Lifestyle Company, Germany

32 Uster Technologies Ltd | Annual Report 2010
Corporate Governance
The information disclosed in this section follows the Directive on Information Relating to Corporate Gov-
ernance issued by the SIX Swiss Exchange and complies largely with the Swiss Code of Best Practice for
Corporate Governance issued by Economiesuisse. Uster Technologies Ltd has implemented these principles
of good corporate governance in its articles of association, its organizational rules and its code of conduct.
All information shown in this section applies to the balance sheet date if not indicated otherwise. Significant
changes between the balance sheet date and the copy deadline of the annual report are listed under “10 Mate-
rial Changes since the Balance Sheet Date” at the end of this section.
Further information on Corporate Governance can be found by visiting Uster Technologies Ltd’s website at
www.uster-investors.com/governance.php.
1 Group Structure and Shareholders
1.1 Group Structure
1.1.1 Operational Structure
The operational structure of the Uster Group is illustrated below:
Board of Directors
5 members
Chairman Max-Ulrich Zellweger
Executive Committee
9 membersCEO Geoffrey Scott
Finance and Support
CFO Thomas F. Dressendörfer
Sales and Service
Harold Hoke
Textile Technology
Richard Furter
Research and Innovation
Rafael Storz
U.S. Operations
Hossein Ghorashi
Asian Operations
Naiming Wei
Order Fulfi llment
Renato Murk
Marketing and Business
Development
Deniz Bütüner (until December 31, 2010)
Reine Wasner(starting from January 1, 2011)
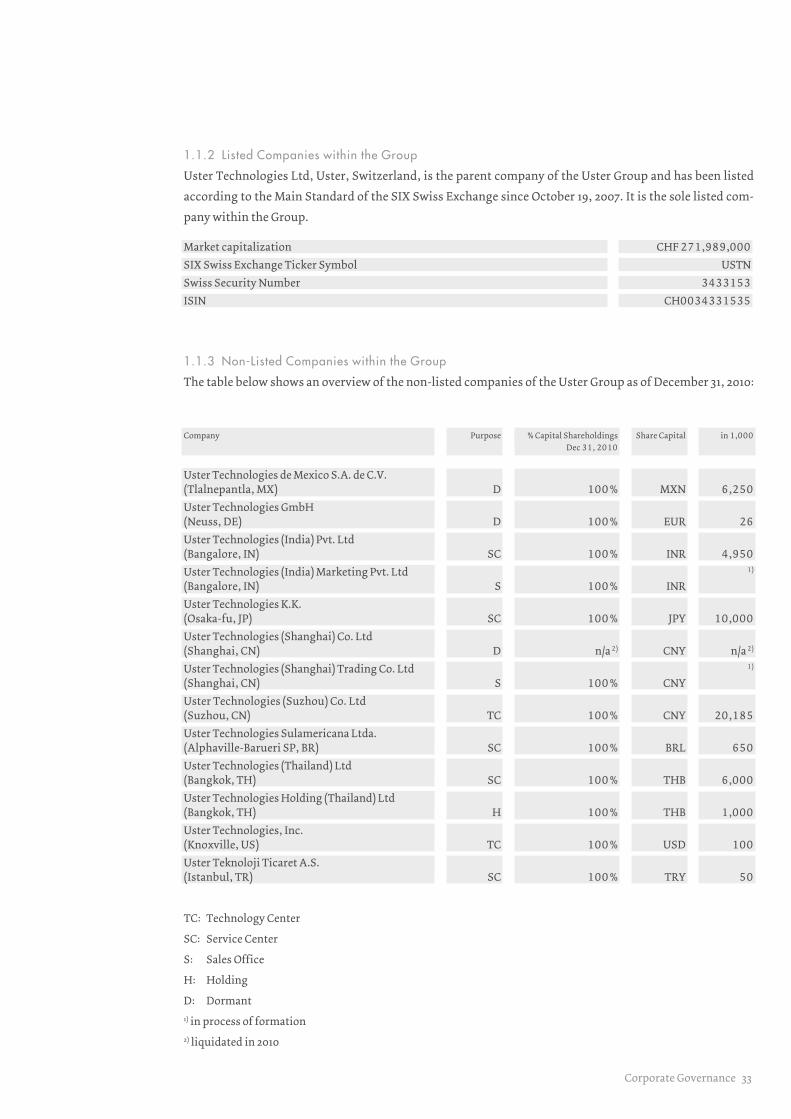
Corporate Governance 33
1.1.2 Listed Companies within the Group
Uster Technologies Ltd, Uster, Switzerland, is the parent company of the Uster Group and has been listed
according to the Main Standard of the SIX Swiss Exchange since October 19, 2007. It is the sole listed com-
pany within the Group.
Market capitalization CHF 271,989,000
SIX Swiss Exchange Ticker Symbol USTN
Swiss Security Number 3433153
ISIN CH0034331535
1.1.3 Non-Listed Companies within the Group
The table below shows an overview of the non-listed companies of the Uster Group as of December 31, 2010:
Company Purpose % Capital Shareholdings
Dec 31, 2010
Share Capital in 1,000
Uster Technologies de Mexico S.A. de C.V.(Tlalnepantla, MX) D 100 % MXN 6,250
Uster Technologies GmbH(Neuss, DE) D 100 % EUR 26
Uster Technologies (India) Pvt. Ltd(Bangalore, IN) SC 100 % INR 4,950
Uster Technologies (India) Marketing Pvt. Ltd(Bangalore, IN) S 100 % INR
1)
Uster Technologies K.K.(Osaka-fu, JP) SC 100 % JPY 10,000
Uster Technologies (Shanghai) Co. Ltd(Shanghai, CN) D n/a 2) CNY n/a 2)
Uster Technologies (Shanghai) Trading Co. Ltd(Shanghai, CN) S 100 % CNY
1)
Uster Technologies (Suzhou) Co. Ltd
(Suzhou, CN) TC 100 % CNY 20,185
Uster Technologies Sulamericana Ltda.(Alphaville-Barueri SP, BR) SC 100 % BRL 650
Uster Technologies (Thailand) Ltd(Bangkok, TH) SC 100 % THB 6,000
Uster Technologies Holding (Thailand) Ltd(Bangkok, TH) H 100 % THB 1,000
Uster Technologies, Inc.(Knoxville, US) TC 100 % USD 100
Uster Teknoloji Ticaret A.S.(Istanbul, TR) SC 100 % TRY 50
TC: Technology Center
SC: Service Center
S: Sales Office
H: Holding
D: Dormant1) in process of formation2) liquidated in 2010
34 Uster Technologies Ltd | Annual Report 2010
1.2 Significant Shareholders
As of December 31, 2010, 880 shareholders (2009: 1,017) were registered in the share register of Uster Tech-
nologies Ltd. In the course of 2010 the following disclosure announcements were made according to art.
20 f. of the Swiss Federal Stock Exchange and Securities Trading Act (SESTA):
• July 22, 2010, Balfidor Fondsleitung, CH-Basel, announced that its stake in the Company’s share capital
increased to 3.09 %.
• November 30, 2010, Uster Management informed that part of the Board and Uster Management formed
a group for purchase and sale of shares.
The following major shareholders owned more than 3.0 % of the share capital of Uster Technologies Ltd as
of December 31, 2010:
• Alcide Ltd 27.9 %
• Toyota Industries Corporation 22.5 %
• Board and Management Group 1) 8.1 %
• T. Rowe Price International Inc. 4.5 %
• Bär Marc Philipp 3.1 %
• Balfidor Fondsleitung AG 3.1 %
1) Part of Board and Management formed a Group for purchase and sale of shares
1.3 Cross-Shareholdings
Uster Technologies Ltd does not have any cross-shareholdings with other companies.
Corporate Governance 35
2 Capital Structure
2.1 Ordinary Share Capital
The ordinary share capital of Uster Technologies Ltd as of December 31, 2010, amounted to CHF 79,524,000
and was fully paid up. It consisted of 8,460,000 registered shares with a nominal value of CHF 9.40 each.
2.2 Authorized and Conditional Share Capital
As of December 31, 2010, Uster Technologies Ltd had an authorized share capital of CHF 17,860,000.
According to the articles of association of Uster Technologies Ltd, the Board of Directors is authorized,
at any time until March 30, 2012, to increase the share capital by an amount not to exceed CHF 17,860,000
through the issuance of up to 1,900,000 fully paid registered shares with a nominal value of CHF 9.40 each.
An increase in partial amounts is permitted.
The Board of Directors determines the issue price, the type of payment, the date of issue of new shares,
the conditions for the exercise of pre-emptive rights and the beginning date for the dividend entitlement.
In this regard, the Board of Directors may issue new shares by means of a firm underwriting through a
banking institution, a syndicate or another thirdparty with a subsequent offer of these shares to the cur-
rent shareholders (unless the pre-emptive rights of current shareholders are excluded). The Board of Di-
rectors may permit pre-emptive rights that have not been exercised to expire or it may place these rights
and/or shares as to which pre-emptive rights have been granted but not exercised, at market conditions
or use them for other purposes in the interest of Uster Technologies Ltd.
The subscription and acquisition of the new shares, as well as each subsequent transfer of the shares, shall
be subject to the restrictions mentioned under “2.6 Limitations on Transferability and Nominee Registra-
tions”. The Board of Directors is authorized to restrict or exclude the pre-emptive rights of shareholders
and allocate such rights to third parties if the shares are to be used (a) for the acquisition of enterprises,
parts of an enterprise of participations, or for new investments, or, in case of a share placement, for the
financing or refinancing of such transactions; or (b) for the purpose of the participation of strategic part-
ners (including in the event of a public tender offer) or for the purpose of an expansion of the shareholder
constituency in certain investor markets or in connection with the listing of the shares at domestic or
foreign exchanges, including for the purpose of the delivery of shares to the involved banks in case of the
over-allotment option.
As of December 31, 2010, Uster Technologies Ltd had a conditional share capital, pursuant to which the
share capital may be increased by a maximum aggregate amount of CHF 3,008,000 through the issuance
of a maximum of 320,000 fully paid registered shares with a nominal value of CHF 9.40 each by the exercise
of option rights which the employees, the Management or Directors of Uster Technologies Ltd or another
Group company may be granted in the future. The pre-emptive rights of the shareholders are excluded.
The acquisition of registered shares through the exercise of option rights and the subsequent transfer of
the registered shares are subject to the transfer restrictions mentioned under “2.6 Limitations on Trans-
ferability and Nominee Registrations”.
36 Uster Technologies Ltd | Annual Report 2010
2.3 Changes in Share Capital
March 30, 2010 New authorized share capital of CHF 17,860,000 was created including the authorization
to increase the share capital until March 30, 2012, by amending article 3a of the articles
of association.
November 2, 2009 The nominal share capital was increased from CHF 61,664,000 to CHF 79,524,000 by
the issuance of 1,900,000 registered shares with a nominal value of CHF 9.40 each. The
new shares were issued from the Company’s authorized share capital to Toyota Indus-
tries Corporation at a price of CHF 23.09 per share, representing a premium of 10 % over
the volume-weighted average share price of the last 30 trading days prior to the capital
increase.
June 13, 2008 A dividend payment by way of nominal value reduction of CHF 0.60 per share reduced
the nominal value from CHF 10 to CHF 9.40 per ordinary share and the nominal share
capital by CHF 3,936,000 to CHF 61,664,000.
October 18, 2007 The share capital was increased from CHF 45,600,000 to CHF 65,600,000 by the issuance
of 2,000,000 shares with a nominal value of CHF 10 each. Both the authorized and con-
ditional share capital increase have been approved at the extraordinary Shareholders’
meeting on October 4, 2007.
2.4 Shares and Participation Certificates
2.4.1 Shares
Each share has a nominal value of CHF 9.40 and each share recorded and registered under a shareholder’s
name in the share register of Uster Technologies Ltd is entitled to one vote. There are no preferential rights
for individual shareholders and all shareholders are entitled to equal dividends.
On January 1, 2009, the new Swiss Federal Act on Intermediated Securities (FISA) became effective. Uster
Technologies Ltd created the uncertificated securities book (Wertrechtebuch) pursuant to art. 973c of the
Swiss Code of Obligations. In addition the shares of Uster Technologies Ltd are registered with the SIX
SIS AG and qualify as intermediated securities in accordance with the FISA.

Corporate Governance 37
2.4.2 Participation Certificates
Uster Technologies Ltd has not issued any participation certificates.
2.5 Profit Sharing Certificates
Uster Technologies Ltd has not issued any profit sharing certificates.
2.6 Limitations on Transferability and Nominee Registrations
2.6.1 Limitations on Transferability
Acquirers of registered shares will be recorded in the share register as shareholders with the right to vote,
provided they explicitly declare to have acquired these registered shares in their own name and for their own
account.
2.6.2 Nominee Registrations
Nominees are persons or entities who do not expressly declare in the application form to hold the shares for
their own account and with whom the Board of Directors has entered into the according contractual agreements.
According to the articles of association, the Board of Directors may record nominees in the share register with
voting rights for shares up to a maximum of 3.0 % of the outstanding nominal share capital. Shares held by a
nominee that exceed this limit are only registered in the share register with voting rights if such nominee de-
clares in writing to disclose name, address and shareholding of any person or legal entity for whose account it
is holding 1.0 % or more of the outstanding share capital.
Legal entities and associations or other partnerships that are linked by capital, voting power, management or
in other manner as well as all persons, entities and partnerships that are acting in concert with a view to cir-
cumvent the restrictions on nominee registration (especially as a syndicate) are deemed to be one nominee.
2.7 Convertible Bonds and Warrants/Options
Uster Technologies Ltd has not issued any convertible bonds, warrants or options. Uster Technologies Ltd
has a Restricted Stock Unit (RSU) plan, the essentials of which are set forth under “5 Compensation, Share-
holdings and Loans”.

38 Uster Technologies Ltd | Annual Report 2010
Board of Directors
Members of the Board of Directors
Akira Onishi
1958, Japan
Member
Elected in: 2010
Elected until: 2013
Harald Rönn
1960, German
Vice-Chairman
Elected in: 2007
Elected until: 2011
Max-Ulrich Zellweger
1941, Swiss
Chairman
Elected in: 2003
Elected until: 2013
Barry James Mulady
1947, British
Member
Elected in: 2003
Elected until: 2012
Geoffrey Scott
1954, British
Member
Elected in: 2003
Elected until: 2013
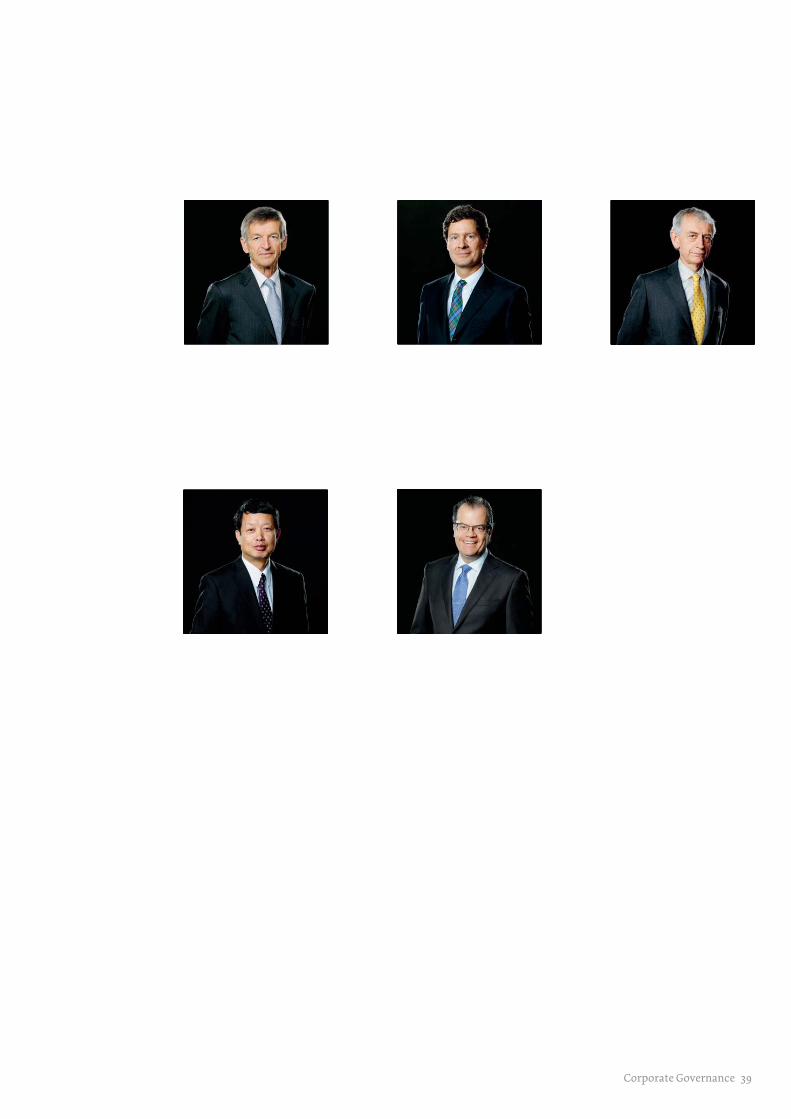
Corporate Governance 39

40 Uster Technologies Ltd | Annual Report 2010
3 Board of Directors
3.1 Members of the Board of Directors
The following information sets forth the name, year of birth, function, election and directorship term of
each Member of the Board of Directors, all of whom except for Geoffrey Scott are non-executive directors,
followed by a short description of each Member’s business experience, education and activities.
Max-Ulrich Zellweger, Chairman of the Board of Directors
Max-Ulrich Zellweger has been a Member of the Board of Directors of Uster Technologies Ltd since 2003 and
is elected until 2013. Between 1987 and 1992 he was Area Manager Asia Pacific of Schindler Elevators Co. and
in this function responsible for the subsidiaries and joint ventures of Schindler in China, Japan, India, Hong
Kong and other Asian countries. He is now Managing Partner of Pacific Consult Ltd, a Zurich and Shanghai
based business consultant specialized on business development in Asia, established in 1992 by Max-Ulrich
Zellweger with some partners. He frequently lectures on Asia-related topics at universities and Executive
MBA courses. Furthermore, he is Chairman of the Board of Directors of Fr. Sauter Holding AG and a Member
of the Board of Directors of Fr. Sauter AG, Bartec GmbH (Germany) and Pacific Consult Ltd. Max-Ulrich
Zellweger holds a Masters degree in Mechanical Engineering of the Swiss Institute of Technology (ETH) in
Zurich. He was born in 1941 and is a Swiss citizen.
Harald Rönn, Vice-Chairman of the Board of Directors
Harald Rönn has been a Member of the Board of Directors of Uster Technologies Ltd since 2007 and is elect-
ed until 2011. Prior to joining Alpha Beteiligungsberatung GmbH & Co. KG in 1997 as a Managing Partner he
worked at Hoechst Brazil, followed by Citicorp in New York and then Frankfurt in 1987. Harald Rönn moved
in 1991 to 3i Frankfurt as a Manager. He holds a degree in Business Administration from the University
Getulio Vargas in Brazil and is fluent in German, English and Portuguese. He was born in 1960 and is a Ger-
man citizen.
Dr. Barry James Mulady, Member of the Board of Directors
Barry James Mulady has been a Member of the Board of Directors of Uster Technologies Ltd since 2003 and
is elected until 2012. He has been Chairman of PageOne Communications Ltd, London, England, since 2000
and is Chairman of ipTEST Ltd, Guildford, England. From 2000 to 2006, he served as a non-executive Direc-
tor of Tellermate plc, Newport, Wales and Sensima Ltd, London. From 1996 to 1999 he was CEO of Airtech
plc, Aylesbury, England. Prior to that he served as President of Fisons Instruments Europe and CEO of VG
Instruments plc. He has broad experience in general management, mergers and acquisitions and business
development. Barry James Mulady earned a First Class Honours Degree in Physics and a PhD in Nuclear
Magnetic Resonance from the University of Nottingham. He was born in 1947 and is a British citizen.
Corporate Governance 41
Akira Onishi, Member of the Board of Directors
Akira Onishi has been elected a Member of the Board of Directors of Uster Technologies Ltd in 2010 for a
period of three years until 2013 and acts as representative of the strategic investor Toyota Industries Corpo-
ration. He started his carrier as sales and marketing manager in the textile machinery division of Toyota
Industries Corporation in 1981. Later he was active in various management functions mainly in Corporate
Planning. Akira Onishi currently holds the positions of Senior Managing Director, Member of the Board,
Corporate Planning and Head of Textile Machinery Business Unit. Akira Onishi earned a degree in law from
Nagoya University, Japan. He was born in 1958 and is a Japanese citizen.
Dr. Geoffrey Scott, Member of the Board of Directors and Chief Executive Officer
Geoffrey Scott has been a Member of the Board of Directors and CEO of Uster Technologies Ltd since 2003
and is elected until 2013. He was Chief Executive Officer of the Zellweger Uster Division of Zellweger Luwa,
Uster, Switzerland, from 1999 to 2003. Prior to that he held Senior Management positions at Kevex Instru-
ments, Fisons plc (Scientific Instruments Division) and Beckman Instruments. He has broad experience of
strategy and business development, sales, marketing and after-sales, product development and general
management. He was a Member of the Board of Directors of Maillefer SA until 12 January 2011. Geoffrey Scott
earned a BSc Honours degree in Biochemistry from the University of Liverpool, and a PhD in Biochemistry
from the University of Nottingham. He was born in 1954 and is a British citizen.
3.2 Independency of the Board of Directors
None of the non-executive Members of the Board of Directors has been a Member of the Executive Commit-
tee of Uster Technologies Ltd or its subsidiaries during the past three years and there are no significant
business connections between Uster Technologies Ltd and its subsidiaries and the non-executive Members
of the Board of Directors.
In his function of a Managing Partner of Pacific Consult Ltd Max-Ulrich Zellweger advises the Company on
certain business issues related to China. Also, Barry James Mulady sometimes delivers consulting services
to the Company. However, the scope of these consultancy services is not significant.
The Members of the Board of Directors do not have any activities and functions outside Uster Technologies
Ltd that would compromise their independency.

42 Uster Technologies Ltd | Annual Report 2010
3.3 Elections and Terms of Office
The articles of association of Uster Technologies Ltd provide that the Board of Directors may consist of a
minimum of three Members and a maximum of nine Members. Members of the Board of Directors are ap-
pointed and removed exclusively by shareholders’ resolution. The elections are held individually. Their
maximum term of office is three years, re-election is allowed.
3.4 Internal Organization
3.4.1 Duties and Operating Principles of the Board of Directors
The Board of Directors is entrusted with the ultimate direction of Uster Technologies Ltd and the supervision
of the Executive Committee. The Board of Directors’ non-transferable and irrevocable duties include the
following:
• The ultimate direction of the Company and the issuance of the necessary directives;
• The determination of the organization, including the adoption and revision of the organizational rules;
• The organization of the accounting system, the financial control as well as the financial planning;
• The appointment and dismissal of the persons entrusted with the management of the Company as well as
the determination of the signatory power;
• The ultimate supervision of the persons entrusted with the management of the Company;
• The responsibility for the preparation of the annual report and the Shareholders’ meeting as well as the
implementation of the resolutions adopted by the meeting of Shareholders;
• The passing of resolutions regarding the supplementary contribution for shares not fully paid up and of
the corresponding amendments to the articles of incorporation;
• The passing of resolutions concerning an increase in share capital to the extent that such power is vested
in the Board of Directors and of resolutions concerning the confirmation of capital increases and corre-
sponding amendments to the articles of incorporation as well as making the required report on the capital
increase;
• The notification of the judge in case of over-indebtedness of the Company;
• The adoption of and any amendments or modifications to any equity incentive plan, stock option agree-
ment, restricted stock purchase agreement, etc.;
• The decision regarding entering into any financing arrangement in excess of CHF 10.0 million including
loan agreements, credit lines, letters of credit or capitalized leases;
• The issuance of convertible debentures with option rights or other financial market instruments;
• The approval of the business strategy and the approval and adoption of the budget of the Company;
• The approval of any transaction exceeding the amount of CHF 10.0 million which is not in accordance with
the budget.
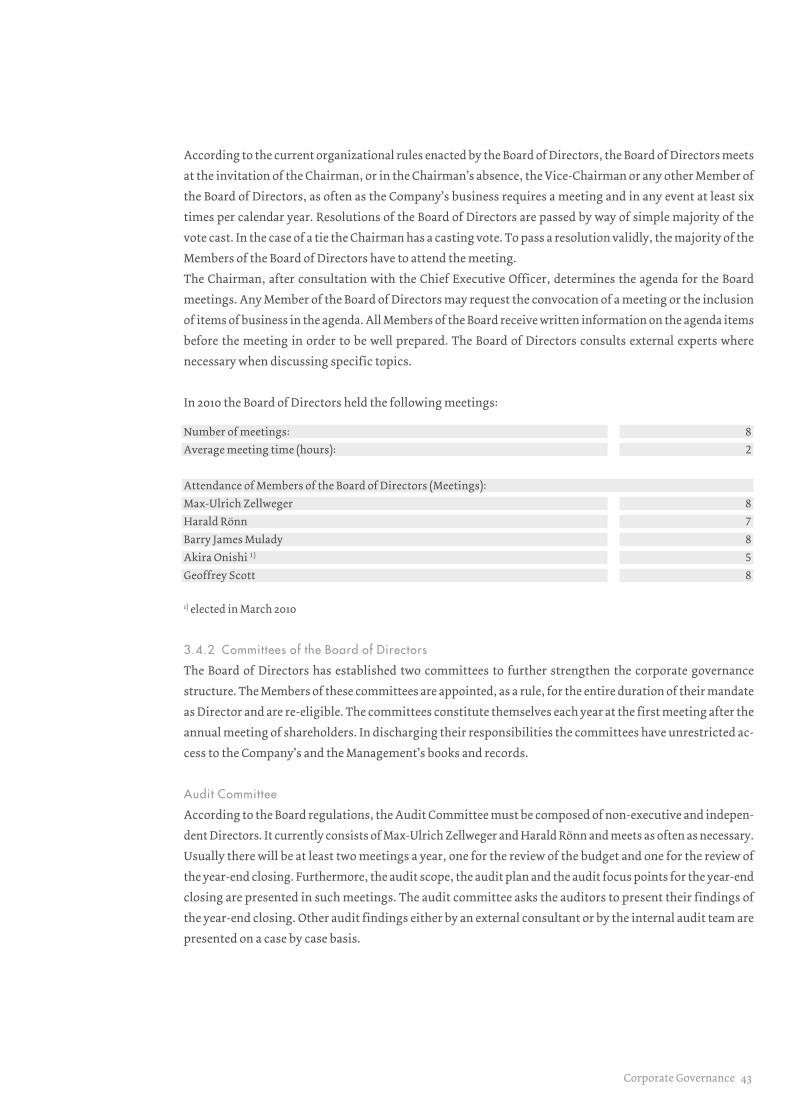
Corporate Governance 43
According to the current organizational rules enacted by the Board of Directors, the Board of Directors meets
at the invitation of the Chairman, or in the Chairman’s absence, the Vice-Chairman or any other Member of
the Board of Directors, as often as the Company’s business requires a meeting and in any event at least six
times per calendar year. Resolutions of the Board of Directors are passed by way of simple majority of the
vote cast. In the case of a tie the Chairman has a casting vote. To pass a resolution validly, the majority of the
Members of the Board of Directors have to attend the meeting.
The Chairman, after consultation with the Chief Executive Officer, determines the agenda for the Board
meetings. Any Member of the Board of Directors may request the convocation of a meeting or the inclusion
of items of business in the agenda. All Members of the Board receive written information on the agenda items
before the meeting in order to be well prepared. The Board of Directors consults external experts where
necessary when discussing specific topics.
In 2010 the Board of Directors held the following meetings:
Number of meetings: 8
Average meeting time (hours): 2
Attendance of Members of the Board of Directors (Meetings):
Max-Ulrich Zellweger 8
Harald Rönn 7
Barry James Mulady 8
Akira Onishi 1) 5
Geoffrey Scott 8
1) elected in March 2010
3.4.2 Committees of the Board of Directors
The Board of Directors has established two committees to further strengthen the corporate governance
structure. The Members of these committees are appointed, as a rule, for the entire duration of their mandate
as Director and are re-eligible. The committees constitute themselves each year at the first meeting after the
annual meeting of shareholders. In discharging their responsibilities the committees have unrestricted ac-
cess to the Company’s and the Management’s books and records.
Audit Committee
According to the Board regulations, the Audit Committee must be composed of non-executive and indepen-
dent Directors. It currently consists of Max-Ulrich Zellweger and Harald Rönn and meets as often as necessary.
Usually there will be at least two meetings a year, one for the review of the budget and one for the review of
the year-end closing. Furthermore, the audit scope, the audit plan and the audit focus points for the year-end
closing are presented in such meetings. The audit committee asks the auditors to present their findings of
the year-end closing. Other audit findings either by an external consultant or by the internal audit team are
presented on a case by case basis.
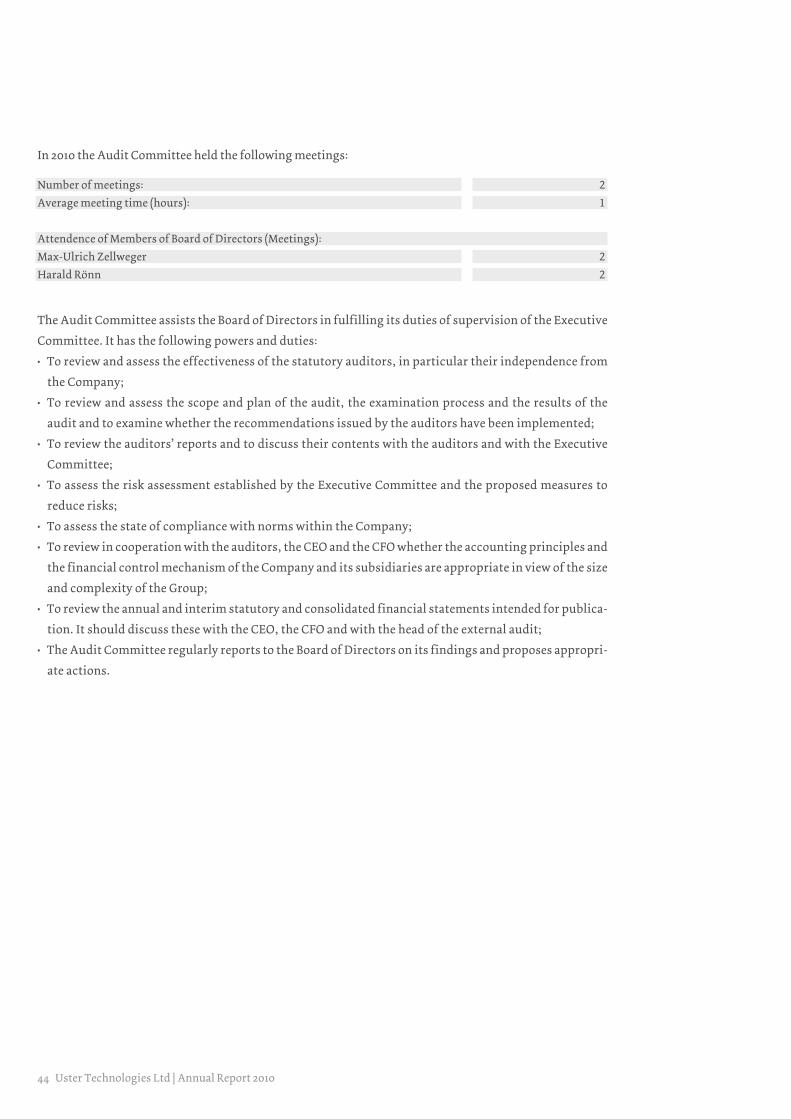
44 Uster Technologies Ltd | Annual Report 2010
In 2010 the Audit Committee held the following meetings:
Number of meetings: 2
Average meeting time (hours): 1
Attendence of Members of Board of Directors (Meetings):
Max-Ulrich Zellweger 2
Harald Rönn 2
The Audit Committee assists the Board of Directors in fulfilling its duties of supervision of the Executive
Committee. It has the following powers and duties:
• To review and assess the effectiveness of the statutory auditors, in particular their independence from
the Company;
• To review and assess the scope and plan of the audit, the examination process and the results of the
audit and to examine whether the recommendations issued by the auditors have been implemented;
• To review the auditors’ reports and to discuss their contents with the auditors and with the Executive
Committee;
• To assess the risk assessment established by the Executive Committee and the proposed measures to
reduce risks;
• To assess the state of compliance with norms within the Company;
• To review in cooperation with the auditors, the CEO and the CFO whether the accounting principles and
the financial control mechanism of the Company and its subsidiaries are appropriate in view of the size
and complexity of the Group;
• To review the annual and interim statutory and consolidated financial statements intended for publica-
tion. It should discuss these with the CEO, the CFO and with the head of the external audit;
• The Audit Committee regularly reports to the Board of Directors on its findings and proposes appropri-
ate actions.
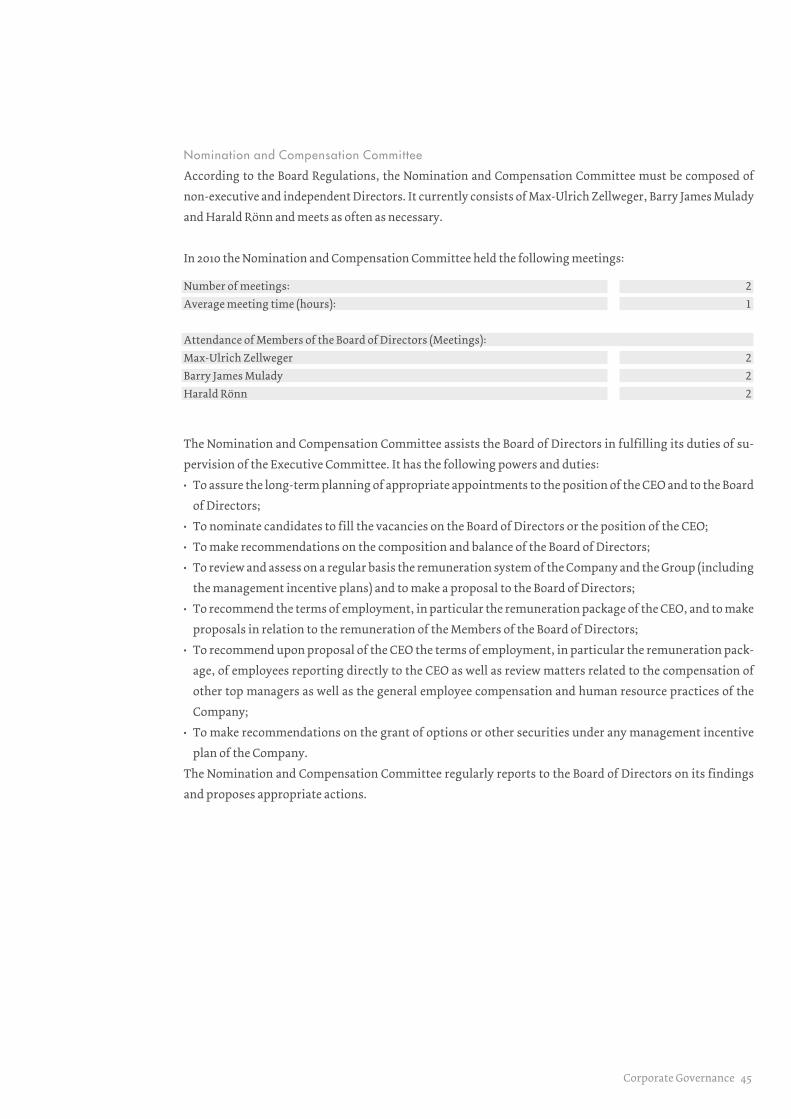
Corporate Governance 45
Nomination and Compensation Committee
According to the Board Regulations, the Nomination and Compensation Committee must be composed of
non-executive and independent Directors. It currently consists of Max-Ulrich Zellweger, Barry James Mulady
and Harald Rönn and meets as often as necessary.
In 2010 the Nomination and Compensation Committee held the following meetings:
Number of meetings: 2
Average meeting time (hours): 1
Attendance of Members of the Board of Directors (Meetings):
Max-Ulrich Zellweger 2
Barry James Mulady 2
Harald Rönn 2
The Nomination and Compensation Committee assists the Board of Directors in fulfilling its duties of su-
pervision of the Executive Committee. It has the following powers and duties:
• To assure the long-term planning of appropriate appointments to the position of the CEO and to the Board
of Directors;
• To nominate candidates to fill the vacancies on the Board of Directors or the position of the CEO;
• To make recommendations on the composition and balance of the Board of Directors;
• To review and assess on a regular basis the remuneration system of the Company and the Group (including
the management incentive plans) and to make a proposal to the Board of Directors;
• To recommend the terms of employment, in particular the remuneration package of the CEO, and to make
proposals in relation to the remuneration of the Members of the Board of Directors;
• To recommend upon proposal of the CEO the terms of employment, in particular the remuneration pack-
age, of employees reporting directly to the CEO as well as review matters related to the compensation of
other top managers as well as the general employee compensation and human resource practices of the
Company;
• To make recommendations on the grant of options or other securities under any management incentive
plan of the Company.
The Nomination and Compensation Committee regularly reports to the Board of Directors on its findings
and proposes appropriate actions.
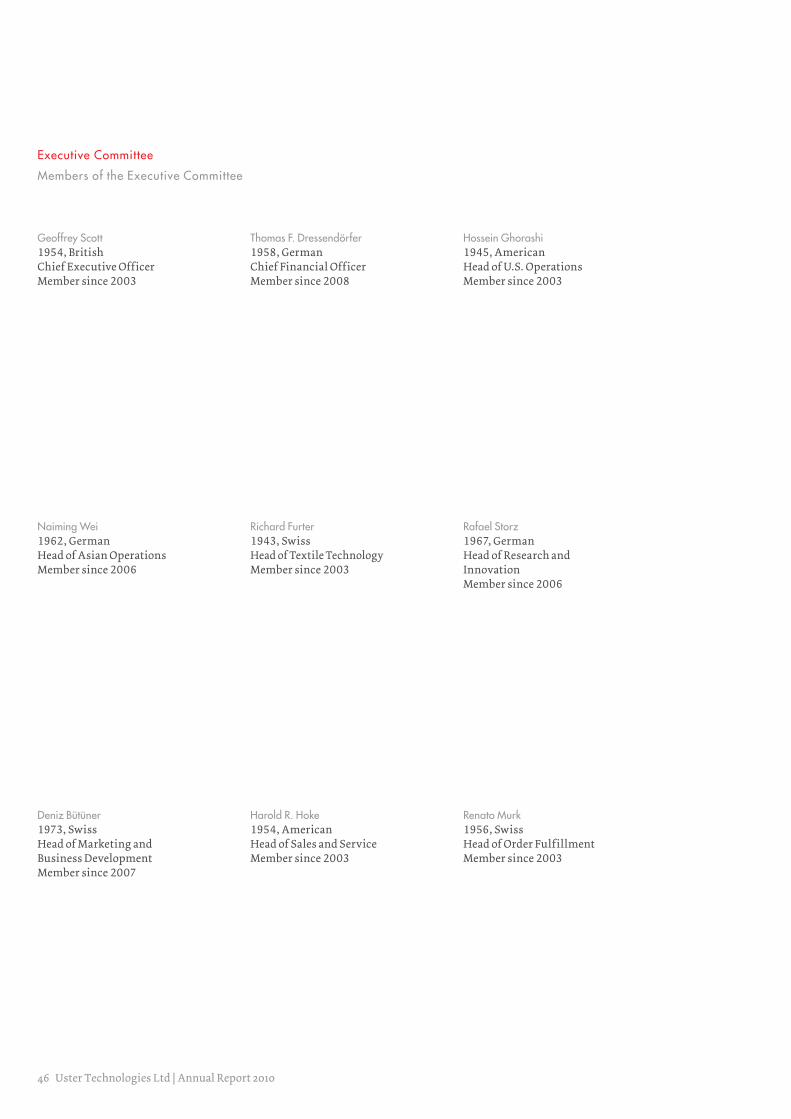
46 Uster Technologies Ltd | Annual Report 2010
Executive Committee
Members of the Executive Committee
Geoffrey Scott
1954, British
Chief Executive Officer
Member since 2003
Thomas F. Dressendörfer
1958, German
Chief Financial Officer
Member since 2008
Hossein Ghorashi
1945, American
Head of U.S. Operations
Member since 2003
Naiming Wei
1962, German
Head of Asian Operations
Member since 2006
Richard Furter
1943, Swiss
Head of Textile Technology
Member since 2003
Deniz Bütüner
1973, Swiss
Head of Marketing and
Business Development
Member since 2007
Rafael Storz
1967, German
Head of Research and
Innovation
Member since 2006
Harold R. Hoke
1954, American
Head of Sales and Service
Member since 2003
Renato Murk
1956, Swiss
Head of Order Fulfillment
Member since 2003
Corporate Governance 47
48 Uster Technologies Ltd | Annual Report 2010
3.4.3 Areas of Responsibilities
In accordance with the law, the articles of incorporation and the organizational rules the Board of Directors
has delegated the Company’s operational management to Geoffrey Scott, the CEO of Uster Technologies Ltd.
Together with the Executive Committee he is responsible for the overall management of the Uster Group.
The CEO has all the powers and duties that are not explicitly reserved to the Board of Directors or a Board
Committee as mentioned above. In particular, the CEO has the following powers and duties:
• The provision of all information and documents necessary to the Board of Directors;
• The implementation of the resolutions passed by the Board of Directors;
• The organization, management and control of the day-to-day business of the Company;
• The proposal to the Board of Directors for the approval of transactions to be resolved by the Board of
Directors;
• The proposal to the Board of Directors for the appointment and dismissal of Members of the Executive
Committee;
• The organization of the Executive Committee and the preparation, calling and presiding the meetings
of the Executive Committee.
3.4.4 Information and Control Mechanisms
Board of Directors
The Board of Directors recognizes the importance of receiving sufficient information from the Executive
Committee to fulfill its supervisory duty and to make the decisions that are reserved to the Board of Direc-
tors. It has the following means to monitor the responsibilities it has delegated to the Executive Committee:
• The CEO of the Group is a Member of the Board of Directors and informs the Board in every meeting about
the current development of the business. Additionally the CFO serves as the secretary of the Board and
also participates in every meeting. Other Members of the Executive Committee are invited to attend
Board meetings to report on their areas of responsibility as deemed necessary by the Board.
• The minutes of the Executive Committee Meetings are made available to the Chairman of the Board.
• Informal meetings are held as required between Board Members and the CEO.
• The Board of Directors receives on a monthly basis the consolidated income statement, balance sheet
and cash flow statement of the Uster Group together with a detailed comment on the course of the busi-
ness. The Board of Directors does not have direct access to the Management Information System of the
Company.
• Risk management and monitoring procedures are evaluated at regular intervals by the Board of Directors.
Board Committees
The Board Committees, especially the Audit Committee, invite external consultants to review the business
and better understand the laws and policies impacting the Company. In addition the CEO, the CFO and the
representative of the external auditors will be invited to the meetings of the Audit Committee.
Corporate Governance 49
4 Executive Committee
4.1 Members of the Executive Committee
The following information sets forth the name, year of birth, nationality and function of each Member of
the Executive Committee, followed by a short description of each Member’s business experience, education
and activities.
Dr. Geoffrey Scott, Member of the Board of Directors and Chief Executive Officer
Geoffrey Scott has been a Member of the Board of Directors and CEO of Uster Technologies Ltd since 2003
(elected until 2013). He was Chief Executive Officer of the Zellweger Uster Division of Zellweger Luwa, Uster,
Switzerland, from 1999 to 2003. Prior to that he held Senior Management positions at Kevex Instruments,
Fisons plc (Scientific Instruments Division) and Beckman Instruments. He has broad experience of strategy
and business development, sales, marketing and after-sales, product development and general management.
He was a Member of the Board of Directors of Maillefer SA until January 12, 2011. Geoffrey Scott earned a BSc
Honours degree in Biochemistry from the University of Liverpool, and a PhD in Biochemistry from the Uni-
versity of Nottingham. He was born in 1954 and is a British citizen.
Thomas F. Dressendörfer, Chief Financial Officer, Finance and Support
Thomas F. Dressendörfer has been appointed to the CFO position of Uster Technologies Ltd as of October 1,
2008. He takes responsibility to lead the Finance and Support Team in Uster, including IT, and reports as
member of the Executive Management Committee directly to the CEO. Thomas F. Dressendörfer has worked
in the past years with Randstad, The Nielsen Company and Procter & Gamble, where he has been holding
various key senior finance positions. He brings experience of leading high performing Finance teams as well
as experience of working with Finance groups internationally. Thomas F. Dressendörfer holds a Masters
Degree in Business Administration and Economics from the University of Erlangen-Nuremberg in Germany.
He was born in 1958 and is a German citizen.
Hossein Ghorashi, Head of U.S. Operations
Hossein Ghorashi has been Head of U.S. Operations since 2003. From 1990 through 2002 he held the posi-
tions of Senior Vice-President of R&D and Head of Zellweger Uster Inc. He was with Special Instruments
Laboratory from 1969 through 1989 and was Vice-President of R&D for the last 10 years. He holds a BS and
an MS in Electrical Engineering from the University of Tennessee, Knoxville TN, United States. He is a
coinventor of 18 fiber testing patents, author of numerous papers and presents the Company’s latest in-
novations in important international conferences. He is known and referred to as a cotton fiber testing
expert worldwide. Hossein Ghorashi was born in 1945 and is an American citizen.
50 Uster Technologies Ltd | Annual Report 2010
Dr. Naiming Wei, Head of Asian Operations
Naiming Wei has been a Member of the Management and Head of Asian Operations of Uster Technologies
Ltd since 2006. From 2000 to 2005 he was General Manager at Shanghai Sachs Huizhong Shock Absorber Co.
Ltd, a joint venture company between the German automotive supplier ZF-Sachs Ltd and Shanghai Automo-
tive Industry Corporation. Prior to that, Naiming Wei worked as management consultant at Management
Engineers GmbH for large and middle size multinational clients in Germany, in the UK and in Switzerland.
From 1993 to 1997 he was Sales and Marketing Manager and Purchasing Manager at Siemens Ltd, Business
Division Private Communication Systems. Naiming Wei holds a Masters degree (Dipl.-Ing.) and a PhD degree
(Dr.-Ing.) in Electrical Engineering from the University Erlangen-Nuremberg in Germany. He was born in
1962 and is a German citizen.
Richard Furter, Head of Textile Technology
Richard Furter has been Head of Textile Technology of Uster Technologies Ltd since 2003. Prior to that he
has worked for Zellweger Uster Ltd since 1967 where he was an electronic engineer in R&D and was par-
ticularly involved in sensor technology and signal processing. In this role he has filed various patents.
Richard Furter held positions as Product Manager, Manager of R&D and Manager of Marketing and Sales.
He is familiar with the customers in the most important textile markets. Richard Furter graduated as an
electronic engineer (currently Lucerne University of Applied Sciences and Arts). He was born in 1943 and
is a Swiss citizen.
Dr. Rafael Storz, Head of Research and Innovation
Rafael Storz has been a Member of the Management since 2006. From 2001 to 2006 he was a Member of the
Management and Head of R&D of Leica Microsystems CMS GmbH, Wetzlar, Germany. From 1998 to 2001 he
was a project manager and deputy head of the R&D department at Leica Microsystems Heidelberg GmbH,
Germany. He is experienced within strategy and business development and product development. He is a
(co-)inventor of 69 patents in the field of measurement equipment and analysis tools. Rafael Storz earned a
PhD in Physics from the University of Konstanz, Germany. He was born in 1967 and is a German citizen.
Deniz Bütüner, Head of Marketing and Business Development
Deniz Bütüner has been a Member of the Management since 2007 and joined Uster Technologies as Vice-
President Marketing in the same year. From 2003 to 2006 she was with Bombardier Transportation’s Propulsion
and Controls Division, where she was responsible for the Division’s strategy, marketing and communication.
Between 1998 and 2002 she held marketing, business development and communications management positions
with Hyperion Solutions, MIS Technologies and Swisslog Management. Deniz Bütüner has experience in strat-
egy, business development and marketing. She is a Member of the Board of Directors of Marble & Fortune AG.
Deniz Bütüner holds a Swiss Federal Diploma in Marketing Management. She was born in 1973 and is a Swiss
citizen.
Corporate Governance 51
Reine Wasner, Head of Marketing and Business Development (as of January 1, 2011)
Reine Wasner has been appointed to the position as Vice-President of Marketing and Business Development
as of January 1, 2011. Prior to joining the company, he worked for more than ten years in management con-
sulting including Booz Allen Hamilton, Arthur D. Little and A. T. Kearney. He has experience in the areas of
strategy development, market and business development and innovation management across a wide range
of industries, including projects for Uster Technologies Ltd. Reine Wasner holds a Master of Science in
Mechanical Engineering from the Technical University of Lund, a Master of Business Administration from
the University of Lund as well as a three year research degree from the University of Linköping (all in Sweden)
in collaboration with MIT in Boston (USA). He was born in 1970 and is a Swedish citizen.
Harold R. Hoke Jr., Head of Sales and Service
Harold Hoke has been Head of Sales and Service of Uster Technologies Ltd since 2003. He rejoined Uster
Technologies Ltd in 2002 after almost two years as CEO of Savio America. Harold Hoke originally joined
Zellweger Uster Ltd in 1980 in the U.S. operation. In 1996 he was based in the Company’s Swiss headquarters
and was initially responsible for Sales and Service Asia, later responsible for the companies’ worldwide sales
and service organization including all small subsidiary companies. Harold Hoke has experience in sales,
marketing, service, business development, production management and strategy development. Harold Hoke
holds a BS from Clemson University. He was born in 1954 and is an American citizen.
Renato Murk, Head of Order Fulfillment
Renato Murk has been Head of Order Fulfillment of Uster Technologies Ltd since 2003, a position which
includes the worldwide responsibility for the production processes and supply chain management. From
1999 to 2003 he was responsible for production and logistics of the Zellweger Uster Division of Zellweger
Luwa Ltd. From 1996 to 1999, he was a Manager of Product Assembly Lines at Zellweger Uster. Renato Murk
holds a Master of Industrial Engineering degree from the Swiss Federal Institute of Technology (ETH) with
the majors Process Engineering and Business Administration. Besides significant experience in general and
production management he has executed several efficiency and cost-improving programs as a senior con-
sultant in a Swiss-based management consultancy. He was born in 1956 and is a Swiss citizen.
4.2 Other Activities and Vested Interests
There are no further activities of vested interests of the Members of the Executive Management except the
ones mentioned above.
4.3 Management Contracts
The Board of Directors has not delegated any management tasks to third parties outside the Company.
52 Uster Technologies Ltd | Annual Report 2010
5 Compensation, Shareholdings and Loans
5.1 Content and Method of Determining the Compensation and the Share-Ownership Programs
5.1.1 Compensation Design
The compensation policy of Uster Technologies Ltd is designed to provide simple and clearly structured
salary systems that ensure fair remuneration and are transparent to employees. Salary levels are geared
relative to salaries in the local markets and are reviewed at regular intervals using different remuneration
studies available on the market. Individual compensation is determined by the specifications of the posi-
tion, competencies and experience, performance and the Group’s business success. Where possible, re-
sults- and performance-driven compensation systems are employed that include a results-related variable
component.
5.1.2 Board of Directors
The remuneration of the Members of the Board of Directors consists of an equal payment in cash for the
ordinary Board Members. The remuneration for Chairman of the Board of Directors is determined by tak-
ing into account his respective responsibility, experience and the time which he invests in his activity as
Chairman. Extraordinary assignments or work which a Director accomplishes outside of his activity as a
Director is specifically remunerated. Such remuneration has to be approved by the Board of Directors. In
addition, the Directors are reimbursed all reasonable cash expenses properly incurred by them in the
discharge of their duties, including their reasonable expenses of traveling to and from the meetings of the
Board of Directors, committee meetings and Shareholders’ meetings. Board Members may also participate
in the Uster Group RSU plan which is detailed below.
5.1.3 Executive Committee
The Members of the Executive Committee are remunerated according to the principle of flexible, perfor-
mance-related compensation. Their remuneration consists of a basic salary and a performance-related
component in the context of the bonus plan. The performance related compensation part amounts to an
average of 50 % of the basic salary for attainment of target; further payment is made for overachievement
against target. The variable component is directly linked to the primary drivers of business performance.
It is based on the yearly gross sales and the operating earnings achieved by the Group (EBITA) as well as
the individual goals amounting to a maximum of 10 % of total performance related compensation. All the
components mentioned above are cash compensations which are paid out immediately and are not subject
to forfeiture clauses. Additional benefits for the Members of the Executive Committee include a car and
participation in the below-mentioned RSU plan.
5.1.4 Share Ownership Program
In April 2010, the Board of Directors adopted a Restricted Stock Unit (RSU) plan. The RSU plan has been
designed to provide an increased incentive to contribute to the future success of the Company, to align
remuneration with the creation of shareholder value, to promote a team-base culture throughout the
organization and to increase the ability of Uster Group to attract and retain individuals with exceptional
skills. The Nomination and Compensation Committee will select the employees eligible for the RSU plan
in its own discretion, but upon proposal by the CEO. The selected employees will be awarded a fixed num-
ber of Restricted Stock Units (RSU Awards) to purchase registered shares of the Company. The total num-
ber of RSU Awards awarded at any one time is left to the sole discretion of the Nomination and Compensa-
tion Committee, which will base its decision on the recommendation of the CEO.
Corporate Governance 53
According to the RSU plan, the RSU Awards will vest on the third anniversary from the date of grant of
the RSU Award, provided that neither the employment agreement has been terminated nor any forfeiture
event has occurred.
There are no other share-ownership programs or option plans with regard to the compensation of the
Board of Directors and the Executive Committee. Usually Uster Technologies Ltd does not adjust salaries
during the year.
5.1.5 Compensation Governance
With respect to the compensation the Nomination and Compensation Committee has the following re-
sponsibilities:
• To review and assess on a regular basis the remuneration system of the Group including the incentive
plans for the Executive Committee and to make a proposal to the Board of Directors thereto;
• To make recommendations with respect to the remuneration package of the CEO and the Directors;
• To recommend upon proposal of the CEO the remuneration package of employees reporting directly to
the CEO;
• To make recommendations on the grant of options or other securities under any management incentive
plan. Based on these recommendations the Board of Directors approves the remuneration of the Members
of the Board of Directors and the Members of the Executive Committee.
The Nomination and Compensation Committee generally meets during the fourth quarter to discuss the
remuneration package of the Board Members and the Members of the Executive Committee for the follow-
ing year. Information from different remuneration studies available on the market is made available to
the Members of the Nomination and Compensation Committee and serves as a basis for the discussion of
the remuneration during the meeting. Examples of such studies include surveys from Swissmem and
Landolt & Mächler in Switzerland, Hewitt in China and the Department of Labor in the USA. The CEO is
partially present at the meeting but he has to leave when his remuneration is discussed. After the final
decision on the remuneration of the Board Members and the Members of the Executive Committee by the
Board of Directors the salary changes are signed by a Member of the Board of Directors.
5.2 Compensation of the Members of the Board of Directors and the Executive Committee
Information on the compensation of the Board of Directors and the Executive Committee for the year ending
December 31, 2010, are presented in the note 11 of the Financial Statements of Uster Technologies Ltd.
6 Shareholders’ Participation
6.1 Voting Rights and Representation Restrictions
Transferability and Nominee Registrations above.
In a Shareholders’ meeting each share recorded as a share with the right to vote in the share register entitles
its owner to one vote. By means of a written proxy each shareholder may have his shares represented in a
Shareholders’ meeting by a third person who needs not be a shareholder. Shareholders who are recorded in
the share register with the right to vote at a certain date appointed by the Board of Directors are entitled to
participate in the Shareholders’ meeting and to exercise the right to vote.
No exceptions to these rules were granted by the Board of Directors in the year under review.

54 Uster Technologies Ltd | Annual Report 2010
6.2 Statutory Quorums
Unless mandatory statutory provisions provide otherwise, the Shareholders’ meeting passes its resolutions
and performs elections with the absolute majority of the votes represented at the meeting.
If an election cannot be completed upon the first ballot and if there is more than one candidate, the Chair-
man shall direct a second ballot at which the relative majority shall decide.
6.3 Convocation of the Shareholders’ Meeting
The Shareholders’ meeting is called by the Board of Directors or, if necessary, the auditors not less than
20 days before the date of the meeting. Notice of a Shareholders’ meeting is given by means of a single
publication in the Swiss Official Gazette of Commerce. The shareholders registered in the share register
may in addition receive a written notice sent by mail.
An extraordinary Shareholders’ meeting is called whenever the Board of Directors or the auditors con-
sider it necessary or if a Shareholders’ meeting decides so. The Board of Directors will also call a Share-
holders’ meeting if one or more shareholders whose combined holdings represent at least 10.0 % of the
share capital so demand in writing and specify the items and the proposals, in the case of elections the
names of the proposed candidates, to be submitted to the meeting.
6.4 Agenda
Shareholders whose individual or combined holdings represent an aggregate nominal value of at least
CHF 1,000,000 or at least 10.0 % of the share capital may demand that an item be included in the agenda.
This right must be exercised in writing at least 60 days before the meeting with indication of the items
and the proposals of the shareholders.
No resolution shall be passed on items for which no proper notice has been given; this prohibition does
not apply to proposals to call an extraordinary Shareholders’ meeting, to initiate a special audit or to elect
the auditors as demanded by a shareholder.
No prior notice is required for proposals concerning items included in the agenda and discussions that
do not result in the adoption of resolutions.
6.5 Inscriptions into the Share Register
After the publication or mailing of the written notice of the Shareholders’ meeting until the day following
the Shareholders’ meeting no recordings in the share register will be made, provided that the Board of
Directors does not appoint a different date.
Uster Technologies Ltd | Annual Report 2010 55
7 Changes of Control and Defense Measures
7.1 Obligation to Make an Offer
According to the Federal Act on Stock Exchanges and Securities Trading (SESTA) a shareholder or a group
of shareholders acting in concert acquiring more than 33 1⁄3 % of the voting rights must submit a takeover
offer to all remaining shareholders. The articles of association of Uster Technologies Ltd do not include
any amendment (i. e. no opting-out or opting-up provision) to this rule.
7.2 Clauses on Changes of Control
Uster Technologies Ltd has a Restricted Stock Unit (RSU) plan, the essentials of which are set forth under
“5 Compensation, Shareholdings and Loans”. The RSU plan sets forth that the RSU awards granted under
the RSU plan vest immediately and may be converted into shares of Uster Technologies Ltd upon the
occurrence of a change of control. In addition to that, neither the Members of the Board of Directors nor
the Members of the Executive Committee have contracts that provide for benefits upon termination of
employment contracts due to a change of control.
8 Auditors
8.1 Duration of the Mandate and Term of Office of the Lead Auditor
The statutory auditors and Group auditors are elected by the Shareholders’ meeting. The term of office of
the auditors is one year, beginning with the day of their election and ending on the day of the next ordinary
Shareholders’ meeting.
Ernst & Young Ltd, Zurich, have been the auditors of the Group since 2003. They have been the statutory
auditors of Uster Technologies Ltd since its incorporation in November 2006. The auditor-in-charge,
Daniel Zaugg, took up office in 2008.
8.2 Auditing Fees
In the year under review, Ernst & Young Ltd invoiced CHF 0.5 million (2009: CHF 0.5 million) for their
audit services.
8.3 Additional Fees
Ernst & Young Ltd invoiced additional fees in the amount of CHF 0.1 million (2009: CHF 0.4 million)
mostly related to tax consulting.
8.4 Information Tools Pertaining to the External Audit
The Audit Committee monitors on behalf of the Board of Directors the performance and independence of
the external auditors. In addition it reviews the audit result and monitors the implementation of the find-
ings by the Executive Committee.
The Audit Committee prepares proposals for the appointment or removal of the external auditors for
submission to the Board of Directors, which then nominates the external auditor for election by the Share-
holders’ meeting.
Currently the Audit Committee is informed on the findings of the audit through the Management Letter
issued by the auditors after the year-end audit, which is written after the year-end audit by the auditor.
56 Uster Technologies Ltd | Annual Report 2010
9 Information Policy
Uster Technologies Ltd is committed to an open and clear information policy towards its shareholders as
well as its other stakeholders.
The audited annual as well as unaudited semi-annual reports are available to the shareholders and other
stakeholders. The annual report is provided in printed form and both annual and semi-annual reports are
available on the website under www.uster-investors.com/financial_reports.php. Additionally the public
is informed via the media of material current changes and developments. Events relevant for the share
price are published according to the ad-hoc publicity guidelines of the SIX Swiss Exchange.
Media and analyst conferences are held at least once a year and the press releases as well as presentations
are available on the website under www.uster-investors.com/news.php.
Interested parties can subscribe to the mailing list available under www.uster-investors.com/subscription_
service.php in order to receive ad-hoc publications or other recent information relating to the Company.
Important Dates
Publication of annual results 2010 February 28, 2011
Media and analyst conference February 28, 2011
Last day for inscription into the share register
before the Shareholders’ meeting 2011
March 18, 2011
Shareholders’ meeting 2011 March 29, 2011
Dividend payment A p r i l 6 , 2 0 1 1
Semi-annual results 2011 July 19, 2011
Contact for Media, Investors and Analysts
Thomas F. Dressendörfer, CFO
Sonnenbergstrasse 10
CH-8610 Uster
Phone +41 43 366 36 06
Fax +41 43 366 36 54
Email [email protected]
10 Material Changes since the Balance Sheet Date
There are no material changes to the information stated in this section since the balance sheet date.

Uster Technologies Ltd | Financial Report 2010
58 Comment on the Consolidated Financial Statements 2010
Comment on the Consolidated Financial Statements
Summary
In a positive market environment Uster Technologies Ltd delivered a strong performance in the 2010 financial year.
Sales grew by 31.8 % to CHF 132.8 million. EBITA increased by 52.4 % to CHF 34.6 million and margins improved to
26.0 %, well above the previous year’s level of 22.5 %.
Key drivers for this strong EBITA margin improvement were:
• Continued sales growth in the key market of China, where the trend to automation and quality testing continues,
and in other markets like India and South East Asia which are returning to pre-crisis growth levels;
• A strong portfolio of high value-adding products that support a convincing investment proposition for customers;
• A flexible organizational structure allowing the Company to immediately adjust for these strong revenue
up-swings meeting the demand of the clients;
• Minimal exchange rate exposures and receivables defaults, with the majority of sales invoiced in CHF, and
with terms of business requiring secured payment terms (letter of credit or down payment).
The net result was CHF 20.8 million or 15.6 % of gross sales. Key drivers for this excellent net result were:
• Positive business performance with a strong EBITA;
• Resolution of a tax case with the Swiss tax authorities related to fiscal period 2007, allowing for the release
of tax accruals;
• Change of Swiss income tax regime as of fiscal period 2008.
The cash position was improved to CHF 21.0 million with an EBITA / operating cash flow conversion of 123.2 %. The
cash flow from operating activities was CHF 42.6 million. This was mainly used to reduce debt by CHF 27.0 mil-
lion, down to CHF 98.0 million resulting in a net debt / EBITDA ration of 2.1, and to invest in improved facilities
in the production area for the new yarn clearer product.
Income Statement
Gross Sales
Gross sales for 2010 amounted to CHF 132.8 million, an increase of 31.8 % compared to the prior year figure of
CHF 100.8 million. The overall increase of gross sales for quality testing instruments and service sales is a result
of the current strong market environment in all the key textile markets. The strongest driver of the sales growth
was the yarn clearer sold through the key automatic winding machinery manufacturers. Uster Technologies
Ltd invoices customers in the majority of cases in CHF with secured payment terms. As a result, exchange rate
gains/losses on sales were held at a level below 1 % of gross sales in 2010.
EBITA
EBITA for the Group amounted to CHF 34.6 million (2009: CHF 22.7 million). As a percentage of gross sales the
EBITA reached 26.0 % (2009: 22.5 %).
Uster Technologies Ltd’s flexible business model allowed the Group to quickly adapt its operations to meet
the increased demand in the market without needing to invest into additional headcount. R&D activities that
had been slowed down in response to the crisis were restored to a high level to support future growth resulting
in R&D expenses of 11.2 % of sales. Furthermore, during the course of the year, the cost of goods sold improved
slightly due to a favorable Euro exchange rate for some parts sourced out of the Euro area.
Balance Sheet
The balance sheet total as of December 31, 2010, amounted to CHF 399.5 million (2009: CHF 404.7 million).
• Amortization of intangible assets of CHF 15.2 million (assets)
Comment on the Consolidated Financial Statements 2010 59
• An increase in cash of CHF 6.0 million (assets)
• Loan repayments of CHF 27.0 million (liabilities)
• Reduction of deferred tax of CHF 7.8 million (liabilities)
• Shareholder’s equity increase by CHF 21.1 million mainly as a result of the positive net result (equity)
• The equity ratio increased to 56.2 % (2009: 50.3 %)
Impairment Test of Intangible Assets and Goodwill
Uster Technologies Ltd performs an impairment test on the goodwill and the intangible assets at least once
a year. The latest impairment test was performed in the fourth quarter of 2010 and was based on recent market
developments, realistic internal assumptions and external input on key parameters. The impairment test
confirmed the carrying amounts of the goodwill and related intangible assets.
Bank Loans
The Group repaid bank loans of CHF 10.0 million as compulsory repayments and further CHF 17.0 million as
voluntary repayments. The Net Debt / EBITDA ratio is at 2.1. compared to 4.5 in 2009. Free, not utilized cred-
it facilities amount to CHF 32.0 million. The maturity date of these bank loans is October 2012.
Cash Flow Statement
Uster Technologies Ltd continues to have a strong focus on cash generation.
The cash flow was positively impacted by higher sales levels (31.8 % above 2009) and higher levels of accounts
receivables due to increasing OEM shipments in 2010. The majority of the cash flow has been used to further
deleverage the balance sheet by voluntarily repaying parts of the loan.
Cash per December 31, 2010, improved by CHF 6.0 million to CHF 21.1 million (2009: CHF 15.1 million).
Capital Expenditure for Intangible and Tangible Assets
Capital expenditure for intangible and tangible assets amounted to CHF -3.8 million (2009: CHF -3.3 million).
The majority of this capital expenditure is attributed to an automation system in the production area. At a
level of only 2.9 % of gross sales this is low compared to market averages and is consuming only 9.0 % of the
cash flow from operating activities. The main reason for this low capital expenditure rate is the consequent
outsourcing of all non-core activities in line with the flexible business model of Uster Technologies Ltd.
Personnel
As of December 31, 2010, the Uster Group employed 445 full time equivalents (2009: 449) which is a decrease
of 0.7 % compared to the prior year.
Taxes
The expected income tax for the Uster Group is positively impacted by a resolved tax case with the Swiss tax
authorities and the new Swiss income tax regime effective as of fiscal period 2008.
Dividend Proposal
At the General Meeting on March 29, 2011, the Board of Directors will propose a dividend payment of about
50 % of net results for the 2010 financial year (CHF 1.20 / share).

60 Uster Group – Consolidated Financial Statements 2010
Uster Group – Consolidated Financial Statements
Consolidated Statement of Comprehensive Income
in CHF 1,000 Notes Jan 1 –
Dec 31, 2010
Jan 1 –
Dec 31, 2009
Gross sales 132,841 100.0 % 100,763 100.0 %
Sales deductions 6 -2,746 -2,858
Net sales 130,095 97.9 % 97,905 97.2 %
Cost of goods sold 7 -52,978 -41,631
Gross profit 77,117 58.1 % 56,274 55.8 %
Sales and marketing expenses 8.1 -14,274 -11,750
Research and development expenses 8.2 -14,916 -11,010
Management and administrative expenses 8.3 -13,418 -11,245
Other income 71 329
Other expenses/amortization 9 -15,149 -15,141
Earnings before interest and tax (EBIT) 19,431 14.6 % 7,457 7.4 %
Amortization 1) 12 15,171 15,252
Earnings before interest tax and amortization (EBITA) 34,602 26.0 % 22,709 22.5 %
Amortization 12 -15,171 -15,252
Earnings before interest and tax (EBIT) 19,431 14.6 % 7,457 7.4 %
Finance income 2,443 609
Finance expenses -7,580 -7,653
Finance result 10 -5,137 -3.9 % -7,044 -7.0 %
Earnings before tax 14,294 10.8 % 413 0.4 %
Income tax 16 6,469 665
Profit of the year 20,763 15.6 % 1,078 1.1 %
Currency translation differences -649 83
Total comprehensive income 20,114 15.1 % 1,161 1.2 %
Earnings per share (in CHF)Basic 11 2.45 0.16
Diluted 11 2.44 0.16
1) Change in presentation to focus on relevant information only. For details see note 3.1.
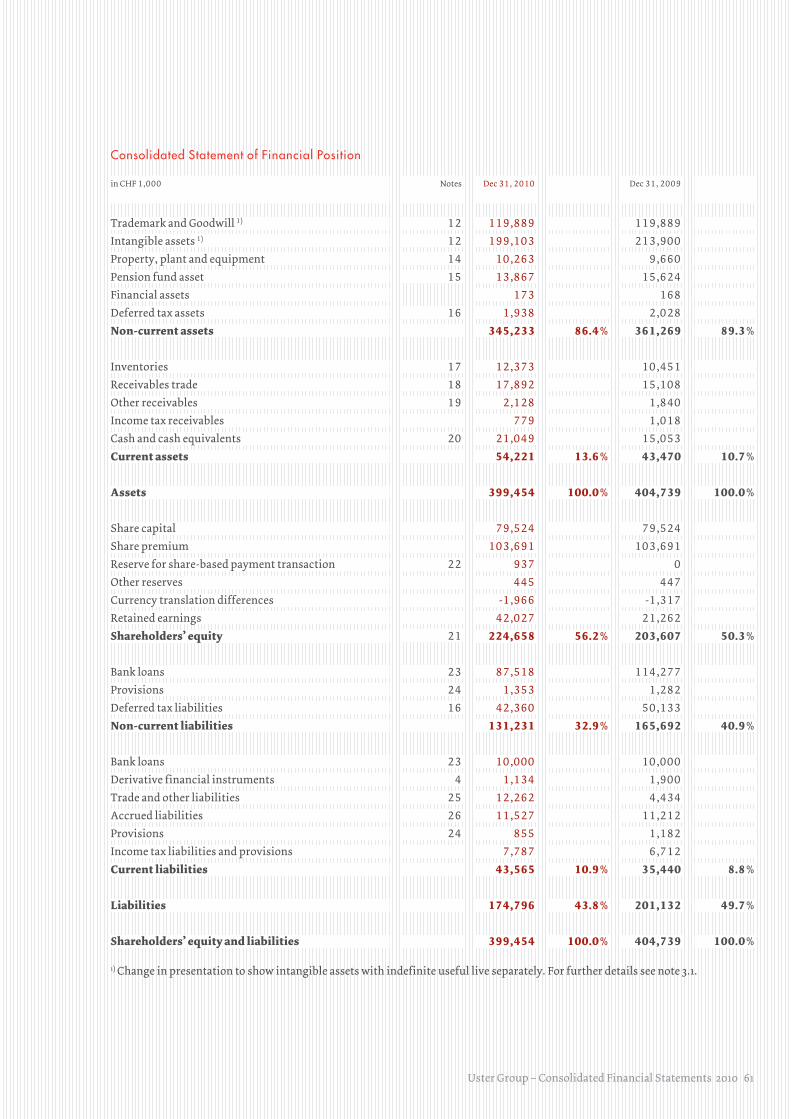
Uster Group – Consolidated Financial Statements 2010 61
Consolidated Statement of Financial Position
in CHF 1,000 Notes Dec 31, 2010 Dec 31, 2009
Trademark and Goodwill 1) 12 119,889 119,889
Intangible assets 1) 12 199,103 213,900
Property, plant and equipment 14 10,263 9,660
Pension fund asset 15 13,867 15,624
Financial assets 173 168
Deferred tax assets 16 1,938 2,028
Non-current assets 345,233 86.4 % 361,269 89.3 %
Inventories 17 12,373 10,451
Receivables trade 18 17,892 15,108
Other receivables 19 2,128 1,840
Income tax receivables 779 1,018
Cash and cash equivalents 20 21,049 15,053
Current assets 54,221 13.6 % 43,470 10.7 %
Assets 399,454 100.0 % 404,739 100.0 %
Share capital 79,524 79,524
Share premium 103,691 103,691
Reserve for share-based payment transaction 22 937 0
Other reserves 445 447
Currency translation differences -1,966 -1,317
Retained earnings 42,027 21,262
Shareholders’ equity 21 224,658 56.2 % 203,607 50.3 %
Bank loans 23 87,518 114,277
Provisions 24 1,353 1,282
Deferred tax liabilities 16 42,360 50,133
Non-current liabilities 131,231 32.9 % 165,692 40.9 %
Bank loans 23 10,000 10,000
Derivative financial instruments 4 1,134 1,900
Trade and other liabilities 25 12,262 4,434
Accrued liabilities 26 11,527 11,212
Provisions 24 855 1,182
Income tax liabilities and provisions 7,787 6,712
Current liabilities 43,565 10.9 % 35,440 8.8 %
Liabilities 174,796 43.8 % 201,132 49.7 %
Shareholders’ equity and liabilities 399,454 100.0 % 404,739 100.0 %
1) Change in presentation to show intangible assets with indefinite useful live separately. For further details see note 3.1.
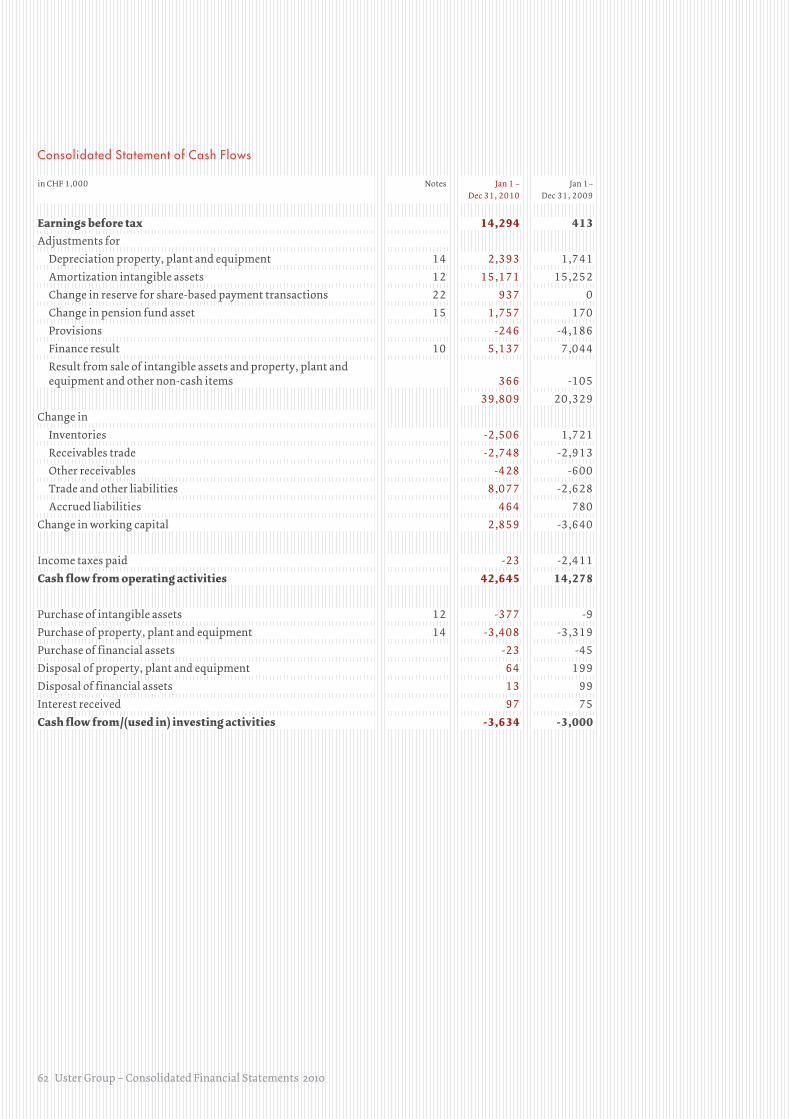
62 Uster Group – Consolidated Financial Statements 2010
Consolidated Statement of Cash Flows
in CHF 1,000 Notes Jan 1 –
Dec 31, 2010
Jan 1 –
Dec 31, 2009
Earnings before tax 14,294 413Adjustments for
Depreciation property, plant and equipment 14 2,393 1,741
Amortization intangible assets 12 15,171 15,252
Change in reserve for share-based payment transactions 22 937 0
Change in pension fund asset 15 1,757 170
Provisions -246 -4,186
Finance result 10 5,137 7,044
Result from sale of intangible assets and property, plant and
equipment and other non-cash items 366 -105
39,809 20,329
Change in
Inventories -2,506 1,721
Receivables trade -2,748 -2,913
Other receivables -428 -600
Trade and other liabilities 8,077 -2,628
Accrued liabilities 464 780
Change in working capital 2,859 -3,640
Income taxes paid -23 -2,411
Cash flow from operating activities 42,645 14,278
Purchase of intangible assets 12 -377 -9
Purchase of property, plant and equipment 14 -3,408 -3,319
Purchase of financial assets -23 -45
Disposal of property, plant and equipment 64 199
Disposal of financial assets 13 99
Interest received 97 75
Cash flow from / (used in) investing activities -3,634 -3,000
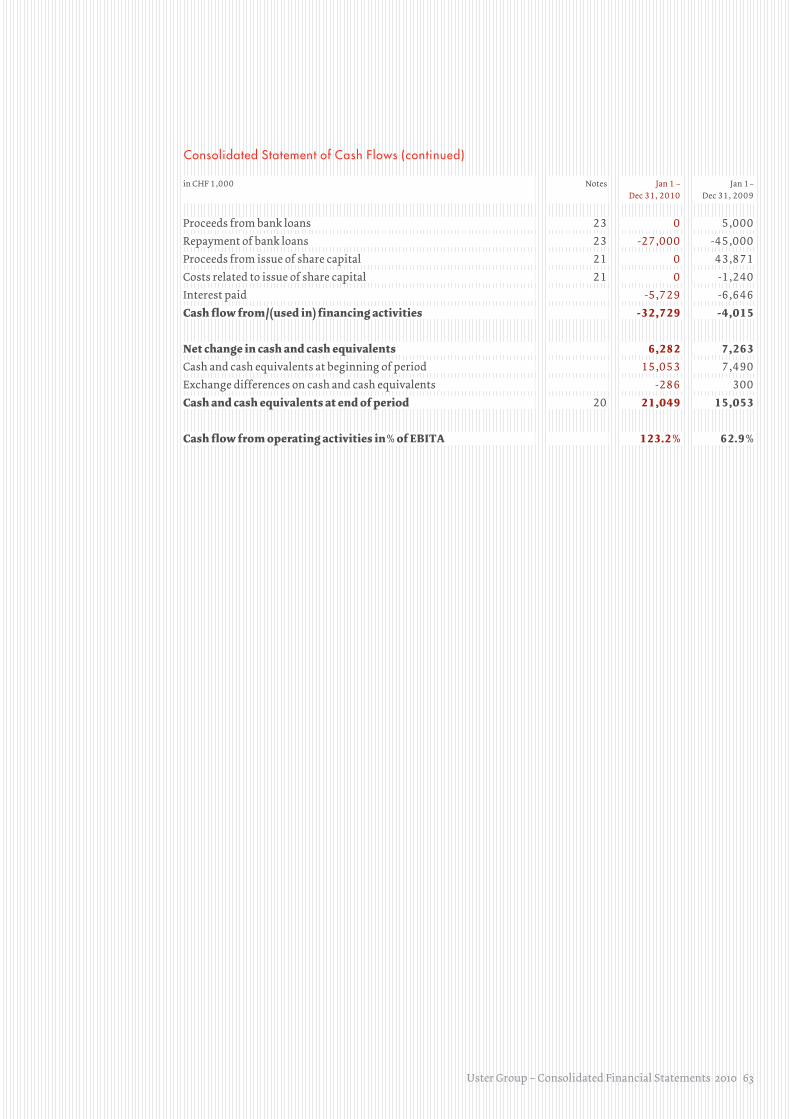
Uster Group – Consolidated Financial Statements 2010 63
Consolidated Statement of Cash Flows (continued)
in CHF 1,000 Notes Jan 1 –
Dec 31, 2010
Jan 1 –
Dec 31, 2009
Proceeds from bank loans 23 0 5,000
Repayment of bank loans 23 -27,000 -45,000
Proceeds from issue of share capital 21 0 43,871
Costs related to issue of share capital 21 0 -1,240
Interest paid -5,729 -6,646
Cash flow from / (used in) financing activities -32,729 -4,015
Net change in cash and cash equivalents 6,282 7,263Cash and cash equivalents at beginning of period 15,053 7,490
Exchange differences on cash and cash equivalents -286 300
Cash and cash equivalents at end of period 20 21,049 15,053
Cash flow from operating activities in % of EBITA 123.2 % 62.9 %
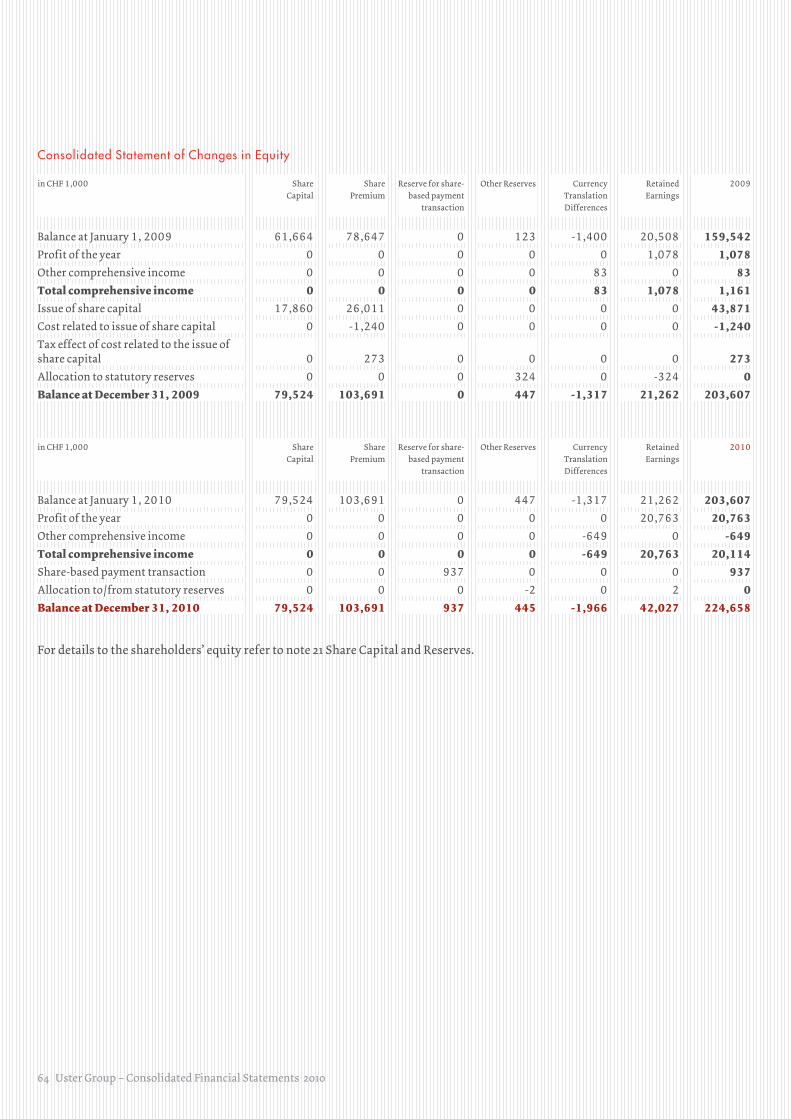
64 Uster Group – Consolidated Financial Statements 2010
Consolidated Statement of Changes in Equity
in CHF 1,000 Share
Capital
Share
Premium
Reserve for share-
based payment
transaction
Other Reserves Currency
Translation
Differences
Retained
Earnings
2009
Balance at January 1, 2009 61,664 78,647 0 123 -1,400 20,508 159,542Profit of the year 0 0 0 0 0 1,078 1,078Other comprehensive income 0 0 0 0 83 0 83Total comprehensive income 0 0 0 0 83 1,078 1,161Issue of share capital 17,860 26,011 0 0 0 0 43,871Cost related to issue of share capital 0 -1,240 0 0 0 0 -1,240Tax effect of cost related to the issue of
share capital 0 273 0 0 0 0 273Allocation to statutory reserves 0 0 0 324 0 -324 0Balance at December 31, 2009 79,524 103,691 0 447 -1,317 21,262 203,607
in CHF 1,000 Share
Capital
Share
Premium
Reserve for share-
based payment
transaction
Other Reserves Currency
Translation
Differences
Retained
Earnings
2010
Balance at January 1, 2010 79,524 103,691 0 447 -1,317 21,262 203,607Profit of the year 0 0 0 0 0 20,763 20,763Other comprehensive income 0 0 0 0 -649 0 -649Total comprehensive income 0 0 0 0 -649 20,763 20,114Share-based payment transaction 0 0 937 0 0 0 937Allocation to / from statutory reserves 0 0 0 -2 0 2 0Balance at December 31, 2010 79,524 103,691 937 445 -1,966 42,027 224,658
For details to the shareholders’ equity refer to note 21 Share Capital and Reserves.
Uster Group – Notes to the Consolidated Financial Statements 2010 65
Uster Group – Notes to the Consolidated Financial Statements
1 Corporate Information
Uster Technologies Ltd (“the Company”) and its subsidiaries (together “the Group”) are the world’s market
leader in textile quality controlling and provide systems and services that enable the industry to manufacture
optimum quality and competitive products “from fiber to fabric”. The Group has a long history as the leader
in textile electronics. For more than 60 years the testing and monitoring solutions have enabled the produc-
tion of the finest fibers, yarns and fabrics.
Uster Technologies Ltd is domiciled in Switzerland. The address of its registered office is Sonnenberg-
strasse 10, CH-8610 Uster, Switzerland.
2 Basis of Preparation of the Consolidated Financial Statements
2.1 Statement of Compliance
The consolidated financial statements of the Uster Group have been prepared in accordance with the
International Financial Reporting Standards (IFRS).
The consolidated financial statements of the Uster Group for the year ended December 31, 2010, were authorized
for issue in accordance with a resolution of the Board of Directors on February 10, 2011. The general meeting
of shareholders will be held on March 29, 2011. According to the Swiss Code of Obligation, the general meeting
of shareholders has the authority to approve the financial statements.
2.2 Basis of Measurement
The consolidated financial statements have been prepared on a historical cost basis except for the derivative
financial instruments mentioned in note 4.3 Market Risk that have been measured at fair value.
2.3 Functional and Presentation Currency
The consolidated financial statements are stated in Swiss Francs, which is the Company’s functional
currency. All values are rounded to the nearest thousand (CHF 1,000) except when otherwise indicated.
2.4 Significant Accounting Judgments and Estimates
In the process of preparing the consolidated financial statements the Executive Committee of the Uster Group
has to make judgments, assumptions and estimations that affect the reported amounts of assets, liabilities,
income and expenses. These estimates are reviewed on a regular basis and are based on past experience as
well as assumptions about the future that currently seem to be reasonable. The actual results, however, could
differ from these estimates.
The key estimates and assumptions that have a significant risk of causing material adjustments to the carrying
amounts of assets and liabilities are mentioned below.
2.5 Impairment of Goodwill and Intangible Assets
The Uster Group determines at least on an annual basis whether goodwill and intangible assets with indefinite
useful lives are to be impaired or not. For intangible assets with definite useful lives the useful life is reviewed
each year and assessed for impairment whenever there is an indicator that the intangible asset may be impaired.
This requires an estimation of the value in use of the cash-generating units to which the goodwill and the
intangible assets are allocated. Estimating the value in use requires to make an estimate of the future cash
flows of the cash-generating units and to choose a suitable discount rate for the calculation of the present
value of those cash flows (see note 13 Impairment Testing of Goodwill and Intangible Assets with Indefinite
Useful Lives). These estimations are based on internal and external sources of information.

66 Uster Group – Notes to the Consolidated Financial Statements 2010
2.6 Pension Benefits
The cost of defined benefit pension plans is determined using actuarial valuations. The actuarial valuation
involves making assumptions about discount rates, expected rates of return on assets, future salary increases,
mortality rates and future pension increases. Due to the long-term nature of these plans, such estimates are
subject to significant uncertainty (see note 15 Pension Benefits).
3 Summary of Significant Accounting Policies
3.1 Changes in Accounting Policies and Presentation
The accounting policies adopted in the preparation of these consolidated financial statements are consistent
with those followed in the preparation of the Group’s annual financial statements for the year ended December 31,
2009. None of the standards, amendments or interpretations effective in 2010 are relevant for the Group.
Standards, Amendments and Interpretations Effective in 2010 not Relevant for the Group
Standard /
Interpretation
Title
Effective Date
IFRS 1 Additional Exemptions
for first time adopters – Amendment
January 1, 2010
IFRS 2 Group Cash-settled Share-based
Payment Transactions – Amendment
January 1, 2010
IFRS 3 Business Combinations – Revised July 1, 2009
IAS 27 Consolidated and Separate
Financial Statements – Amendment
July 1, 2009
IAS 39 Eligible hedged items – Amendment July 1, 2009
IFRIC 9 Embedded Derivatives – Amendment July 1, 2009
IFRIC 17 Distributions of Non-cash Assets to Owners July 1, 2009
IFRIC 18 Transfer of Assets from Customers transfer of assets received after
July 1, 2009
Improvements to IFRS April 2009 January 1, 2010
Standards, Amendments and Interpretations that are not yet Effective in 2010
and have not been Early Adopted by the Group
Standard /
Interpretation
Title
Effective Date
IFRS 1 Severe Hyperinflation and Removal of Fixed Dates
for First-time Adopters – Amendment
July 1, 2011
IFRS 7 Financial Instruments Disclosures – Transfer
of financial assets – Amendment
July 1, 2011
IFRS 9 Financial Instruments January 1, 2013
IAS 12 Deferred Tax: Recovery
of Underlying Assets – Amendment
January 1, 2012
IAS 24 Related Party Disclosures January 1, 2011
IAS 32 Classification of Rights Issues February 1, 2010
IFRIC 14 Prepayments of a Minimum Funding
Requirement – Amendment
January 1, 2011
IFRIC 19 Extinguishing Liabilities with Equity Instruments July 1, 2010
Improvements to IFRS May 2010 January 1, 2011
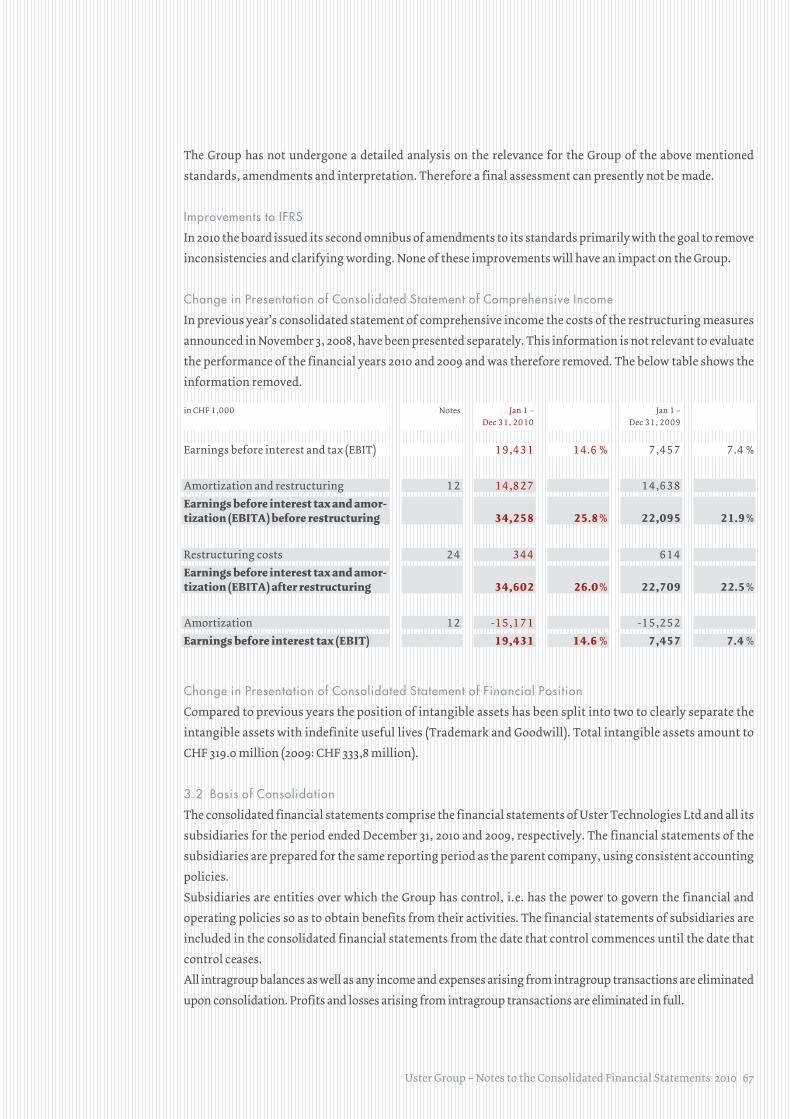
Uster Group – Notes to the Consolidated Financial Statements 2010 67
The Group has not undergone a detailed analysis on the relevance for the Group of the above mentioned
standards, amendments and interpretation. Therefore a final assessment can presently not be made.
Improvements to IFRS
In 2010 the board issued its second omnibus of amendments to its standards primarily with the goal to remove
inconsistencies and clarifying wording. None of these improvements will have an impact on the Group.
Change in Presentation of Consolidated Statement of Comprehensive Income
In previous year’s consolidated statement of comprehensive income the costs of the restructuring measures
announced in November 3, 2008, have been presented separately. This information is not relevant to evaluate
the performance of the financial years 2010 and 2009 and was therefore removed. The below table shows the
information removed.
in CHF 1,000 Notes Jan 1 –
Dec 31, 2010
Jan 1 –
Dec 31, 2009
Earnings before interest and tax (EBIT) 19,431 14.6 % 7,457 7.4 %
Amortization and restructuring 12 14,827 14,638
Earnings before interest tax and amor-tization (EBITA) before restructuring 34,258 25.8 % 22,095 21.9 %
Restructuring costs 24 344 614
Earnings before interest tax and amor-tization (EBITA) after restructuring 34,602 26.0 % 22,709 22.5 %
Amortization 12 -15,171 -15,252
Earnings before interest tax (EBIT) 19,431 14.6 % 7,457 7.4 %
Change in Presentation of Consolidated Statement of Financial Position
Compared to previous years the position of intangible assets has been split into two to clearly separate the
intangible assets with indefinite useful lives (Trademark and Goodwill). Total intangible assets amount to
CHF 319.0 million (2009: CHF 333,8 million).
3.2 Basis of Consolidation
The consolidated financial statements comprise the financial statements of Uster Technologies Ltd and all its
subsidiaries for the period ended December 31, 2010 and 2009, respectively. The financial statements of the
subsidiaries are prepared for the same reporting period as the parent company, using consistent accounting
policies.
Subsidiaries are entities over which the Group has control, i. e. has the power to govern the financial and
operating policies so as to obtain benefits from their activities. The financial statements of subsidiaries are
included in the consolidated financial statements from the date that control commences until the date that
control ceases.
All intragroup balances as well as any income and expenses arising from intragroup transactions are eliminated
upon consolidation. Profits and losses arising from intragroup transactions are eliminated in full.
68 Uster Group – Notes to the Consolidated Financial Statements 2010
3.3 Foreign Currency
Foreign Currency Transactions
Each subsidiary determines its functional currency, and items included in the financial statements of each
subsidiary are measured using that functional currency. Transactions in foreign currencies are initially
recorded in the functional currency at the rate ruling at the date of the transaction.
Monetary assets and liabilities denominated in foreign currency at the reporting date are translated into the
functional currency using the rates valid at that date.
Exchange rate gains and losses arising from transactions and from the translation of monetary items denominated
in foreign currencies are recognized in profit or loss.
Foreign Subsidiaries
As at the reporting date the financial statements of all subsidiaries that have a functional currency different
from the presentation currency are translated into the presentation currency as follows:
• Assets and liabilities are translated at the closing rate ruling at the reporting date.
• Income and expenses are translated at exchange rates at the dates of transactions.
The exchange differences resulting from the above translation are recognized directly in other comprehensive
income. Upon the disposal of a foreign subsidiary the deferred cumulative exchange differences stated in
other comprehensive income are recognized in profit or loss. None of the subsidiaries has the currency of a
hyperinflationary economy.
Foreign exchange gains and losses resulting from intragroup loans of which the settlement is neither planned
nor likely in the foreseeable future are considered to be part of a net investment in a subsidiary and are
recognized directly in other comprehensive income. The deferred cumulative exchange differences stated in
other comprehensive income are recognized in profit or loss on disposal of the foreign subsidiary or on loss
of control on the subsidiary.
The following rates were used for the translation of the financial statements of the foreign subsidiaries:
Closing Rates Average Rates
Dec 31, 2010 Dec 31, 2009 Jan 1 –
Dec 31, 2010
Jan 1 –
Dec 31, 2009
CHF CHF CHF CHF
USD 1 0.936 1.030 1.043 1.087
EUR 1 1.250 1.484 1.382 1.510
JPY 100 1.151 1.114 1.188 1.161
CNY 100 14.174 15.166 15.405 15.906
THB 100 3.113 3.092 3.288 3.163
INR 100 2.092 2.213 2.281 2.245
BRL 100 56.383 59.077 59.241 54.727
MXN 100 7.556 7.841 8.259 8.047
TRY 100 60.423 68.854 69.214 69.859
Uster Group – Notes to the Consolidated Financial Statements 2010 69
3.4 Intangible Assets
Business Combinations and Goodwill
Business combinations are accounted for using the acquisition method. This involves recognizing identifiable
assets (including previously unrecognized intangible assets) and liabilities (including contingent liabilities
and excluding future restructuring) of the acquired business at fair value.
Goodwill represents the excess of the consideration transferred and the amount recognized for non-controlling
interest at the date of the acquisition of the net identifiable assets, liabilities and contingent liabilities assumed.
When the excess is negative (negative goodwill), it is recognized immediately in profit or loss. Goodwill acquired
in a business combination is initially measured at cost.
Following initial recognition goodwill is measured at cost less any accumulated impairment losses. For the
purpose of impairment testing goodwill is allocated from the date of acquisition to cash-generating units.
The allocation is made to those cash-generating units or groups of cash-generating units that are expected
to benefit from the business combination, irrespective of whether other assets or liabilities of the Group are
assigned to those units. Each unit to which the goodwill is allocated represents the lowest level within the
Uster Group at which the goodwill is monitored for internal management purposes. Impairment losses on
goodwill are not reversed.
Research and Development
Research costs are expensed as incurred. An intangible asset arising from development expenditure on an
individual project is recognized only when the Group can demonstrate the technical feasibility of completing
the intangible asset so that it will be available for use or sale, its intention to complete and its ability to use
or sell the asset, how the asset will generate future economic benefits, the availability of resources to complete
the asset and the ability to measure reliably the expenditure during the development. Currently the Group
did not capitalize development cost.
Other Intangible Assets
Intangible assets acquired separately are measured on initial recognition at cost. The cost of intangible assets
acquired in a business combination is the fair value at the date of acquisition. Following initial recognition
intangible assets are carried at cost less any accumulated amortization and any accumulated impairment
losses. The useful lives of intangible assets are assessed to be either finite or indefinite.
Intangible assets with finite lives are amortized using the straight-line method over their useful economic
life and assessed for impairment whenever there is an indication that the intangible asset may be impaired.
The amortization period and the amortization method for an intangible asset with a finite useful life are
reviewed at least once, usually at the end of, each financial year. Changes in the expected useful life or the
expected pattern of consumption of future economic benefits embodied in the asset are accounted for by
changing the amortization period or method and treated as changes in accounting estimates. The amortiza-
tion expense on intangible assets with finite lives is recognized in the expense category consistent with the
function of the intangible assets.
Intangible assets with an indefinite useful life are tested annually for impairment either individually or at
the level of the cash-generating unit. Such intangibles are not amortized. The useful life of an intangible
asset with an indefinite life is reviewed annually to determine whether indefinite life assessment continues
to be supportable. If not, the change in the useful life assessment from indefinite to definite is made on a
prospective basis.
70 Uster Group – Notes to the Consolidated Financial Statements 2010
The useful lives of the intangible assets are as follows:
Useful Life in Years
Software 5
Customer base 20
Technology 10
USTER® STATISTICS 25
Trademark indefinite
3.5 Property, Plant and Equipment
Property, plant and equipment including land and buildings are stated at cost less accumulated depreciation
and accumulated impairment. Such cost includes expenditure directly attributable to the acquisition of the
property, plant and equipment.
The cost of replacing part of property, plant and equipment is included in the carrying amount of the item
if it is probable that the future economic benefits associated with the item will flow to the Group and the
cost can be measured reliably. The cost for all other repairs and maintenance is charged to the Statement of
Comprehensive Income as incurred.
Depreciation is calculated using the straight-line method over the estimated useful lives of the assets. Land
is not depreciated.
The useful lives of property, plant and equipment are as follows:
Useful Life in Years
Buildings 25
Plant and machinery 3–5
Office equipment 3–5
IT and communication equipment 2–6
Vehicles 4–5
The residual values and useful lives of property, plant and equipment are reviewed and adjusted, if appropriate,
at the end of each financial year.
The carrying values of property, plant and equipment are reviewed for impairment when events or changes in
circumstances indicate that the carrying value may not be recoverable.
Items of property, plant and equipment are derecognized upon disposal or when no future economic benefits
are expected from their use or disposal. Any gains or losses on disposals are recognized in profit or loss within
“Other income” or “Other expenses”.
3.6 Financial Instruments
Financial Instruments
Financial instruments comprise investments in equity and debt securities, trade and other receivables,
cash and cash equivalents, loans and borrowings, trade and other payables as well as accrued liabilities.
Uster Group – Notes to the Consolidated Financial Statements 2010 71
Financial instruments are classified in the following categories:
• Financial assets at fair value through profit or loss
• Loans and receivables
• Held-to-maturity investments
• Available-for-sale financial assets
• Financial liabilities at fair value through profit or loss
• Financial liabilities at amortized cost
The classification depends on the purpose for which the financial assets or liabilities were acquired or
entered into and is determined at initial recognition.
Non-derivative financial instruments are recognized initially at fair value plus, for instruments not at fair
value through profit and loss, any directly attributable transaction costs. Subsequent to initial recognition
they are measured as described below.
Financial Assets at Fair Value through Profit or Loss
Financial assets at fair value through profit or loss include financial assets held for trading. A financial
asset falls under this category if acquired principally for the purpose of selling in the short-term. Assets
in this category are classified as current assets. The Group did not have financial instruments falling under
this category on December 31, 2010 or 2009.
Subsequent to initial recognition financial assets at fair value through profit or loss are measured at fair
value, and changes therein are recognized in profit or loss without any deduction for transaction costs
that may occur on sale or disposal.
Loans and Receivables
Loans and receivables are non-derivative financial assets with fixed or determinable payments that are
not quoted in an active market. They are included in current assets, except for maturities greater than 12
months after the reporting date. These are classified as non-current assets. The Group’s loans and receivables
comprise “receivables trade” (note 18 Receivables Trade), “other receivables” (note 19 Other Receivables),
“cash and cash equivalents” (note 20 Cash and Cash Equivalents) as well as “financial assets” that include
mainly deposits.
Loans and receivables are carried at amortized cost, using the effective interest method less any allowance
for impairment. Gains and losses are recognized in profit and loss when the loans and receivables are
derecognized or impaired.

72 Uster Group – Notes to the Consolidated Financial Statements 2010
Held-to-maturity Investments
Held-to-maturity investments are non-derivative financial instruments which carry fixed or determinable
payments and fixed maturities and which the Group has the positive intention and ability to hold to maturity.
The Group did not have financial instruments falling under this category on December 31, 2010 or 2009.
Available-for-sale Financial Assets
Available-for-sale financial assets are those non-derivative financial instruments that are designated as
available-for-sale or are not classified in any of the three preceding categories. As of December 31, 2010
and 2009, no financial assets have been designated as available-for-sale financial assets.
Financial Liabilities at Fair Value through Profit or Loss
Financial liabilities at fair value through profit or loss include financial liabilities held for trading. A
financial liability falls under this category if entered into principally for the purpose of repayment in the
short-term. Liabilities in this category are classified as current liabilities.
Subsequent to initial recognition financial liabilities at fair value through profit or loss are measured at
fair value, and changes therein are recognized in profit or loss.
As of December 31, 20010, the Group held one derivative financial instrument (see note 4.3 Market Risk)
to hedge its interest rate risk exposure on the bank loans. This interest rate swap, however, does not qualify
as a hedge accounting instrument according to IAS 39.
It is recognized initially at fair value (as an asset or liability at fair value through profit or loss) and any
gains or losses resulting from the valuation at market value are taken through profit or loss as incurred.
Financial Liabilities at Amortized Cost
All loans and borrowings are initially recognized at fair value less directly attributable transaction costs.
Subsequently they are measured at amortized cost, using the effective interest method. Gains and losses
are recognized in profit or loss when the liabilities are derecognized as well as through the amortization
process.
As of December 31, 2010 and 2009, the Group had bank loans as well as trade and other liabilities that
qualified as financial liabilities at amortized cost (see notes 23 Bank Loans and 25 Trade and Other Liabilities).
Accounting for finance income and expenses is discussed in note 3.15 Finance Income and Expenses.
Share Capital
Ordinary Shares
Ordinary shares are classified as equity. Transaction costs directly attributable to the issue of ordinary
shares are recognized as a deduction from equity net of any tax effects.
Treasury Shares
When share capital recognized as equity is repurchased, the amount of the consideration paid is recognized
as a deduction from equity. When treasury shares are sold or reissued subsequently, the amount received
is recognized as an increase in equity and the resulting surplus or deficit on the transaction is recorded in
retained earnings. As of December 31, 2010 and 2009, the Group did not have any treasury shares.

Uster Group – Notes to the Consolidated Financial Statements 2010 73
3.7 Share-based Payment Transactions
The Group operates a Restricted Stock Unit Plan under which the Group receives services from employees
as consideration for shares of the Group at CHF 9.40 each.
Equity-settled Transactions
The cost of equity-settled transactions is recognized, together with a corresponding increase in reserve for
share-based payment transaction in equity, over the period in which the performance and/or service conditions
are fulfilled. The cumulative expense recognized for equity-settled transactions at each reporting date until
the vesting date reflects the extent to which the vesting period has expired and the Group’s best estimate of
the number of equity instruments that will ultimately vest. The income statement expense or credit for a
period represents the movement in cumulative expense recognized as at the beginning and end of that period
and is recognized in personnel expense (note 8.4).
Expense is recognized for equity-settled transactions where vesting is conditional upon a market or non-vesting
condition, which are treated as vesting irrespective of whether or not the market or non-vesting condition
is satisfied, provided that all other performance and/or service conditions are satisfied. Where the terms of
an equity-settled transaction award are modified, the minimum expense recognized is the expense as if the
terms had not been modified, if the original terms of the award are met. An additional expense is recognized
for any modification that increases the total fair value of the share-based payment transaction, or is otherwise
beneficial to the employee as measured at the date of modification. Where an equity-settled award is cancelled,
it is treated as if vested on the date of cancellation, and any expense not yet recognized for the award is recog-
nized immediately. This includes any award where non-vesting conditions within the control of either the
entity or the employee are not met. However, if a new award is substituted for the cancelled award, and
designated as a replacement award on the date that it is granted, the cancelled and new awards are treated
as if they were a modification of the original award, as described in the previous paragraph. All cancellations
of equity-settled transaction awards are treated equally. The dilutive effect of outstanding options is reflected
as additional share dilution in the computation of diluted earnings per share (further details are given in
note 22).
3.8 Inventories
Inventories are measured at the lower of cost and net realizable value. Cost for inventories is based on the
weighted average principle and includes expenditure incurred in acquiring the inventories, conversion costs
and other costs incurred in bringing them to their existing location and condition. Manufactured inventories
as well as work in progress cost includes an appropriate share of production overheads based on normal
operating capacity.
Net realizable value is the estimated selling price in the ordinary course of business less the estimated costs
of completion and the selling expenses.
74 Uster Group – Notes to the Consolidated Financial Statements 2010
3.9 Cash and Cash Equivalents
Cash and cash equivalents include cash on hand, bank account balances as well as short-term deposits with
an original maturity of 90 days or less.
3.10 Provisions
Provisions are recognized when the following criteria are met:
• The Group has a present legal or constructive obligation as a result of a past event;
• It is probable that an outflow of resources embodying economic benefits will be required to settle the
obligation;
• The amount of the obligation can be reliably estimated.
The expense relating to any provision is presented in the Statement of Comprehensive Income net of any
reimbursement.
3.11 Impairment
Intangible Assets and Property, Plant and Equipment
Assets with an indefinite useful life are not subject to amortization and depreciation but are tested for
impairment annually or more frequently if events or changes in circumstances indicate that the carrying
value may be impaired.
Assets that are subject to amortization and depreciation are reviewed for impairment whenever there is an
indication that the carrying amount may not be recoverable.
An impairment loss is recognized for the amount by which the asset’s carrying amount exceeds its recoverable
amount. An asset’s recoverable amount is the higher of an asset’s fair value less costs to sell and its value in
use. For the purpose of assessing impairment, assets are grouped at the lowest levels for which there are
separately identifiable cash in flows (cash-generating units).
Impairment losses are recognized in profit or loss. Intangible assets other than goodwill and intangible assets
with indefinite useful lives and property, plant and equipment for which an impairment loss was recognized
are reviewed for possible reversal of the impairment at each reporting date. Such reversal is recognized in
profit or loss.
Financial Assets
A financial asset is assessed at each reporting date to determine whether there is any objective evidence that
it is impaired. An impairment loss in respect of a financial asset measured at amortized cost is calculated as
the difference between its carrying amount and its present value of the future estimated cash flows discounted
at the original effective interest rate. An impairment loss in respect of an available for sale financial asset is
calculated by reference to its fair value. Individually significant financial assets are tested for impairment on
an individual basis. In relation to trade receivables a provision for impairment is made when there is objective
evidence (such as the probability of insolvency or significant financial difficulties of the debtor) that the
Group will not be able to collect all of the amounts due under the original terms of the invoice. The carrying
amount of the receivable is reduced through use of an allowance account. Impaired debts are derecognized
when they are assessed as uncollectible.
Uster Group – Notes to the Consolidated Financial Statements 2010 75
3.12 Pension Benefits
Defined Benefit Pension Plan
Uster Technologies Ltd provides pension benefits for its employees in Switzerland in the event of retirement,
disability and death. The pension scheme is organized as a separate legal entity and is funded in accordance
with legal requirements.
Costs and liabilities related to the defined benefit pension plan are determined using the projected unit
credit method with attribution of benefit by service pro rata.
The amount recognized in the Statement of Financial Position in respect of defined benefit pension plans is
the fair value of plan assets less the present value of the defined benefit obligation at reporting date, together
with adjustments for unrecognized actuarial gains and losses, unrecognized past service cost and for unre-
cognized assets.
Actuarial gains and losses are recognized as income or expense when the cumulative unrecognized actuarial
gain or loss exceeds 10.0 % of the higher of the defined benefit obligation and the fair value of the plan assets.
These gains or losses are recognized over the expected average remaining working life of the employees
participating in the plan.
Defined Contribution Plans
For employees in other subsidiaries the company pays contributions to the separate legal entity as the plans’
rules require. The regular contributions constitute net periodic costs for the year in which they are due and as
such are included in personnel expenses.
3.13 Leases
Leases in terms of which the Group assumes substantially all the risks and rewards of ownership are classified
as finance leases. As of December 31, 2010 and 2009, the Group did not have any finance leases.
All the Group’s leases are operating leases and the leased assets are not recognized in the Group’s Statement of
Financial Position. Operating lease payments are recognized as an expense in profit or loss on a straight-line
basis over the lease term. Lease incentives received are recognized as an integral part of the total lease expense
over the term of the lease.
3.14 Revenue Recognition
Revenue from the sale of testing instrumentation is measured at the fair value of the consideration received or
receivable net of returns, discounts and volume rebates, sales taxes and duty. Revenue is recognized when the
significant risks and rewards of ownership of the goods have passed to the buyer; it is probable that the eco-
nomic benefits associated with the transaction will flow to the entity, the associated costs incurred or to be
incurred can be estimated reliably, and the amount of revenue can be measured reliably.
Risks and rewards for products and spare parts sold are usually transferred to the client as soon as the products
and spare parts leave an entity of the Uster Group. However, sometimes the transfer of risks and rewards occurs
when they are received by the client at the port of entry.
Revenue from service contracts relating to maintenance of testing instrumentation sold is recognized on a pro
rata basis over the contract period. The length of the service contracts usually varies between 3 and 12 months.
76 Uster Group – Notes to the Consolidated Financial Statements 2010
3.15 Finance Income and Expenses
Finance income includes interest income on funds invested as well as changes in the fair value of the interest
rate swap described in note 4.3 Market Risk. Interest income is recognized as it accrues in profit or loss using
the effective interest rate method.
Finance expenses comprise interest expense on loans, changes in the fair value of the interest rate swap described
in note 4.3 Market Risk, and impairment losses recognized on non-derivative financial instruments with the
exception of accounts receivable trade for which the valuation allowance is recorded under sales deductions.
All interest expenses on loans are recognized in profit or loss using the effective interest rate method.
3.16 Income Tax
Income tax includes current and deferred tax. Income tax is recognized in profit or loss except to the extent that
it relates to items recognized directly in equity or in other comprehensive income, in which case it is recognized
in equity or other comprehensive income.
Current Income Tax
Current income tax assets and liabilities for the current and prior periods are measured at the amount expected
to be recovered from or paid to the tax authorities. The tax rates and tax laws used to compute the amount are
those that are enacted at the reporting date.
Deferred Tax
Deferred income tax is provided using the liability method on temporary differences at the reporting date
between the tax bases of assets and liabilities and their carrying amounts for financial reporting purposes.
Deferred income tax is recognized for all taxable temporary differences except:
• If the deferred income tax arises from the initial recognition of an asset or liability in a transaction that is not
a business combination and, at the time of the transaction, affects neither the accounting profit nor the
taxable profit or loss;
• With respect to the taxable temporary differences associated with investments in subsidiaries where the
timing of the reversal of the temporary differences can be controlled and it is probable that the temporary
differences will not reverse in the foreseeable future;
• On taxable temporary differences arising on the initial recognition of goodwill.
Deferred income tax assets are recognized for all carry forwards of unused tax credits and unused tax losses to
the extent that it is probable that taxable profit will be available against which the deductible temporary differences
and the carry forwards of unused tax credits and losses can be utilized.
Deferred income tax assets and liabilities are measured at the tax rates that are expected to apply in the year
when the asset is realized or the liability is settled, based on tax rates and tax laws that have been enacted or
substantively enacted at the reporting date.
Deferred income tax assets and deferred income tax liabilities are offset if a legally enforceable right exists to
set off current tax assets against current income tax liabilities and the deferred income taxes relate to the same
taxable entity and the same taxation authority.
A provision is made for non-recoverable withholding taxes on undistributed earnings of foreign subsidiaries.
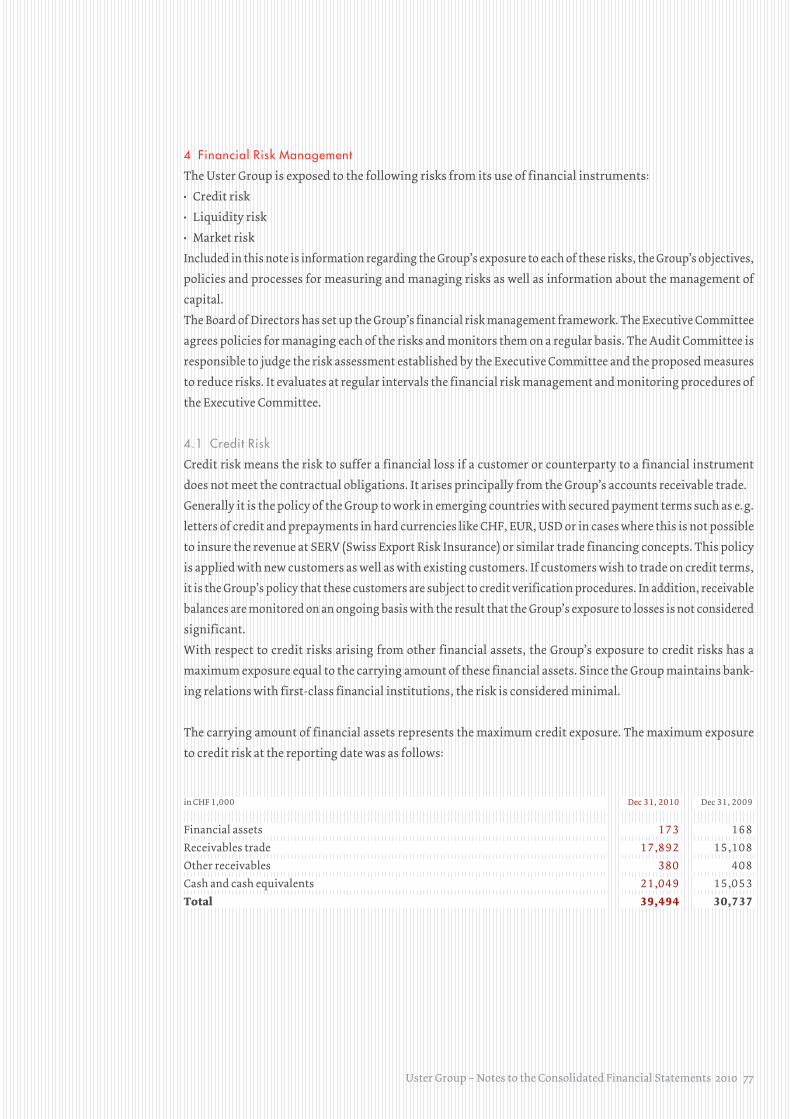
Uster Group – Notes to the Consolidated Financial Statements 2010 77
4 Financial Risk Management
The Uster Group is exposed to the following risks from its use of financial instruments:
• Credit risk
• Liquidity risk
• Market risk
Included in this note is information regarding the Group’s exposure to each of these risks, the Group’s objectives,
policies and processes for measuring and managing risks as well as information about the management of
capital.
The Board of Directors has set up the Group’s financial risk management framework. The Executive Committee
agrees policies for managing each of the risks and monitors them on a regular basis. The Audit Committee is
responsible to judge the risk assessment established by the Executive Committee and the proposed measures
to reduce risks. It evaluates at regular intervals the financial risk management and monitoring procedures of
the Executive Committee.
4.1 Credit Risk
Credit risk means the risk to suffer a financial loss if a customer or counterparty to a financial instrument
does not meet the contractual obligations. It arises principally from the Group’s accounts receivable trade.
Generally it is the policy of the Group to work in emerging countries with secured payment terms such as e. g.
letters of credit and prepayments in hard currencies like CHF, EUR, USD or in cases where this is not possible
to insure the revenue at SERV (Swiss Export Risk Insurance) or similar trade financing concepts. This policy
is applied with new customers as well as with existing customers. If customers wish to trade on credit terms,
it is the Group’s policy that these customers are subject to credit verification procedures. In addition, receivable
balances are monitored on an ongoing basis with the result that the Group’s exposure to losses is not considered
significant.
With respect to credit risks arising from other financial assets, the Group’s exposure to credit risks has a
maximum exposure equal to the carrying amount of these financial assets. Since the Group maintains bank-
ing relations with first-class financial institutions, the risk is considered minimal.
The carrying amount of financial assets represents the maximum credit exposure. The maximum exposure
to credit risk at the reporting date was as follows:
in CHF 1,000 Dec 31, 2010 Dec 31, 2009
Financial assets 173 168
Receivables trade 17,892 15,108
Other receivables 380 408
Cash and cash equivalents 21,049 15,053
Total 39,494 30,737
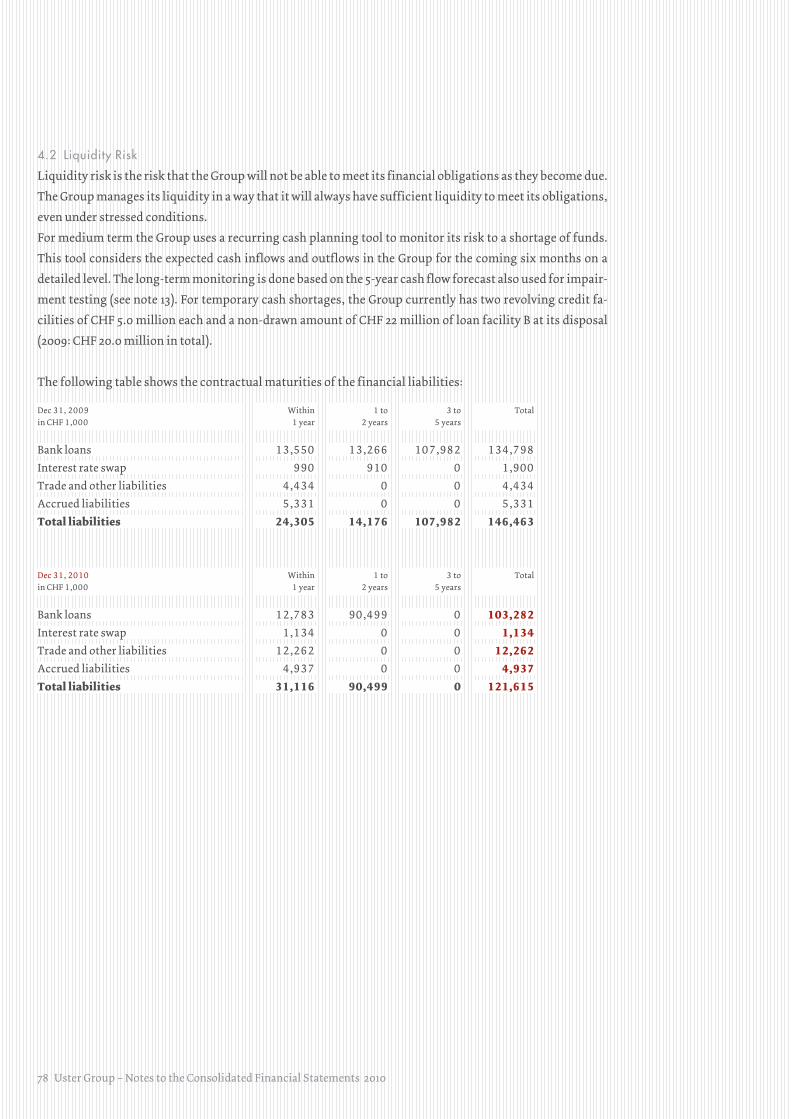
78 Uster Group – Notes to the Consolidated Financial Statements 2010
4.2 Liquidity Risk
Liquidity risk is the risk that the Group will not be able to meet its financial obligations as they become due.
The Group manages its liquidity in a way that it will always have sufficient liquidity to meet its obligations,
even under stressed conditions.
For medium term the Group uses a recurring cash planning tool to monitor its risk to a shortage of funds.
This tool considers the expected cash inflows and outflows in the Group for the coming six months on a
detailed level. The long-term monitoring is done based on the 5-year cash flow forecast also used for impair-
ment testing (see note 13). For temporary cash shortages, the Group currently has two revolving credit fa-
cilities of CHF 5.0 million each and a non-drawn amount of CHF 22 million of loan facility B at its disposal
(2009: CHF 20.0 million in total).
The following table shows the contractual maturities of the financial liabilities:
Dec 31, 2009
in CHF 1,000
Within
1 year
1 to
2 years
3 to
5 years
Total
Bank loans 13,550 13,266 107,982 134,798
Interest rate swap 990 910 0 1,900
Trade and other liabilities 4,434 0 0 4,434
Accrued liabilities 5,331 0 0 5,331
Total liabilities 24,305 14,176 107,982 146,463
Dec 31, 2010
in CHF 1,000
Within
1 year
1 to
2 years
3 to
5 years
Total
Bank loans 12,783 90,499 0 103,282Interest rate swap 1,134 0 0 1,134Trade and other liabilities 12,262 0 0 12,262Accrued liabilities 4,937 0 0 4,937Total liabilities 31,116 90,499 0 121,615
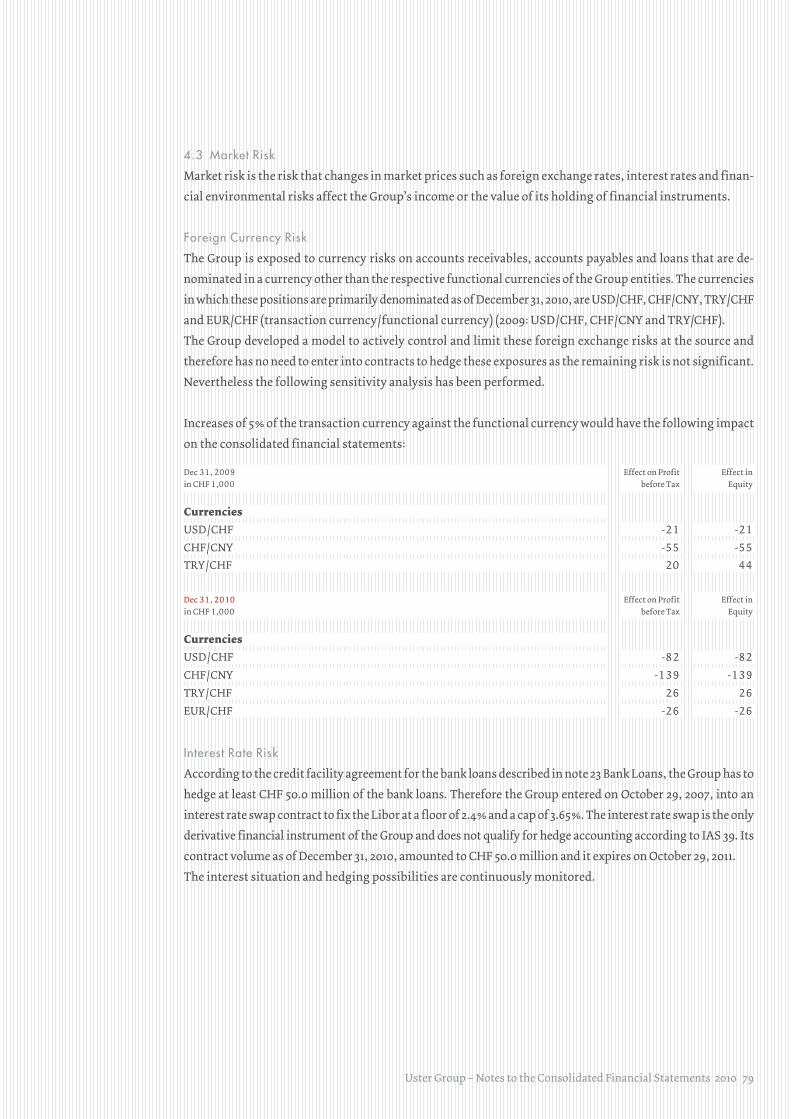
Uster Group – Notes to the Consolidated Financial Statements 2010 79
4.3 Market Risk
Market risk is the risk that changes in market prices such as foreign exchange rates, interest rates and finan-
cial environmental risks affect the Group’s income or the value of its holding of financial instruments.
Foreign Currency Risk
The Group is exposed to currency risks on accounts receivables, accounts payables and loans that are de-
nominated in a currency other than the respective functional currencies of the Group entities. The currencies
in which these positions are primarily denominated as of December 31, 2010, are USD / CHF, CHF / CNY, TRY / CHF
and EUR / CHF (transaction currency / functional currency) (2009: USD / CHF, CHF / CNY and TRY/CHF).
The Group developed a model to actively control and limit these foreign exchange risks at the source and
therefore has no need to enter into contracts to hedge these exposures as the remaining risk is not significant.
Nevertheless the following sensitivity analysis has been performed.
Increases of 5 % of the transaction currency against the functional currency would have the following impact
on the consolidated financial statements:
Dec 31, 2009
in CHF 1,000
Effect on Profit
before Tax
Effect in
Equity
CurrenciesUSD / CHF -21 -21
CHF / CNY -55 -55
TRY / CHF 20 44
Dec 31, 2010
in CHF 1,000
Effect on Profit
before Tax
Effect in
Equity
CurrenciesUSD / CHF -82 -82
CHF / CNY -139 -139
TRY / CHF 26 26
EUR / CHF -26 -26
Interest Rate Risk
According to the credit facility agreement for the bank loans described in note 23 Bank Loans, the Group has to
hedge at least CHF 50.0 million of the bank loans. Therefore the Group entered on October 29, 2007, into an
interest rate swap contract to fix the Libor at a floor of 2.4 % and a cap of 3.65 %. The interest rate swap is the only
derivative financial instrument of the Group and does not qualify for hedge accounting according to IAS 39. Its
contract volume as of December 31, 2010, amounted to CHF 50.0 million and it expires on October 29, 2011.
The interest situation and hedging possibilities are continuously monitored.

80 Uster Group – Notes to the Consolidated Financial Statements 2010
The table below sets out the carrying amount of the Group’s interest bearing financial instruments exposed
to interest rate risk:
Dec 31, 2009
in CHF 1,000
Balance within
1 year
1 to
2 years
3 to
5 years
Over
5 years
Variable rateCash and cash equivalents 15,053 0 0 0
Bank loans 124,277 114,518 104,759 0
Interest rate swap 1,900 0 0 0
Total 141,230 114,518 104,759 0
Dec 31, 2010
in CHF 1,000
Balance within
1 year
1 to
2 years
3 to
5 years
Over
5 years
Variable rateCash and cash equivalents 21,049 0 0 0
Bank loans 97,518 87,759 0 0
Interest rate swap 1,134 0 0 0
Total 119,701 87,759 0 0
The Group’s bank loans at variable rate are analyzed on a dynamic basis with regards to the interest rate exposure.
On a regular basis the sensitivity of the Group’s result before tax to a reasonably possible change in interest
rates, with all other variables held constant, is tested.
The result of the sensitivity testing mentioned above is as follows:
Change in base points Effect on result before tax
in CHF 1,000
Dec 31, 2010 Dec 31, 2009
+ 5 -59 -84
+ 20 -233 -335
- 10 103 168
-15 117 251
4.4 Capital Management
The Group’s objectives when managing capital are to safeguard the Group’s ability to continue as a going
concern in order to provide returns for shareholders and benefits for other stakeholders and to maintain an
optimal capital structure to reduce the cost of capital. As of December 31, 2010, equity amounted to 56.2 % of
total equity and liabilities (2009: 50.3 %).
Please refer to note 23 Bank Loans for covenant requirements.
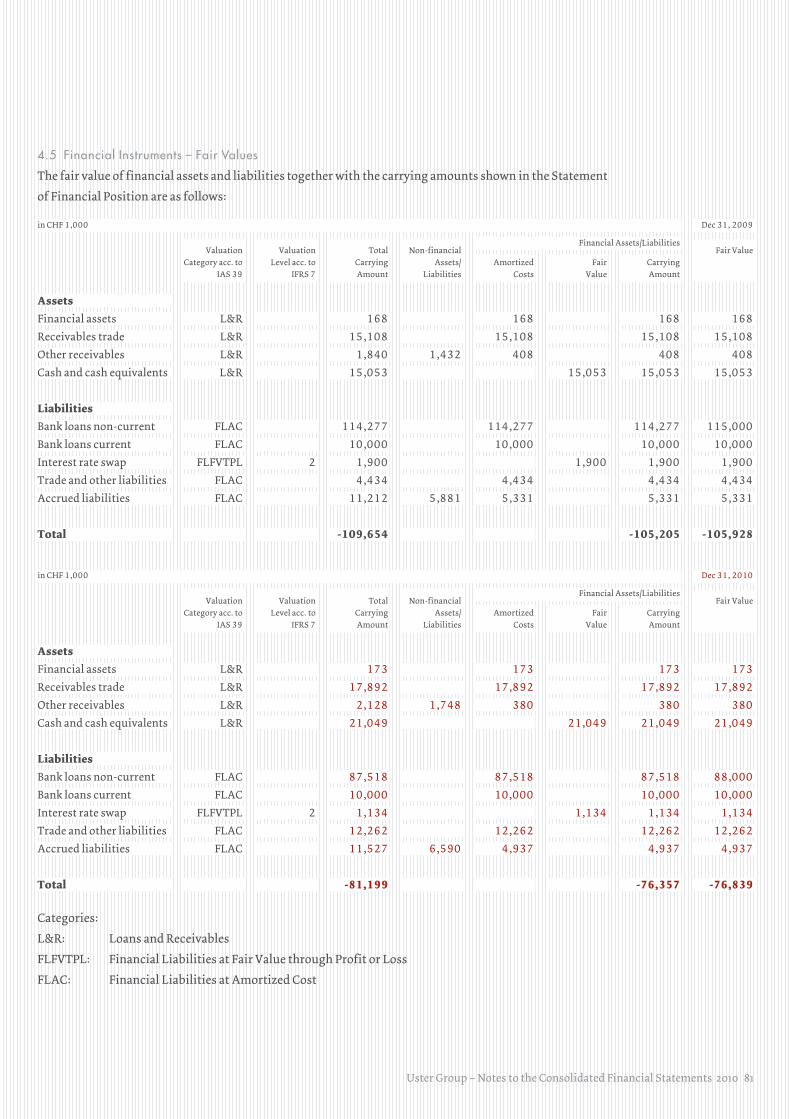
Uster Group – Notes to the Consolidated Financial Statements 2010 81
4.5 Financial Instruments – Fair Values
The fair value of financial assets and liabilities together with the carrying amounts shown in the Statement
of Financial Position are as follows:
in CHF 1,000 Dec 31, 2009
Financial Assets/LiabilitiesValuation
Category acc. to
IAS 39
Valuation
Level acc. to
IFRS 7
Total
Carrying
Amount
Non-financial
Assets/
Liabilities
Amortized
Costs
Fair
Value
Carrying
Amount
Fair Value
AssetsFinancial assets L&R 168 168 168 168
Receivables trade L&R 15,108 15,108 15,108 15,108
Other receivables L&R 1,840 1,432 408 408 408
Cash and cash equivalents L&R 15,053 15,053 15,053 15,053
LiabilitiesBank loans non-current FLAC 114,277 114,277 114,277 115,000
Bank loans current FLAC 10,000 10,000 10,000 10,000
Interest rate swap FLFVTPL 2 1,900 1,900 1,900 1,900
Trade and other liabilities FLAC 4,434 4,434 4,434 4,434
Accrued liabilities FLAC 11,212 5,881 5,331 5,331 5,331
Total -109,654 -105,205 -105,928
in CHF 1,000 Dec 31, 2010
Financial Assets/LiabilitiesValuation
Category acc. to
IAS 39
Valuation
Level acc. to
IFRS 7
Total
Carrying
Amount
Non-financial
Assets/
Liabilities
Amortized
Costs
Fair
Value
Carrying
Amount
Fair Value
AssetsFinancial assets L&R 173 173 173 173
Receivables trade L&R 17,892 17,892 17,892 17,892
Other receivables L&R 2,128 1,748 380 380 380
Cash and cash equivalents L&R 21,049 21,049 21,049 21,049
LiabilitiesBank loans non-current FLAC 87,518 87,518 87,518 88,000
Bank loans current FLAC 10,000 10,000 10,000 10,000
Interest rate swap FLFVTPL 2 1,134 1,134 1,134 1,134
Trade and other liabilities FLAC 12,262 12,262 12,262 12,262
Accrued liabilities FLAC 11,527 6,590 4,937 4,937 4,937
Total -81,199 -76,357 -76,839
Categories:
L&R: Loans and Receivables
FLFVTPL: Financial Liabilities at Fair Value through Profit or Loss
FLAC: Financial Liabilities at Amortized Cost
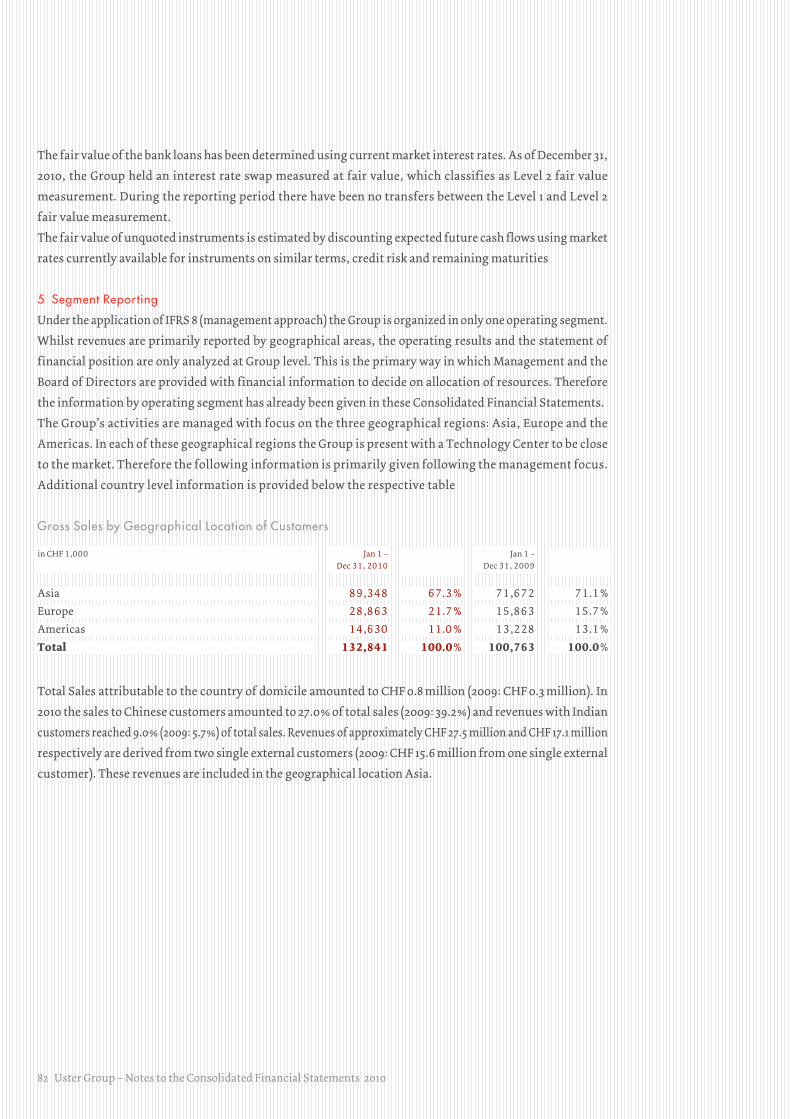
82 Uster Group – Notes to the Consolidated Financial Statements 2010
The fair value of the bank loans has been determined using current market interest rates. As of December 31,
2010, the Group held an interest rate swap measured at fair value, which classifies as Level 2 fair value
measurement. During the reporting period there have been no transfers between the Level 1 and Level 2
fair value measurement.
The fair value of unquoted instruments is estimated by discounting expected future cash flows using market
rates currently available for instruments on similar terms, credit risk and remaining maturities
5 Segment Reporting
Under the application of IFRS 8 (management approach) the Group is organized in only one operating segment.
Whilst revenues are primarily reported by geographical areas, the operating results and the statement of
financial position are only analyzed at Group level. This is the primary way in which Management and the
Board of Directors are provided with financial information to decide on allocation of resources. Therefore
the information by operating segment has already been given in these Consolidated Financial Statements.
The Group’s activities are managed with focus on the three geographical regions: Asia, Europe and the
Americas. In each of these geographical regions the Group is present with a Technology Center to be close
to the market. Therefore the following information is primarily given following the management focus.
Additional country level information is provided below the respective table
Gross Sales by Geographical Location of Customers
in CHF 1,000 Jan 1 –
Dec 31, 2010
Jan 1 –
Dec 31, 2009
Asia 89,348 67.3 % 71,672 71.1 %
Europe 28,863 21.7 % 15,863 15.7 %
Americas 14,630 11.0 % 13,228 13.1 %
Total 132,841 100.0 % 100,763 100.0 %
Total Sales attributable to the country of domicile amounted to CHF 0.8 million (2009: CHF 0.3 million). In
2010 the sales to Chinese customers amounted to 27.0 % of total sales (2009: 39.2 %) and revenues with Indian
customers reached 9.0 % (2009: 5.7 %) of total sales. Revenues of approximately CHF 27.5 million and CHF 17.1 million
respectively are derived from two single external customers (2009: CHF 15.6 million from one single external
customer). These revenues are included in the geographical location Asia.
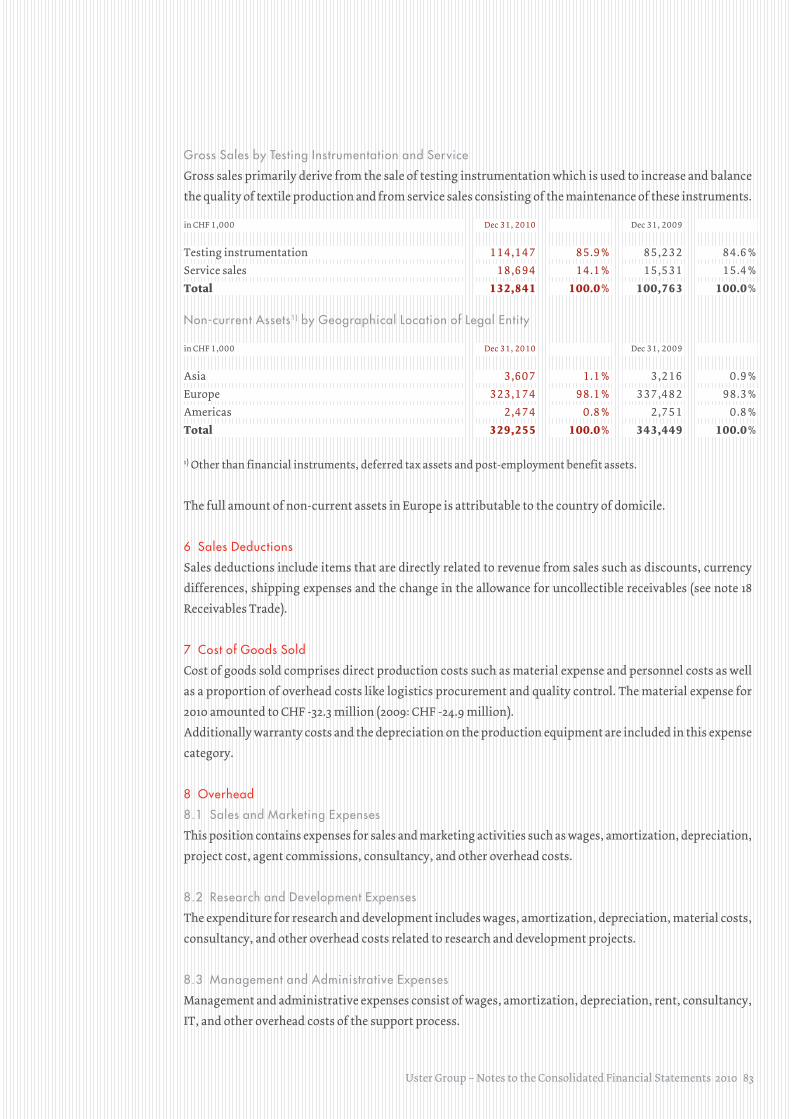
Uster Group – Notes to the Consolidated Financial Statements 2010 83
Gross Sales by Testing Instrumentation and Service
Gross sales primarily derive from the sale of testing instrumentation which is used to increase and balance
the quality of textile production and from service sales consisting of the maintenance of these instruments.
in CHF 1,000 Dec 31, 2010 Dec 31, 2009
Testing instrumentation 114,147 85.9 % 85,232 84.6 %
Service sales 18,694 14.1 % 15,531 15.4 %
Total 132,841 100.0 % 100,763 100.0 %
Non-current Assets1) by Geographical Location of Legal Entity
in CHF 1,000 Dec 31, 2010 Dec 31, 2009
Asia 3,607 1.1 % 3,216 0.9 %
Europe 323,174 98.1 % 337,482 98.3 %
Americas 2,474 0.8 % 2,751 0.8 %
Total 329,255 100.0 % 343,449 100.0 %
1) Other than financial instruments, deferred tax assets and post-employment benefit assets.
The full amount of non-current assets in Europe is attributable to the country of domicile.
6 Sales Deductions
Sales deductions include items that are directly related to revenue from sales such as discounts, currency
differences, shipping expenses and the change in the allowance for uncollectible receivables (see note 18
Receivables Trade).
7 Cost of Goods Sold
Cost of goods sold comprises direct production costs such as material expense and personnel costs as well
as a proportion of overhead costs like logistics procurement and quality control. The material expense for
2010 amounted to CHF -32.3 million (2009: CHF -24.9 million).
Additionally warranty costs and the depreciation on the production equipment are included in this expense
category.
8 Overhead
8.1 Sales and Marketing Expenses
This position contains expenses for sales and marketing activities such as wages, amortization, depreciation,
project cost, agent commissions, consultancy, and other overhead costs.
8.2 Research and Development Expenses
The expenditure for research and development includes wages, amortization, depreciation, material costs,
consultancy, and other overhead costs related to research and development projects.
8.3 Management and Administrative Expenses
Management and administrative expenses consist of wages, amortization, depreciation, rent, consultancy,
IT, and other overhead costs of the support process.
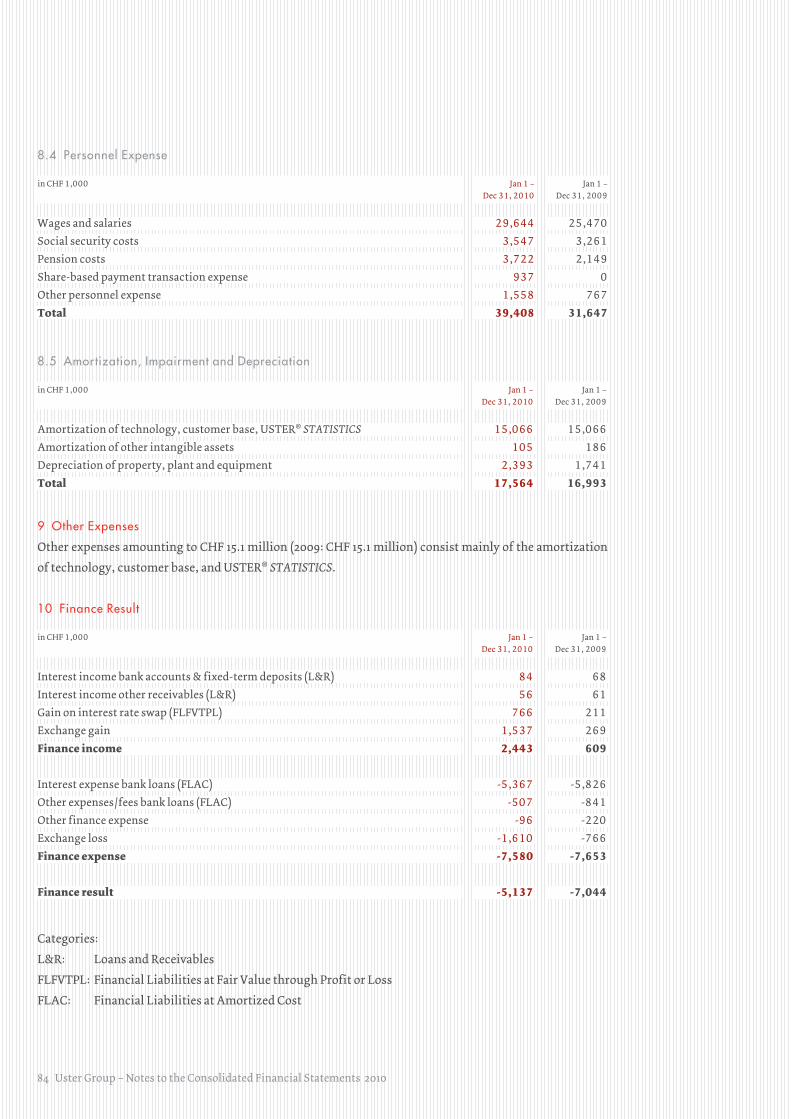
84 Uster Group – Notes to the Consolidated Financial Statements 2010
8.4 Personnel Expense
in CHF 1,000 Jan 1 –
Dec 31, 2010
Jan 1 –
Dec 31, 2009
Wages and salaries 29,644 25,470
Social security costs 3,547 3,261
Pension costs 3,722 2,149
Share-based payment transaction expense 937 0
Other personnel expense 1,558 767
Total 39,408 31,647
8.5 Amortization, Impairment and Depreciation
in CHF 1,000 Jan 1 –
Dec 31, 2010
Jan 1 –
Dec 31, 2009
Amortization of technology, customer base, USTER® STATISTICS 15,066 15,066
Amortization of other intangible assets 105 186
Depreciation of property, plant and equipment 2,393 1,741
Total 17,564 16,993
9 Other Expenses
Other expenses amounting to CHF 15.1 million (2009: CHF 15.1 million) consist mainly of the amortization
of technology, customer base, and USTER® STATISTICS.
10 Finance Result
in CHF 1,000 Jan 1 –
Dec 31, 2010
Jan 1 –
Dec 31, 2009
Interest income bank accounts & fixed-term deposits (L&R) 84 68
Interest income other receivables (L&R) 56 61
Gain on interest rate swap (FLFVTPL) 766 211
Exchange gain 1,537 269
Finance income 2,443 609
Interest expense bank loans (FLAC) -5,367 -5,826
Other expenses / fees bank loans (FLAC) -507 -841
Other finance expense -96 -220
Exchange loss -1,610 -766
Finance expense -7,580 -7,653
Finance result -5,137 -7,044
Categories:
L&R: Loans and Receivables
FLFVTPL: Financial Liabilities at Fair Value through Profit or Loss
FLAC: Financial Liabilities at Amortized Cost
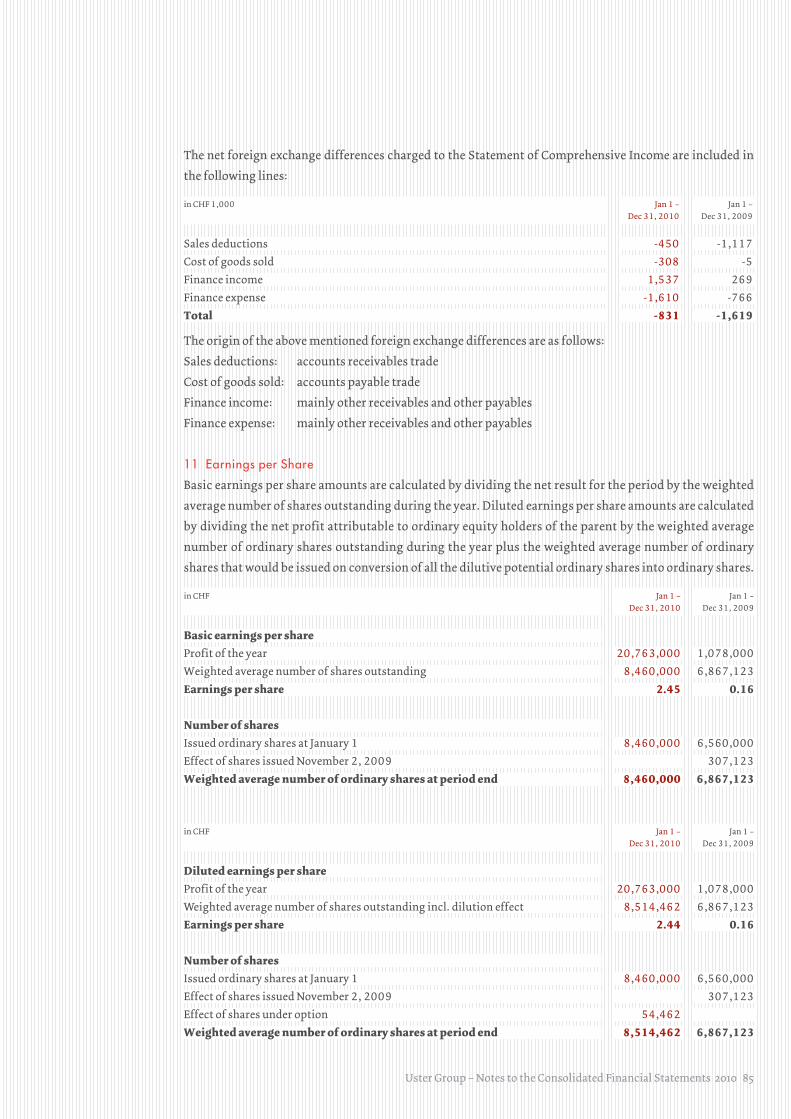
Uster Group – Notes to the Consolidated Financial Statements 2010 85
The net foreign exchange differences charged to the Statement of Comprehensive Income are included in
the following lines:
in CHF 1,000 Jan 1 –
Dec 31, 2010
Jan 1 –
Dec 31, 2009
Sales deductions -450 -1,117
Cost of goods sold -308 -5
Finance income 1,537 269
Finance expense -1,610 -766
Total -831 -1,619
The origin of the above mentioned foreign exchange differences are as follows:
Sales deductions: accounts receivables trade
Cost of goods sold: accounts payable trade
Finance income: mainly other receivables and other payables
Finance expense: mainly other receivables and other payables
11 Earnings per Share
Basic earnings per share amounts are calculated by dividing the net result for the period by the weighted
average number of shares outstanding during the year. Diluted earnings per share amounts are calculated
by dividing the net profit attributable to ordinary equity holders of the parent by the weighted average
number of ordinary shares outstanding during the year plus the weighted average number of ordinary
shares that would be issued on conversion of all the dilutive potential ordinary shares into ordinary shares.
in CHF Jan 1 –
Dec 31, 2010
Jan 1 –
Dec 31, 2009
Basic earnings per shareProfit of the year 20,763,000 1,078,000
Weighted average number of shares outstanding 8,460,000 6,867,123
Earnings per share 2.45 0.16
Number of sharesIssued ordinary shares at January 1 8,460,000 6,560,000
Effect of shares issued November 2, 2009 307,123
Weighted average number of ordinary shares at period end 8,460,000 6,867,123
in CHF Jan 1 –
Dec 31, 2010
Jan 1 –
Dec 31, 2009
Diluted earnings per shareProfit of the year 20,763,000 1,078,000
Weighted average number of shares outstanding incl. dilution effect 8,514,462 6,867,123
Earnings per share 2.44 0.16
Number of sharesIssued ordinary shares at January 1 8,460,000 6,560,000
Effect of shares issued November 2, 2009 307,123
Effect of shares under option 54,462
Weighted average number of ordinary shares at period end 8,514,462 6,867,123
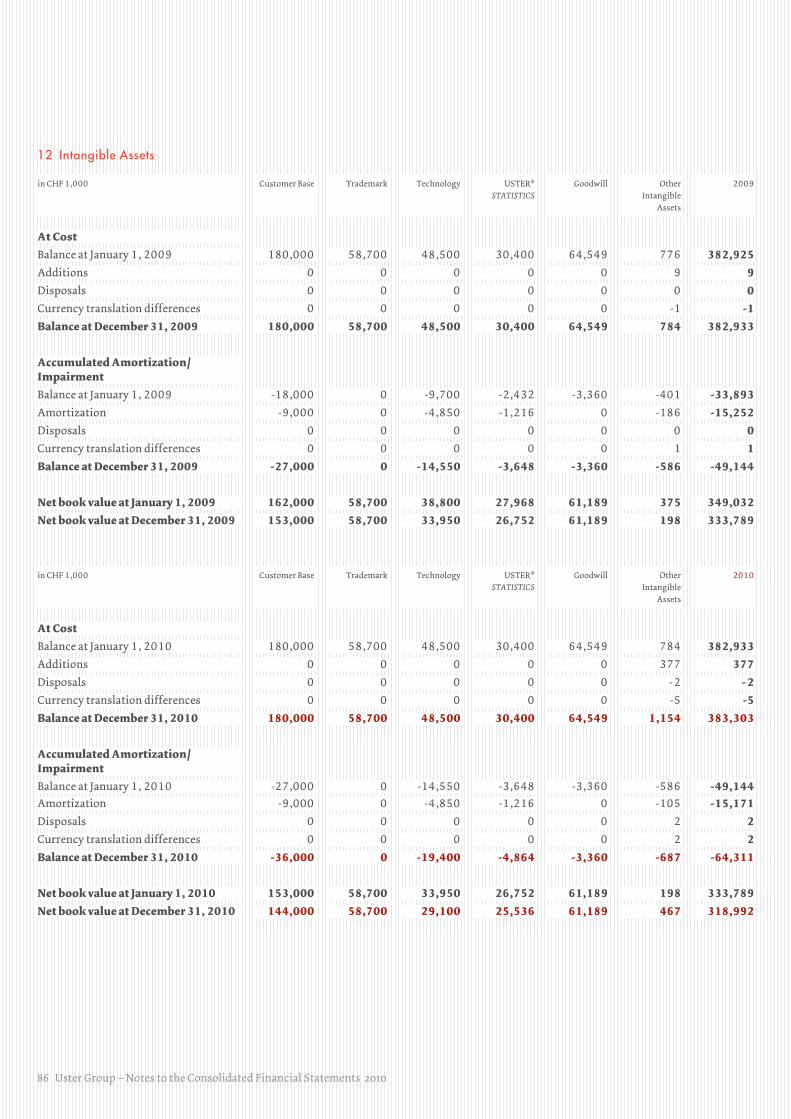
86 Uster Group – Notes to the Consolidated Financial Statements 2010
12 Intangible Assets
in CHF 1,000 Customer Base Trademark Technology USTER®
STATISTICSGoodwill Other
Intangible
Assets
2009
At CostBalance at January 1, 2009 180,000 58,700 48,500 30,400 64,549 776 382,925Additions 0 0 0 0 0 9 9Disposals 0 0 0 0 0 0 0Currency translation differences 0 0 0 0 0 -1 -1Balance at December 31, 2009 180,000 58,700 48,500 30,400 64,549 784 382,933
Accumulated Amortization / ImpairmentBalance at January 1, 2009 -18,000 0 -9,700 -2,432 -3,360 -401 -33,893Amortization -9,000 0 -4,850 -1,216 0 -186 -15,252Disposals 0 0 0 0 0 0 0Currency translation differences 0 0 0 0 0 1 1Balance at December 31, 2009 -27,000 0 -14,550 -3,648 -3,360 -586 -49,144
Net book value at January 1, 2009 162,000 58,700 38,800 27,968 61,189 375 349,032Net book value at December 31, 2009 153,000 58,700 33,950 26,752 61,189 198 333,789
in CHF 1,000 Customer Base Trademark Technology USTER®
STATISTICSGoodwill Other
Intangible
Assets
2010
At CostBalance at January 1, 2010 180,000 58,700 48,500 30,400 64,549 784 382,933Additions 0 0 0 0 0 377 377Disposals 0 0 0 0 0 - 2 - 2Currency translation differences 0 0 0 0 0 -5 -5Balance at December 31, 2010 180,000 58,700 48,500 30,400 64,549 1,154 383,303
Accumulated Amortization / ImpairmentBalance at January 1, 2010 -27,000 0 -14,550 -3,648 -3,360 -586 -49,144Amortization -9,000 0 -4,850 -1,216 0 -105 -15,171Disposals 0 0 0 0 0 2 2Currency translation differences 0 0 0 0 0 2 2Balance at December 31, 2010 -36,000 0 -19,400 -4,864 -3,360 -687 -64,311
Net book value at January 1, 2010 153,000 58,700 33,950 26,752 61,189 198 333,789Net book value at December 31, 2010 144,000 58,700 29,100 25,536 61,189 467 318,992

Uster Group – Notes to the Consolidated Financial Statements 2010 87
Customer Base
The intangible asset “customer base” represents the estimated value of the customers of the Uster Group.
Uster enjoys a strong customer loyalty and appreciation in approximately 75 countries. Technical training,
product performance, trusted measurement and long living products as well as after-sales services produce
high customer retention and loyalty. Its useful life of 20 years (remaining amortization period 16 years)
was reviewed during the fourth quarter of 2010 and was confirmed.
Trademark
Uster products are used as standard references for quality control in the global textile industry. USTER®
STATISTICS are used throughout the industry as the base benchmarks for the trading of textile products at
assured levels of quality across global markets. The USTER® STATISTICS are perceived as industry standard
all over the world.
The USTERIZED® concept (as seal of quality for yarns tested and cleared with USTER® products) is increas-
ingly used by well-known consumer companies to assure a consistent level of quality in support of their own
branded products.
Due to the brand awareness and the excellent reputation of the brand “USTER®”, this intangible asset is
considered to have an indefinite useful life.
Technology
The intangible asset technology summarizes the estimated value of the intellectual property of the Group, i. e.
patents and designs which are registered in the name of Uster Technologies Ltd, Switzerland. These intellectual
property rights refer to all the different processes, instruments and machines which have been developed by
the Group through the course of the years. A welldefined policy protects the intellectual property in the markets
relevant to the business. The Technologies useful life of 10 years (remaining amortization period 6 years) was
reviewed during the fourth quarter of 2010 and was confirmed.
USTER® STATISTICS
Uster provides a service to the textile industry by collecting data from thousands of samples of fiber and yarn
from its customers around the world. The Company produces a database, USTER® STATISTICS, of performance
data against the historic population of quality metrics and makes the results freely available to the industry.
USTER® STATISTICS was established in 1957 and looks back on more than 50 years of fiber and yarn quality
measurement. It is perceived as industry standard all over the world. The USTER® STATISTICS’ useful life of
25 years (remaining amortization period 21 years) was reviewed during the fourth quarter of 2010 and was
confirmed.
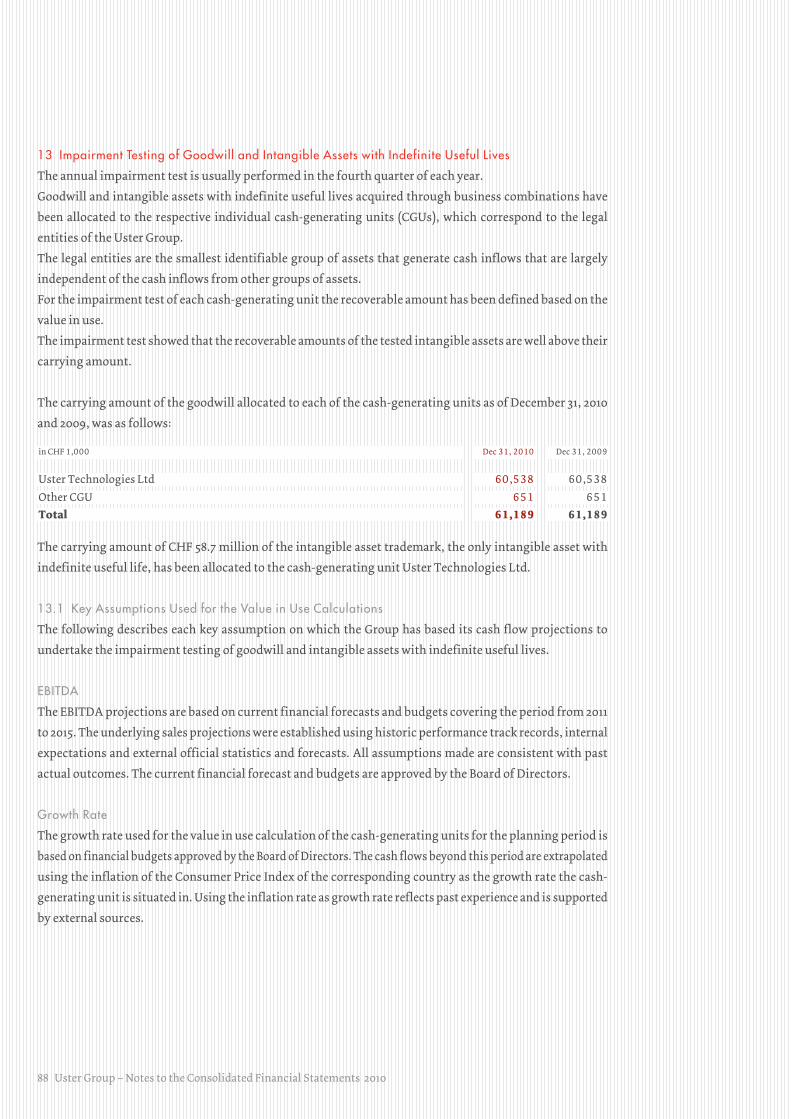
88 Uster Group – Notes to the Consolidated Financial Statements 2010
13 Impairment Testing of Goodwill and Intangible Assets with Indefinite Useful Lives
The annual impairment test is usually performed in the fourth quarter of each year.
Goodwill and intangible assets with indefinite useful lives acquired through business combinations have
been allocated to the respective individual cash-generating units (CGUs), which correspond to the legal
entities of the Uster Group.
The legal entities are the smallest identifiable group of assets that generate cash inflows that are largely
independent of the cash inflows from other groups of assets.
For the impairment test of each cash-generating unit the recoverable amount has been defined based on the
value in use.
The impairment test showed that the recoverable amounts of the tested intangible assets are well above their
carrying amount.
The carrying amount of the goodwill allocated to each of the cash-generating units as of December 31, 2010
and 2009, was as follows:
in CHF 1,000 Dec 31, 2010 Dec 31, 2009
Uster Technologies Ltd 60,538 60,538
Other CGU 651 651
Total 61,189 61,189
The carrying amount of CHF 58.7 million of the intangible asset trademark, the only intangible asset with
indefinite useful life, has been allocated to the cash-generating unit Uster Technologies Ltd.
13.1 Key Assumptions Used for the Value in Use Calculations
The following describes each key assumption on which the Group has based its cash flow projections to
undertake the impairment testing of goodwill and intangible assets with indefinite useful lives.
EBITDA
The EBITDA projections are based on current financial forecasts and budgets covering the period from 2011
to 2015. The underlying sales projections were established using historic performance track records, internal
expectations and external official statistics and forecasts. All assumptions made are consistent with past
actual outcomes. The current financial forecast and budgets are approved by the Board of Directors.
Growth Rate
The growth rate used for the value in use calculation of the cash-generating units for the planning period is
based on financial budgets approved by the Board of Directors. The cash flows beyond this period are extrapolated
using the inflation of the Consumer Price Index of the corresponding country as the growth rate the cash-
generating unit is situated in. Using the inflation rate as growth rate reflects past experience and is supported
by external sources.
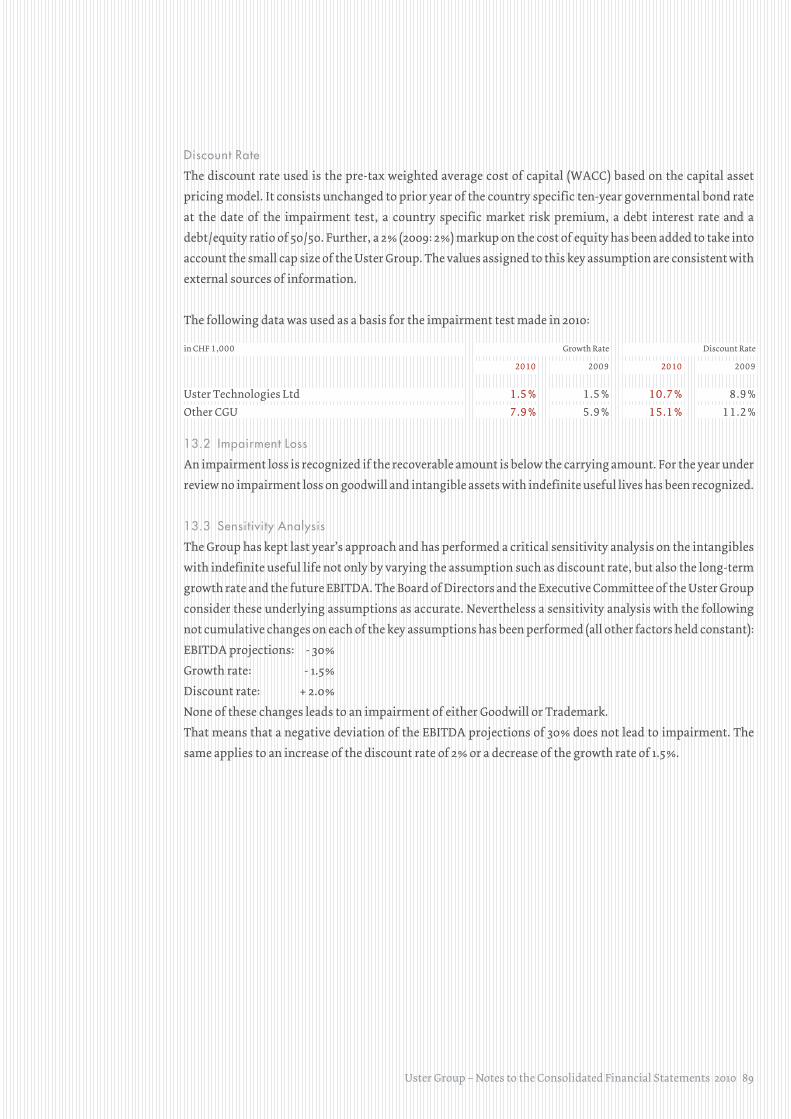
Uster Group – Notes to the Consolidated Financial Statements 2010 89
Discount Rate
The discount rate used is the pre-tax weighted average cost of capital (WACC) based on the capital asset
pricing model. It consists unchanged to prior year of the country specific ten-year governmental bond rate
at the date of the impairment test, a country specific market risk premium, a debt interest rate and a
debt / equity ratio of 50 / 50. Further, a 2 % (2009: 2 %) markup on the cost of equity has been added to take into
account the small cap size of the Uster Group. The values assigned to this key assumption are consistent with
external sources of information.
The following data was used as a basis for the impairment test made in 2010:
in CHF 1,000 Growth Rate Discount Rate
2010 2009 2010 2009
Uster Technologies Ltd 1.5 % 1.5 % 10.7 % 8.9 %
Other CGU 7.9 % 5.9 % 15.1 % 11.2 %
13.2 Impairment Loss
An impairment loss is recognized if the recoverable amount is below the carrying amount. For the year under
review no impairment loss on goodwill and intangible assets with indefinite useful lives has been recognized.
13.3 Sensitivity Analysis
The Group has kept last year’s approach and has performed a critical sensitivity analysis on the intangibles
with indefinite useful life not only by varying the assumption such as discount rate, but also the long-term
growth rate and the future EBITDA. The Board of Directors and the Executive Committee of the Uster Group
consider these underlying assumptions as accurate. Nevertheless a sensitivity analysis with the following
not cumulative changes on each of the key assumptions has been performed (all other factors held constant):
EBITDA projections: - 30 %
Growth rate: - 1.5 %
Discount rate: + 2.0 %
None of these changes leads to an impairment of either Goodwill or Trademark.
That means that a negative deviation of the EBITDA projections of 30 % does not lead to impairment. The
same applies to an increase of the discount rate of 2 % or a decrease of the growth rate of 1.5 %.

90 Uster Group – Notes to the Consolidated Financial Statements 2010
14 Property, Plant and Equipment
in CHF 1,000 Land and
Buildings
Machinery and
Equipment
Furniture and
Fixtures
2009
At CostBalance at January 1, 2009 2,968 4,817 4,277 12,062Additions 0 2,954 365 3,319Disposals 0 -192 -349 -541Currency translation differences -75 -40 -14 -129Balance at December 31, 2009 2,893 7,539 4,279 14,711
Accumulated Depreciation / ImpairmentBalance at January 1, 2009 -301 -1,695 -1,827 -3,823Depreciation -155 -737 -849 -1,741Disposals 0 101 346 447Currency translation differences 15 31 20 66Balance at December 31, 2009 -441 -2,300 -2,310 -5,051
Net book value at January 1, 2009 2,667 3,122 2,450 8,239Net book value at December 31, 2009 2,452 5,239 1,969 9,660
Fire insurance values 5,325 17,181 8,356 30,862
in CHF 1,000 Land and
Buildings
Machinery and
Equipment
Furniture and
Fixtures
2010
At CostBalance at January 1, 2010 2,893 7,539 4,279 14,711Additions 40 2,135 1,233 3,408Disposals -4 -85 -139 -228Currency translation differences -268 -171 -172 -611Balance at December 31, 2010 2,661 9,418 5,201 17,280
Accumulated Depreciation/ImpairmentBalance at January 1, 2010 -441 -2,300 -2,310 -5,051Depreciation -149 -1,303 -941 -2,393Disposals 2 56 101 159Currency translation differences 56 115 97 268Balance at December 31, 2010 -532 -3,432 -3,053 -7,017
Net book value at January 1, 2010 2,452 5,239 1,969 9,660Net book value at December 31, 2010 2,129 5,986 2,148 10,263
Fire insurance values 7,183 17,209 10,062 34,454
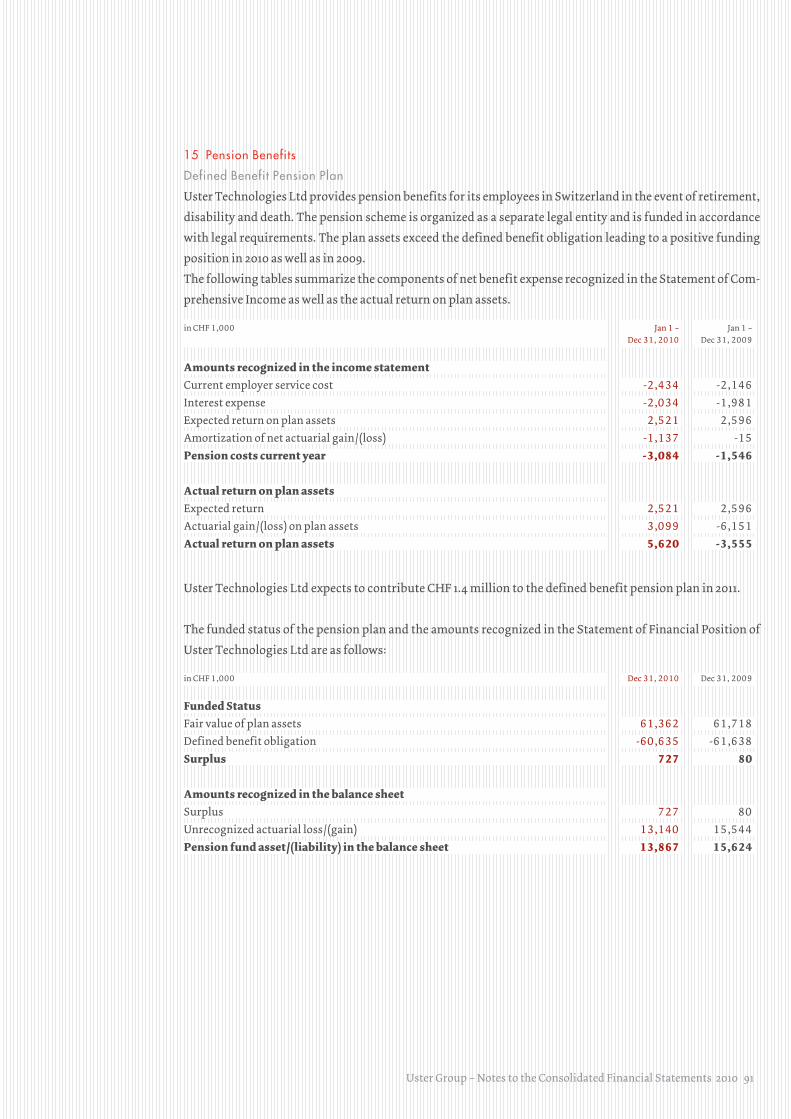
Uster Group – Notes to the Consolidated Financial Statements 2010 91
15 Pension Benefits
Defined Benefit Pension Plan
Uster Technologies Ltd provides pension benefits for its employees in Switzerland in the event of retirement,
disability and death. The pension scheme is organized as a separate legal entity and is funded in accordance
with legal requirements. The plan assets exceed the defined benefit obligation leading to a positive funding
position in 2010 as well as in 2009.
The following tables summarize the components of net benefit expense recognized in the Statement of Com-
prehensive Income as well as the actual return on plan assets.
in CHF 1,000 Jan 1 –
Dec 31, 2010
Jan 1 –
Dec 31, 2009
Amounts recognized in the income statementCurrent employer service cost -2,434 -2,146
Interest expense -2,034 -1,981
Expected return on plan assets 2,521 2,596
Amortization of net actuarial gain / (loss) -1,137 -15
Pension costs current year -3,084 -1,546
Actual return on plan assetsExpected return 2,521 2,596
Actuarial gain / (loss) on plan assets 3,099 -6,151
Actual return on plan assets 5,620 -3,555
Uster Technologies Ltd expects to contribute CHF 1.4 million to the defined benefit pension plan in 2011.
The funded status of the pension plan and the amounts recognized in the Statement of Financial Position of
Uster Technologies Ltd are as follows:
in CHF 1,000 Dec 31, 2010 Dec 31, 2009
Funded StatusFair value of plan assets 61,362 61,718
Defined benefit obligation -60,635 -61,638
Surplus 727 80
Amounts recognized in the balance sheetSurplus 727 80
Unrecognized actuarial loss / (gain) 13,140 15,544
Pension fund asset / (liability) in the balance sheet 13,867 15,624

92 Uster Group – Notes to the Consolidated Financial Statements 2010
The changes in the present value of the defined benefit obligation are as follows:
in CHF 1,000 Dec 31, 2010 Dec 31, 2009
Reconciliation of defined benefit obligationDefined benefit obligation at January 1 61,637 63,802
Current employer service cost 2,434 2,146
Interest expense 2,034 1,981
Employee contribution 1,136 1,175
Benefit payments / net inflow -8,440 -762
Plan settlement 0 -8,762
Actuarial (gain) / loss 1,834 2,057
Defined benefit obligation at December 31 60,635 61,637
The changes in the fair value of the plan assets are as follows:
in CHF 1,000 Dec 31, 2010 Dec 31, 2009
Reconciliation of assetsAssets at January 1 61,718 72,245
Expected return 2,521 2,596
Employer contribution 1,328 1,377
Employee contribution 1,136 1,175
Benefit payments / net inflow -8,440 -762
Plan settlement 0 -8,762
Actuarial gain / (loss) on plan assets 3,099 -6,151
Assets at December 31 61,362 61,718
The strategic target of major categories of plan assets as a percentage of the fair value of total plan assets are
as follows:
Dec 31, 2010 Dec 31, 2009
Asset categoriesEquity securities 25 % 28 %Debt securities 33 % 33 %Property 26 % 26 %Other 16 % 13 %
The overall expected rate of return is determined based on the plan’s asset allocation strategy and current
market rates.
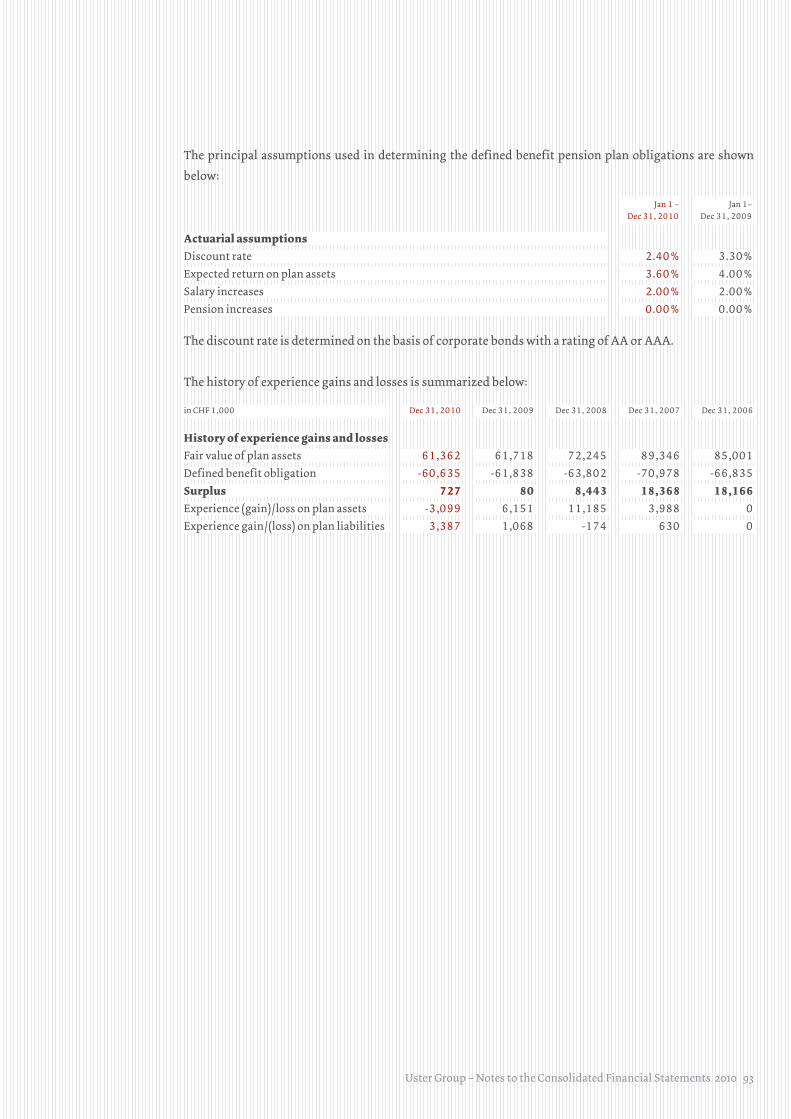
Uster Group – Notes to the Consolidated Financial Statements 2010 93
The principal assumptions used in determining the defined benefit pension plan obligations are shown
below:
Jan 1 –
Dec 31, 2010
Jan 1–
Dec 31, 2009
Actuarial assumptionsDiscount rate 2.40 % 3.30 %Expected return on plan assets 3.60 % 4.00 %Salary increases 2.00 % 2.00 %Pension increases 0.00 % 0.00 %
The discount rate is determined on the basis of corporate bonds with a rating of AA or AAA.
The history of experience gains and losses is summarized below:
in CHF 1,000 Dec 31, 2010 Dec 31, 2009 Dec 31, 2008 Dec 31, 2007 Dec 31, 2006
History of experience gains and lossesFair value of plan assets 61,362 61,718 72,245 89,346 85,001
Defined benefit obligation -60,635 -61,838 -63,802 -70,978 -66,835
Surplus 727 80 8,443 18,368 18,166Experience (gain) / loss on plan assets -3,099 6,151 11,185 3,988 0
Experience gain / (loss) on plan liabilities 3,387 1,068 -174 630 0

94 Uster Group – Notes to the Consolidated Financial Statements 2010
16 Income Tax
Statement of Comprehensive Income
in CHF 1,000 Jan 1 –
Dec 31, 2010
Jan 1 –
Dec 31, 2009
Current income taxes -4,591 -3,078
Current income taxes previous years 3,240 -4,276
Deferred income taxes 7,820 8,019
Total 6,469 665
The current income tax from previous years results mainly from the retroactive change of the income tax
structure in Switzerland and from the finalization of the tax audit relating to the fiscal years 2007 to 2009
which led to the release of a tax risk provision.
A reconciliation of the expected tax expense based on the parent company’s tax rate to the effective tax
expense is as follows:
in CHF 1,000 Jan 1 –
Dec 31, 2010
Jan 1 –
Dec 31, 2009
Earnings before tax 14,294 413 Tax at expected tax rate of the parent company -2,430 -17.0 % -81 -19.5 %Effects from different tax rates in the Group’s different
jurisdictions 147 1.0 % -287 -69.6 %
Tax effect of non-deductible or non-taxable items -448 -3.1 % -176 -42.6 %Impact of tax rate changes on temporary differences 6,416 44.9 % 5,887 1,425.4 %Unrecognized tax losses 22 0.2 % -341 -82.6 %Non-recoverable withholding tax -14 -0.1 % -22 -5.3 %Current income taxes previous years 3,240 22.6 % -4,276 -1,035.5 %Others -464 -3.3 % -39 -9.5 %Total 6,469 45.2 % 665 160.8 %
The difference between the expected tax rates 2010 and 2009 is due to the change of the income tax
structure in Switzerland.
The following table shows the deferred income tax related to items charged or credited directly to equity:
in CHF 1,000 Dec 31, 2010 Dec 31, 2009
Tax effect of costs related to the issue of share capital 0 273
Total 0 273
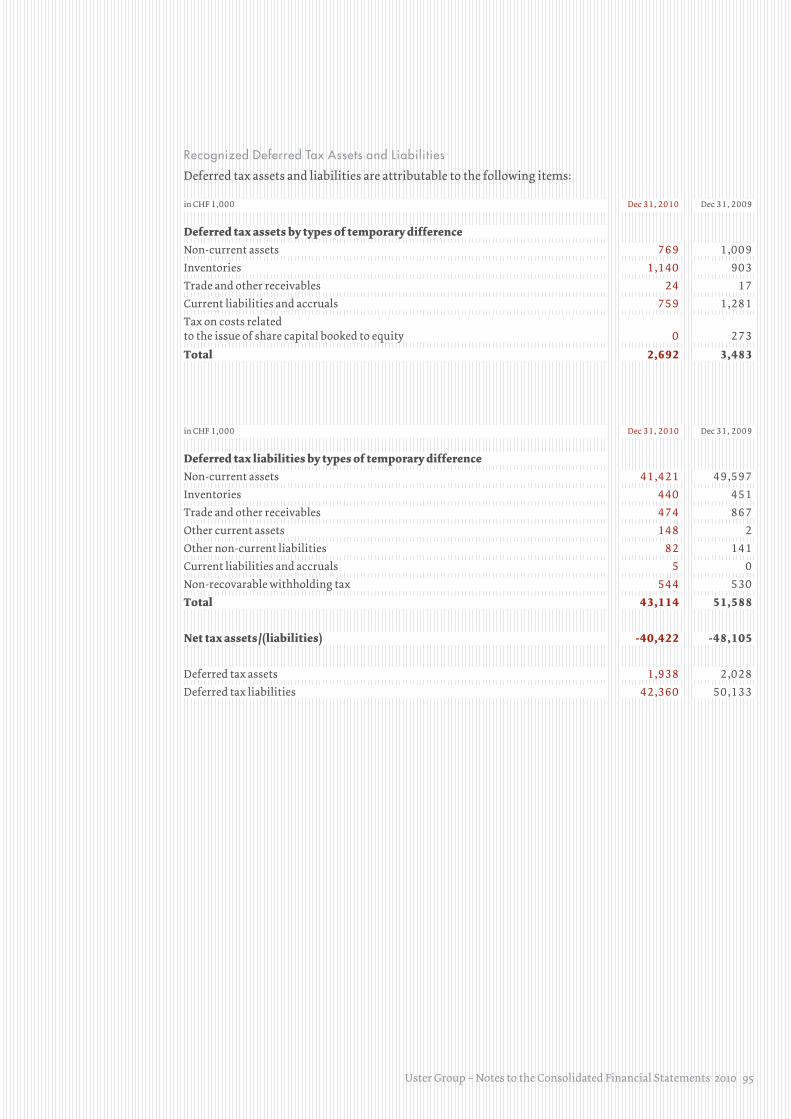
Uster Group – Notes to the Consolidated Financial Statements 2010 95
Recognized Deferred Tax Assets and Liabilities
Deferred tax assets and liabilities are attributable to the following items:
in CHF 1,000 Dec 31, 2010 Dec 31, 2009
Deferred tax assets by types of temporary differenceNon-current assets 769 1,009
Inventories 1,140 903
Trade and other receivables 24 17
Current liabilities and accruals 759 1,281
Tax on costs related
to the issue of share capital booked to equity 0 273
Total 2,692 3,483
in CHF 1,000 Dec 31, 2010 Dec 31, 2009
Deferred tax liabilities by types of temporary differenceNon-current assets 41,421 49,597
Inventories 440 451
Trade and other receivables 474 867
Other current assets 148 2
Other non-current liabilities 82 141
Current liabilities and accruals 5 0
Non-recovarable withholding tax 544 530
Total 43,114 51,588
Net tax assets / (liabilities) -40,422 -48,105
Deferred tax assets 1,938 2,028
Deferred tax liabilities 42,360 50,133
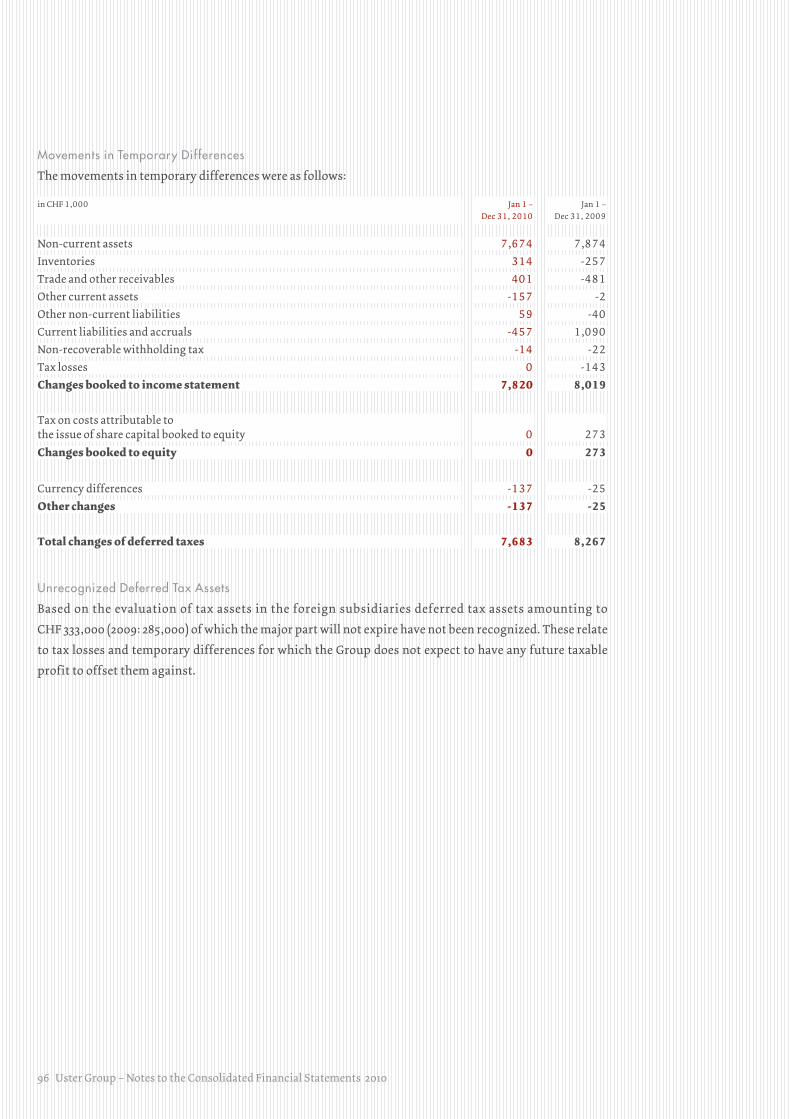
96 Uster Group – Notes to the Consolidated Financial Statements 2010
Movements in Temporary Differences
The movements in temporary differences were as follows:
in CHF 1,000 Jan 1 –
Dec 31, 2010
Jan 1 –
Dec 31, 2009
Non-current assets 7,674 7,874
Inventories 314 -257
Trade and other receivables 401 -481
Other current assets -157 -2
Other non-current liabilities 59 -40
Current liabilities and accruals -457 1,090
Non-recoverable withholding tax -14 -22
Tax losses 0 -143
Changes booked to income statement 7,820 8,019
Tax on costs attributable to
the issue of share capital booked to equity 0 273
Changes booked to equity 0 273
Currency differences -137 -25
Other changes -137 -25
Total changes of deferred taxes 7,683 8,267
Unrecognized Deferred Tax Assets
Based on the evaluation of tax assets in the foreign subsidiaries deferred tax assets amounting to
CHF 333,000 (2009: 285,000) of which the major part will not expire have not been recognized. These relate
to tax losses and temporary differences for which the Group does not expect to have any future taxable
profit to offset them against.

Uster Group – Notes to the Consolidated Financial Statements 2010 97
17 Inventories
in CHF 1,000 Dec 31, 2010 Dec 31, 2009
Raw materials and supplies 2,327 4,161
Semifinished and finished goods 9,011 5,680
Work in progress 1,035 610
Total 12,373 10,451
The amount of write-down of inventories recognized as an expense in profit or loss in 2010 amounted
to CHF 1.2 million (2009: CHF 0.4 million) and is included in cost of goods sold. The total amount of
inventories valued at fair value less cost to sell amounts to CHF 0.0 million (2009: CHF 0.0 million).
18 Receivables Trade
in CHF 1,000 Dec 31, 2010 Dec 31, 2009
Accounts receivable trade 17,060 14,647
Bills receivable trade 832 461
Total 17,892 15,108
Accounts receivable trade as well as bills receivable trade are non-interest-bearing and are generally on 30
to 90 days’ terms.
The carrying amounts of trade and bills receivables less the allowance for uncollectible items are assumed
to approximate their fair values due to the short-term nature of trade receivables.
The carrying amount of the Group’s trade receivables are denominated in the following currencies:
in CHF 1,000 Dec 31, 2010 Dec 31, 2009
CHF 15,445 11,534
USD 1,183 1,391
CNY 880 771
TRY 137 152
JPY 88 942
EUR 0 90
Other 159 228
Total 17,892 15,108
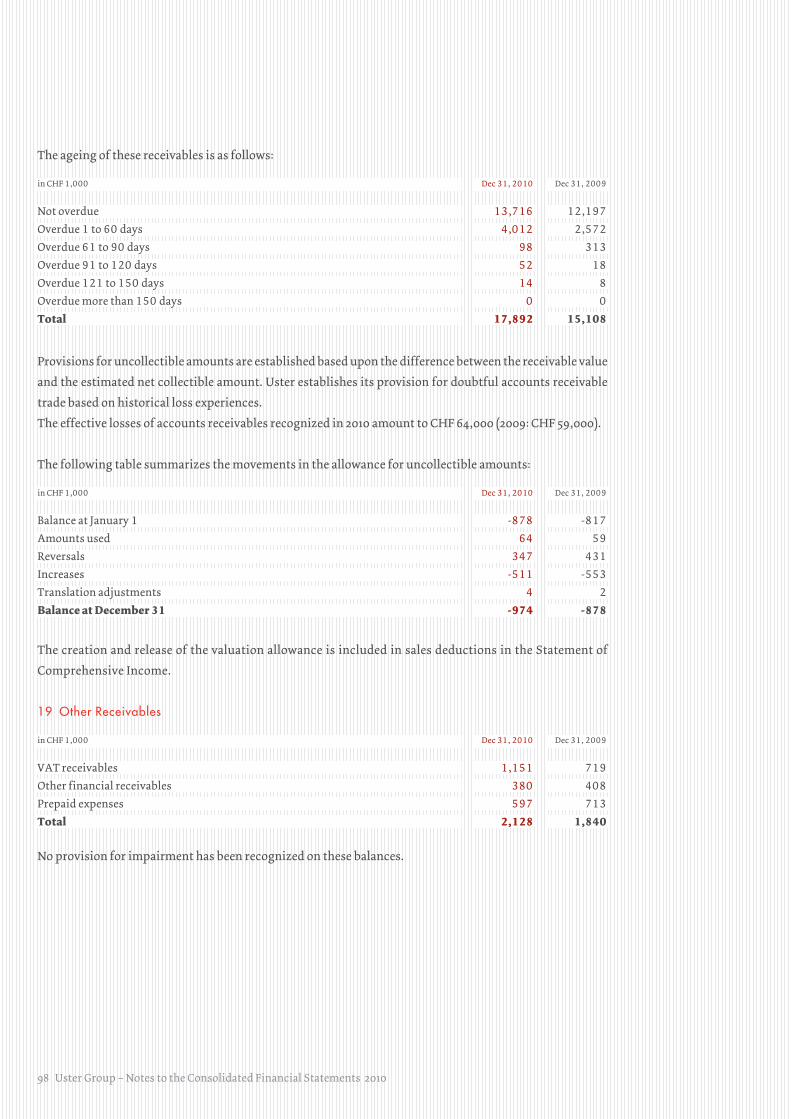
98 Uster Group – Notes to the Consolidated Financial Statements 2010
The ageing of these receivables is as follows:
in CHF 1,000 Dec 31, 2010 Dec 31, 2009
Not overdue 13,716 12,197
Overdue 1 to 60 days 4,012 2,572
Overdue 61 to 90 days 98 313
Overdue 91 to 120 days 52 18
Overdue 121 to 150 days 14 8
Overdue more than 150 days 0 0
Total 17,892 15,108
Provisions for uncollectible amounts are established based upon the difference between the receivable value
and the estimated net collectible amount. Uster establishes its provision for doubtful accounts receivable
trade based on historical loss experiences.
The effective losses of accounts receivables recognized in 2010 amount to CHF 64,000 (2009: CHF 59,000).
The following table summarizes the movements in the allowance for uncollectible amounts:
in CHF 1,000 Dec 31, 2010 Dec 31, 2009
Balance at January 1 -878 -817
Amounts used 64 59
Reversals 347 431
Increases -511 -553
Translation adjustments 4 2
Balance at December 31 -974 -878
The creation and release of the valuation allowance is included in sales deductions in the Statement of
Comprehensive Income.
19 Other Receivables
in CHF 1,000 Dec 31, 2010 Dec 31, 2009
VAT receivables 1,151 719
Other financial receivables 380 408
Prepaid expenses 597 713
Total 2,128 1,840
No provision for impairment has been recognized on these balances.
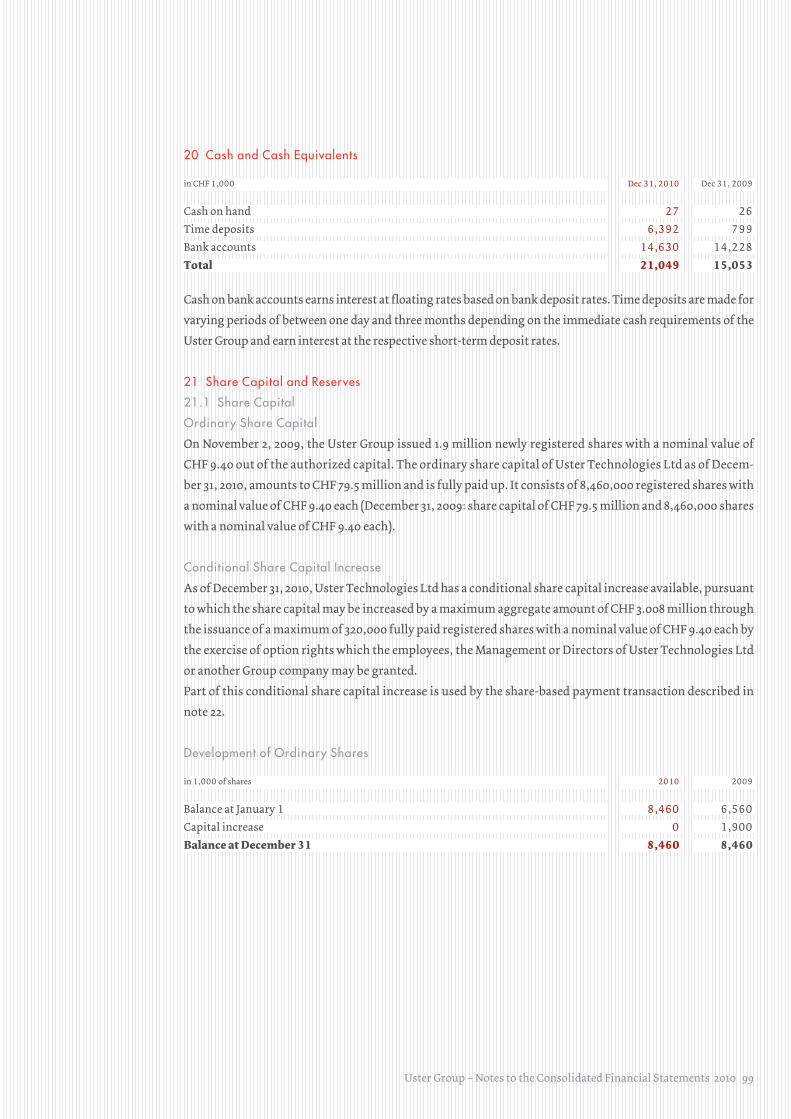
Uster Group – Notes to the Consolidated Financial Statements 2010 99
20 Cash and Cash Equivalents
in CHF 1,000 Dec 31, 2010 Dec 31, 2009
Cash on hand 27 26
Time deposits 6,392 799
Bank accounts 14,630 14,228
Total 21,049 15,053
Cash on bank accounts earns interest at floating rates based on bank deposit rates. Time deposits are made for
varying periods of between one day and three months depending on the immediate cash requirements of the
Uster Group and earn interest at the respective short-term deposit rates.
21 Share Capital and Reserves
21.1 Share Capital
Ordinary Share Capital
On November 2, 2009, the Uster Group issued 1.9 million newly registered shares with a nominal value of
CHF 9.40 out of the authorized capital. The ordinary share capital of Uster Technologies Ltd as of Decem-
ber 31, 2010, amounts to CHF 79.5 million and is fully paid up. It consists of 8,460,000 registered shares with
a nominal value of CHF 9.40 each (December 31, 2009: share capital of CHF 79.5 million and 8,460,000 shares
with a nominal value of CHF 9.40 each).
Conditional Share Capital Increase
As of December 31, 2010, Uster Technologies Ltd has a conditional share capital increase available, pursuant
to which the share capital may be increased by a maximum aggregate amount of CHF 3.008 million through
the issuance of a maximum of 320,000 fully paid registered shares with a nominal value of CHF 9.40 each by
the exercise of option rights which the employees, the Management or Directors of Uster Technologies Ltd
or another Group company may be granted.
Part of this conditional share capital increase is used by the share-based payment transaction described in
note 22.
Development of Ordinary Shares
in 1,000 of shares 2010 2009
Balance at January 1 8,460 6,560
Capital increase 0 1,900
Balance at December 31 8,460 8,460
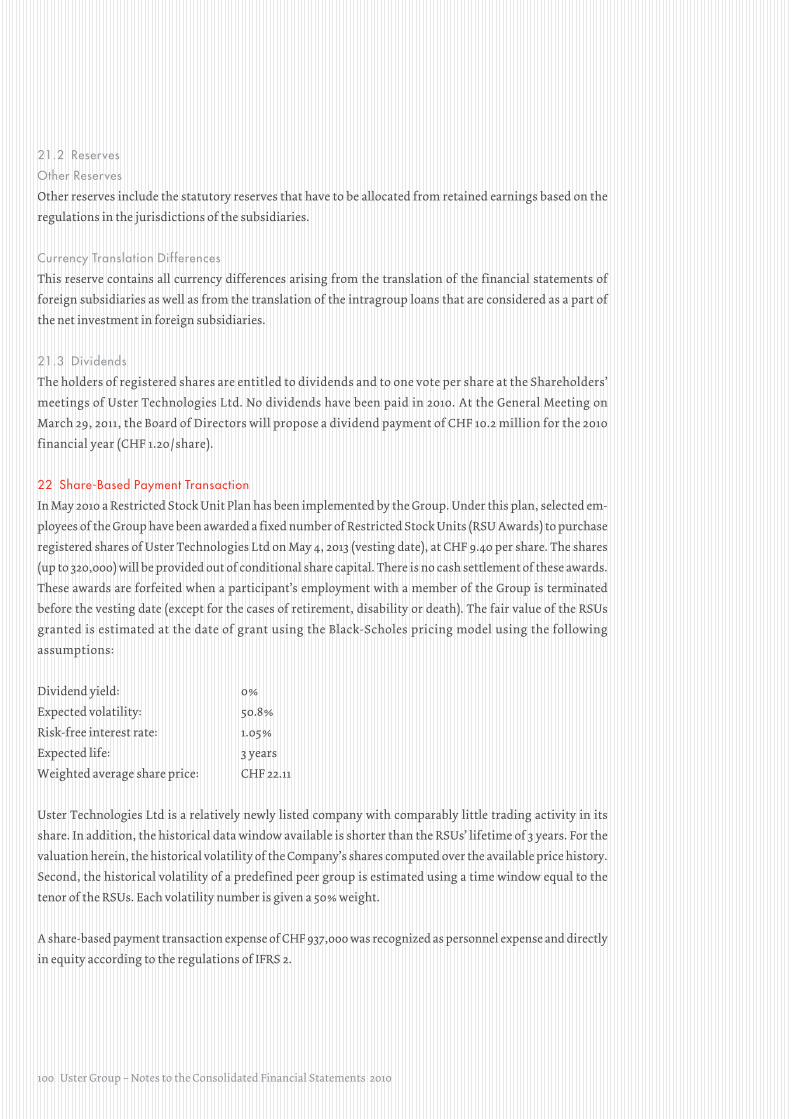
100 Uster Group – Notes to the Consolidated Financial Statements 2010
21.2 Reserves
Other Reserves
Other reserves include the statutory reserves that have to be allocated from retained earnings based on the
regulations in the jurisdictions of the subsidiaries.
Currency Translation Differences
This reserve contains all currency differences arising from the translation of the financial statements of
foreign subsidiaries as well as from the translation of the intragroup loans that are considered as a part of
the net investment in foreign subsidiaries.
21.3 Dividends
The holders of registered shares are entitled to dividends and to one vote per share at the Shareholders’
meetings of Uster Technologies Ltd. No dividends have been paid in 2010. At the General Meeting on
March 29, 2011, the Board of Directors will propose a dividend payment of CHF 10.2 million for the 2010
financial year (CHF 1.20 / share).
22 Share-Based Payment Transaction
In May 2010 a Restricted Stock Unit Plan has been implemented by the Group. Under this plan, selected em-
ployees of the Group have been awarded a fixed number of Restricted Stock Units (RSU Awards) to purchase
registered shares of Uster Technologies Ltd on May 4, 2013 (vesting date), at CHF 9.40 per share. The shares
(up to 320,000) will be provided out of conditional share capital. There is no cash settlement of these awards.
These awards are forfeited when a participant’s employment with a member of the Group is terminated
before the vesting date (except for the cases of retirement, disability or death). The fair value of the RSUs
granted is estimated at the date of grant using the Black-Scholes pricing model using the following
assumptions:
Dividend yield: 0 %
Expected volatility: 50.8 %
Risk-free interest rate: 1.05 %
Expected life: 3 years
Weighted average share price: CHF 22.11
Uster Technologies Ltd is a relatively newly listed company with comparably little trading activity in its
share. In addition, the historical data window available is shorter than the RSUs’ lifetime of 3 years. For the
valuation herein, the historical volatility of the Company’s shares computed over the available price history.
Second, the historical volatility of a predefined peer group is estimated using a time window equal to the
tenor of the RSUs. Each volatility number is given a 50 % weight.
A share-based payment transaction expense of CHF 937,000 was recognized as personnel expense and directly
in equity according to the regulations of IFRS 2.
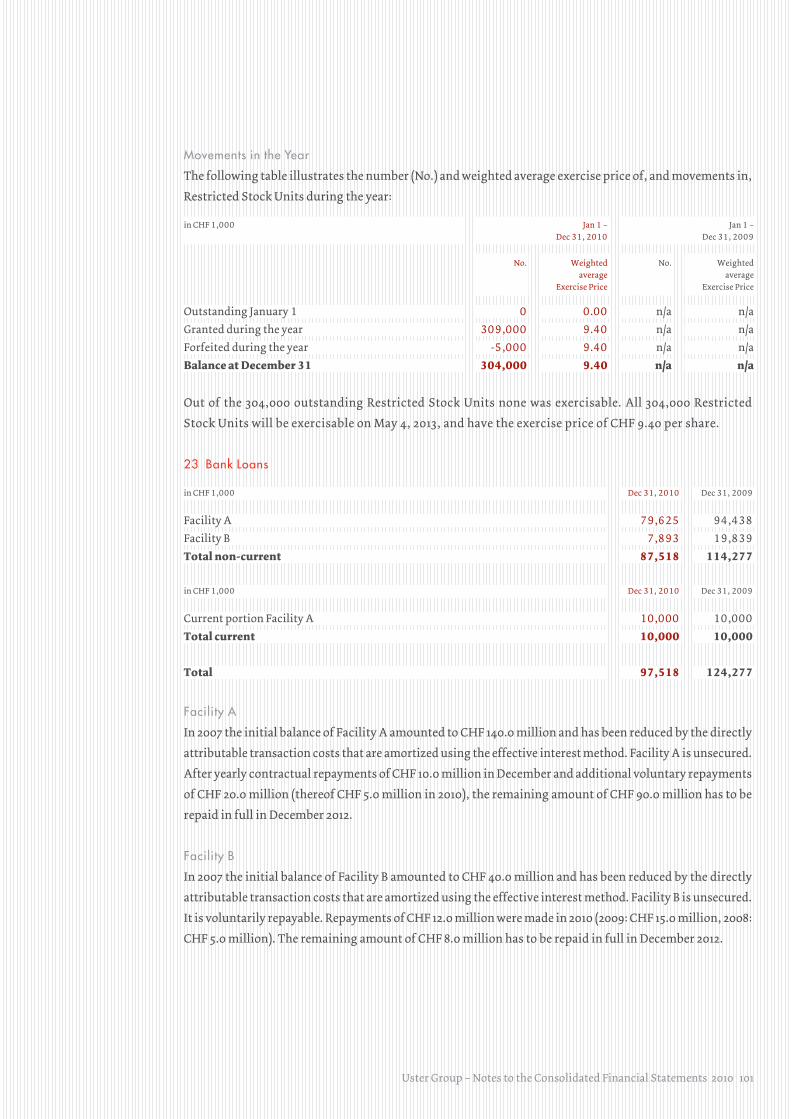
Uster Group – Notes to the Consolidated Financial Statements 2010 101
Movements in the Year
The following table illustrates the number (No.) and weighted average exercise price of, and movements in,
Restricted Stock Units during the year:
in CHF 1,000 Jan 1 –
Dec 31, 2010
Jan 1 –
Dec 31, 2009
No. Weighted
average
Exercise Price
No. Weighted
average
Exercise Price
Outstanding January 1 0 0.00 n/a n/a
Granted during the year 309,000 9.40 n/a n/a
Forfeited during the year -5,000 9.40 n/a n/a
Balance at December 31 304,000 9.40 n/a n/a
Out of the 304,000 outstanding Restricted Stock Units none was exercisable. All 304,000 Restricted
Stock Units will be exercisable on May 4, 2013, and have the exercise price of CHF 9.40 per share.
23 Bank Loans
in CHF 1,000 Dec 31, 2010 Dec 31, 2009
Facility A 79,625 94,438
Facility B 7,893 19,839
Total non-current 87,518 114,277
in CHF 1,000 Dec 31, 2010 Dec 31, 2009
Current portion Facility A 10,000 10,000
Total current 10,000 10,000
Total 97,518 124,277
Facility A
In 2007 the initial balance of Facility A amounted to CHF 140.0 million and has been reduced by the directly
attributable transaction costs that are amortized using the effective interest method. Facility A is unsecured.
After yearly contractual repayments of CHF 10.0 million in December and additional voluntary repayments
of CHF 20.0 million (thereof CHF 5.0 million in 2010), the remaining amount of CHF 90.0 million has to be
repaid in full in December 2012.
Facility B
In 2007 the initial balance of Facility B amounted to CHF 40.0 million and has been reduced by the directly
attributable transaction costs that are amortized using the effective interest method. Facility B is unsecured.
It is voluntarily repayable. Repayments of CHF 12.0 million were made in 2010 (2009: CHF 15.0 million, 2008:
CHF 5.0 million). The remaining amount of CHF 8.0 million has to be repaid in full in December 2012.
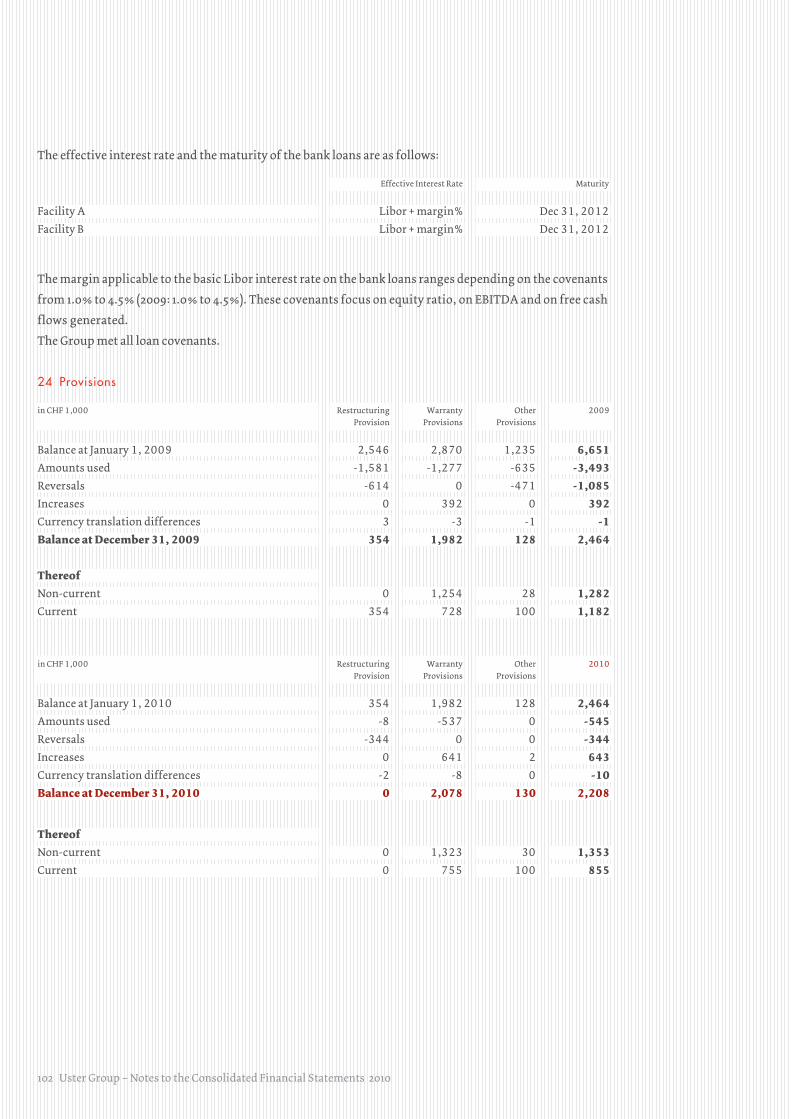
102 Uster Group – Notes to the Consolidated Financial Statements 2010
The effective interest rate and the maturity of the bank loans are as follows:
Effective Interest Rate Maturity
Facility A Libor + margin % Dec 31, 2012
Facility B Libor + margin % Dec 31, 2012
The margin applicable to the basic Libor interest rate on the bank loans ranges depending on the covenants
from 1.0 % to 4.5 % (2009: 1.0 % to 4.5 %). These covenants focus on equity ratio, on EBITDA and on free cash
flows generated.
The Group met all loan covenants.
24 Provisions
in CHF 1,000 Restructuring
Provision
Warranty
Provisions
Other
Provisions
2009
Balance at January 1, 2009 2,546 2,870 1,235 6,651Amounts used -1,581 -1,277 -635 -3,493Reversals -614 0 -471 -1,085Increases 0 392 0 392Currency translation differences 3 -3 -1 -1Balance at December 31, 2009 354 1,982 128 2,464
Thereof Non-current 0 1,254 28 1,282Current 354 728 100 1,182
in CHF 1,000 Restructuring
Provision
Warranty
Provisions
Other
Provisions
2010
Balance at January 1, 2010 354 1,982 128 2,464Amounts used -8 -537 0 -545Reversals -344 0 0 -344Increases 0 641 2 643Currency translation differences -2 -8 0 -10Balance at December 31, 2010 0 2,078 130 2,208
Thereof Non-current 0 1,323 30 1,353Current 0 755 100 855
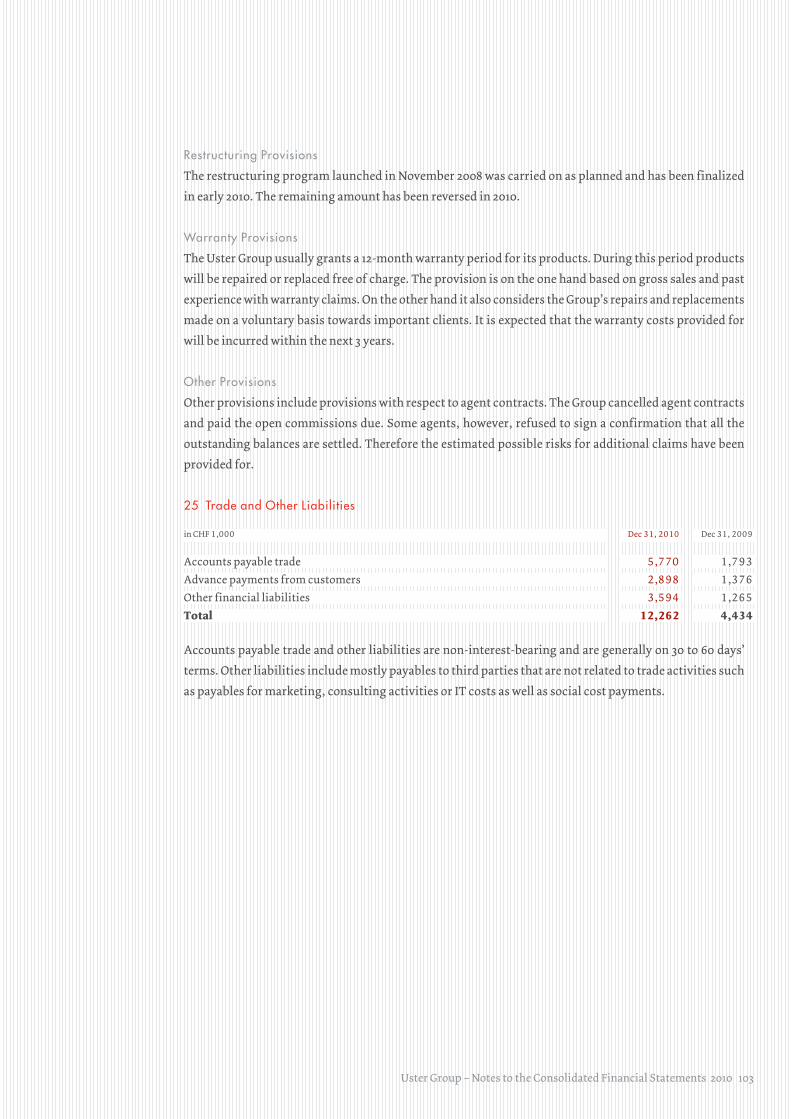
Uster Group – Notes to the Consolidated Financial Statements 2010 103
Restructuring Provisions
The restructuring program launched in November 2008 was carried on as planned and has been finalized
in early 2010. The remaining amount has been reversed in 2010.
Warranty Provisions
The Uster Group usually grants a 12-month warranty period for its products. During this period products
will be repaired or replaced free of charge. The provision is on the one hand based on gross sales and past
experience with warranty claims. On the other hand it also considers the Group’s repairs and replacements
made on a voluntary basis towards important clients. It is expected that the warranty costs provided for
will be incurred within the next 3 years.
Other Provisions
Other provisions include provisions with respect to agent contracts. The Group cancelled agent contracts
and paid the open commissions due. Some agents, however, refused to sign a confirmation that all the
outstanding balances are settled. Therefore the estimated possible risks for additional claims have been
provided for.
25 Trade and Other Liabilities
in CHF 1,000 Dec 31, 2010 Dec 31, 2009
Accounts payable trade 5,770 1,793
Advance payments from customers 2,898 1,376
Other financial liabilities 3,594 1,265
Total 12,262 4,434
Accounts payable trade and other liabilities are non-interest-bearing and are generally on 30 to 60 days’
terms. Other liabilities include mostly payables to third parties that are not related to trade activities such
as payables for marketing, consulting activities or IT costs as well as social cost payments.
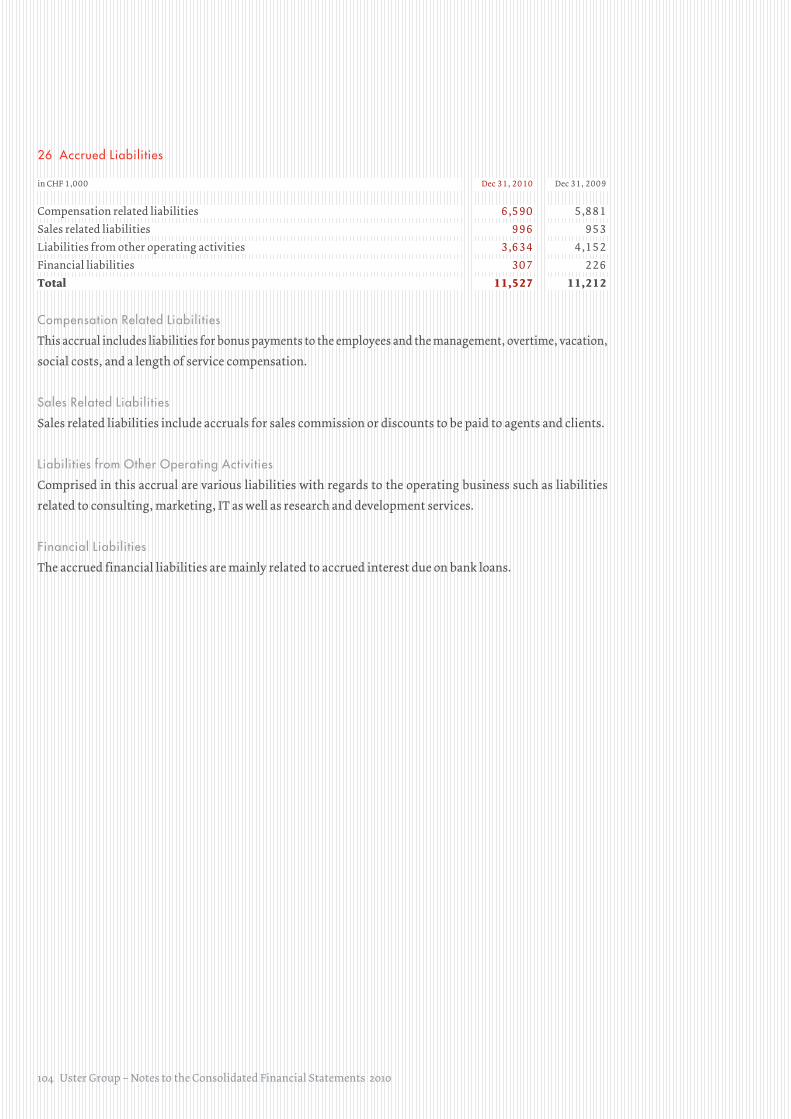
104 Uster Group – Notes to the Consolidated Financial Statements 2010
26 Accrued Liabilities
in CHF 1,000 Dec 31, 2010 Dec 31, 2009
Compensation related liabilities 6,590 5,881
Sales related liabilities 996 953
Liabilities from other operating activities 3,634 4,152
Financial liabilities 307 226
Total 11,527 11,212
Compensation Related Liabilities
This accrual includes liabilities for bonus payments to the employees and the management, overtime, vacation,
social costs, and a length of service compensation.
Sales Related Liabilities
Sales related liabilities include accruals for sales commission or discounts to be paid to agents and clients.
Liabilities from Other Operating Activities
Comprised in this accrual are various liabilities with regards to the operating business such as liabilities
related to consulting, marketing, IT as well as research and development services.
Financial Liabilities
The accrued financial liabilities are mainly related to accrued interest due on bank loans.
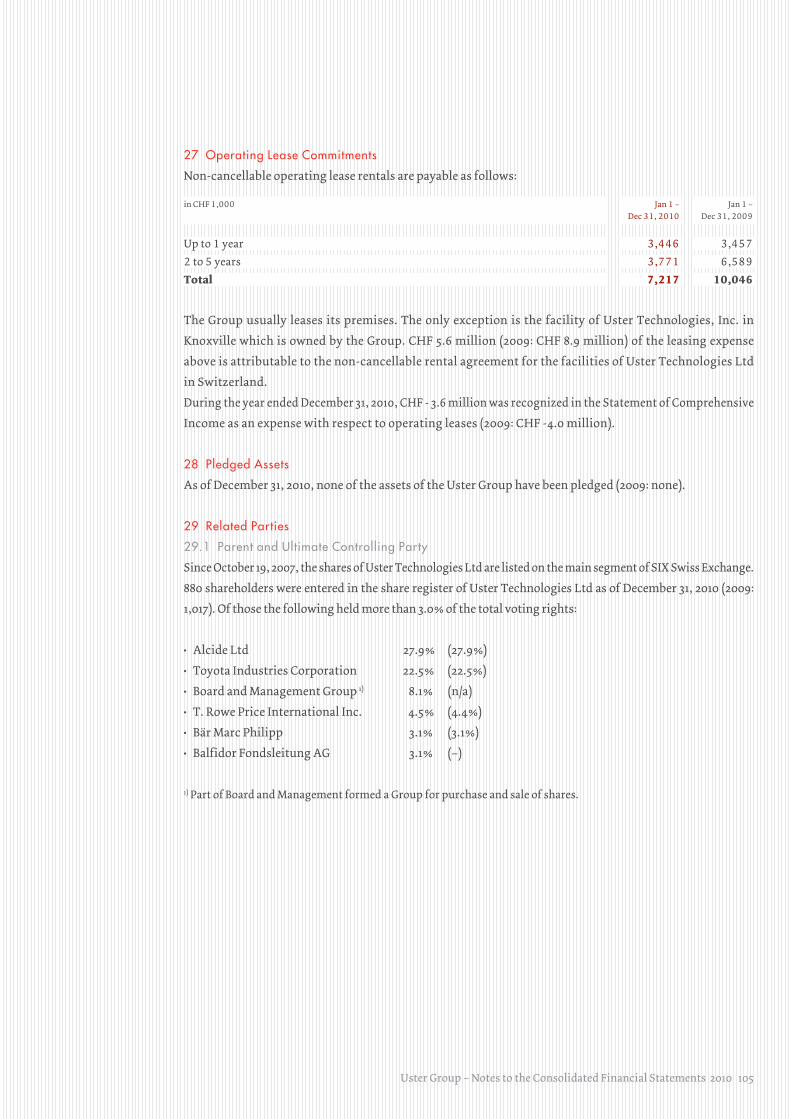
Uster Group – Notes to the Consolidated Financial Statements 2010 105
27 Operating Lease Commitments
Non-cancellable operating lease rentals are payable as follows:
in CHF 1,000 Jan 1 –
Dec 31, 2010
Jan 1 –
Dec 31, 2009
Up to 1 year 3,446 3,457
2 to 5 years 3,771 6,589
Total 7,217 10,046
The Group usually leases its premises. The only exception is the facility of Uster Technologies, Inc. in
Knoxville which is owned by the Group. CHF 5.6 million (2009: CHF 8.9 million) of the leasing expense
above is attributable to the non-cancellable rental agreement for the facilities of Uster Technologies Ltd
in Switzerland.
During the year ended December 31, 2010, CHF - 3.6 million was recognized in the Statement of Comprehensive
Income as an expense with respect to operating leases (2009: CHF -4.0 million).
28 Pledged Assets
As of December 31, 2010, none of the assets of the Uster Group have been pledged (2009: none).
29 Related Parties
29.1 Parent and Ultimate Controlling Party
Since October 19, 2007, the shares of Uster Technologies Ltd are listed on the main segment of SIX Swiss Exchange.
880 shareholders were entered in the share register of Uster Technologies Ltd as of December 31, 2010 (2009:
1,017). Of those the following held more than 3.0 % of the total voting rights:
• Alcide Ltd 27.9 % (27.9 %)
• Toyota Industries Corporation 22.5 % (22.5 %)
• Board and Management Group 1) 8.1 % (n/a)
• T. Rowe Price International Inc. 4.5 % (4.4 %)
• Bär Marc Philipp 3.1 % (3.1 %)
• Balfidor Fondsleitung AG 3.1 % (–)
1) Part of Board and Management formed a Group for purchase and sale of shares.
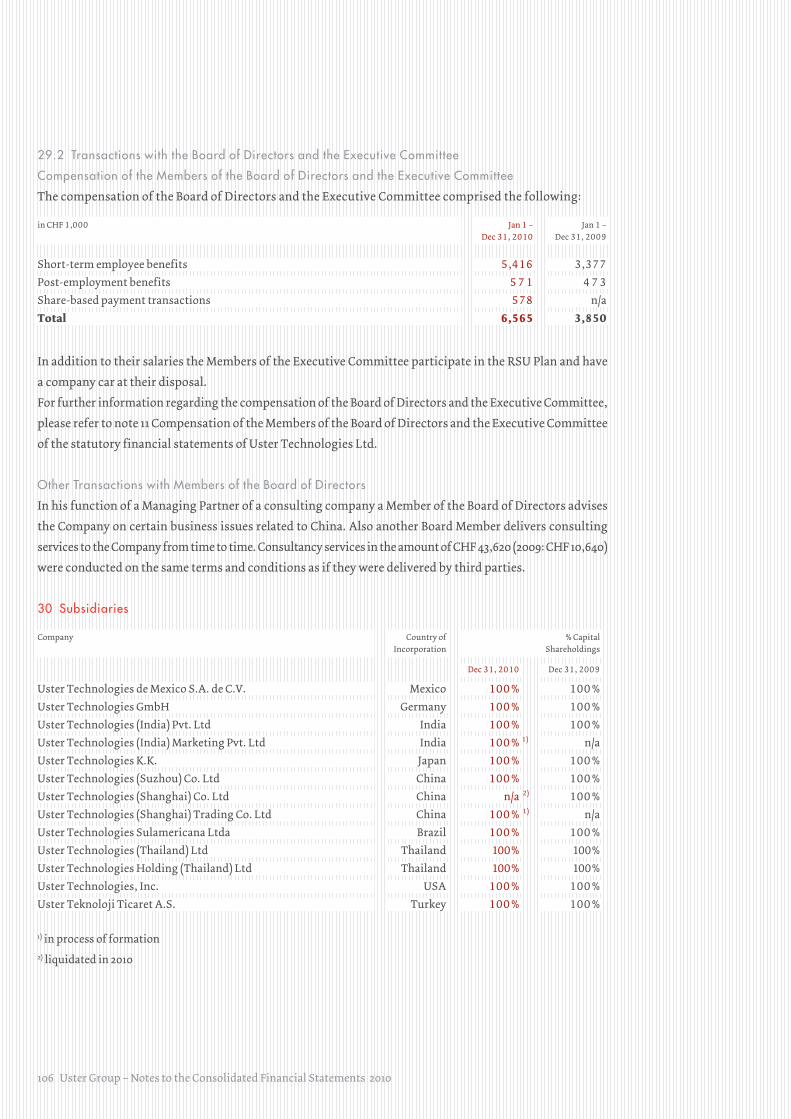
106 Uster Group – Notes to the Consolidated Financial Statements 2010
29.2 Transactions with the Board of Directors and the Executive Committee
Compensation of the Members of the Board of Directors and the Executive Committee
The compensation of the Board of Directors and the Executive Committee comprised the following:
in CHF 1,000 Jan 1 –
Dec 31, 2010
Jan 1 –
Dec 31, 2009
Short-term employee benefits 5,416 3,377
Post-employment benefits 5 7 1 4 7 3
Share-based payment transactions 578 n/a
Total 6,565 3,850
In addition to their salaries the Members of the Executive Committee participate in the RSU Plan and have
a company car at their disposal.
For further information regarding the compensation of the Board of Directors and the Executive Committee,
please refer to note 11 Compensation of the Members of the Board of Directors and the Executive Committee
of the statutory financial statements of Uster Technologies Ltd.
Other Transactions with Members of the Board of Directors
In his function of a Managing Partner of a consulting company a Member of the Board of Directors advises
the Company on certain business issues related to China. Also another Board Member delivers consulting
services to the Company from time to time. Consultancy services in the amount of CHF 43,620 (2009: CHF 10,640)
were conducted on the same terms and conditions as if they were delivered by third parties.
30 Subsidiaries
Company Country of
Incorporation
% Capital
Shareholdings
Dec 31, 2010 Dec 31, 2009
Uster Technologies de Mexico S.A. de C.V. Mexico 100 % 100 %
Uster Technologies GmbH Germany 100 % 100 %
Uster Technologies (India) Pvt. Ltd India 100 % 100 %
Uster Technologies (India) Marketing Pvt. Ltd India 100 % n/a
Uster Technologies K.K. Japan 100 % 100 %
Uster Technologies (Suzhou) Co. Ltd China 100 % 100 %
Uster Technologies (Shanghai) Co. Ltd China n/a 100 %
Uster Technologies (Shanghai) Trading Co. Ltd China 100 % n/a
Uster Technologies Sulamericana Ltda Brazil 100 % 100 %
Uster Technologies (Thailand) Ltd Thailand 100 % 100 %
Uster Technologies Holding (Thailand) Ltd Thailand 100 % 100 %
Uster Technologies, Inc. USA 100 % 100 %
Uster Teknoloji Ticaret A.S. Turkey 100 % 100 %
1) in process of formation2) liquidated in 2010
2)
1)
1)
Report of the Statutory Auditor on the Consolidated Financial Statements 2010 107
Report of the Statutory Auditor on the Consolidated Financial Statements
To the General Meeting of Uster Technologies Ltd, Uster
Zurich, 11 February 2011
As statutory auditor, we have audited the consolidated financial statements of Uster Technologies Ltd, which
comprise the statement of comprehensive income, statement of financial position, statement of cash flows,
statement of changes in equity, and notes (pages 60 to 106) for the year ended 31 December 2010.
Board of Directors’ responsibility
The Board of Directors is responsible for the preparation and fair presentation of the consolidated financial
statements in accordance with International Financial Reporting Standards (IFRS) and the requirements of
Swiss law. This responsibility includes designing, implementing and maintaining an internal control system
relevant to the preparation and fair presentation of consolidated financial statements that are free from
material misstatement, whether due to fraud or error. The Board of Directors is further responsible for
selecting and applying appropriate accounting policies and making accounting estimates that are reasonable
in the circumstances.
Auditor’s responsibility
Our responsibility is to express an opinion on these consolidated financial statements based on our audit.
We conducted our audit in accordance with Swiss law and Swiss Auditing Standards and International
Standards on Auditing (ISA). Those standards require that we plan and perform the audit to obtain reasonable
assurance whether the consolidated financial statements are free from material misstatement.
An audit involves performing procedures to obtain audit evidence about the amounts and disclosures in the
consolidated financial statements. The procedures selected depend on the auditor’s judgment, including
the assessment of the risks of material misstatement of the consolidated financial statements, whether due
to fraud or error. In making those risk assessments, the auditor considers the internal control system relevant
to the entity’s preparation and fair presentation of the consolidated financial statements in order to design
audit procedures that are appropriate in the circumstances, but not for the purpose of expressing an opinion
on the effectiveness of the entity’s internal control system. An audit also includes evaluating the appropriateness
of the accounting policies used and the reasonableness of accounting estimates made, as well as evaluating
the overall presentation of the consolidated financial statements. We believe that the audit evidence we have
obtained is sufficient and appropriate to provide a basis for our audit opinion.
Opinion
In our opinion, the consolidated financial statements for the year ended 31 December 2010 give a true and
fair view of the financial position, the results of operations and the cash flows in accordance with IFRS and
comply with Swiss law.
108 Report of the Statutory Auditor on the Consolidated Financial Statements 2010
Report on other legal requirements
We confirm that we meet the legal requirements on licensing according to the Auditor Oversight Act (AOA)
and independence (Art. 728 CO and Art. 11 AOA) and that there are no circumstances incompatible with our
independence.
In accordance with article 728a paragraph 1 item 3 CO and Swiss Auditing Standard 890, we confirm that an
internal control system exists, which has been designed for the preparation of consolidated financial state-
ments according to the instructions of the Board of Directors.
We recommend that the consolidated financial statements submitted to you be approved.
Ernst & Young Ltd
Daniel Zaugg Tobias Meyer
Licensed audit expert Licensed audit expert
(Auditor in charge)
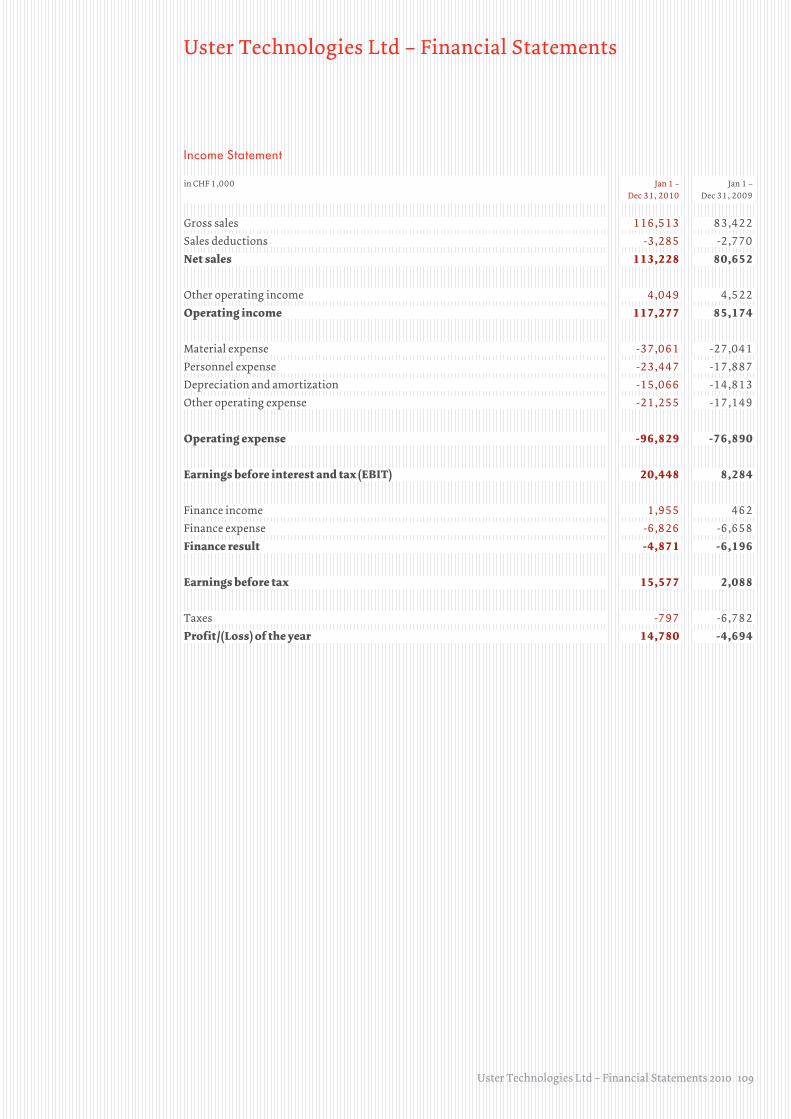
Uster Technologies Ltd – Financial Statements 2010 109
Uster Technologies Ltd – Financial Statements
Income Statement
in CHF 1,000 Jan 1 –
Dec 31, 2010
Jan 1 –
Dec 31, 2009
Gross sales 116,513 83,422
Sales deductions -3,285 -2,770
Net sales 113,228 80,652
Other operating income 4,049 4,522
Operating income 117,277 85,174
Material expense -37,061 -27,041
Personnel expense -23,447 -17,887
Depreciation and amortization -15,066 -14,813
Other operating expense -21,255 -17,149
Operating expense -96,829 -76,890
Earnings before interest and tax (EBIT) 20,448 8,284
Finance income 1,955 462
Finance expense -6,826 -6,658
Finance result -4,871 -6,196
Earnings before tax 15,577 2,088
Taxes -797 -6,782
Profit / (Loss) of the year 14,780 -4,694
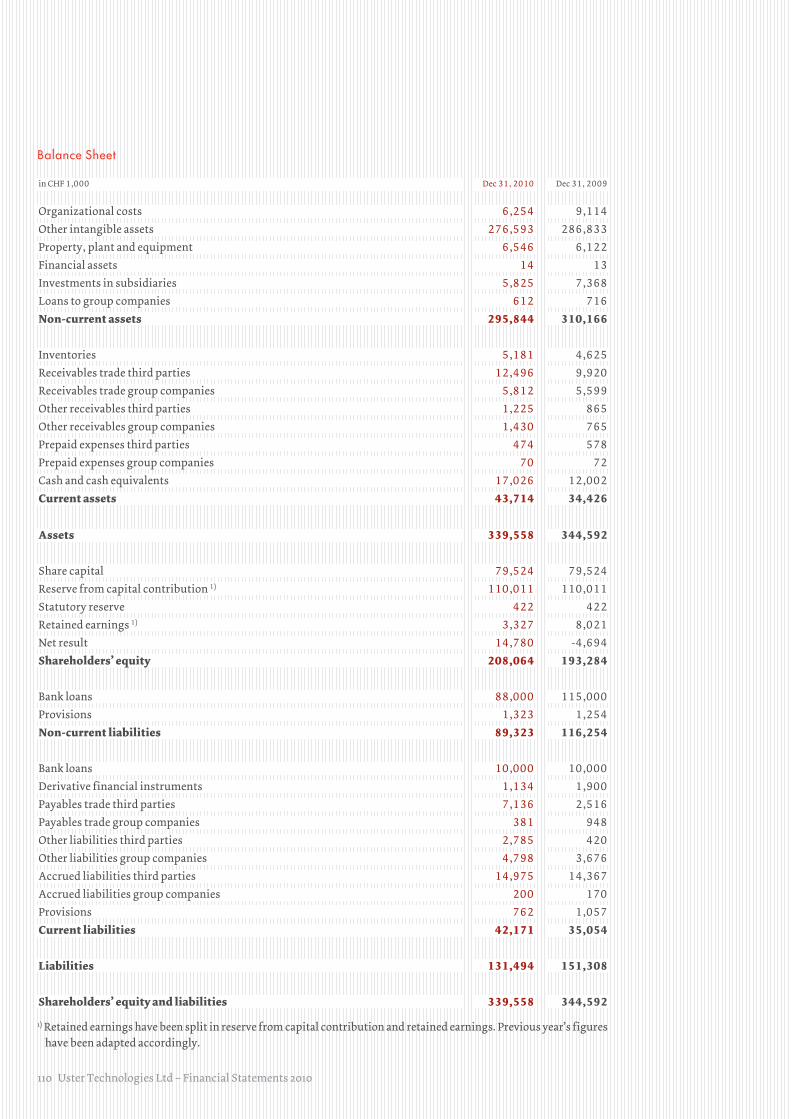
110 Uster Technologies Ltd – Financial Statements 2010
Balance Sheet
in CHF 1,000 Dec 31, 2010 Dec 31, 2009
Organizational costs 6,254 9,114
Other intangible assets 276,593 286,833
Property, plant and equipment 6,546 6,122
Financial assets 14 13
Investments in subsidiaries 5,825 7,368
Loans to group companies 612 716
Non-current assets 295,844 310,166
Inventories 5,181 4,625
Receivables trade third parties 12,496 9,920
Receivables trade group companies 5,812 5,599
Other receivables third parties 1,225 865
Other receivables group companies 1,430 765
Prepaid expenses third parties 474 578
Prepaid expenses group companies 70 72
Cash and cash equivalents 17,026 12,002
Current assets 43,714 34,426
Assets 339,558 344,592
Share capital 79,524 79,524
Reserve from capital contribution 1) 110,011 110,011
Statutory reserve 422 422
Retained earnings 1) 3,327 8,021
Net result 14,780 -4,694
Shareholders’ equity 208,064 193,284
Bank loans 88,000 115,000
Provisions 1,323 1,254
Non-current liabilities 89,323 116,254
Bank loans 10,000 10,000
Derivative financial instruments 1,134 1,900
Payables trade third parties 7,136 2,516
Payables trade group companies 381 948
Other liabilities third parties 2,785 420
Other liabilities group companies 4,798 3,676
Accrued liabilities third parties 14,975 14,367
Accrued liabilities group companies 200 170
Provisions 762 1,057
Current liabilities 42,171 35,054
Liabilities 131,494 151,308
Shareholders’ equity and liabilities 339,558 344,592
1) Retained earnings have been split in reserve from capital contribution and retained earnings. Previous year’s figures have been adapted accordingly.
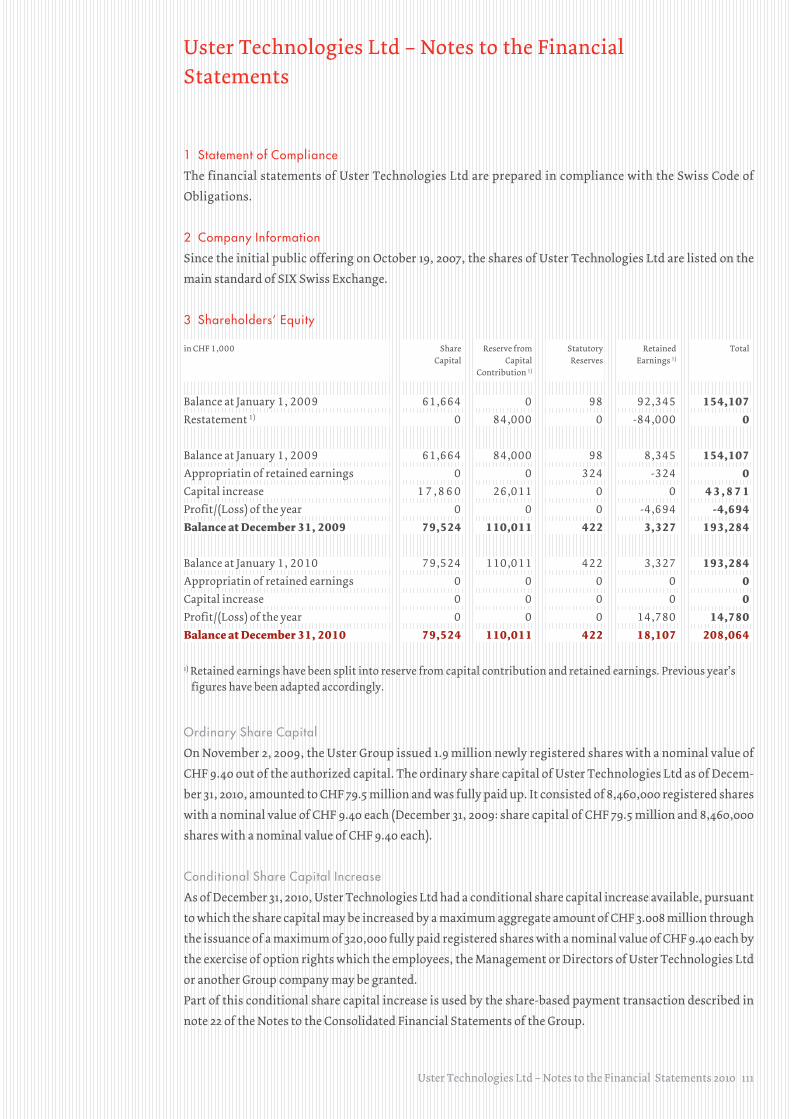
Uster Technologies Ltd – Notes to the Financial Statements 2010 111
Uster Technologies Ltd – Notes to the Financial Statements
1 Statement of Compliance
The financial statements of Uster Technologies Ltd are prepared in compliance with the Swiss Code of
Obligations.
2 Company Information
Since the initial public offering on October 19, 2007, the shares of Uster Technologies Ltd are listed on the
main standard of SIX Swiss Exchange.
3 Shareholders’ Equity
in CHF 1,000 Share
Capital
Reserve from
Capital
Contribution 1)
Statutory
Reserves
Retained
Earnings 1)
Total
Balance at January 1, 2009 61,664 0 98 92,345 154,107Restatement 1) 0 84,000 0 -84,000 0
Balance at January 1, 2009 61,664 84,000 98 8,345 154,107Appropriatin of retained earnings 0 0 324 -324 0Capital increase 1 7 , 8 6 0 26,011 0 0 4 3 , 8 7 1Profit / (Loss) of the year 0 0 0 -4,694 -4,694Balance at December 31, 2009 79,524 110,011 422 3,327 193,284
Balance at January 1, 2010 79,524 110,011 422 3,327 193,284Appropriatin of retained earnings 0 0 0 0 0Capital increase 0 0 0 0 0Profit / (Loss) of the year 0 0 0 14,780 14,780Balance at December 31, 2010 79,524 110,011 422 18,107 208,064
1) Retained earnings have been split into reserve from capital contribution and retained earnings. Previous year’s figures have been adapted accordingly.
Ordinary Share Capital
On November 2, 2009, the Uster Group issued 1.9 million newly registered shares with a nominal value of
CHF 9.40 out of the authorized capital. The ordinary share capital of Uster Technologies Ltd as of Decem-
ber 31, 2010, amounted to CHF 79.5 million and was fully paid up. It consisted of 8,460,000 registered shares
with a nominal value of CHF 9.40 each (December 31, 2009: share capital of CHF 79.5 million and 8,460,000
shares with a nominal value of CHF 9.40 each).
Conditional Share Capital Increase
As of December 31, 2010, Uster Technologies Ltd had a conditional share capital increase available, pursuant
to which the share capital may be increased by a maximum aggregate amount of CHF 3.008 million through
the issuance of a maximum of 320,000 fully paid registered shares with a nominal value of CHF 9.40 each by
the exercise of option rights which the employees, the Management or Directors of Uster Technologies Ltd
or another Group company may be granted.
Part of this conditional share capital increase is used by the share-based payment transaction described in
note 22 of the Notes to the Consolidated Financial Statements of the Group.

112 Uster Technologies Ltd – Notes to the Financial Statements 2010
4 Pledged Assets
As of December 31, 2010, none of the assets of Uster Technologies Ltd were pledged (2009: none).
5 Guarantee
As of December 31, 2010, Uster Technologies Ltd did not have any guarantees outstanding (2009: none).
6 Fire Insurance Values of Property, Plant and Equipment
The fire insurance values of property, plant and equipment as of December 31, 2010, amounted to CHF 17.1 million
(2009: CHF 15.3 million).
7 Pension Fund Liability
As of December 31, 2010, Uster Technologies Ltd had a pension fund liability of CHF 0.3 million (2009: CHF 0.0 million).
8 Risk Assessment
Risk management is part of the management process which is defined within the management handbook.
All risks / groups of risks are assigned to the process owners of the business processes containing the specific
risk. Strategic risks are directly assigned to the Executive Management Team.
The process owners supervise the risks / group of risks and propose process changes if the risks take unexpected
developments. The process changes are approved by the Executive Management Team.
The risk management process is reviewed at least once a year by the Board of Directors.
9 Significant Shareholders
880 shareholders were entered in the share register of Uster Technologies Ltd as of December 31, 2010
(2009: 1,017). Of those the following held more than 3.0% of the total voting rights:
• Alcide Ltd 27.9 % (27.9 %)
• Toyota Industries Corporation 22.5 % (22.5 %)
• Board and Management Group 1) 8.1 % (n/a)
• T. Rowe Price International Inc. 4.5 % (4.4 %)
• Bär Marc Philipp 3.1 % (3.1 %)
• Balfidor Fondsleitung AG 3.1 % (–)
1) Part of Board and Management formed a Group for purchase and sale of shares.
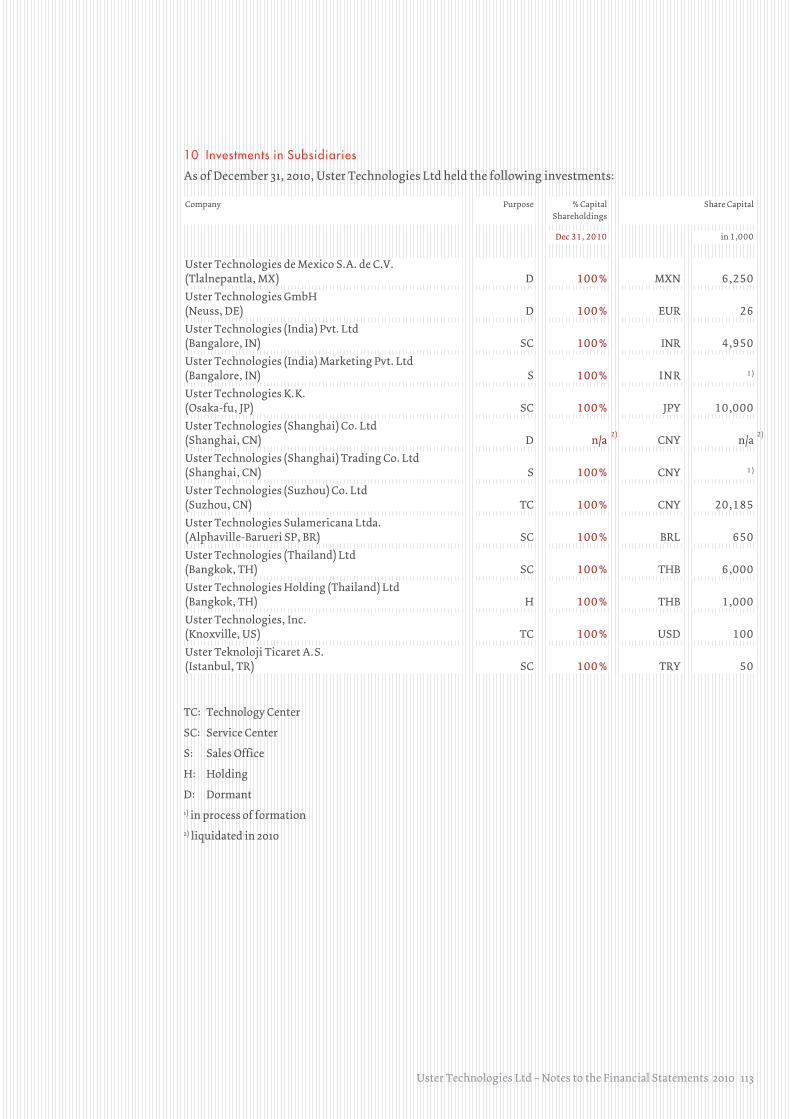
Uster Technologies Ltd – Notes to the Financial Statements 2010 113
10 Investments in Subsidiaries
As of December 31, 2010, Uster Technologies Ltd held the following investments:
Company Purpose % Capital
Shareholdings
Share Capital
Dec 31, 2010 in 1,000
Uster Technologies de Mexico S.A. de C.V.
(Tlalnepantla, MX) D 100 % MXN 6,250
Uster Technologies GmbH
(Neuss, DE) D 100 % EUR 26
Uster Technologies (India) Pvt. Ltd
(Bangalore, IN) SC 100 % INR 4,950
Uster Technologies (India) Marketing Pvt. Ltd
(Bangalore, IN) S 100 % I N R 1 )
Uster Technologies K. K.
(Osaka-fu, JP) SC 100 % JPY 10,000
Uster Technologies (Shanghai) Co. Ltd
(Shanghai, CN) D n/a CNY n/a
Uster Technologies (Shanghai) Trading Co. Ltd
(Shanghai, CN) S 100 % CNY 1 )
Uster Technologies (Suzhou) Co. Ltd
(Suzhou, CN) TC 100 % CNY 20,185
Uster Technologies Sulamericana Ltda.
(Alphaville-Barueri SP, BR) SC 100 % BRL 650
Uster Technologies (Thailand) Ltd
(Bangkok, TH) SC 100 % THB 6,000
Uster Technologies Holding (Thailand) Ltd
(Bangkok, TH) H 100 % THB 1,000
Uster Technologies, Inc.
(Knoxville, US) TC 100 % USD 100
Uster Teknoloji Ticaret A. S.
(Istanbul, TR) SC 100 % TRY 50
TC: Technology Center
SC: Service Center
S: Sales Office
H: Holding
D: Dormant1) in process of formation2) liquidated in 2010
2) 2)
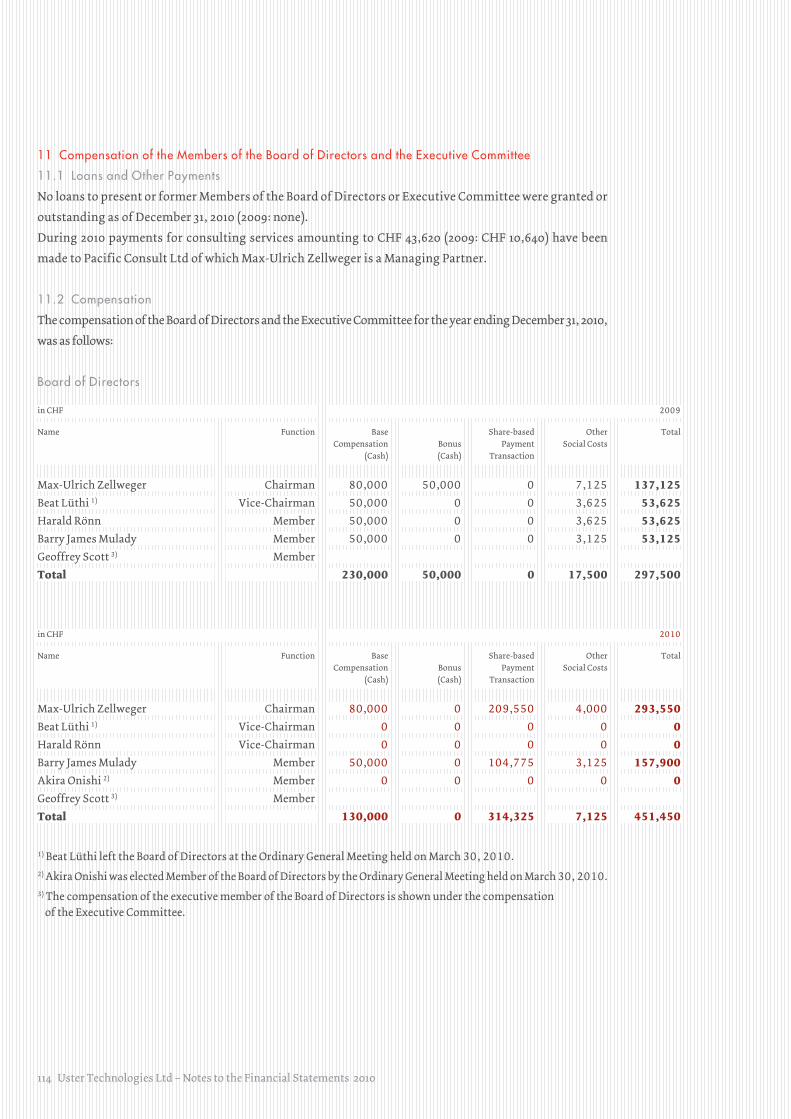
114 Uster Technologies Ltd – Notes to the Financial Statements 2010
11 Compensation of the Members of the Board of Directors and the Executive Committee
11.1 Loans and Other Payments
No loans to present or former Members of the Board of Directors or Executive Committee were granted or
outstanding as of December 31, 2010 (2009: none).
During 2010 payments for consulting services amounting to CHF 43,620 (2009: CHF 10,640) have been
made to Pacific Consult Ltd of which Max-Ulrich Zellweger is a Managing Partner.
11.2 Compensation
The compensation of the Board of Directors and the Executive Committee for the year ending December 31, 2010,
was as follows:
Board of Directors
in CHF 2009
Name Function Base
Compensation
(Cash)
Bonus
(Cash)
Share-based
Payment
Transaction
Other
Social Costs
Total
Max-Ulrich Zellweger Chairman 80,000 50,000 0 7,125 137,125Beat Lüthi 1) Vice-Chairman 50,000 0 0 3,625 53,625Harald Rönn Member 50,000 0 0 3,625 53,625Barry James Mulady Member 50,000 0 0 3,125 53,125Geoffrey Scott 3) Member
Total 230,000 50,000 0 17,500 297,500
in CHF 2010
Name Function Base
Compensation
(Cash)
Bonus
(Cash)
Share-based
Payment
Transaction
Other
Social Costs
Total
Max-Ulrich Zellweger Chairman 80,000 0 209,550 4,000 293,550Beat Lüthi 1) Vice-Chairman 0 0 0 0 0Harald Rönn Vice-Chairman 0 0 0 0 0Barry James Mulady Member 50,000 0 104,775 3,125 157,900Akira Onishi 2) Member 0 0 0 0 0Geoffrey Scott 3) Member Total 130,000 0 314,325 7,125 451,450
1) Beat Lüthi left the Board of Directors at the Ordinary General Meeting held on March 30, 2010.
2) Akira Onishi was elected Member of the Board of Directors by the Ordinary General Meeting held on March 30, 2010.
3) The compensation of the executive member of the Board of Directors is shown under the compensation
of the Executive Committee.
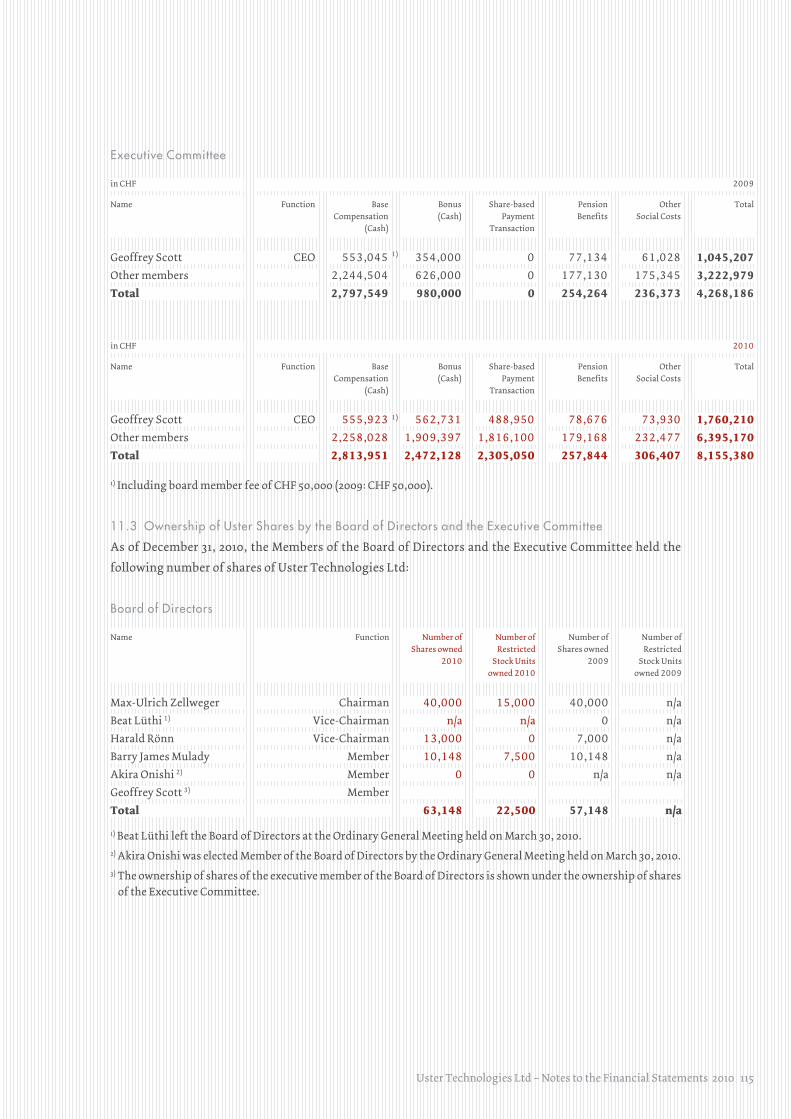
Uster Technologies Ltd – Notes to the Financial Statements 2010 115
Executive Committee
in CHF 2009
Name Function Base
Compensation
(Cash)
Bonus
(Cash)
Share-based
Payment
Transaction
Pension
Benefits
Other
Social Costs
Total
Geoffrey Scott CEO 553,045 354,000 0 77,134 61,028 1,045,207Other members 2,244,504 626,000 0 177,130 175,345 3,222,979Total 2,797,549 980,000 0 254,264 236,373 4,268,186
in CHF 2010
Name Function Base
Compensation
(Cash)
Bonus
(Cash)
Share-based
Payment
Transaction
Pension
Benefits
Other
Social Costs
Total
Geoffrey Scott CEO 555,923 562,731 488,950 78,676 73,930 1,760,210Other members 2,258,028 1,909,397 1,816,100 179,168 232,477 6,395,170Total 2,813,951 2,472,128 2,305,050 257,844 306,407 8,155,380
1) Including board member fee of CHF 50,000 (2009: CHF 50,000).
11.3 Ownership of Uster Shares by the Board of Directors and the Executive Committee
As of December 31, 2010, the Members of the Board of Directors and the Executive Committee held the
following number of shares of Uster Technologies Ltd:
Board of Directors
Name Function Number of
Shares owned
2010
Number of
Restricted
Stock Units
owned 2010
Number of
Shares owned
2009
Number of
Restricted
Stock Units
owned 2009
Max-Ulrich Zellweger Chairman 40,000 15,000 40,000 n/a
Beat Lüthi 1) Vice-Chairman n/a n/a 0 n/a
Harald Rönn Vice-Chairman 13,000 0 7,000 n/a
Barry James Mulady Member 10,148 7,500 10,148 n/a
Akira Onishi 2) Member 0 0 n/a n/a
Geoffrey Scott 3) Member
Total 63,148 22,500 57,148 n/a
1) Beat Lüthi left the Board of Directors at the Ordinary General Meeting held on March 30, 2010.2) Akira Onishi was elected Member of the Board of Directors by the Ordinary General Meeting held on March 30, 2010.3) The ownership of shares of the executive member of the Board of Directors is shown under the ownership of shares of the Executive Committee.
1)
1)
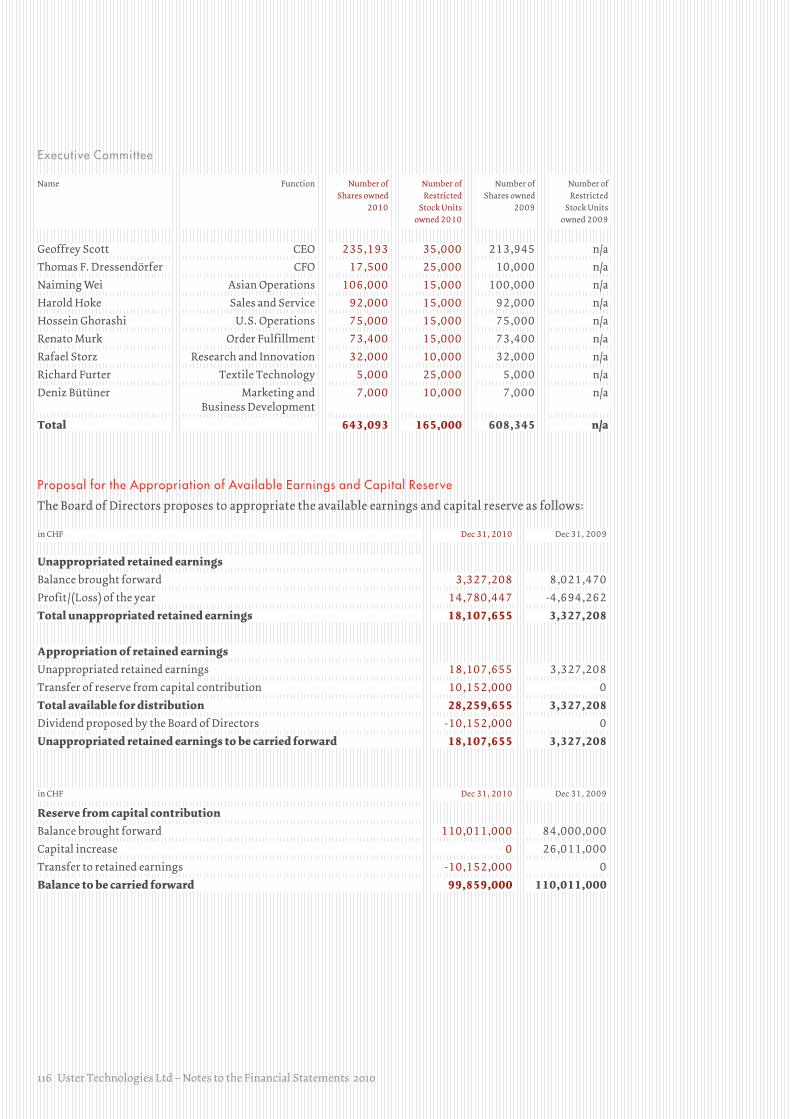
116 Uster Technologies Ltd – Notes to the Financial Statements 2010
Executive Committee
Name Function Number of
Shares owned
2010
Number of
Restricted
Stock Units
owned 2010
Number of
Shares owned
2009
Number of
Restricted
Stock Units
owned 2009
Geoffrey Scott CEO 235,193 35,000 213,945 n/a
Thomas F. Dressendörfer CFO 17,500 25,000 10,000 n/a
Naiming Wei Asian Operations 106,000 15,000 100,000 n/a
Harold Hoke Sales and Service 92,000 15,000 92,000 n/a
Hossein Ghorashi U. S. Operations 75,000 15,000 75,000 n/a
Renato Murk Order Fulfillment 73,400 15,000 73,400 n/a
Rafael Storz Research and Innovation 32,000 10,000 32,000 n/a
Richard Furter Textile Technology 5,000 25,000 5,000 n/a
Deniz Bütüner Marketing and
Business Development
7,000 10,000
7,000 n/a
Total 643,093 165,000 608,345 n/a
Proposal for the Appropriation of Available Earnings and Capital Reserve
The Board of Directors proposes to appropriate the available earnings and capital reserve as follows:
in CHF Dec 31, 2010 Dec 31, 2009
Unappropriated retained earningsBalance brought forward 3,327,208 8,021,470
Profit / (Loss) of the year 14,780,447 -4,694,262
Total unappropriated retained earnings 18,107,655 3,327,208
Appropriation of retained earningsUnappropriated retained earnings 18,107,655 3,327,208
Transfer of reserve from capital contribution 10,152,000 0
Total available for distribution 28,259,655 3,327,208Dividend proposed by the Board of Directors -10,152,000 0
Unappropriated retained earnings to be carried forward 18,107,655 3,327,208
in CHF Dec 31, 2010 Dec 31, 2009
Reserve from capital contributionBalance brought forward 110,011,000 84,000,000
Capital increase 0 26,011,000
Transfer to retained earnings -10,152,000 0
Balance to be carried forward 99,859,000 110,011,000
Report of the Statutory Auditor on the Financial Statements 2010 117
Report of the Statutory Auditor on the Financial Statements
To the General Meeting of Uster Technologies Ltd, Uster
Zurich, 11 February 2011
As statutory auditor, we have audited the financial statements of Uster Technologies Ltd, which comprise
the income statement, balance sheet and notes (pages 109 to 116) for the year ended 31 December 2010.
Board of Directors’ responsibility
The Board of Directors is responsible for the preparation of the financial statements in accordance with the
requirements of Swiss law and the company’s articles of incorporation. This responsibility includes designing,
implementing and maintaining an internal control system relevant to the preparation of financial statements
that are free from material misstatement, whether due to fraud or error. The Board of Directors is further
responsible for selecting and applying appropriate accounting policies and making accounting estimates
that are reasonable in the circumstances.
Auditor’s responsibility
Our responsibility is to express an opinion on these financial statements based on our audit. We conducted
our audit in accordance with Swiss law and Swiss Auditing Standards. Those standards require that we plan
and perform the audit to obtain reasonable assurance whether the financial statements are free from material
misstatement.
An audit involves performing procedures to obtain audit evidence about the amounts and disclosures in the
financial statements. The procedures selected depend on the auditor’s judgment, including the assessment
of the risks of material misstatement of the financial statements, whether due to fraud or error. In making
those risk assessments, the auditor considers the internal control system relevant to the entity’s preparation
of the financial statements in order to design audit procedures that are appropriate in the circumstances,
but not for the purpose of expressing an opinion on the effectiveness of the entity’s internal control system.
An audit also includes evaluating the appropriateness of the accounting policies used and the reasonableness
of accounting estimates made, as well as evaluating the overall presentation of the financial statements. We
believe that the audit evidence we have obtained is sufficient and appropriate to provide a basis for our audit
opinion.
Opinion
In our opinion, the financial statements for the year ended 31 December 2010 comply with Swiss law and the
company’s articles of incorporation.
118 Report of the Statutory Auditor on the Financial Statements 2010
Report on other legal requirements
We confirm that we meet the legal requirements on licensing according to the Auditor Oversight Act (AOA)
and independence (Art. 728 CO and Art. 11 AOA) and that there are no circumstances incompatible with our
independence.
In accordance with article 728a paragraph 1 item 3 CO and Swiss Auditing Standard 890, we confirm that an
internal control system exists, which has been designed for the preparation of financial statements according
to the instructions of the Board of Directors.
We further confirm that the proposed appropriation of available earnings complies with Swiss law and the
company’s articles of incorporation. We recommend that the financial statements submitted to you be
approved.
Ernst & Young Ltd
Daniel Zaugg Tobias Meyer
Licensed audit expert Licensed audit expert
(Auditor in charge)
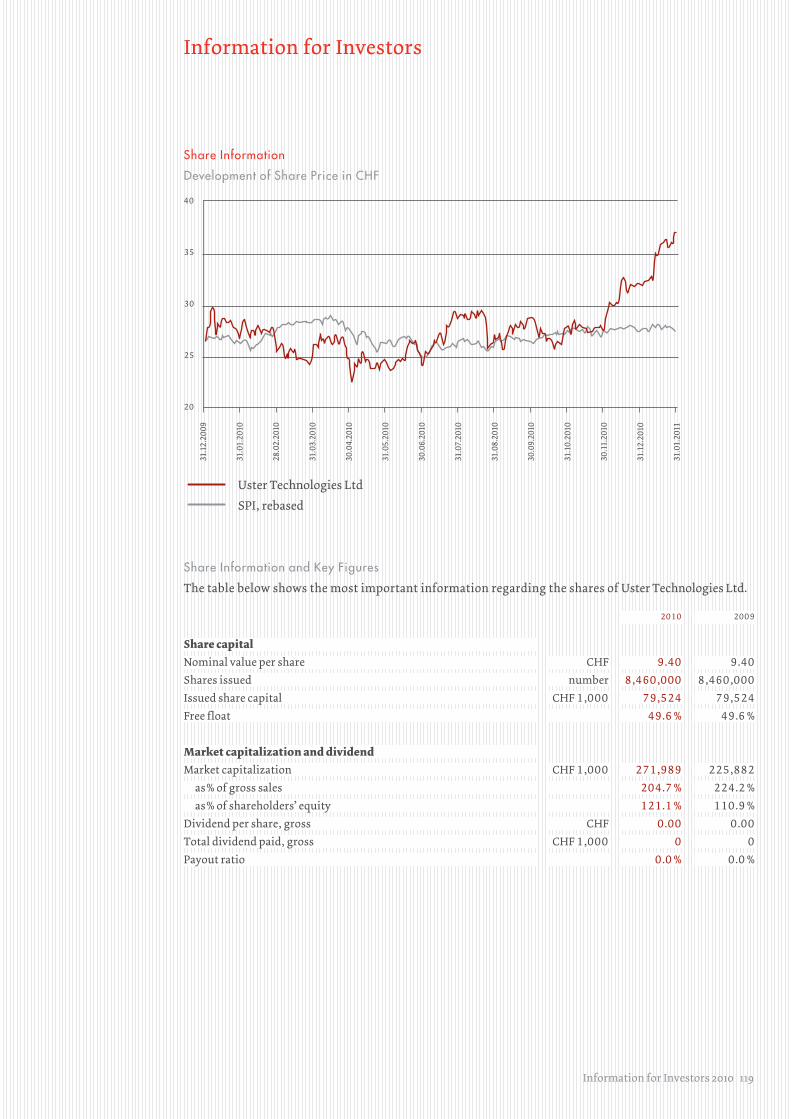
Information for Investors 2010 119
Information for Investors
Share Information
Development of Share Price in CHF
Share Information and Key Figures
The table below shows the most important information regarding the shares of Uster Technologies Ltd.
2010 2009
Share capitalNominal value per share CHF 9.40 9.40
Shares issued number 8,460,000 8,460,000
Issued share capital CHF 1,000 79,524 79,524
Free float 49.6 % 49.6 %
Market capitalization and dividendMarket capitalization CHF 1,000 271,989 225,882
as % of gross sales 204.7 % 224.2 %
as % of shareholders’ equity 121.1 % 110.9 %
Dividend per share, gross CHF 0.00 0.00
Total dividend paid, gross CHF 1,000 0 0
Payout ratio 0.0 % 0.0 %
40
35
30
25
20
Uster Technologies Ltd
SPI, rebased
31.1
0.20
10
30.1
1.20
10
31.0
8.20
10
30.0
6.20
10
30.0
4.20
10
31.0
5.20
10
31.0
7.20
10
30.0
9.20
10
28.0
2.20
10
31.0
3.20
10
31.1
2.20
09
31.0
1.20
10
31.1
2.20
10
31.0
1.20
11
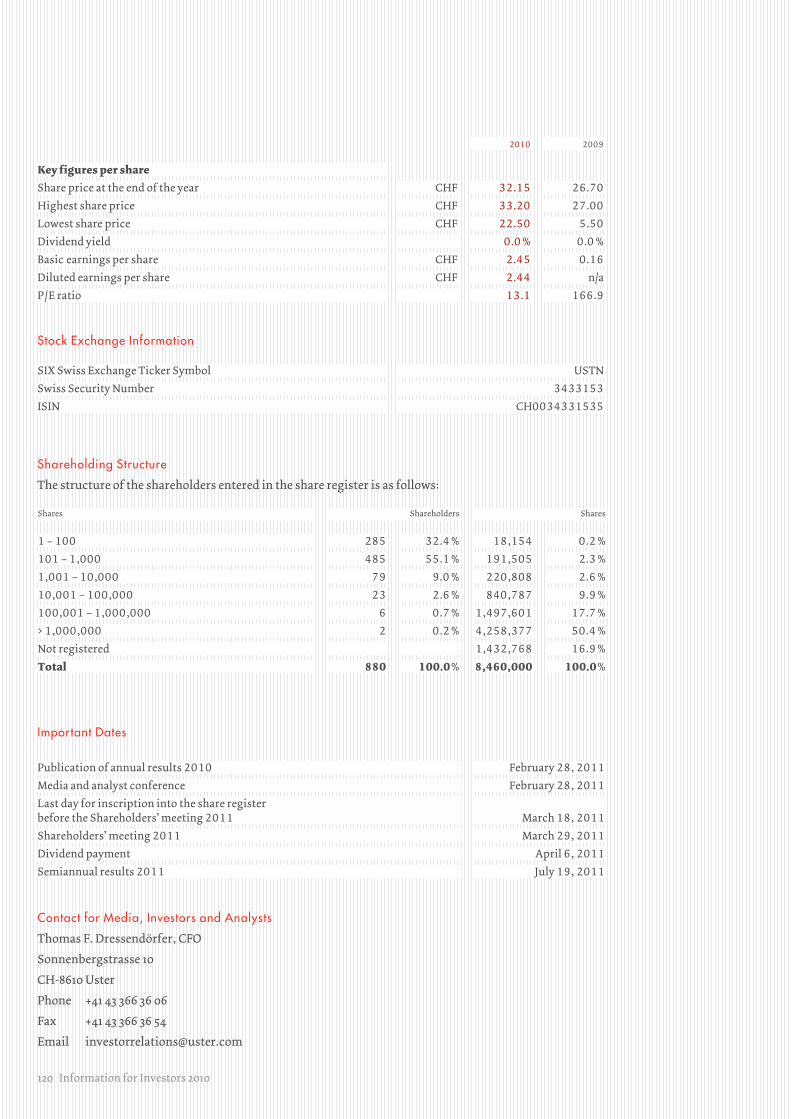
120 Information for Investors 2010
2010 2009
Key figures per shareShare price at the end of the year CHF 32.15 26.70
Highest share price CHF 33.20 27.00
Lowest share price CHF 22.50 5.50
Dividend yield 0.0 % 0.0 %
Basic earnings per share CHF 2.45 0.16
Diluted earnings per share CHF 2.44 n/a
P / E ratio 13.1 166.9
Stock Exchange Information
SIX Swiss Exchange Ticker Symbol USTN
Swiss Security Number 3433153
ISIN CH0034331535
Shareholding Structure
The structure of the shareholders entered in the share register is as follows:
Shares Shareholders Shares
1 – 100 285 32.4 % 18,154 0.2 %
101 – 1,000 485 55.1 % 191,505 2.3 %
1,001 – 10,000 79 9.0 % 220,808 2.6 %
10,001 – 100,000 23 2.6 % 840,787 9.9 %
100,001 – 1,000,000 6 0.7 % 1,497,601 17.7 %
> 1,000,000 2 0.2 % 4,258,377 50.4 %
Not registered 1,432,768 16.9 %
Total 880 100.0 % 8,460,000 100.0 %
Important Dates
Publication of annual results 2010 February 28, 2011
Media and analyst conference February 28, 2011
Last day for inscription into the share register
before the Shareholders’ meeting 2011 March 18, 2011
Shareholders’ meeting 2011 March 29, 2011
Dividend payment April 6, 2011
Semiannual results 2011 July 19, 2011
Contact for Media, Investors and Analysts
Thomas F. Dressendörfer, CFO
Sonnenbergstrasse 10
CH-8610 Uster
Phone +41 43 366 36 06
Fax +41 43 366 36 54
Email [email protected]
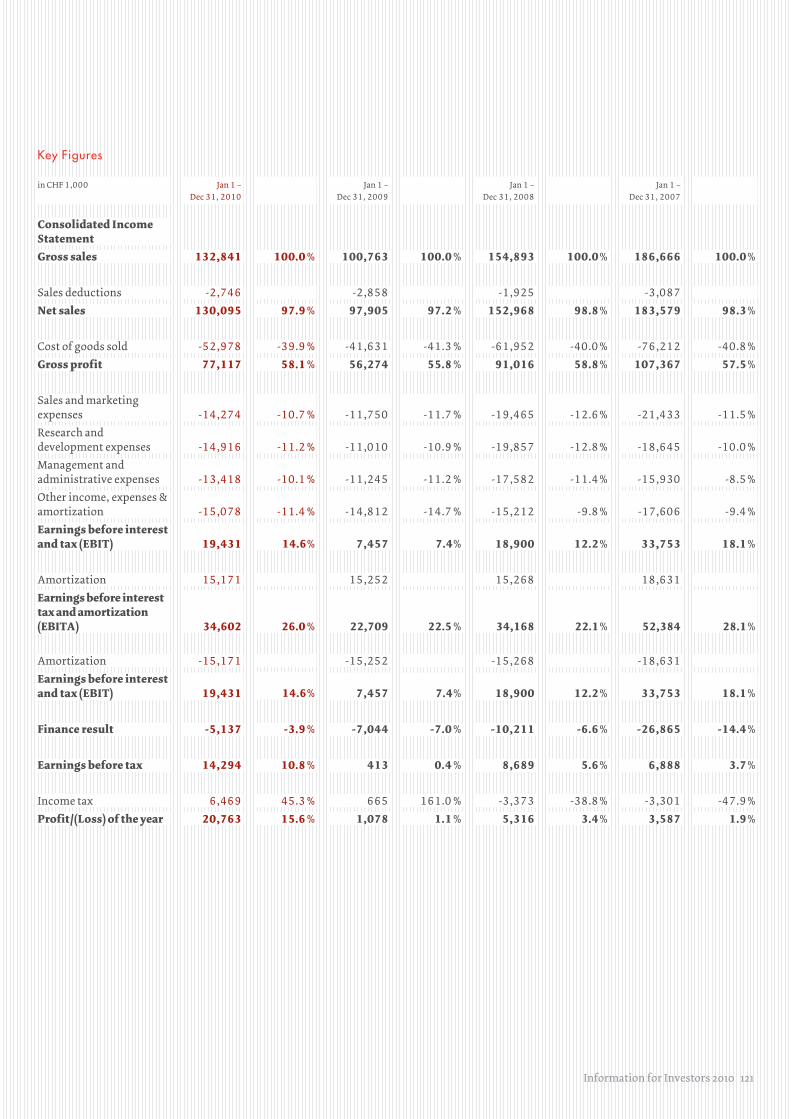
Information for Investors 2010 121
Key Figures
in CHF 1,000 Jan 1 –
Dec 31, 2010
Jan 1 –
Dec 31, 2009
Jan 1 –
Dec 31, 2008
Jan 1 –
Dec 31, 2007
Consolidated Income StatementGross sales 132,841 100.0 % 100,763 100.0 % 154,893 100.0 % 186,666 100.0 %
Sales deductions -2,746 -2,858 -1,925 -3,087
Net sales 130,095 97.9 % 97,905 97.2 % 152,968 98.8 % 183,579 98.3 %
Cost of goods sold -52,978 -39.9 % -41,631 -41.3 % -61,952 -40.0 % -76,212 -40.8 %
Gross profit 77,117 58.1 % 56,274 55.8 % 91,016 58.8 % 107,367 57.5 %
Sales and marketing
expenses -14,274 -10.7 % -11,750 -11.7 % -19,465 -12.6 % -21,433 -11.5 %
Research and
development expenses -14,916 -11.2 % -11,010 -10.9 % -19,857 -12.8 % -18,645 -10.0 %
Management and
administrative expenses -13,418 -10.1 % -11,245 -11.2 % -17,582 -11.4 % -15,930 -8.5 %
Other income, expenses &
amortization -15,078 -11.4 % -14,812 -14.7 % -15,212 -9.8 % -17,606 -9.4 %
Earnings before interest and tax (EBIT) 19,431 14.6% 7,457 7.4% 18,900 12.2 % 33,753 18.1 %
Amortization 15,171 15,252 15,268 18,631
Earnings before interest tax and amortization (EBITA) 34,602 26.0 % 22,709 22.5 % 34,168 22.1 % 52,384 28.1 %
Amortization -15,171 -15,252 -15,268 -18,631
Earnings before interest and tax (EBIT) 19,431 14.6% 7,457 7.4% 18,900 12.2 % 33,753 18.1 %
Finance result -5,137 -3.9 % -7,044 -7.0 % -10,211 -6.6 % -26,865 -14.4 %
Earnings before tax 14,294 10.8 % 413 0.4 % 8,689 5.6 % 6,888 3.7 %
Income tax 6,469 45.3 % 665 161.0 % -3,373 -38.8 % -3,301 -47.9 %
Profit / (Loss) of the year 20,763 15.6 % 1,078 1.1 % 5,316 3.4 % 3,587 1.9 %
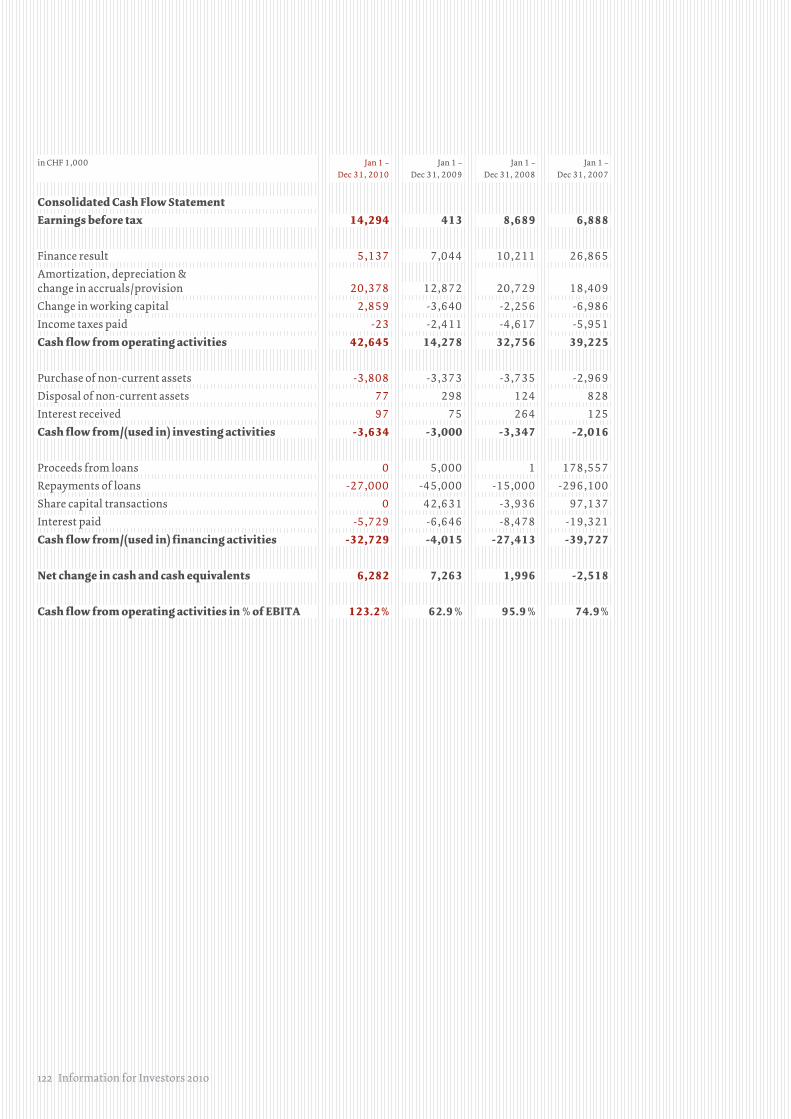
122 Information for Investors 2010
in CHF 1,000 Jan 1 –
Dec 31, 2010
Jan 1 –
Dec 31, 2009
Jan 1 –
Dec 31, 2008
Jan 1 –
Dec 31, 2007
Consolidated Cash Flow StatementEarnings before tax 14,294 413 8,689 6,888
Finance result 5,137 7,044 10,211 26,865
Amortization, depreciation &
change in accruals / provision 20,378
12,872 20,729 18,409
Change in working capital 2,859 -3,640 -2,256 -6,986
Income taxes paid -23 -2,411 -4,617 -5,951
Cash flow from operating activities 42,645 14,278 32,756 39,225
Purchase of non-current assets -3,808 -3,373 -3,735 -2,969
Disposal of non-current assets 77 298 124 828
Interest received 97 75 264 125
Cash flow from / (used in) investing activities -3,634 -3,000 -3,347 -2,016
Proceeds from loans 0 5,000 1 178,557
Repayments of loans -27,000 -45,000 -15,000 -296,100
Share capital transactions 0 42,631 -3,936 97,137
Interest paid -5,729 -6,646 -8,478 -19,321
Cash flow from / (used in) financing activities -32,729 -4,015 -27,413 -39,727
Net change in cash and cash equivalents 6,282 7,263 1,996 -2,518
Cash flow from operating activities in % of EBITA 123.2 % 62.9 % 95.9 % 74.9 %
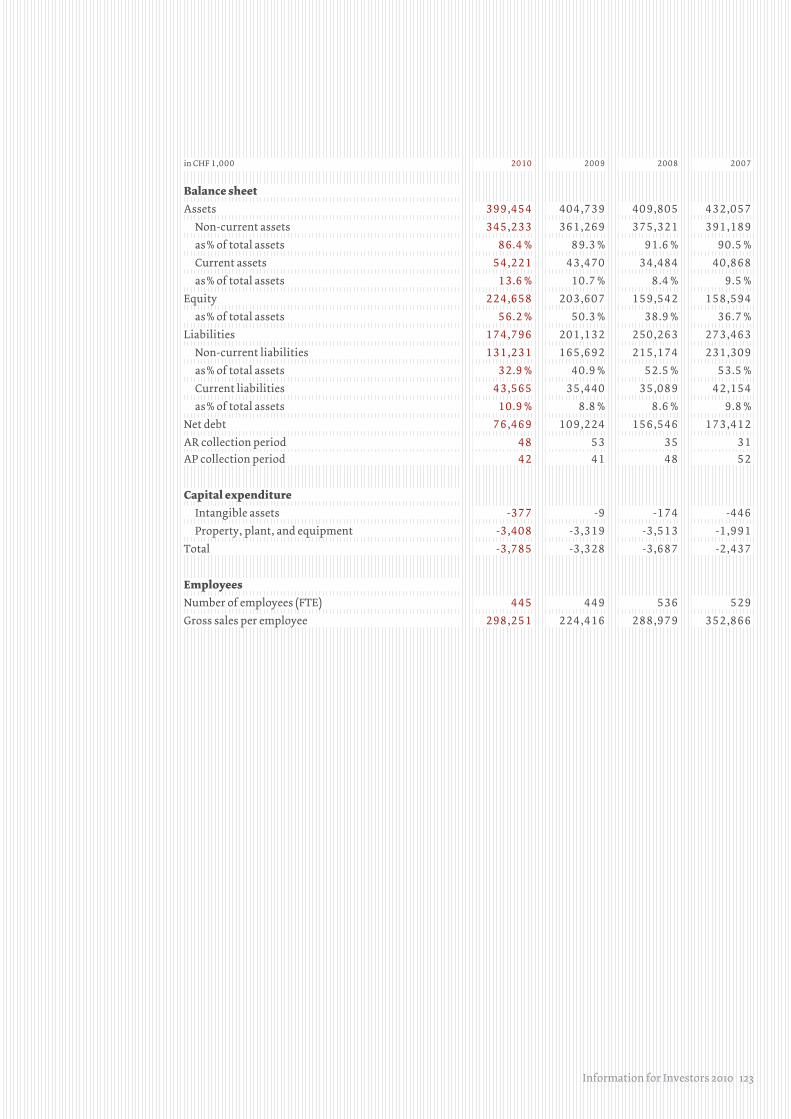
Information for Investors 2010 123
in CHF 1,000 2010 2009 2008 2007
Balance sheetAssets 399,454 404,739 409,805 432,057
Non-current assets 345,233 361,269 375,321 391,189
as % of total assets 86.4 % 89.3 % 91.6 % 90.5 %
Current assets 54,221 43,470 34,484 40,868
as % of total assets 13.6 % 10.7 % 8.4 % 9.5 %
Equity 224,658 203,607 159,542 158,594
as % of total assets 56.2 % 50.3 % 38.9 % 36.7 %
Liabilities 174,796 201,132 250,263 273,463
Non-current liabilities 131,231 165,692 215,174 231,309
as % of total assets 32.9 % 40.9 % 52.5 % 53.5 %
Current liabilities 43,565 35,440 35,089 42,154
as % of total assets 10.9 % 8.8 % 8.6 % 9.8 %
Net debt 76,469 109,224 156,546 173,412
AR collection period 48 53 35 31
AP collection period 42 41 48 52
Capital expenditureIntangible assets -377 -9 -174 -446
Property, plant, and equipment -3,408 -3,319 -3,513 -1,991
Total -3,785 -3,328 -3,687 -2,437
EmployeesNumber of employees (FTE) 445 449 536 529
Gross sales per employee 298,251 224,416 288,979 352,866
124 Uster Technologies Ltd | Annual Report 2010
Imprint
Content Concept and Editing
IRF Communications AG
Text
Uster Technologies Ltd
Design, Concept and Layout
TGG Hafen Senn Stieger
Photos Imagepages
Vonier Fotografie
Photos Board of Directors
and Executive Committee
T+T Fotografie
Printing
Ostschweiz Druck AG

Uster Technologies Ltd
Sonnenbergstrasse 10
CH-8610 Uster / Switzerland
Phone +41 43 366 36 36
Fax +41 43 366 36 37
Email [email protected]
The English reporting section of this annual report is the governing text.
Die englische Version des Berichterstattungsteils ist massgeblich.


![USTER ZWEIGLE FRICTION TESTER 5 - Think · PDF fileUSTER® ZWEIGLE FRICTION TESTER 5 APPLICATION REPORT ... 2 Importance of yarn friction ... weaving, and knitting [1, 2]](https://static.fdocuments.us/doc/165x107/5aa7e44c7f8b9ac5648cba7f/uster-zweigle-friction-tester-5-think-zweigle-friction-tester-5-application-report.jpg)