ADB Working Paper Series on Regional Economic...
52
The Impact of ACFTA on People’s Republic of China–ASEAN Trade: Estimates Based on an Extended Gravity Model for Component Trade Yu Sheng, Hsiao Chink Tang, and Xinpeng Xu No. 99 | July 2012 ADB Working Paper Series on Regional Economic Integration
Transcript of ADB Working Paper Series on Regional Economic...

The Impact of ACFTA on People’s Republic of China–ASEAN Trade: Estimates Based on an Extended Gravity Model for Component Trade
Yu Sheng, Hsiao Chink Tang, and Xinpeng Xu No. 99 | July 2012
ADB Working Paper Series onRegional Economic Integration


Yu Sheng+, Hsiao Chink Tang++ and Xinpeng Xu+++
The Impact of ACFTA on People’s Republic of China–ASEAN Trade: Estimates Based on an Extended Gravity Model for Component Trade
ADB Working Paper Series on Regional Economic Integration
No. 99 July 2012
We are grateful to Peter Drysdale from the Australian National University (ANU) and all participants at the ANU Economic Development Seminar for their useful comments, support and encouragement. Marife Bacate provided research assistance. +Research Associate, The China Economy Program, Crawford School of Economics and Government, The Australian National University, Canberra, ACT 0200, Australia. [email protected]++Economist, Office of Regional Economic Integration, Asian Development Bank, 6 ADB Avenue, Mandaluyong City, 1550 Metro Manila, Philippines. [email protected]+++Professor of Economics, Faculty of Business, The Hong Kong Polytechnic University, Hung Hum, Kowloon, Hong Kong, China. [email protected]

The ADB Working Paper Series on Regional Economic Integration focuses on topics relating to regional cooperation and integration in the areas of infrastructure and software, trade and investment, money and finance, and regional public goods. The Series is a quick-disseminating, informal publication that seeks to provide information, generate discussion, and elicit comments. Working papers published under this Series may subsequently be published elsewhere.
Disclaimer: The views expressed in this paper are those of the authors and do not necessarily reflect the views and policies of the Asian Development Bank (ADB) or its Board of Governors or the governments they represent. ADB does not guarantee the accuracy of the data included in this publication and accepts no responsibility for any consequence of their use. By making any designation of or reference to a particular territory or geographic area, or by using the term ―country‖ in this document, ADB does not intend to make any judgments as to the legal or other status of any territory or area.
Unless otherwise noted, $ refers to US dollars.
© 2012 by Asian Development Bank July 2012 Publication Stock No. WPS124840

Contents
. . . . . . . . . . . . . . . .
. . . . . . . . . . . . . . . . . . . . . . . . . . . . . . . . . . . . . . . . . . . . . . . . . . . . . . . . . . . . . . . . . . . . . . . . . . . . . . . . . . . . . . . . . . . . . . . . . . . . . . . . .
Abstract v
1. Introduction 1
2. Trade Between the PRC and ASEAN: Some Stylized Facts 2
3. Brief Literature Review 3
4. The Estimation Strategy: Concept, Methodology, and Data 4
4.1 Concept: Component Trade and Its Determinants 4
4.2 Gravity Model and Its Empirical Specification 5
4.3 Data 9
5. Results 10
5.1 Determinants of Bilateral Trade: Total vs. Component Trade 10
5.2 Projection of ASEAN-PRC Trade Flows from ACFTA 11
5.3 Implication for ASEAN-PRC Trade Pattern and Trade Diversion 12
6. Conclusions 13
References 15
ADB Working Paper Series on Regional Economic Integration 33
Tables
1. People‘s Republic of China and ASEAN Trade, 1984–2009 18
2. ASEAN‘s Exports to and Imports from the People‘s Republic of China, by Product, 1980–2009 19
3. ASEAN Members and the People‘s Republic of China, Trade Share (%) 20
4. Results for Bilateral (Total) Trade Flows, All Countries, 1980–2008 21
5. Results for Intra-Industry Trade Flows, All Countries, 1980–2008 22
6. Impact of ACFTA on ASEAN and the People‘s Republic of China Trade Flows (billion $ at 2008 prices) 23
7. Impact of ACFTA on ASEAN and the People‘s Republic of China Trade Pattern (billion $ at 2008 prices) 24
Figures
1. Growth in the People‘s Republic of China‘s Import from and Export to the World, 1997–2009 (%) 25
2. The People‘s Republic of China‘s Import from and Export to ASEAN, 1984–2009 (billion $) 25
3.1 Major Trading Partners of the People‘s Republic of China, 1999 & 2009 (%) 26
3.2 Major Trading Partners of ASEAN, 2009 (%) 26
4. Trade Structure of Selected ASEAN Countries with the People‘s Republic of China, 2008 (million $) 27
Appendixes
A. Derivation of the Determinants of Component Trade Flow 29
B. Data Descriptions and Sources 31

Abstract This paper uses an extended gravity model to shed light on the impact of the free trade area agreement between the Association of Southeast Asian Nations (ASEAN) and the People's Republic of China (PRC) on the members‘ trade flows and trade patterns. New determinants that capture the rising importance of global production sharing and intra-regional trade in parts and components in East Asia are proposed. Results from the extended gravity model show that the free trade agreement leads to substantially higher bilateral trade between ASEAN and the PRC, more than what a conventional gravity model predicts. The increase is concentrated in the ASEAN countries with stronger industrial linkages with the PRC. Keywords: ACFTA, gravity model, parts and components trade. JEL Classification: F17, O53


The Impact of ACFTA on People's Republic of China-ASEAN Trade | 1
1. Introduction The Association of Southeast Asian Nations (ASEAN)—the People‘s Republic of China (PRC) free trade agreement or ACFTA came into effect on 1 January 2010. It covers a free trade area with the highest population (1.9 billion) and an economic size next only to that of the North American Free-Trade Area (NAFTA) and the European Union (EU). As part of the agreement, the average tariff on ASEAN-origin exports to PRC was lowered from 9.8 percent to 0.1 percent in 2010, while the average tariff on PRC-origin exports to the six original ASEAN members—Brunei Darussalam, Indonesia, Malaysia, the Philippines, Singapore and Thailand—was reduced from 12.8 percent to 0.6 percent. By 2015, the policy of zero-tariff rate for 90 percent of Chinese goods is expected to extend to the four new ASEAN members—Cambodia, the Lao People‘s Democratic Republic (PDR), Myanmar and Viet Nam (Xinhuanet 2010). Numerous studies and reports have documented the benefits, opportunities, and challenges of ACFTA to its member countries (Chia 2005; Tongzon 2005). A key challenge is that ACFTA may intensify competition among member countries and lead to significant job losses. It may also reduce social welfare if the effects of trade diversion dominate trade creation. Still, the main attraction of ACFTA is that it offers vast opportunities and benefits to consumers and firms in member countries. Consumers benefit from having access to a wide variety and cheaper products and produce. Many ASEAN firms in particular can tap more easily into the Chinese market, the fastest growing market in the world. The removal of tariffs also allows freer flows of intermediate goods between the two regions, benefiting producers at every stage of production and deepening regional economic integration. Because of the increased significance of production fragmentation in both regions, it is therefore useful to investigate more closely how the free trade agreement will eventually reshape production and trade relationships between the PRC and the ASEAN countries. By using an extended gravity model that takes into account bilateral imports, exports and related trade in parts and components between the PRC and the ASEAN countries, we note that ACFTA affects bilateral trade in parts and components via an additional channel of cross-country industrial linkages. We conjecture that if trade between member countries is mainly in components, then the formation of the free trade area is likely to generate more opportunities than if trade was in final goods alone. The additional trade opportunities come from the finer specializations in the production chain due to trade liberalization. This view is relatively novel and complement existing studies using computable general equilibrium (CGE) models and gravity models (Chirathivat 2002; Roberts 2004; Park et al. 2008; Park et al. 2010). The existing studies generally assume that trade flows between countries are mainly in final goods and are therefore determined by conventional factors such as country size and its living standards. However, they may underestimate the impact of a free trade area if the nature of trade among member countries has a large and growing proportion of component trade as in the case of ACFTA. This paper aims to investigate (1) how trade in parts and components may differ from trade in final goods as a consequence of ACFTA; (2) how much trade flows and trade pattern between the PRC and the ASEAN countries would change after ACFTA; and (3)
2 | Working Paper Series on Regional Economic Integration No. 99
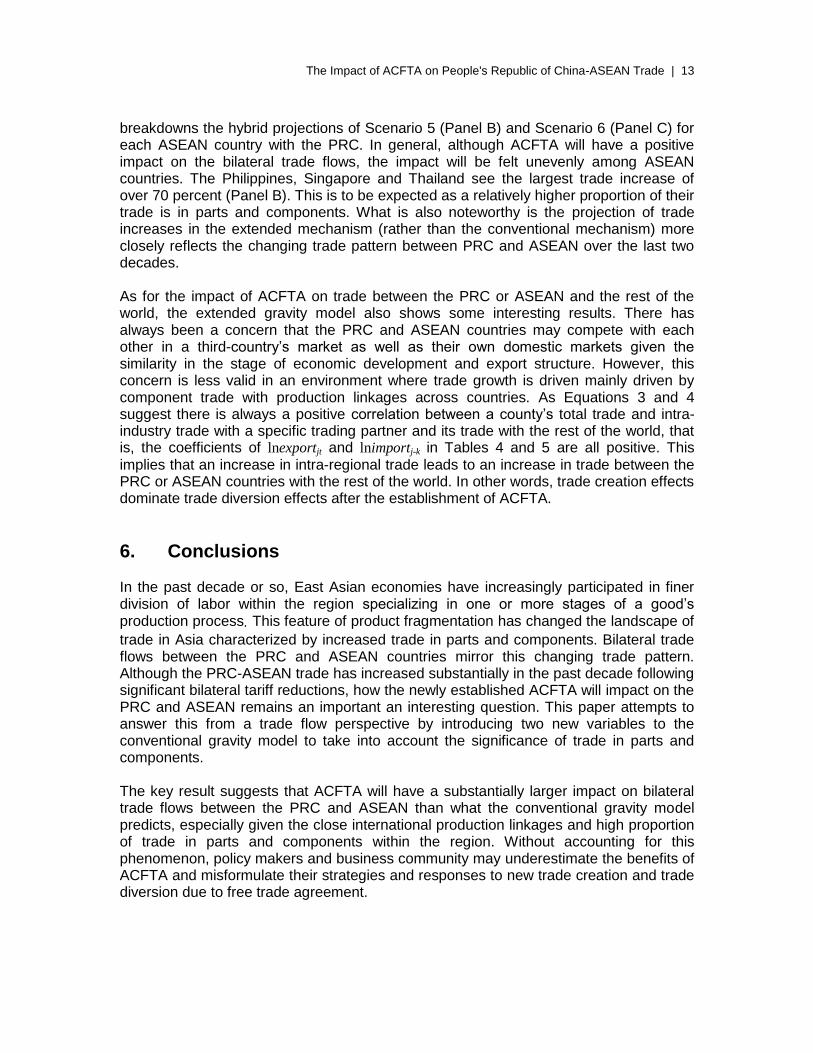
whether greater integration between the PRC and ASEAN would threaten trade between the PRC or ASEAN with non-member countries. The main results are as follows. First, by explicitly accounting for component trade, ACFTA will have a substantially larger impact on the trade flows between the PRC and ASEAN than what the existing literature predicts—around 25 per cent more (US$343 billion at 2008 constant prices), which is more than double the existing projections in Chirathivat (2002), and Lee and Mensbrugghe (2007). Second, the larger trade flows between the two regions are more likely to be in parts and components and concentrated among a sub-group of member countries with stronger industrial linkages. This implies that industries in ASEAN and the PRC will become more closely integrated. Finally, trade creation in component trade between the two regions will generate positive spillovers to the rest of the world. This comes about because finer specializations in the production chain also involve countries outside ACFTA. These trade creation effects may in turn offset trade diversion effects and further improve the social welfare in both the PRC and ASEAN. The paper is organized as follows. The next section provides an overview of trade between PRC and ASEAN. Sections 3 and 4 review the theory, empirical model and data sources. Section 5 reports the results and section 6 concludes.
2. Trade between the PRC and ASEAN: Some Stylized Facts Bilateral trade flows between the PRC and ASEAN have grown rapidly in absolute terms as well as in its relative importance to each other‘s total trade (export plus import). Parallel to the rapid expansion of the PRC‘s exports and imports between 1998 and 2008 (Figure 1) was the significant increase in bilateral trade with ASEAN, especially after the PRC‘s accession to the World Trade Organization (WTO) in 2001 (Figure 2). In 1998 total trade between the PRC and ASEAN amounted to about $24 billion (Table 1). It increased nearly ten-fold to $231 billion in 2008, averaging more than 20 percent in annual growth. In addition, trade between the PRC and ASEAN has become more important to each other‘s total trade. Between 1999 to 2009 ASEAN‘s share in the PRC‘s total trade increased markedly, while the share of the US and Japan, the PRC‘s major trading partners fell (Figure 3.1). In 2009, ASEAN became the PRC‘s fourth largest trading partner accounting for 10.2 percent of the PRC‘s total trade, which is close to Japan‘s share. And in 2009, the PRC became ASEAN‘s largest trading partner outside of ASEAN (Figure 3.2). The PRC also became ASEAN‘s largest source of imports (accounting for 13.3% of total imports) and third largest export market (accounting for 10.1% of total exports). In terms of bilateral trade pattern, there has been a shift from primary goods to manufacturing goods. From 1978 when PRC initiated the open-door policy to the 1997 Asian financial crisis, inter-industry trade of commodity goods was the dominant feature of the bilateral trade. For instance in 1985, trade in agricultural and mineral goods accounted for more than half of total ASEAN exports to and imports from PRC at 55 and 83 percent, respectively (Table 2). More recently, however, intra-industry trade in manufactured goods has grown in importance. This is most apparent in the rapid growth

The Impact of ACFTA on People's Republic of China-ASEAN Trade | 3
of the share of machinery and transport equipment in total ASEAN exports to PRC from 18% in 1980 to 49% in 2005 and its share in total ASEAN imports from PRC from 8% to 57% in the same period. Compared to the rest of the world, trade in parts and components (fragmentation trade) has accounted for the bulk of the total trade growth in the Asia-Pacific region, in particular between ASEAN and the PRC (Uchida 2008; Li 2009; Athukorala 2011). 1 In 2004, parts and components accounted for 33.5 percent of the total manufacturing export of East Asian countries, such as Malaysia, the Philippines, Singapore and Thailand, while only 20.9 percent for EU, and 30.7 percent for NAFTA countries (Athukorala and Yamashita 2006). This change in the trade flows and trade pattern reflects the change in international production from the traditional pattern of producing a good from start to finish in one country to production fragmentation, where production processes are carried out in stages dispersed across multiple economies. For example, to meet an order for 10,000 shirts from a retailer in the US, a trading company sources the yarn from a factory in the Republic of Korea. It then dyes and weaves the fabric in factories in Taipei,China. And finally, the cutting, sewing and trimming of the shirts are done in Thailand where labor, capacity and skills have an advantage (Fung 2005). The bilateral trade between ASEAN and the PRC is dominated by several countries and, despite some country differences, reinforcing the previous discussion, are mostly in parts and components trade. Singapore, Malaysia, Thailand, and Indonesia together account for more than 80 percent of either ASEAN‘s imports or exports with the PRC in 1980 to 2009 (Table 3).2 In addition, the bulk of the trade (exports and imports) between Malaysia, Singapore, Thailand and the PRC are concentrated in two sectors (Figure 4): machinery and mechanical appliances and their parts and components (HS 84); and electrical machinery and equipment and their parts and components (HS 85).3 That said, inter-industry trade remains important in some products. Malaysia continues to be a net exporter of animal or vegetable fats and oils to the PRC, while Thailand, of plastics and articles thereof.
3. Brief Literature Review Interests in the economic impact of ACFTA on the PRC and ASEAN are evident from the growing number of studies in the literature. The two most common methodologies used to study the impact of free trade area on countries are the CGE models and gravity models. Using the CGE approach, Chirathivat (2002), Lee and Mensbrugghe (2007), Kawai and Wignaraja (2008), and Park et al. (2009) apply the Global Trade Analysis Project (GTAP) model or the Global Trade and Economic Analysis (GTEM) model to project trade and economic effects of ACFTA in the Asia-Pacific region. Results from
1 For example in Athukorala (2011), the author shows that trade in parts and components has grown
faster than total world trade in manufacturing and that this phenomenon is most apparent in East Asia than anywhere else in the world.
2 From henceforth, ―ASEAN imports‖ refers to ―total ASEAN imports from PRC‖ and ―ASEAN exports‖
refers to ―total ASEAN exports to PRC‖, unless otherwise specified. 3 ―HS‖ refers to the Harmonized Commodity Description and Coding System or Harmonized System in
short.

4 | Working Paper Series on Regional Economic Integration No. 99
these studies suggest that ACFTA generates a linear pattern of trade creation among member countries either through tariff cuts (supply-side factor) or increases in GDP (demand-side factor), where the net effect is estimated around 20 to 40 percent. On the other hand, Roberts (2004) and Yuan (2010) use the gravity model and stimulate different scenarios of income increases and/or tariff reductions.4 Estimated results from these studies, although different in magnitude from the CGE studies, generally confirm a linear growth trajectory of trade between the PRC and ASEAN. Although both the CGE and gravity models provide estimates of bilateral trade impacts of ACFTA, they have their limitations. CGE results are based on estimated coefficients not accounted for in the model and thus cannot be statistically verified. More important, projections from the model do not distinguish between trade in parts and components and trade in final goods. As to be discussed later, the impact of a free trade agreement on final goods trade differs from its impact on components trade. Since the actual bilateral trade between the PRC and ASEAN comprise mainly of parts and components, studies that do not account for these are likely to generate misleading results. The gravity model, on the other hand, has an advantage over the CGE models for not relying on many demand and substitution elasticities (which are obtained externally) for simulation. Thus, it is more straightforward to provide statistical estimation on the impact of free trade agreement on bilateral trade. Nevertheless, the conventional gravity model still does not capture the salient feature of rising trade in parts and components. It ignores the increased component trade in the machinery and transport equipment industries, wherein a large number of multi-layered vertical production processes take place. Therefore, this paper contributes to the literature by extending the gravity model to explicitly account for the production linkages inherent in components trade.
4. The Estimation Strategy: Concept, Methodology, and Data
4.1 Concept: Component Trade and Its Determinants Standard trade theories posit that productivity and comparative advantage differences across countries are key drivers of international trade. Empirically these drivers have done well in explaining the inter-industry trade between developed and developing countries (Leontief 1953; Leamer 1980; Trefler 1995). A third driver under the ambit of new trade theory (Krugman 1979 and 1980) emphasizes the role of market structure and behavior of firms in determining intra-industry trade among countries. It has also been used to explain trade patterns among countries arising from cross-country industrial linkages through vertical-specialization or product-fragmentation. Gonzales and Holmes (2011) review the theoretical underpinnings of vertical specialization and global trade and summarize studies in this area. Three characteristics of component trade and its impact on trade creation are worth highlighting. First, its growth may follow a different path (perhaps exponentially) in contrast to the growth in final goods trade (linearly) (see Appendix A for details). Second,
4 The gravity model has also been widely used in analyzing the effects of regional trade blocs (Frankel et
al. 2007) and WTO membership (Rose 2004; Subramaniam and Wei 2007).

The Impact of ACFTA on People's Republic of China-ASEAN Trade | 5
the pattern of new component trade among trading partners is likely to be determined by cross-country industrial linkages along with their comparative advantages, which are determined by endowment and relative productivity. Third, trade with the rest of world may increase since non-member countries may also be involved in the production chain, which in turn reduces the trade diversion effects of a free trade area. Intuitively, when a country specializes in finer stages of a global production chain, it sources different complementary components from different trading partners. This means when trade in parts and components increases between two member countries in a newly formed free trade area, part and component trade with other countries in the global production chain also increases. This is even more important if trade liberalizations encourage deeper production specialization. That is, importing more parts and components raises productivity and reduces cost of intermediate inputs, which in turn strengthens a country‘s comparative advantage in specific stages of global production chain. Thus, an increase in imports of parts and components from a member country leads to an increase in imports in other parts and components from either the same or different member countries (or even countries outside the free trade area). At the same time, because of the lower cost of production, there are more exports of either parts and components or final goods to the same or different member countries or even the rest of the world. The well-known story of making iPod is a good example of global production sharing that offers increased trade opportunities for countries within and outside a free trade area. While it is not easy to tell which country really makes the Apple iPod, one thing is clear, it is not US (Varian 2007). The 451 parts that go into making an iPod are made in many countries, mostly in Asia. iPod‘s hard drive is manufactured by Toshiba in the Philippines and the PRC. Its display module, video/multimedia processor chip and the controller chip are made in Taipei,China, while the final assembly is done in the PRC. Given the deep production linkages of making iPods in Asia, an additional unit demand of iPod say from the US will increase the PRC‘s import of iPod‘s hard drive from the Philippines and the display module, video/multimedia processor chip and the controller chip from Taipei,China. At the same time, since they are other components that go into making the hard drive, display module and video/multimedia/controller chips, the Philippines and Taipei,China will in turn import these components from other countries. Thus, component trade generates more trade opportunities by strengthening industrial linkages between trading partners. This underlines the non-linear trend of trade flows between ASEAN and the PRC that more closely mimics the observed growth in parts and components trade. Also, this underlines the need to better account for the characteristics of part and component trade in the gravity estimations.
4.2 Gravity Model and Its Empirical Specification The gravity model was developed by Tinbergen (1962), Linnemann (1966), Pöyhönen (1963), and Pulliainen (1963). Today, it is ―probably the most successful empirical trade device….and usually produces a good fit‖ (Anderson 1979, p.106). Its theoretical foundations can be found in Anderson (1979), Helpman and Krugman (1985), Bergstrand (1985), and Deardorff (1998).

6 | Working Paper Series on Regional Economic Integration No. 99
The basic empirical model specification in this paper follows Rose (2004), and Subramanian and Wei (2007):
0
1 2 3
1 2
ln
_ _
ln exp ln
h m njkt h jt m kt n jkt
h m n
jkt jt kt
jt j kt t t jkt
t
import M X Z
FTA WTO M WTO X
ort import DT
, (1)
where lnimportjkt is the natural logarithm of the value of country j‘s import from country k
at time t. This variable is used as the dependent variable rather than total trade between
j and k in order to distinguish the asymmetric impact of free trade agreement on
importing and exporting countries (Subramanian and Wei 2007). Besides, in practice, the balance in the balance of payments for a pair-wise trading partner is often not the same. Mjt‗s and Xkt‗s consist of time-varying importer- and exporter-specific variables,
respectively. These variables are the natural logarithm of GDP and GDP per capita, which are used to capture importer- and exporter-specific characteristics such as economic size, income level and consumer preferences (Anderson and Wincoop 2003). In particular, GDP serves as a proxy for production capacity for an exporter or market size for an importer, while GDP per capita serves as a proxy for income level and consumption preference. Zjkt‘s are variables used to proxy for ―multilateral resistance‖ or transaction costs associated with trading. They include greater circle distance between j and k, and dummies for common language, shared borders and islands. WTO_Mjt is a dummy variable for importer j who is a WTO member, while WTO_Xkt is a dummy variable for exporter k who is a WTO member. FTAjkt is a dummy variable that takes on a value of one if j and k belong to a common free trade area or common market in year t. Also, DTt is a year dummy to control for time-specific effects.
The aforementioned are the standard variables in a gravity model. To better capture the features of part and component trade, two additional variables are introduced. The first is the natural logarithm of an importer‘s total imports from the rest of the world, lnimportj-kt, and the other is the natural logarithm of an importer‘s total exports, lnexportjt. The first
variable is used to account for complementary or substitution effects of trade between a trading country-pair and a third country. Eichengreen et al. (2007) use this to study how exports from Asia (excluding the PRC) to other countries are affected by rising exports from the PRC to the same markets. Mulapruk and Coxhead (2005) provide theoretical justification for using this variable and its sign to identify a country‘s comparative advantage. Here, we use it only for substitutability or complementarity of products. The substitution effect dominates if country k and the rest of the world, –k, competes with each other, that is, the coefficient of lnimportj-kt is negative. If country j increases its imports from –k and, –k competes with k, then j will import less from k. On the other hand, the complementary effect dominates if j increases its imports from –k at the same time as its imports from k, that is, the coefficient of lnimportj-kt is positive. The iPod example is
instructive. To meet an increase for iPod, factories in the PRC will increase their imports of hard drives from the Philippines together with their imports of video/multimedia processor chip from Taipei,China (a third country).

The Impact of ACFTA on People's Republic of China-ASEAN Trade | 7
The second variable (lnexportjt) is used to capture the sensitivity of imports in parts and
components in response to changes in an importer‘s exports. Consider a case where export of hard-disks by a member country (say Thailand) rises in response to an increase in demand from a non-member country (say the US). If inputs into the hard-disks are produced and exported by another member country (say the PRC), then Thailand will import more of these parts and components from the PRC—higher exports from Thailand contribute to higher imports of parts and components from the PRC. In this way, trade in parts and components plays a vital role in expanding trade within and outside a free trade area due to the existence of cross-country production linkages among member countries and between member and non-member countries. Thus, if product fragmentation and component trade are important, then the coefficient of lnexportjt is expected to be positive and significant—an increase in exports results in an
increase in the demand for its parts and components, which are being imported.
Appendix A discusses how changes in lnimportj-kt and lnexportjt, affect lnimportjkt through
the outsourcing effects of component trade. Note that component trade is only a necessary but not sufficient condition for the coefficient of lnimportj-kt to be positive since there is also the substitution effect among trading partners. It is also important to note that the outsourcing effects may not be limited to the initial trading partners, that is, between the PRC and Thailand. Given the industrial linkages between the PRC or Thailand with other countries, a free trade agreement between the two countries can also generate additional demand for components from the rest of world—trade externality.
Although Equation 1 can be used to examine total bilateral trade flows, it cannot be used to test the hypothesis on trade creation that is specific to component trade. More specifically, lnimportjkt does not clearly differentiate between trade in parts and
components, which is of interest, from trade in final goods. The ideal solution is to split total trade into final good trade and component trade and use the latter as the dependent variable. However, there is no general agreement on the definition of component trade (Athukorala and Yamashita 2006). Practically, it is also difficult to calculate bilateral component trade for all paired countries. Fortunately, component trade is usually classified into the same industry according to the standard international trade code (SITC) given the similar nature of the type of trade. From a statistical perspective, bilateral component trade is highly correlated to bilateral intra-industry trade (Grimwade 2000). Thus, the bilateral intra-industry trade can be used as an approximation to the bilateral component trade. In this paper, the value of bilateral intra-industry trade is defined as the product of the intra-industry trade index (at 3-digit level, SITC Rev.1) and the value of bilateral imports used for lnimportjkt in Equation 1. This value of intra-industry trade is used as the
dependent variable that approximates the bilateral component trade. Thus, the extended gravity model can be re-estimated as follows:

8 | Working Paper Series on Regional Economic Integration No. 99
0
1 2 3
1 2
ln _
_ _
ln ln
h m njkt h jt m kt n jkt
h m n
jkt jt kt
jt j kt t t jkt
t
intra import M X Z
FTA WTO M WTO X
export import DT
, (2)
where lnintra_importjkt is the logarithm of the value of intra-industry imports of country j from country k at time t. The other variables are defined as in Equation 1.
The magnifying effect of the formation of a FTA on components trade of country j through lnimportj-kt and lnexportjt, is captured by the trade multiplier that is derived in
Appendix A, which is based on the extended gravity model similar to Equation 2 above. The multiplier shows that the overall impact of FTA on the volume components trade is not determined solely by θ1; π1 and π2 play significant roles. Since Equation 2 examines
the determinants of component trade using the same model specification as Equation 1, we can compare the estimated coefficients of FTAjkt, lnimportj-kt and lnexportjt in both
equations to see whether Equation 2 can better explain variations in component trade. Specifically, if the estimated coefficient of FTAjkt, θ1, is smaller in Equation 2 than in Equation 1, this suggests that the conventional trade determinant (FTAjkt)—defined as the relationship between FTAjkt and bilateral trade flow—cannot explain component (or
intra-industry) trade flows as well as for total trade. Put differently, FTA contributes to a smaller change in component trade compared to total trade. Therefore, for Equation 2 to better explain component (or intra industry) trade, it must account for the intrinsic characteristics of cross-country production linkages. This suggests that the estimated coefficients π1 and π2 in Equation 2 should be larger than those in Equation 1.5
As a benchmark, Equations 1 and 2 are first run as pooled OLS regressions. Later as comparisons, panel random and fixed effect regressions are applied. Heteroscedasticity robust standard errors are used in all estimations.6 Wang et al. (2010) contends that the panel fixed effect regression that controls for the trade-pair fixed effect (or assume εjkt=ujk+vjkt) may still lead to biased estimates. This is because the trade-pair fixed effect (ujk) may come from trading partners‘ country specific characteristics (ηj and ηk), which are more likely to be correlated with the explanatory variables such as Mjt and Xkt.
Incorrectly specifying the source of fixed effects may lead to endogeneity problem, such that E(Xjktεjkt) = E[(Xjkt)( ηj + ηk – ujk)] ≠ 0 or the ―gold medal error‖ as described by Baldwin
and Taglioni (2006). To address this, the equations are estimated with country-specific fixed effects (or assume εjkt= ηj + ηk + vjkt ) as follows:
5 More detailed information on the trade multiplier effect involving π1 and π2 is discussed in Appendix A.
6 Autocorrelation is unlikely to be an issue considering the small estimated sample period, see data
section.

The Impact of ACFTA on People's Republic of China-ASEAN Trade | 9
0
1 2 3
1 2
ln
_ _
ln ln
h m njkt h jt m kt n jkt
h m n
jkt jt kt
jt j kt t t
t
j j k k jkt
j k
import M X Z
FTA WTO M WTO X
export import DT
D D
, (3)
0
1 2 3
1 2
ln
_ _
ln ln
h m njkt h jt m kt n jkt
h m n
jkt jt kt
jt j kt t t
t
j j k k jkt
j k
intra_import M X Z
FTA WTO M WTO X
export import DT
D D
, (4)
where Dj and Dk are a group of dummies for country-specific effects.
4.3 Data This study uses unbalanced panel data of bilateral trade flows, income, population, distance, geographical, cultural and historical information and a few other group-specific measures. The data from 1980 to 2000 are obtained directly from Subramanian and Wei (2007). For the period 2001 to 2008, they are updated based on the International Monetary Fund (IMF)‘s Direction of Trade Statistics (DOTS) for the trade data and the World Bank‘s World Development Indicator (WDI) for the income and population data. Bilateral import values (c.i.f. price) are based on the records of the importing countries, measured in US dollar and deflated by the US CPI for urban areas (1982 price). Geographical variables, dummies for WTO and FTA memberships and other dummies are taken from Subramanian and Wei (2007) and updated to incorporate the PRC‘s accession to WTO. Bilateral intra-industry trade is measured using the bilateral intra-industry index from the Australian National University (ANU)‘s International Economic Data Bank (IEDB). It is calculated based on the bilateral trade data at the 3-digit level (ISTC Rev. 3). The dataset consists of 76,417 observations covering 117 countries for every five-year period from 1980 to 2008, except the last one, which is from 2005 to 2008. This gives 6 five-year blocks of data for estimations. We follow Subramanian and Wei (2007) in using the five-year average to smooth the year-to-year fluctuations of bilateral trade flows and to make the estimations and projections more reflective of long-term trend. Appendix B provides more detailed information on the data and their sources.

10 | Working Paper Series on Regional Economic Integration No. 99
5. Results
5.1 Determinants of Bilateral Trade: Total vs. Component Trade Controlling for country-pair effects is important as pooled OLS estimates are inherently biased. Table 4 shows the results for bilateral trade where the dependent variable is lnimportjkt under the different estimation methods (columns): (i) pooled OLS; (ii) panel
fixed effects; (iii) panel random effects; and (iv) panel country-specific effects. Specifically, columns one to three are estimated based on Equation 1, while column four, on Equation 3. For the pooled OLS model, the estimated coefficients for most explanatory variables are overestimated due to potential correlation between the country-pair/country-specific fixed effects and the explanatory variables as discussed above. After controlling for the country-pair effects (columns two and three), the R2 has generally become larger suggesting improvements in the results. Controlling for country-specific effects instead of country-pair effects appears to further reduce the biasness. There may still be some country-specific fixed effects in the residuals which are correlated with the explanatory variables. Thus, country-specific fixed effects are controlled for by estimating Equation 3. Compared with columns one to three, column four is the preferred specification—most of the coefficients have the expected signs and are statistically significant consistent with previous literature (Baldwin and Taglioni 2006; Subramanian and Wei 2007). In particular, the coefficients of FTAjkt and lnimportj-kt are smaller, which suggests the country-specific fixed effects are
important and should be controlled for. Also, the R2 is 0.831, higher than those obtained from the other specifications. The ensuing discussion will focus on the results from the panel country-specific effect model. All the standard gravity variables have the expected sign and statistically significant. GDP and GDP per capita of both importing and exporting countries are positive and significant. This is consistent with the theory that GDP per capita has a positive effect on bilateral trade flows over and above that of GDP. The negative coefficient of ln(distance)
indicates that the longer geographical distance between two countries, the lesser is the trade between them. Economies which share a common language and border also trade more with each other. So do economies within the same free trade area—bilateral trade increases by around 38.8 percent if both countries belong to the same FTA. Similarly, the proposed variables are significant and positive. Total exports of country j (lnexportjt) and its imports from the rest of the world (lnimportj-kt)—are both positive and
significant at 5 percent and 1 percent levels respectively. An increase in the total exports of country j increases its imports from country k by about 4.6 percent, while an increase of country j‘s imports from the rest of the world raises its imports from country k by a
notable 37.3 percent. This suggests with product fragmentation and increasing proportion of trade in parts and components in the total trade, importing country‘s trade (including both import and export) with the rest of the world tends to generate more bilateral trade between trading partners (especially trade in component) through the cross-country industrial linkages. In particular, the significantly positive coefficient of lnimportj-kt implies that complementary effects generally dominate substitution effects in

The Impact of ACFTA on People's Republic of China-ASEAN Trade | 11
bilateral trade flows—since imports from country k increases alongside imports from the rest of the world (-k).
The extended gravity model explains component trade reasonably well. Table 5 presents the results using bilateral intra-industry trade as the dependent variable as per Equations 2 and 4. Recall, these regressions are meant to examine how well the extended gravity model explains component trade vis-à-vis total trade. For brevity, the discussion focuses on the most preferred specification of column four. By and large, the coefficients for the standard variables (GDP, GDP per capita, distance, etc.) are similar to those from the same column in Table 4.7 However, the coefficient of FTAjkt in Table 5 (0.225) is smaller
than in Table 4 (0.388). This is consistent with the hypothesis that the conventional trade determinant has less power in explaining component trade (or intra-industry trade). Also, the coefficient of the importer‘s total exports (lnexportjt) is more important in determining
the imports of parts and components (0.140 in Table 5) than total imports (0.046 in Table 4). On the other hand, the coefficient of the importer‘s imports from other countries (lnimportj-kt) in Table 5 (0.184) is lower than in Table 4 (0.373), which suggests an
importer‘s imports are more likely to come from total trade rather than component trade. In other words, substitution effects between countries may be stronger for component trade than final good trade. These effects seem to dampen the trade creation effects due to cross-country industrial linkages. Estimates of the proposed variables are useful for trade projection, when they are converted into trade creation multipliers. Although the estimated trade creation multiplier (namely, 1/(1-2π1-π2) from the coefficients of lnexportjt and lnimportj-kt in Table 5 (1.86) is
similar to that in Table 4 (1.87), their positive and statistically significant signs support the importance of cross-country industrial linkages in creating more trade. As such, it is beneficial to use these estimates to project trade flows between member countries arising from ACFTA, where such phenomenon is known to be most prevalent.
5.2 Projection of ASEAN-PRC Trade Flows from ACFTA Projections of bilateral imports, exports and total trade are made under six scenarios. Real values of these variables for 2008 are used as base. Three methods of projection are adopted: (1) conventional, (2) new, and (3) hybrid. Each method has two projections based on the estimates of Equations 3 and 4. Hence, this produces the six scenarios. 8
For the conventional method, the first projection is calculated as: θ1 basee , where θ1
is the coefficient of FTAjkt from Equation 3, while the second projection uses the same formula but with θ1 taken from Equation 4. These are presented in the top half (Scenario
1) and bottom half of column two (Scenario 2), Table 6, respectively. The new method, on the other hand, uses the estimated coefficients of lnexportjt and lnimportj-kt in addition to the estimated coefficient of FTAjkt based on Equation 3 (column 3, top half, Scenario
3) and Equation 4 (column 3, bottom half, Scenario 4). It is calculated as: 1,3
1 2base ( base base) / (1 2 )e , where π1 and π2 are the estimated coefficients of
7 Interestingly, economies with common language have more bilateral component trade (or intra-industry
trade) with each other. A possible explanation is that countries with common language and similar culture are more likely to establish vertical linkages through production specialization.
8 The hybrid method will be discussed below.

12 | Working Paper Series on Regional Economic Integration No. 99
lnexportjt and lnimportj-kt based on Equations 3 or 4, and (1–2π1–π2) is the trade multiplier
(as per Appendix A). Two differences of the four projections are worth highlighting. First, the main difference between the conventional and new projections is that the former assumes a one-off trade creation effect after the formation of a free trade area, while the latter assumes a multiplicative impact through greater trade opportunities in parts and components arising from the international industrial linkages. As alluded to above, after the free trade agreement, firms may reallocate their production among member countries and specialize further in the finer stages of production chain. This generates more trade among member countries. Moreover, as member countries are more closely linked together, an increase in demand for a final good will lead to more imports as well as exports by member countries, since the production of this unit of final good requires parts and components from different countries (member and non-member). The effect of this is a multiplicative process of trade growth. Second, the main difference between the two projections of the new method is that the first is based on the total trade model (Equation 3), which does not differentiate between final or component trade, while the second on the intra-industry model (Equation 4), which specifically accounts for component trade. Thus, trade projection for component trade can be more accurate using the coefficients of lnexportjt and lnimportj-kt from Equation 4.
The hybrid method of projections is used to distinguish between final and component goods in the projections of total trade, imports and exports, unlike the conventional and new methods which make no such differentiation. In particular, the two hybrid projections are: Scenario 5 = [(Scenario 1) × 1–weight)] + [(Scenario 3) × weight]; and Scenario 6 = [(Scenario 2) × 1–weight)] + [(Scenario 4) × weight],
where weight for each ASEAN country is obtained from Athukorala (2011), which is the
proportion of component goods in total trade. Note that only the component share of trade (weight) is subject to multiplier effects, that is, the third right-hand term of Scenarios 5 and 6 take into account the multiplier effects from lnexportjt and lnimportj-k of Equations
3 and 4 respectively. In essence, the hybrid method attempts to differentiate the two types of trade in approximating the overall trade creation effects of ACFTA. Results from Table 6 show both the new and hybrid methods projecting a larger trade increase than the conventional method. For instance, total ASEAN and PRC trade could increase by as much as 47 to 89 percent according to the new method. While the hybrid method shows an increase by about 39 to 72 percent. The conventional method projects a smaller increase of 25 to 47 percent. This highlights that ACFTA will encourage more trade between the PRC and ASEAN than what the traditional gravity model predicts.
5.3 Implication for ASEAN-PRC Trade Pattern and Trade Diversion The increased trade flows from ACFTA will impact differently on different ASEAN economies. As the extended gravity model hypothesized, the newly created bilateral trade will concentrate in countries with a higher proportion of component trade. Table 7
The Impact of ACFTA on People's Republic of China-ASEAN Trade | 13
breakdowns the hybrid projections of Scenario 5 (Panel B) and Scenario 6 (Panel C) for each ASEAN country with the PRC. In general, although ACFTA will have a positive impact on the bilateral trade flows, the impact will be felt unevenly among ASEAN countries. The Philippines, Singapore and Thailand see the largest trade increase of over 70 percent (Panel B). This is to be expected as a relatively higher proportion of their trade is in parts and components. What is also noteworthy is the projection of trade increases in the extended mechanism (rather than the conventional mechanism) more closely reflects the changing trade pattern between PRC and ASEAN over the last two decades. As for the impact of ACFTA on trade between the PRC or ASEAN and the rest of the world, the extended gravity model also shows some interesting results. There has always been a concern that the PRC and ASEAN countries may compete with each other in a third-country‘s market as well as their own domestic markets given the similarity in the stage of economic development and export structure. However, this concern is less valid in an environment where trade growth is driven mainly driven by component trade with production linkages across countries. As Equations 3 and 4 suggest there is always a positive correlation between a county‘s total trade and intra-industry trade with a specific trading partner and its trade with the rest of the world, that is, the coefficients of lnexportjt and lnimportj-k in Tables 4 and 5 are all positive. This
implies that an increase in intra-regional trade leads to an increase in trade between the PRC or ASEAN countries with the rest of the world. In other words, trade creation effects dominate trade diversion effects after the establishment of ACFTA.
6. Conclusions In the past decade or so, East Asian economies have increasingly participated in finer division of labor within the region specializing in one or more stages of a good‘s production process. This feature of product fragmentation has changed the landscape of
trade in Asia characterized by increased trade in parts and components. Bilateral trade flows between the PRC and ASEAN countries mirror this changing trade pattern. Although the PRC-ASEAN trade has increased substantially in the past decade following significant bilateral tariff reductions, how the newly established ACFTA will impact on the PRC and ASEAN remains an important an interesting question. This paper attempts to answer this from a trade flow perspective by introducing two new variables to the conventional gravity model to take into account the significance of trade in parts and components. The key result suggests that ACFTA will have a substantially larger impact on bilateral trade flows between the PRC and ASEAN than what the conventional gravity model predicts, especially given the close international production linkages and high proportion of trade in parts and components within the region. Without accounting for this phenomenon, policy makers and business community may underestimate the benefits of ACFTA and misformulate their strategies and responses to new trade creation and trade diversion due to free trade agreement.

14 | Working Paper Series on Regional Economic Integration No. 99
In addition, since ACFTA has asymmetric impacts on trade in final goods and trade in parts and components, the extended gravity model that adjust for trade in parts and components can shed light on the trade pattern between the PRC and individual ASEAN countries. Generally, as expected the higher the proportion of component trade in the bilateral trade between member countries, the larger is the increase in bilateral trade flows after the formation of ACFTA. Finally, since trade in parts and components is usually complementary among member countries (driven by the international production linkages), trade creation may dominate trade diversion effects.

The Impact of ACFTA on People's Republic of China-ASEAN Trade | 15
References J.E. Anderson. 1979. A Theoretical Foundation for the Gravity Equation. American
Economic Review. 69 (1). pp. 106–116. J.E. Anderson and E. van Wincoop. 2003. Gravity with Gravitas: A Solution to the Border
Puzzle. American Economic Review. 93 (1). pp. 170–192. P.C. Athukorala and N. Yamashita. 2006. Production Fragmentation and Trade
Integration: East Asia in a Global Context. The North American Journal of Economics and Finance. 17 (3). pp. 233–256.
P.C. Athukorala. 2011. Production Networks and Trade Patterns in East Asia:
Regionalization or Globalization. Asian Economic Papers. 2011 (10). pp. 65–95. R. Baldwin and D. Taglioni. 2006. Gravity for Dummies and Dummies for Gravity
Equations. NBER Working Paper Series. 12516. Cambridge, MA: National Bureau of Economic Research.
J.H. Bergstrand. 1985. The Gravity Equation in International Trade: Some
Microeconomic Foundations and Empirical Evidence. Review of Economics and Statistics. 67 (3). pp. 474–481.
S.Y. Chia. 2005. ASEAN–China* Economic Competition and Free Trade Area. Asian
Economic Papers. 4 (1). pp. 109–147. S. Chirathivat. 2002. ASEAN–China* Free Trade Area: Background, Implications and
Future Development. Journal of Asian Economics. 13 (5). pp. 671–686. A.V. Deardorff. 1998. Determinants of Bilateral Trade: Does Gravity Work in a
Neoclassical World? In J. Frankel, ed. The Regionalization of the World Economy. Chicago: University of Chicago Press.
B. Eichengreen, Y. Rhee, and H. Tong. 2007. China and the Exports of Other Asian Countries. Review of World Economics. 143 (2). pp. 201–226.
J. Frankel, E. Stein, and S.J. Wei. 1997. Regional Trading Blocs in the World Economic
System. Washington, DC: Institute for International Economics. V. Fung. 2005. Business Perceptions and Expectations Regarding the WTO Doha
Negotiations. APEC Economies Newsletter. 9-12. Asia Pacific School of Economics and Government, Australian National University.
J.L. Gonzalez and P. Holmes. 2011. The Nature and Evolution of Vertical Specialization:
What is the Role of Preferential Trade Agreements? NCCR TRADE Working Paper. 2011-2041.
9 ADB recognizes this member by the name People‘s Republic of China.

16 | Working Paper Series on Regional Economic Integration No. 99
N. Grimwade. 2000. International Trade: New Patterns of Trade, Production and Investment. 2nd ed. New York: Routledge. p. 71.
E. Helpman and P. Krugman. 1985. Market Structure and Foreign Trade. Cambridge,
MA: MIT Press. M. Kawai and G. Wignaraja. 2008. Regionalism as an Engine of Multilateralism: A Case
for a Single East Asian FTA. ADB Working Paper Series on Regional Economic Integration. 14. Manila: Asian Development Bank.
P. Krugman. 1979. Increasing Returns, Monopolistic Competition, and International
Trade. Journal of International Economics. 9 (4). pp. 469–479. ———. 1980. Scale Economies, Product Differentiation, and the Pattern of Trade.
American Economic Review. 70 (5). pp. 950–959. E.E. Leamer. 1980. The Leontief Paradox Reconsidered. Journal of Political Economy.
88. pp. 495–503. H. Lee and D. van der Mensbrugghe. 2007. Regional Integration, Sectoral Adjustments,
and Natural Groupings in East Asia. Discussion Paper. 07E008. Osaka: Osaka School of International Public Policy, Osaka University.
W.W. Leontief. 1953. Domestic Production and Foreign Trade: The American Capital Position Re-examined. Proceedings American Philosophical Society. 97. pp. 332–349.
X. Li. 2009. Free Trade Agreements and Vertical-Specialisation in East Asia. Asia-
European Journal. 7. pp. 145–160. H. Linnemann. 1966. An Econometric Study of International Trade Flows. Netherlands:
North-Holland Publishing Company. P. Mulapruk and I. Coxhead. 2005. Competition and Complementarity in Chinese and
ASEAN Manufacturing Industries. http://www/ccer.edu.au.cn/download/5761-1.pdf.
National Bureau of Economic Research. Shang-Jin Wei Data. http://www.nber.org/~wei/
data.html
D. Park, I. Park, G. Esther, and G. Estrada. 2008. Prospects of an ASEAN–People‘s Republic of China Free Trade Area: A Qualitative and Quantitative Analysis. ADB Economics Working Paper Series. 130. Manila: Asian Development Bank.
D. Park, I. Park, and G. Estrada. 2009. Prospects for ASEAN–People‘s Republic of
China Free Trade Area: A Qualitative and Quantitative Analysis. China* and the World Economy. 117 (4). pp. 104–120.

The Impact of ACFTA on People's Republic of China-ASEAN Trade | 17
I. Park, S. Park, and S. Kim. 2010. A Free Trade Area of the Asia Pacific (FTAAP): Is It Desirable? MPRA Paper. 26680. Munich: University Library of Munich.
P. Pöyhönen. 1963. A Tentative Model for the Volume of Trade between Countries.
Weltwirtschaftliches Archiv. Band 90 (Heft 1). pp. 93–99. K. Pulliainen. 1963. A World Trade Study: An Econometric Model of the Pattern of the
Commodity Flows in International Trade in 1948–1960. Ekonomiska Samfundets Tidskrif. 2. pp. 78–91.
B.A. Roberts. 2004. A Gravity Study of the Proposed China*–ASEAN Free Trade Area.
The International Trade Journal. 18 (4). pp. 335–353. A.K. Rose. 2004. Do We Really Know that the WTO Increases Trade? American
Economic Review. 94 (1). pp. 98–114. A. Subramanian and S.J. Wei. 2007. The WTO Promotes Trade, Strongly but Unevenly.
Journal of International Economics. 72. pp. 151–175. J. Tinbergen. 1962. Shaping the World Economy: Suggestions for an International
Economic Policy. New York: The Twentieth Century Fund. J. Tongzon. 2005. ASEAN–China* Free Trade Area: A Bane or Boon for ASEAN
Countries? The World Economy. 28 (2). pp. 191–210. D. Trefler. 1995. The Case of Missing Trade and Other HOV Mysteries. The American
Economic Review. 85 (5). pp. 1029–1046. Y. Uchida. 2008. Vertical Specialization in East Asia: Some Evidence from East Asia
Using Asian International Input-Output Tables from 1975 to 2000. In Hiratsuka and Uchida, eds. Vertical Specialization and Economic Integration in East Asia. Chosakenkyu- Houkokusho: IDE-JETRO.
H. Varian. 2007. An iPod Has Global Value. Ask the (Many) Countries That Make It.
New York Times. 28 June. B. Wang, Y. Wei, and X. Liu. 2010. Determinants of Bilateral Trade Flows in OECD
Countries: Evidence from Gravity Panel Data Models. The World Economy. 33 (7). pp. 894–915.
Xinhuanet. 2010. China*-ASEAN Free Trade Area Starts Operation. 01 January.
http://news.xinhuanet.com/english/2010-01/01/content_12739017.htm. L. Yuan. 2010. China‘s* Engagement in Multilateral Institutions: Understanding the
Trade Creation Impact of the ASEAN–China* Free Trade Area. Thesis submitted to the Department of Public Policy of Duke University. Durham, North Carolina.

18 | Working Paper Series on Regional Economic Integration No. 99
Table 1: People’s Republic of China and ASEAN Trade, 1984–2009
Year
Value ($ million) Annual Growth Rate (%)
Export Import Total Trade
Export Import Total Trade
1984 2,032 851 2,883
1985 2,657 1,112 3,769 31 31 31
1986 1,909 1,550 3,459 (28) 39 (8)
1987 2,390 2,162 4,552 25 39 32
1988 2,879 3,194 6,073 20 48 33
1989 3,192 3,758 6,950 11 18 14
1990 3,904 3,060 6,964 22 (19) 0
1991 4,239 3,917 8,156 9 28 17
1992 4,668 4,413 9,081 10 13 11
1993 5,340 6,304 11,644 14 43 28
1994 7,160 7,179 14,339 34 14 23
1995 10,473 9,901 20,374 46 38 42
1996 10,308 10,850 21,158 (2) 10 4
1997 12,708 12,455 25,163 23 15 19
1998 11,164 12,571 23,735 (12) 1 (6)
1999 12,274 14,927 27,201 10 19 15
2000 17,341 22,181 39,522 41 49 45
2001 18,376 23,215 41,591 6 5 5
2002 23,584 31,197 54,781 28 34 32
2003 30,927 47,328 78,255 31 52 43
2004 42,899 62,967 105,866 39 33 35
2005 55,367 74,994 130,361 29 19 23
2006 71,311 89,527 160,838 29 19 23
2007 94,717 108,509 203,226 33 21 26
2008 114,317 117,003 231,320 21 8 14
2009 81,591 96,594 178,185 (29) (17) (23)
Source: Authors‘ calculation from UN Comtrade database. The reporting country is the People‘s Republic of China.

The Impact of ACFTA on People's Republic of China-ASEAN Trade | 19
Table 2: ASEAN’s Exports to and Imports from the People’s Republic of China, by Product, 1980–2009
Year
Agricultural and mineral
goods SITC 0-4
Chemicals SITC 5
Manufactured goods classified
chiefly by material SITC 6
Machinery and transport
equipment SITC 7
Others SITC 8 & 9
Total value
($ billion)
Exports to People’s Republic of China (Share of Total Exports to People‘s Republic of China, %)
1980 68 2 8 18 4 0.7
1985 55 14 15 11 5 0.9
1990 57 11 20 9 3 2.6
1995 52 8 19 18 4 8.3
2000 38 11 10 36 4 16.0
2005 29 12 6 49 5 52.0
2008 33 9 6 42 10 88.0
2009 30 12 7 47 4 76.0
Imports from People’s Republic of China (Share of Total Imports from People‘s Republic of China, %)
1980 55 9 23 8 6 1.7
1985 83 3 9 2 3 3.3
1990 46 8 28 12 6 4.6
1995 18 10 33 28 12 10.0
2000 17 7 16 49 10 18.1
2005 11 7 17 57 9 59.7
2008 7 9 21 53 10 109.6
2009 10 8 14 60 9 78.3
SITC = Standard International Trade Classification. Note: Since the reporting country is different from the data source, the result may not be exactly the same as those found in other figures or tables. Source: Authors‘ calculation from UN Comtrade database. The reporting country is ASEAN.

20 | Working Paper Series on Regional Economic Integration No. 99
Table 3: ASEAN Members and the People’s Republic of China, Trade Share (%)
Year Singapore Malaysia Thailand Indonesia Viet Nam Philippines ASEAN
Exports to People’s Republic of China (Share of Total ASEAN Exports to People‘s Republic of China)
1980 44.4 31.3 17.8 0.0 6.5 100
1985 35.8 17.8 29.2 9.1 8.1 100
1990 30.9 24.0 10.3 32.3 2.4 100
1995 33.2 23.5 19.7 21.0 2.6 100
2000 33.1 18.7 17.4 17.1 9.5 4.1 100
2005 37.9 17.8 17.5 12.8 6.2 7.8 100
2008 35.3 21.5 18.2 13.2 5.5 6.2 100
2009 34.6 25.1 21.2 15.1 - 3.9 100
Imports from People’s Republic of China (Share of Total ASEAN Imports from People‘s Republic
of China)
1980 36.2 14.7 24.2 11.5 0.0 12.8 100
1985 68.6 7.8 6.8 7.6 0.0 8.9 100
1990 45.2 12.2 24.0 14.1 0.0 4.0 100
1995 40.4 17.1 20.9 14.9 0.0 6.6 100
2000 39.2 17.9 18.6 11.1 7.7 4.8 100
2005 34.3 22.1 18.7 9.8 9.9 5.2 100
2008 30.8 18.3 18.3 13.9 14.6 4.2 100
2009 33.1 22.0 21.8 17.9 - 5.2 100
Note: ―-― means not available. Source: Authors‘ calculation from UN Comtrade database. The reporting country is ASEAN.

The Impact of ACFTA on People's Republic of China-ASEAN Trade | 21
Table 4: Results for Bilateral (Total) Trade Flows, All Countries, 1980–2008
Variables OLS (1)
Panel Random Effects
(2)
Panel Fixed Effects
(3)
Country-Specific Effects
(4) Dependent variable: lnimportjk
ln(real GDPj) 0.388*** 0.270*** 0.088*** 0.082*** (0.009) (0.010) (0.013) (0.012) ln(real GDP per capitaj) -0.017 0.187*** 0.320*** 0.343*** (0.011) (0.018) (0.033) (0.030) ln(real GDPk) 0.958*** 0.336*** 0.303*** 0.319*** (0.005) (0.010) (0.014) (0.012) ln(real GDP per capitak) 0.577*** 0.645*** 0.324*** 0.333*** (0.008) (0.017) (0.032) (0.030) ln(distance) -1.016*** -0.751*** 0.044 -1.395*** (0.011) (0.022) (0.065) (0.011) Common Language dummy 0.671*** 0.414*** 0.170 0.605*** (0.019) (0.042) (0.163) (0.020) Land border dummy 0.907*** 1.333*** -0.139 0.397*** (0.045) (0.116) (0.391) (0.044) Importer WTO member dummy -0.049** 0.068*** 0.155*** 0.201*** (0.020) (0.026) (0.031) (0.032) Exporter WTO member dummy 0.385*** 0.407*** 0.147*** 0.107*** (0.022) (0.028) (0.033) (0.032) Island dummy 0.154*** -0.436*** -0.309** 1.144*** (0.017) (0.036) (0.124) (0.108) FTA dummy (FTAjk) 0.999*** 0.754*** 0.421*** 0.388*** (0.036) (0.043) (0.036) (0.032) lnexportjk 0.008 0.023 0.028 0.046** (0.020) (0.020) (0.021) (0.021) lnimportj-k 0.673*** 0.550*** 0.530*** 0.373*** (0.022) (0.023) (0.025) (0.026) Constant -23.128*** 0.000 1.691** 21.658*** (0.160) (0.000) (0.774) (0.647) n 76,417 76,417 76,417 76,417 R2 0.742 0.735 0.828 0.831
WTO = World Trade Organization. Note: n = number of observations. Robust standard errors are in parentheses. ***p<0.01, **p<0.05, *p<0.1.

22 | Working Paper Series on Regional Economic Integration No. 99
Table 5: Results for Intra-Industry Trade Flows, All Countries, 1980–2008
Variables OLS (1)
Panel Random Effects
(2)
Panel Fixed Effects
(3)
Country-Specific Effects
(4)
Dependent variable: lnintra_importjk
ln(real GDPj) 0.593*** 0.603*** 0.520*** 0.544***
(0.014) (0.017) (0.023) (0.022)
ln(real GDP per capitaj) 0.203*** 0.274*** 0.354*** 0.398***
(0.018) (0.025) (0.055) (0.053)
ln(real GDPk) 1.078*** 0.974*** 0.572*** 0.582***
(0.008) (0.013) (0.023) (0.022)
ln(real GDP per capitak) 0.647*** 0.685*** 0.752*** 0.787***
(0.014) (0.022) (0.053) (0.054)
ln(distance) -1.102*** -1.068*** -0.560*** -1.417***
(0.016) (0.024) (0.139) (0.018)
Common Language dummy 0.758*** 0.750*** 0.434 0.724***
(0.029) (0.048) (0.335) (0.034)
Land border dummy 0.722*** 0.878*** -2.017*** 0.360***
(0.070) (0.113) (0.457) (0.075)
Importer WTO member dummy 0.256*** 0.252*** 0.300*** 0.170***
(0.033) (0.039) (0.056) (0.057)
Exporter WTO member dummy 0.500*** 0.368*** 0.135** 0.040
(0.036) (0.043) (0.059) (0.059)
Island dummy 0.229*** 0.130*** -0.262 0.819***
(0.025) (0.039) (0.237) (0.141)
FTA dummy (FTAjk) 0.964*** 0.319*** 0.388*** 0.225***
(0.050) (0.051) (0.051) (0.053)
lnexportjk -0.092*** 0.003 0.132*** 0.140***
(0.032) (0.032) (0.044) (0.042)
lnimportj-k 0.600*** 0.431*** 0.342*** 0.184***
(0.036) (0.037) (0.050) (0.048)
Constant -28.277*** -26.635*** -23.613*** -11.575***
(0.257) (0.400) (1.495) (1.191)
n 46,215 46,215 46,215 46,215
R2 0.587 0.289 0.265 0.651
WTO = World Trade Organization.
Note: n = number of observations. Robust standard errors are in parentheses. ***p<0.01, **p<0.05, *p<0.1.

The Impact of ACFTA on People's Republic of China-ASEAN Trade | 23
Table 6: Impact of ACFTA on ASEAN and the People’s Republic of China’s Trade Flows (billion $ at 2008 prices)
Item 2008 Real
value Conventional
Projection New
Projection Hybrid
Projection
Total Trade Model (Equation (3))
Scenario 1
Scenario 3
Scenario 5
ASEAN-PRC Import 107.12 157.90 202.03 184.5
ASEAN-PRC Export 85.56 126.12 161.37 147.8
ASEAN-PRC Total Trade 192.68 284.02 363.40 332.2
ASEAN-PRC Total Trade Growth (%) - 47.40 88.60 72.4
Intra-Industry Trade Model (Equation (4)) Scenario 2 Scenario 4 Scenario 6
ASEAN-PRC Import 107.12 134.15 157.55 148.2
ASEAN-PRC Export 85.56 107.15 125.84 118.6
ASEAN-PRC Total Trade 192.68 241.30 283.38 266.9
ASEAN-PRC Total Trade Growth (%) - 25.23 47.1 38.5
FTA = Free Trade Agreement, PRC = People‘s Republic of China. Note: Each scenario as described in the main text. ―-― means not available.

Ta
ble
7:
Imp
act
of
AC
FT
A o
n A
SE
AN
an
d t
he P
eo
ple
’s R
ep
ub
lic o
f C
hin
a T
rad
e P
att
ern
(billi
on $
at 2
008
pric
es)
Rep
ort
er
AS
EA
N
Vie
t N
am
Bru
ne
i D
aru
ss
ala
m
Cam
bo
dia
In
do
ne
sia
La
o
Pe
op
le’s
D
em
oc
rati
c
Re
pu
bli
c
Ma
lays
ia
Mya
nm
ar
Ph
ilip
pin
es S
ing
ap
ore
T
ha
ila
nd
20
08
Tra
de
Pa
tte
rn
AS
EA
N-P
RC
Impo
rt 15
.55
0.
17
0.93
15
.25
0.
13
18.6
5
0.67
4.
25
31.5
8
19.9
4
AS
EA
N-P
RC
Exp
ort
4.49
0.
00
0.01
11
.64
0.
02
18.4
2
0.50
5.
47
29.0
8
15.9
3
AS
EA
N-P
RC
Tot
al
20.0
4
0.17
0.
94
26.8
9
0.15
37
.07
1.
17
9.72
60
.66
35
.87
To
tal
Tra
de
Mo
de
l (S
ce
na
rio
5)
AS
EA
N-P
RC
Impo
rt 25
.95
0.25
1.
37
26.5
0 0.
19
27.4
9 1.
16
7.50
59
.17
34.8
8 A
SE
AN
-PR
C E
xpor
t 7.
49
0.00
0.
01
20.2
3 0.
03
27.1
5 0.
86
9.65
54
.49
27.8
6 A
SE
AN
-PR
C T
otal
33
.45
0.25
1.
39
46.7
3 0.
22
54.6
4 2.
02
17.1
5 11
3.66
62
.74
AS
EA
N-P
RC
Tra
de
Gro
wth
(%)
66.9
1 47
.40
47.4
0 73
.77
47.4
0 47
.40
72.8
7 76
.41
87.3
7 74
.92
Intr
a-I
nd
ustr
y T
rad
e M
od
el
(Sc
en
ari
o 6
)
AS
EA
N-P
RC
Impo
rt 21
.08
0.21
1.
16
21.2
3 0.
16
23.3
6 0.
93
5.98
46
.24
27.8
8 A
SE
AN
-PR
C E
xpor
t 6.
09
0.00
0.
01
16.2
0 0.
03
23.0
7 0.
69
7.69
42
.58
22.2
7 A
SE
AN
-PR
C T
otal
27
.17
0.21
1.
18
37.4
3 0.
19
46.4
2 1.
62
13.6
7 88
.82
50.1
5 A
SE
AN
-PR
C T
rade
G
row
th (%
) 35
.57
25.2
3 25
.23
39.2
1 25
.23
25.2
3 38
.73
40.6
1 46
.42
39.8
2
FTA
= F
ree
Trad
e A
gree
men
t, P
RC
= P
eopl
e‘s
Rep
ublic
of C
hina
.
Not
e: S
cena
rios
5 an
d 6
are
as d
escr
ibed
in th
e m
ain
text
.
24 | Working Paper Series on Regional Economic Integration No. 99

The Impact of ACFTA on People's Republic of China-ASEAN Trade | 25
Figure 1: Growth in the People’s Republic of China’s Import from and Export to the World, 1997–2009 (%)
Source: People‘s Republic of China Customs Statistics.
Figure 2: The People’s Republic of China’s Import from and Export to ASEAN, 1984–2009 (billion $)
Source: People‘s Republic of China Customs Statistics.
PRC's export
PRC's import
-20
-10
0
10
20
30
40
50
1997 1998 1999 2000 2001 2002 2003 2004 2005 2006 2007 2008 2009
PRC's export
PRC's import
0
20
40
60
80
100
120
140
1984 1987 1990 1993 1996 1999 2002 2005 2008

26 | Working Paper Series on Regional Economic Integration No. 99
Figure 3.1: Major Trading Partners of the People’s Republic of China, 1999 & 2009 (%)
Source: Data are from UN Comtrade database. The reporting country is the People‘s Republic of China.
Figure 3.2: Major Trading Partners of ASEAN, 2009 (%)
3
Imports
24.6
10.1 11.5
9.6 10.1
24.3
13.3
10.8 11.4 9.3
24.5
11.6 11.2 10.5
9.7
-
6
9
12
15
18
21
24
27
ASEAN People‘s Rep. of China EU-25 Japan US
Exports
Total Trade
Source: ASEAN‘s official website.
16.2 17.0
18.3
7.3
16.4
13.9
10.8 10.2
0
3
6
9
12
15
18
21
EU-25 US Japan ASEAN
1999 2009

The Impact of ACFTA on People's Republic of China-ASEAN Trade | 27
Figure 4: Trade Structure of Selected ASEAN Countries with the People’s Republic of China, 2008 (million $)
(a) Singapore‘s Trade with the People‘s Republic of China
Source: Data are from UN Comtrade database.
(b) Malaysia‘s Trade with the People‘s Republic of China Source: Data are from UN Comtrade database.
Glass and glassware Articles of
iron or steel Aluminum
and articles thereof
Machinery and mechanical appliances; parts thereof
Electrical machinery and equipment and parts thereof
Ships, boats and floating structures
Tin and articles thereof
Miscellaneous articles of base metal
Railway or tramway
locomotives, rolling - stock
and parts thereof
-15,000
-10,000
-5,000
0
5,000
10,000
15,000
export import
Animal or vegetable
fats and oils
Tools, implements,
cutlery, spoons and forks, of base metal
Rubber and articles thereof
Nickel and articles
thereof
Electrical machinery and equipment and
parts thereof
Aircraft, spacecraft and parts thereof
-8,000
-6,000
-4,000
-2,000
0
2,000
4,000
6,000
8,000
export import
Trad
e Fl
ow
Trad
e Fl
ow

28 | Working Paper Series on Regional Economic Integration No. 99
(c) Thailand‘s Trade with the People‘s Republic of China
Source: Data are from UN Comtrade database.
Fish and crustaceans, molluscs and other aquatic invertebrates
Plastics and articles
thereof
Man - made staple fibers
Iron and steel
Electrical machinery and equipment and
parts thereof
Machinery and mechanical
appliances; parts thereof
Vehicles other than railway or tramway rolling stock
- 6,000
- 4,000
- 2,000
0
2,000
4,000
6,000
export import
Trad
e Fl
ow

The Impact of ACFTA on People's Republic of China-ASEAN Trade | 29
Appendix A: Derivation of the Determinants of Component Trade Flow A key characteristic of component trade is its extensive country-country industrial linkages. This implies country j‘s imports of parts and components from country k tend to be highly correlated with j‘s imports from other countries (-k) as well as its exports to the rest of the world. Thus, the imports of parts and components of country j from country k at time t (cimportjkt) can be specified using an extended version of the gravity model specification used by Rose (2004), and Anderson and van Wincoop (2005) as follows:
0 1 2expjkt jt j kt m mjkt jktcimport c ort cimport X (A1)
where cexportjt is exports of country j to the world, cimportj-kt is imports of country j from
the rest of the world, and 1 and 2 are coefficients corresponding to cexportjt and , cimportj-kt, respectively. X is a vector of m variables that affect imports of country j from country k, θ is the vector coefficients corresponding to X and ωjkt is the residual. X represents the GDP, GDP per capita of each country, the distance between trading partners, FTA and trade preference relationship and other covariates. In equilibrium, the first difference of equation 1A is:
1 2expjkt jt j kt m mjktcimport c ort cimport X (A2)
where ∆(.) is the first difference of a variable, Δωjkt=0 , and Δ0=0. By definition, cimportjkt + cimportj-kt = cimportj,wrd, which is implied by the balance of payment for each country in the long run.Taking its first difference gives ∆cimportjkt +
∆cimportj-kt = ∆cimportj,wrd . In equilibrium, ∆cimportj,wrd,t = ∆cexportj,wrd,t if symmetry of all countries is assumed. Substituting ∆cimportj,wrd,t = ∆cexportj,wrd,t into equation 2A gives:
1 2( )jkt jkt j kt j kt m mjktcimport cimport cimport cimport X (A3)
The assumption of symmetry also implies that country j and k are of a similar size, hence, ∆cimportjkt = ∆cimportj-kt . Equation 3A can then be rearranged as:
1 2(1 2 ) jkt m mjktcimport X (A4)
which gives:
1 2/ (1 2 )jkt m mjktcimport X . (A5)
Given the focus is on trade creation due to the formation of FTA, other covariates represented by X except for the FTA dummy are assumed to remain unchanged, that is, ∆Xmjkt = ∆XFTA,jkt . Thus, equation 5A can be written as:
1 2
1
(1 2 )
FTAjktcimport
(A5)

30 | Working Paper Series on Regional Economic Integration No. 99
Equation 5A provides the trade creation effects of FTA, with the trade multiplier specific to the new trade creation mechanism proposed in this paper given by 1/(1–2π1–π2).
The trade multiplier 1/(1–2π1–π2) is usually larger than one, which suggests that a unit change in the initial bilateral trade, ∆Xjkt, could lead to more than one unit change in trade in parts and components, wherein the magnifying effect is determined by π1 and π2. A necessary condition for the trade multiplier to exceed unity is for the sum of 2*π1 and π2
to be less than 1.

The Impact of ACFTA on People's Republic of China-ASEAN Trade | 31
Appendix B: Data Descriptions and Sources
Variable Name Description Source *
lnimport Log of real bilateral trade in 100 million US dollars (c.i.f price)
IMF Direction of Trade Statistics
lnintra_import Log of real bilateral intra-industry trade in 100 million US dollars (c.i.f price), estimated by using the intra-industry index multiplying the real bilateral trade.
Australian National University International Economic Data Bank (IEDB)
ln(real GDPj) Log of real GDP of importer
World Bank World Development Indicator
ln(real GDP per capitaj) Log of real GDP per capita of importer
World Bank World Development Indicator
ln(real GDPk) Log of real GDP of exporter
World Bank World Development Indicator
ln(real GDP per capitak) Log of real GDP per capita of exporter
World Bank World Development Indicator
ln(distance) Log of distance
Subramanian and Wei (2004)
Common language dummy
Take a value of 1 if trading partners share a common language, 0 otherwise
Subramanian and Wei (2004)
Dummy for land border Take the value of 1 if the trading partners share the border otherwise 0.
Subramanian and Wei (2004)
Importer WTO member Take a value of 1 if importer is a WTO member, 0 otherwise
Authors‘ own calculations
Exporter WTO member Take a value of 1 if exporter is a WTO member, 0 otherwise
Authors‘ own calculations
Island dummy Take a value of 0 if neither of trading partners is an island, 1 one of the trading partners is an island country, 2 both are islands.
Subramanian and Wei (2004)
Land border dummy Take a value of 1 if trading partners share a common border, 0 otherwise
Subramanian and Wei (2004)
FTA dummy Take a value of 1 if trading partners are in the same FTA, 0 otherwise
Authors‘ own calculations
lnexportj Log of real export of j to the world
Authors‘ own calculations
lnimportj –k Log of real import of j from countries other than k
Authors‘ own calculations
DTt A group of dummy variables for specific time periods, which take on a value of 1 at the following periods: DT1=1980–1984, DT2=1985–1989, DT3=1990–1994, DT4=1995–1999, DT5=2000–2004, and DT6=2005–2008, 0
Authors‘ own calculations

32 | Working Paper Series on Regional Economic Integration No. 99
Variable Name Description Source *
otherwise.
Dj A group of dummy variables representing each importing country. For example, if an importer is country A, Dj=A =1, 0 otherwise; and if an importer is country B, Dj=B =1, 0 otherwise.
Authors‘ own calculations
Dk A group of dummy variables representing each exporting country.
Authors‘ own calculations
Djk A group of dummy variables for specific importer-exporter (country) pair. For example, if importer is country A and exporter is country B, Djk=AB=1, 0 otherwise. If importer is country A and exporter is country is C, Djk=AC=1, 0
otherwise.
Authors‘ own calculations
* Original data were from Subramanian and Wei (2007) and updated from various sources as indicated below.

The Impact of ACFTA on People's Republic of China-ASEAN Trade | 33
ADB Working Paper Series on Regional Economic Integration*
1. ―The ASEAN Economic Community and the European Experience‖ by
Michael G. Plummer
2. ―Economic Integration in East Asia: Trends, Prospects, and a Possible Roadmap‖ by Pradumna B. Rana
3. ―Central Asia after Fifteen Years of Transition: Growth, Regional Cooperation, and Policy Choices‖ by Malcolm Dowling and Ganeshan Wignaraja
4. ―Global Imbalances and the Asian Economies: Implications for Regional Cooperation‖ by Barry Eichengreen
5. ―Toward Win-Win Regionalism in Asia: Issues and Challenges in Forming Efficient Trade Agreements‖ by Michael G. Plummer
6. ―Liberalizing Cross-Border Capital Flows: How Effective Are Institutional Arrangements against Crisis in Southeast Asia‖ by Alfred Steinherr, Alessandro Cisotta, Erik Klär, and Kenan Šehović
7. ―Managing the Noodle Bowl: The Fragility of East Asian Regionalism‖ by Richard E. Baldwin
8. ―Measuring Regional Market Integration in Developing Asia: a Dynamic Factor Error Correction Model (DF-ECM) Approach‖ by Duo Qin, Marie Anne Cagas, Geoffrey Ducanes, Nedelyn Magtibay-Ramos, and Pilipinas F. Quising
9. ―The Post-Crisis Sequencing of Economic Integration in Asia: Trade as a Complement to a Monetary Future‖ by Michael G. Plummer and Ganeshan Wignaraja
10. ―Trade Intensity and Business Cycle Synchronization: The Case of East Asia‖ by Pradumna B. Rana
11. ―Inequality and Growth Revisited‖ by Robert J. Barro
12. ―Securitization in East Asia‖ by Paul Lejot, Douglas Arner, and Lotte Schou-Zibell
13. ―Patterns and Determinants of Cross-border Financial Asset Holdings in East Asia‖ by Jong-Wha Lee
14. ―Regionalism as an Engine of Multilateralism: A Case for a Single East Asian FTA‖ by Masahiro Kawai and Ganeshan Wignaraja
34 | Working Paper Series on Regional Economic Integration No. 99
15. ―The Impact of Capital Inflows on Emerging East Asian Economies: Is Too Much Money Chasing Too Little Good?‖ by Soyoung Kim and Doo Yong Yang
16. ―Emerging East Asian Banking Systems Ten Years after the 1997/98 Crisis‖ by Charles Adams
17. ―Real and Financial Integration in East Asia‖ by Soyoung Kim and Jong-Wha Lee
18. ―Global Financial Turmoil: Impact and Challenges for Asia‘s Financial Systems‖ by Jong-Wha Lee and Cyn-Young Park
19. ―Cambodia‘s Persistent Dollarization: Causes and Policy Options‖ by Jayant Menon
20. ―Welfare Implications of International Financial Integration‖ by Jong-Wha Lee and Kwanho Shin
21. ―Is the ASEAN-Korea Free Trade Area (AKFTA) an Optimal Free Trade Area?‖ by Donghyun Park, Innwon Park, and Gemma Esther B. Estrada
22. ―India‘s Bond Market—Developments and Challenges Ahead‖ by Stephen Wells and Lotte Schou- Zibell
23. ―Commodity Prices and Monetary Policy in Emerging East Asia‖ by Hsiao Chink Tang
24. ―Does Trade Integration Contribute to Peace?‖ by Jong-Wha Lee and Ju Hyun Pyun
25. ―Aging in Asia: Trends, Impacts, and Responses‖ by Jayant Menon and Anna Melendez-Nakamura
26. ―Re-considering Asian Financial Regionalism in the 1990s‖ by Shintaro Hamanaka
27. ―Managing Success in Viet Nam: Macroeconomic Consequences of Large Capital Inflows with Limited Policy Tools‖ by Jayant Menon
28. ―The Building Block versus Stumbling Block Debate of Regionalism: From the Perspective of Service Trade Liberalization in Asia‖ by Shintaro Hamanaka
29. ―East Asian and European Economic Integration: A Comparative Analysis‖ by Giovanni Capannelli and Carlo Filippini
30. ―Promoting Trade and Investment in India‘s Northeastern Region‖ by M. Govinda Rao

The Impact of ACFTA on People's Republic of China-ASEAN Trade | 35
31. ―Emerging Asia: Decoupling or Recoupling‖ by Soyoung Kim, Jong-Wha Lee, and Cyn-Young Park
32. ―India‘s Role in South Asia Trade and Investment Integration‖ by Rajiv Kumar and Manjeeta Singh
33. ―Developing Indicators for Regional Economic Integration and Cooperation‖ by Giovanni Capannelli, Jong-Wha Lee, and Peter Petri
34. ―Beyond the Crisis: Financial Regulatory Reform in Emerging Asia‖ by Chee Sung Lee and Cyn-Young Park
35. ―Regional Economic Impacts of Cross-Border Infrastructure: A General Equilibrium Application to Thailand and Lao PDR‖ by Peter Warr, Jayant Menon, and Arief Anshory Yusuf
36. ―Exchange Rate Regimes in the Asia-Pacific Region and the Global Financial Crisis‖ by Warwick J. McKibbin and Waranya Pim Chanthapun
37. ―Roads for Asian Integration: Measuring ADB's Contribution to the Asian Highway Network‖ by Srinivasa Madhur, Ganeshan Wignaraja, and Peter Darjes
38. ―The Financial Crisis and Money Markets in Emerging Asia‖ by Robert Rigg and Lotte Schou-Zibell
39. ―Complements or Substitutes? Preferential and Multilateral Trade Liberalization at the Sectoral Level‖ by Mitsuyo Ando, Antoni Estevadeordal, and Christian Volpe Martincus
40. ―Regulatory Reforms for Improving the Business Environment in Selected Asian Economies—How Monitoring and Comparative Benchmarking can Provide Incentive for Reform‖ by Lotte Schou-Zibell and Srinivasa Madhur
41. ―Global Production Sharing, Trade Patterns, and Determinants of Trade Flows in East Asia‖ by Prema-chandra Athukorala and Jayant Menon
42. ―Regionalism Cycle in Asia (-Pacific): A Game Theory Approach to the Rise and Fall of Asian Regional Institutions‖ by Shintaro Hamanaka
43. ―A Macroprudential Framework for Monitoring and Examining Financial Soundness‖ by Lotte Schou-Zibell, Jose Ramon Albert, and Lei Lei Song
44. ―A Macroprudential Framework for the Early Detection of Banking Problems in Emerging Economies‖ by Claudio Loser, Miguel Kiguel, and David Mermelstein

36 | Working Paper Series on Regional Economic Integration No. 99
45. ―The 2008 Financial Crisis and Potential Output in Asia: Impact and Policy Implications‖ by Cyn-Young Park, Ruperto Majuca, and Josef Yap
46. ―Do Hub-and-Spoke Free Trade Agreements Increase Trade? A Panel Data Analysis‖ by Jung Hur, Joseph Alba, and Donghyun Park
47. ―Does a Leapfrogging Growth Strategy Raise Growth Rate? Some International Evidence‖ by Zhi Wang, Shang-Jin Wei, and Anna Wong
48. ―Crises in Asia: Recovery and Policy Responses‖ by Kiseok Hong and Hsiao Chink Tang
49. ―A New Multi-Dimensional Framework for Analyzing Regional Integration: Regional Integration Evaluation (RIE) Methodology‖ by Donghyun Park and Mario Arturo Ruiz Estrada
50. ―Regional Surveillance for East Asia: How Can It Be Designed to Complement Global Surveillance?‖ by Shinji Takagi
51. ―Poverty Impacts of Government Expenditure from Natural Resource Revenues‖ by Peter Warr, Jayant Menon, and Arief Anshory Yusuf
52. ―Methods for Ex Ante Economic Evaluation of Free Trade Agreements‖ by David Cheong
53. ―The Role of Membership Rules in Regional Organizations‖ by Judith Kelley
54. ―The Political Economy of Regional Cooperation in South Asia‖ by V.V. Desai
55. ―Trade Facilitation Measures under Free Trade Agreements: Are They Discriminatory against Non-Members?‖ by Shintaro Hamanaka, Aiken Tafgar, and Dorothea Lazaro
56. ―Production Networks and Trade Patterns in East Asia: Regionalization or Globalization?‖ by Prema-chandra Athukorala
57. ―Global Financial Regulatory Reforms: Implications for Developing Asia‖ by Douglas W. Arner and Cyn-Young Park
58. ―Asia‘s Contribution to Global Rebalancing‖ by Charles Adams, Hoe Yun Jeong, and Cyn-Young Park
59. ―Methods for Ex Post Economic Evaluation of Free Trade Agreements‖ by David Cheong
60. ―Responding to the Global Financial and Economic Crisis: Meeting the Challenges in Asia‖ by Douglas W. Arner and Lotte Schou-Zibell

The Impact of ACFTA on People's Republic of China-ASEAN Trade | 37
61. ―Shaping New Regionalism in the Pacific Islands: Back to the Future?‖ by Satish Chand
62. ―Organizing the Wider East Asia Region‖ by Christopher M. Dent
63. ―Labour and Grassroots Civic Interests In Regional Institutions‖ by Helen E.S. Nesadurai
64. ―Institutional Design of Regional Integration: Balancing Delegation and Representation‖ by Simon Hix
65. ―Regional Judicial Institutions and Economic Cooperation: Lessons for Asia?‖ by Erik Voeten
66. ―The Awakening Chinese Economy: Macro and Terms of. Trade Impacts on 10 Major Asia-Pacific Countries‖ by Yin Hua Mai, Philip Adams, Peter Dixon, and Jayant Menon
67. ―Institutional Parameters of a Region-Wide Economic Agreement in Asia: Examination of Trans-Pacific Partnership and ASEAN+α Free Trade Agreement Approaches‖ by Shintaro Hamanaka
68. ―Evolving Asian Power Balances and Alternate Conceptions for Building Regional Institutions‖ by Yong Wang
69. ―ASEAN Economic Integration: Features, Fulfillments, Failures, and the Future‖ by Hal Hill and Jayant Menon
70. ―Changing Impact of Fiscal Policy on Selected ASEAN Countries‖ by Hsiao Chink Tang, Philip Liu, and Eddie C. Cheung
71. ―The Organizational Architecture of the Asia-Pacific: Insights from the New Institutionalism‖ by Stephan Haggard
72. ―The Impact of Monetary Policy on Financial Markets in Small Open Economies: More or Less Effective During the Global Financial Crisis?‖ by Steven Pennings, Arief Ramayandi, and Hsiao Chink Tang
73. ―What do Asian Countries Want the Seat at the High Table for? G20 as a New Global Economic Governance Forum and the Role of Asia‖ by Yoon Je Cho
74. ―Asia‘s Strategic Participation in the Group of 20 for Global Economic Governance Reform: From the Perspective of International Trade‖ by Taeho Bark and Moonsung Kang
75. ―ASEAN‘s Free Trade Agreements with the People‘s Republic of China, Japan, and the Republic of Korea: A Qualitative and Quantitative

38 | Working Paper Series on Regional Economic Integration No. 99
Analysis‖ by Gemma Estrada, Donghyun Park, Innwon Park, and Soonchan Park
76. ―ASEAN-5 Macroeconomic Forecasting Using a GVAR Model‖ by Fei Han and Thiam Hee Ng
77. ―Early Warning Systems in the Republic of Korea: Experiences, Lessons, and Future Steps‖ by Hyungmin Jung and Hoe Yun Jeong
78. ―Trade and Investment in the Greater Mekong Subregion: Remaining Challenges and the Unfinished Policy Agenda‖ by Jayant Menon and Anna Cassandra Melendez
79. ―Financial Integration in Emerging Asia: Challenges and Prospects‖ by Cyn-Young Park and Jong-Wha Lee
80. ―Sequencing Regionalism: Theory, European Practice, and Lessons for Asia‖ by Richard E. Baldwin
81. ―Economic Crises and Institutions for Regional Economic Cooperation‖ by C. Randall Henning
82. ―Asian Regional Institutions and the Possibilities for Socializing the Behavior of States‖ by Amitav Acharya
83. ―The People‘s Republic of China and India: Commercial Policies in the Giants‖ by Ganeshan Wignaraja
84. ―What Drives Different Types of Capital Flows and Their Volatilities‖ by Rogelio Mercado and Cyn-Young Park
85. ―Institution Building for Africal Regionalism‖ by Gilbert M. Khadiagala
86. ―What Drives Different Types of Capital Flows and Their Volatilities‖ by Rogelio Mercado and Cyn-Young Park
87. ―The Role of the People‘s Republic of China in International Fragmentation and Production Networks: An Empirical Investigation‖ by Hyun-Hoon Lee, Donghyun Park, and Jing Wang
88. ―Utilizing the Multiple Mirror Technique to Assess the Quality of Cambodian Trade Statistics: by Shintaro Hamanaka
89. ―Is Technical Assistance under Free Trade Agreements WTO-Plus?‖ Review of Japan–ASEAN Economic Partnership Agreements‖ by Shintaro Hamanaka
90. ―Intra-Asia Exchange Rate Volatility and Intra-Asia Trade: Evidence by of Goods‖ by Hsiao Chink Tang

The Impact of ACFTA on People's Republic of China-ASEAN Trade | 39
91. ―Is Trade in Asia Really Integrating?‖ by Shintaro Hamanaka
92. ―The PRC's Free Trade Agreements with ASEAN, Japan, and the Republic of Korea: A Comparative Analysis‖ by Gemma Estrada, Donghyun Park, Innwon Park, and Soonchan Park
93. ―Assessing the Resilience of ASEAN Banking Systems: The Case of Philippines‖ by Jose Ramon Albert and Thiam Hee Ng‖
94. ―Strengthening the Financial System and Mobilizing Savings to Support More Balanced Growth in ASEAN+3" by A. Noy Siackhachanh
95. ‖Measuring Commodity-Level Trade Costs in Asia: The Basis for Effective Trade Facilitation Policies in the Region‖ by Shintaro Hamanaka and Romana Domingo
96. ―Why do Imports Fall More than Exports Especially During Crises? Evidence from Selected Asian Economies‖ by Hsiao Chink Tang
97. ―Determinants of Local Currency Bonds and Foreign Holdings: Implications for Bond Market Development in the People‘s Republic of China‖ by Kee-Hong Bae
98. ―ASEAN–China Free Trade Area and the Competitiveness of Local Industries: A Case Study of Major Industries in the Lao PDR‖ by Leebeer Leebouapao, Sthabandith Insisienmay, and Vanthana Nolintha
*These papers can be downloaded from (ARIC) http://aric.adb.org/archives.php? section=0&subsection=workingpapers or (ADB) http://www.adb.org/publications/series/ regional-economic-integration-working -papers


The Impact of ACFTA on People’s Republic of China–ASEAN TradeEstimates Based on an Extended Gravity Model for Component Trade
This paper uses an extended gravity model to shed light on the impact of the free trade area agreement between the Association of Southeast Asian Nations (ASEAN) and the People’s Republic of China (PRC) on the members’ trade flows and trade patterns. Results from the extended gravity model show that the free trade agreement leads to substantially higher bilateral trade between ASEAN and the People’s Republic of China, more than what a conventional gravity model predicts.
About the Asian Development Bank
ADB’s vision is an Asia and Pacific region free of poverty. Its mission is to help its developing member countries reduce poverty and improve the quality of life of their people. Despite the region’s many successes, it remains home to two-thirds of the world’s poor: 1.8 billion people who live on less than $2 a day, with 903 million struggling on less than $1.25 a day. ADB is committed to reducing poverty through inclusive economic growth, environmentally sustainable growth, and regional integration.
Based in Manila, ADB is owned by 67 members, including 48 from the region. Its main instruments for helping its developing member countries are policy dialogue, loans, equity investments, guarantees, grants, and technical assistance.
Asian Development Bank6 ADB Avenue, Mandaluyong City1550 Metro Manila, Philippineswww.adb.org/povertyPublication Stock No. WPS124840 Printed in the Philippines