Adaptive GDDA-BLAST: Fast and Efficient Algorithm …pike.psu.edu/publications/j-plosone10.pdf ·...
12
Adaptive GDDA-BLAST: Fast and Efficient Algorithm for Protein Sequence Embedding Yoojin Hong 1,2 , Jaewoo Kang 3,4 *, Dongwon Lee 1,5 , Damian B. van Rossum 2,6 * 1 Department of Computer Science and Engineering, The Pennsylvania State University, University Park, Pennsylvania, United States of America, 2 Center for Computational Proteomics, The Pennsylvania State University, University Park, Pennsylvania, United States of America, 3 Department of Computer Science and Engineering, Korea University, Seoul, Korea, 4 Department of Biostatistics, College of Medicine, Korea University, Seoul, Korea, 5 College of Information Sciences and Technology, The Pennsylvania State University, University Park, Pennsylvania, United States of America, 6 Department of Biology, The Pennsylvania State University, University Park, Pennsylvania, United States of America Abstract A major computational challenge in the genomic era is annotating structure/function to the vast quantities of sequence information that is now available. This problem is illustrated by the fact that most proteins lack comprehensive annotations, even when experimental evidence exists. We previously theorized that embedded-alignment profiles (simply ‘‘alignment profiles’’ hereafter) provide a quantitative method that is capable of relating the structural and functional properties of proteins, as well as their evolutionary relationships. A key feature of alignment profiles lies in the interoperability of data format (e.g., alignment information, physio-chemical information, genomic information, etc.). Indeed, we have demonstrated that the Position Specific Scoring Matrices (PSSMs) are an informative M-dimension that is scored by quantitatively measuring the embedded or unmodified sequence alignments. Moreover, the information obtained from these alignments is informative, and remains so even in the ‘‘twilight zone’’ of sequence similarity (,25% identity) [1–5]. Although our previous embedding strategy was powerful, it suffered from contaminating alignments (embedded AND unmodified) and high computational costs. Herein, we describe the logic and algorithmic process for a heuristic embedding strategy named ‘‘Adaptive GDDA-BLAST.’’ Adaptive GDDA-BLAST is, on average, up to 19 times faster than, but has similar sensitivity to our previous method. Further, data are provided to demonstrate the benefits of embedded-alignment measurements in terms of detecting structural homology in highly divergent protein sequences and isolating secondary structural elements of transmembrane and ankyrin-repeat domains. Together, these advances allow further exploration of the embedded alignment data space within sufficiently large data sets to eventually induce relevant statistical inferences. We show that sequence embedding could serve as one of the vehicles for measurement of low-identity alignments and for incorporation thereof into high-performance PSSM-based alignment profiles. Citation: Hong Y, Kang J, Lee D, van Rossum DB (2010) Adaptive GDDA-BLAST: Fast and Efficient Algorithm for Protein Sequence Embedding. PLoS ONE 5(10): e13596. doi:10.1371/journal.pone.0013596 Editor: Art F. Y. Poon, BC Centre for Excellence in HIV/AIDS, Canada Received March 10, 2010; Accepted September 28, 2010; Published October 22, 2010 Copyright: ß 2010 Hong et al. This is an open-access article distributed under the terms of the Creative Commons Attribution License, which permits unrestricted use, distribution, and reproduction in any medium, provided the original author and source are credited. Funding: This work was supported by NCSA grant TG-MCB070027N (DVR), The National Science Foundation 428-15 691M (DVR), and The National Institutes of Health R01 GM087410-01 (DVR). This project was also funded by a Fellowship from the Eberly College of Sciences and the Huck Institutes of the Life Sciences (DVR) and a grant from the Pennsylvania Department of Health using Tobacco Settlement Funds (DVR). The Department of Health specifically disclaims responsibility for any analyses, interpretations or conclusions. This work was also supported by the Second Brain Korea 21 Project Grant (JK), Microsoft Research Asia Grant (JK), the Korea Research Foundation Grant funded by the Korean Government (MOEHRD, Basic Research Promotion Fund) (KRF-2008-331-D00481) (JK), the National Research Foundation of Korea (NRF) grant funded by the Korea government (MEST) (2009-0077688, 2009-0086140) (JK), and the Korea Science and Engineering Foundation (KOSEF) grant funded by the Korea government (MEST) (R01-2008-000-20564-0) (JK). The funders had no role in study design, data collection and analysis, decision to publish, or preparation of the manuscript. Competing Interests: The authors have declared that no competing interests exist. * E-mail: [email protected] (JK); [email protected] (DBvR) Introduction One of the major challenges faced by biologists comes to this question: how to identify the relation between highly divergent protein sequences. Although numerous methods (e.g., [2,6,7]) have been proposed to address the problem, it still needs to be resolved. In general, when pairwise sequence identity between protein sequences fall below the 25% identity, statistical measurements fail to clearly identify phylogenetic relations, structural features or protein functions [2,8–11]. GDDA-BLAST (Gestalt Domain Detection Algorithm - Basic Local Alignment Search Tool), originally introduced in [12], was designed to address the challenges arising in connection with low-identity alignments/ divergence. It has been determined that this alignment informa- tion is informative to our laboratory experiments at multiple scales (e.g., whole protein, single protein domain and single amino acid) [3–5,13–16]. The following analyses were put to use: (1) to reconstruct evolutionary histories, (2) to identify functions in the domains of the unknown function, (3) to classify structural homologues of high sequence divergence and (4) to isolate key amino acids important to protein function. A phylogenetic profile represents a protein as a vector where each entry quantifies the existence of the protein in a different genomes [17–19]. This approach has been proven applicable to whole molecules (Single Profile Method), to isolated domains (Multiple Profile Method) and to individual amino acids. Similar to phylogenetic profiles, our embedded-alignment profiles present a protein as a vector where each entry quantifies the existence of alignments with a PSSM [1,2]. The basic idea underlying our method begins by compiling a set of PSSMs that the query PLoS ONE | www.plosone.org 1 October 2010 | Volume 5 | Issue 10 | e13596
Transcript of Adaptive GDDA-BLAST: Fast and Efficient Algorithm …pike.psu.edu/publications/j-plosone10.pdf ·...
Adaptive GDDA-BLAST: Fast and Efficient Algorithm forProtein Sequence EmbeddingYoojin Hong1,2, Jaewoo Kang3,4*, Dongwon Lee1,5, Damian B. van Rossum2,6*
1 Department of Computer Science and Engineering, The Pennsylvania State University, University Park, Pennsylvania, United States of America, 2 Center for
Computational Proteomics, The Pennsylvania State University, University Park, Pennsylvania, United States of America, 3 Department of Computer Science and
Engineering, Korea University, Seoul, Korea, 4 Department of Biostatistics, College of Medicine, Korea University, Seoul, Korea, 5 College of Information Sciences and
Technology, The Pennsylvania State University, University Park, Pennsylvania, United States of America, 6 Department of Biology, The Pennsylvania State University,
University Park, Pennsylvania, United States of America
Abstract
A major computational challenge in the genomic era is annotating structure/function to the vast quantities of sequenceinformation that is now available. This problem is illustrated by the fact that most proteins lack comprehensive annotations,even when experimental evidence exists. We previously theorized that embedded-alignment profiles (simply ‘‘alignmentprofiles’’ hereafter) provide a quantitative method that is capable of relating the structural and functional properties ofproteins, as well as their evolutionary relationships. A key feature of alignment profiles lies in the interoperability of dataformat (e.g., alignment information, physio-chemical information, genomic information, etc.). Indeed, we havedemonstrated that the Position Specific Scoring Matrices (PSSMs) are an informative M-dimension that is scored byquantitatively measuring the embedded or unmodified sequence alignments. Moreover, the information obtained fromthese alignments is informative, and remains so even in the ‘‘twilight zone’’ of sequence similarity (,25% identity) [1–5].Although our previous embedding strategy was powerful, it suffered from contaminating alignments (embedded ANDunmodified) and high computational costs. Herein, we describe the logic and algorithmic process for a heuristic embeddingstrategy named ‘‘Adaptive GDDA-BLAST.’’ Adaptive GDDA-BLAST is, on average, up to 19 times faster than, but has similarsensitivity to our previous method. Further, data are provided to demonstrate the benefits of embedded-alignmentmeasurements in terms of detecting structural homology in highly divergent protein sequences and isolating secondarystructural elements of transmembrane and ankyrin-repeat domains. Together, these advances allow further exploration ofthe embedded alignment data space within sufficiently large data sets to eventually induce relevant statistical inferences.We show that sequence embedding could serve as one of the vehicles for measurement of low-identity alignments and forincorporation thereof into high-performance PSSM-based alignment profiles.
Citation: Hong Y, Kang J, Lee D, van Rossum DB (2010) Adaptive GDDA-BLAST: Fast and Efficient Algorithm for Protein Sequence Embedding. PLoS ONE 5(10):e13596. doi:10.1371/journal.pone.0013596
Editor: Art F. Y. Poon, BC Centre for Excellence in HIV/AIDS, Canada
Received March 10, 2010; Accepted September 28, 2010; Published October 22, 2010
Copyright: � 2010 Hong et al. This is an open-access article distributed under the terms of the Creative Commons Attribution License, which permitsunrestricted use, distribution, and reproduction in any medium, provided the original author and source are credited.
Funding: This work was supported by NCSA grant TG-MCB070027N (DVR), The National Science Foundation 428-15 691M (DVR), and The National Institutes ofHealth R01 GM087410-01 (DVR). This project was also funded by a Fellowship from the Eberly College of Sciences and the Huck Institutes of the Life Sciences(DVR) and a grant from the Pennsylvania Department of Health using Tobacco Settlement Funds (DVR). The Department of Health specifically disclaimsresponsibility for any analyses, interpretations or conclusions. This work was also supported by the Second Brain Korea 21 Project Grant (JK), Microsoft ResearchAsia Grant (JK), the Korea Research Foundation Grant funded by the Korean Government (MOEHRD, Basic Research Promotion Fund) (KRF-2008-331-D00481) (JK),the National Research Foundation of Korea (NRF) grant funded by the Korea government (MEST) (2009-0077688, 2009-0086140) (JK), and the Korea Science andEngineering Foundation (KOSEF) grant funded by the Korea government (MEST) (R01-2008-000-20564-0) (JK). The funders had no role in study design, datacollection and analysis, decision to publish, or preparation of the manuscript.
Competing Interests: The authors have declared that no competing interests exist.
* E-mail: [email protected] (JK); [email protected] (DBvR)
Introduction
One of the major challenges faced by biologists comes to this
question: how to identify the relation between highly divergent
protein sequences. Although numerous methods (e.g., [2,6,7]) have
been proposed to address the problem, it still needs to be resolved.
In general, when pairwise sequence identity between protein
sequences fall below the 25% identity, statistical measurements fail
to clearly identify phylogenetic relations, structural features or
protein functions [2,8–11]. GDDA-BLAST (Gestalt Domain
Detection Algorithm - Basic Local Alignment Search Tool),
originally introduced in [12], was designed to address the
challenges arising in connection with low-identity alignments/
divergence. It has been determined that this alignment informa-
tion is informative to our laboratory experiments at multiple scales
(e.g., whole protein, single protein domain and single amino acid)
[3–5,13–16]. The following analyses were put to use: (1) to
reconstruct evolutionary histories, (2) to identify functions in the
domains of the unknown function, (3) to classify structural
homologues of high sequence divergence and (4) to isolate key
amino acids important to protein function.
A phylogenetic profile represents a protein as a vector where
each entry quantifies the existence of the protein in a different
genomes [17–19]. This approach has been proven applicable to
whole molecules (Single Profile Method), to isolated domains
(Multiple Profile Method) and to individual amino acids. Similar
to phylogenetic profiles, our embedded-alignment profiles present a
protein as a vector where each entry quantifies the existence of
alignments with a PSSM [1,2]. The basic idea underlying our
method begins by compiling a set of PSSMs that the query
PLoS ONE | www.plosone.org 1 October 2010 | Volume 5 | Issue 10 | e13596

sequence is compared to. These profiles are obtainable from any
protein-sequence knowledge-base source (e.g., Protein Data Bank,
Pfam, SMART, and NCBI Conserved Domain Database (CDD))
[20–23], or they are locally creatible through PSI-BLAST [24].
We employ the reverse specific position BLAST (rps-BLAST) [23]
to compare the query with PSSMs. A single domain PSSM
database is utilized for pairwise comparison. We then record and
quantify all alignments between an unmodified (control) query
sequence and a modified one. The latter is composed of two types
of alignments: ‘‘seeded’’ and ‘‘non-seeded’’ alignments. We modify
the query sequence with a ‘‘seed’’ from the PSSM, and, thereby,
create a consistent initiation site (Figure 1-i, ii). The ‘‘seeds’’ are
generated from the profiles by taking a portion (e.g., 10% in this
study) of the PSSM sequence (e.g., from the N-terminus or C-
terminus). These thresholds have been adopted herein from the
results of our previous studies. These ‘‘seeds’’ are embedded at
each position of the query sequence. For example, a query
sequence of 100 amino acids yields 100 distinct test sequences for
each ‘‘seed’’. This strategy is designed to amplify and encode all
the alignments possible for any given query sequence. In place of a
sliding window, we utilized a sliding ‘‘seed,’’ which is similar, yet
inverse to the embedding strategies employed by Henikoff and
Henikoff [25].
Then, each of these modified query sequences is aligned by rps-
BLAST against the parent profile, from which a seed is taken. Due
to the ‘‘hit and the extension of the hit’’ approach of BLAST
algorithm, the embedded ‘‘seed’’ creates a consistent initiation site
that allows rps-BLAST to extend an alignment even between
highly divergent sequences. The idea is summarily depicted in
Figure 1-iii. Next, the alignments from rps-BLAST are filtered out,
based on the thresholds of percentage identity and percentage
coverage (i.e., the alignment length as a function of the profile
length) in order to eliminate random alignments (Figure 1-iv). The
output of the comparison is translated into a composite score of
either zero (when there is no significant match) or a positive value
(that measures the degree of successful match of the protein
sequence to each of the profiles). The composite score is computed
as a product of the number of hits, aveage pairwise identity of the
Figure 1. The Concept of GDDA-BLAST and Adaptive GDDA-BLAST. This schematic depicts the work flow of GDDA-BLAST and AdaptiveGDDA-BLAST (i–ii) The algorithm begins with a modification of the query amino acid sequence via the insertion of a ‘‘seed’’ sequence from the profileof interest. These seeds are obtained from the profile consensus sequences from NCBI’s Conserved Domain Database (CDD). GDDA-BLAST inserts aseed at every query amino acid position; in constrast, Adaptive GDDA-BLAST inserts a seed at the positions where the seed is likely to be extended toan alignment. (iii–iv) The signals are collected from the optimal alignments between the ‘‘embedded’’ sequences and profiles using rps-BLAST orAdaptive GDDA-BLAST; and, they are incorporated as a composite score into an N by M data matrix. (v–ix) This dataspace can be analyzed to generatephylograms and dendrograms based on the Euclidean distance and Pearson correlation measures on alignment profiles of query proteins,respectively.doi:10.1371/journal.pone.0013596.g001
Adaptive GDDA-BLAST
PLoS ONE | www.plosone.org 2 October 2010 | Volume 5 | Issue 10 | e13596

hits, and maximum coverage of the hits. This procedure is readily
adaptible to make an unbiased comparison between a series of
query sequences by subjecting them to the same screening analysis
with the same set of PSSM sequences. After the analysis, each
query sequence (N) is represented in a vector of non-negative
numbers in M dimensions (M = # of ‘‘PSSMs’’ tested) (Figure 1-v).
This N|M data matrix (N alignment profiles of length M for N
queries) is then usable to create a dendrogram through distance
metrics such as Euclidian distance or Pearson’s correlation
between query sequences (Figure 1-vi,vii).
Despite the great potential of the embedded alignment strategies
in answering a diverse set of biological questions, their computa-
tional costs are prohibitively expensive, a problem that arises out
of the current method of generating and analyzing embedded
sequences. As proteins range in length from tens of amino acids to
,8000, the proteomic scale studies using GDDA-BLAST are
prohibitive in nature. To address this challenge, in this paper, we
propose a novel sequence alignment algorithm that is as sensitive
as GDDA-BLAST but is orders of magnitude faster. Adaptive
GDDA-BLAST is termed for its adaptive nature, and exploits
similarities among embedded sequences to adaptively avoid
expensive computations. Instead of inserting a seed into every
position of a query sequence, Adaptive GDDA-BLAST embeds a
seed at the query positions where the seed is likely to be extended
to an alignment (see the Method section for details).
Results
Execution timeTo compare GDDA-BLAST and Adaptive GDDA-BLAST in
terms of execution time, we ran both methods with the 602 query
sequences and the 51 target sequences randomly chosen from the
SABmark twilight zone set [26] and from the CDD database,
respectively. Figure 2-a shows the per-query time for execution of
alignment when a given query is run against the 51 PSSMs in the
library. The lengths of the 602 query sequences range from 34 to
759 amino acids. Note that the running time of GDDA-BLAST
linearly increases as a function of query sequence length.
Conversely, Adaptive GDDA-BLAST shows much better scalability
with respect to query size, because Adaptive GDDA-BLAST inserts
a seed only at the positions where the seed is likely to be extended.
Moreover, the performance gain is maximized when the two
compared sequences are of low identity, because the number of the
candidates for seed-inserting positions is limited. This makes
Adaptive GDDA-BLAST an attractive alternative for alignment
of highly divergent sequences. Overall, Adaptive GDDA-BLAST is
on average 19.3 times (+15.29 S.D.) faster than GDDA-BLAST,
while it achieves more than 100 times speed-up in many occasions.
Detection of Structural Homologues of High SequenceDivergence
To see if Adaptive GDDA-BLAST alignments could be used to
encode informative alignment profiles for proteins, we took on the
challenge of detecting structural homology in highly divergent
protein sequences. For the test, we used 534 sequences from 61
fold groups in SABmark Twilight zone set. As employing 23,511
NBCI CDD PSSMs as a measuring PSSM set, each of 534 queries
was encoded in an alignment profile. In this test, 60% coverage
and 10% pairwise identity thresholds were used for filtering
alignments. We used the Pearson’s correleration coefficient to
measure the similarity between two alignment profiles. We
performed Receiver Operating Characteristic (ROC) curve
analysis [4] to measure the performance of GDDA-BLAST and
Adaptive GDDA-BLAST. The ROC curve shows the sensitivity of
each method at different false positive rates. The sensitivity and
false positive rates are calculated as follows: Sensitivity~TP
TPzTN, Specificity~
TN
TNzFP, FalsePositiveRate~1{
Specificity, where TP is the number of true positives, TN is the
number of true negatives and FP is the number of false positives. To
calculate the sensitivity at different false positive rates for each query,
we used the sequences with k highest Pearson’s correleation
coefficient for the query, while increasing k from 1 up to 40. As
shown in Figure 2-b, the performance difference of Adaptive GDDA-
BLAST, when compared with GDDA-BLAST, is negligible.
Figure S1-a shows that the percentage value of coverage has
been effective to remove random alignments. We tested four cases
including 40%, 60%, 85%, and no-coverage-threashold. It turned
out that 40% and 60% coverage thresholds showed the best
performance, followed by 85% and then by the no-coverage case.
The 85% coverage was too conservative, while the no-coverage
Figure 2. A Performance Comparison of GDDA-BLAST and Adaptive GDDA-BLAST. (a) Per-query running time of GDDA-BLAST andAdaptive GDDA-BLAST, when running 620 query sequences against 51 target sequences. The numbers in a box represent how much faster AdaptiveGDDA-BLAST is than GDDA-BLAST. (b) Fold recognition performance of GDDA-BLAST, Adaptive GDDA-BLAST, PSI-BLAST and SAM-T2K on SABmarkTwilight zone set is shown with ROC curves. 534 sequences of 61 SCOP fold groups from SABmark Twilight zone bechmark set. To calculate thesensitivity at different false positive rates, top-k sequences with the highest similarity to each 534 queries are considered as increasing k from 1.doi:10.1371/journal.pone.0013596.g002
Adaptive GDDA-BLAST
PLoS ONE | www.plosone.org 3 October 2010 | Volume 5 | Issue 10 | e13596
was too liberal. As a result, both failed to filter out random and
noisy alighments effecively while informative alignments are kept.
Figure S1-b shows that Pearson’s correlation cofficient worked best
among the distance metrics for the task at hand.
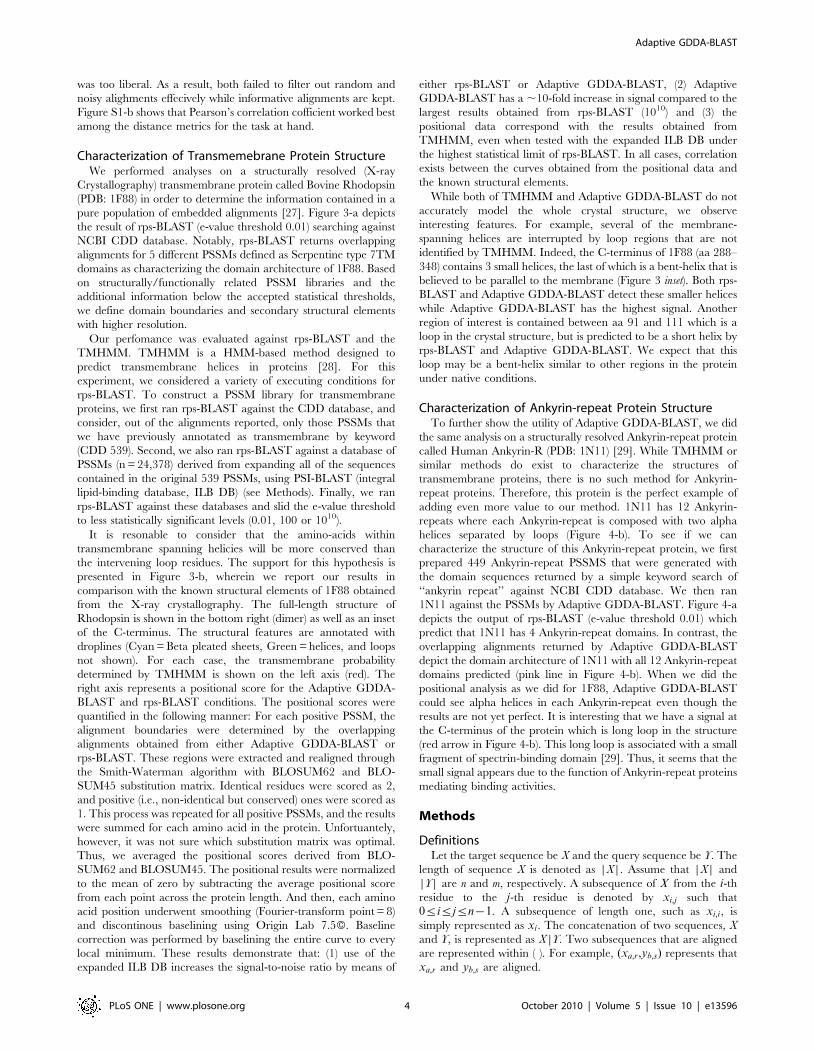
Characterization of Transmemebrane Protein StructureWe performed analyses on a structurally resolved (X-ray
Crystallography) transmembrane protein called Bovine Rhodopsin
(PDB: 1F88) in order to determine the information contained in a
pure population of embedded alignments [27]. Figure 3-a depicts
the result of rps-BLAST (e-value threshold 0.01) searching against
NCBI CDD database. Notably, rps-BLAST returns overlapping
alignments for 5 different PSSMs defined as Serpentine type 7TM
domains as characterizing the domain architecture of 1F88. Based
on structurally/functionally related PSSM libraries and the
additional information below the accepted statistical thresholds,
we define domain boundaries and secondary structural elements
with higher resolution.
Our perfomance was evaluated against rps-BLAST and the
TMHMM. TMHMM is a HMM-based method designed to
predict transmembrane helices in proteins [28]. For this
experiment, we considered a variety of executing conditions for
rps-BLAST. To construct a PSSM library for transmembrane
proteins, we first ran rps-BLAST against the CDD database, and
consider, out of the alignments reported, only those PSSMs that
we have previously annotated as transmembrane by keyword
(CDD 539). Second, we also ran rps-BLAST against a database of
PSSMs (n = 24,378) derived from expanding all of the sequences
contained in the original 539 PSSMs, using PSI-BLAST (integral
lipid-binding database, ILB DB) (see Methods). Finally, we ran
rps-BLAST against these databases and slid the e-value threshold
to less statistically significant levels (0.01, 100 or 1010).
It is resonable to consider that the amino-acids within
transmembrane spanning helicies will be more conserved than
the intervening loop residues. The support for this hypothesis is
presented in Figure 3-b, wherein we report our results in
comparison with the known structural elements of 1F88 obtained
from the X-ray crystallography. The full-length structure of
Rhodopsin is shown in the bottom right (dimer) as well as an inset
of the C-terminus. The structural features are annotated with
droplines (Cyan = Beta pleated sheets, Green = helices, and loops
not shown). For each case, the transmembrane probability
determined by TMHMM is shown on the left axis (red). The
right axis represents a positional score for the Adaptive GDDA-
BLAST and rps-BLAST conditions. The positional scores were
quantified in the following manner: For each positive PSSM, the
alignment boundaries were determined by the overlapping
alignments obtained from either Adaptive GDDA-BLAST or
rps-BLAST. These regions were extracted and realigned through
the Smith-Waterman algorithm with BLOSUM62 and BLO-
SUM45 substitution matrix. Identical residues were scored as 2,
and positive (i.e., non-identical but conserved) ones were scored as
1. This process was repeated for all positive PSSMs, and the results
were summed for each amino acid in the protein. Unfortuantely,
however, it was not sure which substitution matrix was optimal.
Thus, we averaged the positional scores derived from BLO-
SUM62 and BLOSUM45. The positional results were normalized
to the mean of zero by subtracting the average positional score
from each point across the protein length. And then, each amino
acid position underwent smoothing (Fourier-transform point = 8)
and discontinous baselining using Origin Lab 7.5�. Baseline
correction was performed by baselining the entire curve to every
local minimum. These results demonstrate that: (1) use of the
expanded ILB DB increases the signal-to-noise ratio by means of
either rps-BLAST or Adaptive GDDA-BLAST, (2) Adaptive
GDDA-BLAST has a ,10-fold increase in signal compared to the
largest results obtained from rps-BLAST (1010) and (3) the
positional data correspond with the results obtained from
TMHMM, even when tested with the expanded ILB DB under
the highest statistical limit of rps-BLAST. In all cases, correlation
exists between the curves obtained from the positional data and
the known structural elements.
While both of TMHMM and Adaptive GDDA-BLAST do not
accurately model the whole crystal structure, we observe
interesting features. For example, several of the membrane-
spanning helices are interrupted by loop regions that are not
identified by TMHMM. Indeed, the C-terminus of 1F88 (aa 288–
348) contains 3 small helices, the last of which is a bent-helix that is
believed to be parallel to the membrane (Figure 3 inset). Both rps-
BLAST and Adaptive GDDA-BLAST detect these smaller helices
while Adaptive GDDA-BLAST has the highest signal. Another
region of interest is contained between aa 91 and 111 which is a
loop in the crystal structure, but is predicted to be a short helix by
rps-BLAST and Adaptive GDDA-BLAST. We expect that this
loop may be a bent-helix similar to other regions in the protein
under native conditions.
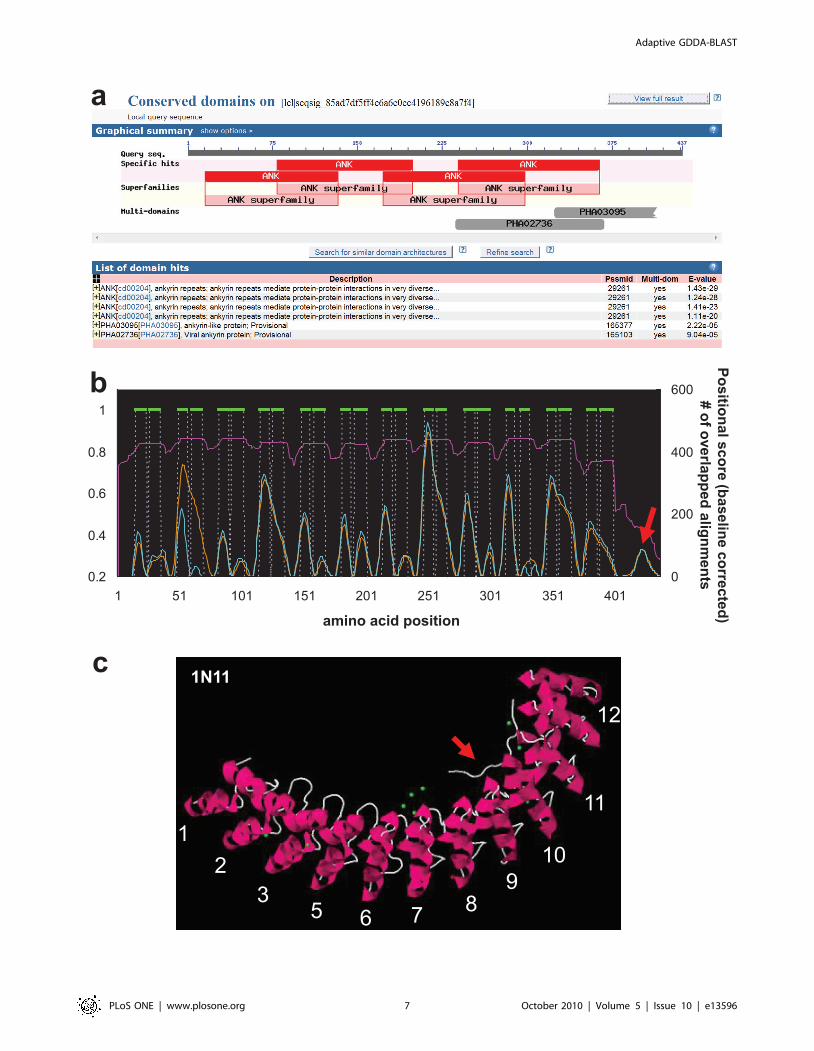
Characterization of Ankyrin-repeat Protein StructureTo further show the utility of Adaptive GDDA-BLAST, we did
the same analysis on a structurally resolved Ankyrin-repeat protein
called Human Ankyrin-R (PDB: 1N11) [29]. While TMHMM or
similar methods do exist to characterize the structures of
transmembrane proteins, there is no such method for Ankyrin-
repeat proteins. Therefore, this protein is the perfect example of
adding even more value to our method. 1N11 has 12 Ankyrin-
repeats where each Ankyrin-repeat is composed with two alpha
helices separated by loops (Figure 4-b). To see if we can
characterize the structure of this Ankyrin-repeat protein, we first
prepared 449 Ankyrin-repeat PSSMS that were generated with
the domain sequences returned by a simple keyword search of
‘‘ankyrin repeat’’ against NCBI CDD database. We then ran
1N11 against the PSSMs by Adaptive GDDA-BLAST. Figure 4-a
depicts the output of rps-BLAST (e-value threshold 0.01) which
predict that 1N11 has 4 Ankyrin-repeat domains. In contrast, the
overlapping alignments returned by Adaptive GDDA-BLAST
depict the domain architecture of 1N11 with all 12 Ankyrin-repeat
domains predicted (pink line in Figure 4-b). When we did the
positional analysis as we did for 1F88, Adaptive GDDA-BLAST
could see alpha helices in each Ankyrin-repeat even though the
results are not yet perfect. It is interesting that we have a signal at
the C-terminus of the protein which is long loop in the structure
(red arrow in Figure 4-b). This long loop is associated with a small
fragment of spectrin-binding domain [29]. Thus, it seems that the
small signal appears due to the function of Ankyrin-repeat proteins
mediating binding activities.
Methods
DefinitionsLet the target sequence be X and the query sequence be Y. The
length of sequence X is denoted as |X|. Assume that |X| and
|Y| are n and m, respectively. A subsequence of X from the i-thresidue to the j-th residue is denoted by xi,j such that
0ƒiƒjƒn{1. A subsequence of length one, such as xi,i, is
simply represented as xi. The concatenation of two sequences, X
and Y, is represented as X|Y. Two subsequences that are aligned
are represented within ( ). For example, (xa,r,yb,s) represents that
xa,r and yb,s are aligned.
Adaptive GDDA-BLAST
PLoS ONE | www.plosone.org 4 October 2010 | Volume 5 | Issue 10 | e13596
Adaptive GDDA-BLAST
PLoS ONE | www.plosone.org 5 October 2010 | Volume 5 | Issue 10 | e13596

An embedded (chimera) sequence is generated by embedding
either the N- or C-terminal portions of X as a ‘‘seed,’’ denoted by
S, to every position of Y . Usually p% of X (i.e., k residues of X
where k~qDX D|p|0:01r) is used as a seed. For example, let 10%
(p = 10) of a target be used as seed. If so, for a target of 100 amino
acid long (|X| = 100), 10 residues (k = 10) of N- or C- terminal of
the target are selected as a seed. Thus, N- and C-terminal seeds
can be represented as x0,k{1 and xn{k,n{1, respectively. A
chimera with a seed at the position q of Y is y0,q{1DSDyq,m{1, and
represented as C(q). Table 1 shows an example of a chimera. To
align the target sequence X and the query sequence Y , GDDA-
BLAST generates (m|2) number of chimera sequences, inserting
N- and C-terminal seeds from X at each position of Y (Figure 1-ii-
a). Each chimera is then aligned to X , using rps-BLAST (Figure 1-
iii). For each query, rps-BLAST is run independently, yielding a
total of (m|2|t) BLAST executions where t is the number of
target sequences. Moreoever, the same procedure needs to be
repeated for a total number of queries.
Note that chimera sequences differ only by the position of the
seed, implying that for two subsequent chimeras, a considerable
part of the computation is recyclable. In the Adaptive GDDA-
BLAST approach, we re-use the outputs from each step of rps-
BLAST for efficiency purposes. For clarity, we hereunder define
the outputs of each step. In the first step of rps-BLAST, we find
hits between X and Y . A hit of (xa,azw{1,yb,bzw{1), where w is a
word size, is denoted as h(a,b). Upon extension of two neighboring
hits without gaps between them, we obtain HSPs (High Scoring
Sequence Pairs) in the second step. An HSP to align xa,azr and
yb,bzr is denoted as hsp(a,b,r). If an HSP has a score high enough
to trigger gapped extension in the third stage, then an alignment is
generated through extending the HSP with gaps in both directions
from a residue pair in the highest scored region of the HSP. Note
that the pair from which gapped extension is initiated is often
referred to as a seed as well [24]. In order to avoid confusion, we
denote this as a GE starting pair to distinguish it from the embedded
seed of GDDA-BLAST.
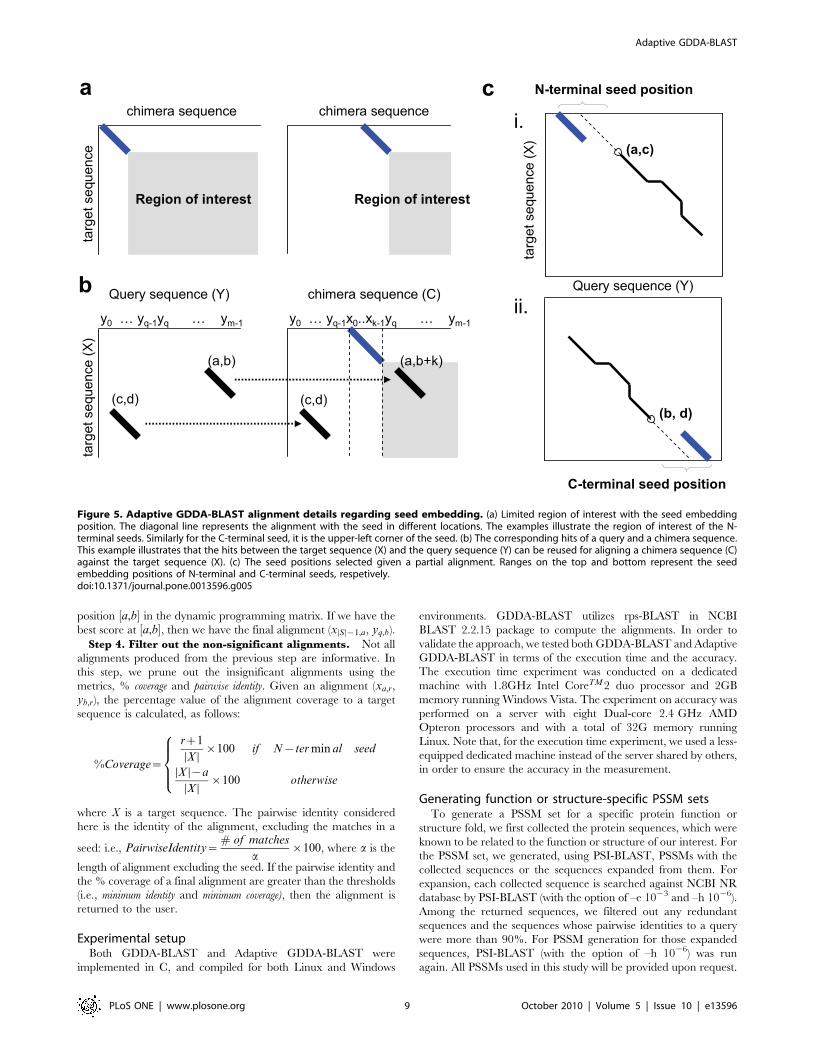
Observations of GDDA-BLASTObservation 1. Seeding limits the search space. Since a
seed provides an exact match, it is very likely that the GE starting
pair exists in an HSP that includes the seed. Moreover, we are only
interested in the alignments that include the seed, since the other
alignments are locatable through the conventional methods using
the original query sequence. This limits the search space of rps-
BLAST. For example, when a seed is inserted at the position 0 of a
query sequence, our search space will be the region in gray, as
shown in Figure 5-a(left). Further, every time seed-inserting
position is moved to the right, our search space is reduced, as is
shown in Figure 5-a(right). Note that, in case of the chimeras with
C-terminal seed, the search space is limited to the upper-left
corner from the start position of the seed.
Observation 2. Chimeras share hits. Because chimeras are
essentially the same sequence if the seeds are excluded, most of their
hits are conserved. Therefore, the hits between X and Y are resuable
in computation of the alignments of any chimera sequences.
Consider a chimera, C(q). Let hC(q) be a hit obtained, after the
first rps-BLAST step between X and C(q). The relation between X-Y
hits (i.e., h) and X-C(q) hits (i.e., hC(q)) is defined, as follows:
Lemma 1.
h(a,b)~
hC(q)(a,b) if 0ƒbƒq{w (a)
hC(q)(a,bzk) if qƒbƒm (b)
no hit otherwise
8><>:
where k is the seed length, q is the seed-inserting position and w is
the size of a hit.
Proof is omitted, since it is clearly shown in Figure 5-b. Note
that we are not interested in the hits of lemma 1-(a) (Figure 5-b
(c,d)), since they lie outside our interest, as demonstrated in
Observation 1. Therefore, we only use the hits of lemma 1-(b)
(Figure 5-b (a,b)) for alignment purposes.
Observation 3. Chimeras share HSPs after ungapped
extension. rps-BLAST performs ungapped extension on
neighboring hits, resulting in HSPs. Similar as in Observation 2,
we define the relation between an HSP of X-Y (i.e., hsp) and that
of X-C(q) (i.e., hspC(q)), as follows:
Lemma 2.
hsp(a,b,r)~
hspC(q)(a,b,r) if 0ƒbƒq{r
hspC(q)(a,bzk,r) if qƒbƒm
no HSP otherwise
8><>:
where r is the length of the HSP. The proof is straightforward
from lemma 1.
Observation 4. Chimeras share alignment paths in
gapped extension. Gapped extension in rps-BLAST starts at
a GE starting pair that is a central residue pair in the highest scoring
segment of any HSP whose score is sufficiently high. Different
alignments can be generated, if the gapped extension is performed
on different GE starting pairs and there is no guarantee that the
same GE starting pair is selected for different chimera sequences.
However, if a portion of a target sequence is conserved in a query
sequence, then it is very likely that the conserved region is aligned
for multiple neighboring chimera sequences. We exploit this
property to speed up the alignment process (Figure 6).
Observation 5. Not every chimera produces a useful
alignment. A seed provides artificial matches. It, however, is
not extendable if there are insufficient neighbouring HSPs to
connect to. Therefore, we can significantly reduce the com-
putational complexity of the alignment process by inserting seeds
only into a limited number of query positions that are likely to be
extended. Hence, in Adaptive GDDA-BLAST, we align the query
and the target sequence first, and then compute the seed-inserting
positions from the alignment result, prior to aligning the chimera
sequences.
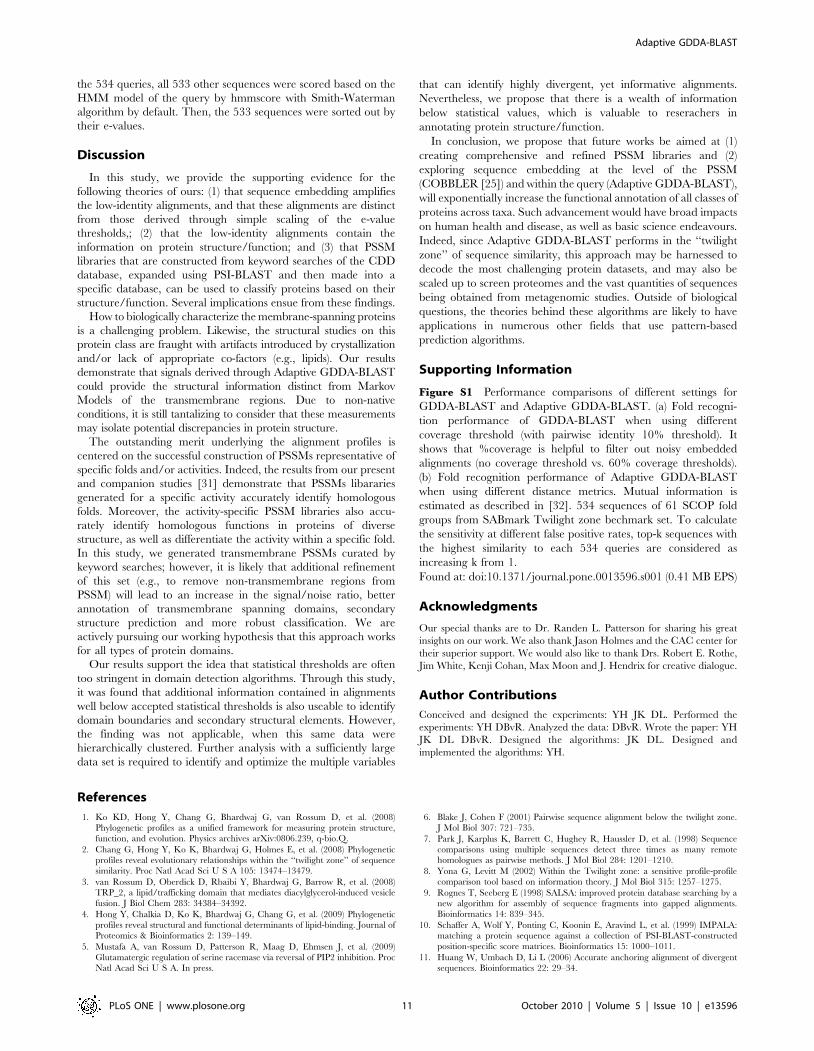
The Adaptive GDDA-BLAST AlgorithmAdaptive GDDA-BLAST works through four basic steps, as
shown in Figure 7. First, we find the conserved regions by
Figure 3. The Characterization of Membrane Spanning Regions. This graph shows the performance of the Hidden Markov Models (TMHMM),rps-BLAST and Adaptive GDDA-BLAST in determining the membrane-spanning domains in Bovine Rhodopsin as determined by X-ray Crystallography(Teal = Beta pleated sheets, Green = helices, loops not shown). This protein was analyzed with an expanded set of PSSMs representing a large varietyof transmembrane domains (,20K PSSMs). Compared with rps-BLAST, Adaptive GDDA-BLAST is more refined with respect to the annotation ofalpha-helices. Moreover, this data demonstrates that less statistically valid alignments (e.g., e-value 0.01 vs. 1010) are still informative for detecting thedomain boundaries and outperform lower thresholds. The full-length structure of Rhodopsin is shown (dimer) as well as an inset of the C-terminusthat is composed of three small helices with the last one folding parallel with the membrane (it is not transmembrane itself).doi:10.1371/journal.pone.0013596.g003
Adaptive GDDA-BLAST
PLoS ONE | www.plosone.org 6 October 2010 | Volume 5 | Issue 10 | e13596
Adaptive GDDA-BLAST
PLoS ONE | www.plosone.org 7 October 2010 | Volume 5 | Issue 10 | e13596

generating non-overlapping local alignments between the query
and the target sequence [30]. We call these partial alignments.
Second, for each partial alignment from Step 1, seed-inserting
positions are determined. Third, we produce final alignments
including the seeds. Finally, we filter out the non-significant
alignments, using quality parameters such as the %coverage and
%identity of the alignment to the corresponding PSSM.
Step 1. Find multiple non-overlapping local align-
ments. Huang et al. [30] proposed an algorithm to find the
multiple non-overlapping local alignments between two sequences.
We have adopted this algorithm to generate partial alignments
between the query and the target sequence. As a scoring matrix,
we can use any given substitution matrix (e.g., BLOSUM62,
BLOSUM45, PAM30, etc) or PSSM of a target sequence in our
algorithm.
The local alignments are found, as follows: First, the hits
between the query and the target sequence are found. A hit
consists of three consecutive residues with a score larger than a
threshold (i.e., minimum word score). For each hit, to generate an
HSP, the ungapped extension is performed until the score drops
below a threshold (HSP drop-off score). When a new HSP is
constructed, the hits involved in the HSP are removed to prevent
subsequent HSPs from extending over to them. This ensures that
all local alignments produced later are not overlapped. We keep
only the HSPs with scores larger than the threshold (minimum HSP
score). Gapped extension is then performed for each HSP to
generate partial alignments.
We keep only the partial alignments whose lengths are greater
than the threshold (i.e., minimum partial alignment length). The
minimum partial alignment length is proportionally determined to
the length of the target sequence. Since a partial alignment is a
locally most optimal alignment, it is not likely that a seed is
extended further than the end position of the partial alignment. In
the final step, a final alignment is chosen based on the the coverage
of the alignment over the target sequence. This pre-filtered partial
alignments are capable of removing the seed-inserting positions
where a seed is not expendable to the final alignments with
sufficient coverage.
Step 2. Select the seed embedding positions. In this step,
the seed-inserting positions in the query sequence are selected,
with the partial alignments obtained from Step 1. As discussed in
Observation 1, a final alignment is generated by extending a seed
from its end positions. Since a partial alignment is a locally optimal
alignment, the extension of a seed can be converged to the partial
alignment if a seed is inserted nearby and if the score of the path is
high enough. An alignment is usually generated with HSPs
connected with small numbers of gaps inbetween, because the
relatively high penalty of gaps is used in the sequence alignment
methods. In addition, the score of partial alignment on either side
of a gap must be higher than the gap penalty [9]. The gapped
extension usually commences from the seed to the partial
alignment, since the score of the alignment with the seed is
typically much higher than that of the partial alignment. For this
reason, it is possible to simply compute the seed-inserting positions
using the score of a seed and the distance from the seed to the
partial alignment.
Given a seed S with the score Score(S), the maximum gap G(S)
(i.e., the distance from the seed to the partial alignment) is
computed, as follows: G(S)~qScore(S){GOP
DGEPDr{1, where GOP
and GEP indicate a gap opening penalty and a gap extension
penalty, respectively. Given a query sequence Y and a partial
alignment (xa,r, yb,s), the query position q is subject to embedding
of a seed with length k, as shown hereunder. (1) For N-terminal
seed: max½{k,e{G(S)�ƒqƒmin½ezG(S),DY D{k{1�, where e~b{a; and (2) for C-terminal seed: max½k,DY Dz(e{G(S)){1�ƒqƒmin½DY Dzk{1,DY Dz(ezG(S)){1�, where e~s{r. Note that
the query embedding position q is computed in connection with the
original query sequence positions. For example, if the N-terminal
seed is inserted at the beginning of the query, then q is {k in order to
preserve the original query sequence positions in the alignment.
Recall that the region of interest starts immediately after the seed.
Thus, in this way, we could preserve the original positions for the
subsequent computations. The inserting positions for the C-terminal
seeds are similarly represented. For C-terminal calculations, if
max½k,DY Dz(e{G(S)){1� is larger than min½DY Dzk{1,DY Dz(ezG(S)){1�, then no C-terminal seed is inserted. The idea of
maximum gap has previously been described to connect the HSPs
with gaps [9].
Step 3. Generate the final alignments with a seed. For
each query position q identified in Step 2, we perform an
alignment with the seed S inserted in its corresponding position to
generate the final alignments. The final alignments are generated
by running dynamic programming, starting at the end position of
the seed, (DSD{1,q), and by proceeding to (DX D{1,DY D{1).
Since we work with highly divergent sequences that produce
low-identity alignments, it is reasonable to consider the following
scenario: a longer alignment with a lower score can be biologically
more meaningful than a shorter alignment with a higher score
[11]. Motivated by this observation, during the alignment, we
adjust an alignment score with respect to the length of the
alignment as follows:
sa½a,b�~sc½a,b�loga if aw1
sc½a,b� otherwise
�
where ½a,b� is a cell in the dynamic programming matrix, and
sc½a,b� and sa½a,b� are the scores before and after adjustment,
respectively. Note that a represents the alignment length at
Figure 4. The Characterization of Ankyrin-repeat Protein Structure. This graph shows the performance of Adaptive GDDA-BLAST indetermining the Ankyrin-repeat domains in Human Ankyrin-R as determined by X-ray Crystallography (Green = helices, loops not shown). This proteinwas analyzed with an expanded set of PSSMs representing Ankyrin-repeat domains (449 PSSMs). Adaptive GDDA-BLAST annotates 12 Ankyrin-repatdomains as well as their alpha-helices. Compared to rps-BLAST, Adaptive GDDA-BLAST shows the structure of 1N11 in much refiner resolution(orange: Fourier-transform point = 7, cyan: Fourier-transform point = 8).doi:10.1371/journal.pone.0013596.g004
Table 1. Residues of a chimera sequence.
y0,q21
N-terminal seed(S) yq,m21
Residue y0 y1 … yq21 x0 x1 … xk21 yq yq+1 … ym21
Chimeraindex
c0 c1 … cq21 cq cq+1 … cq+k21 cq+k+2 cq+k+3 … cm+k21
This table shows an example of chimera sequence with an N-terminal seed oflength k inserted into the position q of the original query sequence Y. Thelength of the resulting chimera sequence is mzk, where m is the length of theoriginal query sequence.]doi:10.1371/journal.pone.0013596.t001
Adaptive GDDA-BLAST
PLoS ONE | www.plosone.org 8 October 2010 | Volume 5 | Issue 10 | e13596
position ½a,b� in the dynamic programming matrix. If we have the
best score at ½a,b�, then we have the final alignment (xDSD{1,a, yq,b).
Step 4. Filter out the non-significant alignments. Not all
alignments produced from the previous step are informative. In
this step, we prune out the insignificant alignments using the
metrics, % coverage and pairwise identity. Given an alignment (xa,r,
yb,r), the percentage value of the alignment coverage to a target
sequence is calculated, as follows:
%Coverage~
rz1
DX D|100 if N{ter min al seed
DX D{a
DX D|100 otherwise
8>><>>:
where X is a target sequence. The pairwise identity considered
here is the identity of the alignment, excluding the matches in a
seed: i.e., PairwiseIdentity~# of matches
a|100, where a is the
length of alignment excluding the seed. If the pairwise identity and
the % coverage of a final alignment are greater than the thresholds
(i.e., minimum identity and minimum coverage), then the alignment is
returned to the user.
Experimental setupBoth GDDA-BLAST and Adaptive GDDA-BLAST were
implemented in C, and compiled for both Linux and Windows
environments. GDDA-BLAST utilizes rps-BLAST in NCBI
BLAST 2.2.15 package to compute the alignments. In order to
validate the approach, we tested both GDDA-BLAST and Adaptive
GDDA-BLAST in terms of the execution time and the accuracy.
The execution time experiment was conducted on a dedicated
machine with 1.8GHz Intel CoreTM2 duo processor and 2GB
memory running Windows Vista. The experiment on accuracy was
performed on a server with eight Dual-core 2.4 GHz AMD
Opteron processors and with a total of 32G memory running
Linux. Note that, for the execution time experiment, we used a less-
equipped dedicated machine instead of the server shared by others,
in order to ensure the accuracy in the measurement.
Generating function or structure-specific PSSM setsTo generate a PSSM set for a specific protein function or
structure fold, we first collected the protein sequences, which were
known to be related to the function or structure of our interest. For
the PSSM set, we generated, using PSI-BLAST, PSSMs with the
collected sequences or the sequences expanded from them. For
expansion, each collected sequence is searched against NCBI NR
database by PSI-BLAST (with the option of –e 1023 and –h 1026).
Among the returned sequences, we filtered out any redundant
sequences and the sequences whose pairwise identities to a query
were more than 90%. For PSSM generation for those expanded
sequences, PSI-BLAST (with the option of –h 1026) was run
again. All PSSMs used in this study will be provided upon request.
Figure 5. Adaptive GDDA-BLAST alignment details regarding seed embedding. (a) Limited region of interest with the seed embeddingposition. The diagonal line represents the alignment with the seed in different locations. The examples illustrate the region of interest of the N-terminal seeds. Similarly for the C-terminal seed, it is the upper-left corner of the seed. (b) The corresponding hits of a query and a chimera sequence.This example illustrates that the hits between the target sequence (X) and the query sequence (Y) can be reused for aligning a chimera sequence (C)against the target sequence (X). (c) The seed positions selected given a partial alignment. Ranges on the top and bottom represent the seedembedding positions of N-terminal and C-terminal seeds, respetively.doi:10.1371/journal.pone.0013596.g005
Adaptive GDDA-BLAST
PLoS ONE | www.plosone.org 9 October 2010 | Volume 5 | Issue 10 | e13596
Benchmark methodsFor detection of structural homology, the ROC curves of
GDDA-BLAST and Adaptive GDDA-BLAST were compared
with those of PSI-BLAST and SAM-T2K. The settings used to
run each method were: PSI-BLAST was run using NCBI NR
database-added 534 query sequences, with the settings of a
maximum number of 20 iterations (-j option), 0.0005 e-value
threshold to include sequences for a profile construction at each
iteration (-h option), and 1000 e-value threshold for returned
alignment in the final iteration (-e option). For each query, all
sequences that were aligned with the query out of 533 other
sequences were sorted by their e-values. In case of SAM-T2K,
target2k script in SAM 3.5 package was used for NCBI NR
database search for each query, and multiple alignments of the
returned sequences were generated. w0.4 was used to generate an
HMM model from the multiple sequence alignment. For each of
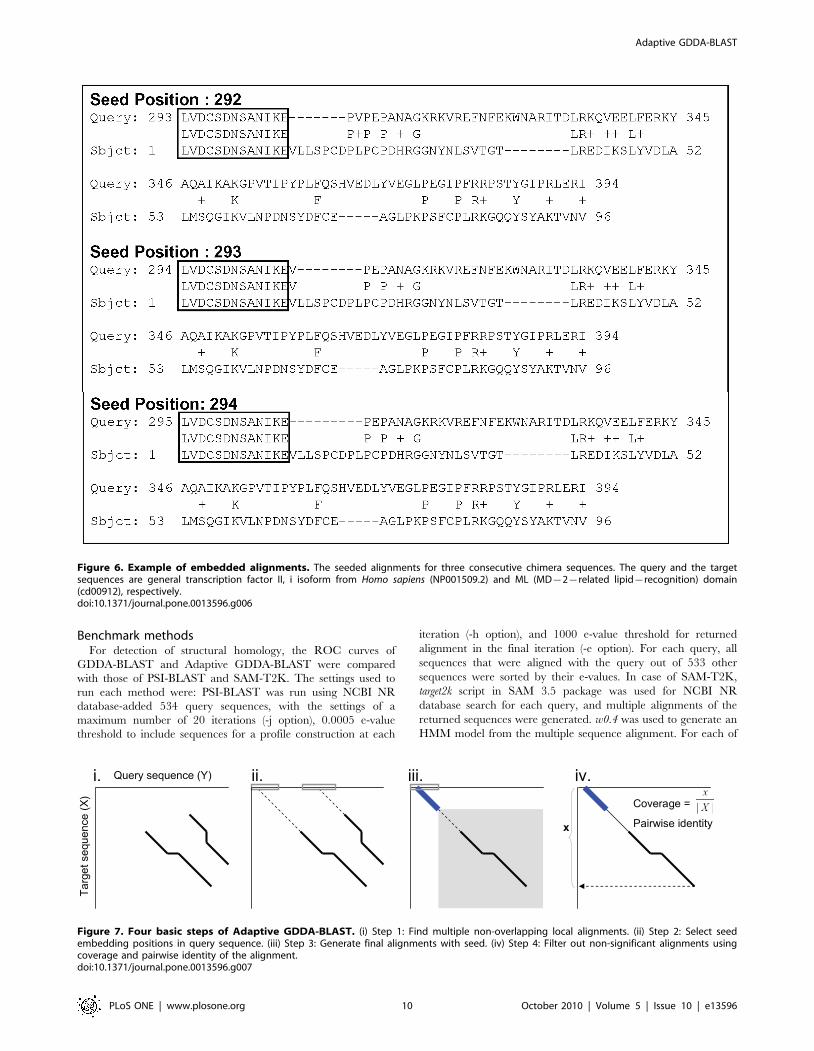
Figure 6. Example of embedded alignments. The seeded alignments for three consecutive chimera sequences. The query and the targetsequences are general transcription factor II, i isoform from Homo sapiens (NP001509.2) and ML (MD{2{related lipid{recognition) domain(cd00912), respectively.doi:10.1371/journal.pone.0013596.g006
Figure 7. Four basic steps of Adaptive GDDA-BLAST. (i) Step 1: Find multiple non-overlapping local alignments. (ii) Step 2: Select seedembedding positions in query sequence. (iii) Step 3: Generate final alignments with seed. (iv) Step 4: Filter out non-significant alignments usingcoverage and pairwise identity of the alignment.doi:10.1371/journal.pone.0013596.g007
Adaptive GDDA-BLAST
PLoS ONE | www.plosone.org 10 October 2010 | Volume 5 | Issue 10 | e13596
the 534 queries, all 533 other sequences were scored based on the
HMM model of the query by hmmscore with Smith-Waterman
algorithm by default. Then, the 533 sequences were sorted out by
their e-values.
Discussion
In this study, we provide the supporting evidence for the
following theories of ours: (1) that sequence embedding amplifies
the low-identity alignments, and that these alignments are distinct
from those derived through simple scaling of the e-value
thresholds,; (2) that the low-identity alignments contain the
information on protein structure/function; and (3) that PSSM
libraries that are constructed from keyword searches of the CDD
database, expanded using PSI-BLAST and then made into a
specific database, can be used to classify proteins based on their
structure/function. Several implications ensue from these findings.
How to biologically characterize the membrane-spanning proteins
is a challenging problem. Likewise, the structural studies on this
protein class are fraught with artifacts introduced by crystallization
and/or lack of appropriate co-factors (e.g., lipids). Our results
demonstrate that signals derived through Adaptive GDDA-BLAST
could provide the structural information distinct from Markov
Models of the transmembrane regions. Due to non-native
conditions, it is still tantalizing to consider that these measurements
may isolate potential discrepancies in protein structure.
The outstanding merit underlying the alignment profiles is
centered on the successful construction of PSSMs representative of
specific folds and/or activities. Indeed, the results from our present
and companion studies [31] demonstrate that PSSMs libararies
generated for a specific activity accurately identify homologous
folds. Moreover, the activity-specific PSSM libraries also accu-
rately identify homologous functions in proteins of diverse
structure, as well as differentiate the activity within a specific fold.
In this study, we generated transmembrane PSSMs curated by
keyword searches; however, it is likely that additional refinement
of this set (e.g., to remove non-transmembrane regions from
PSSM) will lead to an increase in the signal/noise ratio, better
annotation of transmembrane spanning domains, secondary
structure prediction and more robust classification. We are
actively pursuing our working hypothesis that this approach works
for all types of protein domains.
Our results support the idea that statistical thresholds are often
too stringent in domain detection algorithms. Through this study,
it was found that additional information contained in alignments
well below accepted statistical thresholds is also useable to identify
domain boundaries and secondary structural elements. However,
the finding was not applicable, when this same data were
hierarchically clustered. Further analysis with a sufficiently large
data set is required to identify and optimize the multiple variables
that can identify highly divergent, yet informative alignments.
Nevertheless, we propose that there is a wealth of information
below statistical values, which is valuable to reserachers in
annotating protein structure/function.
In conclusion, we propose that future works be aimed at (1)
creating comprehensive and refined PSSM libraries and (2)
exploring sequence embedding at the level of the PSSM
(COBBLER [25]) and within the query (Adaptive GDDA-BLAST),
will exponentially increase the functional annotation of all classes of
proteins across taxa. Such advancement would have broad impacts
on human health and disease, as well as basic science endeavours.
Indeed, since Adaptive GDDA-BLAST performs in the ‘‘twilight
zone’’ of sequence similarity, this approach may be harnessed to
decode the most challenging protein datasets, and may also be
scaled up to screen proteomes and the vast quantities of sequences
being obtained from metagenomic studies. Outside of biological
questions, the theories behind these algorithms are likely to have
applications in numerous other fields that use pattern-based
prediction algorithms.
Supporting Information
Figure S1 Performance comparisons of different settings for
GDDA-BLAST and Adaptive GDDA-BLAST. (a) Fold recogni-
tion performance of GDDA-BLAST when using different
coverage threshold (with pairwise identity 10% threshold). It
shows that %coverage is helpful to filter out noisy embedded
alignments (no coverage threshold vs. 60% coverage thresholds).
(b) Fold recognition performance of Adaptive GDDA-BLAST
when using different distance metrics. Mutual information is
estimated as described in [32]. 534 sequences of 61 SCOP fold
groups from SABmark Twilight zone bechmark set. To calculate
the sensitivity at different false positive rates, top-k sequences with
the highest similarity to each 534 queries are considered as
increasing k from 1.
Found at: doi:10.1371/journal.pone.0013596.s001 (0.41 MB EPS)
Acknowledgments
Our special thanks are to Dr. Randen L. Patterson for sharing his great
insights on our work. We also thank Jason Holmes and the CAC center for
their superior support. We would also like to thank Drs. Robert E. Rothe,
Jim White, Kenji Cohan, Max Moon and J. Hendrix for creative dialogue.
Author Contributions
Conceived and designed the experiments: YH JK DL. Performed the
experiments: YH DBvR. Analyzed the data: DBvR. Wrote the paper: YH
JK DL DBvR. Designed the algorithms: JK DL. Designed and
implemented the algorithms: YH.
References
1. Ko KD, Hong Y, Chang G, Bhardwaj G, van Rossum D, et al. (2008)
Phylogenetic profiles as a unified framework for measuring protein structure,
function, and evolution. Physics archives arXiv:0806.239, q-bio.Q.
2. Chang G, Hong Y, Ko K, Bhardwaj G, Holmes E, et al. (2008) Phylogenetic
profiles reveal evolutionary relationships within the ‘‘twilight zone’’ of sequence
similarity. Proc Natl Acad Sci U S A 105: 13474–13479.
3. van Rossum D, Oberdick D, Rbaibi Y, Bhardwaj G, Barrow R, et al. (2008)
TRP_2, a lipid/trafficking domain that mediates diacylglycerol-induced vesicle
fusion. J Biol Chem 283: 34384–34392.
4. Hong Y, Chalkia D, Ko K, Bhardwaj G, Chang G, et al. (2009) Phylogenetic
profiles reveal structural and functional determinants of lipid-binding. Journal of
Proteomics & Bioinformatics 2: 139–149.
5. Mustafa A, van Rossum D, Patterson R, Maag D, Ehmsen J, et al. (2009)
Glutamatergic regulation of serine racemase via reversal of PIP2 inhibition. Proc
Natl Acad Sci U S A. In press.
6. Blake J, Cohen F (2001) Pairwise sequence alignment below the twilight zone.
J Mol Biol 307: 721–735.
7. Park J, Karplus K, Barrett C, Hughey R, Haussler D, et al. (1998) Sequence
comparisons using multiple sequences detect three times as many remotehomologues as pairwise methods. J Mol Biol 284: 1201–1210.
8. Yona G, Levitt M (2002) Within the Twilight zone: a sensitive profile-profile
comparison tool based on information theory. J Mol Biol 315: 1257–1275.
9. Rognes T, Seeberg E (1998) SALSA: improved protein database searching by anew algorithm for assembly of sequence fragments into gapped alignments.
Bioinformatics 14: 839–345.
10. Schaffer A, Wolf Y, Ponting C, Koonin E, Aravind L, et al. (1999) IMPALA:matching a protein sequence against a collection of PSI-BLAST-constructed
position-specific score matrices. Bioinformatics 15: 1000–1011.
11. Huang W, Umbach D, Li L (2006) Accurate anchoring alignment of divergent
sequences. Bioinformatics 22: 29–34.
Adaptive GDDA-BLAST
PLoS ONE | www.plosone.org 11 October 2010 | Volume 5 | Issue 10 | e13596
12. van Rossum D, Patterson R, Sharma S, Barrow R, Kornberg M, et al. (2005)
Phospholipase Cgamma1 controls surface expression of TRPC3 through anintermolecular PH domain. Nature 434: 99–104.
13. Chakraborty A, Koldobskiy M, Sixt K, Juluri K, Mustafa A, et al. (2008) HSP90
regulates cell survival via inositol hexakisphophate kinase-2. Proc Natl AcadSci U S A 105: 1134–1139.
14. Nikolaidis N, Chalkia D, Watkins D, Barrow R, Snyder S, et al. (2007) Ancientorigin of the new development superfamily DANGER. PLoS ONE 2: e204.
15. Zachos N, van Rossum D, Li X, Caraveo G, Sarker R, et al. (2009)
Phospholipase Cgamma binds directly to the Na+/H+ exchanger 3 and isrequired for calcium regulation of exchange activity. J Biol Chem. In press.
16. Caraveo G, van Rossum D, Patterson R, Snyder S, Desiderio S (2006) Action ofTFII-I outside the nucleus as an inhibitor of agonist-induced calcium entry.
Science 314: 122–125.17. Pellegrini M, Marcotte E, Thompson M, Eisenberg D, Yeates T (1999)
Assigning protein functions by comparative genome analysis: protein phyloge-
netic profiles. Proc Natl Acad Sci U S A 96: 4285–4288.18. Kim Y, Subramaniam S (2006) Locally defined protein phylogenetic profiles
reveal previously missed protein interactions and functional relationships.Proteins 62: 1115–1124.
19. Wu J, Mellor J, DeLisi C (2005) Deciphering protein network organization using
phylogenetic profile groups. Genome Inform 16: 142–149.20. Bernstein F, Koetzle T, Williams G, Meyer E, Brice M, et al. (1977) The protein
data bank: a computer-based archival file for macromolecular structures. J MolBiol 112: 535–542.
21. Sonnhammer E, Eddy S, Durbin R (1997) Pfam: a comprehensive database ofprotein domain families based on seed alignments. Proteins 28: 405–420.
22. Letunic I, Copley R, Schmidt S, Ciccarelli F, Doerks T, et al. (2004) SMART
4.0: towards genomic data integration. Nucleic Acids Res 32: D142–D144.
23. Marchler-Bauer A, Anderson J, Cherukuri P, Weese-Scott C, Geer L, et al.
(2005) CDD: a conserved domain database for protein classification. Nucleic
Acids Res 33: D192–D196.
24. Altschul S, Madden T, Schaffer A, Zhang J, Zhang Z, et al. (1997) Gapped
BLAST and PSI-BLAST: a new generation of protein database search
programs. Nucleic Acids Res 25: 3389–3402.
25. Henikoff S, Henikoff J (1997) Embedding strategies for effective use of
information from multiple sequence alignments. Protein Sci 6: 698–705.
26. van Walles I, Lasters I, Wyns L (2005) SABmark- a benchmark for sequence
alignment that covers the entire known fold space. Bioinformatics 21:
1267–1268.
27. Baleanu-Gogonea C, Karnik S (2006) Model of the whole rat AT1 receptor and
the ligand-binding site. J Mol Biol 12: 325–337.
28. Sonnhammer E, von Heijne G, Krogh A (1998) A hidden Markov model for
predicting transmembrane helices in protein sequences. Proc Int Conf Intell Syst
Mol Biol 6: 175–182.
29. Michaely P, Tomchick D, Machius M, Anderson R Crystal structure of a 12
ANK repeat stack from human ankyrinR.
30. Huang X, Hardison R, Miller W (1990) A space-efficient algorithm for local
similarities. Comput Appl Biosci 6: 373–381.
31. Ko K, Hong Y, Bhardwaj G, Killick T, van Rossum D, et al. (2009)
Brainstorming through the sequence universe: theories on the protein problem.
Physics archives arXiv:0911.0652.
Adaptive GDDA-BLAST
PLoS ONE | www.plosone.org 12 October 2010 | Volume 5 | Issue 10 | e13596