Adapting to Climate Change through IWRM - adb.org · Project title Adapting to climate change...
144
National Environment Commission & Department of Agriculture, Royal Government of Bhutan Adapting to Climate Change through IWRM Contract N° CDTA BHU-8623 IRRIGATION ENGINEERING MANUAL March 2016 █ Egis Eau & Royal Society for Protection of Nature & Bhutan Water Partnership
-
Upload
dinhnguyet -
Category
Documents
-
view
220 -
download
0
Transcript of Adapting to Climate Change through IWRM - adb.org · Project title Adapting to climate change...

National Environment Commission & Department of Agriculture, Royal Government of Bhutan
AdaptingtoClimateChangethroughIWRM
ContractN°CDTABHU-8623
IRRIGATIONENGINEERINGMANUALMarch2016
█EgisEau&RoyalSocietyforProtectionofNature&
BhutanWaterPartnership

█ Egis Eau & RSPN/ BhWP Irrigation Engineering Manual
i
Documentqualityinformation
Generalinformation
Author(s) BasisthaAdhikari
Projecttitle AdaptingtoclimatechangethroughIWRM
Documenttitle IrrigationEngineeringManual
Date November2015
Reference
Addressee(s)
Sentto:
Name Organization Senton:
LanceGORE AsianDevelopmentBank,Manila
Copyto:
Name Organization Senton:
TenzinWangmo Chief,WaterResourcesCoordinationDivision,
NationalEnvironmentCommissionSecretariat,
RoyalGovernmentofBhutan
KarmaTshethar Chief,EngineeringDivision,Departmentof
Agriculture,MinistryofAgricultureandForests,
RoyalGovernmentofBhutan
JigmeNidup DeputyChief,WaterResourcesCoordination
Division,NationalEnvironmentCommission
Secretariat,RoyalGovernmentofBhutan
Historyofmodifications
Version Date Preparedby: Reviewed/validatedby:
1
2 26/08/2015 BasisthaRajAdhikari Dr.LamDorji(TeamLeader)
3 03/11/2015 BasisthaRajAdhikariDr.LamDorji(TeamLeader)andThierry
Delobel(ProjectDirectorEgis)

█ Egis Eau & RSPN/ BhWP Irrigation Engineering Manual
ii
Acronyms
ADB AsianDevelopmentBank
AWDO AsianWaterDevelopmentOrganisations
BhWP BhutanWaterPartnership
BSR BhutanScheduleofRates
CA Commandarea
CC ClimateChange
DG DirectorGeneral
DOA DepartmentofAgriculture
DWS DrinkingWaterSupply
FAO FoodandAgricultureOrganization
FGD FocusGroupDiscussion
FMIS FarmerManagedIrrigationSystem
GIS GeographicInformationSystem
GPS GeographicPositioningSystem
GW Groundwater
HP Hydropower
IFAD InternationalFundforAgricultureDevelopment
IWRM IntegratedWaterResourcesManagement
JICA JapanInternationalCooperationAgency
MOAF MinistryofAgricultureandForest
MOWHS MinistryofWorksandHumanSettlement
MOIC MinistryofInformationandCommunication
NEC NationalEnvironmentCommission
NECS NationalEnvironmentCommissionSecretariat
NIIS NationalIrrigationInformationSystem
NIMP NationalIrrigationMasterPlan
RBMP RiverBasinManagementPlan
RGOB RoyalGovernmentofBhutan
RSPN RoyalSocietyforProtectionofNature(Bhutan)
TA TechnicalAssistance
TAC TechnicalAdvisoryCommittee
UNCDF UnitedNationCapitalDevelopmentFund
USBR UnitedStatesBureauofReclamation
USDA UnitedStatesDepartmentofAgriculture
WB WorldBank
WRCD WaterResourcesCoordinationDivision
WUA WaterUsersAssociation
█ Egis Eau & RSPN/ BhWP Irrigation Engineering Manual
iii
TABLEOFCONTENTS
EXECUTIVESUMMARY.........................................................................................................................................X
CHAPTER-1...........................................................................................................................................................1
1. INTRODUCTION............................................................................................................................................1
1.1 BACKGROUND..................................................................................................................................................1
1.2 SCOPEOFTHEMANUAL......................................................................................................................................1
1.3 IRRIGATIONINBHUTAN......................................................................................................................................1
1.4 METHODOLOGYADOPTED..................................................................................................................................2
1.5 CONTENTS OF THE MANUAL........................................................................................................................3
CHAPTER-2...........................................................................................................................................................4
2. PROJECTSTUDYANDSURVEY......................................................................................................................4
2.1 NAMINGANDCODINGOFIRRIGATIONSCHEME......................................................................................................4
2.2 PROJECTDEVELOPMENTCYCLE............................................................................................................................4
2.3 IRRIGATIONPLANNING.......................................................................................................................................5
2.4 IDENTIFICATIONSTUDY......................................................................................................................................6
2.5 FEASIBILITYSTUDY.............................................................................................................................................8
2.6 ENVIRONMENTALIMPACTSTUDY.......................................................................................................................13
2.7 CLIMATECHANGEIMPACTSTUDY......................................................................................................................15
2.8 REPORTPREPARATION.....................................................................................................................................21
2.9 PROJECTSELECTIONANDPRIORITYRANKING........................................................................................................22
CHAPTER-3.........................................................................................................................................................24
3. HYDROLOGYANDAGRO-METEOROLOGY...................................................................................................24
3.1 HYDROLOGYOFBHUTAN..................................................................................................................................24
3.2 WATERAVAILABILITYFORIRRIGATION................................................................................................................24
3.3 ESTIMATIONOFDESIGNFLOODDISCHARGE.........................................................................................................28
3.4 WATERREQUIREMENTASSESSMENT..................................................................................................................37
3.5 WATERBALANCEASSESSMENT..........................................................................................................................46
3.6 DISCHARGEMEASUREMENT..............................................................................................................................46
CHAPTER-4.........................................................................................................................................................49
4. INTAKESANDHEADWORKS........................................................................................................................49
4.1 INTRODUCTION...............................................................................................................................................49
4.2 TYPESOFINTAKES...........................................................................................................................................49
4.3 SELECTIONOFSITEFORINTAKESANDHEADWORKS................................................................................................51
4.4 SIDEINTAKE...................................................................................................................................................52
4.5 DOUBLEORIFICEINTAKE..................................................................................................................................56
4.6 BOTTOMINTAKEORTRENCHINTAKE..................................................................................................................60
4.7 DIVERSIONHEADWORK....................................................................................................................................64
4.8 ENERGYDISSIPATIONINHYDRAULICSTRUCTURE...................................................................................................81

█ Egis Eau & RSPN/ BhWP Irrigation Engineering Manual
iv
4.9 PUMPEDIRRIGATIONSYSTEM............................................................................................................................84
CHAPTER-5.........................................................................................................................................................93
5. CANALSYSTEMDESIGN..............................................................................................................................93
5.1 INTRODUCTION...............................................................................................................................................93
5.2 TYPEOFCANALS.............................................................................................................................................93
5.3 LAYOUTPLANNING..........................................................................................................................................93
5.4 DESIGNCONCEPTOFIRRIGATIONCANALS............................................................................................................95
5.5 DESIGNOFUNLINEDCANALS............................................................................................................................96
5.6 LININGOFCANALS........................................................................................................................................102
5.7 COVEREDCANALS.........................................................................................................................................106
5.8 DESIGNOFPIPELINES.....................................................................................................................................114
5.9 CANALSALONGUNSTABLEAREAS.....................................................................................................................128
CHAPTER-6.......................................................................................................................................................132
6. CANALSTRUCTURES.................................................................................................................................132
6.1 INTRODUCTION.............................................................................................................................................132
6.2 REGULATINGSTRUCTURES..............................................................................................................................132
6.3 DROPSTRUCTURES.......................................................................................................................................145
6.4 CROSSDRAINAGESTRUCTURES.......................................................................................................................164
6.5 SEDIMENTCONTROLSTRUCTURES....................................................................................................................183
6.6 RETAININGWALLS........................................................................................................................................190
6.7 WATERCONTROLGATES................................................................................................................................195
6.8 STRUCTURALDESIGNOFCANALSTRUCTURES.....................................................................................................197
CHAPTER-7.......................................................................................................................................................204
7. MICROIRRIGATION..................................................................................................................................204
7.1 INTRODUCTION.............................................................................................................................................204
7.2 SPRINKLERIRRIGATIONSYSTEM.......................................................................................................................204
7.3 DRIPIRRIGATION..........................................................................................................................................214
7.4 LOWCOSTSIMPLEDRIPSYSTEM.....................................................................................................................222
7.5 WATERHARVESTING.....................................................................................................................................224
CHAPTER-8.......................................................................................................................................................230
8. RIVERTRAININGANDFLOODCONTROLWORKS.......................................................................................230
8.1 RIVERSOFBHUTAN.......................................................................................................................................230
8.2 FLOODS......................................................................................................................................................230
8.3 RIVERTRAININGWORKS................................................................................................................................233
8.4 BANKPROTECTIONWORKS............................................................................................................................242
8.5 MATHEMATICALMODELSFORRIVERSTUDIES.....................................................................................................246
CHAPTER9.......................................................................................................................................................248
9. PROJECTEVALUATION.............................................................................................................................248
9.1 INTRODUCTION.............................................................................................................................................248

█ Egis Eau & RSPN/ BhWP Irrigation Engineering Manual
v
9.2 AGRICULTUREBENEFITASSESSMENT................................................................................................................248
9.3 PROJECTCOSTESTIMATE...............................................................................................................................251
9.4 ECONOMICANALYSIS.....................................................................................................................................253
10. BASISTERMSUSEDINTHEMANUAL....................................................................................................257
11. REFERENCES.........................................................................................................................................259

█ Egis Eau & RSPN/ BhWP Irrigation Engineering Manual
vi
LISTOFTABLES
Table 2-1 Project development cycle ........................................................................................................... 4Table 2-2 Topographical survey standards ............................................................................................... 10Table 2-3 Potential impacts of climate change on irrigation ....................................................................... 15Table 2-4 Components of the baseline assessment .................................................................................. 17Table 2-5 Example of climate change adaptation planning ........................................................................ 20Table 2-6 Evaluation criteria for scheme priority ranking ........................................................................... 23Table 3-1 80% Reliable Flow of Thimchhu at Lungtenphug (m3/s) ........................................................... 25Table 3-2 Worked out example of 80 % reliable flow ................................................................................. 26Table 3-3 Values of coefficients for WECS method ................................................................................... 27Table 3-4 Example of mean monthly flow .................................................................................................. 27Table 3-5 Suggested Return Period ........................................................................................................... 28Table 3-6 Annual Maximum Flow of Thimpu Chhu (m3/s) ......................................................................... 29Table 3-7 Standard Normal Variate ............................................................................................................ 32Table 3-8 Hydrological Soil Groups and CN Values .................................................................................. 34Table 3-9 Slope Categories ........................................................................................................................ 34Table3-10Growthfactorsformaximumrainfall .............................................................................................. 35Table 3-11 Areal Reduction Factor for 24 Hours Point Rainfall ................................................................. 35Table 3-12 Possible Cropping Patterns of Bhutan ..................................................................................... 37Table 3-13 Worked out example of Cropwat-8 ........................................................................................... 39Table 3-14 Crop Coefficients of Selected Crops ........................................................................................ 40Table 3-15 Land Preparation Requirements .............................................................................................. 40Table 3-16 Estimated Deep Percolation Losses (mm/day) ........................................................................ 41Table 3-17 Worked out example of reliable and effective rainfall (mm) ..................................................... 43Table 3-19 Irrigation water duty .................................................................................................................. 44Table 3-18 Worked out example of crop water requirement ...................................................................... 45Table 3-20 Discharge Measurement with Bucket-Watch Method .............................................................. 48Table 4-1 Velocity and head loss across gravel trap .................................................................................. 53Table 4-2 Design of undersluice ................................................................................................................. 72Table 4-3 Design example of weir .............................................................................................................. 77Table 4-4 Selection of energy dissipaters .................................................................................................. 82Table 5-1 Recommended side slopes of canal .......................................................................................... 98Table 5-2 Maximum permissible velocities and tractive forces .................................................................. 98Table 5-3 Values of roughness coefficient ............................................................................................... 101Table 5-4 Recommended roughness coefficients for lined canal ............................................................. 105Table 5-5 Coefficients for inlet and outlet of different transitions ............................................................. 108Table 5-6 Hydraulic properties of part full flowing pipe ............................................................................ 108Table 5-7 Water pressure according to the head ..................................................................................... 114Table 5-8 Length to diameter ratio of different fittings .............................................................................. 115Table 5-9 Hazen-William's flow coefficients ............................................................................................. 120Table 5-10 Values of pipe roughness ....................................................................................................... 121Table 5-11 Head loss coefficients at pipe inlet ......................................................................................... 123Table 5-12 Head loss coefficients for sudden pipe expansion ................................................................. 124Table 5-13 Head loss coefficient for sudden contraction of pipe .............................................................. 124Table 5-14 Head loss coefficient for gradual expansion .......................................................................... 124Table 5-15 Head loss coefficients for elbows of pipeline ......................................................................... 125Table 5-16 Head loss coefficients for orifice ............................................................................................ 126Table 5-17 Head loss coefficients for valves ............................................................................................ 127Table 5-18 Sample design sheet of pipeline works .................................................................................. 131Table 6-1 Hydraulic jump calculations ...................................................................................................... 135Table 6-2 Widths of Outlet Openings ....................................................................................................... 142Table 6-3 Discharge through Pipe Outlets (Pipe length < 6 m) ................................................................ 143Table 6-4 Bhutan Road Standards ........................................................................................................... 161

█ Egis Eau & RSPN/ BhWP Irrigation Engineering Manual
vii
Table 6-5 Coefficients for friction loss in siphon barrel ............................................................................. 178Table 6-6 Flow velocity through gravel trap ............................................................................................. 183Table 6-7 Design Calculations of Retaining Wall ..................................................................................... 192Table 6-8 Standardized size of gates and their weight ............................................................................ 197Table 6-9 Self-weight of materials ............................................................................................................ 198Table 6-10 Allowable bearing pressure of the soil ................................................................................... 201Table6-11Lanesweightedcreepratio .......................................................................................................... 202
Table6-12ConcreteGradesandUses ........................................................................................................... 202
Table6-13ReinforcementBars ..................................................................................................................... 203Table 7-1 Infiltration rate of different soils ................................................................................................ 209Table 7-2 F-factor value for head loss in pipes ........................................................................................ 209Table 7-3 Reference crop evapo-transpiration and crop coefficients ....................................................... 210Table 7-4 Calculation of reservoir capacity .............................................................................................. 211Table 7-5 Design of pipelines for sprinkler irrigation system .................................................................... 212Table 7-6 Reference crop evapo-transpiration and crop coefficients ....................................................... 218Table 7-7 Head loss calculations of laterals ............................................................................................. 220Table 7-8 Head loss calculations in sub-main line ................................................................................... 221Table 7-9 Head loss calculation in main line ............................................................................................ 221Table 7-10 Typical models of simple drip irrigation system being used in India ...................................... 224Table 7-11 Pond lining materials .............................................................................................................. 228Table 9-1 Sample agricultural benefit assessment matrix ........................................................................ 250Table 9-2 Sample quantity estimate form ................................................................................................. 252Table 9-3 Sample cost estimate form ....................................................................................................... 253Table 9-4 Typical Example of Economic Analysis .................................................................................... 256
LISTOFFIGURES
Figure 2-1 Parameters and issues of vulnerability assessment ................................................................. 18Figure 3-1 Worked out Example of Reliable Rainfall .................................................................................. 42Figure 3-2 Discharge measurement with float area method ...................................................................... 47Figure 4-1 Layout plans of side intakes ...................................................................................................... 51Figure 4-2 Idle Locations for Side Intakes .................................................................................................. 52Figure 4-3 Free flow and submersed flow orifice ....................................................................................... 53Figure 4-4 Side intake design ..................................................................................................................... 56Figure 4-5 Typical sketch of a double orifice intake ................................................................................... 57Figure 4-6 Double orifice intake ................................................................................................................. 58Figure 4-7 Bottom intake design ................................................................................................................ 62Figure 4-8 Definition sketch of weir and its components ............................................................................ 65Figure 4-9 Vertical drop weir ...................................................................................................................... 65Figure 4-10 Sketch of rockfill weir .............................................................................................................. 66Figure 4-11 Sketch of concrete weir ........................................................................................................... 66Figure 4-12 Typical weirs ........................................................................................................................... 67Figure 4-13 Design sketch of undersluice .................................................................................................. 74Figure 4-14 Design sketch of weir .............................................................................................................. 79Figure 4-15 Sketches of different types of energy dissipaters ................................................................... 83Figure 4-16 Sketches of Pumps ................................................................................................................. 84Figure 4-17 Sketch of total dynamic head .................................................................................................. 85Figure 4-18 Sketches of pump characteristic curves ................................................................................. 86Figure 5-1 Canal Layouts ........................................................................................................................... 94Figure 5-2 Small Scale Canal Layouts ....................................................................................................... 94Figure 5-3 Alternative Layout for Small Scale Canals ................................................................................ 95

█ Egis Eau & RSPN/ BhWP Irrigation Engineering Manual
viii
Figure 5-4 Schematic Diagram of Canal System ....................................................................................... 97Figure 5-5 Typical section of trapezoidal canal .......................................................................................... 99Figure 5-6 Typical longitudinal profile of canal ......................................................................................... 100Figure 5-7 Typical stone masonry and concrete lining ............................................................................. 103Figure 5-8 Ferro cement and soil-cement linings ..................................................................................... 104Figure 5-9 Typical covered canals ........................................................................................................... 107Figure 5-10 Design chart for concrete pipes ............................................................................................ 112Figure 5-11 Design chart for HDPE pipes ................................................................................................ 113Figure 5-12 Gate and globe valves .......................................................................................................... 115Figure 5-13 Typical layout of pipeline ....................................................................................................... 117Figure 5-14 Typical air release valves ...................................................................................................... 117Figure 5-15 Typical plan of break pressure tank ...................................................................................... 118Figure 5-16 Typical valve chamber .......................................................................................................... 119Figure 5-17 Moody's diagram for friction loss ........................................................................................... 122Figure 5-18 Sudden expansion and contraction of pipes ......................................................................... 124Figure 5-19 Typical gradual expansion of pipeline ................................................................................... 125Figure 5-20 Sketch of flow from straight pipe to tee and tee to straight pipe .......................................... 126Figure 5-21 Typical sketch of trash screen bars ...................................................................................... 127Figure 5-22 Three types of canal instability .............................................................................................. 129Figure 5-23 Canal instability problems and their solutions ....................................................................... 130Figure 6-1 Alignment of Head Regulator .................................................................................................. 132Figure 6-2 Flow conditions of an orifice .................................................................................................... 133Figure 6-3 Design Sketch of head regulator ............................................................................................. 136Figure 6-4 Proportional Dividers ............................................................................................................... 139Figure 6-5 Typical outlet structure ............................................................................................................ 141Figure 6-6 Typical outlet of Tsirang Irrigation Schemes ........................................................................... 142Figure 6-7 Pipe Outlets ............................................................................................................................ 144Figure 6-8 Definition sketch of drop structure .......................................................................................... 145Figure 6-9 Design sketch of vertical drop ................................................................................................. 146Figure 6-10 Nomogram for the design of Vertical Drop Structure ............................................................ 147Figure 6-11 Relation between Froude number and length of jump .......................................................... 148Figure 6-12 Design sketch of chute drop ................................................................................................. 149Figure 6-13 Energy Loss in Hydraulic Jump ............................................................................................ 150Figure 6-14 Design sketch of pipe prop ................................................................................................... 152Figure 6-15 Design graph of outlet basin (USBR) .................................................................................... 153Figure 6-16 Design sketch of cascade drop ............................................................................................. 155Figure 6-17 Sketch of stop-log escape ..................................................................................................... 159Figure 6-18 Typical road bridge ............................................................................................................... 161Figure 6-19 Tributary River Crossing Options .......................................................................................... 166Figure 6-20 Typical aqueducts ................................................................................................................. 168Figure 6-21 Design sketch of aqueduct .................................................................................................... 170Figure 6-22 Typical super passages ........................................................................................................ 173Figure 6-23 Design sketch of super passage ........................................................................................... 175Figure 6-24 Typical shallow and deep siphons ........................................................................................ 176Figure 6-25 Design sketch of trash rack ................................................................................................... 177Figure 6-26 Typical deep siphon .............................................................................................................. 180Figure 6-27 Typical photos of HDPE pipe crossing .................................................................................. 181Figure 6-28 Typical gravel trap structure .................................................................................................. 184Figure 6-29 Typical configuration of settling basin ................................................................................... 185Figure 6-30 Settling basin design curves ................................................................................................. 188Figure 6-31 Scouring velocities for sand trap ........................................................................................... 189Figure 6-32 Design load diagram of retaining wall ................................................................................... 192Figure 6-33 Possible retaining walls in small canals ................................................................................ 194Figure 6-34 Typical vertical lift gate and stop-logs ................................................................................... 196Figure6-35Schematicpressurediagramofwalls ........................................................................................... 199
Figure6-36Sketchofseepagepathunderneaththestructure ......................................................................... 201

█ Egis Eau & RSPN/ BhWP Irrigation Engineering Manual
ix
Figure 7-1 Type of sprinkler irrigation system .......................................................................................... 206Figure 7-2 Components of sprinkler irrigation system .............................................................................. 207Figure 7-3 Typical sprinkler irrigations ..................................................................................................... 208Figure 7-4 Layout Plan of Sprinkler Irrigation System .............................................................................. 213Figure 7-5 Examples of drip irrigation method ......................................................................................... 214Figure7-6Schematicdiagramofwaterdistributioncomponentofdripirrigationsystem .................................. 216Figure 7-7 Layout plan of designed drip irrigation system ........................................................................ 222Figure 7-8 Schematic diagram of simple drip irrigation system ................................................................ 223Figure 7-9 Typical examples of rainwater harvesting from rooftops ......................................................... 225Figure7-10Typicalcrosssectionofexcavatedponds ...................................................................................... 226Figure 7-11 Standards of water harvesting ponds ................................................................................... 227Figure 8-1 Examples of river training works in Bhutan ............................................................................. 233Figure 8-2 Length and Plan shape of Guide Banks ................................................................................. 235Figure8-3Embankmentsectionofguidebank ............................................................................................... 236Figure 8-4 Spur types in relation to flow direction .................................................................................... 237Figure 8-5 Spur angle (φ) to flow direction ............................................................................................... 238Figure 8-6 Definition sketch of cut-off ....................................................................................................... 238Figure8-7Typicalbankfailure ...................................................................................................................... 242
Figure8-8Rip-rapforbankprotection .......................................................................................................... 243
Figure8-9Basictypesoftoeprotection ......................................................................................................... 244

█ Egis Eau & RSPN/ BhWP Irrigation Engineering Manual
x
EXECUTIVESUMMARYThe updating of the existing irrigation engineering manual 1998 covers the planning, survey, design and evaluation of an irrigation scheme. The manual mainly focuses on the hydrology, hydraulics, planning and design of hydraulic structures, canal layout and design headwork and intakes, micro irrigation and river training and flood control works. In addition, the manual covers crop planning, water demand assessment, and water balance assessment. The limitation of the manual is that it does not cover institutional and construction management aspects of irrigation project preparation. The target group of the manual is the engineering professionals of the Department of Agriculture. However, the manual will also benefit all irrigation practitioners from both the public and private sectors. The Irrigation Engineering Manual is organized into nine chapters. The introductory chapter (Chapter 1) presents irrigation in Bhutan, the methodology adopted and the contents of the manual. Chapter two (2) of the manual describes project study and survey procedures, highlighting identification and feasibility studies, including environment assessment.
In the planning of an irrigation scheme, the water requirement and its availability at the particular location need to be assessed first in addition to the availability of suitable land for agricultural production. The water availability and requirement together decide the area to be irrigated, and the size and capacity of the conveyance system. The planning and design of an irrigation scheme must consider whether the land is suitable for irrigated agriculture, climate conditions are favorable, and water is available for the proposed cropping pattern. The identification of the scheme is the very first step of the project development process. The Dzongkhag/Gewog level office should ask the farmers through their leaders about the necessity of the rehabilitation of an existing scheme or the construction of a new scheme. In addition, local level officers should disseminate information about the plans and program of the Department of Agriculture (DOA) on irrigation development and management.
The feasibility study is the basis for project implementation and is carried out by a team of experts with engineering, agriculture, and socio-environmental backgrounds. The feasibility study covers topographical, hydrological, agricultural, geological and socio-economic surveys. In addition, the study assesses the technical feasibility, economic viability and institutional suitability of project implementation. The priority ranking of the scheme is carried out based on techno-economic, social and environmental criteria.
Chapter three of the manual addresses hydrology and agro-meteorology questions. This chapter highlights the procedures followed to assess the availability of water for irrigation, flood flows, and crop and irrigation water requirements, including water balances. According to the Food and Agriculture Organization (FAO), 80% dependable river flow is used to estimate the water available for irrigation diversion. Given the large spatial variation in run-off in Bhutan and the significant number of small catchments, it is unlikely that gauging stations will be found at the point of irrigation diversion. For gauged catchments, water availability is assessed with the help of frequency analysis; for ungauged catchments, other empirical methods need to be adopted.
The discharge adopted for the design of a hydraulic structure is referred to as design flood discharge. The estimation of design flood is essential for the design of all hydraulic structures. The return period (T) of the flood flow is the indicator which determines the relative importance of the various hydraulic structures. For gauged catchments, design flood is assessed with the help of statistical analysis; for ungauged catchments, other empirical methods are used which are briefly described.
The crop water requirement is estimated with the evapo-transpiration (ETo) of a reference crop and multiplied by the crop coefficients of proposed crops. The ETo is calculated using Cropwat-8, software developed by the FAO. The total crop water requirement is assessed with the addition of land preparation and deep percolation losses during cultivation practices. The net crop water requirement is assessed by deducting effective rainfall from the total crop water requirement. The effective rainfall is calculated from the 80% reliable rainfall of the area. The intake water requirement is calculated with consideration of the irrigation system’s efficiency. The water balance at the diversion point of the source river is calculated by considering downstream environmental flow and upstream abstractions.

█ Egis Eau & RSPN/ BhWP Irrigation Engineering Manual
xi
Chapterfour(4)providesbasicconceptsofintakesanddiversionheadworksalongwiththeirdesign
proceduresandworkedoutexamples.This chapteralsoaddressespump irrigationwith itsdesign
proceduresandaworkedoutexample.Intakestructuresarehydraulicdevicesbuiltattheheadof
an irrigation canal, whereas the structure supplying water to the off-taking canal is called a
headwork. Headworks may be a storage headwork or a diversion headwork. According to the
methodofdivertingwaterfromthesource,intakesarebankintakes,sideintakeswithcrossweirs,
bottomintakes,frontalintakes,submergedintake,andtowerintakes.
A diversionheadworkmaybe aweir or a barragedependingupon theobjective of the irrigation
scheme. Weirs are solid walls across the river to raise the water level and to divert it into the
irrigation canal.Weirsmay be providedwith small shutters on the top. During flooding, there is
considerableaffluxontheupstreamsideofaweirbecausetheentiredischargeoftheriverhasto
passovertheweir’screst.
Abarrageissimilartoaweirbutisequippedwithgatestoheadupthewateronitsupstreamside.
The barrage crest level is on the average river bed level and has minimum afflux. From an
operationalpointofview,abarrage isbetterthanaweir;however, thecostofabarrage ismuch
higherthanthatofaweir.Themaincomponentsofaheadworkareweirs,dividewalls,fishladders,
under sluices, head regulators, abutments, guide bunds and canals. Based on the flow
characteristics,weirs are categorizedas sharp crestedweirs andbroad crestedweirs. In addition,
weirsarealsocategorizedaccordingtothematerialsusedintheirconstruction.Thedesignofaweir
involveshydraulicdesignandstructuraldesign.Thehydraulicdesigninvolvestheassessmentofthe
lengthofthewaterway,crestlevelsoftheweirandundersluice,depthofcutoffsinrelationtoboth
scourandexitgradients,level,lengthandthicknessoffloors,andlengthofprotectionworks.
This chapter also provides design concepts on energy dissipation devices to be used in hydraulic
structures which are mostly based on the hydraulic jump formation. In addition, this chapter
presents thedesignconcept,proceduresandworkedoutexampleofapumped irrigationsystem,
includingbriefnotesonpumpcharacteristics,theselectionandsitingofpumps,andtheselectionof
pipesandfittings.
Chapter five (5) presents the basic concept of canal design in both erodible and non-erodible beds, along with design procedures and worked out examples of a canal system. This chapter also contains concept notes on the types and layout of canals, lined and unlined canals, and piped canals. Design parameters such as canal side slope, permissible velocities, bed width to depth ratio, canal longitudinal slope, Manning’s roughness coefficient, freeboard, and minimum radius of curvature are briefly presented. With regard to lining types, this chapter includes brief notes on stone masonry lining, concrete lining, soil cement lining, Ferro cement lining, plastic lining and slate lining, followed by design procedures and worked out examples. The design concept and worked out examples of pipes flowing full and pipes flowing partially full are provided in the covered canal section. In addition, this chapter covers the design of pipelines, including concept notes on hydraulic grade lines, control valves, frictional head loss pressure limits, air blocks and washouts, control valves, and break pressure tanks. It also provides formulae for the assessment of head losses in pipes and fittings. Furthermore, this chapter covers issues and concerns of hill irrigation canals in unstable areas such as those prone to landslides, and mass slips. Chapter six (6) presents the design concept, procedures and worked out examples of canal structures, highlighting various types of structures. The canal structures are grouped into regulating structures, drop structures, cross drainage structures, and sediment control structures. For regulating structures, the manual provides the design concept, procedures and worked out examples of the head regulator, flow divider or proportional divider, and field outlets or offtakes. The drop structures

█ Egis Eau & RSPN/ BhWP Irrigation Engineering Manual
xii
section covers the design concept, procedures and worked out examples of vertical drops, chute drops, pipe drops, cascade drops, escape structure, bridges and culverts. Cross drainage structures are the main structures in an irrigation scheme, and are grouped into aqueduct, super passage, siphon, pipe crossings and level crossings. The manual provides selection criteria for cross drainage structures, design considerations, merits and demerits, design procedures and worked out examples of these structures. For the sediment control structures, the manual presents the design of gravel traps and settling basins along with worked out examples. The section on retailing walls describes common types of retaining walls based on the materials used, the design concept, the procedures for design and a worked out example. Chapter six also provides the general design concept for water control gates, including types of gates and the standard size for small scale irrigation schemes. In addition, this chapter provides the structural design concept of hydraulic structures including loadings and structural analysis, factor of safety for stability, and bearing pressure. This section also includes the concept of seepage and uplift design, and concrete design for hydraulic structures. Chapter seven (7) covers micro irrigation, with a focus on the design concept, procedures and worked out examples of sprinkler irrigation system, drip irrigation system and water harvesting. In addition, this chapter briefly describes the advantages and constraints of sprinkler and drip systems, types of sprinkler systems and their components. This chapter also includes the design concept and typical models of a simple drip irrigation system. The water harvesting section provides information on types of water harvesting, the design concept of ponds and tanks, design standards used elsewhere in the region, methods of sealing water harvesting ponds or tanks, and a worked out example of pond design. Chapter eight (8) contains the design concept and design procedures of river training and flood control works. This chapter opens with general information on the rivers of Bhutan, types of floods, and flood prone areas in the country. This chapter also provides brief concept notes on types of river training works, which include embankment bunds and guide bunds, spurs and groynes, cutoffs and pitching of banks along with their design parameters and standards. This chapter illustrates the detailed design procedures of river training works. It also includes the design concept and methods of bank protection works along with the design procedure of revetment works. At the end of this chapter, brief notes on the mathematical models used for river studies -- HEC HMS, HEC RAS, MIKE BASIN, MIKE 11 and MIKE FLOOD—are provided. The Irrigation Engineering Manual concludes with chapter nine (9), which covers project evaluation, providing the concept and procedures of agricultural benefit assessment, estimate of project costs, and economic analysis. Agricultural benefits are assessed on the basis of per unit benefits of crop yields and the agricultural inputs involved in growing particular crops. The main agricultural inputs are seeds, fertilizer, pesticide, labor, and animal power. The project cost estimate includes unit rates of the items of work, detailed quantity of the works and cost of the works. The derivation of unit rates is based on the Bhutan Schedule of Rates (BSR), which is published each year by the Ministry of Works and Human Settlement (MOWHS). The quantity of works is assessed according to the dimensions of the works as prescribed in the approved drawings. The cost of civil works comes from the multiplication of quantity and the unit rates. The total project cost may include other costs such as mobilization costs, cost for consulting services, supervision costs, cost for bank commissions etc.

█ Egis Eau & RSPN/ BhWP Irrigation Engineering Manual
1
CHAPTER-1
1. Introduction
1.1 Background
Development of irrigation will benefit the agriculture sector by facilitating adaptation to climate
change, increasingagricultureproductivityand incomes,and improvingrural livelihoods(Severaju,
2014). Although Bhutan has a long history of irrigation scheme planning, design and
implementation,itwasfeltthattheexistingirrigationengineeringmanualneededtobeupdated.In
thiscontext,AsianDevelopmentBankTechnicalAssistance(ADB-TA-8623)onAdaptationtoClimate
Change through Integrated Water Resources Management (IWRM) aims to update the existing
IrrigationEngineeringManualof theDepartmentofAgriculture (DOA)aspartof its strengthening
governance and capacity development. This manual will benefit those involved in the planning,
design,construction,operationandmaintenanceofirrigationschemes.
1.2 Scopeofthemanual
Themainobjective is toupdatetheexisting IrrigationEngineeringManual1998.Thescopeof the
manualcovers irrigationprojectpreparation, fromplanningandsurveys todesignandevaluation.
The manual mainly focuses on the hydrology, hydraulics, planning and design of hydraulic
structures, canal layout, conceptof structuraldesignof irrigation infrastructure,and river training
andfloodcontrolworks. Inaddition,themanualcoverscropplanning,waterdemandassessment,
andwater balance assessment. The limitation of themanual is that it does not cover the socio-
institutionalandconstructionmanagementaspectsofirrigationprojectpreparation.Thetargetsof
the manual are the engineering professionals of the Department of Agriculture. However, the
manual will also benefit all irrigation practitioners from both the public and private sectors. The
manual also includes a separate volume for the typical drawings planned for small irrigation
schemes.
1.3 IrrigationinBhutan
IrrigationinBhutanhasbeenpracticedsincetimeimmemorial.FarmersofBhutanhaveconstructed
smallscaleirrigationschemeswiththeirownresourcesandskills.Thesefarmer-managedirrigation
systems(FMIS)wereconstructedtoprovideassuredirrigationtopaddyfields(Chuzhing).Withthe
introduction of planned development in Bhutan, these FMIS started to receive support from the
Government (Pradhan,1989).TheGovernmentbegantodevelop irrigationwith the first fiveyear
plan(1961-66).TheIrrigationDivisionwasestablishedin1967undertheDepartmentofAgriculture
totakeresponsibilityfortheplanning,designandimplementationofirrigationfacilities.
WiththerequestoftheRoyalGovernmentofBhutan,theinvolvementofbilateralandmultilateral
donoragenciesbeganinthe1980s.Majordonorsinvolvedintheirrigationdevelopmentsectorare
Indian Aid, United Nation Capital Development Fund (UNCDF), International Fund for Agriculture
Development (IFAD), Asian Development Bank (ADB), and the World Bank (WB). Major projects
developed with financial assistance from donor agencies are the Punakha-Wangdi Valley
DevelopmentProject(IFAD),TaklaiIrrigationProject(UNCDF),GelephuLiftIrrigationProject(Indian
Aid),TsirangIrrigationProject(ADB),andDecentralizedRuralDevelopmentProject(WB).TheTaklai
irrigationscheme(1,350ha),thelargestschemeinBhutan,wasrecentlyrehabilitatedwithtechnical

█ Egis Eau & RSPN/ BhWP Irrigation Engineering Manual
2
and financial support from Japan International Cooperation Agency (JICA). The Gelephu Lift
IrrigationProjectisdefunct.
According to the National Irrigation Information System (NIIS), there are about 1,100 irrigation
schemesinBhutan,ofwhich962schemeshaveacommandarealargerthan15acres.111ofthese
962 schemes are not functioning for different reasons. In addition, there are about 140 schemes
with a command area less than 15 acres providing irrigation to about 2,500 acres of land. These
small,mediumandlargeirrigationschemesprovidesomekindofirrigationtoabout64,246acresof
land.TraditionallytwotypesofcultivatedlandsexistinBhutan:wetlands(Chuzhing)anddrylands
(Kamzhing).ChuzhingsarerecognizedasirrigatedlandsingeneralwhileKamzhingsareun-irrigated
cultivatedlands.However,notallChuzhingshaveirrigationfacilities.
1.4 Methodologyadopted
ThemethodologyadoptedtoupdatetheexistingIrrigationEngineeringManualinvolvedthe
followingapproaches:
• Reviewofexistingengineeringmanuals,
• Reviewofirrigationdesignmanualsofsimilarregions,
• Identificationofgapsintheexistingmanuals,
• InteractionwithrelatedstakeholderssuchasstaffoftheEngineeringDivisioninDOAand
collectionofexpectations,and
• PreparationoftheIrrigationEngineeringManual
1.4.1 Reviewofexistingmanuals
Thereviewofexistingmanualsstartedwiththecollectionofthemanuals.Theavailablemanualsat
theDOAare:
• IrrigationEngineeringManual1990,
• Punakha-WandiValleyDevelopmentProjectIrrigationManual-1992,and
• FeederRoadManual
The existing Irrigation EngineeringManual 1990 was prepared by the Department of Agriculture
(DOA)asadraftversion in1990and revisedsubsequently in1994and1998. Themanualhas11
chaptersand10appendicesfocusingmainlyonthesurvey,designandconstructionsupervisionof
irrigation schemes. The Punakha-Wangdi Valley Development Project Irrigation Manual was
prepared by Hunting Services andMottMacDonald Consultants in 1992 as part of the Punakha-
Wangdi Valley Development Project under IFAD assistance. The manual has 6 chapters and 5
appendices.TheFeederRoadManualhas threevolumescoveringhydrology, irrigationdesignand
feederroadrespectively.Theirrigationdesignmanualhas12chaptersand7appendices.
1.4.2 Interactionwithstakeholders
TheinteractionwithengineersofEngineeringDivisioninDOAwascarriedoutonanindividualbasis
andtheirexpectationsregardingtheupdatingoftheIrrigationEngineeringManualwerecollected.
The main staff consulted included the chief engineer, executive engineers, deputy executive
engineersandengineersworkingintheEngineeringDivisionofDAO.
AfterreviewingtheexistingmanualsandinteractionwiththeconcernedDOAstaff,theConsultant
prepared a draft table of contents for the Manual. The proposed draft table of contents was

█ Egis Eau & RSPN/ BhWP Irrigation Engineering Manual
3
presented intheTechnicalAdvisoryCommittee(TAC)meetingon15thDecember2014alongwith
the basic format of the manual and was endorsed. Similarly, the draft table of contents was
presentedtotheEngineeringDivisionon19thDecember2014.
1.4.3 Conceptualframeworkofthemanual
Thebasic formatofthemanual includesthe introduction,designconcepts ,designprocedureand
worked out examples. The design of irrigation structures follows a farmer friendly design with
simple and understandable procedures and illustrations accompanied by photos and sketches
whereverpossible.
1.5 Contents of the Manual
The Irrigation Engineering Manual is structured in nine chapters. The manual starts with this
introductory chapter which presents irrigation in Bhutan, the methodology adopted and the
contentsofthemanual.Chaptertwodescribestheprojectstudyandsurveyprocedureshighlighting
identificationandfeasibilitystudies.Thischapteralsodealswiththenamingandcodingofirrigation
schemes and scheme prioritization criteria. Chapter three deals with hydrology and agro-
meteorology in irrigationprojectdesign.Thischapterhighlightstheproceduresofassessingwater
availability for irrigation, flood flow assessment and assessment of crop and irrigation water
requirementsincludingwaterbalanceassessment.Chapterfourprovidesbasicconceptsofdiversion
headworksandintakesalongwiththeirdesignproceduresandworkedoutexamples.Thischapter
alsocovers theconceptofpump irrigationwith itsdesignproceduresandaworkedoutexample.
Chapterfiveprovidestheconcept,designproceduresandworkedoutexamplesofthecanalsystem.
Thischapteralsoexplainsthetypesandlayoutofthecanals,linedandunlinedcanals,pipedcanals
andcanals inunstableareas.Chaptersixpresentsthedesignconcept,proceduresandworkedout
examples of the canal structures, and highlights various types of flow regulating structures,
conveyance structures, cross-drainage structures, and sediment control structures. Chapter seven
highlights the design concept and procedures of river training and flood control structures. This
chapter also presents the rivers and flood prone areas of Bhutan. Chapter eight presents the
concept of micro irrigation, its application and design procedures. This chapter also describes
differenttypesofmicroirrigationandtheiradvantagesanddisadvantagesinthecontextofBhutan.
Chapternine,whichconcludes themanual, addressesprojectevaluationandprovidesprocedures
for cost estimates, benefit assessments from irrigation projects and the basic economic analysis
conceptsinvolved.

█ Egis Eau & RSPN/ BhWP Irrigation Engineering Manual
4
CHAPTER-2
2. ProjectStudyandSurvey
2.1 NamingandCodingofIrrigationScheme
MostirrigationschemesinBhutanarenamedaccordingtothelocationoftheircommandarea.For
rehabilitation schemes, the existing namesof the schemes should be adopted. For new irrigation
schemes, thenames shouldbebasedon the locationof the commandareaorbedecidedby the
community.Forthescientificidentificationoftheirrigationschemes,itisessentialtoprovidecodes
foreach schemewhich shouldbebasedon thenational identification system.The coding system
adopted in the National Irrigation Information System (NIIS) seems appropriate and is based on
geocoding standards published by the Ministry of Information and Communication (MOIC). The
same coding hence should be adopted for future irrigation development and management. An
exampleofthecodingsystemisasfollows:
01002
The first three digits represent theGewog codewhile the last two digits represent the irrigation
schemecode.01002isthePhusairrigationschemeinGetanaGewogofChhukhaDzongkhag.
2.2 ProjectDevelopmentCycle
Allirrigationschemesencompassseveraldevelopmentcyclestages,startingwithplanning,followed
byimplementation,monitoringandevaluation.Eachstagehasmanyactivitiestobecarriedoutto
fulfill the specified purpose of that stage. The details of the stages and associated activities are
presentedinthefollowingtable(Table2-1).
Table2-1Projectdevelopmentcycle
Projectstage Mainactivities Purpose
Irrigation
planning
• Assessbroadelementsofirrigation
• Appraisaloftheirrigation
development
• Toestablishtheobjectiveand
scopeofirrigationdevelopment
Identification
survey
• Facilitatefarmersawareness
• Perceiveneedsbyfarmers
• Farmersrequestforassistance
• Ensuredevelopmentisdemand
driven
Pre-feasibility
study
• InitialfieldvisitsandPRAs
• Collectexistingphysicalandsocio-
economicdata
• Stakeholdersanalysis
• Firstapprovalorrejectionofpre-
feasibilitybystakeholders
• Firsthandassessmentof
irrigationpotential
• Identifyfarmersobjectives,
requirements,andcapabilities
Feasibilitystudy • Detailedphysicaldatacollection
andinvestigations
• Topographicalsurvey
• Hydrologicalsurvey
• Socio-environmentalsurvey
• Agriculturalsurvey
• Studyonclimatechangeimpacts
• Financialandinstitutionalreview
• Ensureadequateresourcesto
meetfarmersobjectives
• Ensureresourcesavailablefor
proposeddevelopment
• Provideopportunitiestomodify
design
• Providebasisforloans,
managementandO&M

█ Egis Eau & RSPN/ BhWP Irrigation Engineering Manual
5
Projectstage Mainactivities Purpose
• Preliminarydesignandcosts
• Participationoffarmersindesign
choices
• Initiationofappropriatefarmers
organization
• Prepareprojectfeasibilityreport
includingeconomicappraisal
Detaileddesign • Finaldataassessed
• Detaileddesign,quantities,and
contractdocumentsprepared
• Fundingarrangementsorganized
• Farmerscontributionsclearly
determined
• Finalizedetailsandcosts
• Matchdesignswithfarmers
capability
• Enablefarmerstotake
responsibility
Implementation • Projectapproval
• Tenderreceived
• Selectionofcontractorand
contractagreement
• Farmersparticipationin
construction
• Completionoftheconstruction
• Hand-overtofarmers
• Trainingtofarmersoncultivation,
on-farmwatermanagement,and
O&M
• Enablecost-effectivechoice
• Assurepaymentforworksand
materials
• Promotesenseofownership
• Promoteeffectiveuseofwater
• Farmersassumeresponsibility
Monitoringand
evaluation
• Regularreviewofperformance
• On-goingtrainingdextension
• Ensuretargetsareachievedand
sustained
• Encouragecontinued
improvement
2.3 IrrigationPlanning
Irrigation is the process of applyingwater to soil for plant growth, and involves the acquisition,
conveyance, distribution and application of this water. There are significant spatial as well as
temporalvariationsofrainfallandirrigationaimstosupplementnaturalrainfall.Whenplanningan
irrigation scheme, thewater requirement and its availability at theparticular locationneed tobe
assessed first in addition to theavailabilityof suitable land for agricultural production. Thewater
availabilityandrequirementtogetherdecidetheareatobeirrigatedandthesizeandcapacityofthe
conveyance system. An irrigation scheme can be planned and designed in an area when the
followingpointsaremet:
• Suitabilityoflandforagriculturalproduction,
• Favorableclimateforthegrowthofcrops,
• Adequateavailabilityofwater.

█ Egis Eau & RSPN/ BhWP Irrigation Engineering Manual
6
In addition to these three points, farmers’ willingness also has to be considered in planning the
scheme.Smallirrigationschemescanbedevelopedrelativelyquicklywhilelargeirrigationschemes
maytaketimeforproperplanning,designandconstruction.Dependinguponthesizeoftheproject,
theplanningstageitselfconsistsofthreephases:preliminaryplanning,whichincludespre-feasibility
and feasibility studies, detailed planning of land andwater use, and detailed design of irrigation
structuresandcanals.
Survey and studyworks are basic requirements of any irrigation project planning. The success or
failureoftheimplementationofaprojectdependsontheaccuracyofitsstudyandsurvey.Survey
worksformthebasisforthestudyoftheprojectinwhichdataandinformationarecollectedboth
fromprimaryandsecondarysources.Thetypeandnatureofthestudyandsurveydependonthe
stage,sizeandimportanceoftheproject.Forsmallscaleirrigationschemes,itmaybesufficientto
carryouttwolevelsofstudy:theidentificationstudyandthefeasibilitystudy.Inaddition,astudyof
climate change impacts and possible adaptation measures needs to be carried out during the
planning and study stagesof irrigationproject development. The following sectionsdealwith the
majorsurveyandstudyworksofanirrigationproject.
2.4 IdentificationStudy
2.4.1 Introduction
The identification of the scheme is the very first step in the project development process. The
Dzongkhag/Gewog level office should ask farmers through their leaders about the necessity of
rehabilitating the existing scheme or constructing a new scheme. In addition, local level officers
should disseminate information about the plans and program of the Department of Agriculture
(DOA).Thisinformationdisseminationshouldbecarriedoutthroughmeetingswithfarmerleaders
and Gewog heads (Gups). The main objective of information dissemination is to seek genuine
demandoftheprojectfromthefarmers.Astandardprojectdemandformshouldbedevelopedand
distributedtothefarmers.Examplesofgenuinedemandmaybe:
• Therequestfordevelopmentmustbegenuinefromthemajorityofthefarmers,
• Farmersarewillingtocontributetocovertheirpartofdevelopmentcosts,
• Farmersarewillingtoorganizeawaterusersassociation,enterintonecessaryagreements
withtheofficeandundertakeoperationandmaintenanceofthesystemaftercompletion,
• Soilsofthecommandareaaresuitableforirrigation(onlyfornewschemes)
Prior to starting the identification study, the request form of the farmers should be reviewed to
establishwhetheritfulfillstheminimumrequirementsthathavebeenset.Thisprocessistheinitial
screeningwhichaimstoidentifygenuinerequests,prioritizeprojectswithhighfarmercommitment,
identify thetypeofproject (new/rehabilitation)andensurethat thesetprinciplesandcriteriaare
met.
CriteriaforselectionshouldbepreparedbytheEngineeringDivisionofDOAbasedontheprinciples
and objectives of the particular program. The criteria for the selection of the project at the
identificationstageshouldincludebutnotbelimitedtothefollowing:
• Atleasteightypercentofthebeneficiaryhouseholdsshouldsigntheprojectrequestform;
• Therearenopotentialwaterusedisputesinthestreamorriver;
• ThebeneficiariescommittotakefutureO&Mresponsibilities;
• Sufficientwaterisavailable.

█ Egis Eau & RSPN/ BhWP Irrigation Engineering Manual
7
Aftertheveryfirstinitialscreening,athree-stepprojectidentificationstudyneedstobeconducted
including: (a) Desk study, (b) Field visit, and (c) Analysis and reporting. The identification study
shouldbecarriedoutbyateamcomprisingatleastanirrigationengineerandanagricultureofficer.
2.4.2 Deskstudy
Atthissteptheprojectlocationshouldbeidentifiedon1:50,000scaletopographicmaps.Theteam
shouldcollectandreviewprevious reports ifanyare related to theproject.The teamshouldalso
studythedemandformsubmittedbythefarmers.Inthecaseofarehabilitationproject,theteam
shouldverify the information inthedemandformwiththeNational Irrigation InformationSystem
(NIIS)ofDOA.
2.4.3 Fieldvisit
Afterthedeskstudy,amessageshouldbesenttothefarmersinformingthemaboutthetentative
date of the field visit. The tools and equipment to be taken on the field visit are: a copy of the
projectrequestform,theprojectidentificationquestionnaire,topographicalmaps,notebooksand
necessarystationary,GPS,stopwatch,calculator,camera,anda3mlongmeasuringtape.Thefield
visitshouldconsistofatleastthreeactivities:initialmeeting,walkthrough,andconcludingmeeting.
a) Initialmeeting:localfarmersshouldbemet,discussionsshouldbeheldandarrangementmade
fortheschemeinspection.Duringthismeetinganoverviewoftheprojectshouldbemade:
• Istheschemeaneworimprovementproject?
• Whyhavethefarmersrequestedtheproject?
• Whereistheintakesite,maincanalandcommandarea?
b) FieldInspection:visittheintakesite,maincanalalignmentandcommandarea.Theteamneeds
toassessthefollowingmainpointsinadditiontofillinginthequestionnaire:
• Historyoftheproject;
• Conditionsofintakesite;
• Wateravailabilityandissueofwateruse;
• Suitabilityoflandarea;
• Presenceofcross-drainageworksandtechnicalcomplexities;
• Lengthofmaincanalandlandslidezonesifany;
• Majorcropsgrownandcroppingpattern;
• Farmersattitudetowardsprojectimplementation
c) Concluding meeting: After the field inspection and before leaving the site, the study team
shouldholdaconcludingmeetingwiththefarmers.Theteamshouldsharetheirexperienceof
theschemeinspection,majorfindingsandthepossibilityforfurtherstudy.
2.4.4 AnalysisandReporting
Basedon thedataand informationcollectedduring the fieldvisit, the teamneeds toanalyze the
project findings and finalize the identification study. The analysis should be based on technical,
environmentalandsocialaspectsofproject identification.Basedon thisanalysis, the teamhas to
prepareareportstatingtheprojectrecommendationforfurtheractions.Thereportshallcomprise

█ Egis Eau & RSPN/ BhWP Irrigation Engineering Manual
8
mainlytheintroductiontotheproject,theprojectsummarysheet,thecompletedquestionnaire,a
topographical map with the project location, area and water resources calculation, and the
recommendation.
2.5 Feasibilitystudy
2.5.1 Introduction
Thefeasibilitystudyisthebasisforprojectimplementationandiscarriedoutbyateamofexperts
with backgrounds in engineering, agriculture, and socio-environmental fields. This study normally
formsthebasisoffinancingbyexternalfundingagenciesortheGovernment.Thestudyassessesthe
technicalfeasibility,economicviabilityandinstitutionalsuitabilityoftheproject’s implementation.
Thefeasibilitystudyiscarriedoutinthefollowingsteps:
i. Deskstudy
ii. Fieldsurveywork
iii. Fielddataanalysisandfeasibilitydesign
iv. Costestimate
v. Economicanalysis
vi. Projectreportingandrecommendation
2.5.2 Deskstudy
The desk study is a review of thework carried out at the project identification stage. This study
generallyneeds toexamine twoaspects.The first is the listofoutstandingmatters tobestudied,
andanypossibleschemealternatives. Theremaybeseveraloutstandingissuesnottouchedduring
previousstudieswhichshouldbestressedduringthefeasibilitystudy.Schemealternativesneedto
bereviewedinthefeasibilitystudy,whichmayincludethefollowing:
Fornewschemes:
• Alternativewatersourcesfromdifferentrivers,pumpedsupply,groundwater,
supplementaryrivers,etc
• Alternativeintakesiteontheriver,and
• Alternativecanalalignment
Forrehabilitationschemes:
• Extensionofcommandarea,
• Combiningseveralschemes,
• Revisedcanalalignment,and
• Revisedintakesite
2.5.3 FieldSurveyWork
Thefieldsurveyworkmaydifferslightlybasedonthetypeofthescheme(neworrehabilitated).The
followingarethemainactivitiestobecarriedoutduringthefieldsurveywork:
i. Listthenames,commandareaandwaterwithdrawalamounts(indifferentseasons)of
existingirrigationsystemsandotheruses(drinkingwatersupply)locatedinthevicinity
oftherivers/streams.Assesstheimpactofthesystem’sdiversionondownstreamwater

█ Egis Eau & RSPN/ BhWP Irrigation Engineering Manual
9
users, particularlywhere additional irrigationwater is needed for the extension area.
Verifytheriverwaterflowsandintakewithdrawalamountthroughflowmeasurements.
ii. Locate theschemeon1:5,000mapsbasedonavailableortho-photosand/orcadastral
maps.GoogleEarthmayalsobeagoodsourceforsuitablesystemmaps.Thelocationof
themainstructuresshouldalsobemarked.
iii. Collect data regarding the command area, irrigation source, water rights, catchment
condition,soils,landuse,inadesignatedformat.
iv. DiscusswiththefarmersgroupandconfirmtheprojectrequestandthelistoftheWUA
members with individual landholding distribution within the existing and proposed
extensionarea.
v. Basic demographic parameters will be collected such as number of households,
household size, and life expectancy. Other social parameters such as education level,
majorsourceofincome,andfoodsecuritywillalsoberecorded.
vi. Together with the social mobilizer undertake a "walk through" with representatives
fromthefarmersgrouptodeterminethepresentandfutureirrigatedareasandidentify
necessaryworks.
vii. Perform engineering surveys such as river long sections and cross sections. Similarly,
undertakelongitudinalandcrosssectionssurveysofthemainandbranchcanals.
viii. Conductsoilsurveysandbasicsoilstestswithinthecommandareaatadensityofabout
onepitsiteforevery10haofcommandareatoassesssoilsuitabilityforagriculture.
ix. Performflowmeasurement toverifyexistingcanalcarryingcapacities, seepage losses,
andverificationofwaterrequirementsandotherhydraulicparameters.
x. Inconsultationwithfarmergroups,determinethelocationoftherequiredmajorworks
inthecanalalignmentwithappropriatedigitalphotos,whichwillbe incorporated into
theinfrastructureimprovementplan.
xi. Collect and confirm data on the existing irrigated area; cropping pattern; input use
including fertilizer, seeds, and pesticides; yields, in a systematic manner based on
landholdingsizes.
2.5.4 Fielddataanalysisanddesign
The collected data and information has to be analyzed, on return to the office, before a final
decision can be taken on the project. The major activities of the analysis are related to the
estimationofthenetcommandareaandwaterbalanceatthesourceriver.Beforestartingthecanal
design,itisimportanttocheckthewaterbalancetoconfirmwhethervariablewaterissufficientto
theproposedcommandareainallseasons.Afteranalyzingthedata,feasibilitydesignshallstartand
comprisesthefollowing:
i. Systemlayout:Usingtopographicmapsaplanof thesystemshouldbemadeshowing the
source,primary canalalignment,major structuresandmainpartof thecommandarea.A
schematiclinediagramofthesystemlayoutneedstobeprepared;
ii. Canaldesign:Forfeasibilityleveldesign,typicalcanalcrosssectionscanberelatedtocanal
discharge and ground conditions. For rehabilitation schemes canal designs, are only
requiredforreacheswherecompleteremodelingisneeded.
iii. Structure design: It should be prepared for intake andmajor structures. Typical standard
drawingsmaybeusedforminorstructures.

█ Egis Eau & RSPN/ BhWP Irrigation Engineering Manual
10
iv. Standardsforfeasibilityleveldesign
• HeadWorks
• Drawings(plan,typicalsection)showinglocationandlevelsanddimensions
shouldbepreparedandprincipalquantitiesestimated,
• Layout
• A layout plan of the scheme and command area showing primary and
secondarycanalalignmentshouldbeprepared,
• Canals
• Canalroutes,capacities,slope,levelsanddimensionsshouldbeestablished,
• Alongitudinalsectionofthecanalshouldbeprepared,
• Typicalcrosssectionsshouldbedrawn,
• Earthworkquantitiesshouldbeworkedout,
• Structures
• Drawingsofthetypicalstructuresshouldbeprepared,
• Eachsizeandtypeofstructureshouldbeassessed,
• Drawingsofmajorstructuresshowinglocation,levelsanddimensionshould
beprepared,
• Principalquantityshouldbecalculated
2.5.5 TopographicalSurvey
The topographical survey is theprocessofdetermining thepositionboth inplanandelevationof
natural featuresof thearea.Theextentof the topographical surveydependsupon the size, type,
andleveloftheprojectstudy.Forsmallscaleirrigationschemes,thetopographicalsurveyincludes:
• Benchmarksurvey,
• Traversesurvey,
• Alignmentsurvey,and
• Longitudinalandcrosssectionalsurvey
Thetopographicalsurveystandardforsmallscaleirrigationschemesmaybeasfollows(Table2-2).
Table2-2Topographicalsurveystandards
S.N Principaluse Details
1 Scheme
identification
• Useexistingmapsbutsupplementwithsiteinspection
2 Feasibilitystudy • Useexistingmaps,sitesketches
• Carryouttraversesurvey(GPS)
• Benchmarksurveyattherateof0.50to1.0kmintervals
• Carryoutdetailedsitesurveyforstructures-intake/headwork,
majorcrossdrainagestructures
• Forcommandareatopographicalsurveytake100minterval
gridforcontourintervalof0.50to1.0m.
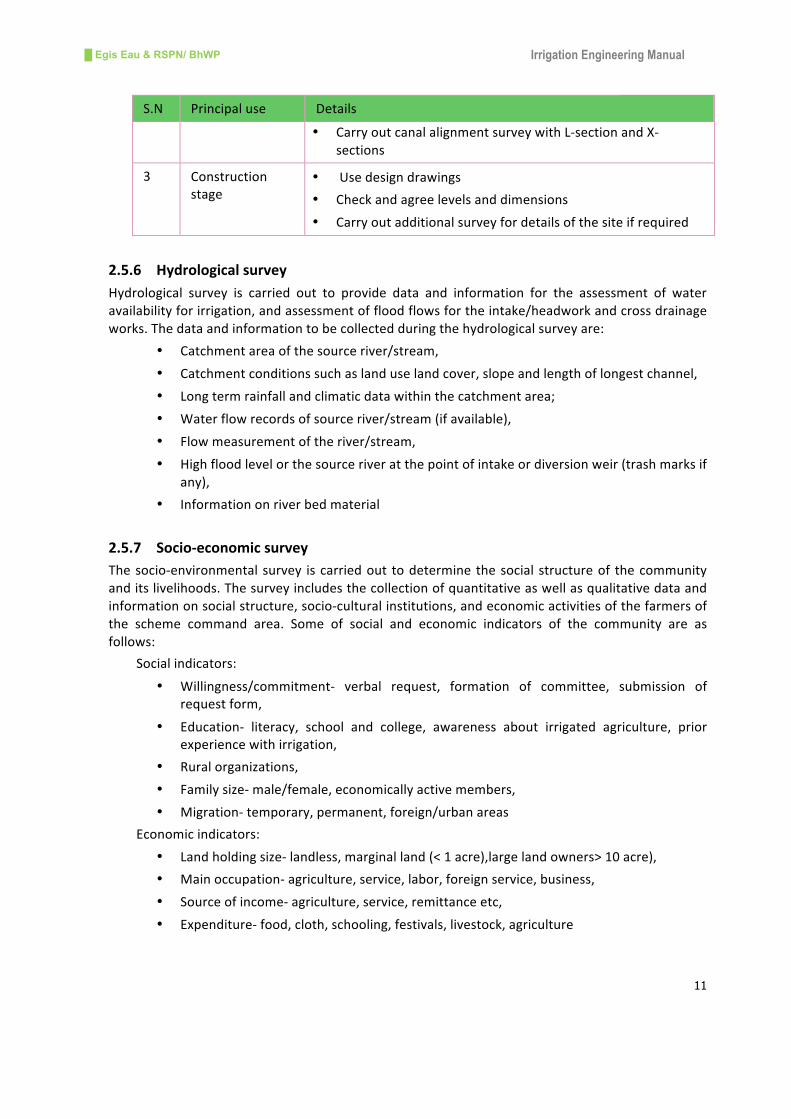
█ Egis Eau & RSPN/ BhWP Irrigation Engineering Manual
11
S.N Principaluse Details
• CarryoutcanalalignmentsurveywithL-sectionandX-
sections
3 Construction
stage
• Usedesigndrawings
• Checkandagreelevelsanddimensions
• Carryoutadditionalsurveyfordetailsofthesiteifrequired
2.5.6 Hydrologicalsurvey
Hydrological survey is carried out to provide data and information for the assessment of water
availabilityforirrigation,andassessmentoffloodflowsfortheintake/headworkandcrossdrainage
works.Thedataandinformationtobecollectedduringthehydrologicalsurveyare:
• Catchmentareaofthesourceriver/stream,
• Catchmentconditionssuchaslanduselandcover,slopeandlengthoflongestchannel,
• Longtermrainfallandclimaticdatawithinthecatchmentarea;
• Waterflowrecordsofsourceriver/stream(ifavailable),
• Flowmeasurementoftheriver/stream,
• Highfloodlevelorthesourceriveratthepointofintakeordiversionweir(trashmarksif
any),
• Informationonriverbedmaterial
2.5.7 Socio-economicsurvey
Thesocio-environmental survey iscarriedout todetermine thesocial structureof thecommunity
anditslivelihoods.Thesurveyincludesthecollectionofquantitativeaswellasqualitativedataand
informationonsocialstructure,socio-culturalinstitutions,andeconomicactivitiesofthefarmersof
the scheme command area. Some of social and economic indicators of the community are as
follows:
Socialindicators:
• Willingness/commitment- verbal request, formation of committee, submission of
requestform,
• Education- literacy, school and college, awareness about irrigated agriculture, prior
experiencewithirrigation,
• Ruralorganizations,
• Familysize-male/female,economicallyactivemembers,
• Migration-temporary,permanent,foreign/urbanareas
Economicindicators:
• Landholdingsize-landless,marginalland(<1acre),largelandowners>10acre),
• Mainoccupation-agriculture,service,labor,foreignservice,business,
• Sourceofincome-agriculture,service,remittanceetc,
• Expenditure-food,cloth,schooling,festivals,livestock,agriculture

█ Egis Eau & RSPN/ BhWP Irrigation Engineering Manual
12
2.5.8 AgriculturalSurvey
Forsmallirrigationschemes,theagriculturalsurveymayincludedataandinformationregardingthe
soiltype,landuseandagriculturepracticesofthecommandarea.Thesoilsurveymayincludethe
assessmentofthetypeofsoil inthecommandareaanditssuitabilityforirrigatedagriculture.The
soilsmaybealluvial,sandy,gravelandbouldermixed.
The landusesurveymay includethegeneralassessmentof landuse in thecommandarea,which
mayclassifythepercentofagriculturalland,forestland,grazingland,wetlands,NationalParksand
reserveforestarea.
Theagriculturesurveyincludesthecollectionofdataandinformationon:
• Existingcroppingpattern,
• Existingcropyields,
• Inputsusedanditsavailability,
• Marketingfacilityandlaborsituation
2.5.9 GPSSurveyMethodology
The Global Positioning System (GPS) aided walk through method uses relatively recent
improvementsinsurveyaids.GPSequipmentstoresanddownloadstracksandwaypoints,digitized
ordigitalcartography,highresolutionsatelliteimagery,andelaboration/presentationofthesurvey
resultsinGISsoftware.
DuringGPSwalkthroughsurveys, tracksofthemainandbranchcanalalignmentswillberecorded
andconveyanceorstructuralproblemsinthesecanalswillbemarkedonthetracks.Inadditionto
thecanalalignmentsurveys,thecommandareaboundariesofthesystemwillberecordedwiththe
GPSequipment.ThecanaltrackandmarkedwaypointswillbedownloadedandprocessedinArcGIS
or compatible GIS software, using Garmin DNR software or other GPS equipment software to
converttherecordedGPSfileformattotheGISshapefileformat.IntheGISsoftware,therecorded
canal tracks and command area boundaries will be overlaid on the newly available digital
topographicalmaps from theSurveyDepartmentand if availablehigh resolution satellite imagery
thatcanbedownloadedcommerciallythrougha licensedversionofGoogleEarthortheaccessto
theDigitalGlobearchivesthroughtheGlobalmappersoftware.Highresolutionimagescanalsobe
composedfromthefreeversionofGoogleEarthbydownloadingtherequiredcoveragetilebytile.
There is also software available atminimal cost that processes the tile by tile downloading from
GoogleEarthautomatically.
The results of the surveys will permit the preparation of accurately geo-referenced mapping of
systemlayouts,commandareaboundariesandsystemdeficiencies.Theaccurategeo-referencingof
the surveys and resultingmapswill allow verification of the accuracy of the surveys through the
overlay on the digital topographicalmaps and especially on the high resolution satellite imagery.
ConversionoftheShapeformattotheGoogleKMZ(KML)proprietyformatwillfacilitatethedisplay
ofthelayoutmapsdirectlyinGoogleEarthwhichallowsa3Drenderingofthecanalsystemlayout
andcommandarea(ShapefilescanbedirectlyconvertedtoKMZ/KMLformatinArcGIS.Verification
ofthesurveyandmappingresultsinGoogleEarth3Dfurtheraidsinassessingthecorrectnessofthe
surveys and resulting system layout and facilitates thepresentation to awideaudienceof survey
resultsinaneasyandcosteffectivemanner.

█ Egis Eau & RSPN/ BhWP Irrigation Engineering Manual
13
2.6 EnvironmentalImpactStudy
2.6.1 LegalProvisions
AccordingtotheEnvironmentAssessmentAct2000,EnvironmentalClearance(EC)ismandatoryfor
anyproject/activity thatmayhaveadverse impact(s)on theenvironment. TheRegulation for the
Environmental Clearance of the Projects 2002 defines responsibilities and procedures for the
implementation of the Act concerning the issuance and enforcement of the environmental
clearance. In addition, the Regulation under its Annex-2 mentions that all irrigation channels
(irrigationschemes)tobedevelopedneedtoobtainenvironmentalclearancefromthecompetent
authority. TheNational Environment Commission (NEC) has revised, updated and published eight
environmental assessment guidelines for the forestry, general, highway and roads, hydropower,
industry,mining,tourismandtransmissionsectors.However,theirrigatedagriculturesectorhasnot
yetbeenincludedinthesesectoralguidelinesandthegeneralenvironmentalassessmentguideline
appliestoirrigationprojectpreparationandimplementation.
Theenvironmentalassessmentprocessendeavorstomitigateandpreventundesirableimpactsfrom
the development of the irrigation project. It must include all of the procedures required under
Bhutanese law intended to identify the means to ensure that a project is managed in an
environmentallysoundandsustainableway.
2.6.2 Potentialsocio-economicandenvironmentalimpacts
Themajorsourceofenvironmentaleffects isfrominfrastructureworks,the impactsofwhichvary
according to the type, size, and location. Highly significant and/or irreversible adverse
environmental impacts are not expected from the implementation of the irrigation project. In
addition, the rehabilitation of existing age-old community managed irrigation schemes will have
negligibleornoimpactsontheenvironment.Theenvironmentalissuesrelatedtotherehabilitation
ofexistingschemesandconstructionofnewirrigationschemesare:
• Landslideandsoilerosion,
• Lossand/ordegradationofforestandvegetationcover,
• Healthandsafety,andsanitationissues,and
• Constructionperioddisturbances
However, these impacts are readilymanageable asmitigationprocedures for such impacts are in
practice in Bhutan. In addition, the irrigation development activities will have socio-economic
impacts on the project site. Potential socio-economic impacts incurred from irrigation activities
include:
• Livelihoodimpactsasaresultoflandacquisitionforcanalalignment,
• Impactsonstructuresrequiringrelocation,
• Impactsonlocalirrigationfacilities,
• Lossofcropsandtrees,
• Lossorreplacementofruralstructures,
• Construction-relatedimpacts,suchaspublichealth,dustandsafety,
• Impactsonvulnerableanddisadvantagedgroups

█ Egis Eau & RSPN/ BhWP Irrigation Engineering Manual
14
2.6.3 ProceduresforEnvironmentalImpactAssessment
The Environmental Clearance (EC) application needs to be backed up with information on no
objection certificates (NOC) andEnvironmental Information (EI). TheEI need to include: potential
adverseenvironmenteffects, complianceplan,amanagementplan,andenvironmentalandother
benefitsoftheproject.ThecompetentauthoritycheckstheEI,socialclearanceandNOCs,aspartof
environmental screening and will lead to either issuance of an EC, instructions for further study
(Environmental Impact Assessment) or rejection of the application based on the situation.
Consultationwithaffectedcommunities (forsocialclearance) isexpected to takeplaceduring the
NOCandEAprocess.TheECissuingagencyisresponsibleformonitoringcompliance.TheNational
EnvironmentCommissionand/orthecompetentauthorityaremandatedtomonitorcompliance.
The environmental impact assessment (EIA) is a tool to identify the potential environmental and
social impacts arising from the implementation of the project. According to the Environmental
assessmentgeneralguidelineprovidessixgenericstepsintheEIAprocess:
§ Screening,
§ Scoping,
§ Baselinedatageneration,
§ Impactassessment,
§ Mitigationofimpact,and
§ Environmentalmanagementplan
Screening is the first stepanddetermineswhetheranEIA isnecessary for theprojectornot.The
second step is scoping, which aims to establish environmental and social priorities, set the
boundaries for the study and define Terms of References (TOR). The third step is to generate
baseline data which provides information on the existing status of the environmental and social
componentsofthestudyarea.Theimpactassessmentisthefourthsteponwhichcharacteristicsof
thepotentialimpacts,evaluatedandpredictedusingbaselinedata.Impactpredictionsarenormally
made using commonmethodologies andmodels. The fifth step is the identification ofmitigation
measuresofpotentialimpacts.Thesemayeitherbepreventiveorremedialmeasures.Thelaststep
is the preparation of environmental management plan which should include recommended
mitigationmeasuresinspecificactionplansthatwillbeimplementedbytheproponent.
2.6.4 IntegrationofEIAintotheprojectcycle
An irrigation project is accomplished in seven stages; the activities of each stage were briefly
presentedinsection2.2ProjectDevelopmentCycle.EIAplaysanimportantroleineachstageofthis
projectcycle.MostoftheactivitiesofEIAtakeplaceduringthepre-feasibilityandfeasibilitystages
of the project. Between irrigation planning and pre-feasibility, the EIA process involves site
selection, screening, initial assessmentand scopingof significant issues. ThedetailedEIA starts in
thefeasibilitystage,whichevaluatessignificantimpacts,collectionofbaselinedata,predictionand
quantificationofimpacts,andreviewofEIAbytheregulatoryagency.
Followingtheseinitialsteps,environmentalprotectionmeasuresareidentified,operatingconditions
aredetermined,andenvironmentalmanagement isestablished. Inthe lastphaseofthefeasibility
study, monitoring needs are identified and an environmental plan and monitoring program are
formulated.Theenvironmentalmanagementplanaimingtoreduceadverseenvironmentalimpacts
isconsideredintheprojectcyclestartingfromtheprojectappraisalstage.
The World Bank funded Remote Rural Communities Development Project (RRCDP) under the
Ministry of Agriculture and Forest developed Environmental and Social Assessment Framework
ImplementationGuidelinesandEnvironmentalandSocialScreeningProcedureGuidelines in2013.

█ Egis Eau & RSPN/ BhWP Irrigation Engineering Manual
15
Theseguidelinesprovide seven stepsof environmental and social safeguardprocessingwhichare
listedbelow:
Step1:Preliminaryenvironmentalandsocialinformationandanalysis,
Step2:Environmentalandsocialscreeningandassessment,
Step3:Environmentalandsocialrecommendationsandpreparationofsub-projectDetailedProject
Report(DPR),
Step4:Environmentalclearanceandsocialclearance,
Step5:PreparationofSocialActionPlan(SAP),
Step6:Implementerssiteenvironmentalandsocialmanagementplan,
Step7:Complianceandfinalmonitoring
2.7 ClimateChangeImpactStudy
2.7.1 Climatechange
Understanding and copingwith climate change is an important global issue and serious concerns
have arisen in the planning and design of water projects, including irrigation. The increase in
greenhouse gas concentrations in the atmosphere has led to global warming, which causes
unpredictable and extreme climate events. According to the IPCC, climate change projections to
2100forSouthAsiaingeneralandBhutaninparticularconsistofincreasesinaveragetemperatures
with relativelywarmerweather at higher altitudes and during the dry season, increase in annual
average precipitation, and continued spatial variation in temperatures and precipitation due to
complex topography (NEC, 2009). The number of hot days is projected to increase. Increased
temperatureswillbeaccompaniedbychangesincloudcover,precipitation,airhumidity,radiation,
wind, and other meteorological elements (NEV, 2011). These effects will lead to changes in
hydrological cycles with impacts on mass water balance, soil moisture, and evapo-transpiration.
Climate changewill affect agriculture throughhigher temperature andmore variable rainfall. The
followingsectionspresentthemajorimpactsofclimatechangeonirrigatedagricultureandpossible
adaptationmeasurestocopewiththepotentialimpactsofclimatechange.
2.7.2 Potentialimpactsofclimatechangeonirrigation
Irrigated agriculture is planned and designed based on location specific physical conditions,
includingtheclimate.Climatechangeinducedbyglobalwarmingposessignificantriskstoirrigated
agriculture in general and water management in particular. According to the results of various
researchstudiesontheimpactsofclimatechange,climatevariabilityhassignificantimpactsoncrop
areaandcropproduction,especiallyinperiodsofdroughtsandfloods.Inaddition,climatechange
willaffect irrigatedagriculturethroughincreasedcropevapo-transpiration,changesintheamount
ofrainfall,andvariationsinriverflows.Hence,theimpactofclimatechangeonirrigatedagriculture
mustbeconsideredinawidercontextwhichincludeswaterdemand,waterqualityandcompetition
over water at the system as well as basin levels. The potential threats of climate change and
associatedimpactsarepresentedhereintabularform(Table 2-3).
Table2-3Potentialimpactsofclimatechangeonirrigation
Climatechange/threats Impacts
Increaseinrainfall • Higherstreamorriverflows
• Benefittoin-streamecology

█ Egis Eau & RSPN/ BhWP Irrigation Engineering Manual
16
Climatechange/threats Impacts
• Morewateravailableforirrigation
Decreaseinrainfall • Lowerstreamorriverflows
• Pressureonenvironmentalflow
• Pressureonwaterforirrigation
Changeinrainfallpatterns • Increaseinpressureonwateravailabilitydueto
seasonalvariation
• Reliabilityofirrigationwaterinquestion
Increaseinrisksofdroughts • Verylowflowinstreamsandrivers
• Pressureonenvironmentalflow
• Nowaterforirrigationabstraction
Increaseintemperatureand
increaseinhotdays
• Adverseeffectonstreamecology
• Increaserisksinweedgrowth
• Increaseinvariabilityofwaterquality
• Increaseinirrigationwaterdemand
• Increaseinmaintenancecostofwater
infrastructure
• Increaseinwaterdemandforlivestock
Increasedfrequencyofheavy
rainfallevents
• Increasefrequencyoflargefloods
• Increaseinsedimentyields
• Increaseinerosionincatchment
• Increaseriskofwaterinfrastructuredamage
• Increaseinlandslideevents
• Increaseinsusceptibilityofcanalalignment
Increaseinwindiness • Increaseinerosionoftopsoil
• Increaseinirrigationwaterdemand
Thepotentialthreatsandtheirimpactssuggestthatclimatevariabilityandchangewillbethemain
drivers of change and will necessitate specific climate change-related responses. The impacts of
climatechangewillvary fromonesystemtoanother,buttheadaptationstrategyshouldconsider
the context of each specific system. During the planning and study of the irrigation system, it is
essential toassessthepotential impactsandextentofvulnerabilityofthesysteminordertoplan
themitigationaswellasadaptationmeasures.
2.7.3 Impactandvulnerabilityassessment
During thepre-feasibility and feasibility studyof the irrigation scheme,a vulnerability assessment
needstobecarriedouttoascertaintheextentofclimatechangeimpacts.Vulnerabilityisdefinedas
theextenttowhichclimatechangemaydamageorharmthephysicalinfrastructureingeneraland
theirrigationsysteminparticular.Itdependsnotonlyonthesensitivityoftheirrigationsystem,but
alsoonitsabilitytoadapttonewclimaticconditions.Vulnerabilityassessmentplaysavitalrolein

█ Egis Eau & RSPN/ BhWP Irrigation Engineering Manual
17
the design of appropriate adaptation measures targeting climate change impacts. Vulnerability
assessmentandadaptationplanninginvolvesseveralstepspresentedbelow.
i. Determiningthescopeanddefiningtheassets
Thescopedescribesthelimitsoftheplanningtasksincludingtime,geographicalarea,assetstobe
covered,andresourceavailabilityforassessment.
ii. Baselineassessment:
Thebaselinedescribesthepastandexistingsituations,trends,anddriversacrosseachofthetarget
systemsandanalyses thechanges to thesesystemsthatwilloccur irrespectiveofclimatechange.
The main components of the baseline assessment and their respective activities are outlined in
tabularform(Table 2-4).
Table2-4Componentsofthebaselineassessment
Components Activities
Asset inventory and priority
setting
• Provide an overall description of existing and proposed
assets
• Describetheconditionofthetargetinfrastructuresystem
Past climate variability and
extremeevents
• Describe the most significant past extreme events
affectingtheassets
• Describetheimpactofthatevent
Climate change threats and
opportunitiesprofile
• Gatherallexistingclimatechangeprojectsrelatingtothe
area
Adaptation audit of past
protectionmeasures
• Describe measures taken by community to learn from
pastextremeevents
• Assess the effectiveness of those past adaptation
measures
Socio-economic status and trends
assessment
• Identifyusersandaffectedcommunities
• Describe the socio-economic trends of relevance to the
asset
Naturalsystemstatusandtrends • Describe the natural systems such as river banks,
catchmentarea
• Describethestatusandtrendsofthesenaturalsystems
Source:DerivedfromADB/ICEM/GON,2014
iii. Impactandvulnerabilityassessment
Themethodconsidersfourimportantfactorsinassessingthevulnerabilityofthetargetsystemand
itscomponentstoclimatechanges:exposure,sensitivity,impactandadaptivecapacity.
Exposureistheextenttowhichasystemisexposedtotheclimatechangethreat.Exposureisbest
assessed by overlapping maps of past extremes such as floods and droughts and of projected
climatechanges in thearea.Exposureto thethreatdependsuponthe locationof thesystemand
threatintensity,frequency,andduration.

█ Egis Eau & RSPN/ BhWP Irrigation Engineering Manual
18
Sensitivity is the degree to which a system will be affected by, or responsive to, the exposure.
Sensitivityforaninfrastructureassetmaybeinfluencedbythespecificsiting,geotechnicalcharacter
(bankstability,drainage),integrityofdesign,andintegrityofmaterialsandconstruction.
Thepotential impact is aproductofexposureand sensitivity. Thepotential impactof the climate
threatisratedbasedonthesupporttoolsinthevulnerabilityassessmentmatrix.Adaptivecapacity
isunderstood intermsoftheabilitytopreparefora futurethreatandabilitytorecoverfromthe
impact. Once the impact assessment is complete, the adaptive capacity of the community or
organizationtoprepareforandrespondtotheimpactsneedstobeassessed.
Whenthe impactandadaptivecapacityareconsidered,ameasureofrelativevulnerabilitycanbe
defined. An example of parameters and issues considered in the vulnerability assessment is
presentedinFigure 2-1.
Figure2-1Parametersandissuesofvulnerabilityassessment
iv. Adaptationplanning
Adaptation to climate change refers to the actions to be taken during the preparation of the
irrigation project by the authorities concerned. Adaptation also includes taking advantage of
opportunities that may arise due to climate change, as well as responding to negative impacts.
Adaptationplanning involves developing a rangeof adaptationoptions for eachof the significant
impactsofclimatechangeandthendeterminingprioritiesforimplementation.
Adaptationatfarmlevel
Climatechangeadaptationmeasuresatthefarmlevelinvolvecropplanning,includingtheselection
of crop varieties and crop calendars to adoptnew temperatures and rainfall patterns. Theuseof
cropsrequiringlittlewateranddrought-resistantcropswillalsobepreferred.Increasedagricultural

█ Egis Eau & RSPN/ BhWP Irrigation Engineering Manual
19
diversification, including better integration of trees, crops, fish and livestock will reduce risk and
increase resilience of farming systems (FAO, 2013). In addition, farmers will favormore efficient
technologiestoreduceevaporationlossesfromthefield.
Adaptationatschemelevel
Actions for adapting to climate change in irrigation schemesneed tobe considered in theoverall
contextofirrigationmodernization(FAO,2013),whichwillenhanceefficiency,waterallocationand
reliable delivery of water. Intermediate storage within the irrigation scheme and access to
alternativesourceofwateraresomeoftheoptionstoimprovereliabilityofwaterforadaptationin
irrigationplanning anddesign. A typical example of adaptationplanning is presentedhere (Table
2-5). Asset: Chisapani Naubasta Irrigation System, Banke, Nepal; Command area- 306 ha;
Beneficiaries-575HH;Maincrops-paddy,wheat,potatoes,pulsesandoilseeds;Maincomponents-
intake,maincanalandcommandarea
v. Mainstreamingadaptationplan
The mainstreaming adaptation plan involves the incorporation of prioritized activities into the
systemstartingfromitsstudythroughoperationandmaintenance.
2.7.4 Integrationofclimatechangeintoprojectcycle
Like the EIA, the impacts of climate change also need to be integrated into the project cycle as
illustratedinsection2.2ofthischapter.Inadditiontomainstreamingclimatechangeadaptation,it
isessentialtoplan,designandincorporatemitigationmeasuresfrompotentialadverseimpactsof
climatechangeintotheprojectcycle.

█ Egis Eau & RSPN/ BhWP Irrigation Engineering Manual
20
Table2-5Exampleofclimatechangeadaptationplanning
Note:VH-veryhigh,H-high,M-medium,L-lowandVL-verylow
ThreatsImpacts Significance Adaptationoptions Priorityadaptation
High and very
highthreats
Impacts for high and very high
threats
Likelihood
(chances
of
the
impactoccurring)
Seriousnessof
theimpact
Significance
of
theimpact
Focus on structural and
bioengineeringoptions
Feasibility
Effectiveness
Priority
Intakestructure
• Increased
riverflows
• Flashfloods
• Further damage to diversion
weir
• Unable to raise water levels to
intake
• Intakeblockswithdebris
• Sedimententersintomaincanal
VH
H
VH
H
H
H
H
M
VH
H
VH
M
• Rebuild diversion weir with
CCconsideration
• Improve river bed
protection downstream of
corewall
• Increasemaintenance
L
M
M
VH
H
H
H
H
H
Maincanal
• Landslides
• Canalssiltup,becomesblocked M M M • Increasecanalclearance
• Protect landslides with
bioengineering
VH
M
M
H
VH
H
Commandarea
• Increased
temperature
• Increased
rainfall
• Storms
• Draughts
• Increase ETo and then water
demand
• More chance of disease to
wintercrops
• Increase rainfall reduces water
demand
• Stormsdamagecrops
• Draughtseffectscropyields
H
M
H
H
M
VL
M
VL
VH
M
L
M
L
VH
M
• Introduce less water
requiringcrops
• Introduce more disease
resistantcrops
• Opportunity for alternative
croppingpatterns
• Chose varieties less
susceptible to storm
damage
M
M
M
M
M
H
M
H
M
H
M
H

█ Egis Eau & RSPN/ BhWP Irrigation Engineering Manual
21
2.8 Reportpreparation
For theelaborationof the feasibility study,a reportneeds tobeprepared including the following
chaptersandappendices:
Executive Summary: The executive summary consists of highlights of each chapter including
conclusionsandrecommendations.
Salient features:Thesalient featureswillbepresented ina specified tabular formwhichcontains
relevantdataandinformationontheproject.
Introduction:Thischapterconsistsofbackgroundinformationabouttheproject,theobjectivesand
scopeoftheproject,andcontentsofthereport.
Methodology:Thischaptercoverstheapproachandmethodologyofthefeasibilitystudy,analysis,
design,andreportpreparation.
Project area:Details of theproject areahave tobepresented in this chapter,whichmay include
location,topography,climate,waterresources,upstreamanddownstreamwateruse,waterrights,
agricultural situation of the area covering cropping patterns, existing yields of major crops,
extension service, and socio-economic conditions of the area. This chaptermay also contain the
conditionofexistingirrigationfacilities,includingWUAs.
Proposed project: This chapter will focus mainly on the proposed planning of irrigation
infrastructure to enhance agricultural production. The chapter will contain an agricultural
development plan, irrigation system plan, command area, crop-water requirement, proposed
structures and their design, operation andmaintenance, institutional support, environmental and
climate change impacts assessment and implementation arrangement. The assessment of water
availability will be calculated using this manual along with the water balance calculation. The
proposedcroppingpatternwillbebasedonthefarmers’preferencesandthewateravailableatthe
diversionpointduringthecroppingseasons.
The potential yieldwill be based on the potential crop yield adjusted to the local circumstances,
taking into account present crop yields under optimal irrigated conditions and average district
yields.Aproject specific implementation schedulewill have tobepreparedbasedon specific site
conditions.
EconomicAnalysis: For the assessment of the EIRR and B/C ration economic analysis need to be
carriedoutfortheprojectwhichismainlybasedontheagriculturalbenefitstobeaccruedfromthe
projectandthecostofprojectimplementation.Theagriculturalbenefitwillbecalculatedaccording
tothecropbudgetofthe“with”and“without”projectsituations.Thecostoftheprojectisassessed
withthederivationofratesandquantities.
Appendices: TheappendicestotheFeasibilityReportwillinclude:
AppendixA: Maps,theGISmappingofthecanalalignment,commandareaboundariesand
irrigationstatusoverlaidonthedigitaltopographicmaplayers,
AppendixB: Drawings, applicable typical drawings and drawings for headwork and major
canalstructures,
AppendixC: Cropwaterrequirement,thetablesgeneratedbythewaterbalancecalculation
program,
AppendixD: Agriculturedata,tabularresultsoftheFGDs,

█ Egis Eau & RSPN/ BhWP Irrigation Engineering Manual
22
AppendixE: Cost and quantity estimation, the tables generated by the cost calculation
spreadsheets,
AppendixF: Economicanalysis,
AppendixG: Projectimplementationplan,asummaryoftheproposedinterventionsdetailed
inthereport,
AppendixH: Photographs.
2.9 ProjectSelectionandPriorityRanking
2.9.1 ProjectSelection
The irrigation schemes to be selected for implementation should be technically feasible,
institutionallyacceptableandeconomicallyviable.
Technicalfeasibility:Theschemeshouldbetechnicallyfeasibleinrelationtotheschemestandard
whichmayinclude:
• Adequatewaterisavailableatthesourcetoirrigatetheproposedcommandarea;
• Nowaterrightsproblems;
• Nomajortechnicaldifficultiesmainlyattheintakeandcanalalignment;
• Soilissuitableforirrigatedagriculture;
• Nomajorlandslides,erosionsinthearea
Institutionalacceptability:Theschemeshouldbebasedonthegenuinedemandofthebeneficiary
farmersinrespectto:
• Majorityfarmersarecommittedtheimplementationofthescheme(80%);
• Writtenagreementexistswithfarmers;
• WUAexistorareintheprocessofformation;
• Suitabilitytodiversifyirrigatedagriculture;
• Availabilityofmarketforinputsandproducts
Economicviability:
• Perunitcostoftheschemeshallbewithinthedefinedlimit;
2.9.2 PriorityRanking
The priority ranking of the scheme is carried out based on techno-economic, social and
environmental criteria. The techno-economic criteria includes cost per acre or total cost of the
scheme,wateravailabilityatthesource,sizeofthecommandareaandlengthofthemaincanal.The
social criteria include the number of beneficiary households, the food security situation, and
beneficiaryinterestintheschemedevelopment.Theenvironmentalcriteriaincludeclimateresilient
scheme, focus on crops requiring less water and proximity to national parks. The details of the
criteriaarepresentedintabularform(Table2-6).

█ Egis Eau & RSPN/ BhWP Irrigation Engineering Manual
23
Table2-6Evaluationcriteriaforschemepriorityranking
S.N Components Weightage Maximumscore
1 Costperacre/totalcost 15% 10
2 Wateravailabilityatsource 10% 10
3 Sizeofcommandarea 15% 10
4 Lengthofmaincanal 10% 10
5 Numberofhouseholds 10% 10
6 Foodsecurity 10% 10
7 Communityinterest/WUA 10% 10
8 Climateresilient 5% 10
9 Focusoncropsrequiringlesswater 5% 10
10 Proximitytonationalpark 10% 10
Total 100%

█ Egis Eau & RSPN/ BhWP Irrigation Engineering Manual
24
CHAPTER-3
3. HydrologyandAgro-Meteorology
3.1 HydrologyofBhutan
ThehydrologyofBhutancorrelateswiththemonsoonrainfallpatternfromtheBayofBengal,which
has significant variation in time and space.Monsoon rainfall starts in June, is intense in July and
August,andpetersoutinSeptember.November,DecemberandJanuaryarethedrymonths,while
pre-monsoon showers occur in April andMay. Themean annual rainfall ranges from 500mm to
5,000mm.TheheaviestrainfalloccursinborderareaswithIndia,decreasingrapidlynorthward.All
four major rivers, Amochhu, Wangchhu, Punatsangchhu, and Drangmechhu (Manas), flow to
BrahmaputraRiver.RiverflowsarehighfromJunetoSeptemberandstarttorecedefromOctober.
Theflowoftheriversbecomes lowduringthemonthsofDecembertoApril.The longtermmean
annual flowof these rivers is 2,325m3/s,which is equivalent to73,000millionm
3 per year (NEC,
2003).
The Department of Hydro-Met Services (DHMS) under the Ministry of Economic Affairs is
maintaining a network of hydrological and meteorological stations. The hydrological network
comprises 13 principal stations equipped with cableways, gauges, and pressure transducers
connected to data loggers and 19 secondary stations equipped with staff gauges. Similarly, the
meteorologicalnetworkcomprises20ClassAstationswithafullrangeofweatherparametersand
74 Class C stationswith temperature, rainfall and humidity data. Almost all of these hydrological
stations are located on the major rivers and their main tributaries and seldom fulfill the
requirementsofthedesignofirrigationschemes.
3.2 WaterAvailabilityforIrrigation
3.2.1 Concept
AccordingtotheFoodandAgricultureOrganization(FAO),theavailabilityofwaterfor irrigation is
assessed at 75% to 80% reliability of the full supply. The 80% reliability of the full supply is
equivalenttoa1 in5yearreturnperiodevent.Thismeansthat80%ofthetime(4yearsoutof5
years)thereisatleastenoughwateravailabletomeetfullwaterdemandforirrigation,and20%of
thetime(1yearin5years)therewillbeundersupply.Thedesignerhastoestimateriverflowsfora
particularlocationwhereintakeorheadworkcanbeconstructedwhichisexpectedtoexceed80%
of time.Given the large spatial variation in run-off inBhutanand the significantnumberof small
catchments it isunlikely thatonewill findgaugingstationsat thepointof irrigationdiversion.For
gaugedcatchments, theassessmentofwateravailability is carriedoutwith thehelpof frequency
analysis; forungauged catchments, othermethodsneed tobe adapted. InBhutan, suchmethods
have not yet been developed, and this section tries to identify the best ways to estimate the
availablereliableflowforirrigationfromungaugedcatchments.
3.2.2 FrequencyAnalysis
Frequencyanalysisisastatisticalmethodusedtoshowthatfloweventsofacertainmagnitudemay
onaveragebeexpectedonceeveryn year. It is generally carriedout toestimate thedesign flow
fromrecordedflowdatacoveringmorethan10years.Fromtherecordedmonthlyflowvalues,1in
5 or 80% reliability flow can be obtained from the mean and standard deviation values for a
particularmonthusingthefollowingformula:
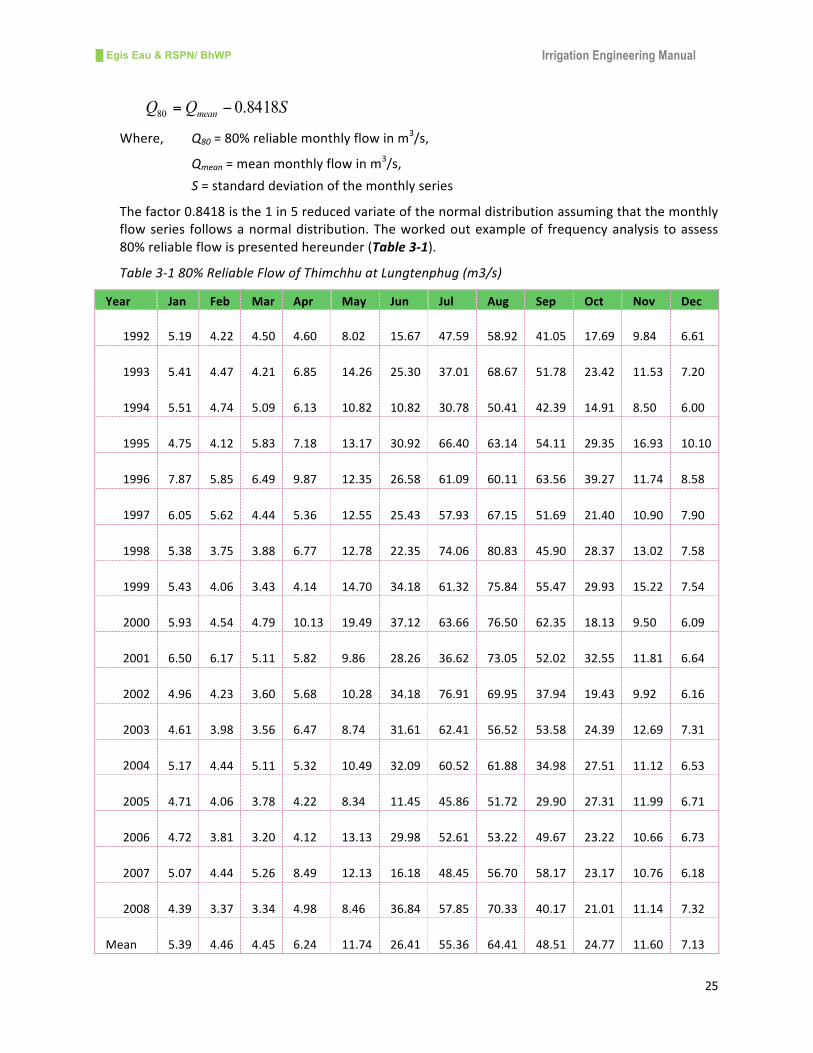
█ Egis Eau & RSPN/ BhWP Irrigation Engineering Manual
25
SQQ mean 8418.080
−=
Where, Q80=80%reliablemonthlyflowinm3/s,
Qmean=meanmonthlyflowinm3/s,
S=standarddeviationofthemonthlyseries
Thefactor0.8418isthe1in5reducedvariateofthenormaldistributionassumingthatthemonthly
flowseries followsanormaldistribution.Theworkedoutexampleof frequencyanalysis toassess
80%reliableflowispresentedhereunder(Table3-1).
Table3-180%ReliableFlowofThimchhuatLungtenphug(m3/s)
Year Jan Feb Mar Apr May Jun Jul Aug Sep Oct Nov Dec
1992
5.19
4.22
4.50
4.60
8.02
15.67
47.59
58.92
41.05
17.69
9.84
6.61
1993
5.41
4.47
4.21
6.85
14.26
25.30
37.01
68.67
51.78
23.42
11.53
7.20
1994
5.51
4.74
5.09
6.13
10.82
10.82
30.78
50.41
42.39
14.91
8.50
6.00
1995
4.75
4.12
5.83
7.18
13.17
30.92
66.40
63.14
54.11
29.35
16.93
10.10
1996
7.87
5.85
6.49
9.87
12.35
26.58
61.09
60.11
63.56
39.27
11.74
8.58
1997
6.05
5.62
4.44
5.36
12.55
25.43
57.93
67.15
51.69
21.40
10.90
7.90
1998
5.38
3.75
3.88
6.77
12.78
22.35
74.06
80.83
45.90
28.37
13.02
7.58
1999
5.43
4.06
3.43
4.14
14.70
34.18
61.32
75.84
55.47
29.93
15.22
7.54
2000
5.93
4.54
4.79
10.13
19.49
37.12
63.66
76.50
62.35
18.13
9.50
6.09
2001
6.50
6.17
5.11
5.82
9.86
28.26
36.62
73.05
52.02
32.55
11.81
6.64
2002
4.96
4.23
3.60
5.68
10.28
34.18
76.91
69.95
37.94
19.43
9.92
6.16
2003
4.61
3.98
3.56
6.47
8.74
31.61
62.41
56.52
53.58
24.39
12.69
7.31
2004
5.17
4.44
5.11
5.32
10.49
32.09
60.52
61.88
34.98
27.51
11.12
6.53
2005
4.71
4.06
3.78
4.22
8.34
11.45
45.86
51.72
29.90
27.31
11.99
6.71
2006
4.72
3.81
3.20
4.12
13.13
29.98
52.61
53.22
49.67
23.22
10.66
6.73
2007
5.07
4.44
5.26
8.49
12.13
16.18
48.45
56.70
58.17
23.17
10.76
6.18
2008
4.39
3.37
3.34
4.98
8.46
36.84
57.85
70.33
40.17
21.01
11.14
7.32
Mean
5.39
4.46
4.45
6.24
11.74
26.41
55.36
64.41
48.51
24.77
11.60
7.13

█ Egis Eau & RSPN/ BhWP Irrigation Engineering Manual
26
Year Jan Feb Mar Apr May Jun Jul Aug Sep Oct Nov Dec
SD
0.85
0.76
0.95
1.84
2.90
8.46
12.90
9.26
9.56
6.11
2.05
1.04
80%
Reliable
4.68
3.83
3.65
4.69
9.30
19.28
44.50
56.61
40.47
19.62
9.88
6.25
3.2.3 Similarcatchmenttransformationmethod
Whenthediversionsite is locatednear thegaugedsite, themonthly flowsat thediversionsite is
calculatedusinganarearatio.
⎟⎟
⎠
⎞
⎜⎜
⎝
⎛=
g
dgdA
AQQ
Where, Qd=monthlydischargeatdiversionsiteinm3/s,
Qg=monthlydischargeatgaugedsiteinm3/s,
Ad=catchmentareaatdiversionsiteinkm2,
Ag=catchmentareaatgaugedsiteinkm2
Workedoutexample(Table 3-2):
Catchmentareaofthestreamatintakesite(Ad)=7.50km2
CatchmentareaofThimpuChhuatLungtenphug(Ag)=663.0km2
Table3-2Workedoutexampleof80%reliableflow
Description Jan Feb Mar Apr May Jun Jul Aug Sep Oct Nov Dec
Q80atThimpu
chhu
4.68 3.83 3.65 4.69 9.30 19.28 44.50 56.61 40.47 19.62 9.88 6.25
Q80atintake
site
0.05 0.04 0.04 0.05 0.11 0.22 0.50 0.64 0.46 0.22 0.11 0.07
3.2.4 EmpiricalMethodsforUngaugedCatchment
A method to assess water availability from ungauged catchments does not exist in Bhutan. The
WaterandEnergyCommissionSecretariatofNepalhasdevelopedamethod(WECSmethod)forthe
assessment of river flows from ungauged catchment areas larger than 100 km2. This method is
basedonaregressionanalysisofpastdata.AlthoughitwasdevelopedforNepal,andconsidersthe
countryasoneunit, itwouldbeuseful forBhutan,whichhassimilar topographyandhydrological
characteristics. For long term average monthly flows, all catchment areas below 5,000 m are
assumedtocontributeflowsequallyperkm2area.Theaveragemonthlyflowscanbecalculatedby
theequation:
Qmean(month)=Cx(AreaofBasin)A1x(Areabelow5000m+1)
A2x(MeanMonsoonprecipitation)
A3
WhereQmean(month)isthemeanflowforaparticularmonthinm3/s,
C,A1,A2andA3arecoefficientsofthedifferentmonths(Table3-3).
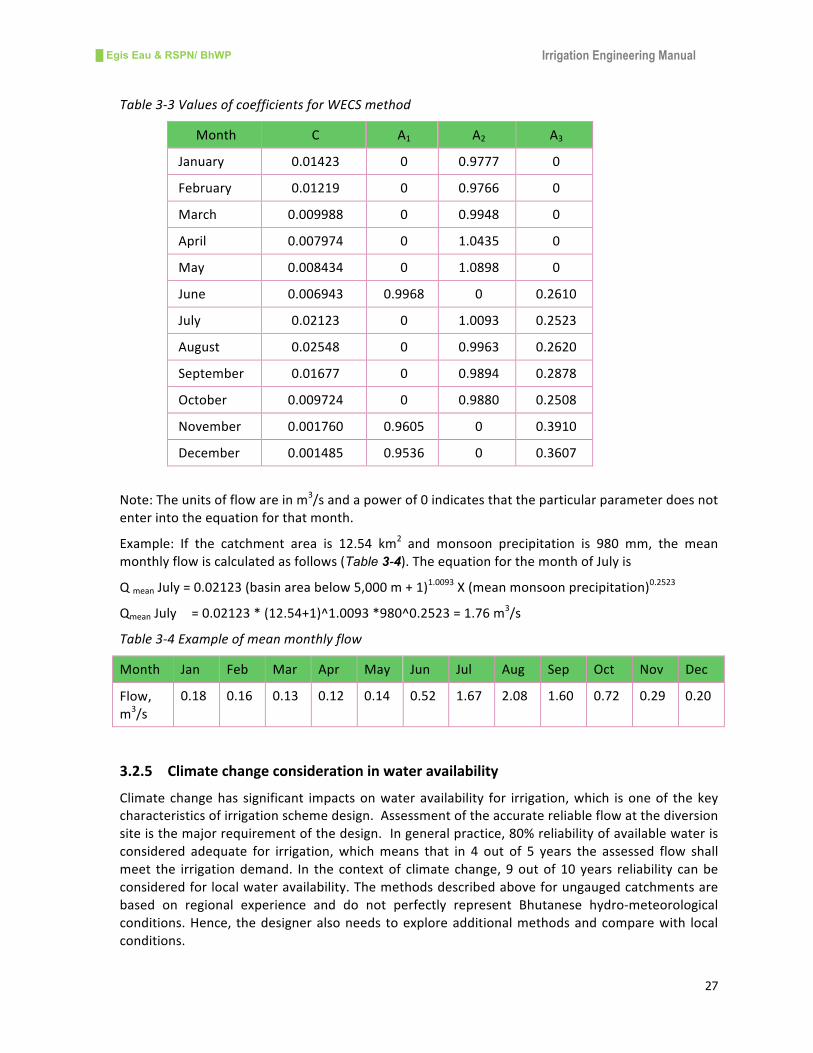
█ Egis Eau & RSPN/ BhWP Irrigation Engineering Manual
27
Table3-3ValuesofcoefficientsforWECSmethod
Month C A1 A2 A3
January 0.01423 0 0.9777 0
February 0.01219 0 0.9766 0
March 0.009988 0 0.9948 0
April 0.007974 0 1.0435 0
May 0.008434 0 1.0898 0
June 0.006943 0.9968 0 0.2610
July 0.02123 0 1.0093 0.2523
August 0.02548 0 0.9963 0.2620
September 0.01677 0 0.9894 0.2878
October 0.009724 0 0.9880 0.2508
November 0.001760 0.9605 0 0.3910
December 0.001485 0.9536 0 0.3607
Note:Theunitsofflowareinm3/sandapowerof0indicatesthattheparticularparameterdoesnot
enterintotheequationforthatmonth.
Example: If the catchment area is 12.54 km2 and monsoon precipitation is 980 mm, the mean
monthlyflowiscalculatedasfollows(Table 3-4).TheequationforthemonthofJulyis
QmeanJuly=0.02123(basinareabelow5,000m+1)1.0093
X(meanmonsoonprecipitation)0.2523
QmeanJuly =0.02123*(12.54+1)^1.0093*980^0.2523=1.76m3/s
Table3-4Exampleofmeanmonthlyflow
Month Jan Feb Mar Apr May Jun Jul Aug Sep Oct Nov Dec
Flow,
m3/s
0.18 0.16 0.13 0.12 0.14 0.52 1.67 2.08 1.60 0.72 0.29 0.20
3.2.5 Climatechangeconsiderationinwateravailability
Climate changehas significant impactsonwateravailability for irrigation,which isoneof thekey
characteristicsofirrigationschemedesign.Assessmentoftheaccuratereliableflowatthediversion
siteisthemajorrequirementofthedesign.Ingeneralpractice,80%reliabilityofavailablewateris
considered adequate for irrigation,whichmeans that in 4 out of 5 years the assessed flow shall
meet the irrigationdemand. In the contextof climate change,9outof10years reliability canbe
consideredforlocalwateravailability.Themethodsdescribedaboveforungaugedcatchmentsare
based on regional experience and do not perfectly represent Bhutanese hydro-meteorological
conditions.Hence, thedesigneralsoneeds toexploreadditionalmethodsandcomparewith local
conditions.

█ Egis Eau & RSPN/ BhWP Irrigation Engineering Manual
28
3.3 EstimationofDesignFloodDischarge
3.3.1 ConceptofDesignFlood
Thedischargeadoptedforthedesignofahydraulicstructureisreferredasdesignflooddischargeor
design flood. The estimation of design flood is essential for the design of all hydraulic structures
suchasbarrages,weirs, intakes,bridges, causeways, culverts, crossdrainage structures, and river
trainingstructures.Themagnitudeoffloodastructureisrequiredtopasswithoutgettingdamaged
dependsonitsimportance.Thereturnperiod(T)ofthefloodflowistheindicatorwhichdetermines
therelativeimportanceofthevarioushydraulicstructures.
Thereturnperiodisthatperiodofoccurrenceflood(QT)whichwillbeequaledorexceededoncein
T-yearandtherecurrenceintervalistheaveragenumberofyearswithinwhichagivenfloodevent
isequaledorexceeded.Forexample, if the10yearreturnperiodfloodofariver is100m3/s, it is
assumedthat100m3/swillbeequaledorexceededonce in10years. It isexpressedasQ10=100
m3/s. The criteria for the selection of the return period are based on technical and economic
considerationswhicharesummarizedasfollows:
• Importanceofstructuretobeconstructed,
• Effectofovertoppingofthestructure,
• Potentiallossoflifeanddownstreamdamage,and
• Costofthestructure
Referencebooksonhydraulicstructuresandmanualshavesuggestedreturnperiodsaspresented
below(Table3-5).
Table3-5SuggestedReturnPeriod
S.N Typeofstructure ReturnPeriodinyears
1 Irrigationsupplyreliability 5
2 Roadculverts 5-10yearsdependinguponthetypeofcrossings
3 Highwaybridge 10-50yearsdependinguponthetypeofrivers
4 Irrigationintake 10-25years
5 Irrigationweir/barrage 50-100dependinguponitssize
6 Crossdrainagestructures 10-25years
There are various methods of estimating design flood discharge, some of these are illustrated
below.
3.3.2 FloodFrequencyAnalysis
Floodfrequencyanalysisisastatisticalmethodtoshowthatfloodeventsofcertainmagnitudemay
onaveragebeexpectedonceeverynyear. It isgenerallycarriedouttoestimatethedesignflood
from the recorded flow data of more than 10 years. The most commonly used methods for
frequencyanalysisare:
• Normaldistribution,

█ Egis Eau & RSPN/ BhWP Irrigation Engineering Manual
29
• Lognormaldistribution,and
• Gumbel’sdistribution
i. NormalDistribution: Thegeneralquantileestimationequationisasfollows:
xTavTKxX σ×+=
Where,KTisthefrequencyfactor,obtainedfromstandardtablecorrespondingtoprobabilityof
execeedence,p(=1/T)andCs;
xavisthemeanoftheoriginaltimeseries,
σxisthestandarddeviationoftheoriginaltimeseries;
CsisthecoefficientofSkewnessandinNormaldistributionCsequalstozero
ii. LogNormalDistribution: Thegeneralquantileestimationequationisasfollows:
( )yTavT KYeX σ×+=
Where,KTisthefrequencyfactor,obtainedfromstandardtablecorrespondingtoprobabilityof
execeedence,p(=1/T)andcoefficientofSkewness,Cs
Yavisthemeanofthelog-transformedtimeseries,
σyisthestandarddeviationofthelog-transformedtimeseries,
CsyisthecoefficientofSkewnessandinLogNormaldistributionCsequaltozero
iii. Gumble’s Distribution or Extreme Value Type-I Distribution (EVI): The general quantile
estimationequationisasfollows:
TTYuX α+=
Where, αµ ×−= 5772.0u
μ=xavisthemeanoforiginaltimeseries,
( ) πσα /6×=x
σxisthestandarddeviationoforiginaltimeseries,
YT=(-ln(-ln(1-1/T)))and(1-1/T)istheprobabilityofnonexceedenceand
Tisthereturnperiod
Thedetails of thesemethods are available in theHandbookofAppliedHydrologybyVent Te
Chow,1964.
3.3.3 DesignExampleofFloodFrequencyAnalysis
CalculatethedesignflooddischargeofThimpuRiverfora50yearreturnperiodfromthefollowing
data(Table3-6).
Table3-6AnnualMaximumFlowofThimpuChhu(m3/s)
S.N Year Maxflow(m3/s) Date
1 1991 143.40 17-Jul
2 1992 82.00 27-Aug
3 1993 106.70 24-Aug
4 1994 62.16 31-Aug

█ Egis Eau & RSPN/ BhWP Irrigation Engineering Manual
30
S.N Year Maxflow(m3/s) Date
5 1995 93.04 15-Aug
6 1996 83.81 30-Aug
7 1997 105.80 13-Aug
8 1998 129.94 8-Jul
9 1999 118.07 26-Aug
10 2000 111.55 1-Sep
11 2001 137.00 19-Aug
12 2002 132.64 23-Aug
13 2003 104.54 1-Jul
14 2004 100.03 21-Jul
15 2005 78.88 15-Aug
16 2006 84.32 26-Sep
17 2007 155.09 7-Sep
18 2008 86.68 20-Jul
i. Normaldistribution
Meanofthesamplesize(xav)=106.42m3/s
Standarddeviationofsamplesize(Ϭx)=25.44
Reducedvariateisprovidedbasedonreturnperiod.
Returnperiod(years) 2 5 10 20 50 100
Reducedvariate(KT) 0.00 0.84 1.28 1.64 2.05 2.33
xTavTKxX σ×+=
For50yearsreturnperiodflood(Q50)=106.42+2.05*25.44=158.57m
3/s
ii. Gumbledistribution(type-I)
Meanofthesamplesize(xav)=106.42m3/s
Standarddeviationofsamplesize(Ϭx)=25.44
Scalefactor(α)=Ϭx*0.78=25.44*0.78=19.84
Locationfactor(u)=Xav–α*0.5772=106.42–19.84*0.5772=94.97
Reducedvariateisprovidedbasedonreturnperiod.
Returnperiod(years) 2 5 10 20 50 100
Reducedvariate(YT) 0.37 1.50 2.25 2.97 3.90 4.60
TTYuX α+=
For50yearsreturnperiodflood(Q50)=94.97+19.84*3.90=172.36m3/s
Insummarythecalculateddesignfloodsare:
Normaldistribution,Q50=158.57m3/s
Gumbeldistribution,Q50=172.36m3/s

█ Egis Eau & RSPN/ BhWP Irrigation Engineering Manual
31
3.3.4 RationalMethod
TheRationalMethodisawidelyusedmethodfordesignfloodestimationofsmallcatchments.This
methodconsiderstheentirecatchmentareaasasingleunitassuminguniformrainfalldistribution.
Thismethodissuitableforsmallcatchmentswithanareaoflessthan25km2.Therationalmethod
formulaisasfollows:
AICQ 278.0=
Where,Qisthepeakdischargeinm3/s,
Cistherunoffcoefficient(roughlydefinedasratioofrunofftorainfall),
Iistherainfallintensityinmm/h,
Aisthecatchmentareainkm2
TheRationalformulaadaptsfollowingassumptions:
• Thepredictedpeakdischargehassameprobabilityofoccurrenceasthatofrainfallintensity,
• Therun-offcoefficientisconstantduringrainstorms,and
• Therecessiontimeisequaltothetimeofrise
Themaximumrun-offrateinthecatchmentisreachedwhenallpartsofthewatershedcontribute
totheoutflow.Thishappenswhenthetimeofconcentration(Tc) isreached,whichisregardedas
the time taken for the run-off at the most remote part of the catchment to reach the point of
outflow.Therearemanymethodsavailabletocalculatethetimeofconcentration.Eachmethodhas
its own parameters to consider. Themostwidely usedmethod for the calculation of the time of
concentrationistheRamser-Kirpichmethod,whichisexpressedasfollows:
385.077.00019.0
−××= SLT
c
Where,ListhelengthofthemainstreaminmandSistheweightedslopeofthemainstream.
Rainfall intensity (I) is computed from the rainfall intensity-duration curves of a known location
basedonthetimeofconcentration(Tc)ofthestreaminhours.Theaveragerainfallintensity(I)has
durationequal to thecritical stormduration,normally takenasa timeofconcentration (Tc). The
Feeder RoadManual, Volume I, Hydrology has prepared rainfall intensity curves for 10 selected
stationsofBhutanandthesecurvescanbeusedtodeterminetherainfall intensityofaparticular
areaforthedesignreturnperiod.Fornaturalcatchments,thevaluesofCvaryfrom0.2to0.4.
3.3.5 EmpiricalMethods
Empiricalrelationsarebasedonthestatisticalcorrelationbetweentheobservedpeakflowandthe
catchmentareainagivenregionandarethereforeregionspecific.Themethodusedincentraland
northernpartsofIndiaistheModifiedDickensMethod.
(i) ModifiedDickensMethod
3/2CAQ f =
AAP
PTC
S/)6(100
4)/1185log()6.0log(342.2
+=
+=
Where,
Aisthecatchmentareainkm2,

█ Egis Eau & RSPN/ BhWP Irrigation Engineering Manual
32
Asisthesnowcoveredareawithinthecatchmentareainkm2,
Tisthereturnperiodinyears
ThemostwidelyusedempiricalmethodsforcalculatingfloodflowinNepalaretheWECSandDHM
Method and the Sharma and AdhikariMethod. The Sharma and AdhikariMethod is the updated
version of theWECS and DHMMethod. Thesemethods are based on regression analysis of the
availabledata.
(ii) WECSandDHMMethod
WaterandEnergyCommissionSecretariat(WECS)ofNepaldevelopedthemethodin1990basedon
theregressionanalysisofavailableDepartmentofHydrologyandMeteorology(DHM)dataofNepal.
Theequationsusedforthecalculationof2-yearand100-yearreturnperiodfloodsare:
( ) 8783.0
300028767.1 AQ =
( ) 7342.0
3000100639.14 AQ =
Where, Q2is2-yearreturnperiodflood,
Q100is100-yearreturnperiodflood,
A3000iscatchmentareabelow3000maltitude,
Basedonthealgebraicevaluationsusedforlognormaldistribution,thefollowingrelationshipcanbe
usedtoestimatefloodsatotherreturnperiods.
)exp(ln 2 lf SQQ σ+=
Where,
326.2/)/ln( 2100 QQl =σ
Sisthestandardnormalvariate(Table3-7).
Table3-7StandardNormalVariate
ReturnPeriod(T)inyears StandardNormalVariate(S)
2 0
5 0.842
10 1.282
20 1.645
50 2.054
100 2.326
Hence, the 50-year return period flood (Q50) is estimated as follows:
( )[ ]326.2/)/ln(054.2lnexp 2100250 QQQQ +=
█ Egis Eau & RSPN/ BhWP Irrigation Engineering Manual
33
(iii) SharmaandAdhikariMethod
( ) 86.030002
29.2 AQ =
( ) 72.03000100
7.20 AQ =
Where,
Q2is2-yearflood
Q100is100-yearflood
A3000isthecatchmentareabelow3000maltitude
Forestimating the floodsofother returnperiods, the relationships shown in theWECSandDHM
methodcanbeused.Hence,the50-yearreturnperiodflood(Q50)isestimatedasfollows:
( )[ ]326.2/)/ln(054.2lnexp 2100250 QQQQ +=
(iv) SCSMethod
TheU.S.SoilConservationService(SCS)methodisapplicableinsmallcatchmentsandiswidelyused
in irrigationprojects for catchmentsbelow100km2. The runoff fromnatural catchmentsmaybe
estimatedusingthefollowingformula:
( )2
4 a
a
IP
IPQ
+
−=
Where,Qistherunoffinmm,
Pisthedesignrainfallinmm,and
Iaistheinitiallossduetoinfiltration,interceptionandsurfacestorage
Theinitialloss(Ia)isdefinedbyacurvenumber(CN)whichisequalto:
Ia=5.08(1000/CN-10)mm
CN represents the hydrological soil group, the type of land use and the antecedent moisture
condition. A range of CN values appropriate to normal antecedent moisture conditions and
applicable Himalayan conditions is presented in Table 3-8. A high value of CN reflects low initial
lossesandcorrespondinglyhighrunoff,whereasalowvalueindicatesdiminishedrunoff.
Thesurfacerunoffcategoriescanbedescribedas:
Rapid-Earlygrowthstageofcrops
- Poorplantdensity
- Poorgroundcover
- Overgrazedareas
Slow-Latergrowthstageofcrops
- Denseplantintensity
█ Egis Eau & RSPN/ BhWP Irrigation Engineering Manual
34
- Goodgroundcover
- Lushgrazingareas
Themeanslopemaybecalculatedfrom
100×=L
ESlope
δ
Where, Eδ is the difference in elevation (in m) between the highest point on the watershed
nearesttothestreamheadanditsoutfallpointandListhelengthofthemainstream.Theslope
categoriesaregiveninTable3-8.
Table3-8HydrologicalSoilGroupsandCNValues
TypeofSoil InfiltrationRate Class
DeepSandy High A
ShallowSandyandMediumTextured Moderate B
ShallowwithMedium/HeavyTexture Slow C
ClayandShallow/hardpans VerySlow D
Land use or
Cover
SurfaceRunoff HydrologicalSoilClass
A B C D
Fallow
Row Crops e.g.
Maize
Rapid 77 86 91 94
Moderate 72 81 88 91
Slow 67 78 85 89
BroadcastCrops
e.g.UplandRice
Rapid 65 76 84 88
Slow 63 75 83 87
Pasture or
range
Rapid 68 79 86 89
Moderate 49 69 79 84
Slow 39 61 74 80
Woods Moderate 36 60 73 79
Slow 25 55 70 77
Table3-9SlopeCategories
Category RangeofSlope
Flat 0-5
Moderate 6-10
Steep >10

█ Egis Eau & RSPN/ BhWP Irrigation Engineering Manual
35
Tochoose thedesign rainfalla rangeofgrowth factorscorresponding tovarious returnperiods is
presentedinTable3-10.
Table3-10Growthfactorsformaximumrainfall
ReturnPeriod(Years) GrowthFactor(G)
5 1.3
10 1.5
25 1.8
50 2.0
100 2.3
150 2.4
200 2.5
Note:G=0.32lnT+0.78
Where, GisthegrowthfactorforGumbeldistribution,
Tisthereturnperiodand
lnisthenaturallogarithm
The growth factors are used to adjust themean annualmaximum24 hour rainfall values. As the
rainfall data represents a single location, theymust be reduced according to the areal reduction
factor, which depends on the size of the catchment area in question. Factors for a range of
catchmentareasaregiveninTable3-11.
Table3-11ArealReductionFactorfor24HoursPointRainfall
CatchmentAreakm2 ArealReductionFactor
10 1.00
50 0.99
100 0.98
200 0.96
500 0.91
1000 0.86
5000 0.76
ThestepstodeterminethefloodflowusingtheSCSmethodissummarizedasfollows:
Step1:Chooseacurvenumber(CN)fromTable3-8,takingintoaccounthydrologicalsoilclass,cover
andrunoffcategory.

█ Egis Eau & RSPN/ BhWP Irrigation Engineering Manual
36
Step2:Findthecatchmentarea(A)inkm2,mainstreamlength(L)andtheslopeinpercentage(δE/L
x100).
Step3:ChooseaslopecategoryfromTable
Step 4 : Choose a design 24-hour rainfall adjusted according to Table 3-10 to give the required
returnperiodandadjustaccordingtoTable3-11forthecatchmentarea.
Curve numbers (CN) of 60, 70 and 80 have been chosen and for each there are three slope
categories:flat,moderateandsteep.
OnceCNvalueandslopecategoryhavebeenchosen,theremainingtaskistolocatetheintersection
of thecatchmentareaordinatewiththedesignrainfallcurve inorder toreadoff thedesignpeak
flood.
3.3.6 FloodEstimationfromTrashMarks
TheTrashmarkmethodisoneoftheconventionalmethodsofestimatingfloodflowwhichisused
whenotherdataandinformationareunavailable.Thismethodisbasedontheslopeareasurveyof
theparticularriverstretchwherepastfloodlevelscanberecordedwiththehelpofoldinhabitants
and/or local informants. Itmaybepossibletofinddebris indicatingapastfloodlevelortohavea
level on a tree or building pointed out. Trash mark levels are more accurate than remembered
levels. A river cross sectional survey is needed at two or three sites where flood levels can be
obtainedandthehydrauliccalculationiscarriedoutusingManning’sformula:
n
SRAQ
2/13/2××
=
Where,Aistheareaofrivercrosssectionuptotrashlevelinm2,
Risthehydraulicradius=A/P
Sisthewatersurfaceslope
nistheManning’sroughnesscoefficientandisgiveninastandardtable(VenTeChow,1959)
Pisthewettedmeterinm,
Thewatersurfaceslopeisthatobtainedfromthetrashmarksatthreedifferentsites.Thefloodflow
canbeestimatedfortwoorthreesitesandthenaveraged.
3.3.7 AssessmentofFloodFlowConsideringClimateChange
Climatechangemay increase the intensityofextreme rainfall and flow rates. Irrigation structures
aredesignedforacertainlevelofexceedenceofrainfall,flowratesandwaterlevels.Theseallare
basednotonlyontheaccurateassessmentofthedataqualitybutalsoadequateknowledgeofthe
consequencesofanexceedence.Hence,adequatedataandknowledgeisessentialduringthedesign
of hydraulic structures such as intakes and cross drainage works. One suggested approach is to
selectahigherreturnperiodfordesignfloodflowassessment,whichisnotalwayseconomical.In
addition, the computeddesign flooddischarge canbe increasedby adding 10 to 20% in order to
assessdesignfloodwithclimatechangeconsiderations.

█ Egis Eau & RSPN/ BhWP Irrigation Engineering Manual
37
3.4 WaterRequirementAssessment
3.4.1 CropWaterRequirements
Thecropwaterrequirement isdefinedasthequantityofwaterutilizedbytheplantduring its life
time. It is estimated with the evapotranspiration (ETo) of a reference crop. The steps used to
calculatethecropwaterrequirementareasfollows:
i. Collectclimaticdatafromnearbymeteorologicalstation,
ii. Decidecroppingpattern,
iii. Calculatereferencecropevapotranspiration(ETo)(fromFAOmethodsandtables),
iv. Usecropcoefficients(fromFAO),
v. CalculateevapotranspirationofcropsETcrop(mm/day)
vi. Allowforlandpreparationloss(riceandwheatonly)(Lp),
vii. Allowfordeeppercolation(riceonly)(dp),
viii. Calculatetotalcropwaterrequirements(CWR),
ix. Calculateeffectiverainfall(Pe),
x. Calculatenetcropwaterrequirements(netCWR),
3.4.2 Climaticdata
In order to calculate the reference crop evapotranspiration (ETo), climatic data shall be collected
from thenearest andmost representativemeteorological stations. The required climaticdataare
longtermmonthlyminimumandmaximumairtemperatures,monthlyrainfall,relativehumidityor
vapour pressure, wind speed and sunshine duration. In addition, locational information such as
latitude,longitudeandaltitudearenecessary.
3.4.3 CroppingPattern
Theproposedcroppingpatternfor irrigationschemesshouldbebasedonagro-climaticconditions
andfarmers’preferences.ThepossiblecroppingpatternspracticedinBhutanarepresentedinthe
tablebelow(Table3-12).
Table3-12PossibleCroppingPatternsofBhutan
S.
N
Agro-ecologicalZones Dates
Crops Seedbed Transplant/Plant Harvest
1 Cooltemperate(2600mto3600mamsl)
i Potato March August
ii Maize March October
iii Wheat November June
iv Buckwheat September June
2 Warmtemperate(1800mto2600mamsl)
i Paddy April/May May/June October
Fallow
ii Paddy April/May May/June October
Legumes/Oilseeds December April
iii Paddy April/May May/June October
Wheat Nov/December May

█ Egis Eau & RSPN/ BhWP Irrigation Engineering Manual
38
S.
N
Agro-ecologicalZones Dates
Crops Seedbed Transplant/Plant Harvest
iv Potato December April
Vegetables April August
V Orchard Roundtheyear
3 DrySub-tropical(1200mto1800mamsl)
i Paddy April/May May/June October
Fallow
ii Paddy April/May May/June October
Wheat Nov/December May
iii Paddy April/May May/June October
Vegetables/Legumes November February/March
iv Paddy April/May May/June October
Potato November March/April
v Orchard Roundtheyear
4 Humidsub-tropical(600mto1200mamsl)
i Paddy April/May May/June October
Fallow
ii Paddy April/May May/June October
Wheat December April/May
iii Paddy April/May May/June October
Potato November March
iv Paddy April/May May/June October
Vegetables/Legumes January April
v SpringMaize February June
Paddy May/June June October
vi Orchard Roundtheyear
5 Wetsub-tropical(150mto600mamsl)
i Paddy April/May May/June October
Fallow
ii Paddy April/May May/June October
Paddy January February May/June
iii Paddy April/May May/June October
Wheat Nov/December April
iv Springmaize February June
Paddy April/May May/June October
v Paddy April/May May/June October
Potato December April
vi Paddy April/May May/June October
Vegetables/Legume November February/March
Source:DerivedfromDOAinformation,2015

█ Egis Eau & RSPN/ BhWP Irrigation Engineering Manual
39
3.4.4 ReferenceCropEvapotranspiration(ETo)
The Reference Evapotranspiration (ETo) represents the potential evaporation of a well-watered
grasscropknownasthereferencecrop.Dependingupontheavailabilityofclimaticdata,thereare
fourmethods for calculatingEToofwhich themostwidelyusedmethod is thePenman-Monteith
method. The FAO has developed software to calculate ETo, the latest version is Cropwat-8. This
softwareisuser-friendlyandeasilyavailableonFAOwebsites.AworkedoutexampleofCrowat-8is
presentedhere(Table3-13).
Table3-13WorkedoutexampleofCropwat-8
3.4.5 CropCoefficient(Kc)
The crop coefficient (Kc) is the experimentally determined ratio of crop evapotranspiration to
reference crop evapotranspiration (ETc/ETo). The crop coefficient considers the leaf anatomy,
stomata characteristics, aerodynamic properties, and albedo of the crop under the same climatic
conditions.Inaddition,thecropcoefficientfactor(Kc)servesasanaggregationofthephysicaland
physiologicaldifferencesbetweencropsandthereferencedefinition(FAO,1998).Thefactorsthat
determine theKc are crop type, climate, soil evaporation, and crop growth stages. TheKc values
varywithcropgrowingstages,whichare:
• Initialstage,
• Cropdevelopmentstage,
• Mid-seasonstage,and
• Lateseasonstage
Cropcoefficients(Kc)ofvariouscropsproposedinthismanualarederivedfromtheFAOIrrigation
andDrainageManualno56andarepresentedbelow(Table3-14).

█ Egis Eau & RSPN/ BhWP Irrigation Engineering Manual
40
Table3-14CropCoefficientsofSelectedCrops
Crops Initialstage Cropdevelopment
stage
Mid-season
stage
Lateseasonstage
Maize 0.45 0.80 1.05 0.80
Rice 1.10 1.10 1.05 0.95
Wheat 0.43 1.05 1.15 0.40
Potato 0.42 0.80 1.15 0.77
Mustard 0.45 0.85 1.00 0.72
Legumes 0.40 0.95 1.05 0.95
Vegetable
(winter)
0.28 0.54 0.95 0.89
Vegetable
(summer)
0.34 0.93 1.05 0.91
Orange 0.85 0.85 0.85 0.85
Apple 0.80 1.00 1.10 0.80
Source:DerivedfromFAO,1998
3.4.6 CropEvapotranspiration(ETcrop)
Cropevapotranspirationiscalculatedbymultiplyingthereferencecropevapotranspiration(ETo)by
thecropcoefficients(Kc)oftheparticularcrop.AllofthecalculationsaretabulatedonExcelsheets
on15daysbasisoftheyear.
KcEToETcrop ×=
WhereETcropisthecropevapotranspirationinmm/day,
EToisthereferencecropevapo-transpirationinmm/day,and
Kcisthecropcoefficientsoftheparticularcropforgivenastageofcropdevelopment
3.4.7 LandPreparationRequirement
Sincelandpreparationonpaddyfieldsisdoneduringthedryperiod,somewaterisrequiredforthat
work. For non-paddy crops,much lower landpreparation requirements are assumed, and can be
metbysoilmoisturestorage,except inthecaseofwheat, forwhich60mmisappliedto improve
germination. Landpreparation requirements forpaddyovera15-dayperiodarepresentedbelow
(Table3-15).
Table3-15LandPreparationRequirements
15-dayperiods 1st 2
nd 3
rd 4
th
Pre-monsoonpaddy 75 75 50 50
Followpaddy 55 50 50 -
█ Egis Eau & RSPN/ BhWP Irrigation Engineering Manual
41
15-dayperiods 1st 2
nd 3
rd 4
th
Monsoonpaddy 55 55 50 50
Wheat 60 - - -
3.4.8 DeepPercolationLosses
Deeppercolationlossesareconsideredonlyforpaddyriceanddependonsoiltypes(Table3-16).In
addition, evaporation losses from the paddy field are also considered based on pan evaporation
dataofeachlocation.
Table3-16EstimatedDeepPercolationLosses(mm/day)
SoilTexture NewlyIrrigated LongtermIrrigated
Sand,loamysand >20 >20
Sandyloam 20 10
Veryfinesandyloam,loamsilty
loam,sandyclayloam
20 5
Siltyclayloam,clayloamsiltyclay,
clay
5 2
3.4.9 TotalCropWaterRequirements(mm/15day)
The Total CropWater Requirement (CWR) is the sum of crop evapotranspiration (ETcrop), water
requirementforlandpreparation(Lp),lossesduetopercolation(Dp)andlosesduetoevaporation
(Ep).
CWR=ETcrop+Lp+Dp+Ep
3.4.10 ReliableRainfallandEffectiveRainfall
Rainfall contributes to a greater extent in satisfying cropwater requirement depending upon the
location. Howmuchwaterwill come from rainfall and howmuchwill be covered by irrigation is
unfortunately difficult to predict as rainfall varies from season to season and year to year. In
addition,notalloftherainthatfallsonthefield isusedbytheplant.Theamountofrainfallused
effectively for plant growth is termed effective rainfall, and is calculated from the 80% reliable
rainfallofthearea.
80% Reliable Rainfall: The amount of rainfall which can be depended on in 1 out of 5 years,
correspondingtothe80%probabilityofexceedence,istermedReliableRainfall.TheFAOsuggests
using80%reliablerainfallforirrigationsystemdesign.Rainfallswith20%,50%and80%probability
ofexceedencearedefinedaswetyear,normalyearanddryyearrainfallrespectively.Tocompute
dryyearrainfall (80%reliable) fromthetimeseriesmeteorologicaldata, the followingprocedures
havebeenadopted:
i. Tabulateyearlyrainfalltotalsofthegivenperiod,
ii. Arrangedataindescendingorderofmagnitude,
iii. Tabulateplottingpositionsaccordingtothefollowing:

█ Egis Eau & RSPN/ BhWP Irrigation Engineering Manual
42
1
100
+
×=N
mFa
Where,Faistheplottingposition,
mistheranknumber,
Nisnumberofrecords
iv. Plotvaluesinlog-normalscaleandobtainlogarithmicregressionequation(Figure3-1),
v. Calculateyearvaluesof80%probability(P80),
vi. Determinemonthlyvaluesofdryyearaccordingtothefollowingrelationship:
Pav
PPP
dry
iavidry ×=
Where,Pidryisthemonthlyrainfalldryyearformonthi,
Piavistheaveragemonthlyrainfallformonthi,
Pdryistheyearlyrainfallat80%ofprobabilityofexceedence
Pavistheaverageyearlyrainfall,
Figure3-1WorkedoutExampleofReliableRainfall
Thepartoftherainfallwhichiseffectivelyusedbythecropafterrainfalllossesduetosurfacerunoff
anddeeppercolationistermedasEffectiveRainfall(Peff).TheFAOdevelopedsoftware,Cropwat-8,
hasdifferentoptionsforcomputingeffectiverainfall.ThemostwidelyusedmethodistheUSDASoil
ConservationServicemethod.Aworkedoutexampleof80%reliablerainfallandeffectiverainfallof
theParoDCSstationispresentedhere(Table 3-17).
Dry(80%)

█ Egis Eau & RSPN/ BhWP Irrigation Engineering Manual
43
Table3-17Workedoutexampleofreliableandeffectiverainfall(mm)
Month Jan Feb Mar Apr May Jun Jul Aug Sep Oct Nov Dec
Average
Rainfall
7.4
15.1
20.0
32.1
55.6
83.3
136.9
118.6
89.1
52.2
1.7
2.8
P80
Reliable
5.7
11.6
15.4
24.7
42.8
64.2
105.5
91.4
68.7
40.2
1.3
2.2
Effective
Rainfall 5.6 11.4 15.1 23.7 39.9 57.6 87.7 78.0 61.1 37.7 1.3 2.2
3.4.11 NetCropWaterRequirements(mm/15day)
Thenetcropwaterrequirement(NetCWR)iscalculatedasthedifferencebetweentotalcropwater
requirementsandeffectiverainfall(Pe).
NetCWR=CWR–Pe
Where,NetCWRisthenetcropwaterrequirementinmm/15dayandPeistheeffectiverainfallin
mm.
Hence, the net crop water requirement for paddy crops is crop evapotranspiration plus land
preparation requirements (including evaporation from land preparation) plus deep percolation
minus effective rainfall. The net crop water requirement for dry root crops is the crop
evapotranspiration plus, in the case of wheat, land preparation requirements minus effective
rainfall.
3.4.12 CanalSystemEfficiencies
During the irrigation process, considerable water loss occurs through evaporation, seepage and
deeppercolation.Theamountlostdependsupontheefficiencyofthesystem.Inordertocalculate
the intake water requirements, field irrigation losses, distribution canal losses, and conveyance
canallossesmustbetakenintoaccount.
(i) Fieldefficiency(Fe):Irrigationfieldapplicationefficiencyisexpressedastheratioofwater
storedintherootzonetothewaterapplied.Whenirrigatingdryrootcrops,itisdifficultto
apply thewater evenlyover thewhole field. To allow for this, a field efficiencyof 60% is
assumed.Forrice,astheirrigationisbasedonfloodingfieldefficiencycanbeassumedto
be75%to85%toallowforlimitedrun-offandoverspill.
(ii) Distribution efficiency (De): The distribution efficiency is the efficiency of the water
distributioncanalsandconduitssupplyingwaterfromtheconveyancesystemtoindividual
fields. Irrigationwater is lost along the field channels from the off-take structures due to
seepage, percolation, evapotranspiration, evaporation, and/or leakage. Distribution
efficiencyisconsideredtobe70%to80%dependinguponthetypeofdistributionsystem.
(iii) Conveyanceormaincanalefficiency(Ce):Irrigationwaterisalsolostalongdeliverycanals
suchasthemaincanalandthesecondary/tertiarycanalfromtheintaketotheoff-takesof
distribution system. It is causedby seepage,percolation, evapotranspiration, evaporation,
leakageand/oroverdiversionofirrigationwater.Conveyanceefficiencyisconsideredtobe
70%to80%.

█ Egis Eau & RSPN/ BhWP Irrigation Engineering Manual
44
Overallirrigationsystemefficiencyrangesfrom29%forsmallscalehillirrigationschemesto54%for
well managedlargeirrigationsystems.
3.4.13 IntakeWaterRequirement
Theintakewaterrequirementisthemaximumfieldcropwaterrequirementdividedbythesystem
efficiencies.
TheFieldCropWaterRequirement(l/s/ha)=NetCWR(mm/15day)/(Fe*129.6)
Where, 129.6 is the conversion factor to convert mm/15day into l/s/ha, since 8.64mm/day = 1
l/s/haandFeisfieldefficiency.
IntakeWaterRequirement(IWR)=FieldCWR/(Cse),l/s/ha
Where,Cseisthecanalsystemefficiency,whichmaybetakenas30%to50%.
The detailed worked out example of the crop water requirement is presented hereunder (Table
3-19).
3.4.14 Considerationofclimatechangeincropwaterrequirement
Considerationofthepotential impactsofclimatechangeoncropwaterrequirementssuggestthat
farmoperationsshouldbesuitedtothelocalconditionsinordertoreducetheriskofcropdamage.
Thismayrequireadjustingthetimingofcropplantingandharvestingdates,changingthecropping
intensity, and proposing crop varietieswith lowwater requirements andwhich can tolerate heat
anddrought.Inaddition,irrigationwaterrequirementscouldbeminimizedbyincreasingirrigation
system efficiency and using crop coefficients on the lower side of the given range. Furthermore,
deficitirrigationshallalsobeintroducedincaseofacuteclimatechangeconditions.
3.4.15 IrrigationWaterDuty
The duty of irrigation water is the amount of water required for irrigation of a unit of land for
specificcropataspecifictime.Theirrigationwaterdutydependsupon:
• Typeofsoil,
• Percolationrateofsoil,
• Rainfall,and
• Croppingpractice
In Bhutan, the peakwater requirement occursmostly during the landpreparation period in June
andrangesfrom1.6l/s/hato4.3l/s/ha(Table3-18).
Table3-18Irrigationwaterduty
Soiltype Clay Loam Sandyloam
Percolationrate(mm/day) 0-5 5-10 10-15
Rainfall<2,500mm/year Irrigationduty
(l/s/ha)
2.4 3.3 4.3
Rainfall>2,500mm/year 1.6 1.9 2.2
Source:IrrigationEngineeringManual,1998

█ Egis Eau & RSPN/ BhWP Irrigation Engineering Manual
45
Table3-19Workedoutexampleofcropwaterrequirement
Project: Irrigation Master Plan Location: Paro DCS Cropping pattern: Rice Potato
Month
Half Month 1 2 1 2 1 2 1 2 1 2 1 2 1 2 1 2 1 2 1 2 1 2 1 2
Cropping Pattern Potato Rice Potato
Rice---Potato 20%
ET0 mm/day 1.46 1.46 1.96 1.96 2.53 2.53 3.02 3.02 3.34 3.34 3.20 3.20 3.14 3.14 3.14 3.14 2.83 2.83 2.54 2.54 1.84 1.84 1.37 1.37
Crop coefficient (Kc) 1.01 1.13 1.13 1.08 0.94 0.77 1.10 1.10 1.10 1.10 1.05 1.05 1.05 0.95 0.95 0.95 0.42 0.55 0.79
ETcrop mm/day 1.47 1.65 2.21 2.12 2.38 1.95 0.00 0.00 0.00 3.67 3.52 3.52 3.45 3.30 3.30 3.30 2.69 2.69 2.41 0.00 0.00 0.77 0.75 1.08
ETcrop (mm/half month) 22.86 25.57 31.01 29.64 36.86 30.20 0.00 0.00 0.00 56.95 52.80 52.80 53.54 51.10 51.10 51.10 40.33 40.33 37.40 0.00 0.00 11.59 11.68 16.78
Land preparation (mm) 55.00 55.00 50.00 50.00
Deep percolation (mm) 75.00 75.00 75.00 75.00 75.00 75.00 75.00 75.00 75.00 75.00
Pan evaporation (mm/day) 5.00 5.00
Pan evaporation (mm/15day) 75.00 75.00
Total crop water requirement 22.86 25.57 31.01 29.64 36.86 30.20 0.00 0.00 0.00 261.95 257.80 177.80 178.54 126.10 126.10 126.10 115.33 115.33 112.40 0.00 0.00 11.59 11.68 16.78
(mm/half month)
80% Reliable Rainfall 2.57 3.32 4.03 5.09 6.49 8.18 10.16 13.41 17.93 22.44 26.97 36.99 52.49 55.10 44.81 37.52 33.22 27.75 21.08 14.10 6.82 2.73 1.83 1.77
Effective Rainfall 0.00 0.00 0.00 0.00 0.00 0.43 1.28 3.05 5.75 8.46 11.19 18.46 30.29 32.08 23.83 18.19 15.16 11.65 7.65 4.24 1.41 0.00 0.00 0.00
Net irrigation water requirement
mm/half month 22.86 25.57 31.01 29.64 36.86 29.77 0.00 0.00 0.00 253.48 246.61 159.34 148.25 94.03 102.28 107.92 100.17 103.68 104.75 0.00 0.00 11.59 11.68 16.78
Overall system efficiency 0.30 0.30 0.30 0.30 0.30 0.30 0.30 0.30 0.30 0.30 0.30 0.30 0.30 0.30 0.30 0.30 0.30 0.30 0.30 0.30 0.30 0.30 0.30 0.30
Total water requirement
(mm/half month) 76.2 85.2 103.4 98.8 122.9 99.2 0.0 0.0 0.0 844.9 822.0 531.1 494.2 313.4 340.9 359.7 333.9 345.6 349.2 0.0 0.0 38.6 38.9 55.9
Water requirement of the
system (m3 per ha) 762 852 1034 988 1229 992 0 0 0 8449 8220 5311 4942 3134 3409 3597 3339 3456 3492 0 0 386 389 559
Water requirement (l/s/ha) 0.59 0.66 0.80 0.76 0.95 0.77 0.00 0.00 0.00 6.52 6.34 4.10 3.81 2.42 2.63 2.78 2.58 2.67 2.69 0.00 0.00 0.30 0.30 0.43
Monthly water requirement
(l/s/ha) 3.12 2.70 2.62 1.35 0.15 0.370.62 0.78 0.86 0.00 3.26 5.22
Jul Aug Sep Oct Nov DecJan Feb Mar Apr May Jun
Total Water Requirement Computation

█ Egis Eau & RSPN/ BhWP Irrigation Engineering Manual
46
3.5 WaterBalanceAssessment
3.5.1 General
Water balance is the difference of inflows and outflows at the particular point of river diversion.
Inflows are rainfall and runoff while outflows are water demand for irrigation, household water
supply, evaporation and evapotranspiration from vegetation. The water balance is calculated at
eachdiversionpointinordertoascertaintheamountofavailablewaterthatcouldbeusedinthe
proposedirrigationschemewithoutimpactingtheexistingusesofwater.Themaincomponentsof
thewaterbalanceareavailableriverflowattheintakesite,thewaterrequirementforirrigationas
per the proposed cropping pattern and intensity, and downstream mandatory releases for
householdsupplyandenvironmentalflow.
3.5.2 AvailableFlowattheIntakeSite
The available river flow at the intake site is assessed according to themethodology described in
section3.2ofthischapter(Chapter-3).Fromtheavailableflow,the80%reliableflowisassessedfor
diversion to the irrigationschemeunderconsideration.Theavailable flowat the intakesite is the
balanceoftheavailable80%reliableflowminusmandatoryreleasesforupstreamanddownstream
existinguses,includingenvironmentalflow.
3.5.3 ExistingDownstreamRequirements
Existing water uses need to be considered while designing the irrigation scheme. The users and
farmersusing thewater for irrigationand/ordrinkingwater in thevicinityof theproposed intake
siteshouldfirstagreetothedevelopmentoftheproposedirrigationscheme.Thedesigner/planner
needstoassessallofthewithdrawalsofwaterupstreamanddownstreamoftheproposedintake
site.Theexistingwaterwithdrawalscanbeassessedbymeasuringtheflowatitsintakesiteandby
consultingthecommunity.Forthemandatoryenvironmentalflow,atleast10%ofthenon-monsoon
flowshallbereleasedfromtheproposedintakesite.
3.5.4 WaterBalance
Theavailablewaterat thesourcestream/rivershouldmeettherequirementsofallexistingwater
uses, proposed intake water requirements, and the mandatory downstream flow. If the water
balanceispositiveintermsofmeetingtheserequirements,theschemeistechnicallyfeasiblefroma
water availability point of view. If the water balance is negative, it is essential to change the
croppingpatternsand/orreducethecommandareaoftheproposedschemeasitisnotpossibleto
changetheexistingwaterrequirementsorthemandatorydownstreamflow.
3.6 DischargeMeasurement
3.6.1 General
Theamountofwaterpassingatapointonthestreamorchannelduringagiventimeisafunctionof
thevelocityandcross-sectionalareaandisexpressedbytheContinuityequation:Q=AV,whereQis
the stream discharge, A the cross-sectional area, and V the flow velocity. The discharge
measurement concerns themeasurement of the flow velocity and cross sectional area. For small
irrigation schemes, threemethodsareappropriate for thedischargemeasurement: floatmethod,
bucketandwatchmethod,andcurrentmetermethod.

█ Egis Eau & RSPN/ BhWP Irrigation Engineering Manual
47
3.6.2 Floatmethod
Thefloatmethodmeasuresthesurfacevelocityofflowingwater,andthemeanvelocityisobtained
using a correction factor. The basic idea is to measure the time taken to float an object over a
specifieddistance.
Vsurface=traveldistance/traveltime=L/t
Because surface velocities are typically higher thanmean or average velocities, V mean = k Vsurface
wherekisacoefficientthatgenerallyrangesfrom0.65forroughbedsto0.75forsmoothbeds.The
proceduresfordischargemeasurementareasfollows:
• Step1Chooseasuitablestraightreachwithminimumturbulence(minimumdistanceshouldbe
20m);
• Step2Markthestartandendpointsofthechosenreach;
• Step3Ifpossible,traveltimeshouldexceed20secondsbutbeatleast10seconds;
• Step4Dropyourobjectintothestreamupstreamoftheupstreammarker;
• Step5Startthewatchwhentheobjectcrossestheupstreammarkerandstopthewatchwhen
itcrossesthedownstreammarker;
• Step6Repeatthemeasurementatleast3timesandusetheaverageinfurthercalculations;
• Step7Ifyouonlydothefloatmethod,youneedtomeasurethecross-sectionalareasatthe
startandendpointofyourreach;
• Step8Averagecross-sectionalareas;
• Step9Usingtheaverageareaandcorrectedvelocity,youcannowcomputedischarge
Q=AVmean
Figure3-2Dischargemeasurementwithfloatareamethod
3.6.3 BucketandWatchmethod
The bucket and watch method is a simple volumetric measurement of water at the given time
period.Thismethodisapplicableforspringsourceswithadischargelessthan1lps.Thevolumeof
watercanbemeasuredbydivertingtheentireflowintoameasuringvesselofknowncapacity(for
example,aplasticbucket).Thetimetakentofillthevesselisnoted.Atleastthreetofivereadings
are necessary for themeasurement of the water and average value is computed. The discharge
calculationmaybecarriedoutusingthefollowingformat(Table3-20).

█ Egis Eau & RSPN/ BhWP Irrigation Engineering Manual
48
Table3-20DischargeMeasurementwithBucket-WatchMethod
Projectname: Location:
Sourcename: Dateofmeasurement:
Description Measurementnumber
A Vesselcapacity(liter) 1 2 3 4 5
B Timetofillthevessel(sec)
C Discharge(l/s)=A/B
D AveragedischargeQ(l/s) Q=(C1+C2+C3+C4+C5)/5
3.6.4 CurrentMeter
A current meter is a device used to measure the velocity of flowing water. It has a propeller
mountedonashaftwhichallowsthedevicetomovefreelyregardlessofthedepthofthewater.
Thespeedofrotationisthefunctionofthevelocityofwater.Themanufacturerofthecurrentmeter
providesthecorrelationbetweenthenumberofrotationsandwatervelocity.Themeasurementof
velocity ismore accurate and reliable and the currentmeter is extensively used in streamswith
uniformcrosssections.Thismethodisusefultomeasurevelocitiesintherangeof0.2m/sto5m/s.
Theproceduretomeasurethevelocityusingacurrentmeterisasfollows:
• Chooseasuitablesiteforthemeasurement;
• Secureameasuringtapeacrossthesection;
• Measurethechainageatbothbanksandcalculatethestreamwidth;
• Dividethestreamwidthintosections;
• Ifthereisstaffgauge,takeagaugereadingatthestartoftheflowmeasurement.Checkatthe
endthatthemeasurementisthesame;
• Measuretheflowinthecenterofeachsection:
o Measurethewaterdepth,
o Ifthedepthislessthanorequalto0.3mmeasurethevelocityat0.6d,
o Ifthedepthofwaterismorethan0.3mmeasurethevelocityat0.2dand0.8d,
• Calculatethevelocityfromthemachinemanufacturerstable;
• Calculatetheflowareaofeachsection;
• Calculatethedischargeineachsectionandsumdischargestogivethetotals,
• ThetotalstreamdischargeQ=a1v1+a2v2+a3v3+……+anvn

█ Egis Eau & RSPN/ BhWP Irrigation Engineering Manual
49
CHAPTER-4
4. IntakesandHeadworks
4.1 Introduction
Intakestructuresarehydraulicdevicesbuiltattheheadoftheirrigationcanals.Theirrigationcanals
in the context of the small scale irrigation include onlymain canals. The intakes formediumand
largeirrigationschemesaredifferentandbeyondthescopeofthismanual.Themainpurposeofan
intakeistoallowtheabstractionofwaterfromthesourcewithaminimumsedimententry.There
areanumberofdifferenttypesof intakes;theselectionofthemostappropriatetypedependson
thelocation,scaleandfunctionoftheirrigationscheme.Intakescanbefromrivers,reservoirs,and
lakes.
Any hydraulic structure which supplies water to the off-taking canal is called a headwork. A
headworkmaybeastorageheadworkoradiversionheadwork.Astorageheadworkcomprisesthe
constructionofadamontheriver,andstoreswaterwhenthereisexcesssupplyandreleaseswater
according to irrigation demands. A diversion headwork serves to divert the required amount of
water to the canal from the river. This manual covers the design of side intakes and diversion
headworks.
4.2 TypesofIntakes
Typesof intake structures aremainly distinguishedby themethodused todivertwater from the
sourceriver:
• Bankintakes,
• Sideintakeswithcrossweirs,
• Canaldiversionworks,
• Bottomintakes,
• Frontalintakes,
• Submergedintakes,and
• Towerintakes
4.2.1 BankIntake
Bankintakesarelocatedonthebanksoftheriverandtheirfacesarealignedwiththebanks.Bank
intakesareappropriateforirrigationwherewaterfluctuationintheriverislowandasmallportion
oftheriverflowisabstractedtothecanal.The inflowintothe intakestructuredependsuponthe
waterlevelintheriver.Inexistingcommunitymanagedschemes,temporaryarrangementsareused
toraisethewater level.Theintakes,whichareattheriverbedlevel,havecoarsescreens,control
gates and settling chambers to trap coarsematerial. Bank intakes are referred as side intakes or
lateralintakes.
4.2.2 Sideintakewithcrossweir
Sideintakeswithcrossweirareessentialforriversandstreamswhereasubstantialportionofthe
flow is tobediverted.Theweir issituated intheriverwhichdamsupthewater level toensurea
constantminimum depth of water upstream of theweir and allowswater to be diverted to the

█ Egis Eau & RSPN/ BhWP Irrigation Engineering Manual
50
canalsystem.Basedonthematerialusedfortheirconstruction,weirsaremasonryweirs,concrete
weirs,orwoodenweirs.
4.2.3 Canaldiversionworks
Canal diversion works are weirs or barrages constructed across the rivers to maintain adequate
levelstoabstractwatertowardsthemaincanal.Barragesareconstructedacrossthemainriverat
theheadworkofthenewcanals.Barragesandassociatedheadworksconsistofanundersluicefor
sluicingsedimentsandaheadregulatortocontroltheflowofwatertothemaincanal.
4.2.4 Bottomintake
Bottom intakes are located on the river bed and the water to be diverted is taken through a
collectionchamberbuiltintheriverbottomcoveredwithtrashscreens.Thebarsofthescreenare
laid in the direction of river flow and inclined in a downstreamdirection. The coarse sediment is
keptoutofthecollectionchamberandtransportedfurtherdownstream.Particleswhicharesmaller
thantheopeningsofthescreenbarsareintroducedintothecollectionchambertogetherwiththe
water, and are excluded from the settling basin through a flushing device constructed a short
distancedownstream.Thebottomintakecanbeconstructedatthesamelevelastheriverbedorin
theformofasill.
4.2.5 Frontalintake
Frontal intakes are designed to abstract clear water from mountain rivers. These intakes are
successfully utilized in Turkey. The intake has two layers: the upper layer draws clear water for
irrigationandthelowerlayercontinuouslyflushesthesedimentinfrontoftheintake.
4.2.6 Submergedintake
Asubmergedintakeislocatedatthebottomoftheriverorreservoir.Itcomprisesabellmouthand
bend set in a concrete block with a concrete draw-off pipe. The inlet is protected from the bar
screenandsethighenoughabovethebedtoallowsedimentstopassoneithersideoftheinlet.This
typeofintakeisoftenusedindrainageoutletofsmallreservoir.
4.2.7 Towerintake
Towerintakesarefreestandingstructures,setindeepwaterconnectedbyanaccessbridgetothe
bank.Tower intakesareused inoutletworksof the reservoirswith thearrangementsofgatesor
valves.
Irrespectiveofwhether the intakestructuresareselectedwithorwithoutdamming the river, the
structuresshouldbedesignedsothat:
• Attimesoflowestdischarge,therequiredamountofwatercanalwaysbediverted,
• Allfloodscanbeevacuatedwithoutdamageofthestructures,and
• Theamountofwaterflowingintothecanalislimitedtotheamountofwatertobediverted.
The selection of the type of intakes dependsmainly of the objective of the project, specific site
conditions, and the requirements of the irrigation scheme. The general criteria that affect the
selectionoftheintake/headworkare:

█ Egis Eau & RSPN/ BhWP Irrigation Engineering Manual
51
• Effectivenessinexcludingsedimententryintothecanal,
• Easeandrelativecostofstructure,
• Effectoffloodsintermsofdamagerisk,
• Effectoffloodsonsedimententry,and
• Flowcontroltothecanalsystem
4.3 SelectionofSiteforIntakesandheadworks
The site for the headwork or intake should be selected to ensure that the required flow can be
diverted to the canal at all stages of the river. The main considerations in the selection of the
headworkorintakesiteareasfollows:
• Channel dimensions- narrow floodwaywith a relatively straight approach reach, enabling the
rivertodeveloplinearflow,
• Thalwegdeflection-themainchannelwithlowflowisreferredasthethalweg.Thestabilityof
thethalwegisofprimeimportanceinselectingsuitableintakesites,
• Outersideofabend-secondarycurrentsdevelopontheoutersideofbendswhichreducethe
entryofbedloadintotheintakeanddeflectthebedcurrentsawayfromtheintake(Figure4-1),
• Confluence of two rivers- the most suitable location for an intake is downstream of the
confluenceoftworivers,
• Boulderdeposits-thelocationofbigboulderdepositisstableinsteeprivers,
• Bankstability-bankswith rockoutcrops,orarmoredboulderbanksprotecting the intake from
erosion,
• Riverslope-intakelocationisstableatpoolreachoftheriverslope,
• Stablegeologicalsection-intakeisstablewheregeologyisstable.
Figure4-1Layoutplansofsideintakes

█ Egis Eau & RSPN/ BhWP Irrigation Engineering Manual
52
4.4 SideIntake
4.4.1 DesignConcept
A side intake is an opening on the bank of a river which extracts water from the river for the
irrigationcanal.Sideintakesarelessexpensivethanothertypesofintakesandarelesscomplicated.
Side intakesmust be correctly located formaximum safety and effectiveness. Theymust be safe
fromboulder impactandfloodwaterentry.Themostappropriate locationforaside intake is the
outerbendoftheriverornearthenaturalpools(Figure4-2).Sideintakesaresensitivetoriverflood
waterlevels.
Figure4-2IdleLocationsforSideIntakes
4.4.2 DesignProcedure
In itssimplestform,aside intakeconsistsofanungatedorifice inamasonrywall.Thedesignofa
sideintakeinvolvesthesizingofanorificeandthedesignofalinkcanal.Thedesignproceduresare
asfollows:
Step-1 Select a suitable opening size in relation to the required discharge. For rectangular
opening, the size width to depth ratio should be 2:1. The size of the orifice is determined
considering the low flow of the river and needs to be checked to ensure safety during high flow
periods.Theopeningsizemustbemoreorlesssimilartothesizeofthelinkcanalthatconnectsthe
intaketothesettlingbasin.Atrashrack isalsonecessarytopreventdebrisfromentering intothe
canal.
Step-2Computedischargeusingformulae:
Freeflowcase:Freeflowcanoccuronlywhenthedownstreamflowdepthinthecanalisequaltoor
lessthansubsequentdepth,h2(Figure 4-3).
⎟⎠
⎞⎜⎝
⎛−×××= 63.02
12/3
a
hgabCCQ vd
Where,Cdisthedischargecoefficient=0.60,
Cvisthevelocitycoefficient=1,
bisthewidthoftheorifice,
aistheheightoftheorifice,
h1isthedepthofwaterupstreamoftheorifice,

█ Egis Eau & RSPN/ BhWP Irrigation Engineering Manual
53
Figure4-3Freeflowandsubmersedfloworifice
Freeflow Submersedflow
Subsequentdepth,h2isafunctionofFroudenumber,F,
3
3
gh
VF =
[ ]1812
1 2
3
2 −+= Fh
h
Whenthedownstreamwaterdepth inthecanal isgreaterthansubsequentdepth, theorificewill
becomesubmersedandsubmergedflowequationwillapply.
Submersedflowcase:
( )21
2/32 hhgabCCQ vd −×××=
Step-3Checkthemaximumintakeflowathighfloodlevel.Thelinkcanalandautomaticspillofthe
settlingbasinmustbeadequatetocopewiththeexpectedintakeflowatthehighfloodlevelofthe
river. Iftheseconditionsarenotsatisfied,thefollowingoptionsshouldbeconsideredtore-design
theintake.
Option-1Trydifferentcombinationsoforificesize,linkcanalandautospillingcapacityofthesettling
basin;
Option-2Provideacontrolgateattheorifice;
Option-3Provideadoubleorificeintake
Thebasichydraulicdesignforaside intakewilldependonthesizeofsedimentandhenceonthe
desirablenominaltrapvelocity.Thebasicdesignparametersofthesideintakearepresentedbelow
(Table4-1).
Table4-1Velocityandheadlossacrossgraveltrap
Description CoarseSand Fine/medium
gravel
Medium/coarse
gravel
Velocity(m/s)
Nominal trap
velocity
0.15 0.25 0.50

█ Egis Eau & RSPN/ BhWP Irrigation Engineering Manual
54
Description CoarseSand Fine/medium
gravel
Medium/coarse
gravel
Sillvelocity 0.15 0.25 0.50
Firstorificevelocity 0.25 0.42 0.83
Outletgatevelocity 0.60 0.60 0.60
HeadLoss(mm)
Atsill 3 8 32
Atfirstorifice 8 22 88
Atoutletgate 46 46 46
Totalheadloss 57 76 166
Taketotalheadloss 60 80 170
Source:PDSPManual,1990
4.4.3 DesignExampleofSideIntake
Designabankintakestructureforacanalwithdesigndischargeof50lps.Assumethatthesediment
tobehandledismainlyfine/mediumgravel.
Designdata:
• Canaldesignwaterlevel 101.00m
• Riverminimumlevel 101.20m
• Rivermaximumlevel 103.00m
i)Calculatenettrapcross-section
FromtheTable4-1,nominaltrapvelocity =0.25m/s
Trapcrosssectionalarea(Ate)=0.05/0.25 =0.20m2
Adopting1mwidetrap,thedepthoftrap=0.20/1.0=0.20m
Afurther0.30mdepthisprovidedtoallowforstorage
TraplengthL=10xAte=10*0.20=2.00m
ii)Designofupstreamorifice
FromTable4-1,forfine/mediumgravel,upstreamorificevelocity=0.42m/s
Orificearea(A) =Q/V=0.050/0.42=0.119m2
Lettheorificebe0.60mwideand0.20mdeep,hencethearea(A)=0.12m2
Usingtheorificeformulathelossofheadattheorificeiscalculated.
hgBDQ Δ= 27.0
( )gDB
Qh
249.022
2
×××=Δ
Where,Q=50l/s,B=0.60m,andD=0.20m
Then,Δh=0.018m,sayΔh=0.02m
iii)Designdownstreamorifice
Letoutletgatevelocitybe0.50m/s
Then,orificearea=0.05/0.50=0.10m2

█ Egis Eau & RSPN/ BhWP Irrigation Engineering Manual
55
Letorificebe0.5mwideand0.20mdeep,
( )gDB
Qh
249.022
2
×××=Δ
Where,B=0.50mandD=0.20m
Then,Δh=0.0025/0.096138=0.026,sayΔh=0.03m
iv)Designofsill
Fromthetablesillvelocity=0.25m/s,
Areaacrossthesill=0.050/0.25=0.20m2
Ifsillwidth=1.0m,thenthedepthofwateroverthesill=0.20/1.0=0.20m
Headlossacrossthesill=g
KV
2
2
Where,Kiscoefficient=2.5,andVisvelocity=0.25m/s
Then,headloss=0.008m
v)Checkminimumriverlevel
Totalheadloss =0.02+0.03+0.01=0.06m
Minimumriverwaterlevel =101.00+0.06=101.06m
Actualminimumriverwaterlevel=101.20m
Thereforethestructurelevelcorrespondingwaterlevelsareacceptable.
vi)Checkstructureformaximumriverlevels
Assumecanalcantake50%extraflow,thatis75lps
Fora50lpscanalwithz=1:1andn=0.025andbedslope1:500,B=0.30m,D=0.25m
Flowdepthinthecanalfor75lpsis0.32m
Thereforemaximumwaterlevelinthecanal=101.00-0.25+0.32=101.07m
Headlossthroughthedownstreamorifice( )gDB
Qh
249.022
2
×××=Δ =0.0.08m
Headlossthroughtheupstreamorifice( )gDB
Qh
249.022
2
×××=Δ =0.02m
Headlossacrosssill(nearly) =0.02m
Totalheadloss=0.08+0.02+0.02=0.12m
Maximumriverwaterlevel =101.07+0.12=101.19m
Actualmaximumriverwaterlevel=103.00m
Astheheadovertheorificeishigh,acontrolgateonthecanalorificeisnecessarytopreventflood
flowfromenteringthecanal.

█ Egis Eau & RSPN/ BhWP Irrigation Engineering Manual
56
Figure4-4Sideintakedesign
4.5 DoubleOrificeIntake
4.5.1 DesignConcept
Adoubleorifice intakehastwoorifices,oneat theriver intakeproperandasecondorificeat the
endofthelinkcanalorsettlingbasinwithasidespillway.Thefirstorificeisthefirsttocontrolthe
flow.Duringhighstageoftheriverthefirstorificedeliversexcessflowtothelinkcanal.Thisexcess
flowwouldbespilledfromaside-spillwaytowardsthedownstreamendofasectionofthelinkcanal
andsluicessedimentfromtimetotime.Atlowriverlevels,therewillbearelativelysmallsediment
supply; the link canal, if properly sized,will act as a sediment trapwhichmay be cleared out by
removing the stop-logs from the sediment ejection channel. At higher stages, the continuous
operation of the side spillway will lead to a significant proportion of the bed material being

█ Egis Eau & RSPN/ BhWP Irrigation Engineering Manual
57
transportedthroughthelinkcanal.AtypicalsketchofadoubleorificeintakeispresentedinFigure
4-5.
Figure4-5Typicalsketchofadoubleorificeintake

█ Egis Eau & RSPN/ BhWP Irrigation Engineering Manual
58
4.5.2 Designprocedure
(i) AssessthedesignwithmaximumallowableflowsQ1andQ2toenterthecanaldownstream
ofthesecondorifice,withcorrespondingwaterlevelsatthecanalentrance,WL1andWL2.
Lettheenergyheads,h1andh2,bethesameasthesewaterlevels,
(ii) Chooseasizeforthesecondorifice,A2,togiveamaximumvelocity,say2m/s i.e.forthe
maximumallowableflowtoenterthecanal,Q2,
(iii) UsingA2, calculateorificehead loss fromgraphatdesigncanal flow,Q1;add toh1 togive
energyhead,h3inthestructure,
(iv) Set the excess flow spillway crest level allowing 0.05 m as free board during normal
conditions,
(v) Asthere isnofriction loss inthechannel,thefirstorificedownstreamenergy levelcanbe
takenash3.Calculatetheheadlossatthefirstorifice(itissuggestedthatbothorificesare
madethesamesize),andcalculatetheenergyhead,h4,upstreamofthefirstorifice(Figure
4-6),
(vi) Compare this energy head loss, h4, with the minimum river level during the irrigation
season. If there is excess available head, the system can delivermore than the required
flow,
(vii) Now considermaximum canal flow,Q2, with second orifice downstream energy level, h2,
assumingthelinkcanalhasscouredout,
(viii) Calculatetheheadlossatthesecondorificeandaddtoh2togiveh3,theenergyheadinthe
structure,
(ix) Calculatetheheadoverthecrestofexcessspillwayusingbroadcrestweirformula,
Thedownstreamenergylevelatthefirstorificecanbetakenash3,
(x) CalculatetheorificeheadlosswithflowrateQmax,addtoh3togiveh4andcomparewith
maximumriverlevel.Iftheriverlevelishigher,therewillbeagreaterinflowandtheside-
weiristooshort.Ifthemaximumriverlevelislower,thecrestlengthoftheweircalculated
aboveismorethanadequate.
(xi) Amend the assumed value of spill water above accordingly and repeat until the head
upstream of the first orifice agrees with maximum water level, or it is obvious that the
design needs to be reconsidered, i.e. by changing one or both orifice sizes, or the ratio
Q2/Q1,ortherelativecanalandriverlevels,etc.
Figure4-6Doubleorificeintake
Fordesignflow Formaximumflow

█ Egis Eau & RSPN/ BhWP Irrigation Engineering Manual
59
4.5.3 DesignExampleofDoubleOrificeIntake
Designflowincanal(Q1) =250l/s
Maximumallowableflowincanal(Q2) =350l/s
Canaldesignwaterlevel(h1) =502.00m
Canalmaximumallowablewaterlevel(h2) =502.11m(seebelow)
Structurelength =30.00m
Minimumriverlevel =502.50m
Maximumriverlevel =504.00m
Maximumflowenteringstructure =700l/s
Calculations
Foracanalwithadesignflowof250l/s,waterslopeof1:500,n=0.025,
Z=1:1,b=0.45andd=0.45.
Formaximumallowableflowincanalof350l/susingformula:
b
a
b
a
d
d
Q
Q=⎥
⎦
⎤⎢⎣
⎡60.0
60.0
⎥⎦
⎤⎢⎣
⎡×=
b
a
baQ
Qdd
=0.45*(0.35/0.25)^0.60=0.55m
Maximumcanalwaterlevel=502.00+(0.55–0.45)=502.10m
AreaofflowatdesignflowA1=b*d1+m*d1^2=0.45*0.45+1*0.45^2=0.41m2
VelocityatdesignflowVdes=Qd/A1=0.25/0.41=0.62m/s
AreaofflowatmaximumflowA2=b*d2+m*d2^2=0.55*0.45+1*0.55^2=0.55m2
VelocityatmaximumflowVmax=Qmax/A2=0.35/0.55=0.64m/s
Fordesigncanalflows
h1=WL1=502.00m
Formaximumallowablecanalflows
H2=WL2=502.10m
Assumemaximumvelocityof2m/sthroughorifice(i.e.formaximumallowableflowincanal).
Formaximumallowableflow,Q2=0.35m3/s
A2=0.35/2.0=0.175m2
Letorificedimension: Widthbe0.45mandthedepthbe0.40m
Theorificewidthissameasthatofcanalbedwidthandthedepthallowsadequatesubmergenceof
theorificeatallflows.
Fordesigncanalflows
ForQ1=250l/s,B=0.45m,D=0.40m
Headloss,
( ) gDB
Qh
270.02
2
×××=Δ
=0.20m
Waterleveld/soffirstorifice,h3=h1+Δh=502.00+0.20=502.20m
Toallowafreeboardof0.05m,makecrestlevelofexcessflowspillway502.25m
AssumeinletorificeissamesizeasoutletorificeB=0.45mandD=0.40m
Headloss

█ Egis Eau & RSPN/ BhWP Irrigation Engineering Manual
60
( ) gDB
Qh
270.02
2
×××=Δ
=0.20m
Waterlevelu/soffirstorifice,h4=h3=∆h=502.20+0.20=502.40m
Checkforminimumriverlevel,h4islessthanminriverlevelof502.50m(h4<NWL)
Riverlevelisadequate
Formaximumallowablecanalflow,Q2of350l/s
H2=502.10(seestep(i)above)
Formaximumcanalflowsheadloss
( ) gDB
Qh
270.02
2
×××=Δ
=0.39m
Waterleveld/soforificeatmaximumflow
h3=h2+Δh=502.10+0.39=502.49m
Headacrossexcessflowspillway=waterd/soffirstorifice–spillwaycrestlevel
hw=502.49–502.25=0.24m
Assumeflowenteringfromtheriverinflood,
Qf=2xQ2=2*350=700l/s
AmountofflowtobespilledQspill=700-350=350l/s
Lengthofspillwaycrest,LW=Qspill/(1.4*h3/2)=0.35/1.4x(0.24)1.5
=2.08msay2.20m
Formaximumflowenteringfromriver
ForA=700l/s,B=0.45m,D=0.40mheadloss,∆h
( ) gDB
Qh
270.02
2
×××=Δ
=1.57m
Waterlevelu/soffirstorificeatmaximumflow=h3+∆h=502.49+1.57=504.07m
Maximumriverlevel=504.00mwhichislessthan504.07m
Thereforestructuredesignisacceptable.
4.6 BottomIntakeorTrenchIntake
4.6.1 DesignConcept
Abottomintakeortrenchintakeislocatedintheriverbedthatdrawsoffwaterthroughracksinto
thetrenchwhichconveystheflowtothemaincanal.Themaincharacteristicofthebottomintakeis
that it hasminimum impacts on river levels. This typeof intake ismostly suitable in hilly regions
whererivershavelowsedimentconcentration.Themaincomponentsofabottomintakeare:
• Weirtocontrolminimumriverflowsandtomaintaintheflowtowardstherack,
• Steelracktoextractwaterfromtheriver,
• Bottom trench immediately below the rack to lead the water extracted by the rack into the
canal,
• Floodcontrolgateimmediatelydownstreamofthetrench,
• Feedercanaltocarryallsedimententeringtheintaketothesettlingbasin,
• Settlingbasinwithasidespillandsedimentflushingarrangement,

█ Egis Eau & RSPN/ BhWP Irrigation Engineering Manual
61
4.6.2 DesignProcedure
DataRequired
• Maximumdiversiondischargerequired(Qc),
• Designflooddischarge(Qd),
• Existingwidthoftheriver(P),
• Bardiameter(a),
• Barspacing(b)(asperthedesirablesedimentsizerequiredtobeeliminated),
• Approachflowdepth(ho),
The design procedure of the bottom intake is related to the design of the size of the trench and
collectionchamberincludingsedimentflushingarrangements(Figure 4-7).
i. Selecttheheightoftheweir(P)abovetheriverbed
ii. Fixthelengthoftheweirbasedontheexistingwidthoftheriver,
QdP 75.4=
WherePistheLacey’swaterwayinmand
Qdisthedesignflooddischargeinm3/s,
iii. Calculatetheheadovertherackcrestusingtheformula,
okhh3
2=
Wherehoistheapproachflowdepthinm,andkisconstantdependingupontheinclinationof
thetrashrack(β),
β 0 2 4 6 8 10 12 14 16 18 20 22 24 26
k 1.00 0.98 0.96 0.94 0.93 0.91 0.89 0.88 0.87 0.85 0.84 0.83 0.81 0.80
iv. Calculatecoefficientofdischargethroughtrashrackusingtheformula,
Whereaisthewidthofthebarsection,
bisthecentertocenterdistancebetweenbars
βistheinclinationofthetrashrack
v. Calculatewidthandlengthofthetrenchopeningortrashrackusingtheformula,
WhereCisthedischargecoefficient,
µisthecontractioncoefficientofthetrashrackanddependsuponthetypeofbars,
bisthewidthofthetrashrack
Listhelengthofthetrashrackand
histheheadovertherackcrest
β2/3cos60.0 ××=b
aC
ghLbCQA 23
2×××××= µ

█ Egis Eau & RSPN/ BhWP Irrigation Engineering Manual
62
Thecalculationof thewidthand lengthof the trash rackshouldbebasedona trialanderror
method and the final dimensions should be determined by whether the structure is easy to
operateandtherequiredflowisensured.Forpracticalpurposes,thelengthofthetrashrackis
increasedby20%.
vi. Calculatethesizeofthecollectioncanal-alongthetrashrackwidth(weirwidth)theamountof
waterforirrigationfallingthroughtherackopeningincreaseslinearlyandreachesitsmaximum
valueattheendofthecrosssection.Forreasonsofsimplicity,thisendcross-sectionisusedfor
thedimensioningofthecollectioncanal.
The water depth in the collection canal is calculated using a continuity equation along with
Manning’sformula,
2/1
3/2
2
1S
dB
dB
ndBAVQ ×⎟
⎠
⎞⎜⎝
⎛
+
×××==
WhereBisthewidthofthecanalandisthesameasthelengthofthetrashrack,
disthewaterdepthinthecollectioncanaltobeassessed,
nistheroughnesscoefficient,and
Sistheslopeofcollectioncanal
Waterdepthcanbecalculatedusingtrialanderror.
vii. Calculatethefreeboardofthecanalfrom
dFb
25.0= wheredisthedaterdepthinm,
viii. Fixthetotaldepthofcollectioncanal
Figure4-7Bottomintakedesign
Layoutofweir Flowthroughracks

█ Egis Eau & RSPN/ BhWP Irrigation Engineering Manual
63
4.6.3 DesignExampleofBottomIntake
Data
Canaldischarge(Q)=400l/s
Designflooddischarge(Qd)=12m3/s
Averagewaterdepthatlowflow(ho)=0.30m
Existingwidthoftheriver(W)=15m
Calculations
CalculatethelengthofweiracrosstheriverfromP=4.75sqrt(Qd)
P=4.75*sqrt(12)=16.45madoptweirlengthastheexistingwidthofriveras15m
Adoptheightofweiras0.30mabovetheriverbedlevel,
Adoptslopeoftrashrackas8o(β)
Adoptflowforflushing(Qf)=1.5*Q=1.5*400=600l/s
Designflowconsideringcloggingof40%(QA)=1.4*Qf=1.4*600=840l/s
Calculateheadovertheu/sedgeofthetrashrackfrom
h=2/3*k*howherekcontractioncoefficientofrack;for8ok=0.927(fromabovetable)
hoistheaveragedepthofwateratlowflow(approachflowdepth)=0.30m
h=2/3*0.927*0.30=0.19m
Calculatecoefficientofdischarge,
Whereaisthewidthofbarsection=0.02m(adopt)
bisthecentertocenterdistancebetweenbars=0.04m(adopt)
βistheinclinationoftrashrack=8o
C=0.60*0.02/0.04*cost^3/28=0.30
Calculatesizeoftrashrackfromformula,
WhereCisthedischargecoefficient=0.30fromcalculation,
µ is thecontractioncoefficientoftrashrackanddependsupontypeofbars, forordinaryrackµ=
0.85
bisthewidthofthetrashrack
Listhelengthofthetrashrackand
histheheadovertherackcrest=0.19mfromcalculation
Substitutingvaluesweget0.84=2/3*0.3*0.85*b*L*√(2*9.81*0.19)
0.84=0.32b*L
Solvingthisequationweget
b(m) 2 4 6 8 10
L(m) 1.30 0.65 0.43 0.32 0.26
Selectwidthoftrashrack,b=4m,andlengthoftrashrackis0.65m
Fromoperationalpointofviewthelengthoftrashrackistaken(Lt)=1.2L
Lt=1.2*0.65=0.78mandhenceadoptas0.80m
β2/3cos60.0 ××=b
aC
ghLbCQA 23
2×××××= µ

█ Egis Eau & RSPN/ BhWP Irrigation Engineering Manual
64
Calculatethedimensionsofcollectioncanalfrom,
2/1
3/2
2
1S
dB
dB
ndBAVQ ×⎟
⎠
⎞⎜⎝
⎛
+
×××==
WhereBisthewidthofthecanalandissameasthelengthofthetrashrack=0.80m,
disthewaterdepthinthecollectioncanaltobeassessed,
nistheroughnesscoefficient=0.02forconcreteand
Sistheslopeofcollectioncanal=0.03(Sistakenas30%)
ForQ=0.84m3/sweget, 0.84=0.80*d*1/0.02*(0.03)^1/2*(0.80*d/(0.80+2*d)^2/3
Fromtrialanderror,d=0.355m
Calculatefreeboardas0.25*d=0.25*0.355=0.09m
Totalheightofcanalatcollectionchamber=0.355+0.09=0.44m
AdoptD=0.45m
Hence,designisacceptable.
4.7 DiversionHeadwork
4.7.1 Introduction
Adiversionheadworkmaybe aweir or a barragedependingupon theobjective of the irrigation
scheme.Weirsaresolidwallsacrosstherivertoraisethewater levelandtodivertwater intothe
irrigationcanal.Weirsmaybeprovidedwithsmallshuttersonthetop.Duringfloods,astheentire
dischargeoftheriverhastopassoverthecrest,thereisconsiderableaffluxontheupstreamdueto
thesolidwallacrosstheriver.
Abarragehasasimilarstructureasaweirbutthegatealoneaffectstheheadingofthewateronthe
upstream.Thebarragecrestlevelisontheaverageriverbedlevelandhasminimumafflux.Froman
operationalpointofview,abarrage isbetterthanaweir;however, thecostofabarrage ismuch
higherthanthatofaweir.
4.7.2 Idealsitefordiversionheadwork
Anidealsitefordiversionheadworksshouldhavethefollowingcharacteristics:
• Narrowandwelldefinedriversection,
• River should have high and non-submergible banks in order to minimize the cost of river
training,
• Maximumcanalcommandwithmoderateearthworks,
• Suitabilityofriverdiversionduringconstruction,
• Thesiteshouldbesuchthattheweirorbarragecanbealignedrightangledtotheriverflow,
• Suitablelocationforallcomponentsoftheheadworks,
• Diversionheadworksshouldnotsubmergevaluablepropertyupstream,
• Goodfoundationshouldbeavailableatthesite,
• Thesiteshouldbeaccessibleandconstructionmaterialavailable,
4.7.3 ComponentsofaHeadwork
The diversionweir is a hydraulic structure across the river whichmaintains the pond level at its
upstreamsothatwatercanbedivertedtotheoff-takingcanal.Generally,adiversionheadwork is
constructed in perennial rivers which have adequate flow throughout the year. A diversion
headworkmayeitherbeaweirorabarragedependinguponthetypeandobjectivesofthescheme.

█ Egis Eau & RSPN/ BhWP Irrigation Engineering Manual
65
Forsmallscaleirrigationschemes,weirsaresuitable.Accordingtotheconstructionmaterial,weirs
maybe classifiedasmasonryweir, concreteweir andgabionweir.According to the shapeof the
crest,weirs are classified as vertical dropweir,Ogeeweir, broad crestedweir, and sharp crested
weir.Thelayoutofthediversionweiranditscomponentsarepresentedbelow(Figure4-8).
1. Weir 2.Dividewall 3.Fishladderforlargeweir 4.Undersluice 5. Head regulator
6.Abutments 7.Guidebund 8.Canal
Figure4-8Definitionsketchofweiranditscomponents
4.7.4 Typesofweirs
Basedontheflowcharacteristics,weirsaregrouped intotwotypes:sharpcrestedweirandbroad
crested weir. Sharp crested weirs are used as flow measuring devices in irrigation while broad
crestedweirs are used for diversionworks. There are three categories ofweirs, distinguished by
howtheyareconstructedandthematerialsused:(i)Verticaldropweirs,(ii)Rockfillweirs,and(iii)
Concreteweirswithslopingglacis.
(i) Verticaldropweirsarewalltypestructuresonahorizontalconcretefloor.Shuttersmayalsobe
providedonthecrestswhicharedroppedduringtheflood.Waterispondeduptothetopofthe
shuttersduringnon-floodperiods.Verticaldropweirsaresuitableforsmallirrigationdiversions,
atypicalsketchofoneispresentedhere(Figure4-9).
Figure4-9Verticaldropweir
1
2
3
4 56
7
8
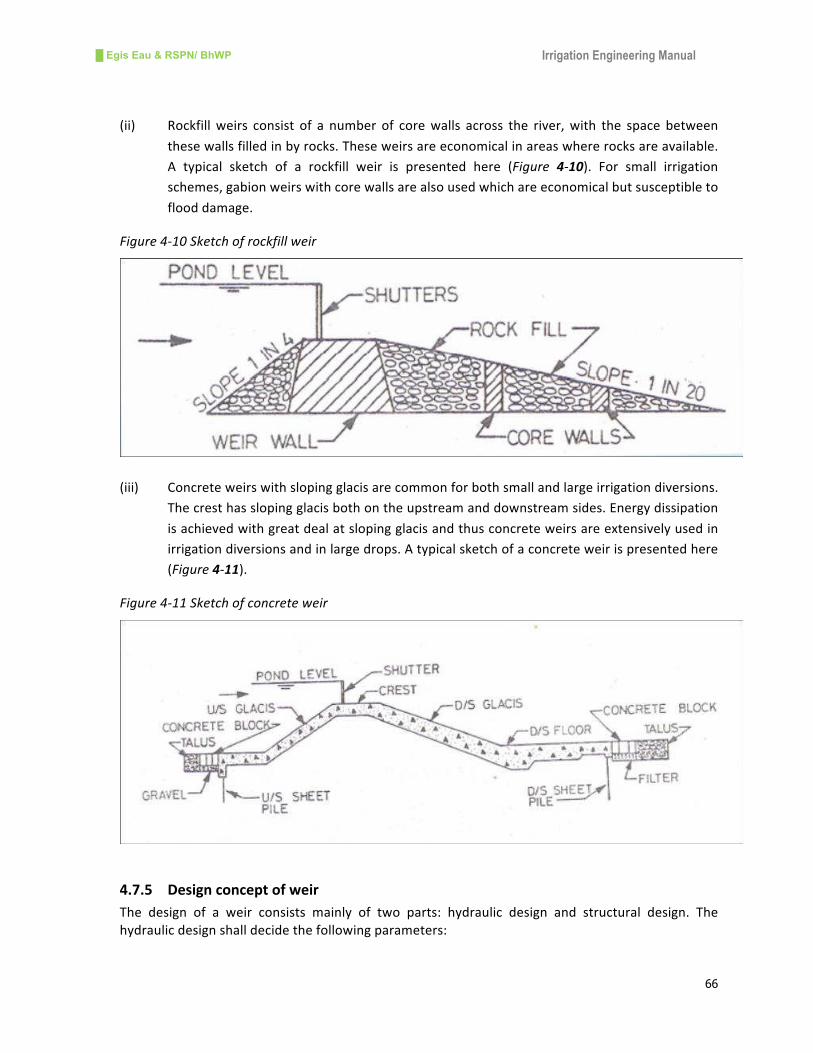
█ Egis Eau & RSPN/ BhWP Irrigation Engineering Manual
66
(ii) Rockfillweirs consist of a number of corewalls across the river,with the space between
thesewallsfilledinbyrocks.Theseweirsareeconomicalinareaswhererocksareavailable.
A typical sketch of a rockfill weir is presented here (Figure 4-10). For small irrigation
schemes,gabionweirswithcorewallsarealsousedwhichareeconomicalbutsusceptibleto
flooddamage.
Figure4-10Sketchofrockfillweir
(iii) Concreteweirswithslopingglacisarecommonforbothsmallandlargeirrigationdiversions.
Thecresthasslopingglacisbothontheupstreamanddownstreamsides.Energydissipation
isachievedwithgreatdealatslopingglacisandthusconcreteweirsareextensivelyusedin
irrigationdiversionsandinlargedrops.Atypicalsketchofaconcreteweirispresentedhere
(Figure4-11).
Figure4-11Sketchofconcreteweir
4.7.5 Designconceptofweir
The design of a weir consists mainly of two parts: hydraulic design and structural design. The
hydraulicdesignshalldecidethefollowingparameters:

█ Egis Eau & RSPN/ BhWP Irrigation Engineering Manual
67
• Lengthofwaterway,dischargeintensityandafflux;
• Safeexitgradient;
• Lacey’ssiltfactor, Dmf 76.1= where,Dm-averagesizeofsedimentparticleinmm;
• Depthsofcutoffsinrelationtobothscourdepthandexitgradient;
• Levelandlengthofdownstreamhorizontalfloor;
• Thicknessofdownstreamhorizontalfloorwithreferencetoupliftpressureandhydraulicjump;
• Lengthandthicknessofprotectionworks
Inadditiontotheaboveparameters,thehydraulicdesignofweirinvolvesthefollowingconcepts:
Crestlevelofweirandundersluice
Fixationofthecrestleveloftheweirisgovernedbytwofactors:therequiredcommandlevelofthe
canal and available low flowof the river during thedry season. If theminimum flowof the river
exceeds thedesigndischargeof the canal, the crest level of theweir is set lower than thewater
leveloftheriver.Thecrestleveloftheundersluiceisfixedatthelowestbedleveloftheriverinthe
deepestchanneland isgenerallykept1mbelowthecrest levelof theweir in smallandmedium
rivers(Figure 4-12).
Figure4-12Typicalweirs
Concreteweir Gabionweir
Lengthofweirandafflux
The lengthof aweir isdirectly correlatedwith theaffluxanddischarge intensityof theweir. The
longer the lengththesmaller is thedischarge intensity.The lengthoftheweiralsodependsupon
the topography of the weir site, river characteristics, and provision of energy dissipation at
downstreamend.Laceyhasprovidedformulaforwaterway:
QP 83.4= Where,Qisthehighflooddischargeinm3/s
For boulder stage rivers, Lacey’s formula may not work properly and the designer has to judge
consideringthefollowingmainpoints:
• Averagewettedwidthoftheriverduringflood;
• Formationofshoalsupstreamoftheweir;
• Energydissipationdevicesdownstreamoftheweir;

█ Egis Eau & RSPN/ BhWP Irrigation Engineering Manual
68
The discharging capacity of the undersluice is determined with the consideration of 20% of the
designfloodortwicethecanaldischargeandcalculatedas:
( ) 2/31.0705.1 HHnLQ −=
Where,Listotalclearwaterwayinm,
nisnumberofendcontraction,
Hisheadoverthecrestinm
Effectofretrogression
Retrogression is the lowering of the river bed downstream of the weir after its construction. In
designing the weir, the effect of retrogression needs to be considered. For small rivers the
retrogressionistakentobe0.30mto0.50m.
Designofhydraulicjumpbasin
Hydraulicjumpoccurswhenasupercriticalflowofwaterchangesintoasub-criticalflow.Thisisthe
mostefficientmethodofdissipatingthekineticenergyofflowingwater.Hydraulicjumpisstablein
slopingglacisandhence it isessential toprovide slopingglacisat theweir surfacewith the slope
rangingfrom1:3to1:5.Withtheanalysisofhydraulicjump,thefollowingparametersaredesigned:
• Downstreamfloorlevel,
• Lengthofhorizontalfloor,
• Downstreamprotectionworks,and
• Upliftpressure
4.7.6 DesignProcedureofWeir
Thefollowingdataareessentialforthedesignofdiversionweirs:
• Maximumflooddischarge(Qd)-basedondesignreturnperiodflood,
• Stagedischargecurveoftheriver,
• Minimumwaterleveloftheriver,
• Cross-sectionoftheriveratweirsite
• Averagesedimentsize,andsiltfactor
Step1 Fixationofcrestlevelsofweirandundersluice;
Weircrestlevel=minimumwaterleveloftheriver
Undersluicecrestlevel=deepestriverbedlevel
Step2 Calculaterequiredwaterwaysofweirandundersluice,
Laceywaterway, QPw 83.4=
Dividetotalwaterwaysintoweirandundersluicewithconsiderationofdividewalland
piers,
Step3 Calculatedischargeintensityofweir,scourdepthandvelocityheadtherein,
q=Q/L,3
2
35.1 ⎟⎟⎠
⎞⎜⎜⎝
⎛=
f
qR andapproachvelocity,V=q/R
Step4 Determinetheheadoverthecrestofweirandundersluice=u/sTEL–crestlevel
Step5 Calculate the discharges passing through the undersluice (Q1) and weir (Q2) for both
floodflowandpondlevelflowandcomparewithdesignflooddischarge,
( ) 2/3
111110.0705.1 HnHLQ −=

█ Egis Eau & RSPN/ BhWP Irrigation Engineering Manual
69
( ) 2/3
222210.084.1 HnHLQ −=
WhereL1isthelengthofundersluice,
L2isthelengthofweir,
H1istheheadoverthecrestofundersluice,
H2istheheadoverthecrestofweir
Step6 Determine head loss for different flow conditions (high flood flow and pond flow);
HL=u/sTEL–d/sTEL
Step7 Determineparametersofhydraulic jumpofundersluice for floodflowandpond level
conditionsconsideringwithandwithoutconcentrationandretrogression
HydraulicjumpcalculationsarecarriedouteitherusingBlenchcurvesorspecificenergy
curvesorbytrialanderrormethod.
Step8 In trialanderrorprovide trial valueofpost jumpdepthandcalculatepre jumpdepth
fromformula:
⎟⎟⎠
⎞⎜⎜⎝
⎛+
×+−=
2
2
2
2
21
4
1/2
2
1D
D
qgDD
Step9 Calculatespecificenergyofu/sandd/sofjumpfromformula:
( )222
222/ DgqDEf ×+=
( )122
112/ DgqDEf ×+=
Step10 Calculateheadloss,Hl=Ef1-Ef2andequalwithcalculatedvaluesofheadlossinstep6,
Step11 Calculatelevelofjumpformation,lengthofconcretefloorandFroudenumberforeach
flowcondition,
Levelofjump=d/sTEL-Ef2
Lengthofconcretefloor,L=5(D2-D1)
Froudenumber,
1gD
qF =
Step12 Adoptd/sfloorlevelasminimumofjumplevelsandadoptd/sfloorlengthasmaximum
ofconcretefloorlengthsfordifferentflowconditions,
Step13 Determine the u/s and d/s scour depths from the formula of scour consideration,2/1
2
35.1 ⎟⎟⎠
⎞⎜⎜⎝
⎛=
f
qR ;determinedepthofu/ssheetpileorcutoffas1to1.25Randd/ssheet
pileorcutoffas1.25to1.5R;
Step14 Workout total floor lengthandexit gradient (GE),determinevalueof
λπ
1 from the
equationH
dGE
=λπ
1 for a given value of GE and known values of d and H. From
correspondingvalueof
λπ
1 readthevalueofαfromKhosla’sexitgradientcurve.
Step15 Calculatethetotallengthoffloor(b)=αxd;dispositionoftotalfloorlengthmaybeas
follows:
Cisternlength=5to6(D2-D1)

█ Egis Eau & RSPN/ BhWP Irrigation Engineering Manual
70
Glacislength=3to5times(crestlevel–cisternlevel)for1:3to1:5slopeofglacis;
Balanceforu/sfloorlength,
Step16 Determineupliftpressureactingonthefloor;%pressuresatu/sandd/ssheetpilelines
areworkedoutas:
%pressureatupstreamsheetpileline
For known value of b and d1,b
d1
1=
α, having knownα read out values ofΦD andΦE
fromKhosla’spressurecurve.
%pressureatthebottomofsheetpile=100-ΦD
%pressureatthebottomoffloor=100-ΦD
%pressureatdownstreamsheetpileline
Forknownvalueofbandd2,b
d2
1=
α,readvaluesofΦDandΦEcorrespondingto
α
1
fromKhosla’spressurecurvewhichwouldbe%pressureatthebottomofthefloorand
sheetpilerespectively,
Step17 Correctionduetofloorthickness
Thethicknessoftheflooratthelocationofthesheetpilesaretentativelyassumedfor
correctingthevaluesofΦCintheu/sandΦEinthed/s.Ift1isthefloorthicknessatu/s
sheet pile of depth d1, correction due to floor thickness = ( )CD
d
tφφ −
1
1 which is
positive.Ift2isthefloorthicknessatd/ssheetpileofdepthd2,correctionduetofloor
thickness= ( )DE
d
tφφ −
2
2 whichisnegative,
Step18 Correctionduetomutualinterferenceofsheetpilesisworkedoutbytheformula:
b
Dd
b
DC
+×='
19
Step19 Afterknowingthecorrected%pressuresatkeypoints,depthofsheetpilesorcutoffs,
thicknessofflooriscalculatedatdifferentpointsfromthed/sendofthecutoffwall.
4.7.7 DesignExampleofConcreteWeir
Designdata:
Highflooddischarge,Q 35m3/s
Averagebedlevelofriver 303.8 m
HFLbeforeconstruction 305.75 m
PermissibleAfflux 0.5 m
PondLevel 305.25 m
Siltfactor 1
Safeexitgradient 0.20(1/5)
Concentration 20%
Retrogression 0.5 m
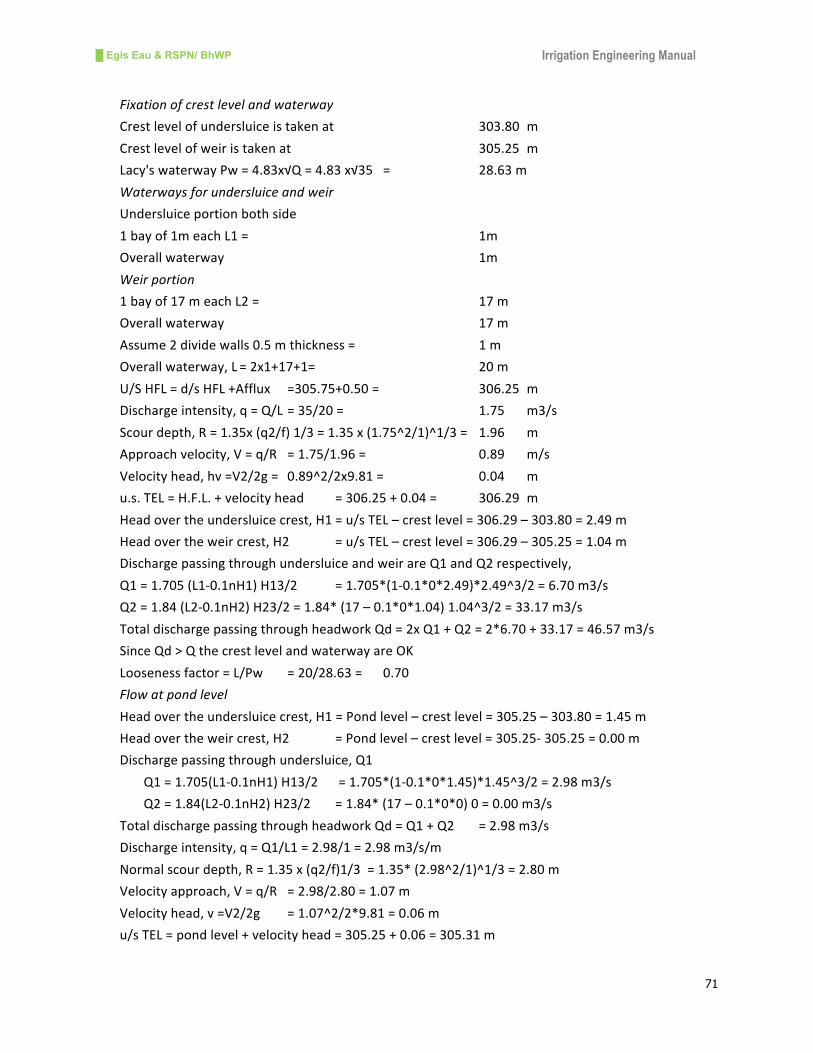
█ Egis Eau & RSPN/ BhWP Irrigation Engineering Manual
71
Fixationofcrestlevelandwaterway
Crestlevelofundersluiceistakenat 303.80 m
Crestlevelofweiristakenat 305.25 m
Lacy'swaterwayPw=4.83x√Q=4.83x√35 = 28.63m
Waterwaysforundersluiceandweir
Undersluiceportionbothside
1bayof1meachL1= 1m
Overallwaterway 1m
Weirportion
1bayof17meachL2= 17m
Overallwaterway 17m
Assume2dividewalls0.5mthickness= 1m
Overallwaterway,L=2x1+17+1= 20m
U/SHFL=d/sHFL+Afflux =305.75+0.50= 306.25 m
Dischargeintensity,q=Q/L=35/20= 1.75 m3/s
Scourdepth,R=1.35x(q2/f)1/3=1.35x(1.75^2/1)^1/3= 1.96 m
Approachvelocity,V=q/R =1.75/1.96= 0.89 m/s
Velocityhead,hv=V2/2g= 0.89^2/2x9.81= 0.04 m
u.s.TEL=H.F.L.+velocityhead =306.25+0.04= 306.29 m
Headovertheundersluicecrest,H1=u/sTEL–crestlevel=306.29–303.80=2.49m
Headovertheweircrest,H2 =u/sTEL–crestlevel=306.29–305.25=1.04m
DischargepassingthroughundersluiceandweirareQ1andQ2respectively,
Q1=1.705(L1-0.1nH1)H13/2 =1.705*(1-0.1*0*2.49)*2.49^3/2=6.70m3/s
Q2=1.84(L2-0.1nH2)H23/2=1.84*(17–0.1*0*1.04)1.04^3/2=33.17m3/s
TotaldischargepassingthroughheadworkQd=2xQ1+Q2=2*6.70+33.17=46.57m3/s
SinceQd>QthecrestlevelandwaterwayareOK
Loosenessfactor=L/Pw =20/28.63= 0.70
Flowatpondlevel
Headovertheundersluicecrest,H1=Pondlevel–crestlevel=305.25–303.80=1.45m
Headovertheweircrest,H2 =Pondlevel–crestlevel=305.25-305.25=0.00m
Dischargepassingthroughundersluice,Q1
Q1=1.705(L1-0.1nH1)H13/2 =1.705*(1-0.1*0*1.45)*1.45^3/2=2.98m3/s
Q2=1.84(L2-0.1nH2)H23/2 =1.84*(17–0.1*0*0)0=0.00m3/s
TotaldischargepassingthroughheadworkQd=Q1+Q2 =2.98m3/s
Dischargeintensity,q=Q1/L1=2.98/1=2.98m3/s/m
Normalscourdepth,R=1.35x(q2/f)1/3=1.35*(2.98^2/1)^1/3=2.80m
Velocityapproach,V=q/R =2.98/2.80=1.07m
Velocityhead,v=V2/2g =1.07^2/2*9.81=0.06m
u/sTEL=pondlevel+velocityhead=305.25+0.06=305.31m
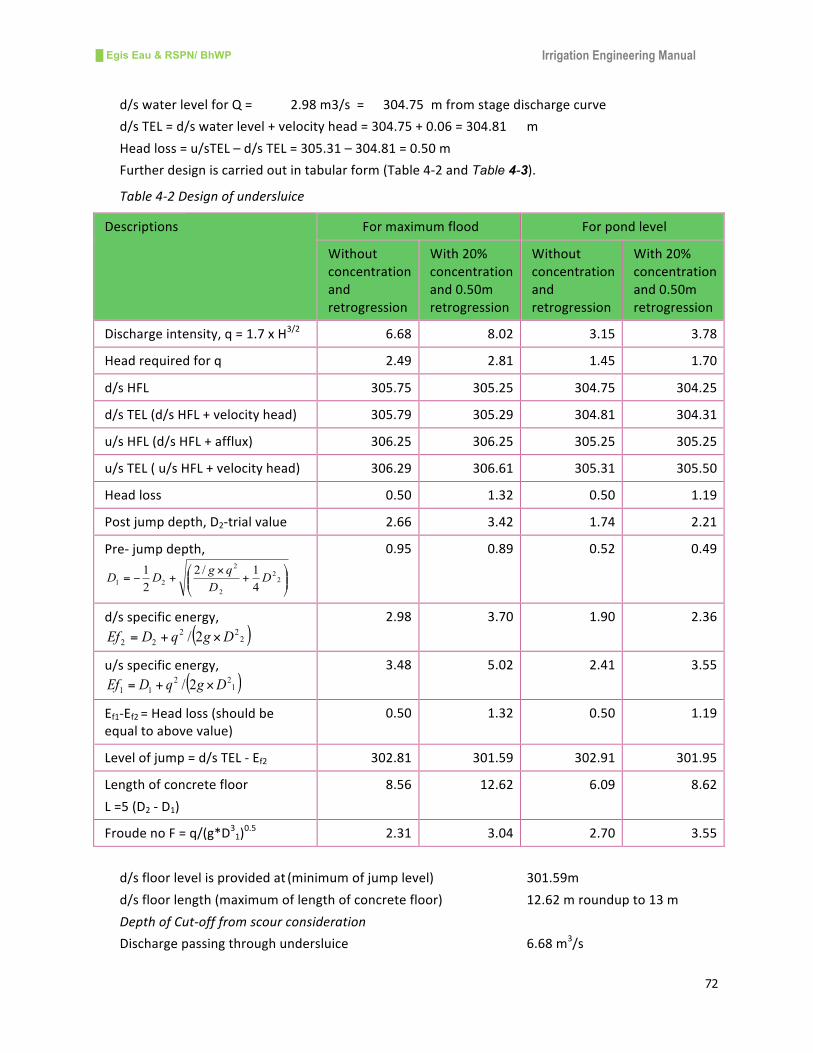
█ Egis Eau & RSPN/ BhWP Irrigation Engineering Manual
72
d/swaterlevelforQ= 2.98m3/s= 304.75 mfromstagedischargecurve
d/sTEL=d/swaterlevel+velocityhead=304.75+0.06=304.81 m
Headloss=u/sTEL–d/sTEL=305.31–304.81=0.50m
Furtherdesigniscarriedoutintabularform(Table4-2andTable 4-3).
Table4-2Designofundersluice
Descriptions Formaximumflood Forpondlevel
Without
concentration
and
retrogression
With20%
concentration
and0.50m
retrogression
Without
concentration
and
retrogression
With20%
concentration
and0.50m
retrogression
Dischargeintensity,q=1.7xH3/2
6.68 8.02 3.15 3.78
Headrequiredforq 2.49 2.81 1.45 1.70
d/sHFL 305.75 305.25 304.75 304.25
d/sTEL(d/sHFL+velocityhead) 305.79 305.29 304.81 304.31
u/sHFL(d/sHFL+afflux) 306.25 306.25 305.25 305.25
u/sTEL(u/sHFL+velocityhead) 306.29 306.61 305.31 305.50
Headloss 0.50 1.32 0.50 1.19
Postjumpdepth,D2-trialvalue 2.66 3.42 1.74 2.21
Pre-jumpdepth,
⎟⎟⎠
⎞⎜⎜⎝
⎛+
×+−= 2
2
2
2
21
4
1/2
2
1D
D
qgDD
0.95 0.89 0.52 0.49
d/sspecificenergy,
( )222
222/ DgqDEf ×+=
2.98 3.70 1.90 2.36
u/sspecificenergy,
( )122
112/ DgqDEf ×+=
3.48 5.02 2.41 3.55
Ef1-Ef2=Headloss(shouldbe
equaltoabovevalue)
0.50 1.32 0.50 1.19
Levelofjump=d/sTEL-Ef2 302.81 301.59 302.91 301.95
Lengthofconcretefloor
L=5(D2-D1)
8.56 12.62 6.09 8.62
FroudenoF=q/(g*D31)0.5
2.31 3.04 2.70 3.55
d/sfloorlevelisprovidedat(minimumofjumplevel) 301.59m
d/sfloorlength(maximumoflengthofconcretefloor) 12.62mroundupto13m
DepthofCut-offfromscourconsideration
Dischargepassingthroughundersluice 6.68m3/s
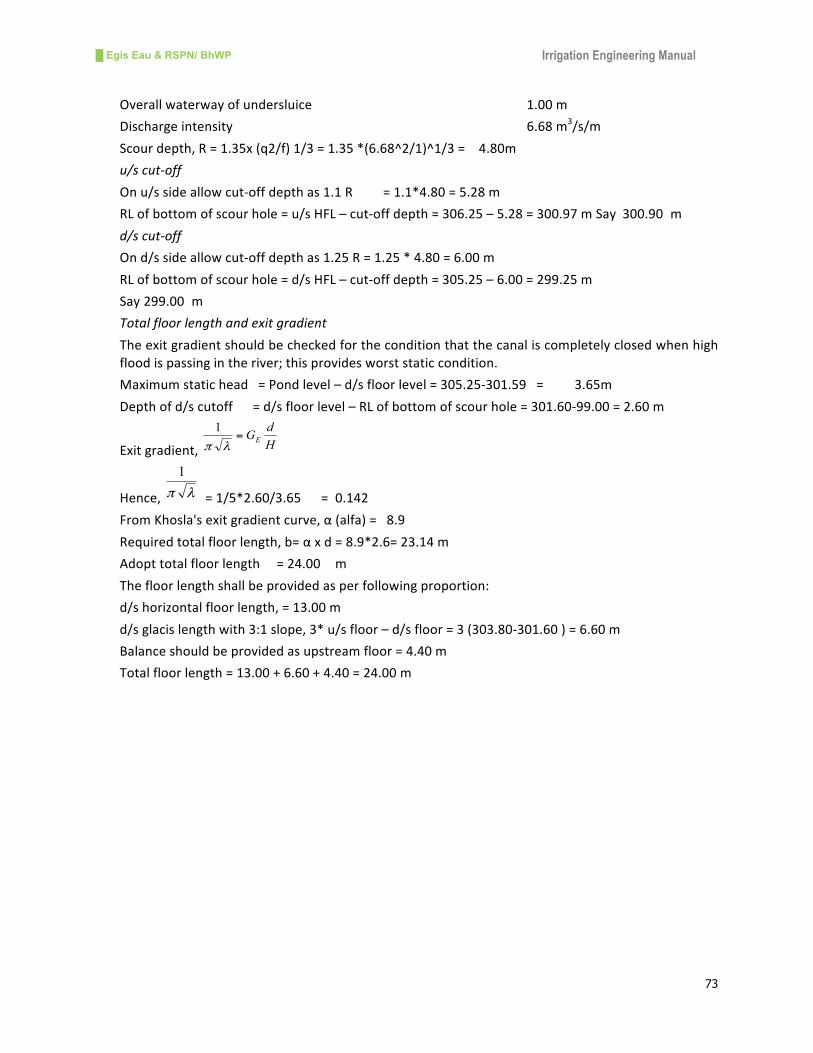
█ Egis Eau & RSPN/ BhWP Irrigation Engineering Manual
73
Overallwaterwayofundersluice 1.00m
Dischargeintensity 6.68m3/s/m
Scourdepth,R=1.35x(q2/f)1/3=1.35*(6.68^2/1)^1/3= 4.80m
u/scut-off
Onu/ssideallowcut-offdepthas1.1R =1.1*4.80=5.28m
RLofbottomofscourhole=u/sHFL–cut-offdepth=306.25–5.28=300.97mSay 300.90 m
d/scut-off
Ond/ssideallowcut-offdepthas1.25R=1.25*4.80=6.00m
RLofbottomofscourhole=d/sHFL–cut-offdepth=305.25–6.00=299.25m
Say299.00 m
Totalfloorlengthandexitgradient
Theexitgradientshouldbecheckedfortheconditionthatthecanaliscompletelyclosedwhenhigh
floodispassingintheriver;thisprovidesworststaticcondition.
Maximumstatichead=Pondlevel–d/sfloorlevel=305.25-301.59= 3.65m
Depthofd/scutoff=d/sfloorlevel–RLofbottomofscourhole=301.60-99.00=2.60m
Exitgradient, H
dGE
=λπ
1
Hence, λπ
1
=1/5*2.60/3.65= 0.142
FromKhosla'sexitgradientcurve,α(alfa)=8.9
Requiredtotalfloorlength,b=αxd=8.9*2.6=23.14m
Adopttotalfloorlength=24.00 m
Thefloorlengthshallbeprovidedasperfollowingproportion:
d/shorizontalfloorlength,=13.00m
d/sglacislengthwith3:1slope,3*u/sfloor–d/sfloor=3(303.80-301.60)=6.60m
Balanceshouldbeprovidedasupstreamfloor=4.40m
Totalfloorlength=13.00+6.60+4.40=24.00m

█ Egis Eau & RSPN/ BhWP Irrigation Engineering Manual
74
Figure4-13Designsketchofundersluice
Pressurecalculations
Letthefloorthicknessintheu/sbe0.50mandnearthed/scut-offbe0.50m
Determinetheupliftpressureactingonthefloorand%pressuresatu/sandd/ssheetpiles:
%pressureatu/ssheetpileline
Upstreamcutoff,d1=303.80-300.90= 2.90 m
Lengthoffloor,b=24.00mandu/scutoffdepth,d1=2.90m
Then,1/α=d1/b=2.90/24.00=0.121
FromKhosla’scurves,φD=88.5 %
φC= 83.4%
φD-φC=88.50–83.40=5.10%
Applycorrectiontotheabovevalues,
Thicknessofu/sfloor,t1=0.50m
φCcorrectionfordepth=t1/d1(φD–φC)=0.50/2.90*5.10=0.88 (+ve)
φCcorrectionforinterferenceofd/scutoff
Khosla’sformula,⎟⎠
⎞⎜⎝
⎛ +×⎟⎟
⎠
⎞⎜⎜⎝
⎛=
b
dD
b
DC
1
50.0
1
19
d1=303.80-0.50-300.90=2.40m
D=303.80-0.5-299.00=4.30m
b1= 23.50 m
b= 24.00 m
C=19*(4.30/23.50)^0.5*(2.40+4.30)/24.00=2.25%(+ve)
φCcorrected =83.40+0.88+2.25= 86.52 %say 86.50 %

█ Egis Eau & RSPN/ BhWP Irrigation Engineering Manual
75
Downstreamcutoff,d2=301.60-299.00=2.60m
Lengthoffloor,b=24.00mandd/scutoffdepth,d1=2.60m
Then,1/α=d2/b=2.60/24.00=0.108
FromKhosla’scurves,φE1=15.8%
φD1= 11.0%
φE1-φD1=15.80–11.00=4.8%
φE1correctionfordepth=0.60*4.80/2.60= 1.11(-ve)
φE1correctionforinterferenceduetou/scutoff
d=301.60-0.60-299.00=2.00m
D=301.60-0.60-300.90=0.10m
⎟⎠
⎞⎜⎝
⎛ +×⎟⎟
⎠
⎞⎜⎜⎝
⎛=
b
dD
b
DC
1
50.0
1
19
=19(0.10/24.00)^0.5*(2.00+0.10/24.00)=0.11 %(-ve)
φEcorrected =15.80-1.11-0.11=14.58%say14.60%
φC=86.50% andφE=14.60%
Floorthickness
Themaximumstaticheadwilloccuronthefloorwhenthereisnoflowinthecanalbutmaximum
floodispassingdownriver.Inthiscasethemaximumstatichead=3.65m
Downstreamfloor
At1mfromd/send
Unbalancedhead=(86.50-14.60)/100*3.65*1.00/24.00+14.60*3.65/100=0.64m
Floorthickness=0.64 /(2.24-1)=0.52m
Providefloorthickness=0.6 mat1mfromd/sendofcut-off
Upliftpressure=1000*0.64=642.25kg/m2
Slabweight=2500*0.70=1750.00 kg/m2
Netupliftpressure=642.25–1750.00=-1107.75 kg/m2
CalculatemomentMr=w*l2/12=-194087396Nmm
d=(Mr/Rb*b)0.5=546mm,say600mm
Provide50mmcoverbothside,sothattotalthicknessofslabis=700mm
Floorthicknessprovided=700mm
At13.00mfromd/send
Unbalancedhead=(86.50-14.60)/100*3.65*13.00/24.00+14.60*3.65/100=1.95m
Floorthickness,t=1.95/(2.24-1)=1.58m
Providefloorthicknessas1.60mat13mfromd/sendofcut-off
Upliftpressure=1000*1.95 =1954.42kg/m2
Slabweight,= 2500*0.30=750.00 kg/m2
Netupliftpressure,=1954.42–750=1204.42kg/m2
Mr=w*l2/12=25092144Nmm
d=(Mr/Rb*b)0.5=196mmsay200mm

█ Egis Eau & RSPN/ BhWP Irrigation Engineering Manual
76
Provide50mmcoverbothside,sototalthicknessofslabis=300 mm
Floorthicknessrequired=300mmatendoffloor
Protectionworksbeyondimperviousfloor
Upstreamprotection
Blockprotection
Scourdepth,R=1.35(q2/f)1/3=1.35(4.80^2/1)^1/3=4.80m
Anticipatedscour=1.50*R=1.5*4.80=7.20m
Upstreamscourlevel=u/sHFL-anticipatedscourlevel=306.25–7.20=299.05m
Scourdepth,Dbelowu/sfloor=crestlevelofundersluice–scourlevel
D=303.80-299.05=4.75m
Volumeofblockprotectiontobegiven(D)=4.75m3/m
Provide1.5mx1.5mx1.0mconcreteblockover0.50mhickgravel
Thelengthrequired=4.75/(1.0+0.50)=3.16m
Providethreerowsoftheaboveblockinalengthof3.00m
Launchingapron
Quantityoflaunchingapronshouldbe2.25Dm3/m
Thicknessoflaunchingapron=1.50m
Thelengthrequired=2.25*4.75/1.50=7.12m
Providelaunchingapronas7.00mlength
Downstreamprotection
Scourdepth,R=4.80m
Anticipatedscour=2*R=9.60m
Downstreamscourlevel=HFL–retrogression–anticipatedscour
=305.75–0.50-9.60=295.65m
Scourdepth,Dbelowd/sfloor=d/sfloorlevel–scourlevel=301.60-295.65=5.95m,Say6.00m
Invertedfilter
Thelengthofinvertedfilter=Dmandthicknessequaltothed/slaunchingapron
Provide rowof 1.50mx1.50mx1mconcreteblockwith10cmgapfilledwithpeagravelover
0.5mthickgradedfilter
Thelengthrequired=5.95/(1.0+0.50)=3.96m=4m
Launchingapron
Quantityoflaunchingapronshouldbe2.25Dm3/m
Thicknessoflaunchingapron=1.50m
Thelengthrequired=2.25*5.95/1.50=8.92m
Providelaunchingapronas9.00mlength

█ Egis Eau & RSPN/ BhWP Irrigation Engineering Manual
77
Table4-3Designexampleofweir
Descriptions Formaximumflood
Without
concentrationand
retrogression
With20%concentration
and0.5mretrogression
Dischargeintensity,q=1.84xH3/2
1.95 2.34
Headrequiredforq 1.04 1.17
d/sHFL 305.75 305.25
d/sTEL(d/sHFL+velocityhead) 305.79 305.29
u/sHFL(d/sHFL+afflux) 306.25 306.25
u/sTEL(u/sHFL+velocityhead) 306.29 306.42
Headloss 0.50 1.13
Postjumpdepth,D2-trialvalue 1.325 1.687
Pre-jumpdepth,
⎟⎟⎠
⎞⎜⎜⎝
⎛+
×+−= 2
2
2
2
21
4
1/2
2
1D
D
qgDD
0.35 0.33
d/sspecificenergy,
( )222
222/ DgqDEf ×+=
1.44 1.79
u/sspecificenergy,
( )122
112/ DgqDEf ×+=
1.94 2.92
Ef1-Ef2=Headloss(shouldbeequal
toabovevalue)
0.50 1.13
Levelofjump=d/sTEL-Ef2 304.36 303.51
Lengthofconcretefloor
L=5(D2-D1)
4.88 6.79
FroudenoF=q/(g*D31)0.5
3.01 3.97
Downstream floor level isprovidedat theminimum levelof jump formationoraveragebed level
minusafflux=303.30m
d/sfloorlengthisprovidedasmaximumoflengthoffloor= 6.79mroundupto7.00m
DepthofCut-offfromscourconsideration
Dischargepassingthroughtheweir(Qd)=33.17m3/s
Totalwaterwayofweir=17.00m
Dischargeintensity=1.95m3/s/m
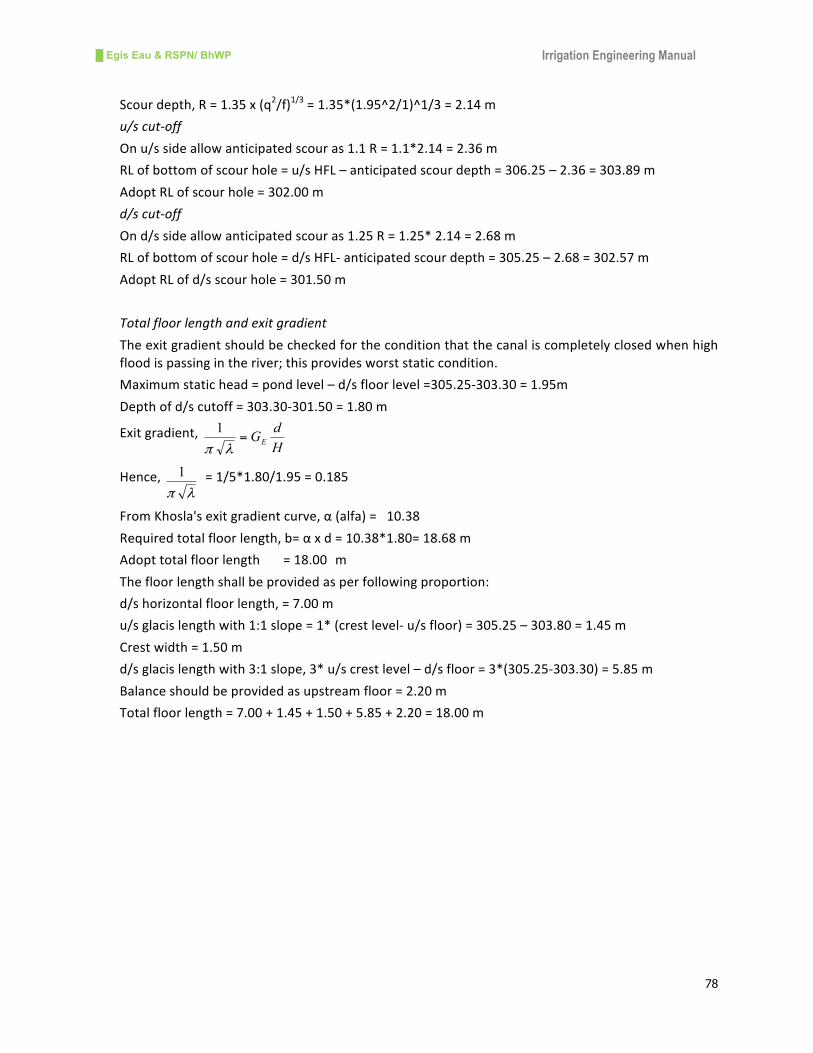
█ Egis Eau & RSPN/ BhWP Irrigation Engineering Manual
78
Scourdepth,R=1.35x(q2/f)
1/3=1.35*(1.95^2/1)^1/3=2.14m
u/scut-off
Onu/ssideallowanticipatedscouras1.1R=1.1*2.14=2.36m
RLofbottomofscourhole=u/sHFL–anticipatedscourdepth=306.25–2.36=303.89m
AdoptRLofscourhole=302.00m
d/scut-off
Ond/ssideallowanticipatedscouras1.25R=1.25*2.14=2.68m
RLofbottomofscourhole=d/sHFL-anticipatedscourdepth=305.25–2.68=302.57m
AdoptRLofd/sscourhole=301.50m
Totalfloorlengthandexitgradient
Theexitgradientshouldbecheckedfortheconditionthatthecanaliscompletelyclosedwhenhigh
floodispassingintheriver;thisprovidesworststaticcondition.
Maximumstatichead=pondlevel–d/sfloorlevel=305.25-303.30=1.95m
Depthofd/scutoff=303.30-301.50=1.80m
Exitgradient,H
dGE
=λπ
1
Hence,
λπ
1 =1/5*1.80/1.95=0.185
FromKhosla'sexitgradientcurve,α(alfa)=10.38
Requiredtotalfloorlength,b=αxd=10.38*1.80=18.68m
Adopttotalfloorlength=18.00 m
Thefloorlengthshallbeprovidedasperfollowingproportion:
d/shorizontalfloorlength,=7.00m
u/sglacislengthwith1:1slope=1*(crestlevel-u/sfloor)=305.25–303.80=1.45m
Crestwidth=1.50m
d/sglacislengthwith3:1slope,3*u/screstlevel–d/sfloor=3*(305.25-303.30)=5.85m
Balanceshouldbeprovidedasupstreamfloor=2.20m
Totalfloorlength=7.00+1.45+1.50+5.85+2.20=18.00m
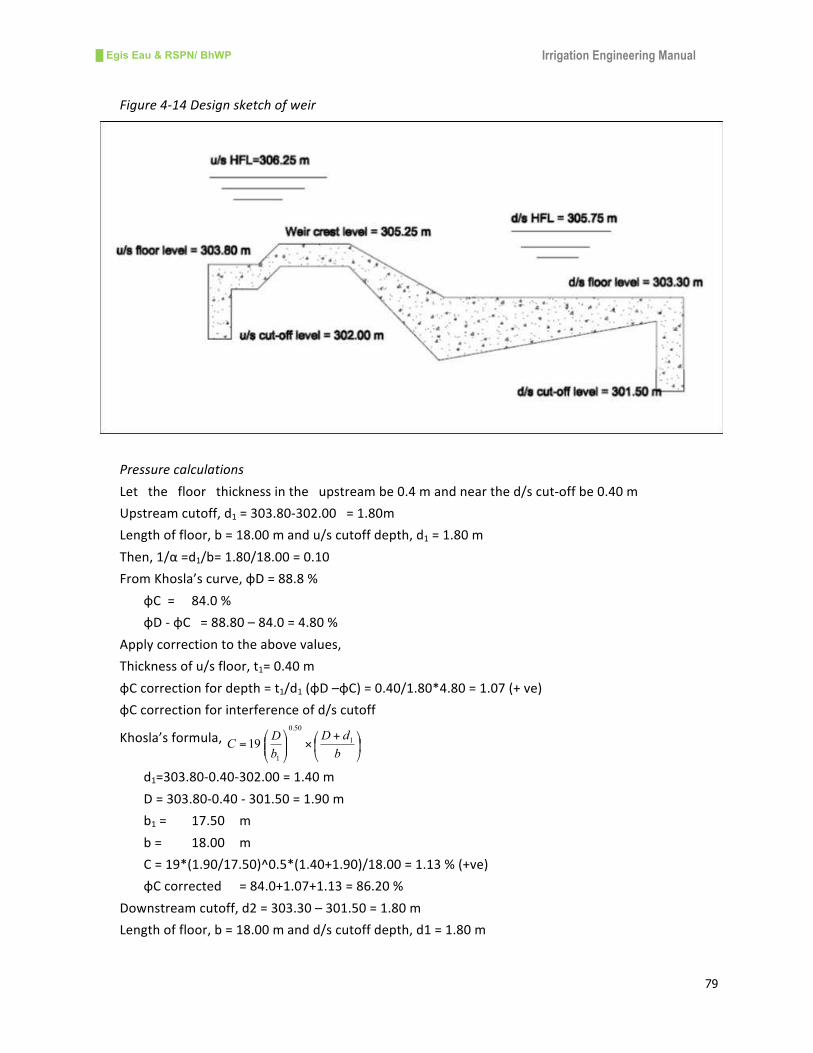
█ Egis Eau & RSPN/ BhWP Irrigation Engineering Manual
79
Figure4-14Designsketchofweir
Pressurecalculations
Letthefloorthicknessintheupstreambe0.4mandnearthed/scut-offbe0.40m
Upstreamcutoff,d1=303.80-302.00=1.80m
Lengthoffloor,b=18.00mandu/scutoffdepth,d1=1.80m
Then,1/α=d1/b=1.80/18.00=0.10
FromKhosla’scurve,φD=88.8%
φC= 84.0%
φD-φC=88.80–84.0=4.80%
Applycorrectiontotheabovevalues,
Thicknessofu/sfloor,t1=0.40m
φCcorrectionfordepth=t1/d1(φD–φC)=0.40/1.80*4.80=1.07(+ve)
φCcorrectionforinterferenceofd/scutoff
Khosla’sformula, ⎟⎠
⎞⎜⎝
⎛ +×⎟⎟
⎠
⎞⎜⎜⎝
⎛=
b
dD
b
DC
1
50.0
1
19
d1=303.80-0.40-302.00=1.40m
D=303.80-0.40-301.50=1.90m
b1= 17.50 m
b= 18.00 m
C=19*(1.90/17.50)^0.5*(1.40+1.90)/18.00=1.13%(+ve)
φCcorrected =84.0+1.07+1.13=86.20%
Downstreamcutoff,d2=303.30–301.50=1.80m
Lengthoffloor,b=18.00mandd/scutoffdepth,d1=1.80m

█ Egis Eau & RSPN/ BhWP Irrigation Engineering Manual
80
Then,1/α=d2/b=1.8/18.00=0.100
FromKhosla’scurves,φE1=14.70%
φD1= 10.20%
φE1-φD1=14.70–10.20=4.50%
φE1correctionfordepth=0.40*4.50/1.80=1.00(-ve)
φE1correctionforinterferenceduetou/scutoff
d=303.30-0.40-301.50=1.40m
D=303.30-0.40-302.00=0.90m
⎟⎠
⎞⎜⎝
⎛ +×⎟⎟
⎠
⎞⎜⎜⎝
⎛=
b
dD
b
DC
1
50.0
1
19=19(0.90/17.50)^0.5*(1.40+0.90/18.00)=0.54%(-ve)
φEcorrected =14.70-1.00-0.54=13.16%say13.20%
φC=86.20% andφE=13.20%
Floorthickness
Themaximumstaticheadwilloccuronthefloorwhenthereisnoflowinthecanalbutmaximum
floodispassingdownriver.Inthiscasethemaximumstatichead=305.25–303.30=1.95m
Downstreamfloor
At1mfromd/send
Unbalancedhead=(86.20-13.20)/100*1.95*1.00/18.00+13.20*1.95/100=0.34m
Floorthickness=0.34/(2.24-1)=0.27m
Providefloorthickness=0.40mat1mfromd/sendofcut-off
Upliftpressure=1000*0.34=335.70kg/m2
Slabweight=2500*0.70=1750.00 kg/m2
Netupliftpressure=335.70–1750.00=-1414.30 kg/m2
CalculatemomentMr=w*l2/12=-247798530Nmm
d=(Mr/Rb*b)^0.5=617mm,say600mm
Provide50mmcoverbothside,sothattotalthicknessofslabis=700mm
Floorthicknessprovided=700mm
At7.00mfromd/send
Unbalancedhead=(86.20-13.20)/100*1.95*7.00/18.00+13.20*1.95/100=0.81m
Floorthickness,t=0.81/(2.24-1)=0.65m
Providefloorthicknessas0.80mat7.00mfromd/sendofcut-off
Upliftpressure=1000*0.81 =810.46kg/m2
Slabweight,=2500*0.30=750.00 kg/m2
Netupliftpressure,=810.46–750.00=60.46kg/m2
Mr=w*l2/12=1259587Nmm
d=(Mr/Rb*b)^0.5=44mmsay200mm
Provide50mmcoverbothside,sototalthicknessofslabis=300mm
Floorthicknessrequired=300mmatendoffloor
█ Egis Eau & RSPN/ BhWP Irrigation Engineering Manual
81
Protectionworksbeyondimperviousfloor
i. Upstreamblockprotection
Scourdepth,R=1.35(q2/f)
1/3=1.35(2.14^2/1)^1/3=2.14m
Anticipatedscour=1.5*R=1.50*2.14=3.21m
u/sscourlevel=u/sHFL–anticipatedscourdepth=306.25–3.21=303.04m
Scourdepth,Dbelowu/sfloor=u/sfloorlevel-scourlevel=303.80–303.04=0.76m
Volumeofblockprotectiontobegiven=Dm3/m=0.76m
3/m
Provide1.0mx1.0mx0.30mblockover0.20mthickgravel
Thelengthrequired= D/(blockthickness+gravelthickness)=0.76/0.50=1.53m
Providetworowsoftheconcreteblockinalengthof2.00m
ii. U/slaunchingapron
Quantityoflaunchingapronfor2:1slopebe2.25Dm3/m
Thicknessoflaunchingapron=blockthickness+gravelthickness=0.50m
Thelengthrequired=2.25*0.76/0.50=3.44m
Providelaunchingapronof3.00mlength
iii. D/sblockprotection
Scourdepth,R=2.14m
Anticipatedscourdepth=2*R=4.29m
Downstreamscourlevel=HFL-retrogression–anticipatedscourdepth
=305.75-0.50-4.29=300.96m
Scourdepth,Dbelowd/sfloor=d/sfloorlevel–scourlevel=303.30-300.96=2.34m
iv. D/sInvertedfilter
Thelengthofinvertedfilter=Dmeterandthicknessequaltothed/slaunchingapron
Provideinrowof1.00mx1.00mx0.60mconcreteblockwith10cmgapfilledwithpeagravelover
0.40mthickgradedfilterinalengthof2.00m
v. D/slaunchingapron
Quantityoflaunchingapronshouldbe2.25Dm3/m
Thicknessoflaunchingapron=1.00m
Thelengthrequired=2.25*D/1.00=2.25*2.34=5.26m
Providelaunchingapron6.00minlength
4.8 EnergyDissipationinHydraulicStructure
4.8.1 Energydissipation
The energy ofwater flowing overweirs/spillways needs to be absorbed or dissipated before it is
returnedtotheriverorcanalwhereunprotectedorsoftfoundationsexist.Theobjectiveofenergy
dissipation is thus to destroy the energy of a mass of water so that it does not create serious
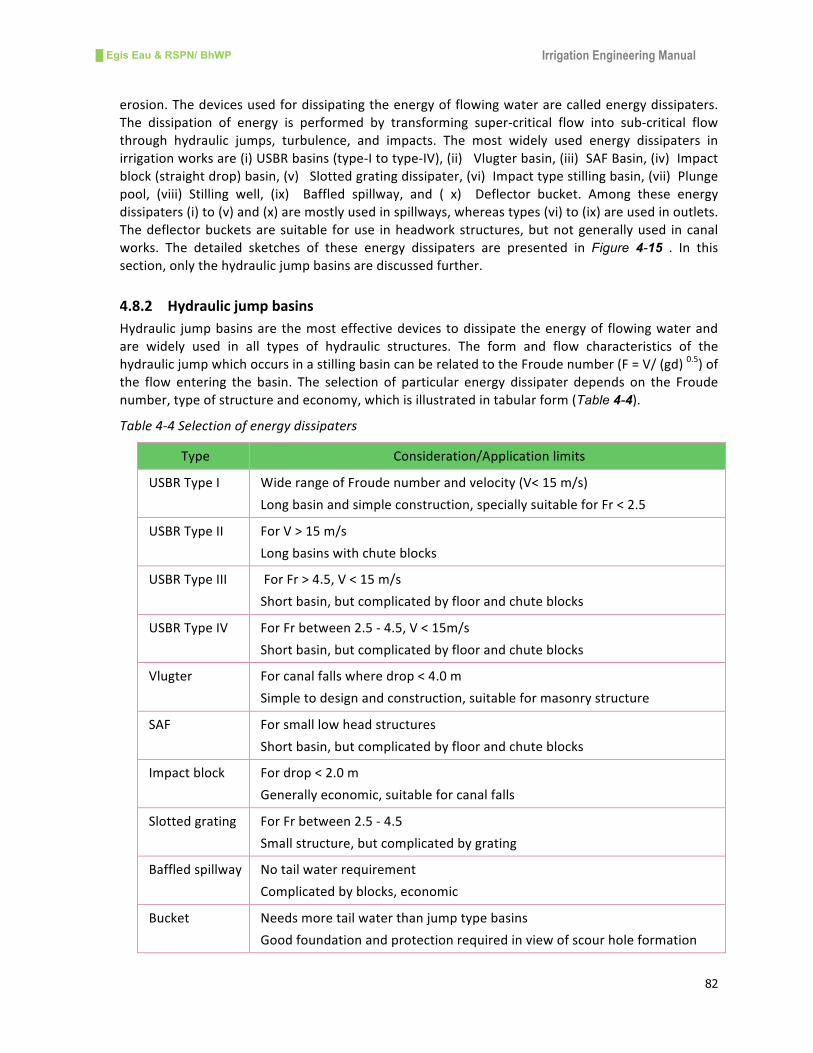
█ Egis Eau & RSPN/ BhWP Irrigation Engineering Manual
82
erosion.Thedevicesusedfordissipatingtheenergyofflowingwaterarecalledenergydissipaters.
The dissipation of energy is performed by transforming super-critical flow into sub-critical flow
through hydraulic jumps, turbulence, and impacts. The most widely used energy dissipaters in
irrigationworksare(i)USBRbasins(type-Itotype-IV),(ii)Vlugterbasin,(iii)SAFBasin,(iv)Impact
block(straightdrop)basin,(v)Slottedgratingdissipater,(vi)Impacttypestillingbasin,(vii)Plunge
pool, (viii) Stilling well, (ix) Baffled spillway, and ( x) Deflector bucket. Among these energy
dissipaters(i)to(v)and(x)aremostlyusedinspillways,whereastypes(vi)to(ix)areusedinoutlets.
Thedeflectorbucketsaresuitable foruse inheadworkstructures,butnotgenerallyused incanal
works. The detailed sketches of these energy dissipaters are presented in Figure 4-15 . In this
section,onlythehydraulicjumpbasinsarediscussedfurther.
4.8.2 Hydraulicjumpbasins
Hydraulic jumpbasinsarethemosteffectivedevices todissipatetheenergyof flowingwaterand
are widely used in all types of hydraulic structures. The form and flow characteristics of the
hydraulicjumpwhichoccursinastillingbasincanberelatedtotheFroudenumber(F=V/(gd)0.5)of
the flow entering the basin. The selection of particular energy dissipater depends on the Froude
number,typeofstructureandeconomy,whichisillustratedintabularform(Table 4-4).
Table4-4Selectionofenergydissipaters
Type Consideration/Applicationlimits
USBRTypeI WiderangeofFroudenumberandvelocity(V<15m/s)
Longbasinandsimpleconstruction,speciallysuitableforFr<2.5
USBRTypeII ForV>15m/s
Longbasinswithchuteblocks
USBRTypeIII ForFr>4.5,V<15m/s
Shortbasin,butcomplicatedbyfloorandchuteblocks
USBRTypeIV ForFrbetween2.5-4.5,V<15m/s
Shortbasin,butcomplicatedbyfloorandchuteblocks
Vlugter Forcanalfallswheredrop<4.0m
Simpletodesignandconstruction,suitableformasonrystructure
SAF Forsmalllowheadstructures
Shortbasin,butcomplicatedbyfloorandchuteblocks
Impactblock Fordrop<2.0m
Generallyeconomic,suitableforcanalfalls
Slottedgrating ForFrbetween2.5-4.5
Smallstructure,butcomplicatedbygrating
Baffledspillway Notailwaterrequirement
Complicatedbyblocks,economic
Bucket Needsmoretailwaterthanjumptypebasins
Goodfoundationandprotectionrequiredinviewofscourholeformation

█ Egis Eau & RSPN/ BhWP Irrigation Engineering Manual
83
Figure4-15Sketchesofdifferenttypesofenergydissipaters

█ Egis Eau & RSPN/ BhWP Irrigation Engineering Manual
84
4.9 PumpedIrrigationSystem
4.9.1 Introduction
Smallscalepumpedirrigationsystemsaremadeupofthefollowingcomponents:
• Watersource,
• Pumpandpowerunit,
• Distributionsystemand
• Methodofirrigation
Thewatersource,distributionsystemand irrigationmethoddeterminetheenergydemand,while
thepumpandpowerunitsupplythepower.Thewatersourcemaybeariver,lakeorgroundwater.
Theamountofwaterabstractedandtheheighttowhichitmustbeliftedfromtheriverorborehole
addtotheenergydemand.PumpsaremostlydrivenbyelectricmotorsinBhutan.
The distribution system conveyswater from the pump to the farmer’s field and consists of open
channels or pipes. Some systems are a combination of open channel and pipes. The choice of
distributionsystemhasasignificanteffectonenergydemand.Theirrigationmethodmaybesurface
irrigation, sprinkler or drip irrigation. Surface irrigationmay be supplied either by a pipe or open
channel.Sprinklerordripirrigationsystemswouldnormallyusepipeddistributionsystems.
Themostcommoncombinationsofthecomponentsforanirrigationsystemare:
• Pump openchannel surfaceirrigation
• Pump pipesupply surfaceirrigation
• Pump pipesupply sprinklerordripirrigation
4.9.2 Typeofpumps
Apumpisadevicetoliftwatertoahigherlevelortotransportitfromonepointtoanother.Pumps
requiresomepowertoperformtheseworkswhich issuppliedbyadrivingdevice (electricmotor,
internalcombustionengine)throughamediumofatransmission.Hence,apumpingsetconsistsof
apowersupplier,atransmissionandapump.
Amongvarioustypesofpumpsto liftwater,Turbotypepumpscomprisingcentrifugal,mixedflow
andaxial flowpumpsaremostfrequentlyused inpumpingworksforwatersupply, irrigation,and
drainageservices.Thesepumpsallfunctionontheprinciplethattheenergyrepresentedbyheadis
imparted to the water pumped through the rotational motion of an impeller. The principle of a
pump’sfunctioningisrepresentedbyEuler’sequation.
Figure4-16SketchesofPumps
Centrifugal Mixedflow Axialflow
Inaradialflow(centrifugal)pump,thewaterleavestheimpellerinplanesperpendiculartotheshaft
axisdue to centrifugal force. Thewater then is guided througha volute casing into thedischarge
nozzle,whileapartofthevelocityheadisconvertedintothestatichead.Insomecasesdiffusersare
arrangedaroundtheimpeller.

█ Egis Eau & RSPN/ BhWP Irrigation Engineering Manual
85
In amixed flow pump, thewater leaves the impeller in a direction diagonal to the shaft axis on
conicalsurfaces.Thewaterleavingtheimpelleriseithercollectedbyavolutecasingorreceivedbya
diffusercasing.
Inanaxialflowpump,thewaterflowsthroughapropellertypeimpelleroncylindricalsurfacesand
adiffusercasingisexclusivelyusedforrestoringpressure.
Mostofthepumpsarecoupledwithelectricmotorsorenginesbeingdrivenfromthepumpshaft
end. Submersible motor pumps are driven by motors integrated into the pump casing and
immersed in the suction sump or deep wells. These pumps are exclusively vertical shaft types
featuringeaseinhandlingwhenusedforportableapplications.
4.9.3 TotalDynamicHead
A total dynamic head or total pumping head is the head that the pump is required to impart to
waterinordertotheheadrequirementoftheparticularsystem.Thetotalheadismadeupofstatic
suctionhead,staticdischargehead,requiredpressurehead,andfrictionhead(Figure 4-17).
Figure4-17Sketchoftotaldynamichead
4.9.4 PumpCharacteristicCurves
Mostmanufacturersprovidefourdifferentcharacteristiccurvesforeverypump:thetotaldynamic
headversusdischarge(TDH-Q)curve,theefficiencyversusdischarge(Eff-Q)curve,thebreakpower
versus discharge (BP-Q) curve, and net positive suction head required versus discharge (NPDH-Q)
curve.Allfourcurvesaredischargerelated(Figure 4-18).

█ Egis Eau & RSPN/ BhWP Irrigation Engineering Manual
86
Figure4-18Sketchesofpumpcharacteristiccurves
Total dynamic head versus discharge curve relates the head to the discharge of the pump. This
curve shows that thepumpcanprovidedifferent combinationsofdischargeandhead.When the
headincreasesthedischargedecreasesorviceversa.
Efficiency versus discharge curve relates the pump efficiency to the discharge. The efficiency is
definedasoutputworkoverinputwork.
BPC
TDHQ
BP
WP
workInput
workOutputE pump
×
×===
WhereEpumpisthepumpefficiency,
BPisthebreakpowerinkworHP(1kW=1.36HP)theenergyimpartedbytheprimemovertothe
pump,
WPisthewaterpowerinkw,theenergyimpartedbythepumptothewater,
Qisthedischargeinm3/shourorl/s,
TDHisthetotaldynamicheadinm,and

█ Egis Eau & RSPN/ BhWP Irrigation Engineering Manual
87
Cisthecoefficienttoconvertworktoenergyunitandequalsto102ifQismeasuredinl/sand367if
Qismeasuredinm3/hour.
Break power versus discharge curve relates the input power required to drive the pump to the
discharge.
Thenetsuctionheadrequiredversusdischarge:Someoftheatmosphericpressureatwaterlevelis
lost in theverticaldistance to theeyeof the impeller, some to frictional losses, and some to the
velocityhead.ThetotalenergythatisleftattheeyeoftheimpelleriscalledtheNetPositiveSuction
Head(NPSH)andtherequiredenergytomovewater intotheeyeoftheimpeller iscalledtheNet
Positive Suction Head Required (NPSHR). It is the function of the pump speed, the shape of the
impeller and the discharge. In order to avoid cavitation of the pump, available NPSH should be
greaterthanNPSHR.
Manufacturers also provide the combined characteristic curves for total head, shaft power and
efficiency plotted on the ordinates against capacity on the abscissa. The forms of characteristic
curvesarecloselyrelatedtothevaluesofthespecificspeedinwhichrespectivecharacteristicsare
giveninpercentageofthevalueatthebestefficiencypoint.
4.9.5 PowerandEnergyforPumping
In general, the power for the pump set is electricity obtained either from the central power grid
systemorgeneratedfromitsownsource.Nominaloperatingconditionofthepowersupplyis400
Volt,3PhaseA.C.with50Hzfrequency.Theamountofenergyrequiredtoliftthewaterdependson
thevolumetobeliftedandtheheadrequired:
367
HVE
w×
=
WhereEistheenergyinkilowatthour(kWh),Vwisthevolumeofwaterinm3,andHistheheadin
m,
Poweristherateofusingenergyandiscommonlymeasuredinkilowattorhorsepower(1kW=1.36
HP).Poweriscalculatedas:
t
EP =
WherePisthepowerinwatt,Eistheenergyinwatthourandtisthetimeinhour.Fromtheenergy
andpowerequationsdischargerelationisobtainedas:
QHP 81.9=
WhereQisthedischargeinliterpersec,andHisthetotalheadinm
4.9.6 Pumpsinseries
Connecting pumps in series applies to the caseswhere the same discharge is required butmore
headisneededthanthatonepumpcanproduce.Fortwopumpsoperatinginseries,thecombined
headequalsthesumoftheindividualheadsatacertaindischarge.
4.9.7 Pumpsinparallel
Pumpsareoperatedinparallelwhenforthesamehead,variationindischargeisrequired.Atypical
examplewouldbeasmallholderpressurizedirrigationsystemwithmanyusers.
4.9.8 Selectionofpumps
Awiderangeofpumpsareavailableonthemarket.Theselectionoftherightpumpfortherightuse
depends on a series of inter-related factors. Centrifugal pumps have the largest application in
irrigationcomparedtoothertypeofpumps.Themostcommonlyusedcentrifugaltypesofpumps
█ Egis Eau & RSPN/ BhWP Irrigation Engineering Manual
88
are horizontal end suction, vertical submersible and vertical turbine pumps. Mixed or axial flow
impellersaresometimesusedinlowlift,highcapacityoperationslikeliftingwaterfromacanal.In
general practice, the selection of the pumps requires the use of manufacturers’ characteristics
curves.
Priortoselectingthepumpingsystem,itisessentialtocalculatetotalheadoveranumberofstages
and finalize the complete layout of the system. All components of the system including valves,
bends, manifolds, reducers, etc. may be incorporated to evaluate total head for each stage of
pumping,summingupstaticheadandfrictionhead.Amarketsurveyforvarioustypesofpumpsand
theiravailabilitywillhelp to identify thecost-effectivepump foragiven site.The selectionof the
prime mover governs the selection of a pump, whether it is mechanically driven or electrically
driven. In our case, we use electrically driven pumps. In the case of electrically driven pumps,
directly coupled ACmotors are generally available in themarket.While selecting a pump, try to
ensurethatthepowerisadequatefortherequireddischargeandhead.
Centrifugalpumpsare themost commonlyusedengine-poweredpumps for small-scale irrigation.
Theyaremainlydesignedtoproviderelativelyhighheadandlowdischargeforagivenpower.Some
sort of compromisehas to be acceptedbetween requireddischarge, total head and geographical
location.
4.9.9 Sitingofpumpingstation
The pumping station is a building which provides a foundation for the pumping set and its
accessories andprotects them fromadverseweather conditions. It also houses the electrical and
other auxiliary equipment and supports suction and discharge piping. The selection of a suitable
locationforapumpingstation isvery important in irrigationdevelopment.Several factorshaveto
beconsideredwhileselectingthepumpingsite.
• Reliabilityofthewatertomatchwiththeproposedcroppingpatternofthecommandarea,
• Outsidethefloodlevelincaseofriverwaterabstraction,
• Adequatewaterdepthforsuctionpipe
4.9.10 SelectionofPipesandFittings
Pipesareanintegratedpartofapumpingsystem.Inanyliftscheme,theselectionofproperpipesis
asimportantasthatofthepump.Notonlydopipesrepresentamajorpartoftheinitialinvestment,
theirimproperselectionwilladverselyaffectoperationandmaintenancecosts.Thecompletefailure
ofaschemecanresultfromimproperpipeselection.
Inselectingpipes,considerationmustbegiventotheirdiameter,materialandcost,keepinginview
theworking condition and availability of such pipes on themarket. The basic considerations that
finallyleadtotheselectionofpipesarediscussedbelow:
• Workingpressure,
• Waterhammer-introducebreakpressuretankorsurgetank,
• Internalpressure-adequatepipethickness,
• Externalpressure-considertrafficload,earthpressure,
• Frictioninpipes-smallfrictionfactor,
• Qualityofwater-siltfreewater,
• Costofpipe-lowcost,
• Availability

█ Egis Eau & RSPN/ BhWP Irrigation Engineering Manual
89
4.9.11 Maincivilworksforpumpedirrigation
Intake
Intake is necessary to guide thewater towards the jackwell or sumpwell. It is alsonecessary to
maintainthewaterlevelfluctuationsintheriver.
Jackwell/Sumpwell
Thewaterdivertedfromtheriveriscollectedinajackwellorsumpwellfromwhereitispumpedto
the irrigationcommandarea.The term jackwell isusedwhen thepumphouse is locateddirectly
over the well. In such cases, vertical turbine pumps are mostly used. When the pump house is
locatedon the ground close to thewell the term sumpwell is used. Forpermanent lift irrigation
schemes,properlydesignedpumpingwellsareprovidedforinstallingthepumpingsets.
Sumpwellsare constructedon thebanksof the river toprotectpumpingunits from floodwater.
Theyareusuallyusedtopumpwaterusingcentrifugalpumpsfromriversandstreamsinwhichthe
flood levels are not high and the water level in the river is within the suction lift of centrifugal
pumps.
Pumphouse
Thepermanentpumphousecanbeprovidedifthewaterlevelintheriverismoreorlessconstant
throughouttheyear.Generallythepumphouseisrectangularinshape.Thepumps,motors,panel
box for electrical components, starters and other accessories are located in the pump house
separately. The dimensions of the pump house are based on the specific requirements of the
installation.Thismayvaryfromsitetositedependinguponthestreamhydrologyalso.
DeliveryChambers/dischargetank
The delivery chamber or discharge tank is necessary at the head of the distribution system.
Generallyitcanbedesignedforoneortwominuteretentioncapacityoftheincomingflow.
4.9.12 Designprocedureofpumpedirrigation
i. Assessthedesigndischargeofthesystembasedonpeakwaterrequirementsandthecommand
area,
ii. Ascertain thewater availability at the source,which should have adequate flow tomeet the
cropwaterrequirements,
iii. Draw the proposed pumped irrigation layout mentioning intake, sump well, pump house,
pipelinealignment,dischargetank,etc,
iv. Drawthelongitudinalprofileofthesystembasedonthelayoutplanmentioningbedlevelofthe
source,high flood level,pumphouse level, criticalpointsalongpipealignment,anddischarge
tank,
v. Calculate the lengthof thepumpingmainlineand leveldifferencebetween thewater levelat
sourceandthedischargetank,
vi. Determinethenumberofpumpingunits,operatinghoursperdayanddesigndischargeofeach
pump,
vii. Determinethestagesof thepumpingsystembasedontheavailableheadandcapacityof the
pump,
viii. CalculateeconomicsizeofpumpingmainfromLea’sformula,
QD ×= 22.1
WhereQisthedesigndischargeinm3/s,

█ Egis Eau & RSPN/ BhWP Irrigation Engineering Manual
90
ix. Adaptnearestpipediameteravailableinthemarket,
x. Calculatevelocityofflowinthepipe,2
4
D
QV
π=
WhereQisthedesigndischargeandDisthepipediameter,
xi. Adopt economic diameter of pipe considering permissible velocity for the particular type of
pipe,
xii. Calculatetotalheadlossinpipeflow,
Totalheadloss=frictionheadloss+bendloss+entranceloss+exitloss
FrictionheadlossfromDarcy-Weisbachformula,gD
VLfh f
2
2×
=
Wherehfisthefictionheadlossinm,
fisthefrictioncoefficientandcanbecalculatedusingvariousformulas,
Listhepipelengthinm,
Disthepipeinsidediameterinm,
Visthevelocityofwaterinm/s,and
gistheaccelerationduetogravity=9.81m/s2
ColebrookWhiteequationforfrictionfactor,⎟⎟
⎠
⎞
⎜⎜
⎝
⎛+−=
fN
De
f R
51.2
70.3
/log
1
Swamee-Jainequationforfrictionfactor,
2
90.0
74.5
70.3
/log
25.0
⎟⎟⎠
⎞⎜⎜⎝
⎛+
=
RN
Def
Whereeistheroughnessheightofpipematerial,
Disthediameterofthepipe,and
NRistheReynoldsnumber,λ
DVNR= ,whereλistheviscosityofthewater
xiii. Calculatetotaldynamicheadforpumping,
Totaldynamichead=Leveldifferencebetweensourceanddischargetank+Headloss+Suction
head,
xiv. Selectthetypeofpumptobeinstalledinthesystem(centrifugal,submersible),
xv. Selectthepumpcapacitybasedonthemanufacturer’scharacteristiccurves,
xvi. Basedonthepumpmodelanditspowercalculatetheefficiencyofthepump,
BP
WPE pump =
WhereWPisthetheoreticalpower,
BPisthebreakhorsepowerbasedonthepumpmodel,
xvii. Calculatethewaterhammerpressureatthedeliverypipe,
WhereVisthevelocityofflowinpipeinm/s,
gistheaccelerationduetogravityinm/s2,
⎥⎦
⎤⎢⎣
⎡⎟⎠
⎞⎜⎝
⎛−+
=
mEt
d
Kw
g
VPh
2
11
.
1

█ Egis Eau & RSPN/ BhWP Irrigation Engineering Manual
91
wisthespecificweightofthewaterinN/m3=9810N/m
3,
KistheeBulkmodulusofwaterinN/m2=2060N/m
2,
disthediameterofpipeinm,
tisthethicknessofthepipeinm,
EistheYoung’smodulusofelasticityofpipeinkN/m2,
1/misthePoissonratio,
xviii. Comparethewaterhammerpressurewiththeallowablepressureofpipematerial,
4.9.13 DesignexampleofPumpedirrigationsystem
Designdata:
Commandarea 10ha
Sourceofwater PerennialRiver
Minimumwaterlevelatthesource 505.00m
Maximumwaterlevelatthecommandarea 640.00m
Lengthofmainlineprofile 320m
Calculations
Thepeakwaterrequirementbe1.25l/sperha
Thetotalwaterrequirementbe10*1.25=12.50l/s
Assumethepumpshallrunfor12hours,thenpeakdischarge=12.50*2=25l/s
Letusprovidethreepumps inparallel;twoforoperationandoneforreserve,thendischargeofa
singlepumpunitbe,q=12.50l/s
Calculate economic size of pumpingmain from Lea’s formula, QD 20.1= = 1.2*√0.0125 = 136.4
mm
AvailablesizeofGIpipe=125mm
Calculateheadlossforpipediameter125mmandlengthof320m
Velocityinpipe,2
4
D
Q
A
QV
π== =4*1000/(3.14*125^2)=1.020m/s
UsingDarcy-Weisbachequationheadloss,g
V
D
Lfhf
2
2
×=
WherefiscoefficientoffrictionwhichiscalculatedfromMoody’sdiagram
ForGIpipeabsoluteroughness,e=0.15mm
Listhelengthofpipe,L=320m
Disthediameterofpipe,D=125mm
Visthevelocityinpipe,V=1.02m/s
FromMoody’sdiagramf=0.036
Then,hf=0.036*320/0.0125*1.02^2/2*9.81=4.88m
Takebendandjoinlossesas10%ofthefrictionalloss,thetotalloss,hf=4.88*1.1=5.36m
Totalheadforpumping=leveldifference+headloss+suctionhead
Letthedepthofsumpwellbeat2.0mandminimumwaterlevelbelowthesumpwellbe1.20m
Thentotalhead=(640.00-505.00)+5.36+2.00+1.20=143.56m
Based on the discharge to be pumped and dynamic head, select pump from manufacturer’s
characteristiccurve,
SelectKSBorequivalentpumpwithmodelno:UPHA293/8+HBC
Powerofpump=30kW=40HP,

█ Egis Eau & RSPN/ BhWP Irrigation Engineering Manual
92
Discharge45m3/hourfortotalheadof144m,
Totallengthofpump=2.36m,
Calculatetheefficiencyofthepump,P
gHQρη = =0.0125*9.81*143.56/30=58.60%
Calculatethewaterhammerpressureatthedeliverypipe,
WhereVisthevelocityofflowinpipe=1.02m/s,
gistheaccelerationduetogravity=9.81m/s2,
wisthespecificweightofthewater=9810N/m3,
KistheeBulkmodulusofwaterinN/m2=2060N/m
2,
disthediameterofpipe=125mm,
tisthethicknessofthepipe=5.4mm,
EistheYoung’smodulusofelasticityofpipe=210kN/m2,
1/misthePoissonratio=0.27
Ph=1.02/sqrt(9.81/9810(1/(2060*1000000)+0.0125/0.0054*(210*1000000*1000)(1-
0.27*0.50))/1000*1000=1.34N/mm2,=13.62kg/cm
2
Totalpressure=staticpressure+waterhammerpressure,
Staticpressure=(headdifference+depthofsumpwell+waterlevelbelowsumpwell)/acceleration
duetogravity=(135+2.0+1.2)/9.81=138.20/9.81=14.08kg/cm2
Totalpressure=14.08+13.62=27.70kg/cm2
GIpipewithheavydutycanwithstandthispressure,
Hence,thedesignisacceptable.
⎥⎦
⎤⎢⎣
⎡⎟⎠
⎞⎜⎝
⎛−+
=
mEt
d
Kw
g
VPh
2
11
.
1

█ Egis Eau & RSPN/ BhWP Irrigation Engineering Manual
93
CHAPTER-5
5. CanalSystemDesign
5.1 Introduction
Before the start of the survey and design, the canal system has to be planned. Canal system
planningincludesdecidingwhattypesofcanalsanddrainsarerequiredandwhattypeofsystemto
use.Italsocomprisesdecidinghowthesystemwillbeoperatedandwhatcontrolstructureswillbe
requiredtodistributewateruptothefarmer’sfield.Inaddition,systemplanninginvolveslayingout
thesystemofcanalsanddrainsonsuitablebasemaps.Hence,an irrigationsystemcomprises the
canalstobringwatertothefieldsandthedrainstotakeawaytheexcessirrigationorrainfallwater.
5.2 TypeofCanals
Basedon their hierarchy, canals are named themain canal, branch canal, tertiary canal and field
canals.Themaincanaltakesoffwaterfromtheheadworkorintakewhileabranchcanaltakesoff
waterfromthemaincanal.Similarly,atertiarycanaltakeswaterfromthebranchcanalandfeeds
fieldcanals.
Basedonthealignment,thecanalsarecategorizedasacontourcanalandaridgecanal.Acontour
canal isalignedalongthecontoursandprovides irrigationonthevalleysideonly.A ridgecanal is
aligned along the ridge and provides irrigation on both sides. Generally,main canals are contour
canalsandbranchcanalsareridgecanals.
Based on the shape of the cross sectional area, the canals are named as trapezoidal canal,
rectangular canal, triangular canal, and circular canal. The shape of the canal depends upon the
capacity,nature,topography,andpurposeofthecanal.
Basedonthematerials inthesectionboundary,thecanalsarelinedcanalandunlinedcanals.The
choiceof linedorunlinedcanaldependsuponthetype,nature,purposeanddevelopmentcostof
thescheme.Generallylinedcanalsaredesignedtoreducetheseepagefromthecanalsectionalong
itsconveyance.Thetypesoflinedcanalsandtheirrelevancearepresentedinseparatesections.
5.3 Layoutplanning
The layout plan is the arrangement of canals, drains, and structures required to achieve water
distribution and remove excess water from irrigation fields. The layout planning establishes the
optimum arrangements, positions, levels of canals and structures. It also considers physical,
technical, and social constraints of the specific site. Generally two types of canal layouts exist
(Figure5-1):
Bifurcatinglayout:Inbifurcatingsystemwaterisdividedamongtwoorthreelargegroupofcanals,
subdivided into twoor threesmallgroupofcanalsandsoon.This typeof layoutsystemexists in
communitymanagedsystemsinvalleysandplains.
Hierarchical layout: In hierarchical system water is divided into large blocks and then after sub-
dividedintosmallerunits.Generally,thistypeoflayoutisexistedinmodernirrigationsystems.The
layoutofcanalsanddrainsfallowridgesandvalleysrespectively.

█ Egis Eau & RSPN/ BhWP Irrigation Engineering Manual
94
Figure5-1CanalLayouts
Bifurcatinglayout Hierarchicallayout
InsmallhillirrigationschemeslikeinBhutan,thefollowingtwotypesoflayoutsystemsaresuitable
forplanningpurpose(Figure5-2):
a. Thefirstsystemhasaprimaryormaincanalwithaseriesofdirectoff-takesalongthemain
canal.Thistypeofcanallayoutexistedinthecommunitymanagedirrigationsystems;
b. The second type of system has small and medium sized off takes along the main and
secondarycanals.Thenumberofsecondarycanalsdependsuponthesizeofthe irrigation
scheme.
Figure5-2SmallScaleCanalLayouts
Figure5-2showsthatinthetype-Alayout,alloftheofftakesarelocatedalongthemaincanalwhile
in the type-B layout, secondary canal or branch canals also exist. The layout planning of a canal
systeminvolvesthreekeyparameters:
• Linkageofcommandareaandintake,
• Alignmentoftheprimarycanal,and
• Typeofcanallayout
Thelocationofthe intakeisthekeydeterminantofthecommandareaandinmanycaseswillset
thelimitoftheareatobeirrigated.Establishingtherelationshipsbetweentheintake/headworksite
andthecommandareaintermsoflevelsandwaterquantitiesinvolvesatrialanderrorapproach.

█ Egis Eau & RSPN/ BhWP Irrigation Engineering Manual
95
Routeselectionofacanaldependsontopography,geologicalconditionsalongthealignment,canal
type, type and size of irrigation project. Primary canals in the hills follow the contours and pass
through ridges, valleys, deep gullies, natural drains, land slide zones and vertical to moderately
sloped terrain. In selecting the alignment of the primary canal, it is essential to establish the
geological features along the alignment, and define the stable and unstable portions. The route
shouldbemodifiedifunstableanddifficultfeaturesareobserved.Ifthealignmenthastopasssuch
features,appropriatesolutionsneedtobeadopted.
Typeofcanal layoutalsodecidesthesystemplanning.Themajor layoutsystemsbeingadoptedin
hilly environment are discussed above. However, there may be an alternative layout system
applicableinhillyterrainlikeBhutan(Figure5-3).Thistypeof layoutfeedstheisolatedpocketsof
thecommandareaalongtheprimarycanal.
Figure5-3AlternativeLayoutforSmallScaleCanals
5.4 DesignConceptofIrrigationCanals
Ingeneralprinciple,irrigationcanalsliealongridgesanddrainslieinvalleys.Thedesignofirrigation
canalsinvolvesthefollowingsteps:
• Drawthecanallayout,
• Measureschemecommandarea,
• Determinecanalcapacityordesignflow,
• Prepareschematicdiagramofcanalsystem,
• Designcanalparametersforeachreachofthecanalsystem,
• Workoutcanalwaterlevelsatcriticallocations,
• Drawthepreliminarycanallongprofile,
• Fromstructuresdesignfinalizecanalwaterlevels,
• Drawupfinalcanallongprofile,
• Drawupcanalcrosssections
Forlargeirrigationsystems,canalcapacitydesignstartsfromthefieldleveltomaincanalandupto
the intake.Thisdesignapproach involvescalculationsofwaterrequirementsat the field leveland
capacitiesoftheirfeedercanalssumminguptothemaincanal.Forsmallscaleirrigation,thedesign
ofcanalcapacityiscarriedoutby:
Q=NCWRxCCA/8.64
Where,Q–designcapacityofcanalattheintakeinlps,
NCWR–netcropwaterrequirementinmm/day,
CCA–culturalcommandareainha,

█ Egis Eau & RSPN/ BhWP Irrigation Engineering Manual
96
If cropwater requirement is not assessed, the capacityof a canal can alsobedeterminedby the
dutyofirrigationwaterordepthofirrigationwaterforthemaincropstobeplanted.
Q=DutyxCCA
Where,dutyorwaterrequirementinlps/ha,
Example:
Duty=3l/s/haandcommandareais20ha,
Thecapacityofcanal(Qd)=3x20=60l/s
Priortostartingthecanalsystemdesignalongwiththestructuredesign,aschematicdiagramofthe
canalschemeisdrawnindicatingcanalsegmentsandlengths,majorstructures,andthecommand
area of the main branch canals and direct off-takes. Based on the schematic diagram of the
proposedcanalsystem(Figure 5-4)canalparametersaredesignedforeachreach.Thecanalscross
sectionalparametersarebedwidth,waterdepth,sideslope,roughnesscoefficient,andfreeboard.
Thelongitudinalslopeofthecanalisdeterminedbasedonthesizeofthecanalandtopographyof
thealignment.
5.5 DesignofUnlinedCanals
5.5.1 DesignProcedure
Thedesignofunlinedcanalsiscarriedoutusingvariousmethods.Forsmallirrigationschemesinthe
hills,itisappropriatetouseManning’sformula.Thedesignprocedureofthecanalfollowsaseries
ofsteps:
i. Determinethedesigndischarge,Q,
ii. Determinethedesignsideslope,m(1vertical:mhorizontal),
iii. Determinecanallongitudinalslope,S,
iv. Determinebedwidth todepth ratio, r (r=B/D;BbeingbedwidthandDbeingwater
depth),
v. Thecalculationshallbecarriedoutbytrialanderrormethod,
vi. AssumebedwidthofthecanalB,
vii. Calculatedepthofwaterdepth, BrD ×=
viii. Calculatecrosssectionalareaofflow, 2mDBDA +=
ix. Calculatewettedperimeterofflow, ( )212 mDBP ++=
x. Calculatehydraulicradius,P
AR =
xi. CalculatevelocityofflowusingManning’sformula, 2/13/21SR
nV ×=
xii. Calculatedischargeofcanalusingcontinuityequation, VAQ ×=
xiii. Checkthecalculateddischargeandcomparewithdesignedone,Qc>Qd
xiv. Comparethecalculatedvelocitywithlimitingvelocity,Vc<Vper
xv. Calculatetractiveforce, SRWCT ×××=

█ Egis Eau & RSPN/ BhWP Irrigation Engineering Manual
97
Where,Cisthecoefficientequalto1forbedand0.76forsides,Wisthespecificweight
ofwaterinN/m3,Risthehydraulicradiusofthecanal,andSistheslopeofthecanal,
xvi. Comparecalculatedtractiveforcewithpermissiblevaluesaccordingtotheirmaterial,
Excelsheetsarerequiredtodesignvarioussectionsofthecanal.Thedesignparametersofacanal
arepresentedinthesectionsbelow.
Figure5-4SchematicDiagramofCanalSystem

█ Egis Eau & RSPN/ BhWP Irrigation Engineering Manual
98
5.5.2 SideSlopes
Thesideslopesforthetrapezoidalcanalsectionisdeterminedonthebasisoftheslopestabilityof
soil.Thesideslopeshouldbeas lowaspossible.Thesideslopesshouldbeslightlyflatter infilling
sectionsthanincutsections.Therecommendedsideslopesofthecanalarepresentedbelow(Table
5-1).
Table5-1Recommendedsideslopesofcanal
Soiltype Hardrock Softrock Heavyclay Loam Sandyloam
Sideslope
(Verticalto
horizontal)
1:0.25 1:0.50 1:0.50to1:1 1:1to1:1.50 1:1.5to1:2
5.5.3 PermissibleVelocity
Themaximum flow velocity, above which scouring will occur in the canal, is termed permissible
velocity. This permissible design velocity is chosen from experience and knowledge of the soil
conditions.Alowervelocityallowsweedstogrowinthecanalsection,consequentlydecreasingthe
canal capacity, while a higher velocity tends to erode the bed of an unlined canal. Hence, the
velocityshouldbewithinthepermissiblelimitsbasedonthetypeofsoilandcanalcapacity(Table
5-2). The velocity shall be checkedwith permissible tractive force of the canalmaterial, which is
givenbytheequation:
T=CWRS
Where,Cisthecoefficienttakenas1forbedand0.76forsides,
Wisthespecificweightofwater,1000kg/m3,
Risthehydraulicradiusofthecanalsection,m
Sisthewatersurfaceslopeofthecanal,
Table5-2Maximumpermissiblevelocitiesandtractiveforces
S.N Material Maximumpermissible
velocity(m/s)
TractiveForce(kg/m2)
Clearwater Siltywater
1 Finesand 0.45–0.75 0.13 0.37
2 Siltloam 0.60–0.75 0.23 0.54
3 Alluvialsilt 0.60–0.75 0.23 0.73
4 Ordinaryloam 0.75–1.05 0.37 0.73
5 Finegravel 0.75–1.05 0.37 1.56
6 Coarsegravel 1.00-1.25 1.47 3.28
7 Cobblesandshingles 1.25-1.50 4.45 5.39
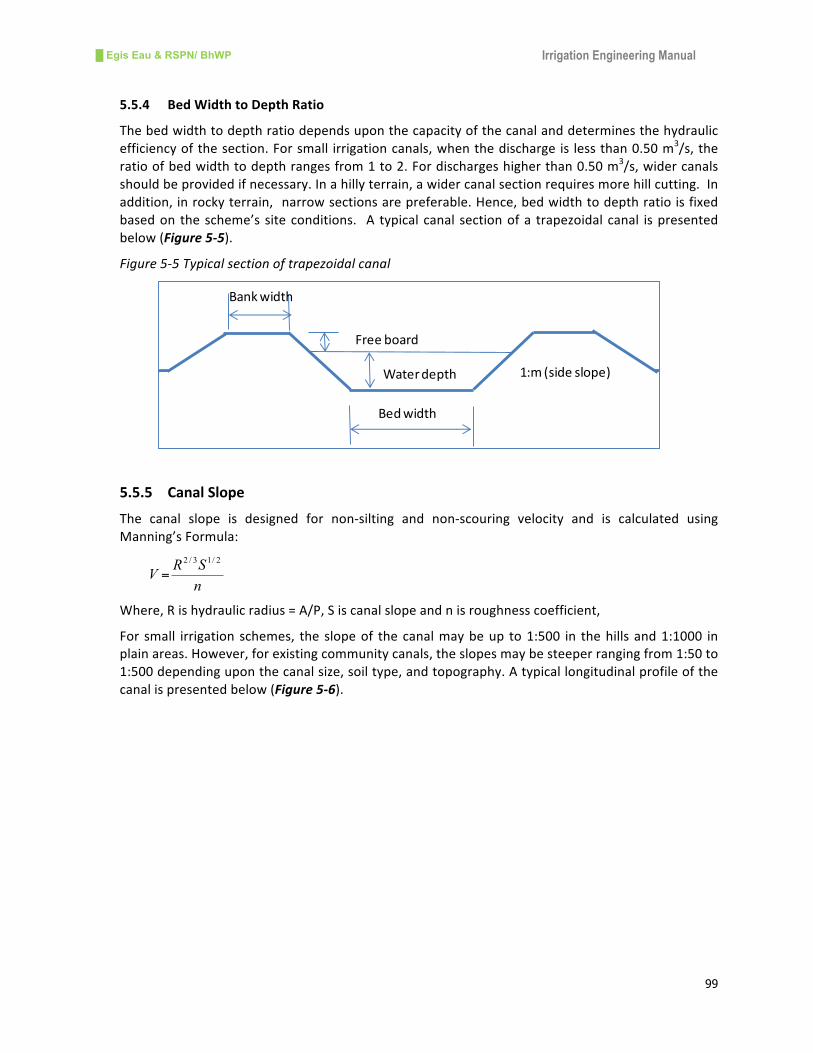
█ Egis Eau & RSPN/ BhWP Irrigation Engineering Manual
99
5.5.4 BedWidthtoDepthRatio
Thebedwidthtodepthratiodependsuponthecapacityofthecanalanddeterminesthehydraulic
efficiencyofthesection.Forsmall irrigationcanals,whenthedischargeis lessthan0.50m3/s,the
ratioofbedwidthtodepthrangesfrom1to2.Fordischargeshigherthan0.50m3/s,widercanals
shouldbeprovidedifnecessary.Inahillyterrain,awidercanalsectionrequiresmorehillcutting.In
addition,inrockyterrain,narrowsectionsarepreferable.Hence,bedwidthtodepthratioisfixed
basedon thescheme’s siteconditions. A typical canal sectionofa trapezoidal canal ispresented
below(Figure5-5).
Figure5-5Typicalsectionoftrapezoidalcanal
5.5.5 CanalSlope
The canal slope is designed for non-silting and non-scouring velocity and is calculated using
Manning’sFormula:
n
SRV
2/13/2
=
Where,Rishydraulicradius=A/P,Siscanalslopeandnisroughnesscoefficient,
For small irrigation schemes, the slopeof thecanalmaybeup to1:500 in thehills and1:1000 in
plainareas.However,forexistingcommunitycanals,theslopesmaybesteeperrangingfrom1:50to
1:500dependinguponthecanalsize,soiltype,andtopography.Atypicallongitudinalprofileofthe
canalispresentedbelow(Figure5-6).
Bedwidth
1:m(sideslope)Waterdepth
Freeboard
Bankwidth

█ Egis Eau & RSPN/ BhWP Irrigation Engineering Manual
100
Figure5-6Typicallongitudinalprofileofcanal
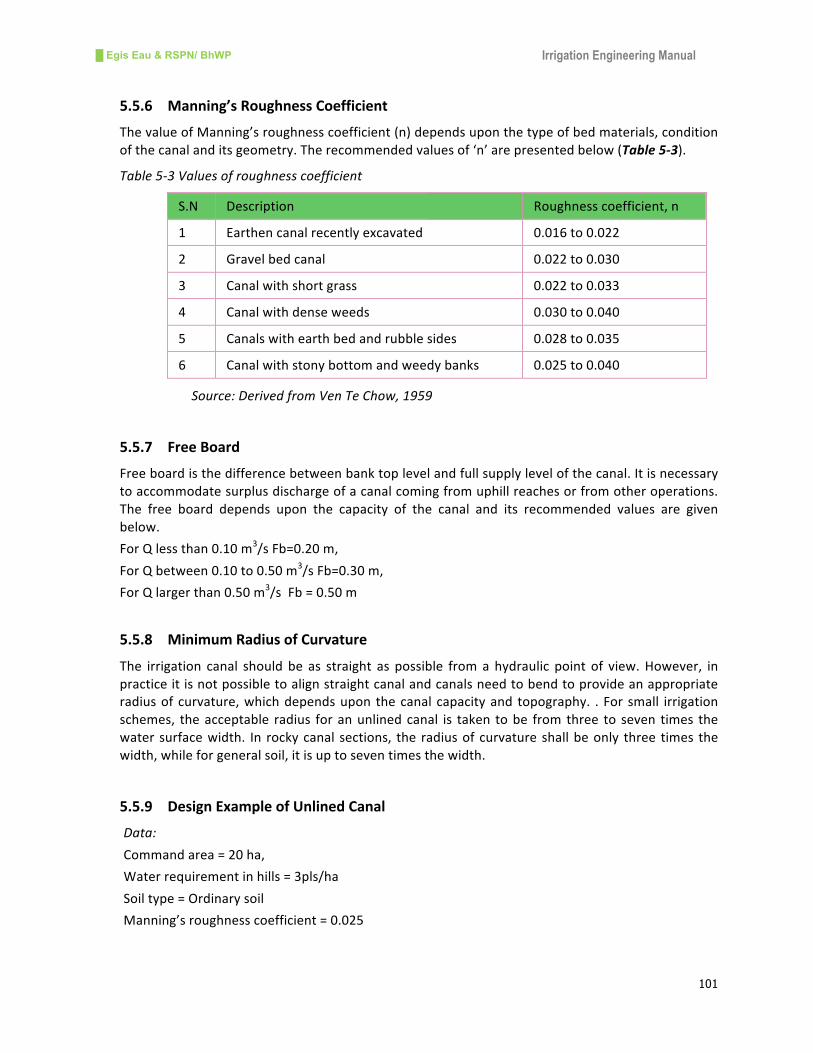
█ Egis Eau & RSPN/ BhWP Irrigation Engineering Manual
101
5.5.6 Manning’sRoughnessCoefficient
ThevalueofManning’sroughnesscoefficient(n)dependsuponthetypeofbedmaterials,condition
ofthecanalanditsgeometry.Therecommendedvaluesof‘n’arepresentedbelow(Table5-3).
Table5-3Valuesofroughnesscoefficient
S.N Description Roughnesscoefficient,n
1 Earthencanalrecentlyexcavated 0.016to0.022
2 Gravelbedcanal 0.022to0.030
3 Canalwithshortgrass 0.022to0.033
4 Canalwithdenseweeds 0.030to0.040
5 Canalswithearthbedandrubblesides 0.028to0.035
6 Canalwithstonybottomandweedybanks 0.025to0.040
Source:DerivedfromVenTeChow,1959
5.5.7 FreeBoard
Freeboardisthedifferencebetweenbanktoplevelandfullsupplylevelofthecanal.Itisnecessary
toaccommodatesurplusdischargeofacanalcomingfromuphillreachesorfromotheroperations.
The free board depends upon the capacity of the canal and its recommended values are given
below.
ForQlessthan0.10m3/sFb=0.20m,
ForQbetween0.10to0.50m3/sFb=0.30m,
ForQlargerthan0.50m3/sFb=0.50m
5.5.8 MinimumRadiusofCurvature
The irrigation canal should be as straight as possible froma hydraulic point of view.However, in
practiceitisnotpossibletoalignstraightcanalandcanalsneedtobendtoprovideanappropriate
radiusof curvature,whichdependsupon thecanal capacityand topography. . For small irrigation
schemes, theacceptable radius foranunlinedcanal is taken tobe from three to seven times the
water surfacewidth. In rockycanal sections, the radiusof curvatureshallbeonly three times the
width,whileforgeneralsoil,itisuptoseventimesthewidth.
5.5.9 DesignExampleofUnlinedCanal
Data:
Commandarea=20ha,
Waterrequirementinhills=3pls/ha
Soiltype=Ordinarysoil
Manning’sroughnesscoefficient=0.025

█ Egis Eau & RSPN/ BhWP Irrigation Engineering Manual
102
Calculation:
Determinedesigndischarge(Q)=commandareaxwaterrequirement=20*3=60lps=0.06m3/s
Forordinarysoiltakesideslope(m)=1:1
Determinebedwidthtodepthratio(r)=1
Assumebedwidth,B=0.20m
Adoptslopeofcanalas1:100asperexistingconditions,
Calculatedepthofflow,D=r*B=0.20m
Calculatecrosssectionalarea, 2mDBDA += =0.20*0.20+1*0.20^2=0.08m
2,
Calculatewettedperimeterofflow, ( )212 mDBP ++= =0.20+2*0.20*sqrt(1+1^2)=0.77m
Calculatehydraulicradius,R=A/P=0.08/0.77=0.10m
Calculatevelocityofflow, 2/13/21SR
nV ×= =1/0.025*0.10^2/3*(1/100)^1/2=0.89m/s
Calculatedischarge,Q=AxV=0.08*0.89=0.071m3/swhichisgreaterthandesigneddischargeof
0.060m3/s,
The velocity of flow is slightly higher than the permissible for earthen canal, however itmay be
suitableforexistingsiteconditionhavinghardclayorrockybed,
Calculatetractiveforce,T=CWRS=1*1000*0.10*1/100=1.04kg/m2whichisinpermissiblelimit,
Hence,designofunlinedcanalisacceptableandparametersare:
Bedwidth=0.20m,
Waterdepth=0.20m,
Freeboard=0.10m,
Canaldepth=0.30m
Sideslope(V:H)=1:1
Longitudinalslope=1/100
ThedesignofcanalsectionisusuallycarriedoutinExcelsheetwithtrialanderrormethod.
5.6 LiningofCanals
5.6.1 PurposeofLining
Canal lining is themethodofsealingthecanalsurfacetopreventseepageand leakagefrom
the section. In addition, canal lining supports unstablebanks andprevents erosion in steep
sections of the canal. Lining is often a major demand of farmers in the rehabilitation of
existing schemesor in the constructionofnew schemes.Theneed forand the typeof canal
lining should be carefully considered during the planning and design stages and wherever
practicallowercostalternativesshouldbeseriouslyconsidered.
5.6.2 TypeofCanalLining
i. DryStoneLining
Drystoneliningiscommoninhillyareaswherestonesareeasilyavailableandwaterisabundantat
thesource.This liningismainlytoprotectagainsterosionandisnoteffectiveforseepagecontrol.

█ Egis Eau & RSPN/ BhWP Irrigation Engineering Manual
103
Thethicknessoftheliningdependsuponthesizeoftheavailablestonesandrangesfrom20cmto
50cm.Atthedownhillsideofthecanal,drystoneretainingwallsareusedaspartofcanalliningto
stabilizethebankandprotectsoilerosion.
ii. StoneMasonryLining
Stonemasonry lining is themost commonly used lining in the hills and foothill areas. Due to its
effectiveness inpreventingseepageanderosion, it iswidelyusedwherestonesareavailable.The
recommendedthicknessoftheliningrangesfrom30cmto50cmin1:4cementsandmortar.For
smallschemes,liningcanoftenbemadewithdressedstone,butselectedundressedriverstoneswill
be cheaper inmost cases. The inner sides of themasonry liningmaybeplasteredwith sand and
cementmortar,butthis isnotrecommendedforsmallschemes. Insomecases,theinnerbankof
themasonryliningisonlymadewithdrystonesasthisallowsdrainageintothecanalfromuphill.A
stonemasonryliningwiththeconcretebedisthemostcommonformofcanallining.However,due
toqualityofworksinthehills,thesustainabilityofstonemasonryliningisinquestion.
Figure5-7Typicalstonemasonryandconcretelining
Stonemasonrylining Concretelining
iii. ConcreteLining
Cementconcreteliningisthemosteffectivemeansofcanalliningasitpreventscanalseepageand
leakage. Depending upon the workmanship, the roughness coefficient of a concrete lining is
significantly low incomparison tostonemasonry lining,whichallowshigherdischarge inasimilar
section.Concrete liningmaybeplaincementconcrete liningor reinforcedcementconcrete lining
dependingupon the typeof canal tobe linedand thenatureof theproject. The thicknessof the
concrete lining varies from 7.50 cm to 15 cm depending upon the capacity of the canal and the
objectiveofthelining.Forlargecanals,trapezoidalsectionissuitableforconcreteliningwhilefor
small canals, rectangular sections are popularly used in the hills. In addition, concrete liningwith
nominalreinforcementorwithGIwiresisrecommendedaslowcostcanalliningsolutionsforsmall
irrigationschemes.
iv. SoilCementLining
Soilcementliningisalowcostcanal liningtechnologyandisrarelyusedinirrigationcanals.It isa
mixtureofredsoilandcementwith7partssoilandonepartcement.Themortarofthesoilcement
isappliedtothesurfaceofthecanalascementplasterintwotothreelayers.Thethicknessofone

█ Egis Eau & RSPN/ BhWP Irrigation Engineering Manual
104
layerofplastermaybe2to3cm.Afterplastering,curingisalsoimportantandtheliningshouldbe
coveredandkeptmoistforafewdays.Thistypeofliningiseffectiveinseepagecontrolbutcanbe
damagedbycattlemovementsandothererosion.Soilcementliningisthemosteconomicalliningin
anirrigationproject.
Figure5-8Ferrocementandsoil-cementlinings
Ferrocementlining Soilcementlining
v. FerroCementLining
Ferro cement is a thinwall reinforced concretemade up ofwiremesh, sand, and cementwhich
possesses strength and serviceability. The mixture of cement with pie gravel is placed over the
thoroughly compacted surface of canal laid with plastic sheet and chicken mesh wire. Nominal
reinforcementisalsoprovidedifnecessary.Thistypeofliningiscostlierthanmasonrylining,butis
durableandeffectivetocontrolseepageandleakage.
vi. PlasticLining
Plastic lining is usedwhere the alignment of the canal falls in unstable areas like those prone to
landslides.Amembraneconsistingofasufficientlythickplasticsheetislaidontheproperlyleveled
surfaceofthecanalandacoverofdrystoneorsoil isprovidedtoprotect it fromminorpuncture
and tear. Plastic lining isquiteeffective for seepage control, is economical andeasy to construct.
Thethicknessoftheplasticsheetmaybe200to300micronsorequivalent(0.25mmto0.50mm).
Plasticliningispronetodamageandtemporaryinnature.
vii. SlateLining
Slate lining is a special type of canal lining usedwhere slates are available. This type of lining is
suitableinmountainswheresoilsareerosiveincanalbed.Thisliningiseffectiveforseepagewhen
usedwith cementmortar pointing and cheaper than other types of linings. The thickness of the
liningmaybe10cmto50cmdependinguponthethicknessofslates.
Inshort,cementconcrete lining is themostsustainable typeof liningcomparedtoother typesof
lining,andhenceitisrecommendedtouseeveninsmallcanals.
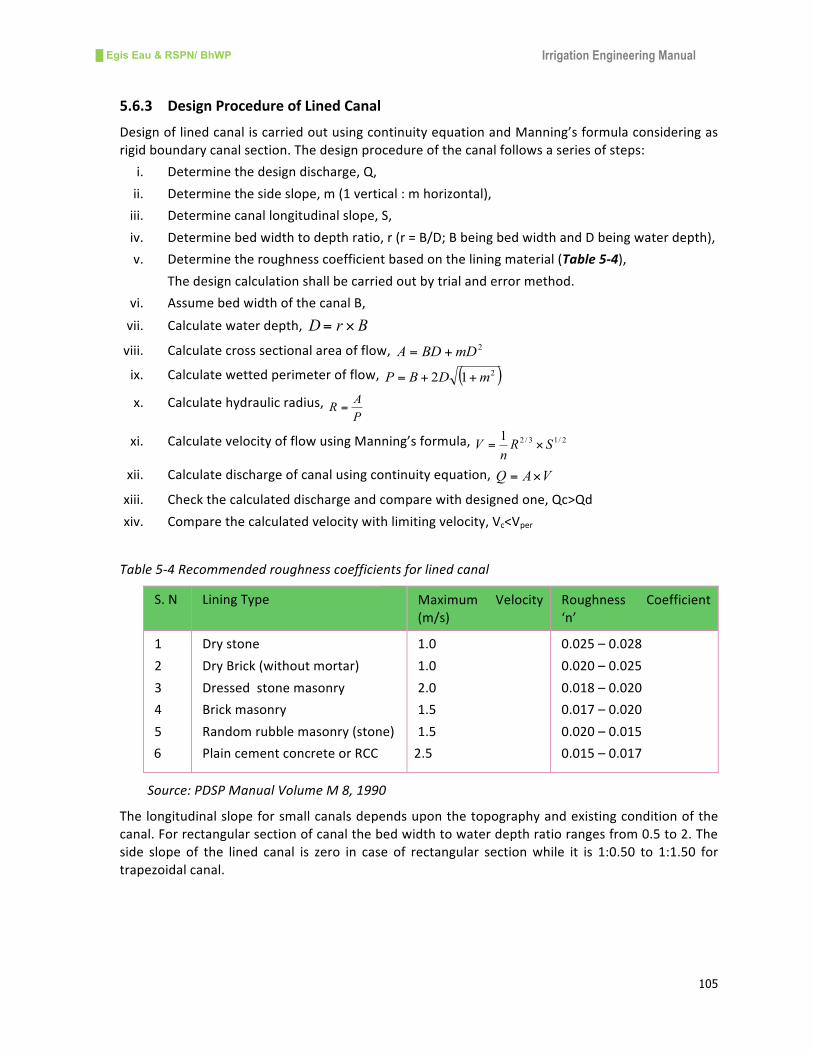
█ Egis Eau & RSPN/ BhWP Irrigation Engineering Manual
105
5.6.3 DesignProcedureofLinedCanal
DesignoflinedcanaliscarriedoutusingcontinuityequationandManning’sformulaconsideringas
rigidboundarycanalsection.Thedesignprocedureofthecanalfollowsaseriesofsteps:
i. Determinethedesigndischarge,Q,
ii. Determinethesideslope,m(1vertical:mhorizontal),
iii. Determinecanallongitudinalslope,S,
iv. Determinebedwidthtodepthratio,r(r=B/D;BbeingbedwidthandDbeingwaterdepth),
v. Determinetheroughnesscoefficientbasedontheliningmaterial(Table5-4),
Thedesigncalculationshallbecarriedoutbytrialanderrormethod.
vi. AssumebedwidthofthecanalB,
vii. Calculatewaterdepth, BrD ×=
viii. Calculatecrosssectionalareaofflow, 2mDBDA +=
ix. Calculatewettedperimeterofflow, ( )212 mDBP ++=
x. Calculatehydraulicradius,P
AR =
xi. CalculatevelocityofflowusingManning’sformula, 2/13/21SR
nV ×=
xii. Calculatedischargeofcanalusingcontinuityequation, VAQ ×=
xiii. Checkthecalculateddischargeandcomparewithdesignedone,Qc>Qd
xiv. Comparethecalculatedvelocitywithlimitingvelocity,Vc<Vper
Table5-4Recommendedroughnesscoefficientsforlinedcanal
S.N LiningType Maximum Velocity
(m/s)
Roughness Coefficient
‘n’
1
2
3
4
5
6
Drystone
DryBrick(withoutmortar)
Dressedstonemasonry
Brickmasonry
Randomrubblemasonry(stone)
PlaincementconcreteorRCC
1.0
1.0
2.0
1.5
1.5
2.5
0.025–0.028
0.020–0.025
0.018–0.020
0.017–0.020
0.020–0.015
0.015–0.017
Source:PDSPManualVolumeM8,1990
Thelongitudinalslopeforsmallcanalsdependsuponthetopographyandexistingconditionofthe
canal.Forrectangularsectionofcanalthebedwidthtowaterdepthratiorangesfrom0.5to2.The
side slope of the lined canal is zero in case of rectangular sectionwhile it is 1:0.50 to 1:1.50 for
trapezoidalcanal.
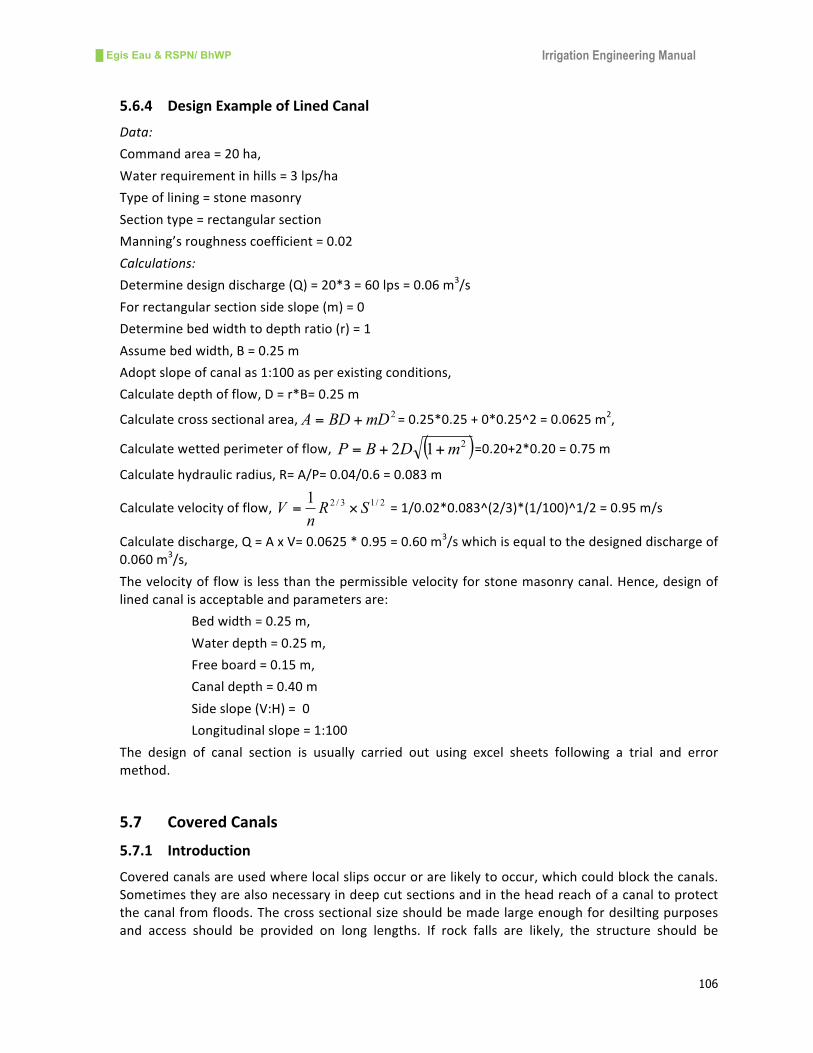
█ Egis Eau & RSPN/ BhWP Irrigation Engineering Manual
106
5.6.4 DesignExampleofLinedCanal
Data:
Commandarea=20ha,
Waterrequirementinhills=3lps/ha
Typeoflining=stonemasonry
Sectiontype=rectangularsection
Manning’sroughnesscoefficient=0.02
Calculations:
Determinedesigndischarge(Q)=20*3=60lps=0.06m3/s
Forrectangularsectionsideslope(m)=0
Determinebedwidthtodepthratio(r)=1
Assumebedwidth,B=0.25m
Adoptslopeofcanalas1:100asperexistingconditions,
Calculatedepthofflow,D=r*B=0.25m
Calculatecrosssectionalarea,2
mDBDA += =0.25*0.25+0*0.25^2=0.0625m2,
Calculatewettedperimeterofflow, ( )212 mDBP ++= =0.20+2*0.20=0.75m
Calculatehydraulicradius,R=A/P=0.04/0.6=0.083m
Calculatevelocityofflow,2/13/21
SRn
V ×= =1/0.02*0.083^(2/3)*(1/100)^1/2=0.95m/s
Calculatedischarge,Q=AxV=0.0625*0.95=0.60m3/swhichisequaltothedesigneddischargeof
0.060m3/s,
Thevelocityofflowis lessthanthepermissiblevelocityforstonemasonrycanal.Hence,designof
linedcanalisacceptableandparametersare:
Bedwidth=0.25m,
Waterdepth=0.25m,
Freeboard=0.15m,
Canaldepth=0.40m
Sideslope(V:H)=0
Longitudinalslope=1:100
The design of canal section is usually carried out using excel sheets following a trial and error
method.
5.7 CoveredCanals
5.7.1 Introduction
Coveredcanalsareusedwherelocalslipsoccurorarelikelytooccur,whichcouldblockthecanals.
Sometimestheyarealsonecessaryindeepcutsectionsandintheheadreachofacanaltoprotect
thecanalfromfloods.Thecrosssectionalsizeshouldbemadelargeenoughfordesiltingpurposes
and access should be provided on long lengths. If rock falls are likely, the structure should be
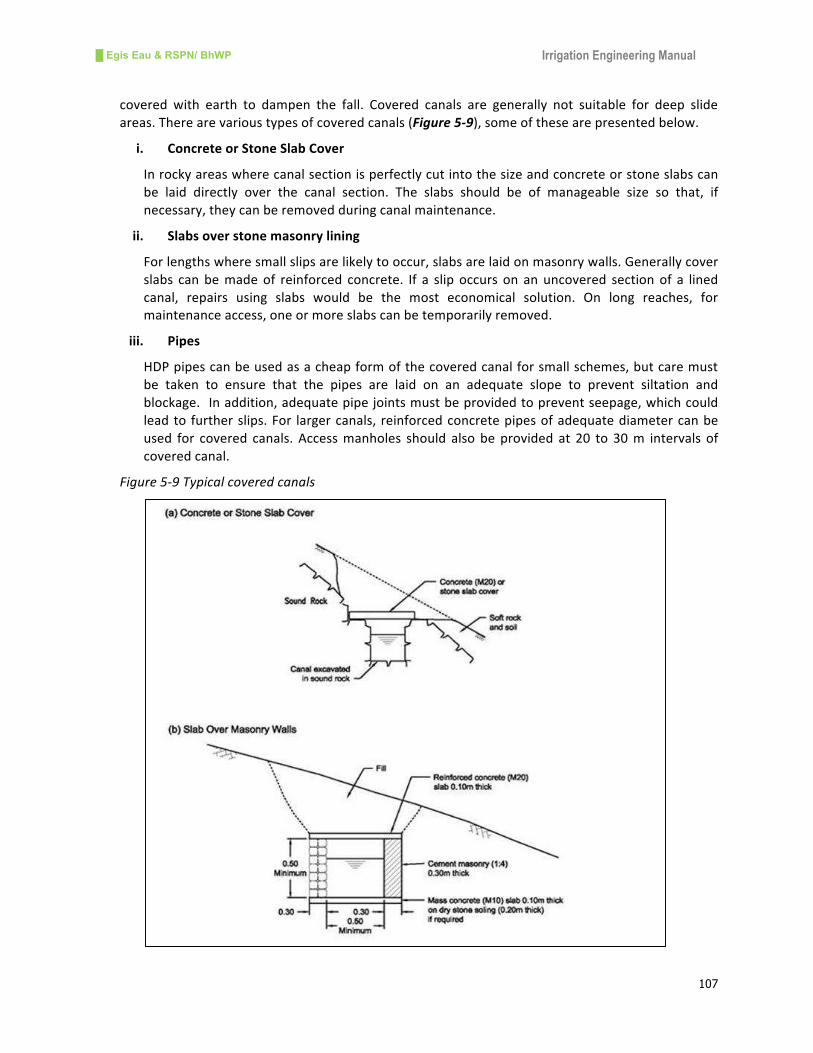
█ Egis Eau & RSPN/ BhWP Irrigation Engineering Manual
107
covered with earth to dampen the fall. Covered canals are generally not suitable for deep slide
areas.Therearevarioustypesofcoveredcanals(Figure5-9),someofthesearepresentedbelow.
i. ConcreteorStoneSlabCover
Inrockyareaswherecanalsectionisperfectlycutintothesizeandconcreteorstoneslabscan
be laid directly over the canal section. The slabs should be of manageable size so that, if
necessary,theycanberemovedduringcanalmaintenance.
ii. Slabsoverstonemasonrylining
Forlengthswheresmallslipsarelikelytooccur,slabsarelaidonmasonrywalls.Generallycover
slabs canbemadeof reinforced concrete. If a slip occurs on anuncovered sectionof a lined
canal, repairs using slabs would be the most economical solution. On long reaches, for
maintenanceaccess,oneormoreslabscanbetemporarilyremoved.
iii. Pipes
HDPpipescanbeusedasacheapformofthecoveredcanalforsmallschemes,butcaremust
be taken to ensure that the pipes are laid on an adequate slope to prevent siltation and
blockage.Inaddition,adequatepipejointsmustbeprovidedtopreventseepage,whichcould
leadto furtherslips.For largercanals, reinforcedconcretepipesofadequatediametercanbe
used for covered canals. Accessmanholes should also beprovided at 20 to 30m intervals of
coveredcanal.
Figure5-9Typicalcoveredcanals

█ Egis Eau & RSPN/ BhWP Irrigation Engineering Manual
108
5.7.2 DesignConcept
Coveredcanalsaregenerallydesignedtobefreeflowingopenchannelslikelinedcanalsections.For
thehydrauliccomputation,Manning’sformula,whichwasalreadydescribedinprevioussections,is
used.Thevelocityofwatershouldbekeptapproximately1m/sandfreeboardshouldbesufficient
(atleast0.20m).Thewaterdepthinthepipesshouldbekeptas2/3ofthediameterofthepipe.For
smallscaleschemes,HDPpipesmayrunfull.Headlossesinthetransitionbetweentheopencanal
andthecoveredcanalneedtobeconsidered,whicharecalculatedas:
( )g
VVCiHi
p
2
22
−=
( )g
VVCoHo
p
2
22
−=
Where,Hi,Hoaretheheadlossesattheinletandoutletrespectivelyinm,
Ci,Coarelosscoefficientsfortheinletandoutlet;
Vpisthevelocityinthecoveredsectioninm/s,
Visthevelocityintheopencanalinm/s,
gistheaccelerationduetogravity=9.81m/s2
The value of Ci and Co is different for different types of transitions. The values for some of the
transitionsareaspresentedhere (Table5-5).ThemostpracticalvaluesofCiandCoare0.50and
1.00respectively.
Table5-5Coefficientsforinletandoutletofdifferenttransitions
S.N Typeoftransition Ci Co
1 Culvertpipeterminatesinheadwallacrosschannel 0.50 1.00
2 Headwall with rounded transition of which the radius
exceeds0.1timesthedepthofwater
0.25 0.50
3 Brokenbacktransitionwithflareangleofabout1:5 0.20 0.40
Largediameterpipesaregenerallyflowpartfullincoveredcanals.Thefollowingtablepresentsthe
hydraulicpropertiesofthepipesflowingpartfull(Table5-6).
Table5-6Hydraulicpropertiesofpartfullflowingpipe
Waterdepth
frominvert
Wettedarea(A) Wetted
perimeter(P)
Hydraulic
radius(R)
Watersurface
width(Ws)
0.10d 0.04d2 0.64d 0.063d 0.6000d
0.20d 0.11d2 0.93d 0.118d 0.8000d
0.30d 0.20d2 1.16d 0.172d 0.9165d
0.40d 0.29d2 1.37d 0.212d 0.9798d
0.50d 0.39d2 1.57d 0.250d 1.0000d
0.60d 0.49d2 1.77d 0.277d 0.9798d
0.70d 0.58d2 1.98d 0.293d 0.9165d

█ Egis Eau & RSPN/ BhWP Irrigation Engineering Manual
109
Waterdepth
frominvert
Wettedarea(A) Wetted
perimeter(P)
Hydraulic
radius(R)
Watersurface
width(Ws)
0.80d 0.67d2 2.21d 0.303d 0.8000d
5.7.3 DesignExamplesofCoveredCanal(PipedCanal)
i. Case-IPipeflowingfull
Data:
Discharge,Q=100l/s
Velocityincanal=0.50m/sec.
Pipetype=HDP
Length=70m
2bendsat45oradius=2*diameter
Availableheaddifference=2.0m
Calculations:
Basedonthedesigndischargeandpipetypeselectsizeofthepipe,
FromHDPpipefrictionchart(Figure5-11)select250mmdiameterpipe,
CalculatethecrosssectionareaofthepipeA=πD2/4=3.14*0.25^2/4=0.049m
2
Calculatethevelocityofflow,V=Q/A=0.1/0.049=2.05m/s,acceptableforHDPpipe
Determinefrictionlossfromgraph(Figure5-11),frictionlossis1.10mfor100mlength,
Calculatefrictionlossfor70mlengthofpipe,frictionheadlosshf=70x1.1/100=0.77m
Headlossatentryandexit,( )
g
VVhe
2
5.12
12
22−
= =1.5[2.052–0.5
2]/19.62=0.32m
Headlossatpipebends,g
Vfh bb2
2
= =0.09x2.052/19.62=0.02m
Fortwobendsheadloss,hb=0.02x2=0.04m
Therefore,totalheadloss=0.77+0.32+0.04=1.13m<2m
Thetotalheadlossislessthanavailableleveldifferenceandhencedesignisacceptable.
ii. Case-IIPipeflowingpartfull
Data:
Discharge =200l/s
Depth =0.5m
Pipetype =concrete
Length =150m
Velocityincanal =0.5m/s
Manning’sn =0.015
Simpleheadwallforentranceandexitofthepipe

█ Egis Eau & RSPN/ BhWP Irrigation Engineering Manual
110
Calculations:
Velocityistobekeptbelow3.0m/s
Thepipewillflowwithminimumof0.20diameterfreeboard.
FromTable5-6areaforwaterdepthof0.8diameter=0.67d2
Calculateminimumflowareinthepipewiththevelocitylimit,A=Q/Vmax
Q=200l/s=0.20m3/sandVmax=3m/s;thenA=0.2/3.0=0.067m
2
And,hence,0.67d2=0.067
Thediameterofpipe,d=0.315m
Requireddiameter=0.315m
Use350mmdiameterpipeasnextavailablesize,
Calculatetheactualvelocityofflowinpipe,V=Q/A=0.2/(0.67Xd2)=0.2/(0.67X0.35
2)
V=2.44m/s
Beforeproceedingwiththecalculationoflosses,checkthepipeinletsettinginrelationtothecanal
depth,
Canaldepth=0.5m
Pipediameter=0.35m
Ifpipeinvertissetatcanalbedlevel,thenwaterdepthaboveinvert=0.5m.Thisisabout1.4times
thepipediameter. Thepipe shall submergewhenwaterdepth is greater than1.2 times thepipe
diameter.Toavoidsubmergence,thepipeinvertwouldhavetobesetabovecanalbedlevelwhich
is not satisfactory for sediment transport. Therefore, increasepipediameter to 0.6m inorder to
matchthecanaldepthandsetinvertofpipeatbedlevel.
Calculatetheslopeofthepipefromformula:
2/13/21
SRn
V = or3/4
22
R
VnS =
Fordepthofflow=0.8xdiameter,hydraulicdepthR=0.303d
Areaofflow,A=0.67d2 =0.67x0.60^2=0.24m
2
Hydraulicradius,R=0.303d=0.303x0.60=0.182m
Velocityofflow,V=Q/A=0.20/0.24=0.83m/s
Slopeofthepipe,S=(0.0152x0.832)/(0.1824/3)=0.0015
Headloss=Sxlength=0.0015X150=0.23m
Forentryandexitlosses,Ci=0.50andCo=1.0
Losses=[1.5(Vp2–V2)]/2g=[1.5(0.832–0.5
2)]/19.62=0.03m
Totalheadloss=0.23+0.03=0.26m
Setoutlettoensurethatthepipeisnotsubmerged.Allow0.2xdiametersasfreeboardi.e.,setpipe
invertat(downstreamwaterlevel–0.8xdiameters).
TheFroudenumberinpipeflowingpartfull(andcoveredcanals)shouldbekeptbelow0.55toavoid
standingwaves.TheFroudenumberiscalculatedfromformula:
F=[αV2/(g.dm)]0.5
Where,dm=flowareainsqm/watersurfacewidthinm,

█ Egis Eau & RSPN/ BhWP Irrigation Engineering Manual
111
HereV=0.83m/s
dm=0.67d2/0.8d=0.536xd=0.32m
Andthen,F=0.83^2/(9.81x0.32)^1/2=0.39<0.55
Hence,designisacceptable.

█ Egis Eau & RSPN/ BhWP Irrigation Engineering Manual
112
Figure5-10Designchartforconcretepipes
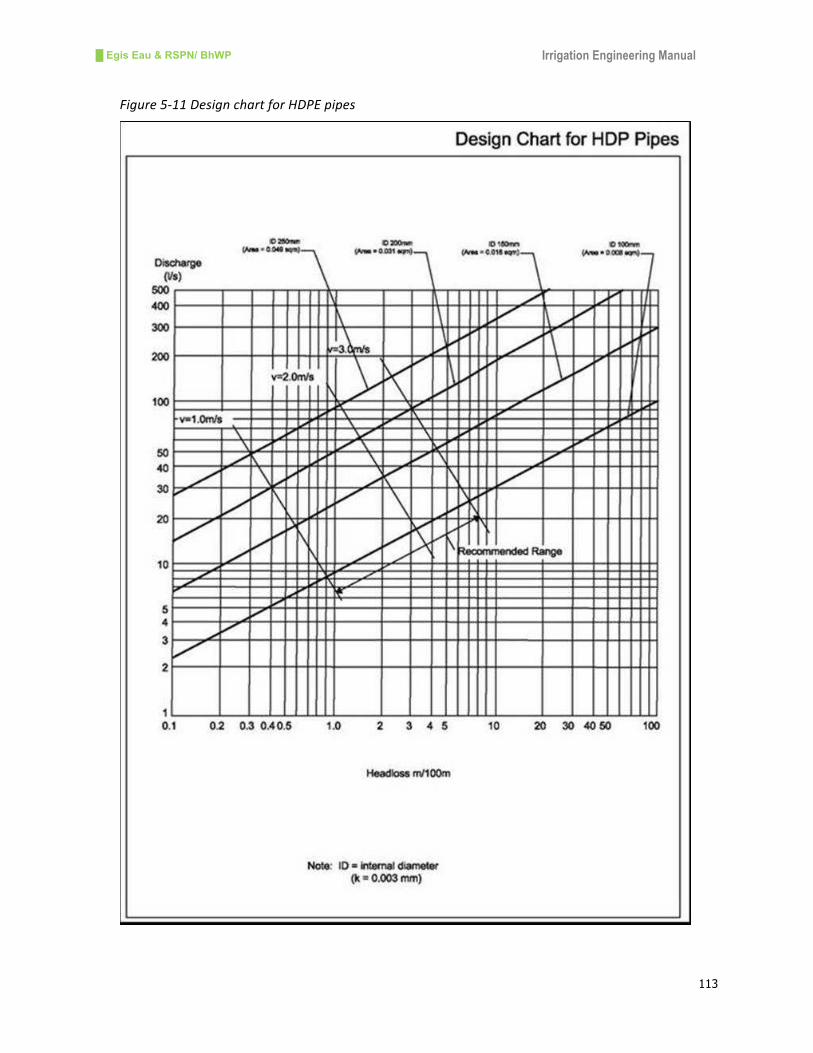
█ Egis Eau & RSPN/ BhWP Irrigation Engineering Manual
113
Figure5-11DesignchartforHDPEpipes
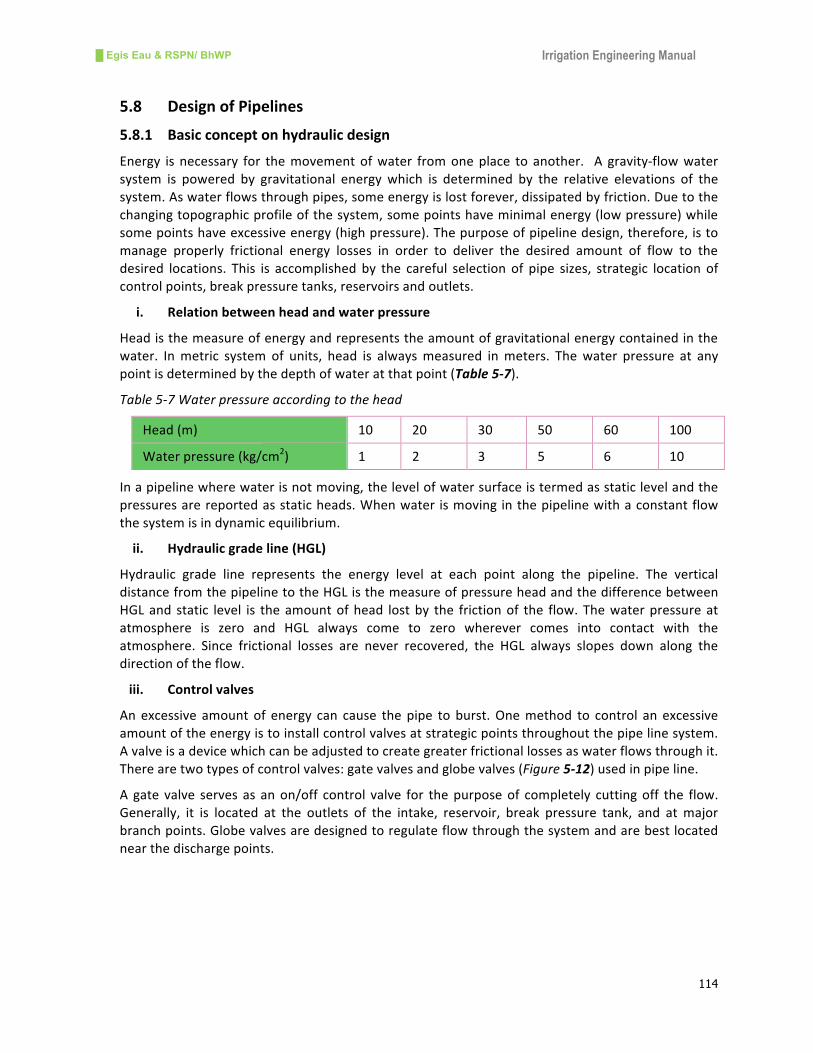
█ Egis Eau & RSPN/ BhWP Irrigation Engineering Manual
114
5.8 DesignofPipelines
5.8.1 Basicconceptonhydraulicdesign
Energy is necessary for themovementofwater fromoneplace to another. A gravity-flowwater
system is powered by gravitational energywhich is determined by the relative elevations of the
system.Aswaterflowsthroughpipes,someenergyislostforever,dissipatedbyfriction.Duetothe
changingtopographicprofileofthesystem,somepointshaveminimalenergy(lowpressure)while
somepointshaveexcessiveenergy(highpressure).Thepurposeofpipelinedesign,therefore,isto
manage properly frictional energy losses in order to deliver the desired amount of flow to the
desired locations. This is accomplished by the careful selection of pipe sizes, strategic location of
controlpoints,breakpressuretanks,reservoirsandoutlets.
i. Relationbetweenheadandwaterpressure
Headisthemeasureofenergyandrepresentstheamountofgravitationalenergycontainedinthe
water. Inmetric system of units, head is alwaysmeasured inmeters. Thewater pressure at any
pointisdeterminedbythedepthofwateratthatpoint(Table5-7).
Table5-7Waterpressureaccordingtothehead
Head(m) 10 20 30 50 60 100
Waterpressure(kg/cm2) 1 2 3 5 6 10
Inapipelinewherewaterisnotmoving,thelevelofwatersurfaceistermedasstaticlevelandthe
pressuresarereportedasstaticheads.Whenwater ismoving inthepipelinewithaconstantflow
thesystemisindynamicequilibrium.
ii. Hydraulicgradeline(HGL)
Hydraulic grade line represents the energy level at each point along the pipeline. The vertical
distancefromthepipelinetotheHGListhemeasureofpressureheadandthedifferencebetween
HGLand static level is theamountofhead lostby the frictionof the flow.Thewaterpressureat
atmosphere is zero and HGL always come to zero wherever comes into contact with the
atmosphere. Since frictional losses are never recovered, the HGL always slopes down along the
directionoftheflow.
iii. Controlvalves
Anexcessive amountof energy can cause thepipe to burst.Onemethod to control an excessive
amountoftheenergyistoinstallcontrolvalvesatstrategicpointsthroughoutthepipelinesystem.
Avalveisadevicewhichcanbeadjustedtocreategreaterfrictionallossesaswaterflowsthroughit.
Therearetwotypesofcontrolvalves:gatevalvesandglobevalves(Figure5-12)usedinpipeline.
A gate valve serves as anon/off control valve for thepurposeof completely cuttingoff the flow.
Generally, it is located at the outlets of the intake, reservoir, break pressure tank, and atmajor
branchpoints.Globevalvesaredesignedtoregulateflowthroughthesystemandarebestlocated
nearthedischargepoints.

█ Egis Eau & RSPN/ BhWP Irrigation Engineering Manual
115
Figure5-12Gateandglobevalves
GateValve GlobeValve
iv. Frictionalheadloss
Any obstruction to the flow, partial or otherwise, causes frictional losses of the energy. The
magnitude of the energy lost due to the friction against some obstacle is determined by several
factors.Themajorfactorswouldbetheroughnessoftheobstacleandthevelocityoftheflowwhile
minorfactorswouldincludewatertemperature,suspendedparticlesetc.Thediameterofthepipe
andtheamountofflowthroughitdeterminesthevelocityofflow.Thegreatertheflow,thefasteris
thevelocity,andthegreaterthefrictionallosses.Likewise,therougherthesurfaceoftheobstacle,
the greater is the frictional losses. Frictional head losses are provided by pipemanufacturers for
bothHDPandGIpipes.
Frictional head losses of flow through fittings such as elbows, reducers, tees, valves etc are
calculated using various formulas and coefficients. In small scale pipeline design, these frictional
headlossesareavailableasequivalentpipelengths.Theamountofheadlossinthefittingsdepends
upon the shape of the fitting and the flow through it. Head losses are computed with the
determinationoftheequivalent lengthofpipenecessarytocreatethesameamountofheadloss.
Thelengthstodiameter(L/D)ratioforvariousfittingsaregivenhere(Table5-8).
Table5-8Lengthtodiameterratioofdifferentfittings
S.N Fittings L/Dratio
1 Tee(run-side) 68
2 Tee(run-run) 27
3 Elbow(90o) 33
4 Union 7
5 Gatevalve 7
6 Freeentrance 29
7 Screenedentrance 150

█ Egis Eau & RSPN/ BhWP Irrigation Engineering Manual
116
v. Maximumpressurelimits
Maximumpressure limitsareconsideredwhenselectingpipematerialsandtypetowithstandthe
highestpossiblepressurethanoccursinthepipeline.Foragravitysystem,theworstscenarioisfor
pressureduringshut-offconditions.Class IIIHDPpipeshavemaximumpressure limitsof6kg/cm2
whichmean60metersofhead.ClassIVHDPpipeshavemaximumpressurelimitsof10kg/cm2for
theuse in100metersofhead.Class IVpipeshavehigherwall thicknesswhichwithstandsgreater
pressures.GalvanizedIron(GI)pipescanwithstand25kg/cm2ofpressure,meaning250metersof
head. To limit themaximumpressure, breakpressure tanks couldbe constructed along themain
pipeline.
vi. Minimumpressurelimits
The pressure in the pipe along the section where HGL is underground is a negative pressure.
Negative pressure in the pipe needs to be avoided for the proper design of the system. It is
recommendedtoalignHGL10metersabovethegroundleveltohavetheminimumpressurelimit.
Inanycase,HGLisnotallowedtogoundergroundatall.
vii. Velocitylimits
The velocity of flow through the pipeline is also an important consideration in the design of a
pipeline.Ifthevelocityistoohigh,theflowcancauseexcessiveerosionofthepipe,whileifitistoo
low,itcancreatecloggingofthepipeline.Therecommendedvelocitylimitsare3.0m/s(maximum)
to0.70m/s(minimum).
viii. Air-blocksandwashouts
Anair-block isabubbleofairtrappedinthepipelinewhosesize issuchthat it interfereswiththe
flow ofwater through the section.Whenwater is allowed to fill or refill the pipeline, air cannot
escape from certain section and is trapped. The proper design canminimize the trapped air and
potentialair-blocksby:
• Arrangingpipe sizes tominimize frictionalhead lossbetween the sourceand the first air-
block,
• Usinglargersizepipeatthetopandsmallersizeatthebottomofthecriticalsections,
• Eliminatingorminimizinghigherair-blockswhichareclosertothestaticlevel,
• Providingairvalves,
Atypicallayoutofpipelineispresentedforreference(Figure5-13)
ix. Airvalves
Airvalvesareautomaticairreleasedevices,whichreleasesaccumulatedairpressureofthepipeline.
Inmains,airvalvesaremostlyplacedatcriticalplaces.Astructureconstructedtolocatethevalveis
referred as valve chamber. The typical examples of air valves are presented in Figure 5-14 and
typicalplanofthevalvechamberarepresentedin Figure5-16.

█ Egis Eau & RSPN/ BhWP Irrigation Engineering Manual
117
Figure5-13Typicallayoutofpipeline
x. Washouts
WashoutsarelocatedatthebottompointsofthemajorU-profiles,especiallythoseupstreamfrom
thereservoirtank.ThewashoutsarethegatevalvemountedontheTeebranchtoamainline.The
number of washouts in the system depends upon the type of source, whether, or not there is
sedimentation tank or reservoir, and the velocity of flow through the pipe line. The size of the
washoutpipes shouldbesameas thatof thepipelineat thatpoint.Thesewashoutsare regularly
openedtocleanthepipe.
Figure5-14Typicalairreleasevalves

█ Egis Eau & RSPN/ BhWP Irrigation Engineering Manual
118
xi. Breakpressuretank
A break pressure tank (BPT) is a structure to allow the flow to discharge into the atmosphere,
therebyreducingthehydrostaticpressuretozeroandestablishinganewstaticlevel.ABPTisbuilt
alongthemainpipelineatstrategic locations.Theflowingwater isdischarged inthetankandthe
energyoftheflowingwaterisdissipatedwithappropriatedevicesandwaterisbacktoatmospheric
pressure.TheenergydissipationiscarriedoutwithbafflewallsconstructedspeciallyintheBPT.
Breakpressuretanksareconstructedwithcementconcreteorstonemasonrywithorwithoutfloat
valves.Anoverflowsystemwith thecapacity to remove themaximumquantityofwaterwhich is
likelytooverflowshouldbeincluded(Figure5-15).Theoverflowwatershouldbedisposedinsucha
waythatitwillnotcausesoilerosion.
Figure5-15Typicalplanofbreakpressuretank
5.8.2 DesignConceptofMainPipeline
The basic concept of themain pipeline is to calculate the head losses in different reaches of the
pipeline.Foreachreach,itisnecessarytodeterminethedesiredamountofheadtobeburnedoff
andthelengthofthepipeline,calculatethedesiredfrictionalheadlossfactor,andselectthepipe
sizefromthetable.Whendesigningthepipe,thedesignercanbeginfromthesourceorfromthe
end of the pipeline. It is also necessary to assess the requirement of the reservoir based on the
balancestudyofsupplyanddemand.

█ Egis Eau & RSPN/ BhWP Irrigation Engineering Manual
119
Figure5-16Typicalvalvechamber
5.8.3 Headlossesinpipesandfittings
Thecalculationofheadlossesinthepipesandtheirfittingsisthemostimportantparameterofpipe
line design. Head losses in the pipe line occur due to friction, bends, and sudden expansion and
contractionofpipes.Thecommonlyusedformulasforthecomputationofheadlossduetofriction
are:
• Darcy-Weisbachformula,
• HazenWilliamsformula,
• Manning’sformula,and
• Colebrook-Whiteequation
i. Darcy-Weisbachformula
Darcy-Weisbachisthemostwidelyusedformulainpipelinedesignforshortlengthpipes.
gD
VLh f
2
42
×= λ
Wherehfisthefictionheadlossinm,
λisthefrictioncoefficient,
Listhepipelengthinm,
Disthepipeinsidediameterinm,
Visthevelocityofwaterinm/s,and
Gistheaccelerationduetogravity=9.81m/s2

█ Egis Eau & RSPN/ BhWP Irrigation Engineering Manual
120
Forcastironpipesλ=[0.02+1/(2,000D)]x1.5
Forsteelpipesλ=[0.0144+9.5/(1000√V)]x1.5
Forexactcalculationofλ intermsofReynoldsnumberandrelativeroughnessMoody’sdiagramis
used(Figure5-17).FortheuseofMoody’sdiagramitisnecessarytocalculatetheReynoldsnumber
fromformula:
γ
DVRe=
WhereVistheaveragevelocityofflowinm/s,
Diameterofpipeinm,and
γisthekinematicviscosityofwaterinm2/s
ii. Hazen-William’sFormula
Hazen-William’sformulaiswidelyusedforlongdistancepipelines.
87.485.1
85.167.10
DC
Q
L
h f
×
×=
Wherehfisthefrictionheadlossinm,
Listhepipelengthinm,
Qistheflowrateinm3/s,
CistheflowcoefficientbasedontypeofpipesandisprovidedinTable5-9,
Dispipeinsidediameterinm
Table5-9Hazen-William'sflowcoefficients
Typeofpipe Flow
coefficient(C)
Typeofpipe Flow
coefficient(C)
Newweldedsteelpipe 140 Cementlinepipe 140
Steelpipeafter20yearsuse 100 Asbestoscementpipe 130
Newcastironpipe 130 Pre-stressedconcretepipe 130
Castironpipeafter20yearuse 100 Plasticpipe 150
iii. Manning’sformula
Manning’sformulaisgenerallyusedinopenchannelflowandinculvertsandisgivenby:
3/4
22
R
Vn
L
h f ×=
Wherehfisthefrictionheadlossinm,
Listhepipelengthinm,
nistheroughnesscoefficientandisgiveninTable 5-10,

█ Egis Eau & RSPN/ BhWP Irrigation Engineering Manual
121
Visthevelocityofflowinm/s,and
Risthehydraulicradiusofthepipeandisequaltocrosssectionalareadividedbywettedperimeter
ofthepipeinm,
Table5-10Valuesofpiperoughness
Pipematerial Roughnessk,(mm)
Glass,drawncopper 0.003
Steel 0.05
Asphaltedcastiron 0.12
Galvanizedcastiron 0.15
Castiron 0.25
Concrete 0.3to3.0
Plastic 0.03
iv. ColebrookWhiteEquation
The Colebrook-White equation provides a mathematical method for calculation of the friction
factor.
⎟⎟
⎠
⎞
⎜⎜
⎝
⎛+−=
fRD
eLog
f e
35.9214.1
1
10
Wherefisthefrictionfactor,
eistheinternalroughnessofthepipe,
Distheinnerdiameterofpipeand
ReistheReynoldsnumber
v. Headlossinpipefittings
Pipelinefittingsandvalvesproduceheadlossesdependingontheirconfigurationswhichstatethat
valueofheadlossisproportionaltothesquareofflowvelocity.
g
Vfh f2
2
=
Wherehfistheheadlossinm,
fistheheadlosscoefficient,
Visthevelocityofflowinm/s,and
gistheaccelerationduetogravityinm/s2
Forsmallscalepipelinedesign,theheadlossinpipefittingsincludingotherlossesenrouteistakenas
thepercentoffrictionheadlosswhichrangesbetween10to20percent.Inthatcase,otherlossesdo
notneedtobecalculatedseparately.

█ Egis Eau & RSPN/ BhWP Irrigation Engineering Manual
122
Figure5-17Moody'sdiagramforfrictionloss

█ Egis Eau & RSPN/ BhWP Irrigation Engineering Manual
123
vi. Headlossatpipeinlet
Thelossofheadoccursattheinletofthepipelinewhichisbasedontheshapeandconfigurationof
theinletstructureandiscalculatedasfollows:
g
Vfh ii2
2
=
Wherehiistheheadlossatinletinm,
fi is the inlet losscoefficientwhichdependsupontheshapeofthe inletstructureandprovided in
Table5-11,
Visthevelocityofflowafterinletinm/s,and
gistheaccelerationduetogravityinm/s2
Table5-11Headlosscoefficientsatpipeinlet
Inletshape Straight Chambered Rounded Bellmouth
Coefficient
(fi)
0.50 0.25 Circular=0.10
Rectangular=0.20
0.06
vii. Headlossatpipeoutlet
The loss of head also occurs at the outlet of the pipelinewhich is based on the velocity of flow
beforetheoutletandiscalculatedasfollows:
g
Vfho o2
2
=
Wherehoistheheadlossatoutletinm,
foistheoutletlosscoefficientandisequalto1,
Visthevelocityofflowbeforeoutletinm/s,and
gistheaccelerationduetogravityinm/s2
viii. Headlossatsuddenexpansion
Thelossofheadalsooccurswiththesuddenexpansionofthepipeline(Figure5-18)whichisbased
onthesizesofthepipesandtheircorrespondingvelocitiesandiscalculatedasfollows:
( )g
Vf
g
VVh sese
22
1
22
21 =−
=
Wherefseisthelosscoefficientforsuddenexpansion(Table5-12),
V1isthevelocitybeforeexpansioninm/s,
V2isthevelocityafterexpansioninm/s
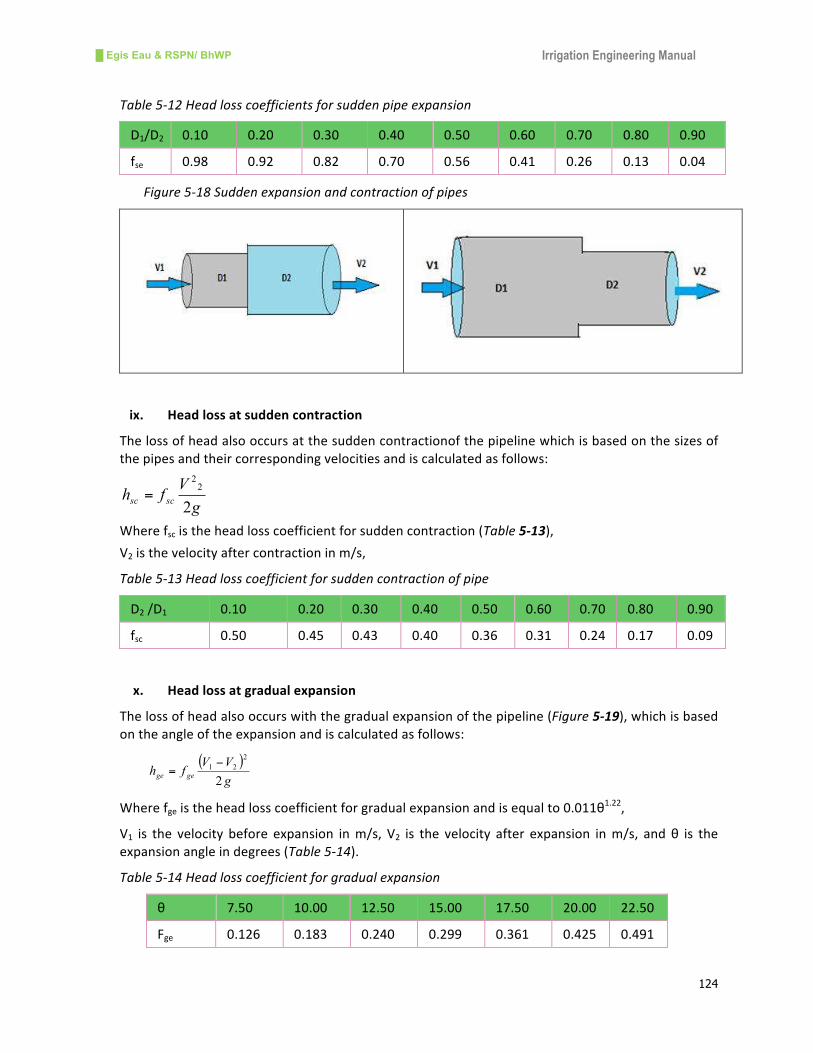
█ Egis Eau & RSPN/ BhWP Irrigation Engineering Manual
124
Table5-12Headlosscoefficientsforsuddenpipeexpansion
D1/D2 0.10 0.20 0.30 0.40 0.50 0.60 0.70 0.80 0.90
fse 0.98 0.92 0.82 0.70 0.56 0.41 0.26 0.13 0.04
Figure5-18Suddenexpansionandcontractionofpipes
ix. Headlossatsuddencontraction
Thelossofheadalsooccursatthesuddencontractionofthepipelinewhichisbasedonthesizesof
thepipesandtheircorrespondingvelocitiesandiscalculatedasfollows:
g
Vfh scsc2
2
2
=
Wherefscistheheadlosscoefficientforsuddencontraction(Table5-13),
V2isthevelocityaftercontractioninm/s,
Table5-13Headlosscoefficientforsuddencontractionofpipe
D2/D1 0.10 0.20 0.30 0.40 0.50 0.60 0.70 0.80 0.90
fsc 0.50 0.45 0.43 0.40 0.36 0.31 0.24 0.17 0.09
x. Headlossatgradualexpansion
Thelossofheadalsooccurswiththegradualexpansionofthepipeline(Figure5-19),whichisbased
ontheangleoftheexpansionandiscalculatedasfollows:
( )g
VVfh gege
2
2
21−
=
Wherefgeistheheadlosscoefficientforgradualexpansionandisequalto0.011θ1.22
,
V1 is the velocity before expansion inm/s, V2 is the velocity after expansion inm/s, and θ is the
expansionangleindegrees(Table5-14).
Table5-14Headlosscoefficientforgradualexpansion
θ 7.50 10.00 12.50 15.00 17.50 20.00 22.50
Fge 0.126 0.183 0.240 0.299 0.361 0.425 0.491

█ Egis Eau & RSPN/ BhWP Irrigation Engineering Manual
125
Figure5-19Typicalgradualexpansionofpipeline
xi. Headlossatelbow
Head loss occurs at bends of the pipelinewhich is based on the turning angle, ratio of radius of
curvaturetothediameterofpipeandiscalculatedasfollows:
g
Vfh bb2
2
=
Wherefbisthelosscoefficientforelbow,
Visthevelocityofflowinm/s,
Thevaluesoffbaregivenbythefollowingexperimentalequationforsmoothsteelpipe,whichare
functionofratioofradiusofcurvature(R)tothediameter(D)andturningangle(θ)intherangeof
0.50to2.5(Table5-15).
Table5-15Headlosscoefficientsforelbowsofpipeline
R/D\θ 22.50o 30
o 45
o 60
o 90
o
0.50 0.989 1.420 1.399 1.615 1.978
0.75 0.289 0.334 0.409 0.472 0.578
1.00 0.147 0.17o 0.208 0.240 0.294
1.50 0.085 0.121 0.121 0.139 0.170
2.00 0.073 0.084 0.103 0.119 0.145
2.50 0.069 0.079 0.097 0.112 0.138
xii. HeadlossatTee
A loss of head also occurs at the Tee of the pipeline (Figure 5-20) which is based on the flow
directionandvelocityinthepipe,andiscalculatedasfollows:
g
Vfh tt2
2
=
WhereftistheheadlosscoefficientforTee,
Visthevelocityofflowinm/s,

█ Egis Eau & RSPN/ BhWP Irrigation Engineering Manual
126
Thevaluesofftdependupontheflowratiosofrespectiveflowdirectionsandcornerchamfers.For
flow from straight pipe towards tee ft is 0.97 and from tee to straight pipe ft is 1.5. The loss
coefficientsforbranchesarealsosimilartothatoftee.
Figure5-20Sketchofflowfromstraightpipetoteeandteetostraightpipe
xiii. HeadlossatOrifice
Headlossoccursattheorificeofthepipelinewhichisbasedonthethrottlingratioandvelocityin
pipeandiscalculatedasfollows:
g
Vfh oror2
2
=
Whereforistheheadlosscoefficientfororifice,
Visthevelocityofflowinm/s,
TheheadlossatanorificedependsonthethrottlingratioasgiveninTable 5-16.
Table5-16Headlosscoefficientsfororifice
(D2/D1)2 0.10 0.20 0.30 0.40 0.50 0.60 0.70 0.80 0.90
orf 226 47.80 17.50 7.80 3.75 1.80 0.80 0.29 0.06
xiv. HeadlossatValves
At valves connected with pumps and installed on the pipeline, the head losses are produced
accordingtothevalvetypesusedeventhoughtheyarefullyopened.Theheadlossisexpressedas:
g
Vfh vv2
2
=
Where fv is the loss coefficient for valves and depend upon the type of valves used. These
coefficientsaregiveninTable5-17.
Visthevelocityofflowinm/s,

█ Egis Eau & RSPN/ BhWP Irrigation Engineering Manual
127
Table5-17Headlosscoefficientsforvalves
Nominal
size
(mm)
100 150 200 250 300 350 400 500 600
Gate
valve
0.16 0.15 0.11 0.05 Negligible
Butterfly
valve
- - 2.40 1.80 1.40 1.09 0.86 0.60 0.45
Check
valve
1.32 1.27 1.21 1.16 1.11 1.05 1.00 0.98 0.96
xv. Headlossesatscreens
Incaseofinletswithtrashscreens(Figure5-21),theheadlossacrossthescreenshallbecalculated
bythefollowingformula:
g
V
b
shts
2sin3
23/4
×⎟⎠
⎞⎜⎝
⎛×= δ
Wherehtsistheheadlossacrossthescreeninm,
δistheinclinationofthescreen,
sisthethicknessofbarinmm,
bistheopeningbetweenbarsinmm,and
Visthevelocityupstreamofthescreen
Figure5-21Typicalsketchoftrashscreenbars
5.8.4 DesignProcedureofPipedCanal
i. Calculate the design flow of the pipeline as 25% greater than required flow considering
partialblocking,
QrQd ×= 25.1

█ Egis Eau & RSPN/ BhWP Irrigation Engineering Manual
128
WhereQdisthedesignedflowandQristherequiredflow,
ii. Determinetheelevationdifferenceofthepipelinebetweenstartandendpoints,
iii. Dividethepipelinelengthintostrategicsegments,thefirstsegmentwillbefromsourceto
the first break pressure tank, second segment from first break pressure tank to second
break pressure tank, and the third segment will be from second break pressure tank to
dischargetank,
iv. If thedemandofwater isgreater than theavailable flowat thesourcea reservoirwillbe
necessarytoprovidetobalancetheflow.Ifthedemandofwaterislessthantheflowatthe
sourcestorage reservoirwillnotbenecessary.Thedesignofmainpipelinewillbecarried
outbasedonthemaximumwaterdemandforirrigation,
v. Calculatethediameterofthepipeconsideringthelimitingvelocityandflowinthepipefor
eachsegment,
vi. Preparelinediagramofthepipelinesystemwithdetailsoflevelsandpipediameters,
vii. Theexampleofpipelineworks:
a. Intake,
b. Supplymainpipeline,
i. Intaketofirstbreakpressuretank,
ii. FirstBPTtosecondBPT,and
iii. SecondBPTtodischargetank
c. Distributionsystem
viii. AsampleexcelsheetofpipelinedesignispresentedinTable5-18.
5.9 Canalsalongunstableareas
Byvirtueoftheuniquetopography,fragilegeologyandmonsoonhydrology,Bhutan’shillslopesare
oftenunstabledue todebris flow, landslides and riverbankerosion. The irrigation canalspassing
along the slopes of the hills and mountains in many cases are susceptible to instability of the
alignment.Therearethreetypesofinstabilitythatcanaffectthecanal,whicharealsoexpressedin
Figure5-22.
5.9.1 Deepslideacrossthecanalalignment
Landslidesandoverburdencreepaffectthewholehillsideforlargeareasaboveandbelowthecanal,
andmore or less independently of the influence of canal construction. In such areas, trees have
oftenslipped,andtheupperpartofthetreetrunkgrowsverticallywhilethelowerpartissloping.
Sometimesthegroundwillbefairlybrokenwithlittledensevegetation.
5.9.2 Shallowslideabovethecanal
Ashallowslideabovethecanal isduetotheeffectofthecanalcuttingcausingitsowninstability.
Forexistingcanals,thegroundwillhaveoftenslumpedintothecanalandtherewillsometimesbe
groundwaterseepage.

█ Egis Eau & RSPN/ BhWP Irrigation Engineering Manual
129
5.9.3 Shallowslidebelowcanal
Thepossibilityofinstabilitybelowthecanalisduetosteepnessandparticularlyexcessporewater
fromthecanalitself.Inexistingcanals,suchareasareusuallyfairlyobvious;thecanalsizeisusually
restricted and has been temporarily stabilized by bamboo or boulders, while continuing seepage
throughoroverthecanalbanksusuallyonlyworsenthesituation.
Figure5-22Threetypesofcanalinstability
Deepslideacrossthecanal Shallowslideabovethe
canal
Shallowslidebelowthecanal
Thegeneralsolutionsforunstableareasofthecanalalignmentaregroupedintofivecategories:
• Liningofthecanal,
• Coveredcanal,
• Retainingwallsonuphillsideaswellasdownhillside,
• Temporarymeasures,and
• Reforestationandgrassing
Thesesolutionmeasuresareapplicabletothespecificsiteconditionsoftheabovementionedcanal
instabilities.ThetypicalinstabilityproblemsandtheirsolutionsaregiveninFigure5-23.

█ Egis Eau & RSPN/ BhWP Irrigation Engineering Manual
130
Figure5-23Canalinstabilityproblemsandtheirsolutions

█ Egis Eau & RSPN/ BhWP Irrigation Engineering Manual
131
Table5-18Sampledesignsheetofpipelineworks
Project:
Schemename: Sourcename: Safeyield:
From To Actual Design From To OD ID Class From To
(m) (m) (lps) (m) (m) (m) (m) (m) (m) (mm) (mm) (kg/cm2) % (m) (m) (m/s) (m) (m)
(0) (1) (2) (3) (4) (5) (6) (7) (8) (9) (10) (11) (12) (13) (14) (17) (18) (19) (20) (21) (22)
1 CC P1 250 275 4 1000 993 7 1000 7.00 7 90 76.3 6 1.15 3.16 3.838 0.88 1000 996.8375
2 P1 P2 250 275 4 993 947 46 1000 49.84 53 90 76.3 6 1.15 3.16 46.675 0.88 996.8375 993.675
3 P2 P3 220 242 4 947 955 -8 1000 38.68 45 90 76.3 6 1.15 2.78 35.892 0.88 993.675 990.892
4 P3 P4 100 110 4 955 956 -1 1000 34.89 44 90 76.3 6 1.15 1.27 33.627 0.88 990.892 989.627
5 P3 P4 200 220 4 956 947 9 1000 42.63 53 90 76.3 6 1.15 2.53 40.097 0.88 989.627 987.097
6 P4 P5 200 220 4 947 943 4 1000 44.10 57 90 76.3 6 1.15 2.53 41.567 0.88 987.097 984.567
7 P5 FRC 200 220 4 943 942 1 1000 42.57 58 90 76.3 6 1.15 2.53 40.037 0.88 984.567 982.037
Pipeline LengthDesign
dischargeS.N
HydraulicgradelineReducedlevel Level
Diff
Newstatic
level Totalavail
head
Maxstatic
pressure
Pipeused
HDPE
Friction
factor
Head
loss
Residual
head
Flow
velocity