Adapting to Climate Change - Adaptation Library...Adapting to Climate Change A Risk-based Guide for...
32
Adapting to Climate Change A Risk-based Guide for Local Governments in British Columbia Volume 2 (Workbook and Case Studies) Robert A. Black James P. Bruce Final Draft February 10, 2010 I.D. Mark Egener
Transcript of Adapting to Climate Change - Adaptation Library...Adapting to Climate Change A Risk-based Guide for...
Adapting to Climate Change
A Risk-based Guide for Local Governments in British Columbia
Volume 2
(Workbook and Case Studies)
Robert A. Black James P. Bruce
Final Draft February 10, 2010 I.D. Mark Egener

i
Adapting to Climate Change: A Risk-based Guide for Local Governments in
British Columbia
Table of Contents: Volume 2 Introduction ............................................................................................................................................ 1!!. Case Study: Extreme Weather Events in Lower Vancouver island .............................................. 2!2. Case Study: Sea Level Rise in the Lower Vancouver island ........................................................ 6!3. Case Study: Sea Level Rise in the Lower Mainland ..................................................................... 12!4. Case Studies: Extreme Weather in the Lower Mainland. ............................................................ 18!Workbook.............................................................................................................................................. 24!Acknowledgments ............................................................................................................................... 30!

1
Introduction
This Guide was user-tested in two workshops in British Columbia; one held in Victoria and one in Metro Vancouver for members of regional local governments and representatives of the provincial government.. The purposes of workshops were to:
o Present the risk management process as a tool to facilitate planning for adapting to climate change,
o Consider and understand the projected climate change impacts in British Columbia over the next 20 to 30 years, and
o Test the Guide using selected impacts by the represented communities to determine which adaptation strategies should be considered to reduce the risks to acceptable levels.
The Victoria workshop participants decided to consider the climate impacts in two general areas: ! Sea level rise, and ! Extreme weather events. The Metro Vancouver workshop participants also decided to consider two aspect of climate change impacts:
! Sea level rise in the lower mainland, and ! Extreme rainfall events. The case studies and examples included in this volume of the Guide illustrate the use of the risk management process to develop adaptation strategies in these specific areas of climate impacts. They are included below to inform users and assist them as they work through the risk management process. Because they were developed during time-limited workshops and in a learning environment, the case studies and examples often use very simplified risk scenarios. Nevertheless, the development of the risk management information by the groups illustrate can assist others dealing with similar risk scenarios. This volume also contains the Workbook which contains all the suggested tables and diagrams from Volume 1 in a format that cant be photocopies or copies electronically and used by the risk management team. As suggested in Volume 1, the risk management team should feel free to change the headings and structure of the tables to meet their specific needs.
2
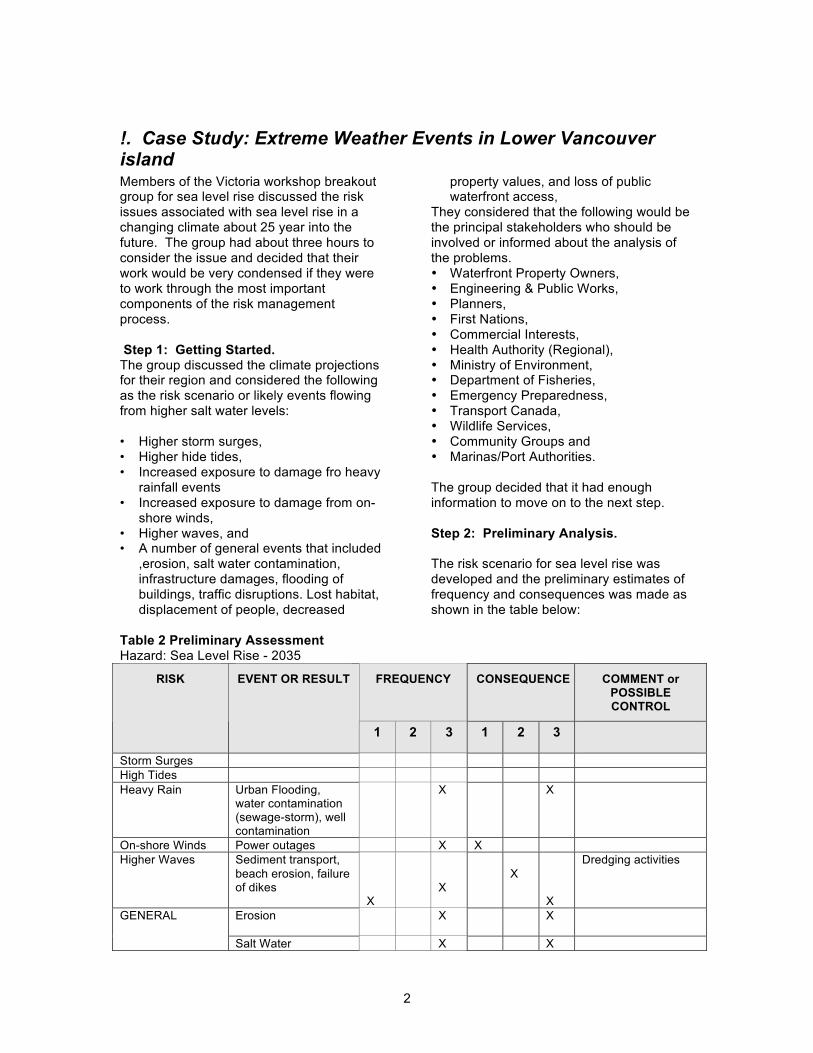
!. Case Study: Extreme Weather Events in Lower Vancouver island Members of the Victoria workshop breakout group for sea level rise discussed the risk issues associated with sea level rise in a changing climate about 25 year into the future. The group had about three hours to consider the issue and decided that their work would be very condensed if they were to work through the most important components of the risk management process. Step 1: Getting Started. The group discussed the climate projections for their region and considered the following as the risk scenario or likely events flowing from higher salt water levels: • Higher storm surges, • Higher hide tides, • Increased exposure to damage fro heavy
rainfall events • Increased exposure to damage from on-
shore winds, • Higher waves, and • A number of general events that included
,erosion, salt water contamination, infrastructure damages, flooding of buildings, traffic disruptions. Lost habitat, displacement of people, decreased
property values, and loss of public waterfront access,
They considered that the following would be the principal stakeholders who should be involved or informed about the analysis of the problems. • Waterfront Property Owners, • Engineering & Public Works, • Planners, • First Nations, • Commercial Interests, • Health Authority (Regional), • Ministry of Environment, • Department of Fisheries, • Emergency Preparedness, • Transport Canada, • Wildlife Services, • Community Groups and • Marinas/Port Authorities.
The group decided that it had enough information to move on to the next step. Step 2: Preliminary Analysis. The risk scenario for sea level rise was developed and the preliminary estimates of frequency and consequences was made as shown in the table below:
Table 2 Preliminary Assessment Hazard: Sea Level Rise - 2035
FREQUENCY CONSEQUENCE COMMENT or POSSIBLE CONTROL
RISK EVENT OR RESULT
1 2 3 1 2 3
Storm Surges High Tides Heavy Rain Urban Flooding,
water contamination (sewage-storm), well contamination
X X
On-shore Winds Power outages X X Higher Waves Sediment transport,
beach erosion, failure of dikes
X
X
X
X
Dredging activities
Erosion X
X GENERAL
Salt Water X X
3
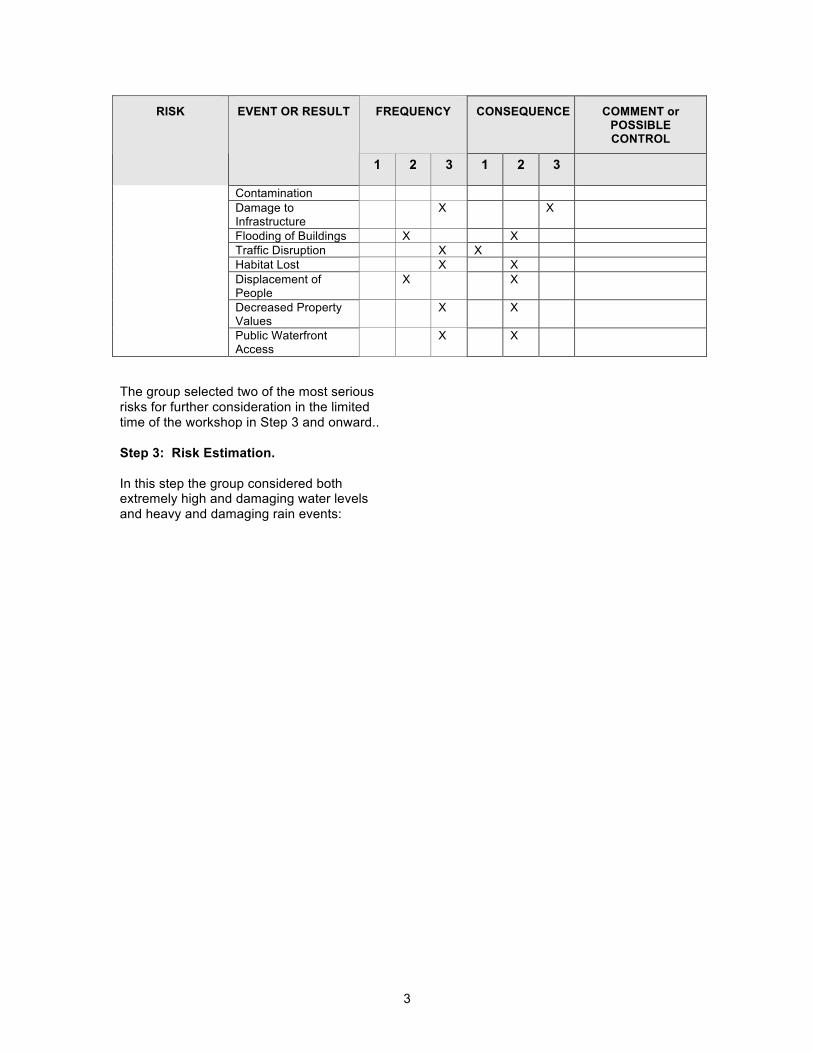
FREQUENCY CONSEQUENCE COMMENT or POSSIBLE CONTROL
RISK EVENT OR RESULT
1 2 3 1 2 3
Contamination Damage to Infrastructure
X X
Flooding of Buildings X X Traffic Disruption X X Habitat Lost X X Displacement of People
X X
Decreased Property Values
X X
Public Waterfront Access
X X
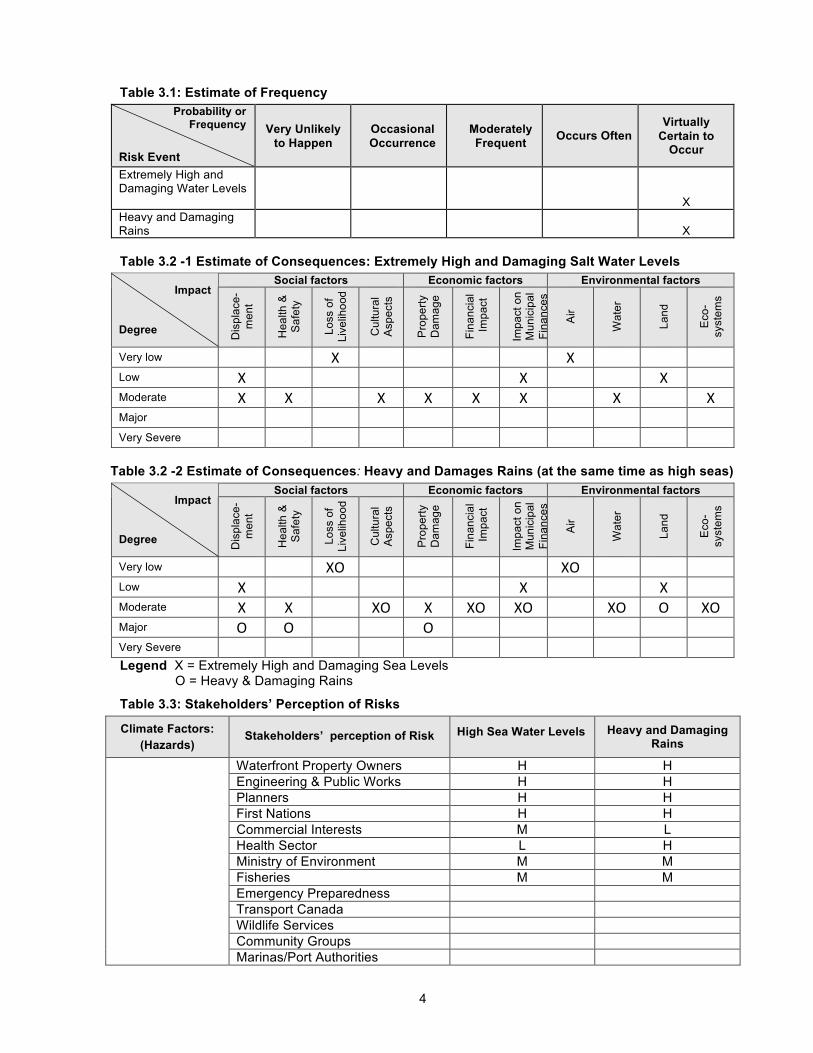
The group selected two of the most serious risks for further consideration in the limited time of the workshop in Step 3 and onward.. Step 3: Risk Estimation. In this step the group considered both extremely high and damaging water levels and heavy and damaging rain events:
4
Table 3.1: Estimate of Frequency Probability or
Frequency
Risk Event
Very Unlikely to Happen
Occasional Occurrence
Moderately Frequent Occurs Often
Virtually Certain to
Occur
Extremely High and Damaging Water Levels
X Heavy and Damaging Rains
X
Table 3.2 -1 Estimate of Consequences: Extremely High and Damaging Salt Water Levels
Social factors Economic factors Environmental factors Impact
Degree Dis
plac
e-
men
t
Hea
lth &
S
afet
y
Loss
of
Live
lihoo
d
Cul
tura
l A
spec
ts
Pro
perty
D
amag
e
Fina
ncia
l Im
pact
Im
pact
on
Mun
icip
al
Fina
nces
Air
Wat
er
Land
Eco
- sy
stem
s
Very low ! ! "! ! ! ! ! "! ! ! !Low "! ! ! ! ! ! "! ! ! "! !Moderate "! "! ! "! "! "! "! ! "! ! "!Major ! ! ! ! ! ! ! ! ! ! !Very Severe ! ! ! ! ! ! ! ! ! ! !
Table 3.2 -2 Estimate of Consequences: Heavy and Damages Rains (at the same time as high seas) Social factors Economic factors Environmental factors
Impact
Degree Dis
plac
e-
men
t
Hea
lth &
S
afet
y
Loss
of
Live
lihoo
d
Cul
tura
l A
spec
ts
Pro
perty
D
amag
e
Fina
ncia
l Im
pact
Im
pact
on
Mun
icip
al
Fina
nces
Air
Wat
er
Land
Eco
- sy
stem
s
Very low ! ! "#! ! ! ! ! "#! ! ! !Low "! ! ! ! ! ! "! ! ! "! !Moderate "! "! ! "#! "! "#! "#! ! "#! #! "#!Major #! #! ! ! #! ! ! ! ! ! !Very Severe ! ! ! ! ! ! ! ! ! !!! !Legend X = Extremely High and Damaging Sea Levels
O = Heavy & Damaging Rains
Table 3.3: Stakeholders’ Perception of Risks
Climate Factors: (Hazards)
Stakeholders’ perception of Risk High Sea Water Levels
Heavy and Damaging Rains
Waterfront Property Owners H H Engineering & Public Works H H Planners H H First Nations H H Commercial Interests M L Health Sector L H Ministry of Environment M M Fisheries M M Emergency Preparedness Transport Canada Wildlife Services Community Groups
Marinas/Port Authorities
5
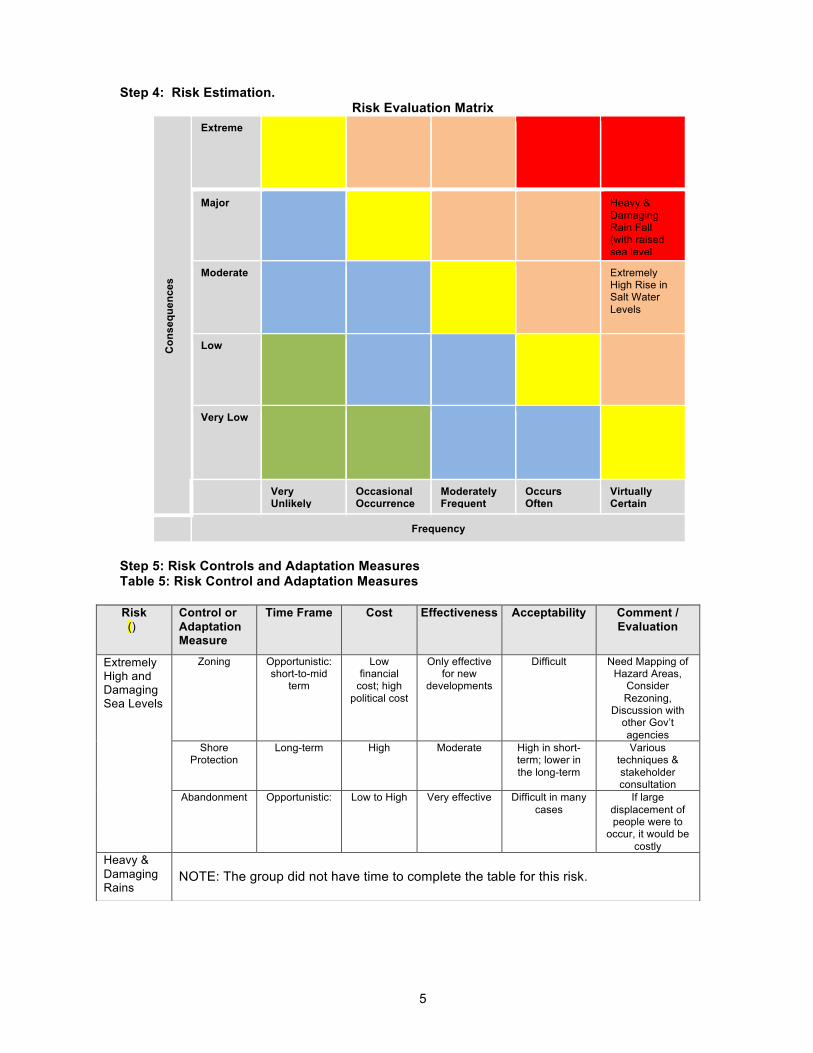
Step 4: Risk Estimation. Risk Evaluation Matrix
Extreme
Major
Heavy & Damaging Rain Fall (with raised sea level
Moderate
Extremely High Rise in Salt Water Levels
Low
Very Low
Con
sequ
ence
s
Very Unlikely
Occasional Occurrence
Moderately Frequent
Occurs Often
Virtually Certain
Frequency
Step 5: Risk Controls and Adaptation Measures Table 5: Risk Control and Adaptation Measures Risk ()
Control or Adaptation Measure
Time Frame Cost Effectiveness Acceptability Comment / Evaluation
Zoning Opportunistic: short-to-mid
term
Low financial
cost; high political cost
Only effective for new
developments
Difficult Need Mapping of Hazard Areas,
Consider Rezoning,
Discussion with other Gov’t agencies
Shore Protection
Long-term High Moderate High in short-term; lower in the long-term
Various techniques & stakeholder consultation
Extremely High and Damaging Sea Levels
Abandonment Opportunistic: Low to High Very effective Difficult in many cases
If large displacement of people were to
occur, it would be costly
Heavy & Damaging Rains
NOTE: The group did not have time to complete the table for this risk.

6
2. Case Study: Sea Level Rise in the Lower Vancouver island The breakout group considered only one climate hazard: Extreme weather events out to twenty years
in the future. Step 1: Getting Started
Team Members Stakeholders
Land Use Planner Health Authority
Finance / Asset Management Provincial Reps (MoT, MoE, MCRD)
Engineering First Nations
Public Information Officer NGOs & ENGOs
Sustainability Office (TBL) Neighborhood or Community Associations
Environmental Chamber of Commerce
Parks Representative Youth Organization or Council
Social Planner Utility Companies
Protective Services Politicians (via Committees)
Facilities Management Seniors Organizations
Housing Authorities Tourism Organization
Risk Management Agricultural Representatives
Human Resources (OH&S rep)
Step 2: Preliminary Analysis.
Table 2 - Preliminary Risk Assessments
Frequency Consequence Risk Scenario
Vulnerability
1 2 3 1 2 3
Comment or control measure
Heavy Rain
Water contamination Broken water mains Flooding --Compromised water quality --Septic system overloads
X X
Heavy Wind
Power poles and lines Blocked communication
X X
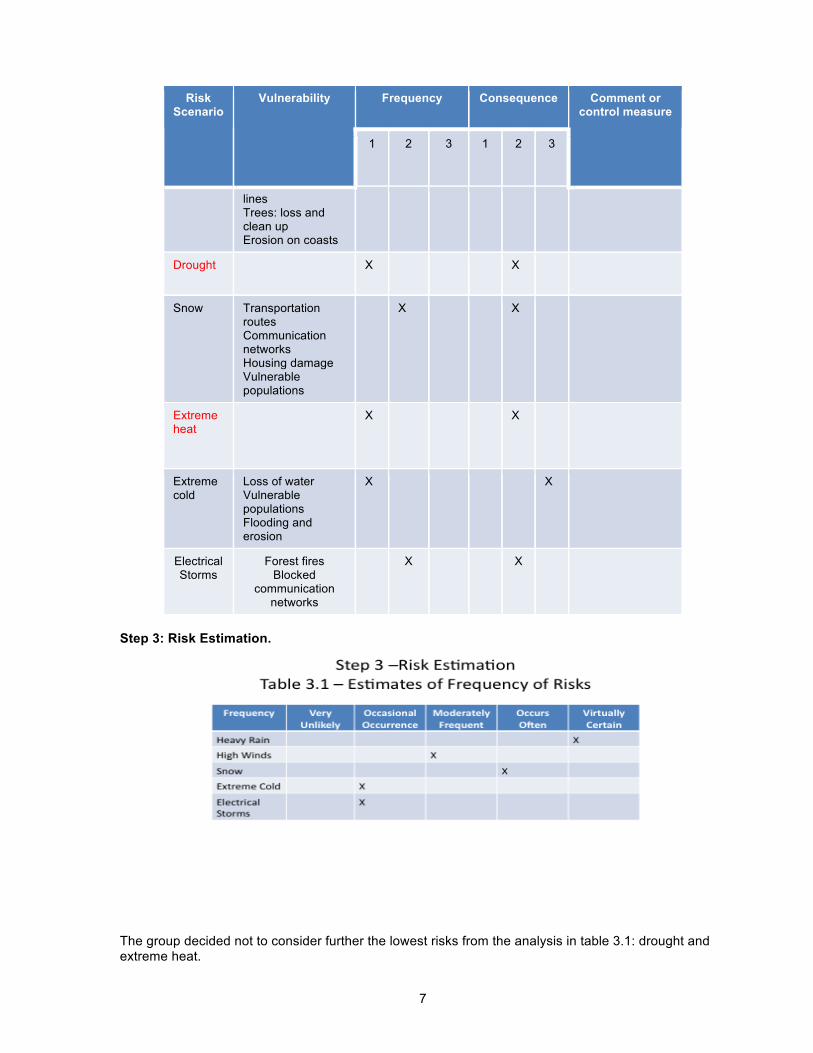
7
Frequency Consequence Risk Scenario
Vulnerability
1 2 3 1 2 3
Comment or control measure
lines Trees: loss and clean up Erosion on coasts
Drought X X
Snow Transportation routes Communication networks Housing damage Vulnerable populations
X X
Extreme heat
X X
Extreme cold
Loss of water Vulnerable populations Flooding and erosion
X X
Electrical Storms
Forest fires Blocked
communication networks
X X
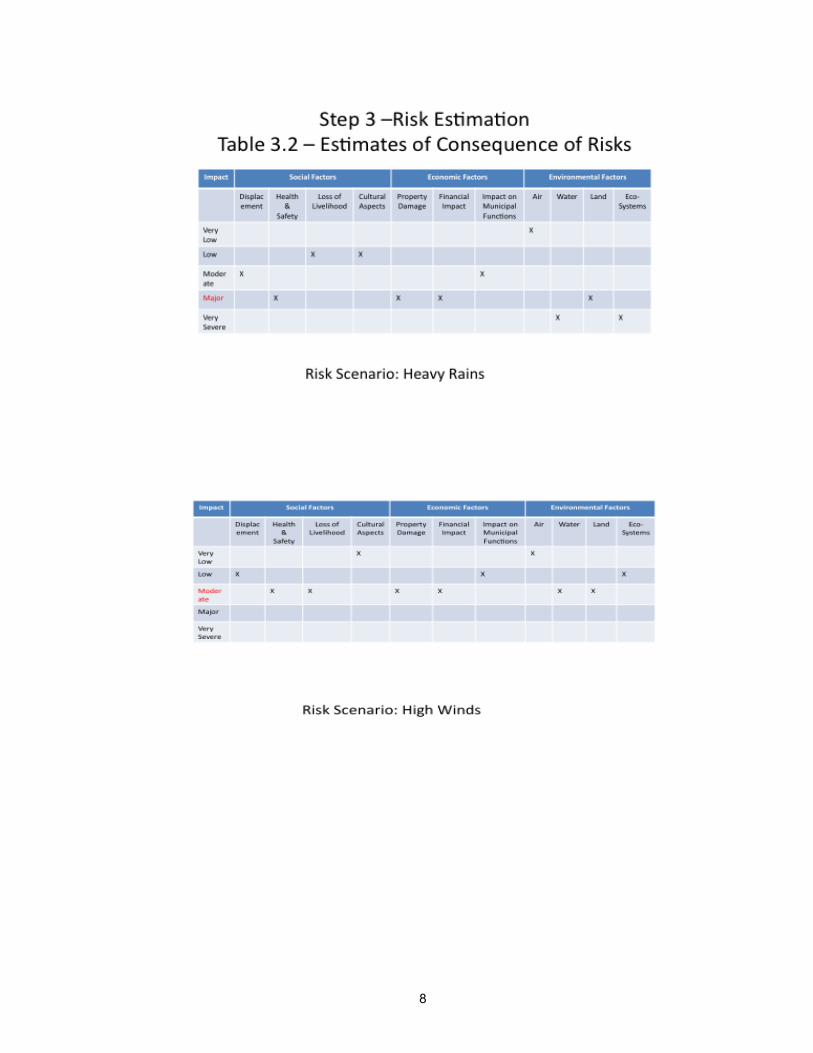
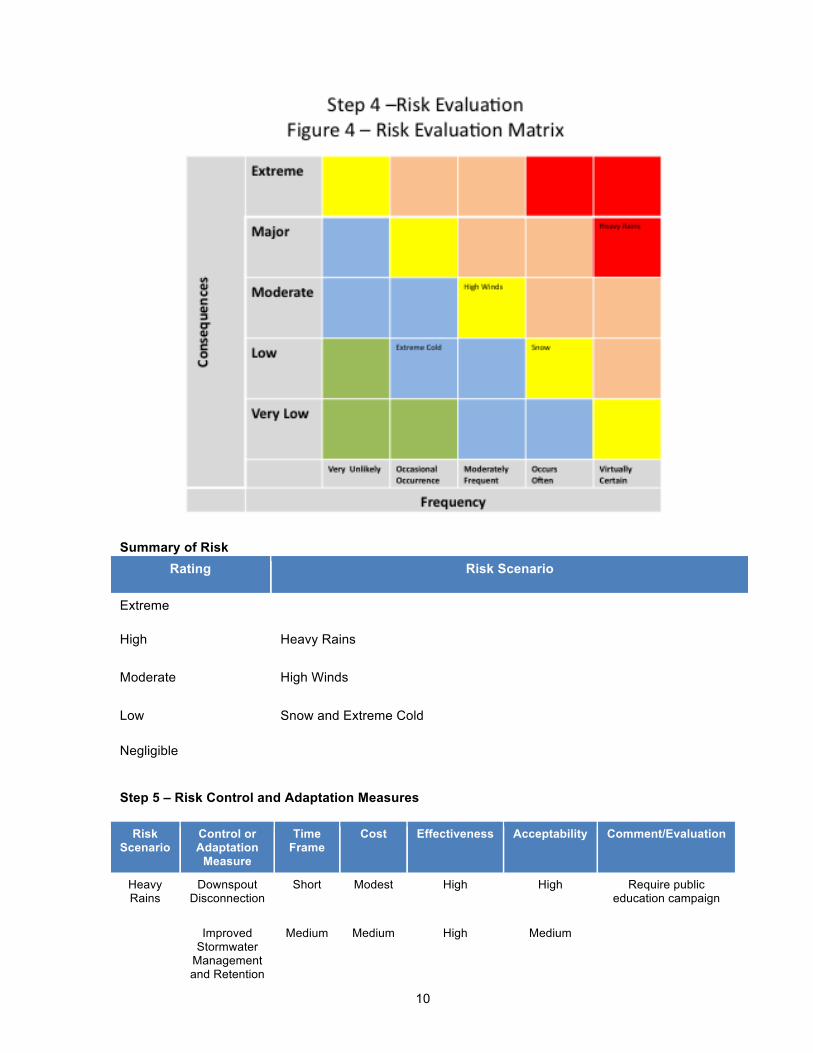
Step 3: Risk Estimation.
The group decided not to consider further the lowest risks from the analysis in table 3.1: drought and extreme heat.
8

9
Table 3.3: Stakeholders’ Risk Perception
Climate Factors: (Hazards)
Risk Scenarios - Aspects of Hazards and Risks to Community
Stakeholders and perception of Risk
Utility Companies: infrastructure failure Agriculture: loss of business; flooding of property; damage to livestock
Extreme weather
Heavy Rains
Health: Drinking water quality; mould and respiratory diseases.
10
Summary of Risk
Rating Risk Scenario
Extreme
High Heavy Rains
Moderate High Winds
Low Snow and Extreme Cold
Negligible
Step 5 – Risk Control and Adaptation Measures
Risk Scenario
Control or Adaptation
Measure
Time Frame
Cost Effectiveness Acceptability Comment/Evaluation
Heavy Rains
Downspout Disconnection
Short Modest High High Require public education campaign
Improved Stormwater
Management and Retention
Medium Medium High Medium
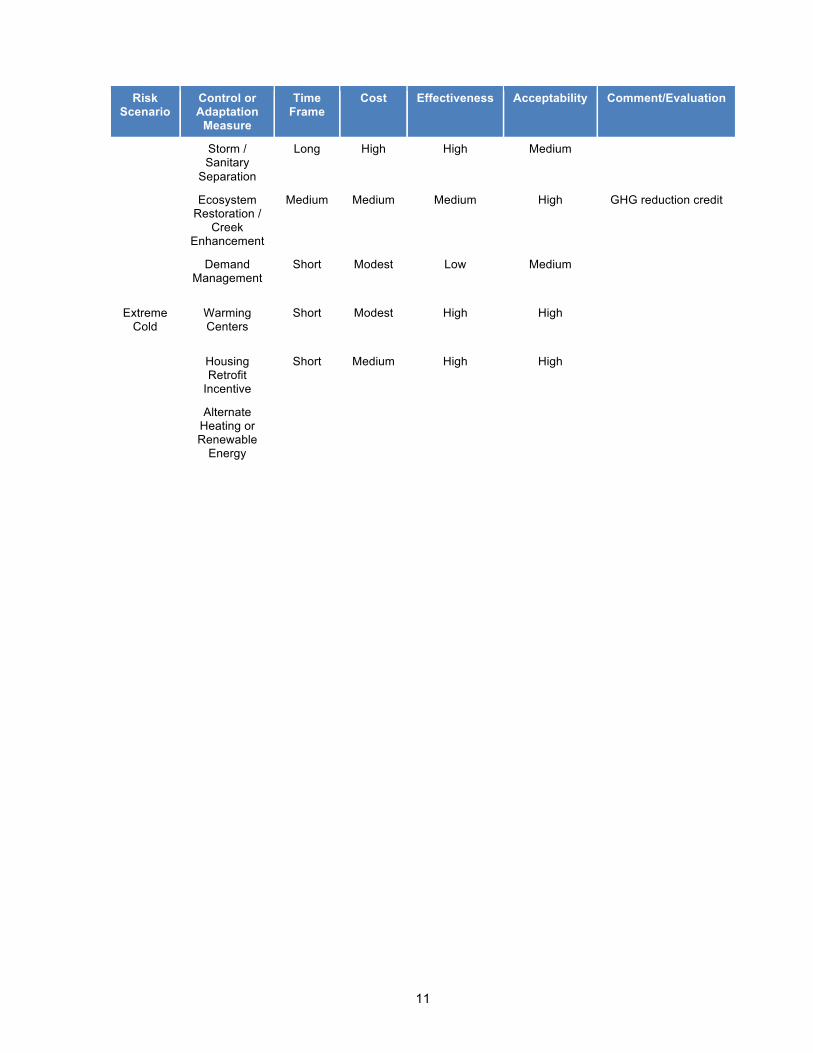
11
Risk Scenario
Control or Adaptation
Measure
Time Frame
Cost Effectiveness Acceptability Comment/Evaluation
Storm / Sanitary
Separation
Long High High Medium
Ecosystem Restoration /
Creek Enhancement
Medium Medium Medium High GHG reduction credit
Demand Management
Short Modest Low Medium
Extreme Cold
Warming Centers
Short Modest High High
Housing Retrofit
Incentive
Short Medium High High
Alternate Heating or Renewable
Energy
12
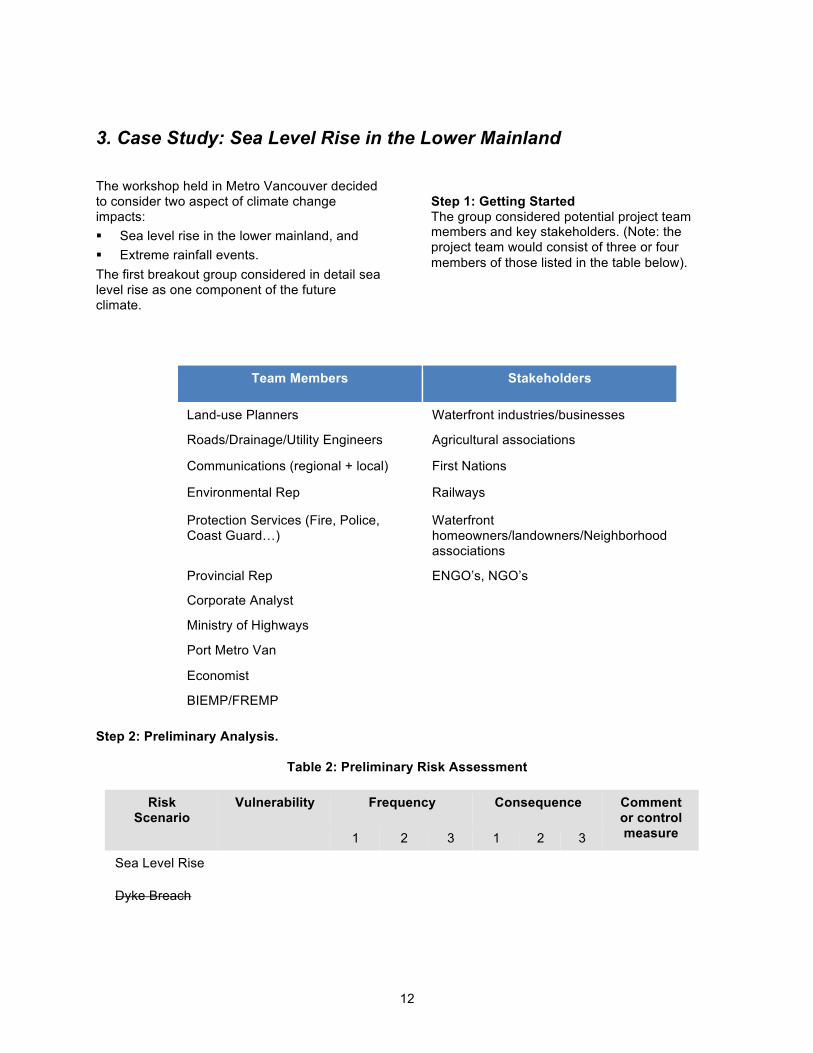
3. Case Study: Sea Level Rise in the Lower Mainland
The workshop held in Metro Vancouver decided to consider two aspect of climate change impacts: ! Sea level rise in the lower mainland, and ! Extreme rainfall events. The first breakout group considered in detail sea level rise as one component of the future climate.
Step 1: Getting Started The group considered potential project team members and key stakeholders. (Note: the project team would consist of three or four members of those listed in the table below).
Team Members Stakeholders
Land-use Planners Waterfront industries/businesses
Roads/Drainage/Utility Engineers Agricultural associations
Communications (regional + local) First Nations
Environmental Rep Railways
Protection Services (Fire, Police, Coast Guard…)
Waterfront homeowners/landowners/Neighborhood associations
Provincial Rep ENGO’s, NGO’s
Corporate Analyst
Ministry of Highways
Port Metro Van
Economist
BIEMP/FREMP Step 2: Preliminary Analysis.
Table 2: Preliminary Risk Assessment
Frequency Consequence Risk Scenario
Vulnerability
1 2 3 1 2 3
Comment or control measure
Sea Level Rise
Dyke Breach
13
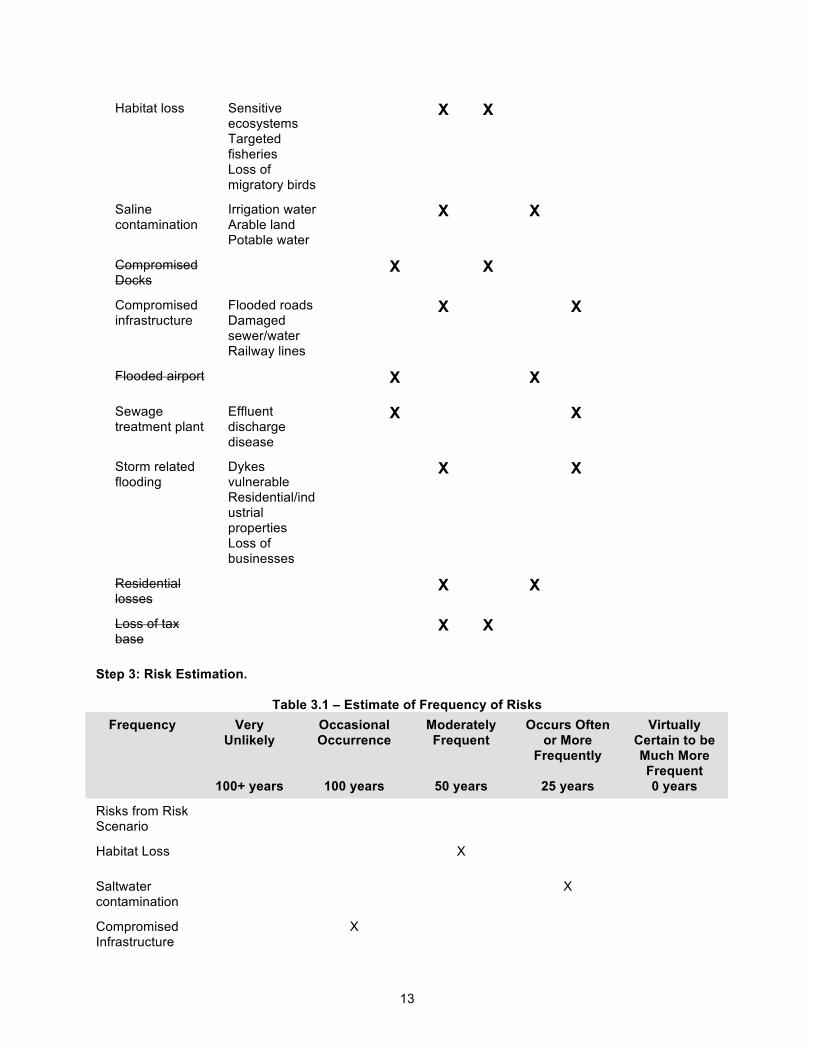
Habitat loss Sensitive ecosystems Targeted fisheries Loss of migratory birds
X X
Saline contamination
Irrigation water Arable land Potable water
X X
Compromised Docks
X X
Compromised infrastructure
Flooded roads Damaged sewer/water Railway lines
X X
Flooded airport X X
Sewage treatment plant
Effluent discharge disease
X X
Storm related flooding
Dykes vulnerable Residential/industrial properties Loss of businesses
X X
Residential losses
X X
Loss of tax base
X X
Step 3: Risk Estimation.
Table 3.1 – Estimate of Frequency of Risks Frequency Very
Unlikely
100+ years
Occasional Occurrence
100 years
Moderately Frequent
50 years
Occurs Often or More
Frequently
25 years
Virtually Certain to be Much More Frequent 0 years
Risks from Risk Scenario
Habitat Loss X
Saltwater contamination
X
Compromised Infrastructure
X

14
Frequency Very Unlikely
100+ years
Occasional Occurrence
100 years
Moderately Frequent
50 years
Occurs Often or More
Frequently
25 years
Virtually Certain to be Much More Frequent 0 years
Compromised sewage treatment plant
X
Storm-related flooding
X
Table 3.2.1 Estimate of Consequences: Habitat Loss
Social factors Economic factors Environmental factors Impact
Degree Dis
plac
e-
men
t
Hea
lth &
S
afet
y
Loss
of
Live
lihoo
d
Cul
tura
l A
spec
ts
Pro
perty
D
amag
e
Fina
ncia
l Im
pact
Im
pact
on
Mun
icip
al
Fina
nces
Air
Wat
er
Land
Eco
- sy
stem
s
Very low ! ! " ! " " " ! " " "Low " " " " " " " " " " "Moderate " " ! " ! ! ! " " " ! Major " " " " " " " " ! ! "Very Severe " " " " " " " " " " "
Overall Risk: Low Table 3.2.2 Estimate of Consequences: Saltwater Contamination.
Social factors Economic factors Environmental factors Impact
Degree Dis
plac
e-
men
t
Hea
lth &
S
afet
y
Loss
of
Live
lihoo
d
Cul
tura
l A
spec
ts
Pro
perty
D
amag
e
Fina
ncia
l Im
pact
Im
pact
on
Mun
icip
al
Fina
nces
Air
Wat
er
Land
Eco
- sy
stem
s
Very low ! ! " ! " " " ! " " "Low " " " " " " " " " " "Moderate " " ! " ! ! ! " " " ! Major " " " " " " " " ! ! "Very Severe " " " " " " " " " " "
Overall Risk: Moderate Table 3.2.3 Estimate of Consequences: Compromised Infrastructure
Social factors Economic factors Environmental factors Impact
Degree Dis
plac
e-
men
t
Hea
lth &
S
afet
y
Loss
of
Live
lihoo
d
Cul
tura
l A
spec
ts
Pro
perty
D
amag
e
Fina
ncia
l Im
pact
Im
pact
on
Mun
icip
al
Fina
nces
Air
Wat
er
Land
Eco
- sy
stem
s
Very low " ! " ! " " " " " " "Low " " " " " " " ! " " "Moderate ! " ! " " " " " ! ! ! Major " " " " ! ! ! " " " "Very Severe " " " " " " " " " " "
Overall Risk: Moderate

15
Table 3.2.4 Estimate of Consequences: Compromised Sewage Treatment Plants Social factors Economic factors Environmental factors
Impact
Degree Dis
plac
e-
men
t
Hea
lth &
S
afet
y
Loss
of
Live
lihoo
d
Cul
tura
l A
spec
ts
Pro
perty
D
amag
e
Fina
ncia
l Im
pact
Im
pact
on
Mun
icip
al
Fina
nces
Air
Wat
er
Land
Eco
- sy
stem
s
Very low ! " " ! " " " " " " "Low " " " " ! " " " " " "Moderate " ! ! " " ! ! ! " ! "Major " " " " " " " " " " "Very Severe " " " " " " " " ! " !
Overall risk: Moderate Table 3.2.5 Estimate of Consequences: Storm Related Flooding
Social factors Economic factors Environmental factors Impact
Degree Dis
plac
e-
men
t
Hea
lth &
S
afet
y
Loss
of
Live
lihoo
d
Cul
tura
l A
spec
ts
Pro
perty
D
amag
e
Fina
ncia
l Im
pact
Im
pact
on
Mun
icip
al
Fina
nces
Air
Wat
er
Land
Eco
- sy
stem
s
Very low " " " " " " " " " " "Low " " " " " " " ! " " "Moderate " " " ! " " " " " " "Major " " ! " " " " " " ! "Very Severe ! ! " " ! ! ! " ! " !
Overall Risk: Very Severe TABLE 3.3: Stakeholders’ Risk Perception.
Climate Factors: (Hazards)
Risk Scenarios - Aspects of Hazards and Risks to Community
Stakeholders and perception of Risk
Habitat Loss
ENGO’s First Nations Ecotourism -As important as any other Risk Scenario -Political -Food Security
Sea Level Rise
Group did not have time to complete for other risks in the scenario
Step 4: Risk Evaluation. Using the data developed in Step 3, the group produced the table below:

16
Figure 4: Risk Evaluation Matrix: Sea Level rise on BC’s Lower Mainland.
Extreme
Compromised Sewage Treatment Plant
Storm Related Flooding
Major
Moderate
Compromised Infrastructure
Salt Water Contamination
Low
Habitat Loss
Very Low
Con
sequ
ence
s
Very Unlikely
Occasional Occurrence
Moderately Frequent
Occurs Often
Virtually Certain
Frequency The group found that storm-related flooding and compromised sewage treatment facilities were the highest risks associated with sea level rise in the 2010-2035 time frame. Step 5: Risk Controls and Adaptation Measures. Because of a shortage of time, the group considered only risk controls/adaptation measures associated with storm-related flooding.
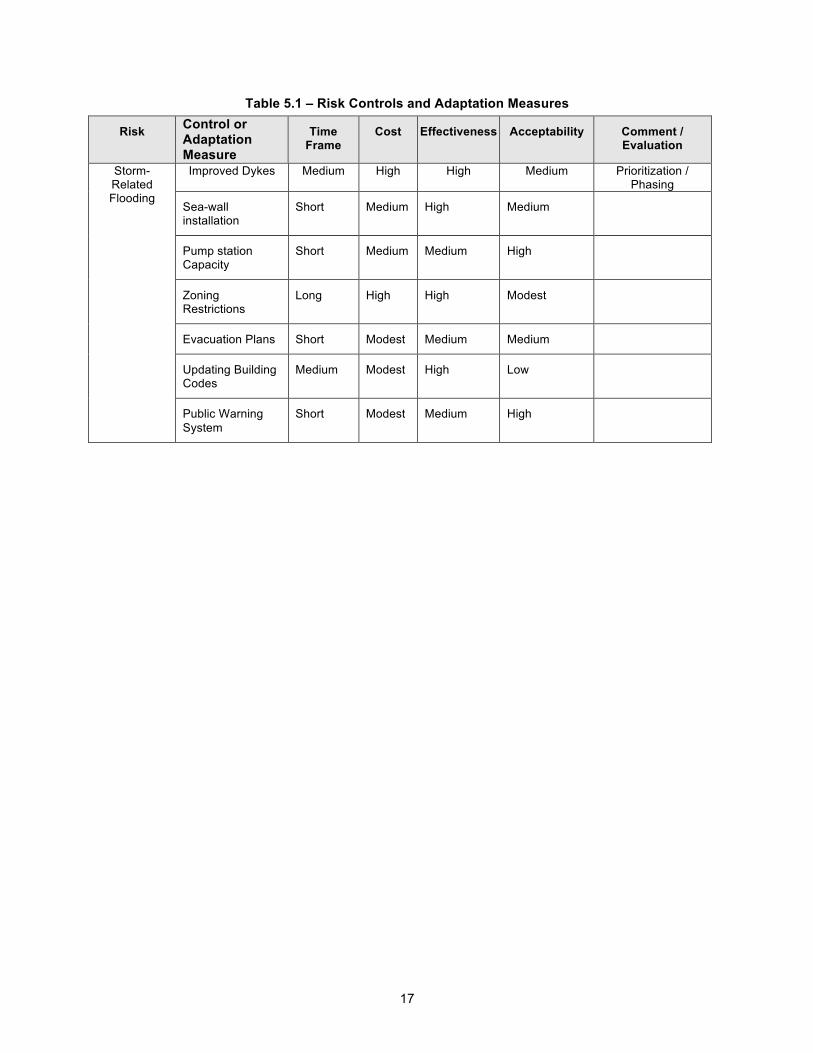
17
Table 5.1 – Risk Controls and Adaptation Measures
Risk
Control or Adaptation Measure
Time Frame
Cost Effectiveness Acceptability Comment / Evaluation
Improved Dykes Medium High High Medium Prioritization / Phasing
Sea-wall installation
Short Medium High Medium
Pump station Capacity
Short Medium Medium High
Zoning Restrictions
Long High High Modest
Evacuation Plans Short Modest Medium Medium
Updating Building Codes
Medium Modest High Low
Storm-Related Flooding
Public Warning System
Short Modest Medium High
18
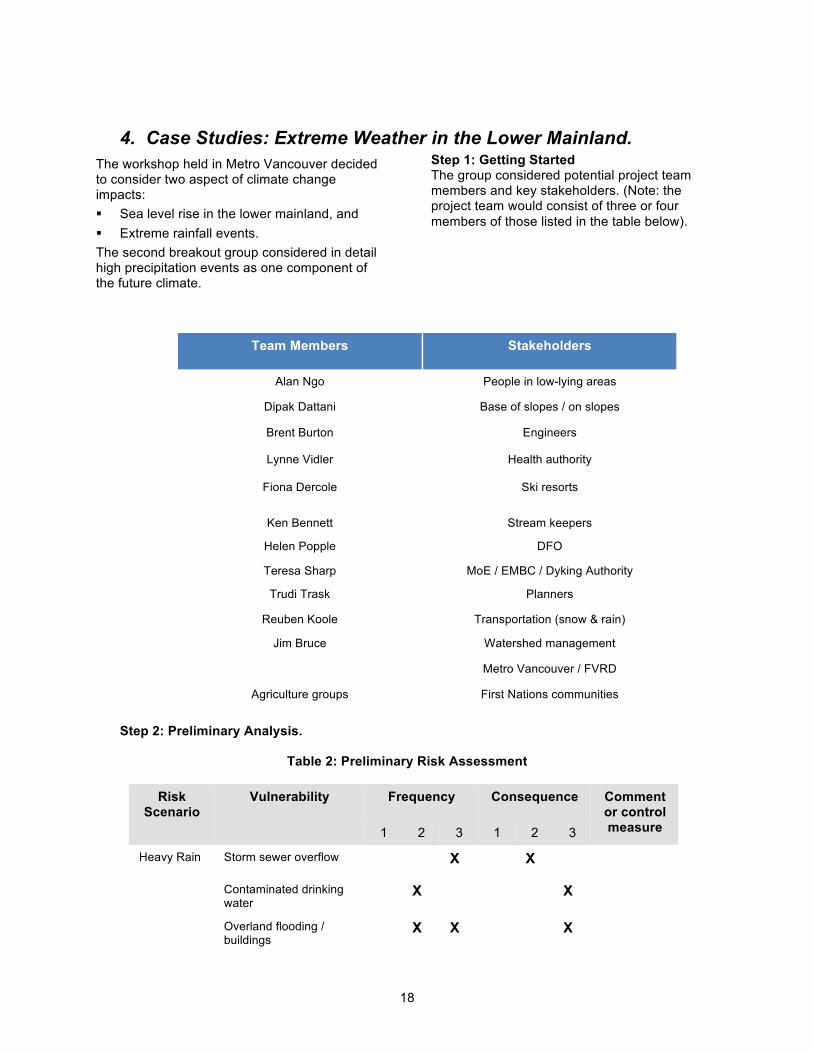
4. Case Studies: Extreme Weather in the Lower Mainland. The workshop held in Metro Vancouver decided to consider two aspect of climate change impacts: ! Sea level rise in the lower mainland, and ! Extreme rainfall events. The second breakout group considered in detail high precipitation events as one component of the future climate.
Step 1: Getting Started The group considered potential project team members and key stakeholders. (Note: the project team would consist of three or four members of those listed in the table below).
Team Members Stakeholders
Alan Ngo People in low-lying areas
Dipak Dattani Base of slopes / on slopes
Brent Burton Engineers
Lynne Vidler Health authority
Fiona Dercole Ski resorts
Ken Bennett Stream keepers
Helen Popple DFO
Teresa Sharp MoE / EMBC / Dyking Authority
Trudi Trask Planners
Reuben Koole Transportation (snow & rain)
Jim Bruce Watershed management
Metro Vancouver / FVRD
Agriculture groups First Nations communities
Step 2: Preliminary Analysis.
Table 2: Preliminary Risk Assessment
Frequency Consequence Risk Scenario
Vulnerability
1 2 3 1 2 3
Comment or control measure
Heavy Rain Storm sewer overflow X X !
Contaminated drinking water
X X !
Overland flooding / buildings
X X X !
19
Urban landslides X X !
Septic field failure X X !
CSO / STP upsets X X !
Stream bank erosion X X !
Habitat disturbance X X !
Heavy Snow
People w/ mobility challenges
X X !
Mobility X X !
Snow clearing X X ! Step 3: Risk Estimation.
Table 3.1 – Estimate of Frequency of Risks Frequency Very
Unlikely
Occasional Occurrence
Moderately Frequent
Occurs Often or
More Frequently
Virtually Certain to be Much
More Frequent
Storm sewer overflow
X
Contaminated drinking water
X
Overland flooding / buildings
X
Urban landslides
X
Septic field failure
X
CSO / STP upsets
X
Stream bank erosion
X
Habitat disturbance
X
Snow: People w/ mobility challenges
X
Snow: Mobility X
20
Frequency Very Unlikely
Occasional Occurrence
Moderately Frequent
Occurs Often or
More Frequently
Virtually Certain to be Much
More Frequent
Snow clearing X
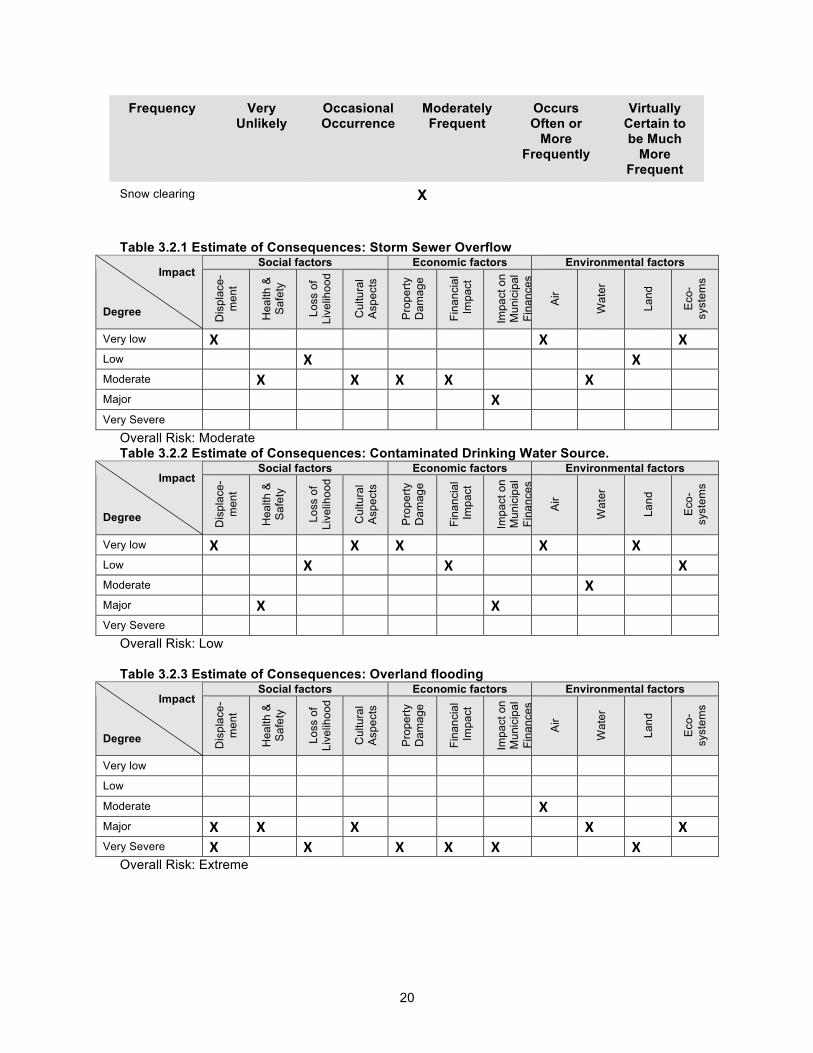
Table 3.2.1 Estimate of Consequences: Storm Sewer Overflow
Social factors Economic factors Environmental factors Impact
Degree Dis
plac
e-
men
t
Hea
lth &
S
afet
y
Loss
of
Live
lihoo
d
Cul
tura
l A
spec
ts
Pro
perty
D
amag
e
Fina
ncia
l Im
pact
Im
pact
on
Mun
icip
al
Fina
nces
Air
Wat
er
Land
Eco
- sy
stem
s
Very low !" " " " " " " !" " " !"Low " " !" " " " " " " !" "Moderate " !" " !" !" !" " " !" " "Major " " " " " " !" " " " "Very Severe " " " " " " " " " " "
Overall Risk: Moderate Table 3.2.2 Estimate of Consequences: Contaminated Drinking Water Source.
Social factors Economic factors Environmental factors Impact
Degree Dis
plac
e-
men
t
Hea
lth &
S
afet
y
Loss
of
Live
lihoo
d
Cul
tura
l A
spec
ts
Pro
perty
D
amag
e
Fina
ncia
l Im
pact
Im
pact
on
Mun
icip
al
Fina
nces
Air
Wat
er
Land
Eco
- sy
stem
s
Very low !" " " !" !" " " !" " !" "Low " " !" " " !" " " " " !"Moderate " " " " " " " " !" " "Major " !" " " " " !" " " " "Very Severe " " " " " " " " " " "
Overall Risk: Low Table 3.2.3 Estimate of Consequences: Overland flooding
Social factors Economic factors Environmental factors Impact
Degree Dis
plac
e-
men
t
Hea
lth &
S
afet
y
Loss
of
Live
lihoo
d
Cul
tura
l A
spec
ts
Pro
perty
D
amag
e
Fina
ncia
l Im
pact
Im
pact
on
Mun
icip
al
Fina
nces
Air
Wat
er
Land
Eco
- sy
stem
s
Very low " " " " " " " " " " "Low " " " " " " " " " " "Moderate " " " " " " " !" " " "Major !" !" " !" " " " " !" " !"Very Severe !" " !" " !" !" !" " " !" "
Overall Risk: Extreme
21
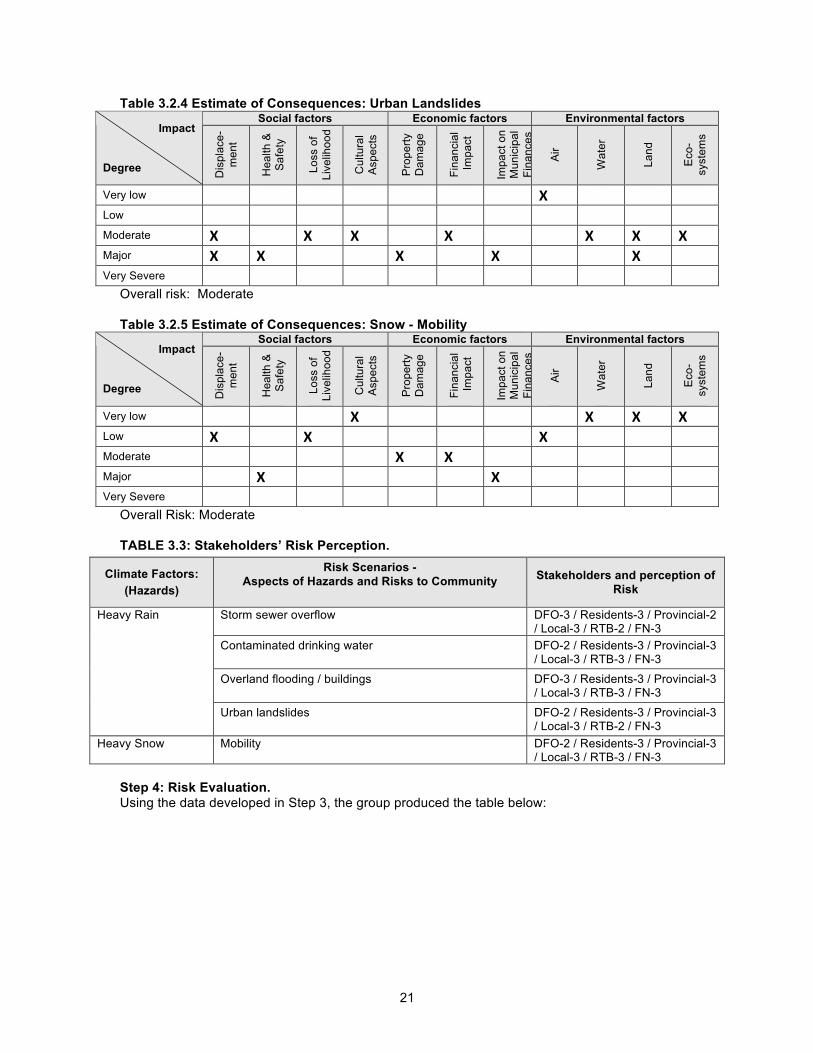
Table 3.2.4 Estimate of Consequences: Urban Landslides Social factors Economic factors Environmental factors
Impact
Degree Dis
plac
e-
men
t
Hea
lth &
S
afet
y
Loss
of
Live
lihoo
d
Cul
tura
l A
spec
ts
Pro
perty
D
amag
e
Fina
ncia
l Im
pact
Im
pact
on
Mun
icip
al
Fina
nces
Air
Wat
er
Land
Eco
- sy
stem
s
Very low " " " " " " " !" " " "Low " " " " " " " " " " "Moderate !" " !" !" " !" " " !" !" !"Major !" !" " " !" " !" " " !" "Very Severe " " " " " " " " "
Overall risk: Moderate Table 3.2.5 Estimate of Consequences: Snow - Mobility
Social factors Economic factors Environmental factors Impact
Degree Dis
plac
e-
men
t
Hea
lth &
S
afet
y
Loss
of
Live
lihoo
d
Cul
tura
l A
spec
ts
Pro
perty
D
amag
e
Fina
ncia
l Im
pact
Im
pact
on
Mun
icip
al
Fina
nces
Air
Wat
er
Land
Eco
- sy
stem
s
Very low " " " !" " " " " !" !" !"Low !" " !" " " " " !" " " "Moderate " " " " !" !" " " " " "Major " !" " " " " !" " " " "Very Severe ! ! ! ! ! ! ! ! ! ! !
Overall Risk: Moderate TABLE 3.3: Stakeholders’ Risk Perception.
Climate Factors: (Hazards)
Risk Scenarios - Aspects of Hazards and Risks to Community
Stakeholders and perception of Risk
Storm sewer overflow DFO-3 / Residents-3 / Provincial-2 / Local-3 / RTB-2 / FN-3
Contaminated drinking water DFO-2 / Residents-3 / Provincial-3 / Local-3 / RTB-3 / FN-3
Overland flooding / buildings DFO-3 / Residents-3 / Provincial-3 / Local-3 / RTB-3 / FN-3
Heavy Rain
Urban landslides DFO-2 / Residents-3 / Provincial-3 / Local-3 / RTB-2 / FN-3
Heavy Snow Mobility DFO-2 / Residents-3 / Provincial-3 / Local-3 / RTB-3 / FN-3
Step 4: Risk Evaluation. Using the data developed in Step 3, the group produced the table below:
22
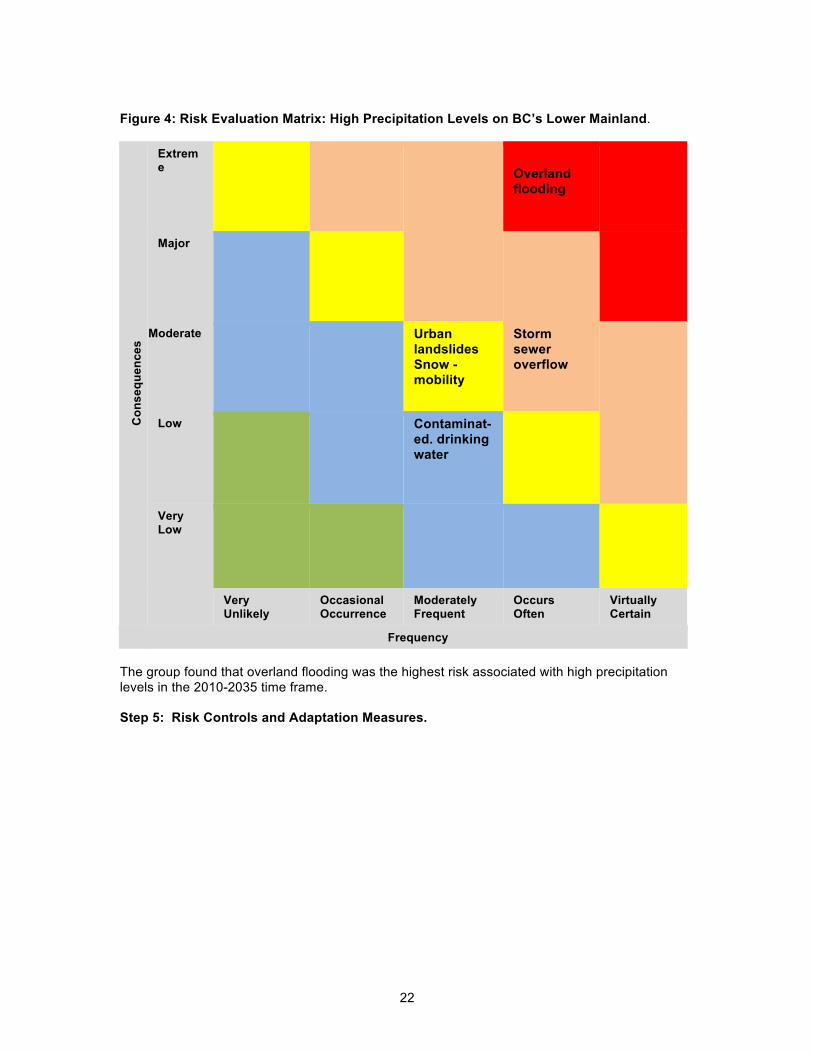
Figure 4: Risk Evaluation Matrix: High Precipitation Levels on BC’s Lower Mainland.
Extreme
" " " "Overland flooding "
"
Major
! ! ! ! !
Moderate
! ! Urban landslides Snow - mobility
Storm sewer overflow
!
Low
! ! Contaminat-ed. drinking water
!
Very Low
! ! ! ! !
Con
sequ
ence
s
Very Unlikely
Occasional Occurrence
Moderately Frequent
Occurs Often
Virtually Certain
Frequency The group found that overland flooding was the highest risk associated with high precipitation levels in the 2010-2035 time frame. Step 5: Risk Controls and Adaptation Measures.

23
Table 5.1 – Risk Controls and Adaptation Measures
Risk
Control or Adaptation Measure
Time Frame
Cost Effectiveness Acceptability Comment / Evaluation
Raise / improve dykes
5yrs $$$$ Mod-high Moderate Regional differences
Increase pump capacity
3yrs $$$ High High
Floodplain mapping / zoning
1yr $ Moderate Moderate Land use change = decades
DPs / MBEs 1yr $ High Moderate Land use change = decades
Land purchase Long-term $$$ High Low
Overland flooding
Dredging / debris management
Short-term
$$ Moderate Moderate Depends on envir. approvals
Increase capacity Short-term
$$ High High Purchase vs. contract
Public education Ongoing $ Low Moderate Subsidized shovels
Parking regulations
Short-term
$ Moderate Low Potential cost recovery
Facility closures Short-term
$ Moderate High Snow days!
Snow - mobility
Road closures Short-term
$ High Moderate Local implementation

24
Workbook This Annex contains the templates suggested in Chapter 4 of Volume 1:
• The risk scenarios (Step 2) • Estimates of Frequency or Probability of risks (Step 3) • Estimates of Consequence of risks (Step 3) • Stakeholder Risk Perceptions (Step 3) • Evaluation of Risks (Step 4) • Adaptation Measures and Risk Controls (Step 5)
The templates can be photocopied for use by risk project teams. The headings of these templates are suggestions only. The project team can change them to suit their needs.
25
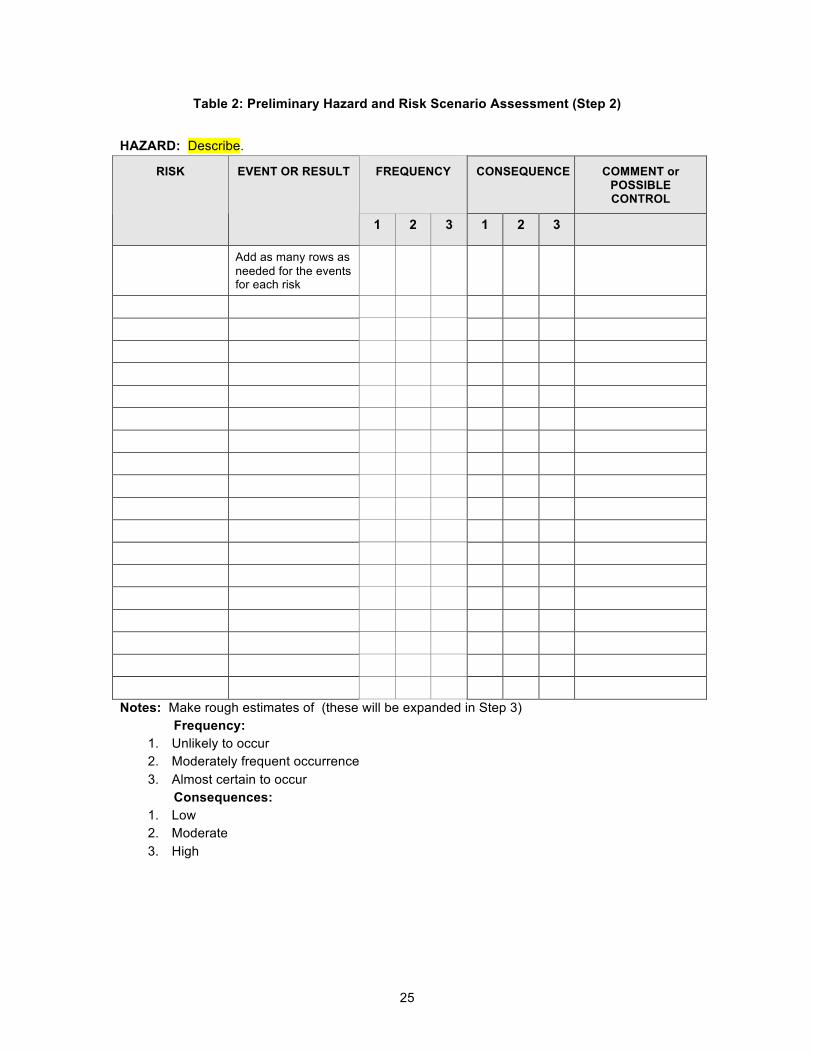
Table 2: Preliminary Hazard and Risk Scenario Assessment (Step 2)
HAZARD: Describe.
FREQUENCY CONSEQUENCE COMMENT or POSSIBLE CONTROL
RISK EVENT OR RESULT
1 2 3 1 2 3
Add as many rows as needed for the events for each risk
Notes: Make rough estimates of (these will be expanded in Step 3) Frequency:
1. Unlikely to occur 2. Moderately frequent occurrence 3. Almost certain to occur
Consequences: 1. Low 2. Moderate 3. High

26
Table 3.1: Estimates of Frequency or Probability of Risks (Step 3) (Use as many rows as needed)
Probability or Frequency
Risk Event
Very Unlikely to Happen
Occasional Occurrence
Moderately Frequent Occurs Often
Virtually Certain to
Occur
!
!
!
!
!
!
!
!
! Note: If the event is ongoing the frequency should be related to it reaching a more severe level than what is occurring now.
Table 3.2: Estimates of Consequences of Risks (Step 3) Risk Event (Use one table for each risk event)
Social factors Economic factors Environmental factors Impact
Degree Dis
plac
e-
men
t
Hea
lth &
S
afet
y
Loss
of
Live
lihoo
d
Cul
tura
l A
spec
ts
Pro
perty
D
amag
e
Fina
ncia
l Im
pact
Im
pact
on
Mun
icip
al
Fina
nces
Air
Wat
er
Land
Eco
- sy
stem
s
Very low
Low
Moderate
Major
Very Severe
27
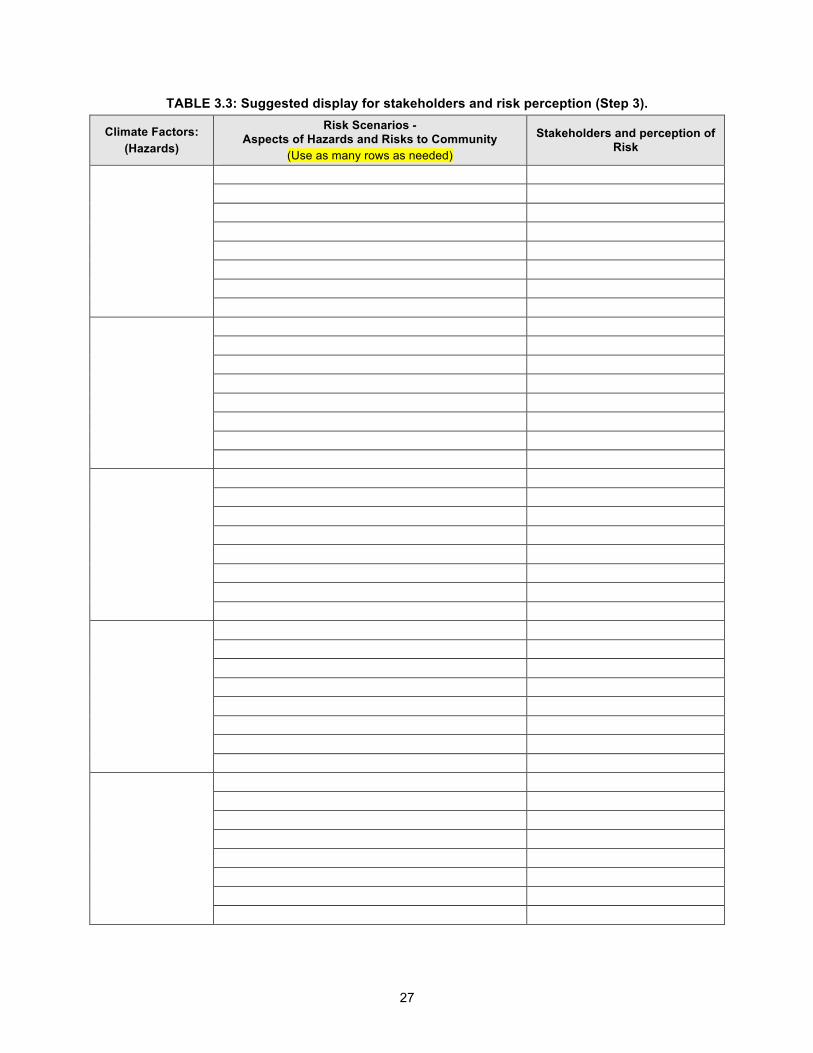
TABLE 3.3: Suggested display for stakeholders and risk perception (Step 3).
Climate Factors: (Hazards)
Risk Scenarios - Aspects of Hazards and Risks to Community
(Use as many rows as needed)
Stakeholders and perception of Risk
28
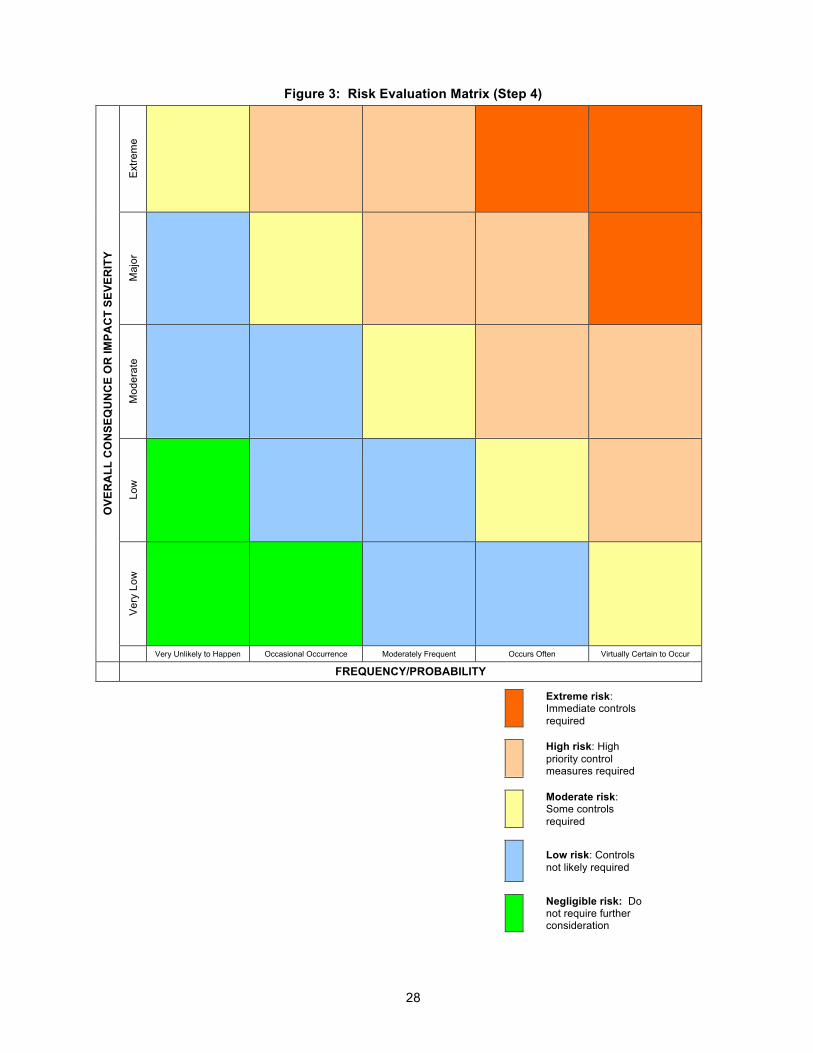
Figure 3: Risk Evaluation Matrix (Step 4)
Ext
rem
e
Maj
or
Mod
erat
e
Low
Ver
y Lo
w
OVE
RA
LL C
ON
SEQ
UN
CE
OR
IMPA
CT
SEVE
RIT
Y
Very Unlikely to Happen Occasional Occurrence Moderately Frequent Occurs Often Virtually Certain to Occur
FREQUENCY/PROBABILITY
Extreme risk: Immediate controls required
High risk: High
priority control measures required
Moderate risk:
Some controls required
Low risk: Controls not likely required
Negligible risk: Do
not require further consideration
29
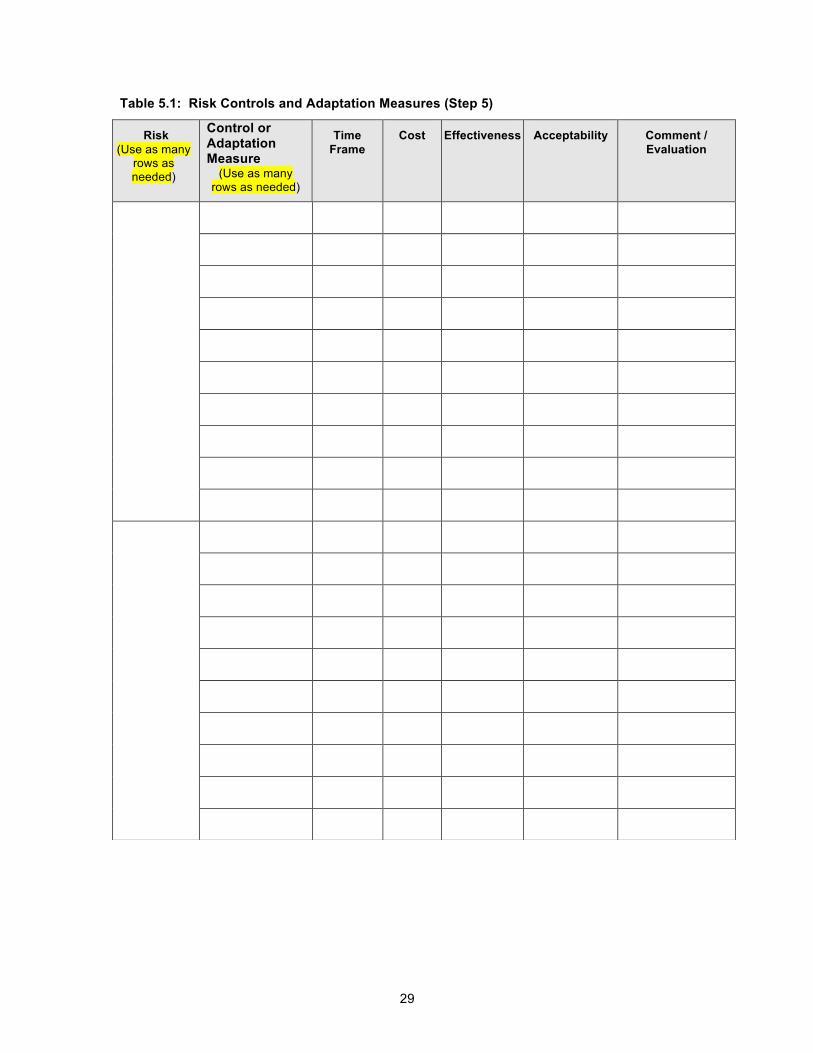
Table 5.1: Risk Controls and Adaptation Measures (Step 5)
Risk (Use as many
rows as needed)
Control or Adaptation Measure
(Use as many rows as needed)
Time Frame
Cost Effectiveness Acceptability Comment / Evaluation
30
Acknowledgments This Guide was produced by Summit Enterprises International (S.e.i.) Inc. and authored by Dr. James P. Bruce and I.D. Mark Egener with assistance from Robert A. Black. The funding support provided by Natural Resources Canada, Climate Change Impacts & Adaptation Directorate and the insurance industry’s Institute for Catastrophic Loss Reduction is gratefully acknowledged and much appreciated as is the support provided by the British Columbia government. The authors are indebted to the participation of by representatives of British Columbia local governments whose insights and assistance greatly improved the quality of the Guide.