INFRASTRUCTURE AND RENEWABLES: TRENDS AND OPPORTUNITIES IN FLORIDA Gary Schumann.
311
C H A P T E R 11
Adaptation of Florida�s Urban
Infrastructure to Climate Change Frederick Bloetscher1, Serena Hoermann2, and Leonard Berry3,4
1Department of Civil, Environmental and Geomatics Engineering, Florida Atlantic University, Boca
Raton, FL; 2Center for Urban and Environmental Solutions, Florida Atlantic University, Boca Raton, FL; 3Florida Center for Environmental Studies, Florida Atlantic University, Davie, FL; 4Coastal Risk
Consulting, Plantation, FL
This chapter looks at how the impacts of climate change affect different parts of Florida. With more than
1500 miles of coastline that contains numerus differences in character between the state�s southern-most
point in the Florida Keys to the northwest Florida Panhandle and northeast Florida in Jacksonville, it is
easy to see why areas across the state are not all the same; temperature, rainfall rates, and even the
potential for sea level rise can vary significantly depending on what part of the state one is in. For
example, southeast Florida and the Tampa Bay area are already dealing with sea level rise issues, but
there is much work to be done in order to assess the risks and help identify potential solutions. Efforts to
adapt to rising seas will need to draw upon prior research and current work to develop tool box strategies
that involve the hard and soft components. A background of impacts to water resources (less rainfall has
been detected) will be discussed.
Key Messages
• Climate changes, along with population continuing to increase, makes the water supply planning and management a critical challenge for the state.
• Climate change factors in Florida impact different areas differentially, making it unfeasible to develop one-size-fits-all policies. This makes it essential to tailor climate adaptation management strategies to each community’s unique needs.
• Storm surge in coastal areas will increase flooding and property damage. • Flooding is not just a coastal issue, but an inland issue, leading to lower capacity for soil to
absorb precipitation, thereby increasing the risk of flooding because aquifers are full and groundwater has no place to go.
• Climate change, especially sea level rise, will have adverse impacts on water, sewer, transportation and stormwater infrastructure. The risk of failure from these systems put private property and economic prosperity at risk.
• The development of a framework to evaluate the impacts of climate change on infrastructure and urban development (as they are intrinsically intertwined) requires (1) identification of vulnerable areas, and (2) the development of successful flood mitigation scenarios to address community vulnerability and cost effectiveness.
• A set of strategies to combat or mitigate climate impacts on a community will be community-specific and usually require significant engineering and planning to determine the best mix.
• Longer-term development policies will need to include the 50- and 100-year vision for development. This vision will address hard and green infrastructure, policy and development objectives and funding needs.

3 12 • FR E D E R I C K B L O E TS C H E R E T A L.
Keywords
Sea level rise adaptation; Groundwater; Aquifer drainage; Toolbox of strategies
A Long Water History
he history of Florida has always been defined by water—either too much or too little, depending on the vision of the decision-makers at the time. One hundred and fifty years ago, much of Florida was swamp; too much water to live and settle in, except for small
bands of Native Americans. But at the turn of the 20th century and starting with the creation of the Florida East Coast Railroad by Henry Flagler, the age of infrastructure construction began in Florida. Then-Governor Napoleon Bonaparte Broward proposed draining the wetlands to permit more settlement of people and farming throughout the state, and drainage on the East Coast began in earnest, spurring the accompanying migrations of winter residents. Hurricanes in 1926 and 1928 disrupted this expansion, requiring another round of diking (the Hoover Dike – see Fig. 11.1) and canal building that kicked off 20 more years of construction, this time around Lake Okeechobee and including development of the Everglades Agricultural Area on the lake’s south side. Post-World War II, hurricanes prompted the Army Corps of Engineers’ next round of canals, dikes, and pumping stations. This effort included completion the largest drainage project of its time—the Central and South Florida Flood Control project, which was authorized by the Flood Control Act of 1948. The project drained the southern half of the State of Florida, altering drainage and recharge patterns, and permanently changing aquifer levels and conditions. The work continued into the late 1960s. In other words, for more than 70 years, decision-makers in Florida had acted upon the idea that there was too much water in the state.
Figure 11.1. Hoover Dike from US 27.
T
A D A P T A T I O N O F F L O R I DA ’ S U R B A N IN F R A S T R UCT U R E T O C L I M A T E C H A N G E • 3 13
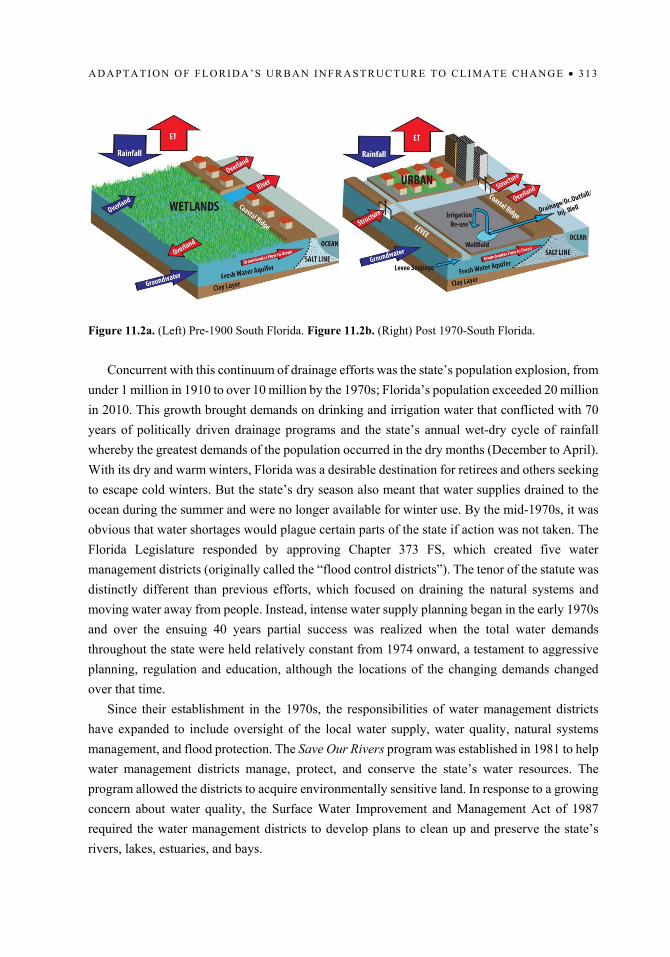
Figure 11.2a. (Left) Pre-1900 South Florida. Figure 11.2b. (Right) Post 1970-South Florida.
Concurrent with this continuum of drainage efforts was the state’s population explosion, from
under 1 million in 1910 to over 10 million by the 1970s; Florida’s population exceeded 20 million in 2010. This growth brought demands on drinking and irrigation water that conflicted with 70 years of politically driven drainage programs and the state’s annual wet-dry cycle of rainfall whereby the greatest demands of the population occurred in the dry months (December to April). With its dry and warm winters, Florida was a desirable destination for retirees and others seeking to escape cold winters. But the state’s dry season also meant that water supplies drained to the ocean during the summer and were no longer available for winter use. By the mid-1970s, it was obvious that water shortages would plague certain parts of the state if action was not taken. The Florida Legislature responded by approving Chapter 373 FS, which created five water management districts (originally called the “flood control districts”). The tenor of the statute was distinctly different than previous efforts, which focused on draining the natural systems and moving water away from people. Instead, intense water supply planning began in the early 1970s and over the ensuing 40 years partial success was realized when the total water demands throughout the state were held relatively constant from 1974 onward, a testament to aggressive planning, regulation and education, although the locations of the changing demands changed over that time.
Since their establishment in the 1970s, the responsibilities of water management districts have expanded to include oversight of the local water supply, water quality, natural systems management, and flood protection. The Save Our Rivers program was established in 1981 to help water management districts manage, protect, and conserve the state’s water resources. The program allowed the districts to acquire environmentally sensitive land. In response to a growing concern about water quality, the Surface Water Improvement and Management Act of 1987 required the water management districts to develop plans to clean up and preserve the state’s rivers, lakes, estuaries, and bays.

3 14 • FR E D E R I C K B L O E TS C H E R E T A L.
Because periodic years of low rainfall are part of Florida’s precipitation cycle (they occur every 6-8 years), failure to plan for these low rainfall years creates conditions akin to a drought— water supplies may be limited and competition increases. Under such conditions, the water management districts are responsible for mediating between the interested parties. But meeting all user needs can be difficult, if not impossible, which has led to legislation that addresses water supply planning. As a result, all five water districts in Florida now have water supply plans that include all spectrums of water use. These plans were initiated in the early 1990s and are updated every five years. Several of the districts have even split their plans into regional units to better address local conditions.
For example, in southeast Florida the 2005-2006 Lower East Coast Water Supply Plan Update was adopted right before the area’s last major “drought,” which occurred in 2007. During that year, rainfall in the upper and central Everglades was about half the norm, while coastal areas saw average rainfall. Consequently, the South Florida Water Management District passed the Regional Water Supply Availability Rule, which limited surficial aquifer water withdrawals to the 2006 levels. Yet the planned alternatives—water reuse, aquifer storage, and deeper brackish sources—have all proven to be a greater challenge to implement than anticipated. As a result, some utilities have tried indirect potable use as a possible future option, but the water supply permitting authority is lacking since recycling wastewater for potable use is not contemplated in any district’s rules. Concurrently, coastal wellfields, sanitary sewer systems that are the source of the wastewater to be reclaimed, and storm water systems that replenish water supplies via infiltration have all become more vulnerable to the impacts of drought.
All of this makes clear how the history of Florida, specifically the development of infrastructure, has been deeply impacted by water and attempts to manage it; and it is logical to expect the same moving forward. Florida’s continued development and projected climate impacts will help shape the state’s future. Florida’s continued development and projected water supply trends will be impacted by water supply variations, more frequent extreme weather events, a trend noted by Marshall et al. (2003) toward less total summer rainfall but higher intensity storms, an uncertain rainfall expectations for agricultural irrigation, and higher heat which will increase demands for irrigation, as well as domestic and industrial demands.

A D A P T A T I O N O F F L O R I DA ’ S U R B A N IN F R A S T R UCT U R E T O C L I M A T E C H A N G E • 3 15
Figure 11.3. Selected coastal effects of sea level rise.
Addressing the Challenges
Much of Florida’s economy (tourism, housing, and agriculture) is based on having adequate water supplies. Climate change is already impacting water availability in the state through three key drivers: 1) changes in precipitation patterns, 2) temperature increases that alter evaporation rates while increasing irrigation needs, and 3) sea level rise. As discussed in depth in prior chapters, these three factors may create the perfect storm, resulting in widespread disruption to the state’s long-term economic growth and development. Bloetscher (2012) designated regions across the state and showed how each of the regions will be differentially affected by changes in climate. He discussed how water issues will significantly impact the various regions’ economic,

3 16 • FR E D E R I C K B L O E TS C H E R E T A L.
natural and built environmental systems, and detailed how there are differing perceptions of risk depending on what area of the state is being looked at.
For example, the increase in sea level observed along the Atlantic Coast (Bloetscher et al. 2012) combined with consistent population growth makes it essential for that area to focus on and continue to improve flood management strategies (NFIP 2011; Parkinson 2010; Schmidt et al. 2011; Warner et al. 2012; Zhang et al. 2011, 2011a). Bloetscher (2012) identified southeast Florida, the Florida Keys and southwest Florida as being far more vulnerable to sea level rise than the rest of the state. These three areas have dense populations, low topography, and are at high risk for climate change impacts (specifically sea level rise and surges).
On the other hand, in the northwest, northeast, north central ridge and Kissimmee River Valley regions, the risks associated with sea level rise due to climate change are not viewed with as much concern because those areas are at a higher elevations and less densely populated; that said, future water supplies due to precipitation changes may be the key driver that those areas must contend with (Bloetscher, 2012). This is an example of how different areas of the state will experience distinct impacts and risks; one-size-fits-all policies may turn out to be undesirable and, in some cases, ineffective. Many solutions must be tailored to the local needs and available resources while other challenges will require cooperative efforts between different government entities and even the private sector.
Water Supply
Florida has five primary sources of potable water that are aerially limited: 1) the Biscayne aquifer located in southeast Florida, 2) the Floridan aquifer system located in North and Central Florida as fresh water and in South Florida at brackish water 100 ft below the surface, 3) a series of sand aquifers that have limited production, 4) a few surface water bodies, and 5) the ocean. As a result, Florida has greater abundance and more sustainable water supplies than most other states in the country. Each of Florida’s potable water sources is unique, particularly in terms of their challenges and vulnerabilities.
The Biscayne aquifer is a phreatic or water table system (not under pressure or protected by an overlying layer of rock) located in southeast Florida. In fact, the Biscayne aquifer is that area’s only source of freshwater. But since it is a karst formation, the aquifer’s flow channels make it susceptible to influxes of saltwater. Interestingly, it is anticipated that as sea level rises Florida’s groundwater level will also rise, which might create an additional water supply through dewatering along roads and developed area to keep groundwater levels low to protect infrastructure (much like dewatering used during construction, only permanent). Higher future water tables could improve the availability of potable water in South Florida, higher water tables can also complicate strategies such as reclaimed water irrigation (higher water tables increase

A D A P T A T I O N O F F L O R I DA ’ S U R B A N IN F R A S T R UCT U R E T O C L I M A T E C H A N G E • 3 17
the potential for flooding), and increasing infiltration into sanitary sewer systems with salt water that requires reverse osmosis treatment to remove the salt prior to use for irrigation.
Located south of Lake Okeechobee is the Floridan aquifer, which, because there is no local recharge, is confined, brackish, and unsustainable. Over time, utilities using this source have experienced a degradation of water quality making its potential of large scale utilization unlikely. Drilling deeper is not South Florida’s future.
In addition, many areas north of Interstate 4 already appear to be at the limit of their sustainable water yields. This means that water supply may be a barrier to future economic development in the northern half of the state. North Florida has a few, mostly small surface water systems. Many of the streams in the Florida Panhandle originate from Georgia and Alabama, posing actual and potential conflict points and a major barrier to future development. The possibility of lower total rainfall in the state may also create significant adverse effects on local agriculture and development.
Many alternative water supply strategies have been proposed as solutions to Florida’s water supply issues, but most are expensive, involve large power draws, and are unlikely to be pursued by regional utilities (except in urbanized areas). For example, desalinization (removing salt from water) is touted as a potential solution, and certainly coastal areas could desalinize the nearby ocean water. But the desalinization process is expensive and many of these coastal areas currently have sufficient freshwater so there is no incentive to invest in establishing desalinization capabilities. Meanwhile, the inland areas in need of additional water supplies do not have access to the ocean and cannot easily adopt desalinization as a way to meet their potable water needs. That said, some municipalities in northeast Florida and the Tampa Bay area have seriously looked at or invested in desalinization capacity in a limited manner.
Another alternative solution, aquifer storage and recovery, has met with some success along Florida’s West Coast; but it has not been as successful in southeast Florida or North Florida, likely due to confinement/formation, recovery, and metals recovery issues (Bloetscher et al. 2014). Also, while aquifer storage and recovery may be useful for utilities, agriculture is unlikely to pursue it as a water management strategy due to its higher cost that current supplies and the recovery uncertainty. Case in point, the South Florida Water Management District’s regional aquifer storage and recovery program, which was originally designed to store billions of gallons of water, has been significantly scaled back due to cost and recovery challenges. Two wells have 10 years of testing. One recovers only 20% of the injected water. .
Surface storage is another alternative strategy sometimes proposed, but areas with large storage potential are virtually non-existent in much of Florida. Discussions are ongoing about using the C51 Reservoir (currently under construction) to store billions of gallons of stormwater in western Palm Beach County as a way of supplementing water supplies for urban utilities; but despite its decade long history this multi-billion dollar project is several years away from being completed. Hence, the potential for increases in conflicts over water resources will no doubt persist.

3 18 • FR E D E R I C K B L O E TS C H E R E T A L.
And finally, water reuse already serves as an effective solution for irrigation demands in many areas of the state (although most agricultural users are not in proximity to wastewater utilities and balk at the cost). However, water quality is a barrier for a variety of reuse options. For example, recharging water conservation areas with reclaimed water treated to higher standards might be possible in southeast Florida, but it can be cost prohibitive in other parts of the state that lack such catchment areas. While indirect potable recharge may work in several regions of the state (e.g., southeast Florida), the high cost and public perception make it unattractive at present. That said, as an example of desperate times supporting more costly solutions, Texas’ Wichita Falls and Big Spring both created direct potable water treatment systems for their communities when reservoir levels dropped below 5% of capacity.
Mitigating Risks Associated with Flooding and Sea Level Rise
Bloetscher et al. (2016) made it clear that flooding is not just a coastal issue, but an issue inland as well. Higher groundwater levels equate to reduced soil storage capacity, which means lower capacity for soil to absorb precipitation, thereby increasing the risk of groundwater flooding (Romah 2012). Chang et al. (2011) described an overall “lifting process” by which there is a 1:1 ratio in water table elevation that can be correlated to sea level rise, while Bloetscher and Romah (2015) and Romah (2012) noted that groundwater levels in southeast Florida are intrinsically linked to the sea level. Thus, while coastal populations are particularly at risk for flooding due to erosion, inundation, and storm surge, interior populations are susceptible to rising water tables and extended periods of inundation. It is this limited soil storage that leads to flooding, necessitating the extensive drainage works facilities that discharge large volumes of water during the wet season. Sea level rise, combined with the end of the wet season in September, the king tides in late September and October, and southeast Florida’s flat topography puts much of the region, whether coastal or inland, at risk.
Due to the associated loss of soil storage capacity caused by sea level rise, an increase in the intensity of storms due to climate change is expected to overwhelm the current storm water infrastructure. Projections indicate the potential for severe damage to southeast Florida’s energy systems, transportation infrastructure, water infrastructure, agricultural lands, and the Everglades ecosystem (Zhang 2011; Karl et al. 2009). Mapping models indicate that infrastructure, primarily roadways (and the associated infrastructure laid underneath them), will be impacted first, followed by property. Higher groundwater elevations created by sea level rise will compromise stormwater and transportation infrastructure in low-lying areas, impacting access to roads, bridges, rail and rail transit (Bloetscher and Romah 2015). Roadway beds can be damaged by inundation and higher water table levels (FDOT 2012). Road bases can become saturated, causing premature base failure. In addition, since soil storage capacity is diminished, the potential for frequently flooded roadways will likely damage pavements (FDOT 2012). Fig. 11.4

A D A P T A T I O N O F F L O R I DA ’ S U R B A N IN F R A S T R UCT U R E T O C L I M A T E C H A N G E • 3 19
illustrates roadway bases before and after sea level rise. Sea level rise will affect FDOT roadways, which are main arteries for transportation as well as emergency evacuation routes, by wetting the base. Many local roads that do not meet stringent FDOT standards are far more vulnerable to failure. As a result, billions of dollars in infrastructure investment would be needed just to maintain the status quo.
AsphaltBaseSubbaseDrainage
Water table – current minimum is 2 ft NGVD (high tide)
Current Base Condition for Low lying Roads
AsphaltBaseSubbaseDrainage
Water table – future minimum is 5 ft NGVD (high tide)
Future Condition for Low lying Roads
Roadway Elevation 8-10 ft
Roadway Elevation 8-10 ft
Figure 11.4. Current and future roadway conditions.
Flooding and sea level rise can pose serious threats when it comes to infrastructure systems
below the road base. Existing sanitary sewer systems in Florida are constructed at depths below the groundwater level. Unfortunately, submerged pipes increase the potential for infiltration through cracked pipes or poorly constructed pipes systems, thereby consuming capacity in treatment plants. Inflow during rainstorms or other inundation can leach into the sanitary sewer systems through unsealed manholes, open cleanouts, and problem surface connections. Inflow can lead directly to sanitary sewer overflows and result in fines assessed against the utility and property damage. Water mains are typically shallower than sewer systems, but they too may also periodically be submerged in groundwater. Near the coast, pipelines may suffer brackish or freshwater conditions, depending on the aquifer levels. This is particularly damaging to cast or ductile iron pipes, both of which may eventually leak and both are prone to movement as groundwater can alter the pipe beds.
Beach erosion is another impact of the combination of sea level rise and coastal storms. As beaches erode, coastal developments face greater risks. Sea walls fail, building foundations can be disrupted, and concrete is more prone to damage from the lower pH, high salinity seawater. This means that effective methods for protecting the coastal infrastructure must be found. And finally, there are indications that the frequency of certain vector and waterborne illnesses due to climate changes (Bloetscher et al. 2016). Therefore, a better understanding of future trends in

3 20 • FR E D E R I C K B L O E TS C H E R E T A L.
mosquito-spread diseases (e.g., Zika, dengue fever, or chikungunya) or waterborne diseases (e.g., giardia and cryptosporidium) is needed to adequately address the challenges posed by climate change.
In short, the future Florida condition will be characterized by a warmer climate, greater variability in storm intensity, greater extremes in temperature, (Marshall et al 2003) as well as uncertainty about rainfall and timing of same. Floridians should anticipate sea level rise that will threaten infrastructure reliability, economic activity, property values, public health and put population risks (Bloetscher et al. 2012, 2014, 2016), all of which will be tied to Florida’s changing climate.
Level of Service in Vulnerable Areas
An important consideration prior to any infrastructure investment by local communities should begin by defining the acceptable “level of service” for areas identified as vulnerable. For example, king tides occur annually (in September/October) in southeast Florida often resulting in coastal flooding. Thus, defining the level of service will involve determining how often it is acceptable for flooding to occur in that community on an annual basis. The effects of sea level rise on the level of service should be used to update the mapping in terms of demonstrating changes in vulnerability and increased flooding frequency. For example, a 1% flooding frequency translates to four flood days per year.
Fig. 11.5 shows the vulnerable and potentially vulnerable areas in Miami-Dade and Broward counties, illustrating that the impacts of sea level rise and groundwater changes are significantly higher than the bathtub models project. Modeling by Romah (2012) showed that the areas in red may be vulnerable at the 99 percentile condition (four days per year), the yellow indicates potentially vulnerable, and the green indicates areas not currently vulnerable. This figure shows the current, 1, 2, and 3 ft sea level rise conditions. Of interest is that the inland areas are at far greater risk than perceived by residents, public officials and government agency staffs, given that the groundwater continues to rise and the topography slopes to the west from the coastal ridge (Romah 2012; Bloetscher and Romah 2015).
Failure to identify potentially vulnerable areas and establish an acceptable level of service prior to an extreme event is often the cause of a loss of confidence in public officials because of increases in flooding and/or property losses, and a perceived weakening level of service by residents.

A D A P T A T I O N O F F L O R I DA ’ S U R B A N IN F R A S T R UCT U R E T O C L I M A T E C H A N G E • 3 21
Figure 11.5. Miami-Dade and Broward counties—vulnerability at 0, 1, 2, 3 ft sea level rise at 99 percentile groundwater/tidal elevations (ignoring current infrastructure).

3 22 • FR E D E R I C K B L O E TS C H E R E T A L.
Proposed Frameworks
Once vulnerable areas are identified, various scenarios can be developed and options can be considered to address a community’s potential needs. One approach is to identify successful mitigation strategies used by other cities that face similar problems based on identified vulnerabilities and cost effectiveness. These two issues can then be combined to develop a framework that can evaluate the impacts of climate change on infrastructure and urban development (as they are intrinsically intertwined). Fig. 11.6 outlines a simplified flow chart that can used as a basis for this type of evaluation.
Figure 11.6. Analytical framework for toolbox development.
The strength of this framework lies in the proposed holistic and incremental approach to
addressing climate change impacts, which includes understanding the combined social and health vulnerabilities in the context of higher exposure of the physical infrastructure to hazards. It combines physical vulnerability with health indicators and social evaluation criteria, and conveys the notion that a plan is not a fixed document, but rather a process that evolves with the changing conditions. Therefore, the approach requires that a mechanism be established to reassess the plan at regular intervals at the community level so that adjustments can incorporate improvements to various infrastructure systems.
Developing a Toolbox
Solving the infrastructure problems discussed in this chapter may be difficult, but not at all impossible. Much of the current work on adaptation to sea level rise focuses on understanding the physical and economic vulnerability of infrastructure, as well as on developing adaptation

A D A P T A T I O N O F F L O R I DA ’ S U R B A N IN F R A S T R UCT U R E T O C L I M A T E C H A N G E • 3 23
strategies for the natural and built environments using new infrastructure systems (Zhang 2011; Hansen et al. 2009; Parkinson 2009; SFRCC 2011; Tebaldi et al. 2012; Titus and Richman 2012; Weiss et al. 2011). Far more statewide coordination will be needed to balance Florida’s urban, natural, water, wastewater and groundwater level needs. Below are some of the primary concerns that will need to be addressed and the steps that can be taken to meet the challenges.
Communities will need to develop a toolbox (i.e., a series of solutions) that can be used to address their specific vulnerabilities. Identifying viable adaptation solutions requires (1) the prior analysis of vulnerability, and (2) overlaying development priorities with expected climate change on GIS maps to identify hotspots where adaptation activities should be focused. This approach will allow for more precise identification of at-risk infrastructure and prediction of impacts on physical infrastructure and the community, as well as local-scale evaluation of conditions. A long-term view is required, since roadways and other infrastructure are normally designed for a 50- to 100-year service life, and they are rarely abandoned. Long-term planning for the effects of climate may also consider possible temporal impacts that can damage infrastructure and limit accessibility to certain services (e.g. health services).
Risk Assessments by Utilities
In order for a community to develop effective mitigation and adaptation strategies, local utilities must judge the vulnerability of their infrastructure and operating protocols (Wallis et al. 2008). Utilities are encouraged to use risk assessments to account for the uncertainties associated with stormwater and any impacts of changes in climate patterns. Strategies should include adaptive management techniques employed during planning and operations, as well as infrastructure improvements. Determining the appropriate actions or strategies to adapt to climate change involves using a vulnerability assessment approach to evaluate the need for operational changes and/or to install new infrastructure or “harden” existing infrastructure. Risk assessment requires evaluation of the likelihood of the climate change impact occurring. For Florida, the changes in rainfall patterns and sea level rise are the most pressing concerns for stormwater master planning; sea level rise will impact flooding and precipitation patterns have changed. However, there is uncertainty about how much and how fast sea level will rise and how precipitation patterns will change the perception of stormwater infrastructure needs.
Deyle et al. (2007) outlined the need for planning for adaptations, protection and potential retreat scenarios given the competition for scarce public dollars over the next 20 to 100 years to deal with sea level rise. However, Frederick and Gleick (1999) noted that socioeconomic implications may restrict the ability of managers and planners to act on required plans or force development changes in the near term. To resolve this, Freas et al. (2008) suggested using risk assessments as a way to determine system vulnerabilities for infrastructure and supply sources using a dual analytical approach known as the threshold–scenario risk assessment framework. The threshold assessment is a qualitative approach that relies on the experience and judgment of

3 24 • FR E D E R I C K B L O E TS C H E R E T A L.
professionals to define vulnerabilities and adaptive strategies. Freas et al. (2008) suggested that in order to set proper thresholds for water systems, experienced water managers’ experience and judgment of meteorological and natural systems is required. Threshold impacts can be assigned based on the infrastructure most susceptible to climate impacts. The method can be applied to any infrastructure system. For example, the most at-risk infrastructure in Iowa during floods in June 2008 were wellheads that were not above the flood stage. Freas et al. (2008) said that setting these thresholds for utilities involves four steps:
1. Define the performance criteria of the system infrastructure 2. Establish variables of importance 3. Define infrastructure component responses to climate change variables 4. Develop adaptation strategies that will reduce or eliminate the impact based on vulnerability
assessment and performance risk. Threshold analyses should identify the weak areas of the system that need hardening through
either adaptive strategies or infrastructure changes that will reduce or eliminate the vulnerability. For example, in the case of water systems identified as weak, a diversified approach to water supplies is the best method to minimize future risks.
A more quantitative approach is the scenario risk assessment, which identifies the likelihood of failure in a system. The purpose of this approach is to quantify risks of a utility’s current system in the event of climate change impacts. Freas et al. (2008) suggested that a scenario risk assessments for utilities involves seven steps. Two additional steps are added here to identify the hardening measures and decision-making steps. 1. Select a range of climate change scenarios based on commonly accepted models 2. Translate these to local scenarios 3. Identify climate change variables of importance (e.g. rainfall frequency, rainfall volume,
temperature, sea level) 4. Determine system responses locally (e.g., incorporate rainfall changes into surface flow
models) 5. Develop adaptation strategies 6. Evaluate robustness of the adaptive strategies 7. Identify hardening measures. 8. Evaluate overall system performance 9. Make the decisions needed to adapt to the change
Adaptations to Address Infrastructure Issues
The next task for communities develop effective mitigation and adaptation strategies involves imagining scenarios whereby toolbox options can be utilized to address flooding in the

A D A P T A T I O N O F F L O R I DA ’ S U R B A N IN F R A S T R UCT U R E T O C L I M A T E C H A N G E • 3 25
community. The goal is identifying successful mitigation strategies used by other cities facing similar challenges (for example, for flooding mitigation strategies, a community would look at cities faced with similar drainage and construction problems).
In order to complete risk assessments, a utility (regional or local) will need sufficient knowledge of the local hydrology. This includes development of surface water flow forecasting models and an integrated surface water–groundwater hydrologic model, all of which incorporate rainfall and temperature variables as driving forces. These models can use the output of downscaled climate models that provide different rainfall and temperature time series and make assessments of the effects of changes in these parameters (i.e., how they affect the service area).
Developing a toolbox of strategies can improve the regional resiliency in response to sea-level rise. It is important to note that any proposed/planned solutions must be site- or community-specific, and most require significant engineering and planning to determine the best set of strategies to pursue. Communities may need to spend millions of dollars to identify their solutions. Hard infrastructure systems and roadways are usually the first systems to be impacted because they are typically positioned lower than buildings and are critical for maintaining transportation. Additionally, most infrastructure systems (water, sewer, stormwater, power) are located within the roadways. As a result, adequate resources for transportation infrastructure and other major investments may need to be given the highest priority. So, for example, catastrophic flooding should be expected during heavy rain events and reducing the vulnerability of a community’s transportation infrastructure will require the design of more resistant and adaptive infrastructure and network systems. This will, in turn, require the development of new performance measures to assess the ability of transportation infrastructure (e.g., roadways, bridges, rail, sea ports, airports) to withstand sea level rise and/or rainfall and to enhance resilience standards and guidelines for design and construction of transportation facilities. Considerations must include retrofitting, material protective measures, rehabilitation and, in some cases, the relocation of facilities to accommodate sea level rise impacts. As they are related, groundwater is also expected to have a significant impact on flooding in low-lying areas as a result of the loss of soil storage capacity. So, groundwater needs to be an important consideration of planning efforts.
Other Measures
In addition to the specific measures outlined above, it makes sense that long-term development policies should include the 50- and 100-year vision of development and require developers to include hardening within ordinances. Additional development in flood prone areas should not be permitted without local solutions or mitigation plans in place. But state and local agencies have been averse to setting such regulations due to private property rights arguments. The challenge is to balance property rights with the practicality of developing or rebuilding projects in areas that are flood prone now or in the future. Lending agencies will ultimately seek relief from the

3 26 • FR E D E R I C K B L O E TS C H E R E T A L.
state if properties lack long-term viability or fall into default due to climate change impacts. Therefore, codes and design guides will need to be modified and standards of practice will also need to change. Reducing Risk vs. Creating Resiliency While uncertainties about the scale, timing, and location of climate change impacts can make decision-making difficult, response strategies can be effective if planning is initiated early on. Because vulnerability can never be estimated with 100% accuracy, the conventional anticipation approach should be replaced or supplemented with one that recognizes the importance of building resiliency. The resiliency approach focuses on adaptive capacity, which can be seen as the ability of a system (natural or social) to handle surprises, respond, learn from mistakes, and recover. Policies that aim to strengthen adaptive capacity/resiliency work to not only avoid potential impacts, but also to create benefits, regardless of the actual occurrence of any or all impacts.
The literature on climate change focuses on two plausible strategic responses: 1) “mitigation
of climate change,” which for the most part relies on policies to reduce greenhouse gas emissions, and 2) “adaptation to climate change,” which consists of actions aimed at meaningfully addressing the vulnerability to climate change impacts (IPCC 2007; Füssel and Klein 2006). Unfortunately, most infrastructure planning is done on timeframes too short to adequately consider climate change, and day-to-day resource management is often crisis driven, subject to political and budgetary constraints. Adaptation planning must merge scientific understanding with political and institutional capacity on an appropriate scale and horizon. This is the challenge.
What Communities Are Doing�Case Studies
Southeast Florida, the Tampa Bay area and Charlotte County have long been among the most active areas in the state looking at climate change adaptation largely because sea level rise poses a real threat to those communities’ valuable real estate in close proximity to the ocean. Several Miami-Dade and Broward county communities have developed climate plans (e.g., Delray Beach, Dania Beach, Coconut Creek, and Surfside) and others have well-developed resiliency programs (for example, Miami Beach has a $500 million program to raise roads and sidewalks and to install pumps and pipes to address ongoing flooding).
The cities of Miami Beach, West Palm Beach, and Fort Lauderdale all have active stormwater projects that model seasonal flooding to identify hot spots. The City of Davie has a similar model, albeit on a broader scale. Similarly, the City of Hollywood is examining flooding in eastern communities. These efforts will lead to capital projects much similar to those already well underway in Miami Beach. But first, the costs must be calculated. A major catalyst for community action began in 2009 when the Southeast Florida Regional Climate Compact was created after elected officials had come together at the Southeast Florida

A D A P T A T I O N O F F L O R I DA ’ S U R B A N IN F R A S T R UCT U R E T O C L I M A T E C H A N G E • 3 27
Climate Leadership Summit, as way to discuss challenges and strategies for responding to the impacts of climate change. Since then, climate issues, particularly southeast Florida’s susceptibility to sea level rise and the need for green infrastructure and building techniques—have been hot topics at the annual Climate Compact event. However, the Regional Climate Compact is a forum for discussion, not a forum for activity to address problems— that responsibility falls to the local governments.
Below, are three summaries of three plans that demonstrate how local governments are turning discussions into action plans and preparing their communities for current and future climate impacts. These examples provide a flavor of what actions can be taken and the anticipated impacts of sea level rise on these communities. Note that only two of the case study communities are coastal, and neither is actually on the ocean.
CASE STUDY 1 – City of Dania Beach Dania Beach, a city in Broward County, completed their climate action plan in 2010 with a focus on hard infrastructure and future planning. The plan began by noting that coastal areas should begin preparing for the impacts of climate change in order to safeguard their communities’ social, cultural, environmental, and economic resources. Policies needed to focus on both mitigation and adaptation strategies. Policy formulation had to be informed by sound science, and administration of both policy and science was ideally to be conducted at the local level to better engage the community and formulate local decisions.
Thinking of the social, political, and natural systems as layers, it is easy to envision the world as one where all things share space, but move at different speeds. Change is constant, but not consistent. The natural environment changes relatively slowly, and people have less ability to affect this layer in the short-term. The built environment changes relatively quickly, with new stock replacing the old on a cycle of about 30 years. Infrastructure, such as transportation networks, water treatment systems, and energy providers, can take even longer—sometimes up to 50 years to retrofit. This means that infrastructure is the layer that takes the longest to develop, has the most impact on our future ability to cope with impacts and adapt to change; thus, it is the layer that should be the focus of planning efforts now.
Dania Beach�s Risk
The City of Dania Beach is a community that includes mangroves, 660 ft of sandy beaches and a pier, and 30,000 residents who reside in a low-lying area. Over a third of the city is below 5 ft of sea level (NAVD88)the expected high tide in 2100; some streets are currently below 3 ft NAVD88. Adaptation measures will most certainly be required to protect the city from the impacts of climate change and groundwater rise. The city has more than $100 million in infrastructure at risk—roads, sewer systems, stormwater lines, along with buried water mains. And as protection of existing public infrastructure and coastal private property becomes less feasible, and the need to relocate population centers more intense, the city’s climate strategies

3 28 • FR E D E R I C K B L O E TS C H E R E T A L.
will have to go beyond just mitigation. In order to reduce the impact of sea level rise, three types of adaptive responses should be undertaken (Nicholls et al. 1999, Klein et al. 2001, Deyle et al. 2007) by the City of Dania Beach: Planned retreat (zoning away from coastal areas) Accommodation (retrofitting buildings) Protection (levees and seawalls)
Fig. 11.7 shows the vulnerability of Dania Beach to sea level rise—red areas are currently
vulnerable using the 99 percentile event; yellow areas are potentially vulnerable, and green indicates areas not currently vulnerable. Note that theses maps focus on the vulnerability of Dania Beach’s roadway system to flooding.
Reducing Economic Vulnerability
Dania Beach’s economic vitality is at risk as well. The Federal Emergency Management Agency’s National Flood Insurance Program ranked Florida third in the nation for repetitive-loss properties (those having two or more flood insurance claims within a 10-year period) (FCOC 2008). To reduce the costs associated with maintaining, insuring, and rebuilding flood-prone properties, a number of strategies are being considered by Dania Beach, such as: rolling easements, targeted coastal land acquisition, tax incentives for landward relocation, stricter setbacks, reclassifying hazard zones, conservation easements, restrictions on rebuilding after storm destruction, and improved comprehensive planning (Deyle et al. 2007, Poulter et al. 2008, FCOC 2008).
The Role of Local Ecosystems
Dania Beach’s relationship between natural systems and the ability to protect and adapt to anticipated impacts of climate change is also important to recognize. Coastal wetlands provide habitat for wildlife, such as nurseries for fish and rookeries for birds, and critical functions for humans, such as the natural cleaning of ground and surface water, as well as flood and storm protection (Stumpf and Haines 1998; Titus 1991). Wetlands are under enormous pressure already, largely due to human density, infrastructure, and water management practices. So as sea level rises, all elements in a coastal wetland (salt marshes, mangrove forests, cypress swamps, etc.) can get caught in the middle of rising tides and development and, effectively, bee “squeezed” out (Titus 1991; Poulter et al. 2008). While the extent of coastal wetlands within Dania Beach’s city limits is limited, there are mangrove forests in West Lake (between the city and the ocean) that will migrate westward as sea level rises. Migrating mangroves will impact private property owners’ ability to develop. However, those same mangroves will reduce the force of surges, helping low-lying eastern areas during storms. Protecting remnant wetlands in and near the city is an important strategy to that the city is pursuing through continuation of good coastal management, as well as careful future infrastructure and land use planning.

A D A P T A T I O N O F F L O R I DA ’ S U R B A N IN F R A S T R UCT U R E T O C L I M A T E C H A N G E • 3 29
According to Mukheibir and Ziervogel, 2007, there are 10 steps to consider when creating an adaptation strategy on the municipal level. The City of Dania Beach’s climate plan specifically addressed the first two, and provided a framework for the remaining eight:
1. Assess current climate trends and future projections for the region (defining the science). 2. Undertake a preliminary vulnerability assessment of the city and communicate results
through vulnerability maps (using GIS and other tools). 3. Analyze vulnerability spatially, by overlaying development priorities with expected climate
change on GIS maps to identify hotspots where adaptation activities should be focused. Supplement analysis with participatory and quantitative methods.
4. Survey current strategic plans and development priorities to reduce redundancy and understand institutional capacity.
5. Develop an adaptation strategy that focuses on highly vulnerable areas. Make sure the strategy offers a range of adaptation actions that are appropriate to the local context.
6. Prioritize adaptation actions using tools such as multi-criteria analysis, cost-benefit analysis, and/or social accounting matrices.
7. Develop a document which covers the scope, design and budget of such actions (a Municipal Adaptation Plan).
8. Engage stakeholders and decision-makers to build political support. Implement the interventions prioritized in the Municipal Adaptation Plan.
9. Monitor and evaluate the interventions on an ongoing basis. 10. Regularly review and modify the plans at predefined intervals.
The strength of this framework for developing a local adaptation plan lies in the initial focus
on location-specific science, the use of both monetary and non-monetary evaluation criteria, and the notion that the plan is not a fixed document, but rather a process by which people learn to change in harmony with a changing environment.

3 30 • FR E D E R I C K B L O E TS C H E R E T A L.
Figure 11.7. Dania Beach risk of roadway flooding as sea level rises.

A D A P T A T I O N O F F L O R I DA ’ S U R B A N IN F R A S T R UCT U R E T O C L I M A T E C H A N G E • 3 31
CASE STUDY 2 – Davie While the Dania Beach case study is an example of a city in the early planning stages of developing their climate plan, the inland Broward community of Davie (population: 91,000) is further along and actively looking at project funding options to begin implementing their plans. City leaders agree it is in the community’s best interest to develop a stormwater planning framework to adapt to sea level rise and protect vulnerable infrastructure through a long-term plan. The stormwater conveyance system serving Davie residents includes primary, secondary, and tertiary canals operated by others; a canal operated by the South Florida Water Management District (SFWMD), and still others operated by local drainage districts. The canal systems in Davie pump the stormwater west to the Everglades and east to the Atlantic Ocean.
The community’s stormwater system consists of structures (including catch basins, curb inlets, culverts, canals, swales, pump stations, ditches, and manholes) that help channel stormwater to the canals. Davie’s stormwater system must comply with Broward County’s Municipal Separate Storm Sewer System (MS4) Program, a publicly-owned system that collects or transports stormwater and discharges it to the state’s surface waters . Like most South Florida communities, the city’s current stormwater management program has significant financial constraints on the Town’s General Fund.
To determine capital needs, an understanding of the existing assets and a means to evaluate potential flooding areas was required. The impacts of sea level rise on groundwater were considered; note the Town is 10 miles from the coast, stretches over 10 miles east-west and is generally sloped to the west, which means that western areas may flood faster than the eastern areas due to groundwater levels and elevation. Discussion with the Town’s staff was held regarding the storm scenario for modeling. The decision was 1:10 storm event (FDOT), but hydrographs were created for the 1:10 event, 5-inch rain event (Florida Building Code) and 25 year 3 day (12 inch) event (SFWMD) for comparative purposes. were run at the 99 percentile groundwater and tidal dates and levels. Modeling at the current condition, 1, 2 and 3 ft sea level rise scenarios were run that incorporate the loss of soil storage capacity created by rising groundwater levels. Figure 11.8 shows the modeling process. An example basin is shown in Figure 11.9 for the current, and future scenarios.
For this southeast Florida community, a number of potential options are available to deal with sea level rise. The perception that they were less vulnerable was found to be incorrect given that the coastal ridge appears to control groundwater levels in the community and surrounding areas. Table 11.1 outlines the estimated cost infrastructure needs, from a long-range planning perspective, needed for each basin under each scenario, with costs. Specific sizing of improvements must be designed to achieve water quantity and quality requirements (quality is not part of the modeling software). The community needs to define which event they are planning to address and the timelines as the costs vary from an initial need of $30 million to nearly $335 million might be needed to address stormwater issues arising from sea level rise before 2100 depending on the level of protection community leaders wish to pursue for residents.

3 32 • FR E D E R I C K B L O E TS C H E R E T A L.
R;キミa;ノノ
Sデ;ェW
C;ミ;ノゲ
EノW┗;デキラミゲ
FノララS M;ヮ
SLR SIWミ;ヴキラ
Sラノ┌デキラミゲP┌マヮゲPキヮWゲC;ミ;ノ
DWゲキヴWS Sデ;ェW
Figure 11.8. Modeling process for Davie risk modeling.
Table 11.1. Cost Estimate Current and Future Needs (Millions of Dollars).
Current
Min Need $ 38
Max Need $ 148
1 ft SLR
Min Need $ 78
Max Need $ 159
2 ft SLR
Min Need $ 123
Max Need $ 255
3 ft SLR
Min Need $ 178
Max Need $ 335

A D A P T A T I O N O F F L O R I DA ’ S U R B A N IN F R A S T R UCT U R E T O C L I M A T E C H A N G E • 3 3 3
Figure 11.9. Change in flooding from current, to 3 ft SLR for the 1:10 storm event- blue areas indicate flooding, darker blue means deeper water.

3 34 • FR E D E R I C K B L O E TS C H E R E T A L.
CASE STUDY 3 – Punta Gorda The City of Punta Gorda is located in Charlotte Harbor of Florida’s southwestern coast. The area is very low, and while the community is inland, it is directly connected to the Gulf of Mexico. Efforts by several universities and the regional planning council have evaluated the understanding of impacts of sea level rise in Punta Gorda. A Florida Atlantic University model of downtown Punta Gorda is shown in Figure 11.10. The blue area have more flooding that the adjacent areas. Of interest is that certain residential areas adjacent to downtown may have less risk, but newer areas may have been more due to elevation and exposure to Charlotte Harbor. Topography drives risk. Storm surge remains a major concern as there is little to slow surge. The regional planning council has taken the lead in evaluating the appropriate responses to sea level rise. The major focus has been community engagement and education given the residents’ relatively low level of concern about the long-term effects of sea level rise. This is an area received a direct hit from hit by Hurricane Charley and its 145mph winds in August 2004. Heavy destruction in Charlotte and Desoto counties was sustained from wind and associated, limited storm surge. 33 were killed with $14 billion in damage. Surge was less than 7ft on the Gulf and only 1.5 ft in coastal waters. Storms remain a focus as well as sea level rise (Beever et al 2009).
The City’s plan was adopted in 2009 (Beever, et al 2009). The plan indicated that “Severe tropical storms and hurricanes with increased wind speeds and storm surges have already severely damaged the community. Significant losses of mature mangrove forest, water quality degradation, and barrier island geomorphic changes have already occurred in the adjacent Charlotte Harbor” (Beever et al 2009). Results have included language to specifically address sea level rise in development codes. Goals included those identified by Deyle, et al (2007), goals to enhance green building initiatives, redevelopment of downtown areas prone to flooding, and the use of pavers instead of asphalt, among other efforts. It should be noted that the actions receiving the highest agreement included protection of seagrasses, xeriscaping, identifying area to protect natural shorelines, restricting fertilizer use and constraining locations for certain infrastructure. Communication with stakeholders was a large part of the plan, including a series of meetings that were held as a part of the plan preparation stage. There were many ideas proposed by the public, but cost was a limiting factor for residents. The risk scenarios focused on adaptation and acceptance of climate impacts.
The city administration has remained attentive to sustainability issues that emerged from the plan through ongoing community boards, comprehensive plan, and infrastructure efforts that meet the plan goals —building infrastructure on higher, safer ground to creating an energy-independent city. The land development codes require all foundations built in Punta Gorda to be higher than state and federal regulations and the city has also purchased shoreline property lined with mangroves to resist sea level rise and storm surge.

A D A P T A T I O N O F F L O R I DA ’ S U R B A N IN F R A S T R UCT U R E T O C L I M A T E C H A N G E • 3 35
Figure 11.10. Downtown Punta Gorda Flooding.
Conclusion Climate change will impact Florida’s infrastructure primarily through sea level rise and changes in precipitation patterns-making it critical that current planning efforts by state and local governments, as well as utilities incorporate climate change issues. Impacts are expected to vary regionally, but climate change will likely result in increased demands on Florida’s infrastructure systems statewide, both in terms of operations and maintenance costs and the need for capital expenditures. Climate changes will impact the state’s supply of drinking water, wastewater, and stormwater systems; impacts will include not only physical property damage, but also increases in the cost of water treatment and treatment infrastructure.
A number of tools and outreach efforts can be adapted or created to foster the inclusion of climate change when considering and planning for infrastructure sustainability. These include advanced asset management strategies, ongoing modeling and monitoring of climate impacts, requiring utilities to examine their environmental footprints, and constantly working towards improvements in their infrastructure systems.
It is worth noting that preventive measures such as pumping, piping, hardening and power grid reinforcement are less costly than reactive measures. And while many local utilities have invested millions to harden their systems, but water supplies, stormwater infrastructure and wastewater systems remain vulnerable. Climate solutions are local, and funding is likely to be local, but the state will need to allocate disaster funding to help those utilities who make

3 36 • FR E D E R I C K B L O E TS C H E R E T A L.
investments but still suffer losses. Giving those utilities that take proactive steps first priority may serve as an incentive for others in the system to make similar proactive investments.
It is essential that state and local government, as well as businesses, use a systems approach that takes into account population, economics, and environmental conditions when making long-term decisions. They will need to examine long-term viability, particularly with regard to investment decisions. Property values are also dependent on the maintenance and proper operation of transportation and utilities, especially storm water, wastewater treatment, and water supply.
Of greater concern is the future practices of the insurance industry, which has traditionally focused on a one-year vision of loss risk. As the insurance industry begins to discuss long-term risks of losses, there will be an accompanying impact on lending practices. Where properties are at risk, lending options may be reduced by insurance limitations—i.e., if the insurance industry sees the potential for significant losses from sea level rise within 30 years, the mortgage industry will limit the length of loans and increase interest rates due to insurance risk, thereby increasing costs to buyers and reducing the attractiveness of the purchase for sellers. The result may be declining property values and slower sales. Therefore, it is certainly in the community’s interest to develop a planning framework to adapt to sea level rise and protect vulnerable infrastructure through a long-term plan.
References
Beever, J.W.; Gray, W.; Trescott, D.;Cobb, D.; Utley, J.; Hutchinson, D.; Gibbons, J.; Walker, T.; Abimbola, M.; Beever, L.B.; and Ott, J. 2009, City of Punta Gorda Adaptation Plan, Southwest Florida Regional Planning Council, Technical Report 09-4, SFRPC, 1926 Victoria Avenue Fort Myers FL 33901.
Bloetscher, Frederick; Polsky, C.; Bolter, K.; Mitsova, D.; Pablicke Garces, K.; King, R.; Cosio Carballo, I.; and Hamilton, K. 2016, Assessing Potential Impacts of Sea Level Rise on Public Health and Vulnerable Populations in Southeast Florida and Providing a Framework to Improve Outcomes, Sustainability 2016, 8, 315; doi:10.3390/su8040315
Bloetscher, F.; Romah, T. 2015. Tools for Assessing Sea Level Rise Vulnerability. Journal of Water and
Climate Change Vol 6 No 2 pp 181–190 © IWA Publishing 2015 doi:10.2166/wcc.2014.045. Bloetscher, F.; Sham, C.H.; Danko, J.J.; and Ratick, S. 2014. Lessons Learned from Aquifer Storage and
Recovery (ASR) Systems in the United States, Journal of Water Resource and Protection, 2014, 6, 1603-1629. http://dx.doi.org/10.4236/jwarp.2014.617146
Bloetscher, F. 2012. Protecting People, Infrastructure, Economies, and Ecosystem Assets: Water Management and Adaptation In The Face Of Climate Change, Journal of Water. Water 2012, 4; doi:10.3390/w40x000x
Bloetscher, F.; Heimlich, B.N. and Romah, T. 2011. Counteracting the Effects of Sea Level Rise in Southeast Florida, Journal of Environmental Science and Engineering, 5:11, 1507-1525, November 2011.
Chang, S. W., Clement, T. P., Simpson, M. J., and Lee, K. K. 2011. Does sea-level rise have an impact on saltwater intrusion? Advances in Water Resources, 34(10), 1283-1291.
Congressional Research Service, September 12, 2016. Deyle, R.E.; Bailey, K.C.; and Matheny, A. (2007), Adaptive Response Planning to Sea Level Rise in
Florida and Implications for Comprehensive and Public Facilities Planning, Florida State University, Tallahassee, Fla.

A D A P T A T I O N O F F L O R I DA ’ S U R B A N IN F R A S T R UCT U R E T O C L I M A T E C H A N G E • 3 37
FDOT. 2012. BDK79 977-01 Development of a methodology for the assessment of sea level rise impacts on Florida's transportation modes and infrastructure. Summary [PDF - 470 KB], Final Report [PDF - 13,326 KB].
FCOC. 2009. Florida Coastal and Ocean Coalition Policy Report, FCOC, Tampa, FL. Freas, K.; Bailey, R.; Muneavar, A.; Butler, S. Incorporating climate change in water planning. J. Am.
Water Works Ass. 2008, 100, 93–99. Frederick, K.D. and P.H. Gleick. 1999. Water and Global Climate Change: Potential Impacts on U.S. Water
Resources. Pew Center on Global Climate Change. Washington, D.C. Füssel, HM. & Klein, R.J.T. 2006. Climate Change Vulnerability Assessments: An Evolution of Conceptual
Thinking, Climatic Change, 75: 301. doi:10.1007/s10584-006-0329-3 Global Insight. The role of metro areas in the US Economy; Reported for The United States Conference of
Mayors, Washington, DC, USA, 1 March 2006. Available online: http://usmayors.org/metroeconomies/Top100_2006.pdf (accessed on 14 February 2012).
Hanson, S.; Nicholls, R.; Ranger, N.; Hallegatte, S.; Corfee-Morlot, J.; Herweijer, C.; Chateau, J. A global ranking of port cities with high exposure to climate extremes. Clim. Chang. 2011, 104, 89–111.
Johns, G.; Leeworthy, V.R.; Bell, F.W.; Bonn, M.A. Socioeconomic Study of Reefs in Southeast Florida: Final Report; Hazen and Sawyer: Hollywood, FL, USA, 2003.
Karl, T.; Melillo, J.; Peterson, T. (Eds.) Global Climate Change Impacts in the United State; Cambridge University Press: Cambridge, UK, 2009.
Keith, D.W., Giardina, J.A., Morgan, M.G. and Wilson, E.J. (2005) Regulating the Underground Injection of CO2. Environmental Science and Technology, 39, 499A-505A. http://dx.doi.org/10.1021/es0534203Lettenmaier et al 2008
Kundzewicz,Z. W.; Mata, L. J.; Arnell, N. W.; Döll, P ; Jimenez, .;Miller, K.; Oki, T.; Şen, Z. and Shiklomanov, I (2007), “The implications of projected climate change for freshwater resources and their management,” Hydrological Sciences Journal, Volume: 53, Issue: 1, Page(s): 3-10.
Mukheibir, P. and Ziervogel, G. (2007). Developing a Municipal Adaptation Plan (MAP) for climate change: the city of Cape Town. Environment & Urbanization. 19(1).
NFIP, 2011. National Flood Insurance Program Loss Statistics from January 1, 1978 Through Report as of 07/31/2011. /http://bsa.nfipstat.com/reports/1040.html, (cited October 2015).
Nicholls, R.J. Ranking Port Cities with High Exposure and Vulnerability to Climate Extremes; OECD Environment Working Papers: Paris, France, 2008-Nicholls, R.J.; Hoozemans, F.M.J. and Marchand, M. 1999. Increasing flood risk and wetland losses due to global sea-level rise: regional and global analyses, Global Environmental Change, V. 9: S69-S87. doi: 10.1016/S0959-3780(99)00019-9.
Parkinson, R.W. Adapting to Rising Sea Level: A Florida Perspective. In Sustainability 2009: The Next
Horizon; In Proceedings of the AIP Conference, Melbourne, FL, USA, 3–4 March 2009; Available online: https://411.fit.edu/sustainability/documents/FINAL%20-%20With%20Cover%2010-1-09.pdf (accessed on 28 March 2016).
Parkinson Randall W. 2010. Municipal adaptation to sea-level rise: City of Satellite Beach, July 30, 2010. R. W. Parkinson Consulting, Inc. Melbourne, Florida.
Poulter, B. and Halpin, P.N. (2008) Raster modeling of coastal flooding from sea level rise. International
Journal of Geographical Information Sciences 22:167–82 Reilly, T.E.; Dennehy, K.F.; Alley, W.M.; William L.C. Ground Water Availability in the United States;
USGS: Reston, VA, USA, 2009. Romah T. 2012. Advanced Methods In Sea Level Rise Vulnerability Assessment, master thesis. Florida
Atlantic University, Boca Raton, FL. Schmidt, K.A.., Hadley, B.C. and Wijekoon, M. 2011. Vertical Accuracy and Use of Topographic LIDAR
Data in Coastal Marshes. J.Coastal Res. 27 6A 116–132 West Palm Beach, Florida November 2011. Southeast Florida Regional Climate Compact (SFRCCC). Analysis of the Vulnerability of Southeast Florida
to Sea-Level Rise. 2012. Available online: http://www.southeastfloridaclimatecompact.org/wp-content/uploads/2014/09/regional-climate-action-plan-final-ada-compliant.pdf (accessed on 29 March 2016.
Stumpf, R. P. and Haines, J. W., 1998, Variations in tidal level in the Gulf of Mexico and implications for tidal wetlands: Estuarine, Coastal and Marine Science, 46: 165-173.
Tebaldi, C.; Strauss, B.H.; Zervas, C.E. Modelling sea level rise impacts on storm surges along US coasts. Environ. Res. Lett. 2012, 7. Article 1.

3 38 • FR E D E R I C K B L O E TS C H E R E T A L. Titus, J.G. and Wang, J. 2008 Maps of lands close to sea level along the middle Atlantic coast of the United
States: an elevation data set to use while waiting for LIDAR. Section 1.1 In: Background Documents
Supporting Climate Change Science Program Synthesis and Assessment Product 4.1 (J. G. Titus & E. M. Strange, eds). EPA 430R07004, US EPA,Washington, DC, USA. http://papers.risingsea.net/federal_reports/Titus_and_Strange_EPA_section1_1_Titus_and_Wang_may2008.pdf.
Titus, J.G.; Richman, C. Maps of lands vulnerable to sea level rise: Modeled elevations along the US Atlantic and Gulf coasts. Clim. Res. 2001, 18, 205–228.
Wallis, M.J.; Ambrose, M.kR. and Chan, CC. 2008 Climate Change: Charting a Water Course in an Uncertain Future, JAWWA v100:6. Pp 70-79.
Warner, N. N. and Tissot, P.E. 2012. Storm flooding sensitivity to sea level rise for Galveston Bay, Texas. Ocean Engineering 44 (2012) 23–32.
Weiss, J.L.; Overpeck, J.T.; Strauss, B. Implications of recent sea level rise science for low-elevation areas in coastal cities of the conterminous USA. Clim. Chang. 2011, 105, 635–645.
Zhang, K. (2011). Analysis of non-linear inundation from sea-level rise using LIDAR data: a case study for South Florida. Climatic Change. 106, 537-565.
Zhang, K., Dittmar, J., Ross, M., and Bergh, C. (2011). Assessment of sea level rise impacts on human population and real property in the Florida Keys. Climatic Change, 107(1-2), 129-146.