Adapt locally and act globally: strategy to maintain high...
16
Adapt locally and act globally: strategy to maintain high chemoreceptor sensitivity in complex environments Ganhui Lan 1,3 , Sonja Schulmeister 2,3 , Victor Sourjik 2, * and Yuhai Tu 1, * 1 IBM T.J. Watson Research Center, Yorktown Heights, New York, NY, USA and 2 Zentrum fu ¨ r Molekulare Biologie der Universita ¨ t Heidelberg, Heidelberg, Germany 3 These authors contribute equally to this work * Corresponding author. V Sourjik, Zentrum fu ¨ r Molekulare Biologie der Universita ¨t Heidelberg, Heidelberg 69120, Germany. Tel.: þ 49 6221 54 6858; Fax: þ 49 6221 54 5892; E-mail: [email protected] or Y Tu, IBM T.J. Watson Research Center, Yorktown Heights, New York, NY 10598, USA. Tel.: þ 1 914 945 2762; Fax: þ 1 914 945 4506; E-mail: [email protected] Received 14.8.10; accepted 10.2.11 In bacterial chemotaxis, several types of ligand-specific receptors form mixed clusters, wherein receptor–receptor interactions lead to signal amplification and integration. However, it remains unclear how a mixed receptor cluster adapts to individual stimuli and whether it can differentiate between different types of ligands. Here, we combine theoretical modeling with experiments to reveal the adaptation dynamics of the mixed chemoreceptor cluster in Escherichia coli. We show that adaptation occurs locally and is ligand-specific: only the receptor that binds the external ligand changes its methylation level when the system adapts, whereas other types of receptors change methylation levels transiently. Permanent methylation crosstalk occurs when the system fails to adapt accurately. This local adaptation mechanism enables cells to differentiate individual stimuli by encoding them into the methylation levels of corresponding types of chemoreceptors. It tunes each receptor to its most responsive state to maintain high sensitivity in complex environments and prevents saturation of the cluster by one signal. Molecular Systems Biology 7: 475; published online 15 March 2011; doi:10.1038/msb.2011.8 Subject Categories: computational methods; signal transduction Keywords: bacterial chemotaxis; high sensitivity to multiple signals; methylation crosstalk; mixed receptor cluster; sensory adaptation This is an open-access article distributed under the terms of the Creative Commons Attribution Noncommercial Share Alike 3.0 Unported License, which allows readers to alter, transform, or build upon the article and then distribute the resulting work under the same or similar license to this one. The work must be attributed back to the original author and commercial use is not permitted without specific permission. Introduction In environments with multiple cues, organisms need to sense different signals and process the complex information in order to make decisions to enhance their chances of survival; e.g., to move toward nutrients and away from toxins. Two-component sensory kinase systems are used ubiquitously in the prokar- yotic world and in plant and yeast cells to sense environmental stress and mediate appropriate cellular responses (Hoch and Silhavy, 1995; Stock et al, 2000). One of the best studied two- component systems is the bacterial chemosensory pathway, which also serves as a model system for understanding general principles of sensory signal transduction in biology (Adler, 1976; Falke et al, 1997; Falke and Hazelbauer, 2001; Laub and Goulian, 2007; Hazelbauer et al, 2008). In Escherichia coli, extracellular chemical information is sensed by several types of transmembrane chemoreceptors, each binding to a different set of chemical ligands and converting this binding into the regulation of intracellular pathway activity. Tar and Tsr receptors are the two most abundant chemoreceptors in E. coli, specific for aspartate and serine, respectively (Grebe and Stock, 1998). Experiments showed that the receptors form hetero-trimers of homo-dimers in bacterial cytoplasmic membrane (Kim et al, 1999; Ames et al, 2002; Studdert and Parkinson, 2005), and these receptor trimers-of-dimers associ- ate to form clusters together with the cytoplasmic adaptor protein CheW and the histidine kinase CheA (Maddock and Shapiro, 1993; Kentner et al, 2006). Ligand binding to receptors changes the autophosphorylation activity of the attached CheA, which in turn affects phosphorylation of the response regulator protein CheY and eventually regulates cell swimming. To explain the large signal amplification and high sensitivity in bacterial chemotaxis, receptor cooperativity in the cluster was first proposed by Bray and coworkers (Bray et al, 1998; Duke and Bray, 1999). This important insight has been confirmed by in vitro (Bornhorst and Falke, 2000; Li and Weis, 2000) and in vivo experiments (Sourjik and Berg, 2002, 2004) as well as by subsequent quantitative modeling (Mello and Tu, 2003b, 2005; Mello et al, 2004; Endres and Wingreen, 2006; Molecular Systems Biology 7; Article number 475; doi:10.1038/msb.2011.8 Citation: Molecular Systems Biology 7:475 & 2011 EMBO and Macmillan Publishers Limited All rights reserved 1744-4292/11 www.molecularsystemsbiology.com & 2011 EMBO and Macmillan Publishers Limited Molecular Systems Biology 2011 1
Transcript of Adapt locally and act globally: strategy to maintain high...

Adapt locally and act globally: strategy to maintainhigh chemoreceptor sensitivity in complexenvironments
Ganhui Lan1,3, Sonja Schulmeister2,3, Victor Sourjik2,* and Yuhai Tu1,*
1 IBM T.J. Watson Research Center, Yorktown Heights, New York, NY, USA and 2 Zentrum fur Molekulare Biologie der Universitat Heidelberg, Heidelberg, Germany3 These authors contribute equally to this work* Corresponding author. V Sourjik, Zentrum fur Molekulare Biologie der Universitat Heidelberg, Heidelberg 69120, Germany. Tel.: þ 49 6221 54 6858;Fax: þ 49 6221 54 5892; E-mail: [email protected] or Y Tu, IBM T.J. Watson Research Center, Yorktown Heights, New York, NY 10598, USA.Tel.: þ 1 914 945 2762; Fax: þ 1 914 945 4506; E-mail: [email protected]
Received 14.8.10; accepted 10.2.11
In bacterial chemotaxis, several types of ligand-specific receptors form mixed clusters, whereinreceptor–receptor interactions lead to signal amplification and integration. However, it remainsunclear how a mixed receptor cluster adapts to individual stimuli and whether it can differentiatebetween different types of ligands. Here, we combine theoretical modeling with experiments toreveal the adaptation dynamics of themixed chemoreceptor cluster inEscherichia coli.We show thatadaptation occurs locally and is ligand-specific: only the receptor that binds the external ligandchanges its methylation level when the system adapts, whereas other types of receptors changemethylation levels transiently. Permanent methylation crosstalk occurs when the system fails toadapt accurately. This local adaptation mechanism enables cells to differentiate individual stimuliby encoding them into the methylation levels of corresponding types of chemoreceptors. It tuneseach receptor to its most responsive state to maintain high sensitivity in complex environments andprevents saturation of the cluster by one signal.Molecular Systems Biology 7: 475; published online 15 March 2011; doi:10.1038/msb.2011.8Subject Categories: computational methods; signal transductionKeywords: bacterial chemotaxis; high sensitivity to multiple signals; methylation crosstalk; mixedreceptor cluster; sensory adaptation
This is an open-access article distributed under the terms of the Creative Commons AttributionNoncommercial Share Alike 3.0 Unported License, which allows readers to alter, transform, or build uponthearticle and thendistribute the resultingworkunder the sameorsimilar license to thisone. Theworkmustbe attributed back to the original author and commercial use is not permitted without specific permission.
Introduction
In environments with multiple cues, organisms need to sensedifferent signals and process the complex information in orderto make decisions to enhance their chances of survival; e.g., tomove toward nutrients and away from toxins. Two-componentsensory kinase systems are used ubiquitously in the prokar-yotic world and in plant and yeast cells to sense environmentalstress and mediate appropriate cellular responses (Hoch andSilhavy, 1995; Stock et al, 2000). One of the best studied two-component systems is the bacterial chemosensory pathway,which also serves as amodel system for understanding generalprinciples of sensory signal transduction in biology (Adler,1976; Falke et al, 1997; Falke and Hazelbauer, 2001; Laub andGoulian, 2007; Hazelbauer et al, 2008). In Escherichia coli,extracellular chemical information is sensed by several typesof transmembrane chemoreceptors, each binding to a differentset of chemical ligands and converting this binding intothe regulation of intracellular pathway activity. Tar and Tsrreceptors are the two most abundant chemoreceptors in
E. coli, specific for aspartate and serine, respectively (Grebeand Stock, 1998). Experiments showed that the receptors formhetero-trimers of homo-dimers in bacterial cytoplasmicmembrane (Kim et al, 1999; Ames et al, 2002; Studdert andParkinson, 2005), and these receptor trimers-of-dimers associ-ate to form clusters togetherwith the cytoplasmic adaptor proteinCheW and the histidine kinase CheA (Maddock and Shapiro,1993; Kentner et al, 2006). Ligand binding to receptors changesthe autophosphorylation activity of the attached CheA, which inturn affects phosphorylation of the response regulator proteinCheYand eventually regulates cell swimming.To explain the large signal amplification and high sensitivity
in bacterial chemotaxis, receptor cooperativity in the clusterwas first proposed by Bray and coworkers (Bray et al, 1998;Duke and Bray, 1999). This important insight has beenconfirmed by in vitro (Bornhorst and Falke, 2000; Li and Weis,2000) and in vivo experiments (Sourjik and Berg, 2002, 2004)as well as by subsequent quantitative modeling (Mello and Tu,2003b, 2005; Mello et al, 2004; Endres and Wingreen, 2006;
Molecular Systems Biology 7; Article number 475; doi:10.1038/msb.2011.8Citation: Molecular Systems Biology 7:475& 2011 EMBO and Macmillan Publishers Limited All rights reserved 1744-4292/11www.molecularsystemsbiology.com
& 2011 EMBO and Macmillan Publishers Limited Molecular Systems Biology 2011 1

Keymer et al, 2006). In particular, in vivo measurements ofpathway activity using fluorescence resonance energy transfer(FRET; Sourjik and Berg, 2002; Vaknin and Berg, 2007) and thecorresponding modeling work (Mello and Tu, 2003b) demon-strated strong interactions between different types of chemo-receptors, such as Tar and Tsr. Cooperativity among differenttypes of receptors allows them to act together (globally) in themixed cluster to amplify the response to any specific signal.Sensory adaptation in E. coli chemotaxis is carried out by
receptor methylation and demethylation, mediated by twocytoplasmic enzymes: methyltransferase (CheR) and methy-lesterase (CheB), which add and remove methyl group (CH3
þ )at specific methylation sites on the receptor, respectively. Thiscovalent modification of the receptor modulates the activity ofthe attached histidine kinase CheA, which phosphorylates notonly CheY but also CheB. As CheB methylesterase activitydramatically increases on phosphorylation (Djordjevic et al,1998), the overall (global) kinase activity can control themethylation process through CheB phosphorylation. In addi-tion, receptors undergo reversible conformational changesupon ligand binding and methylation, e.g., in their HAMPdomain (a linkage domain underneath the plasma membrane)as shown by recent cryoelectron microscopy experiments forE. coli Tsr receptor (Khursigara et al, 2008). Studies onubiquitin receptors have shown that conformational changesin the linkage domain can affect the selectivity and affinity ofenzyme binding and catalysis processes (Sims and Cohen,2009; Sims et al, 2009), and the observed conformational
change in MCP receptors can, in principle, also directly affectmethylation kinetics, providing a possible local feedbackmechanism, in which the adaptation of an individual receptoris controlled by its own ‘local’ activity. Besides evidences fromstructural studies, a recent systematic study of receptormodification kinetics (Amin and Hazelbauer, 2010) has clearlyconfirmed that the receptor methylation rate is modulated bythe receptor’s ligand occupancy and methylation level, whichare related to its activity/conformation.Despite our understanding of the heterogeneous receptor
cooperativity, little is known about its effects on the adaptationprocess in the mixed receptor clusters. To explain the observedaccurate adaptation to external stimuli, Barkai and Leibler(1997) first proposed that the receptor methylation/demethy-lation in bacterial chemotaxis depends on the activity ofreceptor–kinase complexes. This integral feedback mechan-ism (Yi et al, 2000) maintains the overall kinase activity of thecell within the narrow operational range of the ultrasensitiveflagellar motor (Cluzel et al, 2000). However, as illustratedin Figure 1A, if the overall kinase activity controls themethylation/demethlayion dynamics of the individual recep-tors and if the receptors are strongly coupled in the cluster,there will be severe methylation crosstalk between differenttypes of receptors; e.g., the Tsr receptors will be methylatedto the same degree as the Tar receptors even when the cellonly experiences a change in the aspartate concentration.As receptor methylation serves as the cell’s memory ofthe external chemical environment (Webre et al, 2003), such
[L]1
m1
a1 a2
m2
[L]2
a
A
C D
Global adaptation scheme
MWC-type model Ising-type model
Inactive Tar
Active Tar
Active Tsr
Inactive Tsr
Coupling
a1 a2
m1 m2
[L]1 [L]2
a
B Local adaptation scheme
Figure 1 Illustration of the different models of receptor adaptation and receptor cooperativity. (A) The global adaptation model, in which the overall integrated activity acontrols the methylation dynamics of individual receptor. [L]1(2) represents MeAsp (serine) concentration;m1(2) and a1(2) represent Tar (Tsr) methylation level and its localactivity (conformational state). (B) The local adaptation model, in which the methytlation of individual receptor is controlled by its own conformational changes. (C) TheMWC-type model for receptor cooperativity. The extended receptor cluster is divided into tightly coupled functional complex (large dashed circle), within which thereceptors, Tar (blue circle) and Tsr (red circle), are synchronized to be either active (filled) or inactive (hollow). (D) The Ising-type model, in which neighboring receptorsinteract with a finite coupling strength to favor (but not absolutely enforce) same activities.
Adaptation dynamics of the mixed chemoreceptor clusterG Lan et al
2 Molecular Systems Biology 2011 & 2011 EMBO and Macmillan Publishers Limited

severe methylation crosstalk would limit the ability of a cell to‘remember’ multiple stimuli distinctively and consequentlydecrease the cell’s ability to detect different signals. The keyquestion is therefore whether different chemoreceptors canavoid methylation crosstalk (memory ‘contamination’) in thepresence of strong heterogeneous receptor–receptor inter-actions by adapting locally as illustrated in Figure 1B.The receptor cooperativity has been described recently
using classical Monod–Wyman–Changeux (MWC) allostericmodel (Monod et al, 1965), in which receptors behave in anall-or-nonemanner in a functional cluster (activity of receptorsin a functional cluster can be either all on or all off), asillustrated in Figure 1C. TheMWCmodel has been successfullyused to describe the regulation of kinase activity in mixedreceptor cluster in responses to stimuli (Sourjik and Berg,2004; Mello and Tu, 2005; Keymer et al, 2006). However,because of the all-or-none assumption, the MWC-type modelwould predict the same methylation pattern for Tar and Tsrwithin a heterogeneous receptor cluster independent of thesignal (Endres and Wingreen, 2006), which is inconsistentwith the ligand-specific adaptation reported previously (Silver-man and Simon, 1977; Sanders and Koshland, 1988; Antom-mattei et al, 2004).On the basis of ‘conformational spread’ concept put forth by
Bray et al (1998), the E. coli chemoreceptor cluster was firstmodeled using an Ising-type model by Duke and Bray (1999)(see also a review by Bray and Duke, 2004). Although the Dukeand Bray model successfully demonstrated the heightenedsensitivity due to receptor–receptor interaction, it was toosimplistic, with only one type of receptor and two methylationlevels (m¼0, 1), to describe the adaptation dynamics of themixed receptor cluster. Around the same time, a detailed free-energy-based stochastic model (Morton-Firth et al, 1999) wasdeveloped to study the adaptation dynamics of the chemor-eceptors in response to addition of aspartate. However,without considering the receptor–receptor interaction, thismodel predicted a decrease in Tsr methylation level inresponse to aspartate addition, which disagrees with theexperimental observations (Sanders and Koshland, 1988).Later, Shimizu et al (2003) incorporated receptor–receptorcoupling into this model and generally established theconnection between receptor–receptor coupling strength andsignal amplification. However, only one type of receptor wasconsidered in Shimizu et al (2003). An Ising-type model formixed receptor cluster was first proposed by Mello and Tu(2003b). Direct comparison between this mixed receptor Ising-type model and FRET experiments (Sourjik and Berg, 2002)was able to show a strong interaction between different typesof chemoreceptors in the cluster. However, the adaptationdynamics of the mixed receptor cluster was not addressed inMello and Tu (2003b). Goldman et al (2009) has recentlyproposed an alternative Ising-type model to explain theselective methylation in mixed receptor system. In this model,there is no direct receptor–receptor interaction. Instead,cooperative CheA–CheA interactions within an extendedCheA lattice (Goldman et al, 2009). The absence of directreceptor–receptor interaction eliminates methylation cross-talk. As shown in Goldman et al (2009), the Tsr methylationlevel does not change at all in response to aspartate, not eventransiently. This is inconsistent with the previous experiments
(Sanders and Koshland, 1988) and the new experimental datato be presented later in this paper, which clearly shows theexistence of transient methylation crosstalk. Moreover, directinteractions between receptor dimers within the basic trimer-of-dimer receptor unit has been observed in FRETexperiments(Vaknin and Berg, 2007; Kentner and Sourjik, 2009), even inthe absence of CheWand CheA. In addition, there has been nodirect experimental evidence in support of the cooperativeCheA–CheA interaction in the cluster as assumed in theGoldman model.Here, we develop a theory (model) for the mixed chemo-
receptor cluster in which receptors interact directly betweennearest neighbors (nn) as illustrated in Figure 1D, and a localadaptation (LA) scheme is used to describe the methylationkinetics of individual receptors as shown in Figure 1B.Predictions made by this model were tested by directmeasurements of the receptor methylation dynamics for bothTar and Tsr in response to ligands sensed by either receptor.Combining theory and experiments, we address the two basicquestions of whether bacteria can differentiate differentstimuli and how such information can be used to enhancesensitivity in complex environment with multiple cues.
Results
Modeling framework and mathematicalprocedures
The LA model for a mixed receptor network with nninteractions is illustrated in Figure 1B and D. There are twotypes of chemoreceptors in the cluster: Tar that binds aspartateand a-methyl-D,L-aspartate (MeAsp), and Tsr that binds serine.Each individual receptor, Rqlam, is characterized by four statevariables (written as subscripts). q represents the type ofreceptor with q¼1 for Tar and q¼2 for Tsr. l¼0, 1 indicatesligand binding state of the receptor to be either vacant oroccupied. a¼0, 1 represents inactive or active conformation ofthe receptor. m is the receptor methyl level. Tar and Tsrreceptors can have up to 4 and 5 methyl groups, respectively.For simplicity, we use mA[0, 4] for both receptors. Thissimplification does not affect our results and conclusions.Neighboring receptors in the connected network, which doesnot have to be an ordered lattice, can interact and affect eachother’s conformational states (Vaknin and Berg, 2007). Thefree energy of a given receptor in a particular state (q,l,a,m)can be written as
Hðq; l; a;mÞ ¼ mqlþ ðELq lþ EM
q;m þ ECq Þa; ð1Þ
where mq¼ln(KqI /[L]q) and mqþ Eq
L¼ln(KqA/[L]q) are the chemi-
cal potentials of the inactive and active ligand-boundreceptors, respectively, Eq,m
M is the receptor methylation-dependent free energy contribution, and Eq
C is the couplinginteraction strength between neighboring receptors. Kq
I and KqA
are the dissociation constants for the inactive and active type-qreceptors, and [L]q is the concentration of ligand that bindswith type-q receptor. All energies in this paper are written inunits of the thermal energy kBT.The energy parameters mq, Eq
L, Eq,mM for individual receptors
can have complicated dependence on the state variables q andm. For simplicity, we assume that chemical potential terms
Adaptation dynamics of the mixed chemoreceptor clusterG Lan et al
& 2011 EMBO and Macmillan Publishers Limited Molecular Systems Biology 2011 3
mq and EqL are constants for each type of ligand, independent of
receptor methylation levels. We further assume methylationenergy Eq,m
M is linearly proportional to methylation level m(Shimizu et al, 2010):
EMq;m ¼ aqðm�mq;0Þ; ð2Þ
where aq quantifies the energy change by adding one methylgroup to a type-q receptor (aqo0), and mq,0 sets the averagemethylation level in the absence of any stimuli for a type-qreceptor. By analogy to the Ising-type model used in describingcollective behaviors in physical systems, such as ferromagnet-ism (Bozorth, 1993), the receptor–receptor coupling energy Eq
C
is assumed to depend linearly on the activity of its neighbors:
ECq ¼
X
ðnnÞCqq0 ðaq0 � 0:5Þ: ð3Þ
Equation (3) shows that activity of a receptor (a¼0 or 1) in thecluster is influenced by its neighbors’ activities with a couplingconstant (strength) Cqq0. The overall coupling effect of a givenreceptor is obtained by summing over all its nn. In this paper,we assume symmetric coupling strength (Cqq0¼Cq0q). We setCqq0o0 to represent cooperative receptor–receptor interac-tions. The 0.5 in the formula is for preserving symmetrybetween active and inactive state. It does not affect the generalbehavior of the model.For bacterial chemotaxis, the time scales for ligand binding
and activity switching are much faster than that of receptormethylation/demethylation. Therefore, a given individualreceptor is at quasi-equilibrium among its four (a, l) states:(0, 0), (0, 1), (1, 0) or (1, 1). The probabilities in these fourstates are given by the Boltzmann distribution function withtheir free energies given by Equation (1). The average ‘local’activity of an individual type-q receptor depends on itsmethylation level m and is denoted as /aSq,m. In the mean-field approximation,/aSq,m can be taken as the mean activityof all type-q receptors with methylation level m in the cluster.The properties of thewhole cooperative receptor cluster can bedetermined by direct Monte Carlo simulations (SupplementaryFigure S8) or the mean-field-theory approximation (seeSupplementary Information for detailed descriptions of thesetwo methods). Both methods give consistent results. Inparticular, /aSq,m and the population Pq,m of type-q receptorswith methylation level m can be computed from our model.From /aSq,m and P(q,m), we can obtain the average activityof type-q receptor /aSq¼
PmPq,m/aSq,m. The average global
activity of the entiremixed receptor cluster can be described as/aSq¼
Pqfq/aSq, where fq is the fraction of type-q receptor in
the cluster (P
qfq¼1). Note that the average in /aS is over allthe receptors in the mixed cluster. Detailed equations andsolutions are discussed in the Supplementary Information.To complete the description of the pathway dynamics, we
need to describe the (slow) adaptation process, characterizedby the dynamics of receptor population in different methyla-tion levels Pq,m. Previous studies have shown that themethylation process has to depend on the receptor activity inorder to explain the observed accurate adaptation (Barkai andLeibler, 1997). However, the origin of the receptor activitydependence in methylation/demethylation kinetics remainsunclear. One obvious way of receptor activity dependencecomes from the fact that the methylesterase protein CheB is
phosphorylated to its active form CheB-P (Djordjevic et al,1998) by the histidine kinase CheA, which is controlled by theintegrated global activity of all the chemoreceptors. However,accurate adaptation occurs even in the absence of CheBphosphorylation (Alon et al, 1999). A more subtle but perhapsmore important way of receptor activity dependence comesfrom individual receptor’s conformational changes (localactivity), which can control the accessibility of its methylationsites and/or affinity of the enzymes to the receptor (Sims andCohen, 2009; Sims et al, 2009). One focus of this paper is tounderstand and distinguish the general consequences of thelocal and global activity dependence in methylation/demthyl-ation dynamics.We can study the local and global activity dependence
within a simple and general model framework by assumingthat the methylation rate decreases with an effective receptoractivity a and the demethylation rate increases with a, both ina linear manner. The effective receptor activity a can be eitherthe ‘local’ single receptor activity/aSq,m or the ‘global’ mixedreceptor cluster activity /aS. Thus, the dynamics of thereceptor population Pq,m can be written as
dPq;mdt
¼kðqÞR ð1� aÞPq;m�1 þ k
ðqÞB aPq;mþ1�
½kðqÞR ð1� aÞ þ kðqÞB a�Pq;m
; ð4Þ
where kR(q) and kB
(q) are rates of methylation and demethylationfor receptor type-q and are set to be the same for Tar and Tsr:kR,B(q)¼kR,B unless otherwise stated. Within this general model-
ing construct, different choices of the effective receptor activitya in the above equation correspond to different adaptationmodels: a¼/aSq,m is the LA model and a¼/aS is the globaladaptation (GA) model. The difference between these twoadaptation schemes (models) is the focus of this paper. All theparameters used in this study (Equations (1–4)) are summa-rized in Table I. The qualitative behavior of our models doesnot depend on the quantitative choices of the parameters
Table I Parameters used in the LA model
Item Value or formula Item Value or formula
f1 1/2 f2 1/2
E1L 8 E2
L 3
m1,0 1 m2,0 2.5
a1 �1.875 a2 �1.0
C1,1J �5.5 C1,2
J �6.0
C2,1J �6.0 C2,2
J �6.0
kR(1) 1 kB
(1) 2
kR(2) 1 kB
(2) 2
KI1 18.1 mM KI
2 6.0mM
fq are chosen within the measured range of Tar/Tsr ratio (Kalinin et al, 2010);EqL are chosen to reflect the estimated Kd differences between active and inactive
receptors bindingwith ligand (Mello et al, 2004; Mello and Tu, 2005); aq are fromprevious experimental measurements and estimates (Shimizu et al, 2010); mq,0
are estimated from our experiments shown in Figure 4C and D, E1,0M is set to be
3.75 to further suppress the activity of Tar for them¼0 state; CJ is designed to besymmetric, meanwhile provide high sensitivity (Mello and Tu, 2003b; Melloet al, 2004); kR
(q) and kB(q) are set to be the same for Tar and Tsr receptors for
convenience; all the energy parameters are in the unit of kBT, and the timescale isset by having kR
(1)¼1.
Adaptation dynamics of the mixed chemoreceptor clusterG Lan et al
4 Molecular Systems Biology 2011 & 2011 EMBO and Macmillan Publishers Limited
(see Supplementary Figure S2 for results using anotherparameter set).Conceptually, the MWC-type models (Mello and Tu, 2005;
Endres and Wingreen, 2006; Keymer et al, 2006) can beconsidered as a special case of the general Ising model withinfinite coupling strength within (finite-sized) functionalclusters. All the receptors within an MWC functional cluster(see Figure 1C) switch between their active and inactive statessynchronously (‘all-or-none’), regardless of their types(Tar, Tsr) or methylation levels. As a result, the local activitiesof individual receptors are exactly the same as that of thewhole cluster (/aSq,m¼/aS). Therefore, in terms of adapta-tion, the methylation/demethylation process in an MWC-typemodel is effectively only determined by the global activity, thesame as the GA model studied here.Before studying the two simplified adaptation models (GA
and LA), it should be noted that in wild-type E. coli cells, theactivation (phosphorylation) of the demethylation enzymeCheB depends on the global activity of the receptor cluster.Thus, the global and local activities can combine in a complex‘hybrid’ manner to affect the adaptation dynamics. However,
including this detail in the demethylation dynamics does notchange the general results and conclusions of this paper aslong as LA effects exist (see Supplementary Information andSupplementary Figure S5 for details).
Adaptation dynamics for mixed receptor cluster:local adaptation prevents permanent methylationcrosstalk
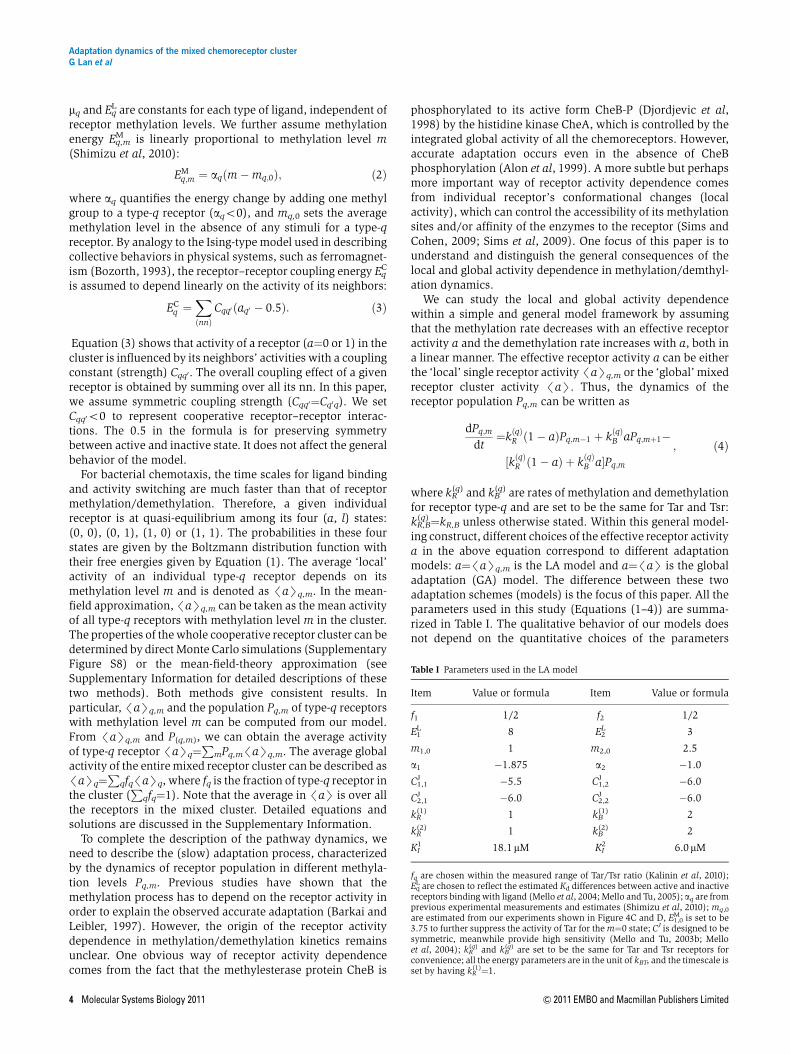
Using the local adaptation (LA) model described in the lastsection, we study and predict the adaptation dynamics of Tarand Tsr in a mixed cluster. As shown in Figure 2A, in responseto a step increase of the chemo-attractant MeAsp, the activityof Tar is suppressed immediately by ligand binding. Owing tothe heterogeneous receptor–receptor interactions (EC), theactivity of Tsr in the mixed receptor cluster also decreasequickly. After the initial activity drop, the system starts torecover (adapt) by increasing the receptor methylation levels,which restores the receptor activities to their initial pre-stimulus levels. In the GA models (such as the MWC-typemodel), the methylation levels of both types of receptors
0
0.3
0.2
0.3
0.4
Act
ivity
0 0.3 0.6 0.9 1.2 1.50.5
1
1.5
2
2.5
3
Met
hyla
tion
0
0.1
0.2
0.3
0.4
0.5P
opul
atio
n, T
ar1 mM MeAsp
P1,2
P2,2
P2,3
P2,1
P2,4
P2,0
P1,3
P1,1
P1,4P1,0
0
0.1
0.2
0.3
0.4
Pop
ulat
ion,
Tsr
<m>1
<m>2
<a>1
<a>2
<a>
AddMeAsp
AddMeAsp
Global responsethrough coupling Global adaptation
Local adaptation
Overshoot
Gradual recovery
Localadaptationscheme
Globaladaptationscheme
0 0.5 1 1.5 2
A C
B D
E
Membrane
Tar Tsr Methylgroup
180 μM MeAsp
Time, (k–1)R
Time, (k–1)R
Figure 2 The adaptation dynamics of a mixed receptor cluster in response to addition of ligand. (A) Adding modest amount (180 mM) of MeAsp induces immediateactivity drops for both Tar and Tsr receptors. Afterwards, Tar activity recovers monotonically (blue line), whereas Tsr activity (red line) first increases to a higher level(overshoot) and then returns back to its initial level. Black line is the averaged activity recovery trajectory of the entire heterogenous receptor cluster. (B) Tar and Tsrexhibit different methylation dynamics after MeAsp addition: Tar increases its methylation level monotonically to a higher level (blue line), whereas Tsr is first methylatedthen demethylated, and returns to its pre-stimulus state (red line). (C,D) The dynamics of the receptor populations in each methylation level for Tar and Tsr, respectively,after adding 1 mMMeAsp. (E) Schematic illustration of methylation dynamics after MeAsp addition under local (upper row) and global (bottom row) adaptation schemes.The blue color represents the Tar-related components and red color are the Tsr-related components. The water level inside each receptor represents activity of thatparticular receptor.
Adaptation dynamics of the mixed chemoreceptor clusterG Lan et al
& 2011 EMBO and Macmillan Publishers Limited Molecular Systems Biology 2011 5

increase monotonically to higher levels as they are bothcontrolled by the (same) global kinase activity. However, in theLAmodel used here, only the average methylation level/mS1
of Tar receptors, which directly bind the external ligand(MeAsp), increases monotonically and reaches a highermethylation level in the final adapted state (blue line inFigure 2B). The average methylation level /mS2 of the Tsrreceptors increases only transiently before returning back to itspre-stimulus level when the system reaches its adapted steadystate (red line in Figure 2B). Thus the LA model predicts onlytransient methylation interference (crosstalk) but no perma-nent (steady state) methylation crosstalk. The activities of Tarand Tsr also show distinct behaviors. The average Tar activity/aS1 shows a monotonic recovery to its pre-stimulus level(blue line in Figure 2A). The average Tsr activity/aS2 shows acharacteristic overshoot above its pre-stimulus level beforereturning back when the system adapts (red line in Figure 2A).Similar results are obtained in response to moderate amountsof serine, to which the system can adapt accurately.The transient dynamics of Tsr in the mixed cluster in
response to MeAsp is an important prediction of the LA modeland can be understood intuitively as follows. As Tsr does notbind to MeAsp (except for extremely high MeAsp level), theonly driving force for Tsr methylation is its coupling to Tar,which makes Tsr activity dependent on the Tar activity.Therefore, even though the Tsr methylation level increasesinitially right after the MeAsp addition due to the initial Taractivity drop, it should recover to its pre-stimulus level as Taradapts, and hence the driving force for Tsr methylationdisappears. The initial rise of the Tsr methylation level,dhmi2dt jt¼040, and its final recovery /mS2|t¼N¼/mS2|t¼0,
imply that there exists a time point t*when the Tsrmethylationlevel reaches its maximum:
dhmi2dt
jt¼t� ¼ 0 andd2hmi2dt2
jt¼t�o0
For LA model, since dhmi2dt � kRð1� hai2Þ � kBhai2 (see
Equation (5) and corresponding descriptions), the firstequation above shows that the Tsr activity crosses its steady-state value a0
(2)¼kR/(kRþ kB) at time t*, and the inequalityleads to d2/mS2/dt
2¼�(kRþ kB)� d/aS2/dto0 so thatd/aS2/dt40 at t*. Therefore, exactly when Tsr methylationlevel reaches its maximum level at time t*, the Tsr activity/aS2 crosses its steady-state value with a positive changingrate, as it overshoots to a higher value before it finally recoversto /aS0
(2) in steady state. This explains the overshoot seenin Figure 2A (see Supplementary Figure S1A for more details).Another interesting prediction from the LA model is that the
averaged kinase activity does not always stay below theadapted value and recover monotonically as it would do in theglobal (MWC-type) adaptation model. If Tsr is more abundantthan Tar and Tsr adapts slower than Tar, the transientnonmonotonic Tsr activity recovery dynamics in response toaddition of aspartate or MeAsp (Figure 2A and SupplementaryFigure S1A) can bring the overall kinase activity above itsadapted level (i.e., an overshoot) before the system reaches itsfinal steady state. For example, with the same energy andcoupling strength parameters listed in Table I, but f1/f2¼1:4and kR
(1)/kR(2)¼2:1, the overall kinase activity undergoes a 10%
overshoot in response to addition of 180 mM of MeAsp, as
shown in Supplementary Figure S1B. This predicted behaviorfrom the LA model is consistent with the overshoot in thetransient response (in terms of the rotational bias of theflagellar motor) of E. coli to a large step chemotactic stimuliobserved by Berg and Brown (1972). This agreement stronglysupports the LA model. Our model also predicts that suchovershoot will be absent without the mixed receptor cluster.This prediction may be tested in cells with only one type ofchemoreceptors.Theoretical modeling also allows us to study the detailed
dynamics of receptor population Pq,m in each individual methyl-ation state (m¼0, 1,y, 4) and for different types of receptors(q¼1, 2). When there is no MeAsp present, the Tar receptorsmostly populate the low-methylation states (m¼0, 1; seebelow and also Supplementary Figure S9 in Neumann et al,2010). After adding 1mM MeAsp, the Tar population shiftsfrom low-methylation states to high-methylation states withmonotonic decreases of P1,0 and P1,1, and monotonic increasesof P1,2, P1,3 and P1,4 as shown in Figure 2C. However, for the Tsrreceptors that do not bind MeAsp, methylation level distribu-tions remain unchanged upon adaptation to MeAsp. Transi-ently, we observe a decrease-then-increase trend of thelow-methylation state probabilities P2,0, P2,1 and P2,2 for Tsr,whereas the probabilities of the high-methylation states P2,3and P2,4 show opposite transient behaviors due to theconservation of the total receptor population (Figure 2D).Similar changes in methylation level distribution for Tsrare observed when 1mM serine is added (SupplementaryFigure S1C and S1D). However, the adapted methylationlevels of Tar receptors in response to 1mM of serine haveincreased from their pre-stimulus levels (SupplementaryFigure S1C). This permanent methylation crosstalk is relatedto the mixed receptor cluster’s inability to maintain perfectadaptation to high concentrations of serine, which we willstudy next.
Methylation crosstalk and adaptation accuracy:imperfect adaptation leads to permanentmethylation crosstalk
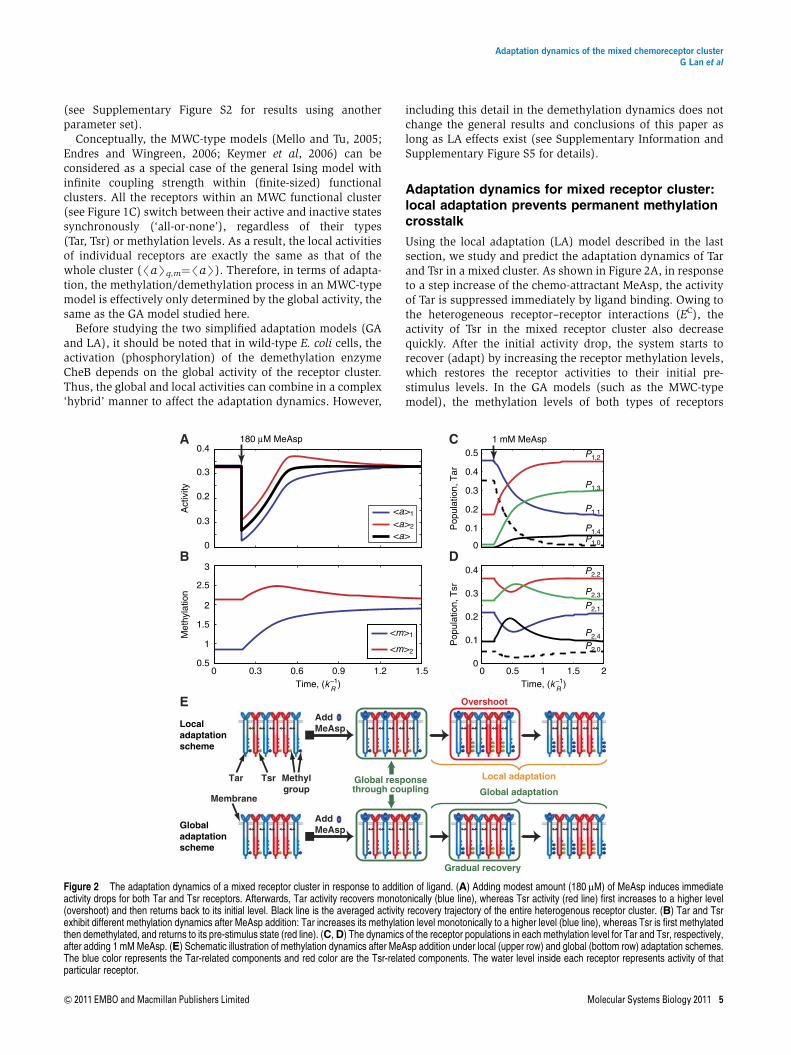
A receptor can adapt to a certain range of ligand concentrationsby adjusting its methylation level (Mesibov et al, 1973;Mao et al,2003). A mixed receptor cluster made of Tar and Tsr has theability of adapting to both MeAsp and serine stimuli, but withdifferent accuracies. Adaptation to MeAsp (or aspartate) isknown to be relatively accurate (perfect) in a wide range ofMeAsp concentrations, whereas the adaptation to serine is muchless accurate, in other words, imperfect (Berg and Brown, 1972;Neumann et al, 2010). This is demonstrated in Figure 3, in whichproperties of the adapted (steady) state of the mixed receptorcluster are shown for different levels ofMeAsp and serine. As canbe easily seen from Figure 3A and B, for a high MeAsp concen-tration (e.g., 1mM, B50K1
I ), the activity can still adaptaccurately and there is no permanent methylation crosstalk(see also Figure 2D). However, the same level of serine (1mM,B200K2
I ) leads to inaccurate adaptation (Figure 3C), and it alsotriggers methylation increase for the (non-binding) Tar receptors(Figure 3D, see also Supplementary Figure S1C); i.e, permanentmethylation crosstalk. These observations suggest a close
Adaptation dynamics of the mixed chemoreceptor clusterG Lan et al
6 Molecular Systems Biology 2011 & 2011 EMBO and Macmillan Publishers Limited

relationship between permanent methylation crosstalk andadaptation accuracy.To directly demonstrate the correlation between permanent
methylation crosstalk and adaptation accuracy, we plot thedegree of methylation crosstalk Dm, defined as the permanentmethylation level increase for the non-binding receptor, versusthe adaptation error (Da), defined as the steady-state clusteractivity change, for different amounts of ligand additions(Figure 3E). With the parameter set used here (Table I), thecorrelations between Dm and Da are nearly linear for bothMeAsp (blue line) and serine (red line) addition, which confirmsthe strong dependence of permanent methylation crosstalk onadaptation accuracy. Changingmodel parameters only affects thedependence quantitatively, and the strong correlation betweenpermanent methylation crosstalk and the adaptation accuracyexists for all parameter sets tested.The causal relation between methylation crosstalk and
adaptation accuracy can also be understood analytically fromour model. For high ligand concentrations, the effect of ligandbinding may not longer be balanced by the covalent modifica-tion (methylation) of its corresponding receptor; therefore, thesystem fails to adapt accurately. This permanent change inactivity (imperfect adaptation) is felt by the other receptors inthe mixed cluster through receptor–receptor interactionP
Cqiqi0 �ðai0 � 0:5Þ, which depends on the activity. Thechanges in receptor–receptor interaction strength drive themethylation of the non-binding receptors and eventually leadsto the permanent changes of their methylation levels, i.e.,methylation crosstalk.What causes inaccurate adaptation? We can answer this
question by deriving the dynamical equation for the averagemethylation level /mSq(�
Pm¼04 Pq,mm) by summing over the
dynamical equations (Equation (4)) for receptor populationsPq,m in different methylation levels:
dhmiqdt
¼ kRð1� haiqÞ � kBhaiq þ kBhaiq;0Pq;0
� kRð1� haiq;4ÞPq;4: ð5Þ
The last two terms in the above equation represent thecontributions from the boundary methylation values m¼0and 4. If the receptor population at these boundary methyla-tion levels are small, i.e., Pq,0,Pq,4 � 1, these boundary termscan be neglected from Equation (5), which will lead to/aS0
q¼kR/(kRþ kB) in steady state independent of ligandconcentration, i.e., perfect adaptation. Otherwise, as firstpointed out in Mello and Tu (2003a), these two ‘boundaryterms’ are responsible for imperfect adaptation of the system.There are two factors causing imperfect adaptation: finitereceptor population at the methylation boundaries (Pm¼0a0or Pm¼4a0), and the existence of activity ‘gap’ at thesemethylation boundaries (defined as D/aSq,0�/aSq,0 andD/aSq,4�1�/aSq,4, see Supplementary Figure S6A and B fordetails). If the activity gaps are not closed, i.e., D/aSq,0a0 orD/aSq,4a0, CheB or CheR would still attempt to demethylat-ing or methylating MCP receptors at the methylation bound-aries (m¼0) or (m¼4) in order to achieve perfect adaptation.However, the finite range of receptor methylation levels(boundaries) prevent the proper enzymatic reaction fromcontinuing. Therefore, the two boundary activity gaps affectthe adaptation accuracy by controlling the catalytic deficiencyat the two boundaries. As the receptor activity ‘gap’ isnormally very small (D/aSq,0B0) at m¼0, the dominantcontribution for imperfect adaptation comes from the receptorpopulation at the highest methylation level m¼4. Thedynamics of the Tar and Tsr population distributions indifferent methylation levels after additions of 1mM MeAsp isshown in Figure 2C and D. Even though adding 1mM MeAspbrings Tar methylation levels up from m¼0, 1, 2 to m¼1, 2, 3,P1,4 is still small, so the system adapts to 1mMMeAsp accuratelyand the steady-state distribution of Tsrmethylation levels remainunchanged, i.e., no permanent methylation crosstalk as shownin Figure 2D. However, adding 1mM serine shifts most of the Tsrpopulation to the boundary level m¼4 (Supplementary FigureS1D), which leads to imperfect adaptation and consequently aobservable shift in Tar methylation population distributiontoward higher methylation level (Supplementary Figure S1C).
0
0.1
0.2
0.3
Act
ivity
10310210110010–1 10310210110010–10
1
2
3
4
Met
hyla
tion <m>1
<m>2
0 0.04 0.08 0.12 0.160
0.2
0.4
0.6
0.8
Adaptation error, Δ<a>
Per
man
ent
met
hyla
tion
cros
stal
k, Δ
m
0
0.1
0.2
0.3
0
1
2
3
4
<a>1<a>2<a>
A C
B D
EAdding MeAspAdding serine
[L] MeAsp (K1)I [L] serine (K2)
I
Figure 3 The steady-state activities, receptor methylation levels and their relationship in different (MeAsp or serine) backgrounds. (A,B) Show the steady-state kinaseactivities and the receptor methylation levels for different background MeAsp levels. The system can adapt perfectly to very high concentrations of MeAsp (up to[L]1¼102K1
I ). As the Tar methylation level approaches its maximum (boundary) value of 4, adaptation becomes inaccurate (labeled by the dotted line), and the Tsrmethylation level starts to increase. (C,D) Show the steady-state kinase activities and the receptor methylation levels for different background serine levels. The perfectadaptation range for serine is much smaller than that for MeAsp, but the general relationship between kinase activity and receptor methylation still holds. As theadaptation becomes inaccurate (labeled by the dotted line), the Tar methylation level starts to increase. (E) Shows the relationship between permanent methylationcrosstalk and adaptation accuracy. The blue line is calculated from panels A, B for MeAsp responses, and red line from panels C, D for serine response. The near-linearcurves demonstrate strong correlation between permanent methylation crosstalk and adaptation error.
Adaptation dynamics of the mixed chemoreceptor clusterG Lan et al
& 2011 EMBO and Macmillan Publishers Limited Molecular Systems Biology 2011 7

Experimental measurements and comparison withtheoretical predictions
To test the predictions from the LA model, we have measuredthe Tar and Tsr populations in different methylation states atdifferent time points after addition of 1mM of either MeAsp orserine. For experiments, we used E. coli strain RP2893 deletedfor genomic copies of cheR and cheB and expressing CheR andCheBc, a constitutively active truncated version of CheB, frominducible plasmids. This setup enables us to focus on studyingthe adaptation control by the local activity while decoupling itfrom the known regulation of the global activity through CheBphosphorylation. Tar and Tsr receptors with different levelsof glutamate methylation were separated using the effects ofmethylation or similarly neutralizing replacement of gluta-mate by glutamine on protein mobility on the SDS–PAGE gel(images shown in Figure 4A and B). Mobility of individualmodification states was calibrated using samples preparedfrom cells expressing Tar or Tsr receptors with zero to four (forTar) or five (for Tsr) glutamines in place of glutamates, asshown in the inset in Figure 4C. Thus, determinedmobilities ofindividual methylation levels are shown as vertical lines inFigure 4C and D. Generally, Tsr mobility on the gel is lower and
Tar mobility is higher, but there is also an overlap in mobilitiesof high-modified Tsr receptors and low-modified Tar receptors.Note that the peaks of methylated receptors do not migrateexactly at the same positions as the standards, presumably dueto small differences between the effects of methylation andglutamine replacement and/or between modifications atdifferent sites. The two shaded regions in Figure 4C and Dmark the clearly distinguishable methylation levels for Tsr (leftregion,m¼0�3) and Tar (right region,m¼2�4). Figure 4C andD shows the detailed experimental results for the timedependence of the receptor methylation profiles (up to 600 s)after adding 1mM of MeAsp (Figure 4C) and serine(Figure 4D). For MeAsp addition, the measured methylationlevel profile shows significant changes for Tar. In contrast,changes in the Tsr methylation are very subtle and onlytransient before relaxing to their original levels (Figure 4C).Although Tsr may directly bind MeAsp at very high concentra-tions (B100mM; Sourjik and Berg, 2002), no Tsr methylationwas observed in the tar-strain stimulated by 1mM MeAsp(data not shown), ruling out direct effect of MeAsp binding onTsr methylation. Furthermore, the observed transient methy-lation crosstalk is not likely due to the direct nonspecificbinding of MeAsp ligand to Tsr receptors, because the
C
A
D
B
Position in the gel
0.01
00 1 2 3 4+5 0 1 2 3 4+5
0 1 2+3 40 1 2+3 4
00.02
0.030.3
Position in the gel
Adding 1 mM MeAsp Adding 1 mM serine
Rel
ativ
e re
cep
tor
sig
nal
Tsr st
andar
d
Tar st
andar
d
0 s 30 s
60 s
180 s
360 s
600 s
Tsr st
andar
d
Tar st
andar
d
0 s 30 s
60 s
180 s
360 s
600 s
Figure 4 Direct measurements of receptor methylation dynamics. (A, B) Mobility images of the Tar–Tsr two receptor system on the SDS–PAGE gel after additionof 1 mM MeAsp and serine, respectively. In the images, different columns show the results at specified time points after ligand addition: t¼0 s (dark), t¼30 s (red),t¼60 s (orange), t¼180 s (yellow), t¼360 s (light blue) and t¼600 s (blue). Results from pure Tar and pure Tsr receptors in fixed modification (amidation) states on thesame gel are shown in the first two columns of each panel for calibration purpose. (C, D) Curves present relative mobility profiles of receptors on the SDS–PAGE gelmeasured from panels A, B, respectively: each colored curve corresponds to the column labeled with the same color. Receptors were detected using immunoblottingas described in Materials and methods. Because serine is rapidly metabolized, 1 mM serine was added every minute during incubation. The inset in panel C showscalibration profiles of mixtures of Tar (green) and Tsr (black) receptors. Numbers 0, 1, 2, 3 and 4þ 5 under the panel boxes (in black) show the positions of Tsr receptorwith corresponding number of modifications, and numbers 0, 1, 2þ 3 and 4 above the panel boxes (in green) are the positions of Tar receptor with correspondingnumber of modifications. Source data is available for this figure at http://www.nature.com/msb.
Adaptation dynamics of the mixed chemoreceptor clusterG Lan et al
8 Molecular Systems Biology 2011 & 2011 EMBO and Macmillan Publishers Limited

methylation crosstalk would otherwise be permanent after thesystem adapts. Distinctly, for addition of 1mM serine, not onlythe methylation levels of the Tsr receptor increases (as seen bythe drastic decrease in the low-methylation level population ofTsr), but the methylation level of the Tar receptor alsoincreases (as seen by the increase in the high-methylationlevel populations of Tar, Figure 4D). Both of these observationsare in agreementwith the LAmodel and confirms the predictedconnection between methylation crosstalk and adaptationaccuracy. Again, no methylation of Tar receptor was observedin the tsr-strain stimulated by serine (data not shown),confirming that Tar methylation is due to crosstalk and notthe direct binding of serine to Tar.Quantitatively, the measured methylation profiles can be
analyzed by adding up the two shaded regions underneatheach profile curve, corresponding to the non-overlappingmethylation levels of Tar and Tsr, at each time point. InFigure 5, the Tsr population in low-methylation levels(m¼1�3) and the Tar population in high-methylation levels(m¼2�4) in response to 1mM MeAsp (Figure 5A) and 1mMserine (Figure 5B) are shown. The blues lines are predictionsfrom the LA model. In response to the 1mM MeAsp addition,the high-methylation population of Tar increases monotoni-cally consistent with our theoretical prediction (blue line).Although the time trajectories for each individual methylationlevels of Tsr are dynamic (see Figure 5C), their sum is ratherflat in agreement with the LA model results (blue line). This is
due to the fact that P2,3 changes in opposite trend with respectto P2,1 and P2,2 (as shown both in model prediction Figure 2Dand in experiment Figure 5C), which neutralize the overallchange of their sum. The unchanged overall methylationprofile at t¼600 s in comparison with that at t¼0 indicates thatthere is no permanent methylation crosstalk between Tar andTsr upon 1mM MeAsp addition. For the response to 1mMserine, Figure 5B shows a significant decrease of the low-methylation level population for Tsr as the Tsr receptors moveto higher methylation level in response to serine binding.However, the high-methylation level populations for Tar alsoshow a significant increase, indicating an increased Tarmethylation level even though Tar does not bind serinedirectly. This observed methylation crosstalk in response toserine confirms the LA model prediction (SupplementaryFigure S1C) and is caused by the inaccurate adaption to serineas explained earlier. Parameter set in Table I is used for thetheoretical simulations without parameter fitting, althoughbetter quantitative agreement with experimental data can beachieved by decreasing the adaptation rate for Tar (seeSupplementary information and Supplementary Figure S3).Dynamics of the receptor populations for individual
methylation levels in the non-overlapping regions of the gelcan also be studied for the lower methylation levels of Tsr(m¼1–3) and the higher methylation levels of Tar (m¼2–4).The dynamics of Tsr lower methylation states in response toaddition of 1mMMeAsp are shown in Figure 5C, in which the
A B
Time (s) Time (s)0 100 200 300 400 500 600
0
1
2
3
4
5
0 100 200 300 400 500 600
SimulationExperiment TsrExperiment Tar
Rel
ativ
e ch
ang
e o
f m
ethy
lati
on
Rel
ativ
e le
vel
0.9
1.0
1.1
1.2
0.7
0.8
0.9
1.0
0.6
0.7
0.9
1.0
0.8
0 1200400 600 0 1200400 600 0 1200400 600Time (s) Time (s)Time (s)
C
Tsr @ m=1 Tsr @ m=2 Tsr @ m=3
1.3
1.41.1Local scheme
ExperimentGlobal scheme
Figure 5 Quantitative comparisons of modeling predictions and experimental measurements. (A,B) Show the relative change of the population of a subset of receptormethylation levels (shadowed areas in Figure 4C and D) at different time points after addition of 1 mM MeAsp and serine. The black dots are for Tsr methylation levelfrom 1 to 3, and the green dots are for Tar methylation levels from 2 to 4. Error bars show the standard deviations from different measurements. Solid blue lines aresimulation results from the local adaptation model. (C) Shows the comparison of theoretical predictions and experimental observations of the dynamic of Tsr receptorpopulations in m¼1, 2 and 3 states after addition of 1 mM MeAsp. The LA model predicts non-monotonic transient behaviors for P2,m, which always return back to thepre-stimulus level (solid blue lines). The LA model is confirmed by experiments (red dots). In comparison, the GA model leads to permanent changes of the Tsrpopulation in different methylation levels (dotted blue lines), in clear disagreement with the experiments. The comparison indicates that the mixed receptor system adaptslocally. The experimental values of P2,m are determined from the data in Figure 4C by local averaging (3 points) around the calibrated receptor methylation levels form¼1, 2, and 3. All receptor populations shown are normalized to their values at t¼0.
Adaptation dynamics of the mixed chemoreceptor clusterG Lan et al
& 2011 EMBO and Macmillan Publishers Limited Molecular Systems Biology 2011 9

red dots are from experimental measurement and the solidblue curves are from the LAmodel prediction, the methylationrate kR is set to be 5�10�3 s�1 for temporal comparison (betterquantitative agreement can be achieved by requiring differentmethylation rates kR for Tar and Tsr in our model). The LAmodel agrees well with the experiments. The non-monotonicnature of the Tsr population dynamic in different methylationlevels confirms the transient methylation crosstalk predictedby the LA model. In comparison, the GA model leads topermanent changes of the Tsr population in differentmethylation levels (dotted blue lines in Figure 5C) in responseto MeAsp, in clear disagreement with the experiments. Thedynamics of Tar populations in higher methylation levels fromthe LA model also agrees with the data (see SupplementaryFigure S4).Overall, the experimental measurements strongly support
the LA model, in which individual receptor activity has animportant role in regulating its own methylation level toachieve adaptation. Our experimental observation of a limited(transient) crosstalk is inconsistent with the purely GAmodels, in which methylation is solely controlled by the totalactivity of the mixed receptor cluster. It also disagrees with therecently proposed CheA–CheA interaction model by Goldmanet al (2009) that predicts the absence of any (even transient)methylation crosstalk. Both the LA model and the experi-mental measurements show that when a mixed receptorcluster is exposed to a mixture of external chemostimuli,different types of receptors adapt to different methylationlevels, depending on the composition of the mixed stimuli.This LA mechanism suggests that bacteria can distinguish andencode complex external ligand information through methyla-tion levels of their corresponding receptors.
Discussion
The ability to adapt to complex environments is essential fororganisms to survive (Adler and Tso, 1974). For the bacterialchemosensory system studied here, adaptation is carried out by areversible receptor covalent modification (methylation/de-methylation) process (Falke et al, 1997). The resulting methyla-tion levels of the receptors encode a rudimentary memory of theenvironment encountered by the cell. In this paper, we proposeda local adaptation (LA) mechanism, in which the receptoradaptation is controlled by its own conformational changes. Weshowed that this local feedback mechanism allows the cell toadapt accurately to different stimuli in the presence ofheterogeneous receptor–receptor interactions. This LA strategyavoids receptor methylation crosstalk, and thus enables the cellto record (remember) the concentrations of different stimulidistinctively using the methylation levels of the correspondingreceptors. The LA mechanism is verified by direct experimentalmeasurements of themethylation dynamics of different chemor-eceptors Tar and Tsr in response to addition ofMeAsp and serine.For E. coli chemotaxis, the adaptation dynamics after a given
environment change can be illustrated by the two-dimensionaltrajectories of the average Tar and Tsr methylation levels. Forthe LA model, as shown in Figure 6A, adding MeAsp leads toa methylation level trajectory that ends to the right of thestarting point, whereas adding serine gives rise to a trajectory
that ends above the starting point. When perfect adaptation isachieved, the methylation coordinate of the end point in thenon-binding direction is the same as that of the starting point,indicating no permanent methylation crosstalk. However,when the trajectories approach the maximum methylationlevel (m¼4), perfect adaptation fails, and the end (steadystate) point has finite changes in both methylation coordinateseven for additions of one single type of stimulus, indicating thestart of methylation crosstalk. Contrarily, for the GA model,such as the MWC-type adaptation models, the methylationdynamics always follows the same trajectory independent ofthe details of the environment changes. As shown in Figure 6B,the end points only depend on an overall strength of theenvironment changes integrated over all stimuli, and themethylation level trajectories for different ligand perturbationsall collapse onto a single line, indicative of severe permanentmethylation crosstalk.The relevant information about the external chemical
environment for an E. coli cell can be specified by the ligandconcentrations ([L]1, [L]2) for MeAsp and serine, respectively.From the methylation trajectory analysis, it is clear that the LAmechanism encodes this information distinctively in themethylation levels of Tar and Tsr (/mS1, /mS2) in a uniqueone-to-one manner without loss of information, as shown inFigure 6C. However, for the GAmechanism, the mapping fromthe chemical information to its intracellular record is notunique (many-to-one). In fact, as shown in Figure 6D, a wholeline of different combinations of concentrations are mapped toa single point in the methylation space, representing a severeloss of information. In the following, we study the functionaladvantages of the LA mechanism that prevents permanentmethylation crosstalk and avoids such information losses.
Local adaptation leads to high sensitivity in globalactivity response
The most important performance measure of a sensory systemis its sensitivity to various external stimuli in differentbackgrounds. For E. coli chemotaxis, after the mixed receptorcluster reaches its steady state in a given ambient chemicalbackground, the response to a sudden change of a stimulusconcentration (D[L]) can be measured by the relative sensi-tivity: S�([D]/aS//aS/D[L]/[L]), where Da is the immedi-ate activity change before methylation/demethylation takesplace and [L] is the ambient level of the ligand whoseconcentration has been changed. Here, we compare thesensitivities of the Ising-type GA and the LA models indifferent backgrounds of MeAsp and serine concentrations. InFigure 7A, we plot the sensitivity to MeAsp as a function of thebackground MeAsp concentration at different levels of serinebackground. Results show that higher levels of serine back-ground do not change the shape of the sensitivity curve, butlower the overall sensitivity to MeAsp, likely caused by thecell’s imperfect adaptation to serine. The serine sensitivitycurves in different levels of MeAsp backgrounds, as shown inFigure 7B, have little or no dependence on the MeAspbackgrounds, as the cell can adapt to a wide range of MeAspconcentrations accurately. More systematic evaluations havebeen performed under all combinations of background MeAsp
Adaptation dynamics of the mixed chemoreceptor clusterG Lan et al
10 Molecular Systems Biology 2011 & 2011 EMBO and Macmillan Publishers Limited

and serine concentrations, and the results are summarized inSupplementary Figure S7. For responses to all combinations ofMeAsp and serine, the LA scheme for the Ising-type modelalways leads to a higher sensitivity than the global scheme (seealso Supplementary Figure S7).In a given background, the receptormethylation levels reach
their steady-state values. The subsequent fast response to asudden change of ligand concentration can be studied by fixingthese methylation levels as they can only change slowly. Theimmediate activity responses as a function of the final level ofligand concentration (background plus added ligand concen-trations) are shown in Figure 7C and D, for MeAsp and serine,respectively. The sensitivities are given by the slopes of theresponse curves at the positions of the adapted statesrepresented by the dots in Figure 7C and D. The responsecurves for different adaptation schemes clearly show that thelocal scheme (black lines) always leads to steeper dose–response curves than the global scheme (red lines). InFigure 7C, the predicted dose–responses in three backgrounds(30, 500 and 5000 mM MeAsp) are compared directly with thecorresponding experimental measurements (Sourjik and Berg,2002; diamond symbols). The LA model shows excellentagreement with the experiments. The high sensitivity of the LAscheme can be understood intuitively as all the individualreceptors are tuned (adapted) to their most sensitive operatingpoint (Mello and Tu, 2007). Contrarily, the GA scheme onlyleads to a state with a fixed globally averaged activity with the
individual receptors adapting to activities either higher orlower than their most sensitive operating points. The deviationof the individual receptors from their most sensitive regimes isresponsible for the reduction in the overall sensitivity of thesystem. Note that the MWC model is different from the Ising-type GA model, and it can reproduce the kinase response data(Keymer et al, 2006; Mello and Tu, 2007) due to the effectivelyinfinite receptor coupling strength (within a functional cluster)assumed in theMWCmodel. However, theMWCmodel, whichautomatically adopts the global scheme for the receptormethylation dynamics, would predict incorrect receptormethylation levels in the mixed receptor cluster.
Stability of the methylation dynamics
Although similar in their structures, Tar and Tsr receptorsdiffer in their cytoplasmic regions, including the positions oftheir methyl-accepting sites. Therefore, even though bothtypes of receptors share the same enzymes formethylation anddemethylation reactions, the structural variance between themcould lead to different catalytic efficiencies of these enzymes.In our model, this difference can be represented by differentkR(q)/kB
(q) ratios for Tar (q¼1) and Tsr (q¼2) receptors, whichleads to different preferred steady-state activities a0
(q)¼kR(q)/
(kR(q)þ kB
(q)) for the Tar and Tsr adaptation dynamics. In the LAmodel, this difference in preferred activities is allowed as eachtype of receptor can achieve its own preferred adapted activity
0 1 2 3 42
2.4
2.8
3.2
3.6
4<m
>2
<m>1
<m
>2
[L]1=0
1 2 3 41
1.5
2
2.5
3
3.5
4[L
] 1
[L] 1
[L]2
104
103
102
101
10–1 100 101 102100
102
102
101
101
100
100
10–1
10–110–2
10–22.5 3 3.5 41
2
3
4
1 2 3
1
2
3
A B
C D
<m>2 <m>2
<m>1
<m
>1
[L]2
<m
>1
[L]2=10 K2I
I
[L]1=0[L]2=102 K2
I[L]1=102 K1
I
[L]2=102 K2I
[L]1=10 K1I
[L]2=0
[L]1=102 K1I
[L]2=0[L]1=10 K1
I
[L]2=0[L]1=K1
I
[L]2=0
[L]2=K2
[L]1=0
[L]2=0[L]1=0 [L]2=0
[L]1=0[L]1=K1
I
[L]2=0
[L]1=10 K1I
[L]2=K2I
[L]1=102 K1I
[L]2=K2I
[L]1=102 K1I
[L]2=10 K2I
[L]1=102 K1I
[L]2=102 K2I
Figure 6 The adaptation trajectories and the mapping from external chemical signal to internal memory. (A) The adaptation dynamics in response to additions ofdifferent stimuli, as represented by the (average) methylation level trajectories in the 2D plane spanned by (/mS1, /mS2), are shown for the local adaptation model.Each line, started from the same original pre-stimulus state at the lower left corner, represents one trajectory after adding certain amount of ligand (labeled besides theend point of each curve). (B) The adaptation trajectories from the MWC-type model. Trajectories for different stimuli fall onto a single line in the (/mS1,/mS2) plane.(C) The ligand concentration space ([L]1, [L]2) is organized by the constant adapted activity contour lines shown in the left panel; the corresponding (average) receptormethylation levels (/mS1,/mS2) adapted to the external stimuli ([L]1, [L]2) can be determined from the local adaptation model and are shown in the right panel with thesame color as the corresponding ligand concentrations. The mapping from the external stimuli ([L]1, [L]2) to the internal memory (/mS1,/mS2) is unique (one-to-one)in the local adaptation model, and there is no loss of information. (D) In the MWC model, each constant kinase activity line in the ([L]1, [L]2) space, shown on the left,is mapped onto a single point in the methylation space, shown on the right. This represents a drastic reduction of information from external chemical signal to theinternal memory.
Adaptation dynamics of the mixed chemoreceptor clusterG Lan et al
& 2011 EMBO and Macmillan Publishers Limited Molecular Systems Biology 2011 11

separately. However, for the GA scheme, in which both the Tarand Tsr methylation dynamics are controlled by the sameglobal activity a, different ratios kR
(q)/kB(q) for Tar and Tsr can be
a major problem as can be seen in the following simple linearequations for the Tar and Tsr methylation dynamics:
dmq
dt¼ k
ðqÞR ð1� aÞ � k
ðqÞB a;
where q¼1, 2 represents Tar and Tsr, respectively. There is nosteady state solution for the above equations unless the tworatios of kinetic constants are exactly the same kR
(1)/kB(1)¼kR
(2)/kB(2) for Tar and Tsr. If they are not the same kR
(1)/kB(1)akR
(2)/kB(2),
the system becomes unstable (frustrated) and the methylationlevels of Tar and Tsr will be driven to their extreme valuesat m¼0 or 4, inconsistent with experimental observations.In comparison with the more flexible LA mechanism, thestringent requirement of the exact equality of the two kinetic
constant ratios for different receptors makes the GA mecha-nism much less robust.
Local adaptation prevents the poisoning effect bymethylation contamination
In environments with extremely high levels of a givenstimulus, the cell can lose its ability to respond to furtherchange of this particular stimulus. A natural question arisesas to whether saturation of one type of stimulus can destroythe cell’s sensitivity to other types of stimuli. Clustering ofdifferent types of chemoreceptors, which has an important rolein signal amplification, could mediate methylation of onetype of receptor in response to a ligand that binds with anothertype of receptor. Because a receptor loses its ability to senseconcentration change at high-methylation levels (m43), witha strong methylation crosstalk, the mixed receptor cluster
Sen
sitiv
ity
AS
ensi
tivity
B
0
0.2
0.4
0.6
0.8
1
0
0.2
0.4
0.6
0.8
1C D
Act
ivity
Act
ivity
Global schemeLocal scheme
Response from global schemeReponse from local schemeExperiment
101
100
10–1
10–2
10–3
10–4
10–2 100 102
10–2
10–1 100 101 102 10–110–2 100 101 102103 104
100 102 10–2 100 102 10–2 100 102 10–2 100 102
104 10–2 100 102 104 10–2 100 102 104 10–2 100 102 104
101
100
10–1
10–2
10–3
10–4
101
100
10–1
10–2
10–3
10–4
101
100
10–1
10–2
10–3
10–4
[L]serine = K2I
[L]serine (K2)I
[L]MeAsp (K1)I
[L]serine (K2)I [L]serine (K2)
I
[L]serine (K2)I
[L]serine (K2)I
[L]MeAsp (K1)I
[L]MeAsp = K1I
[L]MeAsp (K1)I
[L]MeAsp = 10 K1I [L]MeAsp = 102 K1
I [L]MeAsp = 103 K1I
[L]MeAsp (K1)I [L]MeAsp (K1)
I
[L]serine = 10 K2I [L]serine = 102 K2
I [L]serine = 103 K2I
101
100
10–1
10–2
10–3
10–4
101
100
10–1
10–2
10–3
10–4
101
100
10–1
10–2
10–3
10–4
101
100
10–1
10–2
10–3
10–4
Figure 7 Response sensitivity in different backgrounds and comparison with experiments. (A) The response sensitivities to MeAsp as functions of the backgroundMeAsp level. Different panels are for different serine backgrounds. (B) The response sensitivities to serine as functions of the background serine level. Different panelsare for different MeAsp backgrounds. (C,D) Show the dose–response curves for the LA (black) and GA (red) models at three different backgrounds shown by the dottedlines. The responses in three backgrounds ([L]0¼30, 500 and 5000 mM MeAsp) are compared with the corresponding experimental measurements (Sourjik and Berg,2002; diamond symbols) in (C). For comparison purpose, we subtracted background activity at saturate amount of MeAsp (C) or serine (D) and scaled the experimentallymeasured adapted activities to a0 in our model. The LA model shows excellent agreement with the experiments. Note that instead of plotting the response to the addedconcentrationD[L] as done in Sourjik and Berg (2002), we have plotted the response against the final concentration [L]1¼[L]0þD[L] so that the sensitivity can be directlydetermined from the slope of the response curve at [L]1¼[L]0 (Mello and Tu, 2007). The results here indicate that for any given backgrounds, the LA model always leadsto higher sensitivity than the GA model.
Adaptation dynamics of the mixed chemoreceptor clusterG Lan et al
12 Molecular Systems Biology 2011 & 2011 EMBO and Macmillan Publishers Limited

could lose its sensitivity to all types of chemical stimuli whensaturated by one type of ligand.This detrimental ‘poisoning’ effect is particularly severe for
the MWC-type GA models. Owing to the effectively infinitecoupling strength between receptors within the finite func-tional cluster in the MWC-type models, the methylation levelsof all types of receptors can reach their maximum in theirconcerted response to extremely high level of one type ofstimulus. As a result, the non-binding receptors in the mixedcluster also reach high-methylation levels and therefore eitherlose the ability to sense any changes in their correspondingligand (signal) or fail to recover their activity, and hence abilityto respond. As shown in Figure 8A–C for theMWC-typemodel,when two different types of ligands are added successively,the mixed receptor sensory system cannot respond to thesecond ligand addition when the first ligand is overdosed(Figure 8C).The situation is much improved for the LA scheme as shown
in Figure 8D, E and F. In the LA model, the coupling strength(Cqq0) between receptors is finite, and each receptor undergoesseparate adaptation dynamics. Therefore, when one type ofligand is overdosed, the corresponding receptor loses its abilityfor sensing further change of that type of ligand (red lines inFigure 8D, E and F). However, even though methylationcrosstalk does occur in the LA model as the system fails toadapt, the finite coupling strength limits the degree ofmethylation contamination, and acts as a fire-wall to keepother types of receptors from being driven to their highestmethylation levels. As a result, the mixed receptor cluster isstill capable (albeit to a less degree) of sensing changes of otherstimuli (blue lines in Figure 8D, E and F).Figure 8 also shows the corresponding methylation trajec-
tories upon successive ligand additions for the MWC (Figure8G, H and I) and the LA models (Figure 8J, K and L). Notsurprisingly,methylation contamination is severe for theMWCmodel. For the LA model, however, the finite couplinginteraction and the LA mechanism work together to limit thedegree of methylation contamination and protect the entiresensory machinery from being totally destroyed by overdosingof one single type of ligand.In summary, highly cooperative interactions between
sensors (receptors) within amixed sensor network can amplifysmall signals and are directly responsible for high responsesensitivity. What we have shown here is that allowingindividual sensors in the network to adapt according to itsown (local) activity is crucial in maintaining the responsive-ness of the system in environments with multiple signals. Boththe modeling work and the experimental measurements of themethylation dynamics confirm that this local-activity-depen-dent adaptation strategy is used in E. coli chemotaxis. Micro-scopically, certain conformational changes of the chemo-receptors control the activity of the attached histidine kinase.Our study confirms that the same receptor conformationalchanges also affect the receptor’s methylation/demethylationkinetics. This LA scheme prevents methylation crosstalk andenables the cell to differentiate different signals by themethylation levels of the corresponding receptors. This LAprocess tunes each individual sensor to its most sensitiveoperating point and thus maintains the high sensitivity of theentire cluster. The absence of methylation crosstalk shows
that the receptors in a functional cluster do not work in aall-or-none manner. Instead, the receptor interactions withina mixed cluster can be best described by a Ising-type modelwith nn interactions. The finite interaction strength betweenneighboring sensors in a Ising model can also prevent the totaldisfunction of one type of receptor by the saturation of anothertype of receptors.
Materials and methodsAll strains used in this study are listed in Supplementary Table S1.Methylation experiments were performed in E. coli strain RP2893[D2206 (tap-cheZ)] expressing CheR from plasmid pVS113 and CheBcfrom plasmid pSB4. To calibrate mobility of different receptormodification states on the SDS–PAGE gel, receptors with a definednumber of glutamate residues (E) replaced by glutamine (Q), whichmimics methylated glutamate (Dunten and Koshland, 1991), wereused. Tar standard was derived from strains VS144 (tsr TarEEEE), VS141(tsr TarQEEE), VS148 (tsr TarQEQE), VS150 (tsr TarQEQQ) and SB1 (tsrTarQQQQ) that encode Tar mutants on the chromosome. Tsr standardwas derived from strain VS164 (tarTsrQEQEE), and strain VS172 (tsr tar)that expressed Tsr from plasmids pVS362 (TsrEEEEE), pVS356(TsrQEEEE), pVS361 (TsrQQQEE), pVS363 (TsrQQQQE) and pVS502(TsrQQQQQ).
Cell growth and preparation
Strains were grown in tryptone broth (0.1%. tryptone and 0.5% NaCl)with added antibiotics (100mgml�1 ampicillin, 35 mgml�1 chloram-phenicol) and appropriate inducers. Overnight cultures, grown at301C, were diluted 1:100 and grown at 341C and 275 r.p.m. to a finalOD600 of 0.45–0.5. Cells were collected by centrifugation (4000 r.p.m.,10min), washed and resuspended in tethering buffer (10mMpotassium phosphate, 0.1mM EDTA, 1mM L-methionine, 67mMsodium chloride, 10mM sodium lactate, pH 7). Cells were incubatedfor 1 h at 41C to stop growth before methylation experiments.
Determination of optimal induction levels
Strain RP2847 [D2241(tap-cheB)] transformed with pVS113 and pSB4was plated on soft agar plates (1% tryptone, 0.5% NaCl and 0.3%agar) containing varying levels of inducers, L-arabinose and isopropylb-D-thiogalactoside. Wild type (RP437) and RP2847 transformed withempty vectors pTrc99a and pBAD33 served as positive and negativecontrol on the same plate, respectively. The diameter of formed swarmrings was measured and served as basis for estimation of the optimalinduction level, which was defined at 0.01% arabinose for CheRexpression and 30 mgml�1 isopropyl b-D-thiogalactoside for CheBcexpression.
Methylation reaction
Cells were five times concentrated, poured into a small beaker andgentlymixed at room temperature. Samples of 200ml were taken beforeand 30, 60, 180, 360 and 600 s after addition of MeAsp or serine to afinal concentration of 1mM each. Because L-serine is metabolized,1mM serine had to be added every minute during incubation. Sampleswere mixed with 100ml pre-heated (951C) 3� Laemmli buffer andeither used immediately or stored at �801C.
Immunoblotting
Methylation states of receptor populations were resolved on 8% SDS–PAGE gels with a running length of 35 cm. Neutralization of negativelycharged glutamate residues throughmethylation causes enhanced SDSbinding and an increased charge-mass-ratio of methylated receptors(Boyd and Simon, 1980). Proteins were transferred from gels ontonitrocellulose paper using a semidry transfer apparatus (Biometra,Fastblot B34 and B44) for 45min. Membranes were hybridized with
Adaptation dynamics of the mixed chemoreceptor clusterG Lan et al
& 2011 EMBO and Macmillan Publishers Limited Molecular Systems Biology 2011 13

LA modelTar receptoris protected
MWC modelEntire clusteris poisoned
Addserine
Addserine
Overdosed serineTar ‘Poisoned’
Tar partially functional
M
0
0.1
0.2
0.3
[L]2 =10–1 K2 [L]2 =103 K2[L]2 =10 K2
MW
Cac
tivity
<a>
0
0.1
0.2
0.3
LAac
tivity
<a>2
<a>
<a>1
2.5
3
3.5
4
MW
Cm
ethy
latio
n <m>2
<m>1
0 5 10 15 202.5
3
3.5
4
LAm
ethy
latio
n <m>2
<m>1
0 5 10 15 20 0 5 10 15 20
A
D
J
G
B
E
K
H
C
F
L
I
[L]1 =K1
Time (k R ) Time (k R )
[L]1 =K1 [L]1 =K1I I I I I I
–1 –1 Time (k R )–1
Figure 8 Response to successive stimuli of different signals with different strengths. At t¼1 (time is in unit of kR�1), certain amount of serine ([L]2¼10�1, 10, 103 K2
I forthe three cases (columns) shown) is added to the mixed receptor system, followed by the addition of MeAsp ([L]1¼K1
I ) at t¼11. (A–C) are activity adaptation curves fromthe MWC-type model, in which saturating amount of serine background, shown in (C), irreversibly inhibits the mixed receptor cluster and prohibits it from responding tofurther MeAsp addition (the poisoning effect). (D–F) Are activity adaptation curves from the local adaptation model, in which the system still respond to MeAsp partiallyeven with large serine background. (G–I) Show the corresponding methylation level dynamics from the MWC model, and (J–L) show the methylation dynamics of thelocal adaptation model. (G–L) Clearly show that the local adaptation model limits the strength of methylation contamination, whereas severe methylation contaminationexists in the MWC-type model. (M) Schematic illustration of methylation dynamics after adding saturating amount of serine under local adaptation model (upper row) andMWC-type model (bottom row). The blue color represents the Tar-related components and red color are the Tsr-related components. The water level inside eachreceptor represents activity of that particular receptor.
Adaptation dynamics of the mixed chemoreceptor clusterG Lan et al
14 Molecular Systems Biology 2011 & 2011 EMBO and Macmillan Publishers Limited

rabbit polyclonal anti-Tar antibody and fluorescently labeled second-ary antibody (goat anti-rabbit IgG IRDyes 800 conjugate), both at adilution of 1:5000. Detection was performed using LI-COR OdysseysInfrared Imaging System, and intensity profiles were analyzed usingImageJ software, Version 1.34 l (W Rasband, National Institutes ofHealth, Bethesda, MD; http://rsb.info.nih.gov/ij). Data were subse-quently processed using KaleidaGraph software, Version 3.6 (SynergySoftware). Intensity profiles in individual lanes were measured withina stripe comprising all receptor methylation states. Intensity valueswere normalized to the integral fluorescence intensity of thedistribution. The resulting profile was smoothed by using Smoothfunction of KaleidaGraph. Estimation of the relative change in receptormethylationwith timewasmade by calculating the area correspondingto low- or high-methylation states.
Supplementary information
Supplementary information is available at the Molecular SystemsBiology website (www.nature.com/msb).
AcknowledgementsWe thank Gabi Schwarz for help with plasmid construction and DrHazelbauer and Dr Shimizu for helpful discussions. GL and YTweresupported by the NIH grant (R01GM081747 to YT); SS and VS weresupported by the Deutsche Forschungsgemeinschaft grant SO 421/3-3.Author contributions: GL and YT developed the models and carried
out the simulations; SS and VS designed and carried out theexperiments; all analyzed the data, made comparisons with the modelresults, and wrote the paper.
Conflict of interestThe authors declare that they have no conflict of interest.
References
Adler J (1976) The sensing of chemical by bacteria. Sci Am 302: 40–47Adler J, Tso WW (1974) Decision-making in bacteria: chemotactic
response of Escherichia coli to conflicting stimuli. Science 184:1292–2294
Alon U, Surette MG, Barkai N, Leibler S (1999) Robustness in bacterialchemotaxis. Nature 397: 168–171
Ames P, Studdert CA, Reiser RH, Parkinson JS (2002) Collaborativesignaling by mixed chemoreceptor teams in Escherichia coli. ProcNatl Acad Sci USA 99: 7060–7065
Amin DN, Hazelbauer GL (2010) The chemoreceptor dimer is the unitof conformational coupling and transmembrane signaling.J Bacteriol 192: 1193
Antommattei FM, Munzner JB, Weis RM (2004) Ligand-specificactivation of Escherichia coli chemoreceptor transmethylation.J Bacteriol 186: 7556–7563
Barkai N, Leibler S (1997) Robustness in simple biochemical networks.Nature 387: 913–917
Berg HC, Brown DA (1972) Chemotaxis in E. coli analysed by threedimensional tracking. Nature 239: 500–504
Berg HC, Tedesco PM (1975) Transient response to chemotactic stimuliin Escherichia coli. Proc Natl Acad Sci USA 72: 3235–3239
Bornhorst JA, Falke JJ (2000) Attractant regulation of the aspartatereceptor-kinase complex: limited cooperative interactions betweenreceptors and effects of the receptor modification state.Biochemistry 39: 9486–9493
Boyd A, Simon MI (1980) Multiple electrophoretic forms of methyl-accepting chemotaxis proteins generated by stimulus-elicitedmethylation in Escherichia coli. J Bacteriol 143: 809–815
Bozorth RM (1993) Ferromagnetism. Piscataway, NJ, USA: Wiley-IEEEPress
Bray D, Duke T (2004) Conformational spread: the propagation ofallosteric states in large multiprotein complexes. Annu Rev BiophysBiomol Struct 33: 53–73
Bray D, Levin MD, Morton-Firth CJ (1998) Receptor clustering as acellular mechanism to control sensitivity. Nature 393: 85–88
Cluzel P, Surette M, Leibler S (2000) An ultrasensitive bacterial motorrevealed by monitoring signaling proteins in single cells. Science287: 1652–1655
Djordjevic S, Goudreau PN, Xu Q, Stock AM, West AH (1998)Structural basis for methylesterase CheB regulation by aphosphorylation-activated domain. Proc Natl Acad Sci USA 95:1381–1386
Dunten P, Koshland DE (1991) Tuning the responsiveness of asensory receptor via covalent modification. J Biol Chem 266:1491–1496
Duke TAJ, Bray D (1999) Heightened sensitivity of a lattice ofmembrane of receptors. Proc Natl Acad Sci USA 96: 10104–10108
Endres RG, Wingreen NS (2006) Precise adaptation in bacterialchemotaxis through ‘assistance neighborhoods’. Proc Natl Acad SciUSA 103: 13040–13044
Falke JJ, Bass RB, Butler SL, Chervitz SA, Danielson MA (1997) Thetwo-component signaling pathway of bacterial chemotaxis: amolecular view of signal transduction by receptors, kinases, andadaptation enzymes. Annu Rev Cell Dev Biol 13: 457–512
Falke JJ, Hazelbauer GL (2001) Transmembrane signaling in bacterialchemoreceptors. Trends Biochem Sci 26: 257–265
Goldman JP, Levin MD, Bray D (2009) Signal amplification in a latticeof coupled protein kinases. Mol Biosyst 5: 1853–1859
Grebe TW, Stock J (1998) Bacterial chemotaxis: the five sensors of abacterium. Curr Biol 8: R154–R157
Hazelbauer GL, Falke JJ, Parkinson JS (2008) Bacterial chemo-receptors: high-performance signaling in networked arrays.Trends Biochem Sci 33: 9–19
Hoch JA, Silhavy TJ (1995) Two-component signal transduction.Washington DC, USA: American Society for Microbiology
Kalinin Y, Neumann S, Sourjik V, Wu M (2010) Responses ofEscherichia coli bacteria to two opposing chemoattractantgradients depend on the chemoreceptor ratio. J Bacteriol 192:1796–1800
Kentner D, Sourjik V (2009) Dynamicmap of protein interactions in theEscherichia coli chemotaxis pathway. Mol Syst Biol 5: 238
Kentner D, Thiem S, Hildenbeutel M, Sourjik V (2006) Determinants ofchemoreceptor cluster formation in Escherichia coli. Mol Microbiol161: 407–417
Keymer JE, Endres RG, Skoge M, Meir Y, Wingreen NS (2006)Chemosensing in Escherichia coli: two regimes of two-statereceptors. Proc Natl Acad Sci USA 103: 1786–1791
Khursigara CM,Wu X, Zhang P, Lefman J, Subramaniam S (2008) Roleof HAMP domains in chemotaxis signaling by bacterialchemoreceptors. Proc Natl Acad Sci USA 105: 16555–16560
Kim KK, Yokota H, Kim SH (1999) Four-helical-bundle structure of thecytoplasmic domain of a serine chemotaxis receptor. Nature 400:787–792
Laub MT, Goulian M (2007) Specificity in two-component signaltransduction pathways. Annu Rev Genet 41: 121–145
Li G, Weis RM (2000) Covalent modification regulates ligand bindingto receptor complexes in the chemosensory system of Escherichiacoli. Cell 100: 357–365
Maddock JR, Shapiro L (1993) Polar location of the chemoreceptorcomplex in the Escherichia coli cell. Science 259: 1717–1723
Mao H, Cremer PS, Manson MD (2003) A sensitive, versatilemicrofluidic assay for bacterial chemotaxis. Proc Natl Acad SciUSA 100: 5449–5454
Mello BA, Shaw L, Tu Y (2004) Effects of receptor interaction inbacterial chemotaxis. Biophys J 87: 1578–1595
Mello BA, Tu Y (2003a) Perfect and near-perfect adaptation in a modelof bacterial chemotaxis. Biophys J 84: 2943–2956
Adaptation dynamics of the mixed chemoreceptor clusterG Lan et al
& 2011 EMBO and Macmillan Publishers Limited Molecular Systems Biology 2011 15

Mello BA, Tu Y (2003b) Quantitative modeling of sensitivity inbacterial chemotaxis: the role of coupling among differentchemoreceptor species. Proc Natl Acad Sci USA 100: 8223–8228
Mello BA, Tu Y (2005) An allosteric model for heterogeneous receptorcomplexes: understanding bacterial chemotaxis responses tomultiple stimuli. Proc Natl Acad Sci USA 102: 17354–17359
Mello BA, Tu Y (2007) Effects of adaptation in maintaining highsensitivity over a wide range of backgrounds for Escherichia colichemotaxis. Biophys J 92: 2329–2337
Mesibov R, Ordal GW, Adler J (1973) The range of attractantconcentrations for bacterial chemotaxis and the threshold andsize of response over this range: Weber law and relatedphenomena. J Gen Physiol 62: 203–223
Monod J, Wyman J, Changeux JP (1965) On the nature of allosterictransitions: a plausible model. J Mol Biol 12: 88–118
Morton-Firth CJ, Shimizu TS, BrayD (1999)A free-energy-based stochasticsimulation of the tar receptor complex. J Mol Biol 286: 1059–1074
Neumann S, Hansen CH,Wingreen NS, Sourjik V (2010) Differences insignalling by directly and indirectly binding lignads in bacterialchemotaxis. EMBO J 29: 3484–3495
Sanders DA, Koshland DE (1988) Receptor interactions throughphosphorylation and methylation pathways in bacterial chemo-taxis. Proc Natl Acad Sci USA 85: 8425–8429
Shimizu TS, Aksenov SV, Bray D (2003) A spatially extended stochasticmodel of the bacterial chemotaxis signalling pathway. J Mol Biol329: 291–309
Shimizu TS, Tu Y, Berg HC (2010) Amodular gradient-sensing networkfor chemotaxis in E. coli revealed by responses to time-varyingstimuli. Mol Syst Biol 6: 382
SilvermanM, SimonM(1977) Chemotaxis in Escherichia coli:methylationof che gene products. Proc Natl Acad Sci USA 74: 3317–3321
Sims JJ, Cohen RE (2009) Linkage-specific avidity defines the lysine63-linked polyubiquitin-binding preference of rap80. Mol cell 33:775–783
Sims JJ, Haririnia A, Dickinson BC, Fushman D, Cohen RE (2009) Avidinteractions underlie the Lys63-linked polyubiquitin bindingspecificities observed for UBA domains. Nat Struct Mol Biol 16:883–889
Sourjik V, Berg HC (2002) Receptor sensitivity in bacterial chemotaxis.Proc Natl Acad Sci USA 99: 123–127
Sourjik V, Berg HC (2004) Functional interactions between receptors inbacterial chemotaxi. Nature 428: 437–441
Stock AM, Robinson VL, Goudreau PN (2000) Two-component signaltransduction. Annu Rev Biochem 69: 183–215
Studdert CA, Parkinson JS (2005) Insights into the organizationand dynamics of bacterial chemoreceptor clusters throughin vivo crosslinking studies. Proc Natl Acad Sci USA 102:15623–15628
Vaknin A, Berg HC (2007) Physical responses of bacterial chemo-receptors. J Mol Biol 366: 1416–1423
Webre DJ, Wolanin PM, Stock JB (2003) Bacterial chemotaxis. CurrBiol 13: 47–49
Yi TM, Huang Y, SimonMI, Doyle J (2000) Robust perfect adaptation inbacterial chemotaxis through integral feedback control. Proc NatlAcad Sci USA 97: 4649–4653
Molecular Systems Biology is an open-access journalpublished by EuropeanMolecular Biology Organiza-
tion andNature Publishing Group.This work is licensed under aCreative Commons Attribution-Noncommercial-Share Alike 3.0Unported License.
Adaptation dynamics of the mixed chemoreceptor clusterG Lan et al
16 Molecular Systems Biology 2011 & 2011 EMBO and Macmillan Publishers Limited