ADAMS DIVERSIFIED EQUITY Trusted by investors for generations
31
ADAMS DIVERSIFIED EQUITY FUND ANNUAL REPORT 2016
Transcript of ADAMS DIVERSIFIED EQUITY Trusted by investors for generations
Trusted by investors for generationsSM
ADAMS DIVERSIFIED EQUITY FUND
ANNUAL REPORT2016
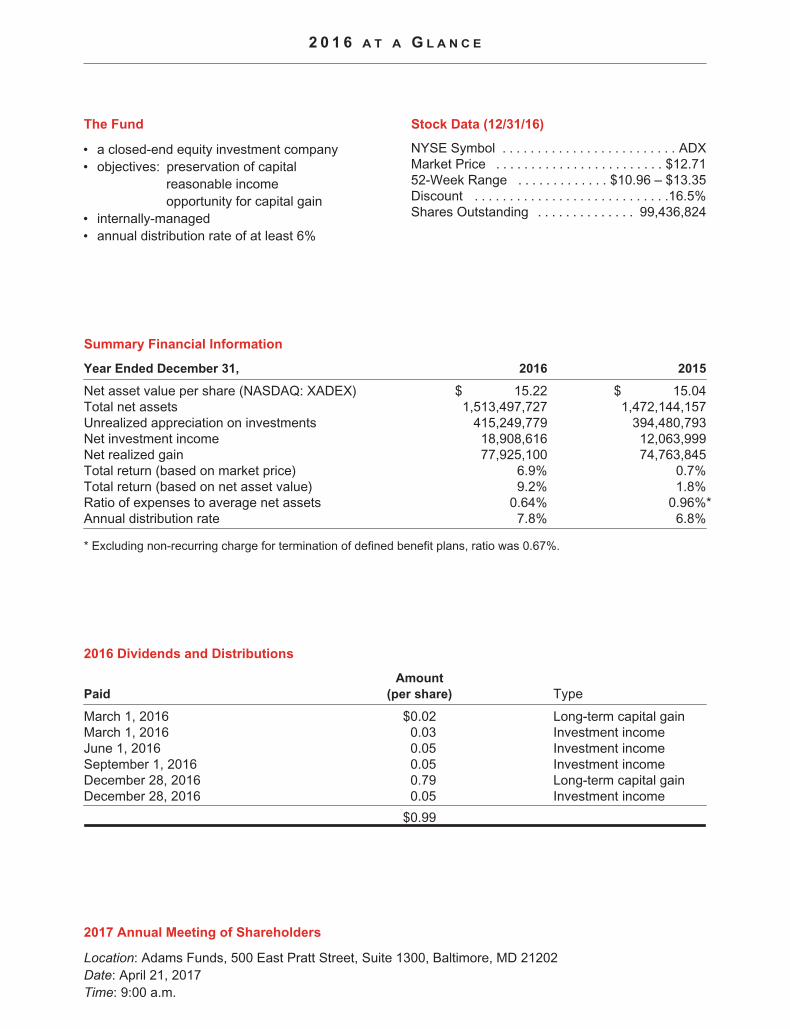
2 0 1 6 A T A G L A N C E
The Fund
‰ a closed-end equity investment company‰ objectives: preservation of capital
reasonable incomeopportunity for capital gain
‰ internally-managed‰ annual distribution rate of at least 6%
Stock Data (12/31/16)
NYSE Symbol . . . . . . . . . . . . . . . . . . . . . . . . . ADXMarket Price . . . . . . . . . . . . . . . . . . . . . . . . $12.7152-Week Range . . . . . . . . . . . . . $10.96 – $13.35Discount . . . . . . . . . . . . . . . . . . . . . . . . . . . .16.5%Shares Outstanding . . . . . . . . . . . . . . 99,436,824
Summary Financial Information
Year Ended December 31, 2016 2015
Net asset value per share (NASDAQ: XADEX) $ 15.22 $ 15.04Total net assets 1,513,497,727 1,472,144,157Unrealized appreciation on investments 415,249,779 394,480,793Net investment income 18,908,616 12,063,999Net realized gain 77,925,100 74,763,845Total return (based on market price) 6.9% 0.7%Total return (based on net asset value) 9.2% 1.8%Ratio of expenses to average net assets 0.64% 0.96%*Annual distribution rate 7.8% 6.8%
* Excluding non-recurring charge for termination of defined benefit plans, ratio was 0.67%.
2016 Dividends and Distributions
Paid
Amount
(per share) Type
March 1, 2016 $0.02 Long-term capital gainMarch 1, 2016 0.03 Investment incomeJune 1, 2016 0.05 Investment incomeSeptember 1, 2016 0.05 Investment incomeDecember 28, 2016 0.79 Long-term capital gainDecember 28, 2016 0.05 Investment income
$0.99
2017 Annual Meeting of Shareholders
Location: Adams Funds, 500 East Pratt Street, Suite 1300, Baltimore, MD 21202Date: April 21, 2017Time: 9:00 a.m.

Letter from Chief Executive Officer and President,
Mark E. Stoeckle
“Despite the political
and economic
unknowns, we see
opportunities in the
U.S. equity markets.”
Dear Fellow Shareholders,
Uncertainty and a 10% stock market decline ushered in the first few weeks of 2016. The ensuing reboundin equities set the tone for what proved to be a year marked by resiliency in the face of the unexpected.Despite macroeconomic and political events ranging from concerns about China’s growth in January tothe Brexit vote in June and the U.S. election in November, financial markets defied expectations. Themajority of 2016’s gains came in the second half of the year. A rebound in corporate earnings,accelerating U.S. economic growth, and stabilizing oil prices supported investor enthusiasm for stocks.The rally gathered steam after the U.S. election with the S&P 500 advancing 5.0% and finishing 2016 witha total return of 12.0%. This year’s rally extends a bull market that has seen the S&P 500 triple in valuesince March of 2009, which marked the trough of the financial crisis.
Against this backdrop, Adams Diversified Equity Fund, Inc. generated a total return on net asset value of9.2% and a total return on market price of 6.9%. The Lipper Large-Cap Core Mutual Funds Average, ourpeer group, returned 10.1%. The Fund distributed 7.8% to shareholders in 2016, exceeding its 6%commitment.
2016 Market Recap
The year’s surprises began in the opening trading session of the year whenmarkets declined on concerns that China faced a hard landing after years ofrapid growth. Fears that additional rate hikes were forthcoming, building on theDecember 2015 Federal Reserve interest rate increase, added additionalpressure. U.S. crude (West Texas Intermediate) prices also fell to a decade lowof $26.21 a barrel. By February 11th, the market had suffered its worst-ever startto a year. However, investor worries subsided quickly, and the marketsassumed an upward trajectory.
The primary catalysts for the market rebound were economic fundamentals thatfueled a more-supportive stance for financial markets. The labor market continued to strengthen as didthe housing outlook and motor vehicle sales. Economic activity began expanding at a moderate paceduring the summer and accelerated later in the year. Oil prices also found a floor as supply and demandmoved closer to balance and U.S. inflation escalated. Some sectors that were hardest hit during theretreat at the beginning of the year, including Energy and Materials, embarked on sustained rallies andfinished the year significantly higher.
The year was not without volatility. In June, the markets reacted adversely to the news that voters in theU.K. had passed the referendum forcing Britain to leave the European Union. The following two tradingsessions wiped $3 trillion out of global markets. However, the market upheaval was short-lived. Fearsabout the U.S. economy diminished causing consumer confidence to rise in the second-half of the year.The unemployment rate fell to 4.6% and U.S. corporate earnings grew after several quarters of declines.In the strongest reading in two years, U.S. GDP advanced 3.5% in the third quarter.
November delivered the second political shock, as Donald Trump proved the predictive models andpolling numbers wrong and emerged victorious in the U.S. Presidential election. Market pundits alsomissed the mark, as expectations for a selloff in the event of a GOP win never materialized. To the
1

L E T T E R T O S H A R E H O L D E R S ( C O N T I N U E D )
contrary, stocks in the U.S. hit record highs, fueled by the anticipated business-friendly policies of the newadministration. Prospects for tax cuts and a cash repatriation plan strengthened domestic equities, as didexpectations of an easier regulatory environment and increased infrastructure spending.
Post-election tailwinds contributed to the superior returns in the Energy, Financials, and Industrialssectors relative to the overall market’s advance of 12.0%. Energy stocks also benefited from OPEC’s firstagreement to curtail production since December of 2008. Elsewhere, the Consumer Discretionary sectoradvanced in the final months of the year thanks to expectations for strong economic growth andimproving wages.
The Federal Reserve held off on raising interest rates for most of the year until improvements in the labormarket and inflation justified the move. The December increase was the first since December 2015 andjust the second rate increase in a decade. Officials also signaled that future hikes would likely proceed ata faster pace than previously projected reflecting optimism about the U.S. economy.
Portfolio Performance
While we are always pleased to generate a positive total return, the Fund’s performance relative to theS&P 500 was disappointing. The shortfall primarily reflected a significant rotation in the market in the firstsix months of 2016. Investors rewarded lower-quality, out-of-favor companies based on the expectationthat their prospects would improve and the performance of the high-quality names we prefer suffered. Wehave experienced these swings in the past and, while not something we either enjoy or take lightly, wehave found that staying true to our investment process will ultimately be rewarded. In the latter half of theyear, there was a more balanced perspective in the market and the portfolio’s performance improved. Forthe year, Technology and Health Care were the most costly sectors versus the S&P 500. Strongperformance in the Energy and Financials sectors helped to offset some of the relative performanceshortfall.
While still up 13.9% for the year, the Technology sector lagged during the post-election rally. Investorssold long-term winners in Technology to fund more cyclical and interest rate-sensitive names. Ourposition in Apple contributed to the relative underperformance. Though aided by Samsung’s well-publicized product recall, a lukewarm reception to the iPhone 7 product cycle hurt the stock. Ourexposure to Visa was also a detractor as debit card market share concerns pressured the stock in theshort-term. But we continue to believe that Visa will benefit from the secular trend toward cashlesstransactions.
Health Care stocks struggled for most of 2016. Post-election, the sector initially moved higher onPresident-elect Trump’s pledge to reform existing health care programs. However, investor interest in thesector waned reflecting uncertainty surrounding the timing of changes and the future state of health carelaws. Our stock selection and weightings in the sector detracted from the Fund’s return. The weakestperformer in Health Care was Allergan, a diversified pharmaceutical company. In April, Pfizer called off itsacquisition of Allergan following new rules designed to curb “tax-inversion” deals. Allergan’s stock borethe brunt of the dropped merger. Despite sector-wide pricing concerns, Allergan’s growth profile remainsamong the best of all large drug companies.
Energy was the strongest performing sector in the S&P 500 in 2016 as supply and demand fundamentalsfor oil and gas improved. Oil prices rose 45% during the year and natural gas advanced 59%. President-elect Trump’s promise of reduced regulation as well as the OPEC agreement to limit production addedfurther optimism, contributing to a market-leading return of 27.4% for the sector. The Fund’s holding inAdams Natural Resources Fund, our sister diversified energy and materials fund, was the top contributorto the sector’s performance. Our overweight positon in Halliburton, one of the world’s largest providers ofproducts and services to the energy industry, also delivered solid results.
2

L E T T E R T O S H A R E H O L D E R S ( C O N T I N U E D )
The Financial sector experienced the largest post-election “bounce” in performance. Financial stockssoared following the election and advanced 22.8% for the year. The sector is a major beneficiary of risinginterest rates, easing regulatory headwinds, and corporate tax reform. Our stock selection and weightingsin the capital markets industry contributed significantly to the portfolio. The Fund’s holdings in GoldmanSachs Group and Raymond James Financial delivered solid earnings growth throughout the year. Bankstocks, including your Fund’s positions in Bank of America and Wells Fargo, were the best-performingindustry group within Financials.
Outlook for 2017
The year kicks off with a new U.S. President, stocks near an all-time high, rising interest rates, andrebounding oil prices. GDP growth is accelerating and U.S. corporate earnings are showing continuedgrowth. We expect the relative economic strength in the U.S. to continue. The U.S. consumer isbenefiting from employment gains, modestly improving wages, and favorable housing conditions. Interestrates, though expected to rise, remain at historically low levels. Further economic growth could beforthcoming if plans to lower corporate taxes and loosen regulations materialize.
However, the year also begins with risks and opportunities arising from the shifting political landscape.Politics will likely be a major market driver over the next several years. A new administration is coming inwith a very different agenda than the one put forth by the Obama White House. Financial markets will bepaying close attention to how President Trump will reduce regulatory restrictions, increase fiscal stimulus,reduce taxes, and boost infrastructure spending.
Outside the U.S., macroeconomic and political risks persist. The implementation of Britain’s exit, electionsin France and Germany, and the effects of changing U.S. trade policy create uncertainty. Apart from this,there are signs of a pickup in global growth led by an improving economic cycle in China.
Despite the political and economic unknowns, we see opportunities in the U.S. equity markets.Companies that benefit from rising interest rates, less regulation, higher commodity prices, and innovationoffer great potential.
The Energy sector, which served the Fund well last year, should continue to benefit from higher oil andgas prices and the more benign regulatory environment anticipated during President Trump’s term. Ascommodity prices rise, companies that operate “closest to the well,” including oil service and explorationand production companies, often outperform. Quality exploration and production companies includingConcho Resources and Anadarko Petroleum, a recent addition to the portfolio, reflect that posture.Trading at a discount to its peers, Anadarko generates strong production and cash flow growth atcompetitive rates of return. Recent asset transactions by management positions the company well andplans to accelerate activity in the Delaware and Denver-Julesburg Basins should result in double-digit oilproduction growth through 2020. Halliburton also remains a favored holding and our preferred vehicle toplay an accelerating U.S. onshore recovery.
Though rising significantly since the election, we continue to be optimistic about the Financials sector. Weare entering a period of rising interest rates, a time when Financials often outperform. Additionally, theelection of Donald Trump could translate into reduced regulation and improving growth prospects for thesector. Companies could benefit from lower compliance costs and a loosening of capital constraints. Inthe fourth quarter we initiated a position in American Express Company, a global payments and creditcard company. After two years of significantly underperforming the sector, we find the stock to beattractively valued as the company is showing signs of becoming more competitive.
We also continue to be optimistic about the Technology sector as ongoing innovation and disruptivetechnologies shape the global economy. Cloud computing, mobility, and “big data” are secular shifts that
3

L E T T E R T O S H A R E H O L D E R S ( C O N T I N U E D )
should continue to attract an increasing portion of corporate technology spending. Our portfolio ispositioned to capture these trends through companies like Microsoft, Alphabet, Facebook, and AdobeSystems.
Consumer confidence rebounded in 2016 and consumer spending could be the beneficiary of lower taxesand increases in disposable income in the coming year. The consumer recently has demonstrated apreference for spending more on experiences rather than things. An addition to our portfolio in the lastquarter captures that trend. Priceline, an online travel agent with a vast global footprint of properties andservices, offers an attractive growth profile and should continue to benefit from the growing consumerpreference for travel and adventure.
Investors were rewarded with attractive returns in 2016, resulting in an eight-year move higher in theS&P 500. The combination of strong fundamentals and a significantly changing political landscape bothdomestically and abroad present a unique environment for investors. The Fund’s long-term focus andproven strategy help us find opportunities during periods of uncertainty. Our search for high-qualitycompanies that are executing well and trading at the right prices is unwavering.
By order of the Board of Directors,
Mark E. StoeckleChief Executive Officer & PresidentJanuary 20, 2017
Disclaimers
This report contains “forward-looking statements” within the meaning of the Securities Act of 1933 and the SecuritiesExchange Act of 1934. By their nature, all forward-looking statements involve risks and uncertainties, and actualresults could differ materially from those contemplated by the forward-looking statements. Several factors that couldmaterially affect the Fund’s actual results are the performance of the portfolio of stocks held by the Fund, the con-ditions in the U.S. and international financial markets, the price at which shares of the Fund will trade in the publicmarkets, and other factors discussed in the Fund’s periodic filings with the Securities and Exchange Commission.
This report is transmitted to the shareholders of the Fund for their information. It is not a prospectus, circular or repre-sentation intended for use in the purchase or sale of shares of the Fund or of any securities mentioned in the report.The rates of return will vary and the principal value of an investment will fluctuate. Shares, if sold, may be worth moreor less than their original cost. Past performance is no guarantee of future investment results.
4
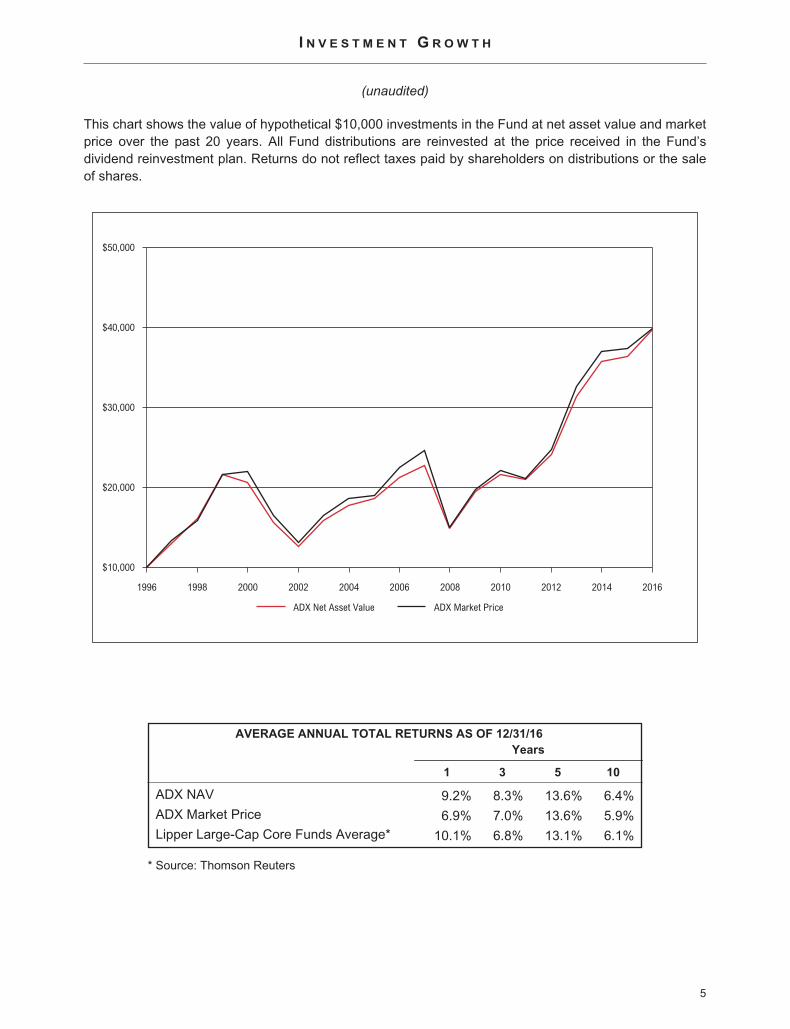
I N V E S T M E N T G R O W T H
(unaudited)
This chart shows the value of hypothetical $10,000 investments in the Fund at net asset value and marketprice over the past 20 years. All Fund distributions are reinvested at the price received in the Fund’sdividend reinvestment plan. Returns do not reflect taxes paid by shareholders on distributions or the saleof shares.
1996 1998 2000 2002 2004 2006 2008 2010 2012 2014 2016
ADX Net Asset Value ADX Market Price
$10,000
$20,000
$30,000
$40,000
$50,000
AVERAGE ANNUAL TOTAL RETURNS AS OF 12/31/16
Years
1 3 5 10
ADX NAV 9.2% 8.3% 13.6% 6.4%ADX Market Price 6.9% 7.0% 13.6% 5.9%Lipper Large-Cap Core Funds Average* 10.1% 6.8% 13.1% 6.1%
* Source: Thomson Reuters
5
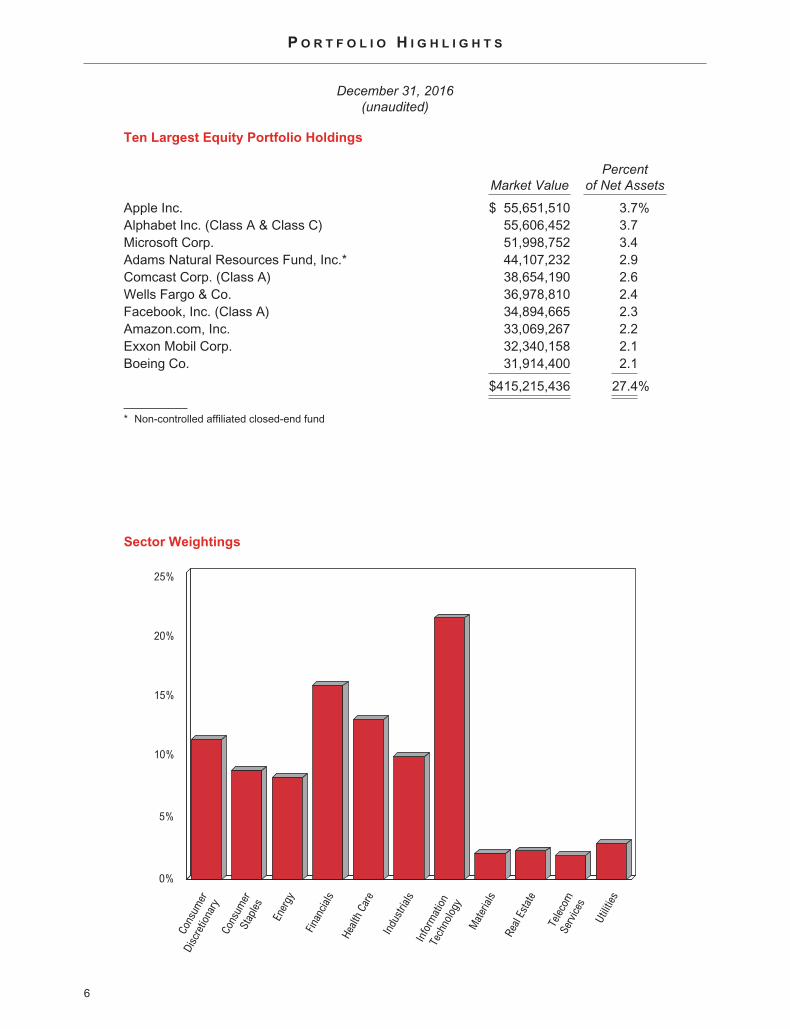
P O R T F O L I O H I G H L I G H T S
December 31, 2016(unaudited)
Ten Largest Equity Portfolio Holdings
Market ValuePercent
of Net Assets
Apple Inc. $ 55,651,510 3.7%Alphabet Inc. (Class A & Class C) 55,606,452 3.7Microsoft Corp. 51,998,752 3.4Adams Natural Resources Fund, Inc.* 44,107,232 2.9Comcast Corp. (Class A) 38,654,190 2.6Wells Fargo & Co. 36,978,810 2.4Facebook, Inc. (Class A) 34,894,665 2.3Amazon.com, Inc. 33,069,267 2.2Exxon Mobil Corp. 32,340,158 2.1Boeing Co. 31,914,400 2.1
$415,215,436 27.4%
* Non-controlled affiliated closed-end fund
Sector Weightings
0%
5%
10%
15%
25%
20%
Cons
umer
Disc
retio
nary
Ener
gy
Cons
umer
Stap
les
Finan
cials
Healt
h Ca
re
Info
rmat
ion
Tech
nolo
gy
Telec
omSe
rvice
s
Mat
erial
s
Utilit
ies
Indu
stria
ls
Real
Esta
te
6
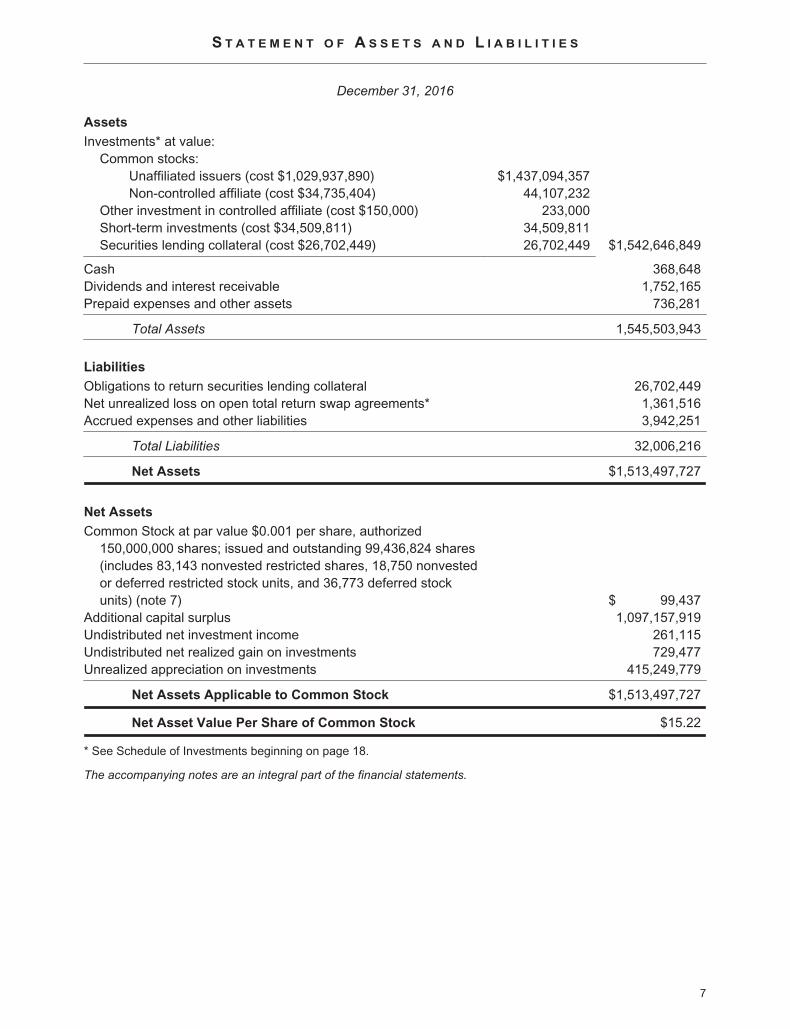
S T A T E M E N T O F A S S E T S A N D L I A B I L I T I E S
December 31, 2016
Assets
Investments* at value:Common stocks:
Unaffiliated issuers (cost $1,029,937,890) $1,437,094,357Non-controlled affiliate (cost $34,735,404) 44,107,232
Other investment in controlled affiliate (cost $150,000) 233,000Short-term investments (cost $34,509,811) 34,509,811Securities lending collateral (cost $26,702,449) 26,702,449 $1,542,646,849
Cash 368,648Dividends and interest receivable 1,752,165Prepaid expenses and other assets 736,281
Total Assets 1,545,503,943
Liabilities
Obligations to return securities lending collateral 26,702,449Net unrealized loss on open total return swap agreements* 1,361,516Accrued expenses and other liabilities 3,942,251
Total Liabilities 32,006,216
Net Assets $1,513,497,727
Net Assets
Common Stock at par value $0.001 per share, authorized150,000,000 shares; issued and outstanding 99,436,824 shares(includes 83,143 nonvested restricted shares, 18,750 nonvestedor deferred restricted stock units, and 36,773 deferred stockunits) (note 7) $ 99,437
Additional capital surplus 1,097,157,919Undistributed net investment income 261,115Undistributed net realized gain on investments 729,477Unrealized appreciation on investments 415,249,779
Net Assets Applicable to Common Stock $1,513,497,727
Net Asset Value Per Share of Common Stock $15.22
* See Schedule of Investments beginning on page 18.
The accompanying notes are an integral part of the financial statements.
7
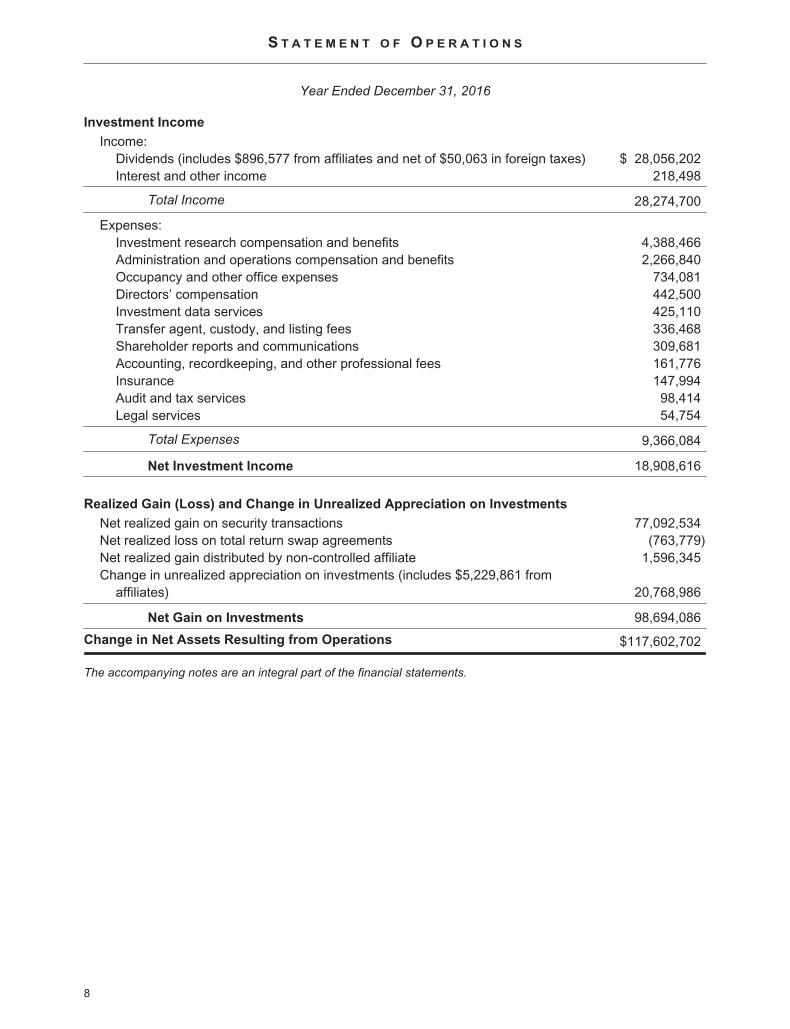
S T A T E M E N T O F O P E R A T I O N S
Year Ended December 31, 2016
Investment Income
Income:Dividends (includes $896,577 from affiliates and net of $50,063 in foreign taxes) $ 28,056,202Interest and other income 218,498
Total Income 28,274,700
Expenses:Investment research compensation and benefits 4,388,466Administration and operations compensation and benefits 2,266,840Occupancy and other office expenses 734,081Directors’ compensation 442,500Investment data services 425,110Transfer agent, custody, and listing fees 336,468Shareholder reports and communications 309,681Accounting, recordkeeping, and other professional fees 161,776Insurance 147,994Audit and tax services 98,414Legal services 54,754
Total Expenses 9,366,084
Net Investment Income 18,908,616
Realized Gain (Loss) and Change in Unrealized Appreciation on Investments
Net realized gain on security transactions 77,092,534Net realized loss on total return swap agreements (763,779)Net realized gain distributed by non-controlled affiliate 1,596,345Change in unrealized appreciation on investments (includes $5,229,861 from
affiliates) 20,768,986
Net Gain on Investments 98,694,086
Change in Net Assets Resulting from Operations $117,602,702
The accompanying notes are an integral part of the financial statements.
8

S T A T E M E N T S O F C H A N G E S I N N E T A S S E T S
For the Year Ended December 31,
2016 2015
From Operations:
Net investment income $ 18,908,616 $ 12,063,999Net realized gain 77,925,100 74,763,845Change in unrealized appreciation 20,768,986 (75,235,059)Change in accumulated other comprehensive income (note 6) — 2,375,650
Increase in Net Assets Resulting from Operations 117,602,702 13,968,435
Distributions to Shareholders from:
Net investment income (17,520,894) (13,398,646)Net realized gain (78,538,326) (75,358,557)
Decrease in Net Assets from Distributions (96,059,220) (88,757,203)
From Capital Share Transactions:
Value of shares issued in payment of distributions (note 5) 32,024,245 32,287,094Cost of shares purchased (note 5) (12,436,299) (13,600,866)Deferred compensation (notes 5, 7) 222,142 474,036
Increase in Net Assets from Capital Share Transactions 19,810,088 19,160,264
Total Change in Net Assets 41,353,570 (55,628,504)
Net Assets:
Beginning of year $1,472,144,157 1,527,772,661
End of year (including undistributed net investment income of$261,115 and distributions in excess of net investment incomeof $710,116, respectively) $1,513,497,727 $1,472,144,157
The accompanying notes are an integral part of the financial statements.
9

N O T E S T O F I N A N C I A L S T A T E M E N T S
Adams Diversified Equity Fund, Inc. (the “Fund”) is registered under the Investment Company Act of 1940(“1940 Act”) as a diversified investment company. The Fund is an internally-managed closed-end fundwhose investment objectives are preservation of capital, the attainment of reasonable income frominvestments, and an opportunity for capital appreciation.
1. SIGNIFICANT ACCOUNTING POLICIES
Basis of Presentation — The accompanying financial statements were prepared in accordance withaccounting principles generally accepted in the United States of America (“GAAP”) for investmentcompanies, which require the use of estimates by Fund management. Management believes thatestimates and valuations are appropriate; however, actual results may differ from those estimates, andthe valuations reflected in the financial statements may differ from the value the Fund ultimately realizes.
Affiliates — The 1940 Act defines “affiliated companies” as those companies in which the Fund owns 5%or more of the outstanding voting securities. Additionally, those companies in which the Fund owns morethan 25% of the outstanding voting securities are considered to be “controlled” by the Fund. The Fundand its affiliates, Adams Natural Resources Fund, Inc. (“PEO”) and Adams Funds Advisers, LLC (“AFA”)have a shared management team.
PEO — The Fund owns 2,186,774 shares of PEO, a non-diversified, closed-end investment company,representing 8% of its outstanding shares. The Fund accounts for PEO as a portfolio investment thatmeets the definition of a non-controlled affiliate. During 2016, the Fund received dividends and long-termcapital gain distributions of $896,577 and $1,596,345, respectively, from its investment in PEO andrecognized a change in unrealized appreciation on its investment in PEO of $5,313,861. Directors of theFund are also directors of PEO.
AFA — In April 2015, Fund shareholders authorized the Fund to provide investment advisory services toexternal parties, and the Securities and Exchange Commission granted no action relief under section12(d)(3) of the 1940 Act to allow the Fund to create a separate, wholly-owned entity for this purpose. TheFund provided the initial capital for the start-up costs of AFA, a Maryland limited liability company, and theFund is the sole member and General Manager, as provided by the Operating Agreement between AFAand the Fund. This structure mitigates the risk of potential liabilities for the Fund associated with anyclaims that may arise from AFA during the ordinary course of conducting its business. Given that AFA isan operating company that provides no services to the Fund, the Fund accounts for AFA as a portfolioinvestment that meets the definition of a controlled affiliate.
In October 2015, AFA began providing advisory services to an external party. AFA earns advisory feerevenue based on assets under management. AFA’s profit can fluctuate due to the level of assets undermanagement, as driven by the number of client relationships, level of client investment activity, and clientinvestment performance, and will impact the Fund’s valuation of its investment in AFA. As of December31, 2016, AFA had assets under management of $134 million invested entirely from one client; failure tomaintain this existing relationship or to develop new relationships could impact AFA’s ability to generaterevenue. To the extent that AFA’s operating costs exceed its revenue earned, the Fund may be requiredto provide additional capital to AFA. For tax purposes, AFA’s revenues and expenses are consolidatedwith those of the Fund and, as such, the advisory fee revenue generated by AFA is monitored closely toensure that it does not exceed an amount that would jeopardize the Fund’s status as a regulatedinvestment company. During 2016, the Fund recognized a change in unrealized appreciation on itsinvestment in AFA of $(84,000).
Expenses — The Fund and its affiliates share personnel, systems, and other infrastructure items and arecharged a portion of the shared expenses. To protect the Fund from potential conflicts of interest, policiesand procedures are in place covering the sharing of expenses among the entities. Expenses that are notsolely attributable to one entity are allocated in accordance with the Fund’s policy, which dictates that
10

N O T E S T O F I N A N C I A L S T A T E M E N T S ( C O N T I N U E D )
such expenses be attributed to each entity based on the relative net assets of the Funds, or, in the caseof AFA, the net assets under management. Investment research compensation and benefits areattributed to each entity based on the relative market values of the portfolio securities covered in eachrespective entity. Expense allocations are updated quarterly, except for those related to payroll, which areupdated annually.
For the year ended December 31, 2016, expenses of $3,529,116 and $442,604 were charged to PEOand AFA, respectively, in accordance with the Fund’s expense sharing policy. There were no amountsdue to, or due from, its affiliates as of December 31, 2016.
Investment Transactions, Investment Income, and Distributions — The Fund’s investment decisionsare made by the portfolio management team with recommendations from the research staff. Policies andprocedures are in place covering the allocation of investment opportunities among the Fund and itsaffiliates to protect the Fund from potential conflicts of interests. Investment transactions are accountedfor on trade date. Realized gains and losses on sales of investments are recorded on the basis of specificidentification. Dividend income and distributions to shareholders are recognized on the ex-dividend date.Interest income is recognized on an accrual basis.
Valuation — The Fund’s financial instruments are reported at fair value, which is defined as the price thatwould be received to sell an asset or paid to transfer a liability in an orderly transaction between marketparticipants at the measurement date. The Fund has a Valuation Committee (“Committee”) to ensure thatfinancial instruments are appropriately priced at fair value in accordance with GAAP and the 1940 Act.Subject to oversight by the Board of Directors, the Committee establishes methodologies and proceduresto value securities for which market quotations are not readily available.
GAAP establishes the following fair value hierarchy that categorizes the inputs used to measure fair value:
• Level 1 — fair value is determined based on market data obtained from independent sources; forexample, quoted prices in active markets for identical investments;
• Level 2 — fair value is determined using other assumptions obtained from independent sources;for example, quoted prices for similar investments;
• Level 3 — fair value is determined using the Fund’s own assumptions, developed based on thebest information available in the circumstances.
Investments in securities traded on national security exchanges are valued at the last reported sale price asof the close of regular trading on the relevant exchange on the day of valuation. Over-the-counter and listedsecurities for which a sale price is not available are valued at the last quoted bid price. Money market fundsare valued at net asset value. These securities are generally categorized as Level 1 in the hierarchy.
Short-term investments (excluding money market funds) are valued at amortized cost, whichapproximates fair value. Total return swap agreements are valued using independent, observable inputs,including underlying security prices, dividends, and interest rates. These securities are generallycategorized as Level 2 in the hierarchy.
The Fund’s investment in its controlled affiliate, AFA, is valued by methods deemed reasonable in goodfaith by the Committee. The Fund generally uses market-based valuation multiples, including price-to-earnings and price-to-book value, and discounted free cash flow analysis, or a combination thereof toestimate fair value. The Committee also considers discounts for illiquid investments, such as AFA. Fairvalue determinations are reviewed on a regular basis and updated as needed. Due to the inherentuncertainty of the value of Level 3 assets, estimated fair value may differ significantly from the value thatwould have been used had an active market existed. Any change in the estimated fair value of Level 3investments is recognized in the Fund’s Statement of Operations in Change in unrealized appreciation oninvestments.
11

N O T E S T O F I N A N C I A L S T A T E M E N T S ( C O N T I N U E D )
Given the absence of market quotations or observable inputs, the Fund’s investment in AFA iscategorized as Level 3 in the hierarchy.
At December 31, 2016, the Fund’s financial instruments were classified as follows:Level 1 Level 2 Level 3 Total
Assets:Common stocks $1,481,201,589 $ — $ — $1,481,201,589Other investments — — 233,000 233,000Short-term investments 34,509,811 — — 34,509,811Securities lending collateral 26,702,449 — — 26,702,449
Total investments $1,542,646,849 $ — $233,000 $1,542,646,849
Liabilities:
Total return swap agreements* $ — $(1,361,516) $ — $ (1,361,516)
* Unrealized appreciation (depreciation)
The following is a reconciliation of the change in the value of Level 3 investments:
Balance as of December 31, 2015 $317,000Purchases —Change in unrealized appreciation on investments (84,000)
Balance as of December 31, 2016 $233,000
There were no transfers between levels during the year ended December 31, 2016.
2. FEDERAL INCOME TAXES
No federal income tax provision is required since the Fund’s policy is to qualify as a regulated investmentcompany under the Internal Revenue Code and to distribute substantially all of its taxable income andgains to its shareholders. Additionally, management has analyzed and concluded that tax positionsincluded in federal income tax returns from the previous three years that remain subject to examinationdo not require any provision. Any income tax-related interest or penalties would be recognized as incometax expense. As of December 31, 2016, the identified cost of securities for federal income tax purposeswas $1,126,011,451 and net unrealized appreciation aggregated $416,635,398, consisting of grossunrealized appreciation of $432,450,604 and gross unrealized depreciation of $15,815,206.
Distributions are determined in accordance with the Fund’s annual 6% minimum distribution ratecommitment, based on the Fund’s average market price, and income tax regulations, which may differfrom generally accepted accounting principles. Such differences are primarily related to the Fund’sretirement plans, equity-based compensation, and investment in AFA. Differences that are permanent,while not material for the year ended December 31, 2016, are reclassified in the capital accounts of theFund’s financial statements and have no impact on net assets. For tax purposes, distributions paid by theFund during the years ended December 31, 2016 and December 31, 2015 were classified as ordinaryincome of $17,518,194 and $14,361,548, respectively, and as long-term capital gain of $78,513,621 and$74,376,524, respectively. The tax basis of distributable earnings at December 31, 2016 was $2,399,504of undistributed ordinary income and $561,150 of undistributed long-term capital gain.
3. INVESTMENT TRANSACTIONS
The Fund’s investment decisions are made by the portfolio management team with recommendationsfrom the research staff. Purchases and sales of portfolio investments, other than short-term investments,during the year ended December 31, 2016 were $462,873,857 and $534,093,696, respectively.
4. DERIVATIVES
During the year ended December 31, 2016, the Fund invested in derivative instruments. The Fund mayuse derivatives for a variety of purposes, including, but not limited to, the ability to obtain leverage, to gain
12

N O T E S T O F I N A N C I A L S T A T E M E N T S ( C O N T I N U E D )
or limit exposure to particular market sectors or securities, to provide additional income, and/or to limitequity price risk in the normal course of pursuing its investment objectives. The financial derivativeinstruments outstanding as of year-end and the amounts of realized and changes in unrealized gains andlosses on financial derivative instruments during the year indicate the volume of financial derivativeactivity for the period.
Total Return Swap Agreements — The Fund may use total return swap agreements to manageexposure to certain risks and/or to enhance performance. Total return swap agreements are bilateralcontracts between the Fund and a counterparty in which the Fund, in the case of a long contract, agreesto receive the positive total return (and pay the negative total return) of an underlying equity security andto pay a financing amount, based on a notional amount and a referenced interest rate, over the term ofthe contract. In the case of a short contract, the Fund agrees to pay the positive total return (and receivethe negative total return) of the underlying equity security and to receive or pay a financing rate, based ona notional amount and a referenced interest rate, over the term of the contract. The fair value of each totalreturn swap agreement is determined daily with the change in the fair value recorded as an unrealizedgain or loss in the Statement of Operations. Upon termination of a swap agreement, the Fund recognizesa realized gain (loss) on total return swap agreements in the Statement of Operations equal to the netreceivable (payable) amount under the terms of the agreement.
Total return swap agreements entail risks associated with counterparty credit, liquidity, and equity price risk.Such risks include that the Fund or the counterparty may default on its obligation, that there is no liquidmarket for these agreements, and that there may be unfavorable changes in the price of the underlyingequity security. To mitigate the Fund’s counterparty credit risk, the Fund enters into master netting andcollateral arrangements with the counterparty. A master netting agreement allows either party to terminatethe contract prior to termination date and to net amounts due across multiple contracts upon settlement,providing for a single net settlement with a counterparty. Pursuant to master netting arrangements, the netcumulative unrealized gain (asset) on open total return swap agreements and net cumulative unrealizedloss (liability) on open total return swap agreements are presented in the Statement of Assets and Liabilities.The Fund’s policy is to net all derivative instruments subject to a netting agreement. The fair value of eachoutstanding total return swap contract is presented on the Schedule of Investments.
A collateral arrangement requires each party to provide collateral with a value, adjusted daily and subjectto a minimum transfer amount, equal to the net amount owed to the other party under the contract. Thecounterparty provides cash collateral to the Fund and the Fund provides collateral by segregating portfoliosecurities, subject to a valuation allowance, into a tri-party account at its custodian. As of December 31,2016, securities, as denoted on the Schedule of Investments, with a value of $1,899,408 were pledged bythe Fund and no cash collateral was held by the Fund.
5. CAPITAL STOCK
The Fund has 10,000,000 authorized and unissued preferred shares, $0.001 par value.
On December 28, 2016, the Fund issued 2,516,928 shares of its Common Stock at a price of $12.71 pershare (the average market price on December 12, 2016) to shareholders of record November 25, 2016,who elected to take stock in payment of the year-end distribution from 2016 capital gain and investmentincome. During 2016, the Fund issued 2,684 shares of Common Stock at a weighted average price of$12.71 per share as dividend equivalents to holders of deferred stock units and restricted stock unitsunder the 2005 Equity Incentive Compensation Plan.
On December 28, 2015, the Fund issued 2,586,293 shares of its Common Stock at a price of $12.47 pershare (the average market price on December 14, 2015) to shareholders of record on November 25,2015, who elected to take stock in payment of the year-end distribution from 2015 capital gain and
13

N O T E S T O F I N A N C I A L S T A T E M E N T S ( C O N T I N U E D )
investment income. During 2015, the Fund issued 2,795 shares of Common Stock at a weighted averageprice of $12.87 per share as dividend equivalents to holders of deferred stock units and restricted stockunits under the 2005 Equity Income Compensation Plan.
The Fund may purchase shares of its Common Stock from time to time, in accordance with parametersset by the Board of Directors, at such prices and amounts as the portfolio management team may deemappropriate. Transactions in Common Stock for 2016 and 2015 were as follows:
Shares Amount
2016 2015 2016 2015
Shares issued in payment of distributions 2,519,612 2,589,088 $ 32,024,245 $ 32,287,094Shares purchased (at a weighted average discount from
net asset value of 15.8% and 13.9%, respectively) (974,904) (977,800) (12,436,299) (13,600,866)Net activity under the 2005 Equity Incentive Compensation
Plan (21,830) 16,002 222,142 474,036
Net change 1,522,878 1,627,290 $ 19,810,088 $ 19,160,264
6. RETIREMENT PLANS
Defined Contribution Plans — The Fund sponsors a qualified defined contribution plan for allemployees with at least six months of service and a nonqualified defined contribution plan for eligibleemployees to supplement the qualified plan. The Fund matches employee contributions made to the planand, subject to Board approval, may also make a discretionary contribution to the plans. During 2016, theFund recorded matching contributions of $291,588. As of December 31, 2016, the Fund recorded aliability in the amount of $225,245, included in Accrued expenses and other liabilities in the accompanyingStatement of Assets and Liabilities, representing the 2016 discretionary contribution.
Defined Benefit Plans — The Fund terminated its qualified and nonqualified defined benefit plans in 2015and has no further defined benefit obligations. In terminating these plans, the Fund incurred settlementcosts in 2015 representing the amount of the pension obligation in excess of the previously-recordedpension liability and any unamortized actuarial losses remaining in accumulated other comprehensiveincome at the time of termination.
A December 31 measurement date was used for its defined benefit plans. Details in aggregate for theplans were as follows:
2016 2015
Change in benefit obligationBenefit obligation at beginning of year $ — $ 9,232,545Interest cost — 134,198Benefits paid (qualified and nonqualified plans) — (11,618,512)Effect of settlement — 2,251,769
Benefit obligation at end of year $ — $ —
Change in qualified plan assetsFair value of qualified plan assets at beginning of year $ — $ 7,044,299Actual return on plan assets — 39,466Contributions — 858,979Qualified plan benefits paid — (7,942,744)
Fair value of qualified plan assets at end of year $ — $ —
Funded status $ — $ —
14
N O T E S T O F I N A N C I A L S T A T E M E N T S ( C O N T I N U E D )
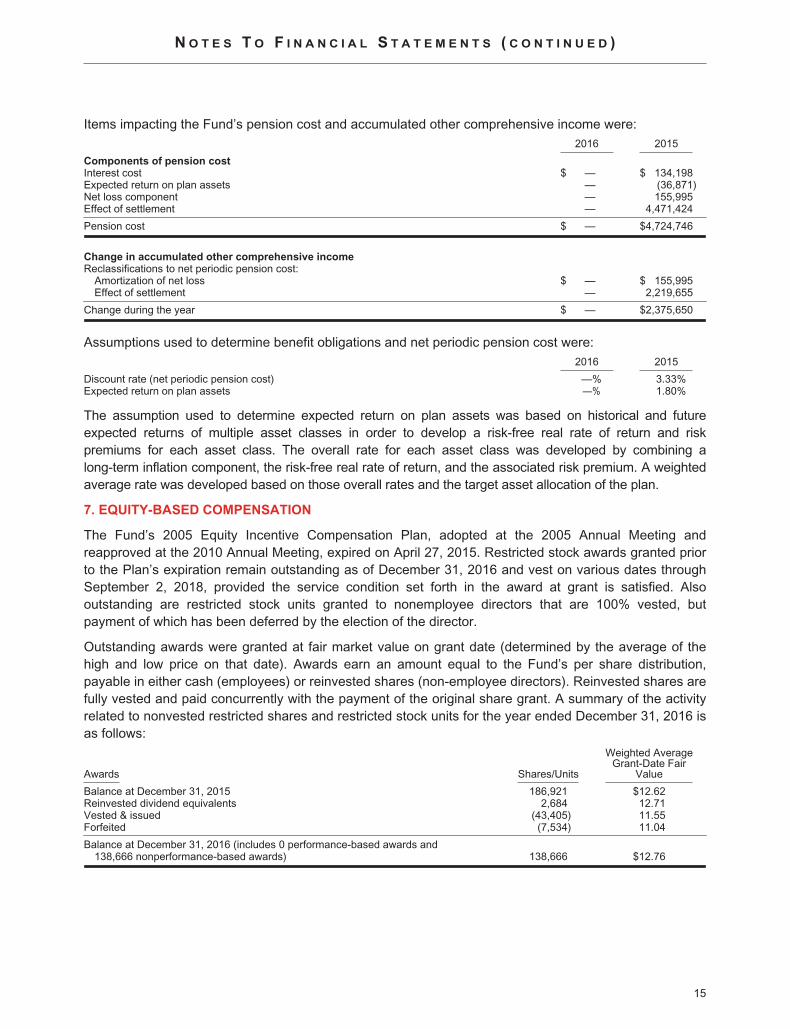
Items impacting the Fund’s pension cost and accumulated other comprehensive income were:2016 2015
Components of pension costInterest cost $ — $ 134,198Expected return on plan assets — (36,871)Net loss component — 155,995Effect of settlement — 4,471,424
Pension cost $ — $4,724,746
Change in accumulated other comprehensive incomeReclassifications to net periodic pension cost:
Amortization of net loss $ — $ 155,995Effect of settlement — 2,219,655
Change during the year $ — $2,375,650
Assumptions used to determine benefit obligations and net periodic pension cost were:2016 2015
Discount rate (net periodic pension cost) —% 3.33%Expected return on plan assets —% 1.80%
The assumption used to determine expected return on plan assets was based on historical and futureexpected returns of multiple asset classes in order to develop a risk-free real rate of return and riskpremiums for each asset class. The overall rate for each asset class was developed by combining along-term inflation component, the risk-free real rate of return, and the associated risk premium. A weightedaverage rate was developed based on those overall rates and the target asset allocation of the plan.
7. EQUITY-BASED COMPENSATION
The Fund’s 2005 Equity Incentive Compensation Plan, adopted at the 2005 Annual Meeting andreapproved at the 2010 Annual Meeting, expired on April 27, 2015. Restricted stock awards granted priorto the Plan’s expiration remain outstanding as of December 31, 2016 and vest on various dates throughSeptember 2, 2018, provided the service condition set forth in the award at grant is satisfied. Alsooutstanding are restricted stock units granted to nonemployee directors that are 100% vested, butpayment of which has been deferred by the election of the director.
Outstanding awards were granted at fair market value on grant date (determined by the average of thehigh and low price on that date). Awards earn an amount equal to the Fund’s per share distribution,payable in either cash (employees) or reinvested shares (non-employee directors). Reinvested shares arefully vested and paid concurrently with the payment of the original share grant. A summary of the activityrelated to nonvested restricted shares and restricted stock units for the year ended December 31, 2016 isas follows:
Awards Shares/Units
Weighted AverageGrant-Date Fair
Value
Balance at December 31, 2015 186,921 $12.62Reinvested dividend equivalents 2,684 12.71Vested & issued (43,405) 11.55Forfeited (7,534) 11.04
Balance at December 31, 2016 (includes 0 performance-based awards and138,666 nonperformance-based awards) 138,666 $12.76
15

N O T E S T O F I N A N C I A L S T A T E M E N T S ( C O N T I N U E D )
Compensation cost is based on the fair market value of the award on grant date and recognized on astraight-line basis over the vesting period. Any compensation cost recognized related to an award that issubsequently forfeited due to unmet service conditions is reversed. Total compensation cost related toequity-based compensation for the year ended December 31, 2016 was $394,528. As of December 31,2016, the Fund had unrecognized compensation cost of $271,785, a component of additional capitalsurplus, related to nonvested awards that will be recognized over a weighted average period of0.90 years. The total fair value of awards vested and issued during the year ended December 31, 2016was $523,685.
8. OFFICER AND DIRECTOR COMPENSATION
The aggregate remuneration paid by the Fund during the year ended December 31, 2016 to officers anddirectors amounted to $4,975,140, of which $442,500 was paid to directors who were not officers. Theseamounts represent the taxable income to the Fund’s officers and directors and, therefore, differ from theamounts reported in the accompanying Statement of Operations that are recorded and expensed inaccordance with generally accepted accounting principles.
9. PORTFOLIO SECURITIES LOANED
The Fund makes loans of securities to approved brokers to earn additional income. It receives ascollateral cash deposits valued at 102% of the value of the securities on loan. The market value of theloaned securities is calculated based upon the most recent closing prices and any additional requiredcollateral is delivered to the Fund on the next business day. Cash deposits are placed in a registeredmoney market fund. The Fund accounts for securities lending transactions as secured financing andretains a portion of the income from lending fees and interest on the investment of cash collateral. TheFund also continues to receive dividends on the securities loaned. Gain or loss in the fair value of thesecurities loaned that may occur during the term of the loan will be for the account of the Fund. AtDecember 31, 2016, the Fund had securities on loan of $26,175,124 and held cash collateral of$26,702,449. The Fund is indemnified by the Custodian, serving as lending agent, for the loss of loanedsecurities and has the right under the lending agreement to recover the securities from the borrower ondemand.
10. OPERATING LEASE COMMITMENTS
The Fund and its affiliates lease office space and equipment under operating lease agreements expiringat various dates through the year 2026. The Fund recognized rental expense of $352,712 in 2016, and itsestimated portion of the minimum rental commitments are as follows:
2017 $ 299,2762018 306,5732019 247,8052020 246,0292021 241,469Thereafter 1,300,136
Total $2,641,288
16

F I N A N C I A L H I G H L I G H T S
Year Ended December 31,
2016 2015 2014 2013 2012
Per Share Operating Performance
Net asset value, beginning of year $15.04 $15.87 $15.09 $12.43 $11.54
Net investment income 0.19 0.13 0.20 0.20 0.19Net realized gain and change in unrealized
appreciation 1.03 — 1.83 3.32 1.41Change in accumulated other
comprehensive income (note 6) — 0.02 (0.01) 0.01 —
Total from operations 1.22 0.15 2.02 3.53 1.60
Less distributions from:Net investment income (0.18) (0.14) (0.20) (0.22) (0.18)Net realized gain (0.81) (0.79) (0.98) (0.62) (0.49)
Total distributions (0.99) (0.93) (1.18) (0.84) (0.67)
Capital share repurchases (note 5) 0.02 0.02 0.02 0.02 —Reinvestment of distributions (0.07) (0.07) (0.08) (0.05) (0.04)
Total capital share transactions (0.05) (0.05) (0.06) (0.03) (0.04)
Net asset value, end of year $15.22 $15.04 $15.87 $15.09 $12.43
Market price, end of year $12.71 $12.83 $13.68 $13.07 $10.59
Total Investment Return*
Based on market price 6.9% 0.7% 13.7% 31.8% 16.9%Based on net asset value 9.2% 1.8% 14.3% 29.7% 14.7%
Ratios/Supplemental Data
Net assets, end of year (in millions) $1,513 $1,472 $1,528 $1,422 $1,156Ratio of expenses to average net assets 0.64% 0.96%† 0.58% 0.69%†† 0.65%††Ratio of net investment income to
average net assets 1.29% 0.79%† 1.29% 1.44%†† 1.54%††Portfolio turnover 32.0% 22.0% 26.6% 55.9% 27.4%Number of shares outstanding at
end of year (in 000’s) 99,437 97,914 96,287 94,224 93,030
* Total investment return assumes reinvestment of all distributions at the price received in the Fund’s dividendreinvestment plan.
† Ratio of expenses to average net assets was 0.67%, excluding the one-time charge of $4,471,424 related to thetermination of the defined benefit plans (note 6), and the ratio of net investment income to average net assetswas 1.08%.
†† Ratios of expenses to average net assets were 0.63% in both 2013 and 2012, excluding non-recurring pension-related settlement charges. The adjusted ratios of net investment income to average net assets were 1.50% and1.56% in 2013 and 2012, respectively.
17

S C H E D U L E O F I N V E S T M E N T S
December 31, 2016
Shares Value (A)
Common Stocks — 97.9%
Consumer Discretionary — 11.4%
Amazon.com, Inc. (B)(C) . . . . . . . . . . . . . . . . . . . . . . . . . . . . . . . . . . . . . . . 44,100 $ 33,069,267Comcast Corp. (Class A) . . . . . . . . . . . . . . . . . . . . . . . . . . . . . . . . . . . . . . . 559,800 38,654,190Consumer Discretionary Select Sector SPDR Fund (B) . . . . . . . . . . . . . . 32,400 2,637,360Dollar General Corp. . . . . . . . . . . . . . . . . . . . . . . . . . . . . . . . . . . . . . . . . . . 149,637 11,083,612Lowe’s Companies, Inc. . . . . . . . . . . . . . . . . . . . . . . . . . . . . . . . . . . . . . . . . 405,000 28,803,600Magna International Inc. . . . . . . . . . . . . . . . . . . . . . . . . . . . . . . . . . . . . . . . 252,000 10,936,800Priceline Group Inc. (C) . . . . . . . . . . . . . . . . . . . . . . . . . . . . . . . . . . . . . . . . 10,300 15,100,418Starbucks Corp. . . . . . . . . . . . . . . . . . . . . . . . . . . . . . . . . . . . . . . . . . . . . . . 251,300 13,952,176Walt Disney Co. (B) . . . . . . . . . . . . . . . . . . . . . . . . . . . . . . . . . . . . . . . . . . . 184,800 19,259,856
173,497,279
Consumer Staples — 8.9%
Coca-Cola Co. . . . . . . . . . . . . . . . . . . . . . . . . . . . . . . . . . . . . . . . . . . . . . . . 465,000 19,278,900CVS Health Corp. . . . . . . . . . . . . . . . . . . . . . . . . . . . . . . . . . . . . . . . . . . . . . 247,400 19,522,334PepsiCo, Inc. (G) . . . . . . . . . . . . . . . . . . . . . . . . . . . . . . . . . . . . . . . . . . . . . 230,400 24,106,752Philip Morris International Inc. . . . . . . . . . . . . . . . . . . . . . . . . . . . . . . . . . . . 323,300 29,578,717Procter & Gamble Co. . . . . . . . . . . . . . . . . . . . . . . . . . . . . . . . . . . . . . . . . . 131,850 11,085,948Spectrum Brands Holdings, Inc. (B) . . . . . . . . . . . . . . . . . . . . . . . . . . . . . . 88,100 10,777,273Walmart Stores, Inc. . . . . . . . . . . . . . . . . . . . . . . . . . . . . . . . . . . . . . . . . . . 292,400 20,210,688
134,560,612
Energy — 8.3%
Adams Natural Resources Fund, Inc. (D) . . . . . . . . . . . . . . . . . . . . . . . . . . 2,186,774 44,107,232Anadarko Petroleum Corp. . . . . . . . . . . . . . . . . . . . . . . . . . . . . . . . . . . . . . 190,600 13,290,538Concho Resources Inc. (C) . . . . . . . . . . . . . . . . . . . . . . . . . . . . . . . . . . . . . 72,900 9,666,540Exxon Mobil Corp. (G) . . . . . . . . . . . . . . . . . . . . . . . . . . . . . . . . . . . . . . . . . 358,300 32,340,158Halliburton Co. . . . . . . . . . . . . . . . . . . . . . . . . . . . . . . . . . . . . . . . . . . . . . . . 354,400 19,169,496Marathon Petroleum Corp. . . . . . . . . . . . . . . . . . . . . . . . . . . . . . . . . . . . . . 125,200 6,303,820
124,877,784
Financials — 15.8%
American Express Co. . . . . . . . . . . . . . . . . . . . . . . . . . . . . . . . . . . . . . . . . . 157,700 11,682,416American International Group, Inc. . . . . . . . . . . . . . . . . . . . . . . . . . . . . . . . 283,000 18,482,730Bank of America Corp. . . . . . . . . . . . . . . . . . . . . . . . . . . . . . . . . . . . . . . . . . 1,140,500 25,205,050BlackRock, Inc. . . . . . . . . . . . . . . . . . . . . . . . . . . . . . . . . . . . . . . . . . . . . . . . 58,200 22,147,428Chubb Ltd. (B) . . . . . . . . . . . . . . . . . . . . . . . . . . . . . . . . . . . . . . . . . . . . . . . 159,500 21,073,140Goldman Sachs Group, Inc. (B) . . . . . . . . . . . . . . . . . . . . . . . . . . . . . . . . . 104,400 24,998,580Intercontinental Exchange, Inc. . . . . . . . . . . . . . . . . . . . . . . . . . . . . . . . . . . 379,900 21,433,958JPMorgan Chase & Co. (B) . . . . . . . . . . . . . . . . . . . . . . . . . . . . . . . . . . . . . 241,200 20,813,148Prudential Financial, Inc. . . . . . . . . . . . . . . . . . . . . . . . . . . . . . . . . . . . . . . . 189,100 19,677,746Raymond James Financial, Inc. . . . . . . . . . . . . . . . . . . . . . . . . . . . . . . . . . 103,200 7,148,664SPDR S&P Regional Banking ETF (B) . . . . . . . . . . . . . . . . . . . . . . . . . . . . 170,100 9,452,457Wells Fargo & Co. . . . . . . . . . . . . . . . . . . . . . . . . . . . . . . . . . . . . . . . . . . . . 671,000 36,978,810
239,094,127
18

S C H E D U L E O F I N V E S T M E N T S ( C O N T I N U E D )
December 31, 2016
Shares Value (A)
Health Care — 13.0%
AbbVie, Inc. . . . . . . . . . . . . . . . . . . . . . . . . . . . . . . . . . . . . . . . . . . . . . . . . . . . 380,000 $ 23,795,600Aetna Inc. . . . . . . . . . . . . . . . . . . . . . . . . . . . . . . . . . . . . . . . . . . . . . . . . . . . . . 183,900 22,805,439Allergan plc . . . . . . . . . . . . . . . . . . . . . . . . . . . . . . . . . . . . . . . . . . . . . . . . . . . 107,096 22,491,231Amgen Inc. . . . . . . . . . . . . . . . . . . . . . . . . . . . . . . . . . . . . . . . . . . . . . . . . . . . . 104,500 15,278,945Biogen Inc. (C) . . . . . . . . . . . . . . . . . . . . . . . . . . . . . . . . . . . . . . . . . . . . . . . . . 47,000 13,328,260Edwards Lifesciences Corp. (C) . . . . . . . . . . . . . . . . . . . . . . . . . . . . . . . . . . . 149,500 14,008,150Gilead Sciences, Inc. . . . . . . . . . . . . . . . . . . . . . . . . . . . . . . . . . . . . . . . . . . . 55,500 3,974,355Health Care Select Sector SPDR Fund (B) . . . . . . . . . . . . . . . . . . . . . . . . . . 27,300 1,882,062Johnson & Johnson . . . . . . . . . . . . . . . . . . . . . . . . . . . . . . . . . . . . . . . . . . . . . 64,000 7,373,440Merck & Co., Inc. . . . . . . . . . . . . . . . . . . . . . . . . . . . . . . . . . . . . . . . . . . . . . . . 351,500 20,692,805Pfizer Inc. (B) . . . . . . . . . . . . . . . . . . . . . . . . . . . . . . . . . . . . . . . . . . . . . . . . . . 702,940 22,831,491Thermo Fisher Scientific Inc. . . . . . . . . . . . . . . . . . . . . . . . . . . . . . . . . . . . . . 145,400 20,515,940Waters Corp. (C) . . . . . . . . . . . . . . . . . . . . . . . . . . . . . . . . . . . . . . . . . . . . . . . 62,200 8,359,058
197,336,776
Industrials — 10.0%
Boeing Co. . . . . . . . . . . . . . . . . . . . . . . . . . . . . . . . . . . . . . . . . . . . . . . . . . . . . 205,000 31,914,400Delta Air Lines, Inc. . . . . . . . . . . . . . . . . . . . . . . . . . . . . . . . . . . . . . . . . . . . . . 282,200 13,881,418Dover Corp. (B) . . . . . . . . . . . . . . . . . . . . . . . . . . . . . . . . . . . . . . . . . . . . . . . . 154,200 11,554,206FedEx Corp. . . . . . . . . . . . . . . . . . . . . . . . . . . . . . . . . . . . . . . . . . . . . . . . . . . . 80,000 14,896,000General Electric Co. . . . . . . . . . . . . . . . . . . . . . . . . . . . . . . . . . . . . . . . . . . . . 246,500 7,789,400Honeywell International Inc. . . . . . . . . . . . . . . . . . . . . . . . . . . . . . . . . . . . . . . 209,400 24,258,990Industrial Select Sector SPDR Fund . . . . . . . . . . . . . . . . . . . . . . . . . . . . . . . 125,800 7,827,276Robert Half International Inc. . . . . . . . . . . . . . . . . . . . . . . . . . . . . . . . . . . . . . 202,500 9,877,950Union Pacific Corp. . . . . . . . . . . . . . . . . . . . . . . . . . . . . . . . . . . . . . . . . . . . . . 278,000 28,823,040
150,822,680
Information Technology — 21.3%
Adobe Systems Inc. (C) . . . . . . . . . . . . . . . . . . . . . . . . . . . . . . . . . . . . . . . . . 176,000 18,119,200Alphabet Inc. (Class A) (B)(C) . . . . . . . . . . . . . . . . . . . . . . . . . . . . . . . . . . . . 35,500 28,131,975Alphabet Inc. (Class C) (C) . . . . . . . . . . . . . . . . . . . . . . . . . . . . . . . . . . . . . . . 35,597 27,474,477Apple Inc. (B)(G) . . . . . . . . . . . . . . . . . . . . . . . . . . . . . . . . . . . . . . . . . . . . . . . 480,500 55,651,510Broadcom Ltd. (B) . . . . . . . . . . . . . . . . . . . . . . . . . . . . . . . . . . . . . . . . . . . . . . 88,800 15,697,176Cisco Systems, Inc. . . . . . . . . . . . . . . . . . . . . . . . . . . . . . . . . . . . . . . . . . . . . . 446,000 13,478,120Facebook, Inc. (Class A) (C) . . . . . . . . . . . . . . . . . . . . . . . . . . . . . . . . . . . . . 303,300 34,894,665Hewlett Packard Enterprise Co. . . . . . . . . . . . . . . . . . . . . . . . . . . . . . . . . . . . 269,400 6,233,916Lam Research Corp. . . . . . . . . . . . . . . . . . . . . . . . . . . . . . . . . . . . . . . . . . . . . 127,600 13,491,148Mastercard, Inc. (Class A) . . . . . . . . . . . . . . . . . . . . . . . . . . . . . . . . . . . . . . . 230,000 23,747,500Microsoft Corp. . . . . . . . . . . . . . . . . . . . . . . . . . . . . . . . . . . . . . . . . . . . . . . . . 836,800 51,998,752Oracle Corp. . . . . . . . . . . . . . . . . . . . . . . . . . . . . . . . . . . . . . . . . . . . . . . . . . . 221,000 8,497,450Visa Inc. (Class A) . . . . . . . . . . . . . . . . . . . . . . . . . . . . . . . . . . . . . . . . . . . . . . 322,000 25,122,440
322,538,329
Materials — 2.1%
Dow Chemical Co. . . . . . . . . . . . . . . . . . . . . . . . . . . . . . . . . . . . . . . . . . . . . . . 136,300 7,799,086LyondellBasell Industries N.V. (Class A) . . . . . . . . . . . . . . . . . . . . . . . . . . . . 186,000 15,955,080PPG Industries, Inc. . . . . . . . . . . . . . . . . . . . . . . . . . . . . . . . . . . . . . . . . . . . . 85,000 8,054,600
31,808,766
19

S C H E D U L E O F I N V E S T M E N T S ( C O N T I N U E D )
December 31, 2016
Shares Value (A)
Real Estate — 2.3%
American Tower Corp. . . . . . . . . . . . . . . . . . . . . . . . . . . . . . . . . . . . . . . 105,000 $ 11,096,400AvalonBay Communities, Inc. . . . . . . . . . . . . . . . . . . . . . . . . . . . . . . . . 53,800 9,530,670Simon Property Group, Inc. . . . . . . . . . . . . . . . . . . . . . . . . . . . . . . . . . . 77,000 13,680,590
34,307,660
Telecommunication Services — 1.9%
SBA Communications Corp. (Class A) (C) . . . . . . . . . . . . . . . . . . . . . . 77,600 8,012,976Verizon Communications Inc. . . . . . . . . . . . . . . . . . . . . . . . . . . . . . . . . 389,000 20,764,820
28,777,796
Utilities — 2.9%
CenterPoint Energy, Inc. . . . . . . . . . . . . . . . . . . . . . . . . . . . . . . . . . . . . 401,000 9,880,640Edison International (B) . . . . . . . . . . . . . . . . . . . . . . . . . . . . . . . . . . . . . 130,300 9,380,297NextEra Energy, Inc. . . . . . . . . . . . . . . . . . . . . . . . . . . . . . . . . . . . . . . . . 111,800 13,355,628Pinnacle West Capital Corp. . . . . . . . . . . . . . . . . . . . . . . . . . . . . . . . . . 140,500 10,963,215
43,579,780Total Common Stocks
(Cost $1,064,673,294) . . . . . . . . . . . . . . . . . . . . . . . . . . . . . . . . . . . . . . . . 1,481,201,589
Other Investments — 0.0%
Financial — 0.0%
Adams Funds Advisers, LLC (C)(E)(Cost $150,000) . . . . . . . . . . . . . . . . . . . . . . . . . . . . . . . . . . . . . . . . . 233,000
Short-Term Investments — 2.3%
Money Market Funds — 2.3%
Fidelity Institutional Money Market — Money Market Portfolio(Institutional Class), 0.83% (F) . . . . . . . . . . . . . . . . . . . . . . . . . . . . . 20,000,000 20,000,000
Northern Institutional Treasury Portfolio, 0.41% (F) . . . . . . . . . . . . . . . 14,509,811 14,509,811
Total Short-Term Investments
(Cost $34,509,811) . . . . . . . . . . . . . . . . . . . . . . . . . . . . . . . . . . . . . . . . . . . 34,509,811
Securities Lending Collateral — 1.7%
(Cost $26,702,449)Money Market Funds — 1.7%
Northern Institutional Funds Liquid Assets Portfolio, 0.55% (F) . . . . . 26,702,449 26,702,449
Total Investments — 101.9% of Net Assets
(Cost $1,126,035,554) . . . . . . . . . . . . . . . . . . . . . . . . . . . . . . . . . . . . . . . . $1,542,646,849
20

S C H E D U L E O F I N V E S T M E N T S ( C O N T I N U E D )
December 31, 2016
Total Return Swap Agreements — (0.1)%
Type of
Contract Counterparty
Termination
Date
Notional
Amount
Unrealized
Appreciation
(Assets)
Unrealized
Depreciation
(Liabilities)
Receive positive total return (pay negative totalreturn) on 200,200 shares of Salesforce.comInc. common stock and pay financingamount based on notional amount and dailyU.S. Federal Funds rate plus 0.55%. Long
MorganStanley 10/13/2017 15,020,742 $ — $(1,361,516)
Gross unrealized loss on open total returnswap agreements $ — $(1,361,516)
Net unrealized loss on open total return swapagreements(H) $(1,361,516)
Notes:(A) Common stocks are listed on the New York Stock Exchange or the NASDAQ and are valued at the last reported
sale price on the day of valuation. See note 1 to financial statements.(B) All or a portion of shares are on loan. See note 9 to financial statements.(C) Presently non-dividend paying.(D) Non-controlled affiliate, a closed-end sector fund, registered as an investment company under the Investment
Company Act of 1940.(E) Controlled affiliate valued using fair value procedures.(F) Rate presented is as of period-end and represents the annualized yield earned over the previous seven days.(G) A portion of the position is pledged as collateral for open swap agreements. The aggregate market value of
pledged securities is $1,899,408.(H) Value is disclosed on the Statement of Assets and Liabilities under the caption Net unrealized loss on open total
return swap agreements.
21
R E P O R T O F I N D E P E N D E N T R E G I S T E R E D P U B L I C A C C O U N T I N G F I R M
To the Board of Directors and Shareholders of Adams Diversified Equity Fund, Inc.:
In our opinion, the accompanying statement of assets and liabilities, including the schedule ofinvestments in securities, and the related statements of operations and of changes in net assets and thefinancial highlights present fairly, in all material respects, the financial position of Adams Diversified EquityFund, Inc. (the “Fund”) at December 31, 2016, the results of its operations for the year then ended, thechanges in its net assets for each of the two years in the period then ended and the financial highlights foreach of the five years in the period then ended, in conformity with accounting principles generallyaccepted in the United States of America. These financial statements and financial highlights (hereafterreferred to as “financial statements”) are the responsibility of the Fund’s management. Our responsibilityis to express an opinion on these financial statements based on our audits. We conducted our audits ofthese financial statements in accordance with the standards of the Public Company Accounting OversightBoard (United States). Those standards require that we plan and perform the audit to obtain reasonableassurance about whether the financial statements are free of material misstatement. An audit includesexamining, on a test basis, evidence supporting the amounts and disclosures in the financial statements,assessing the accounting principles used and significant estimates made by management, and evaluatingthe overall financial statement presentation. We believe that our audits, which included confirmation ofsecurities at December 31, 2016 by correspondence with the custodians and brokers, provide areasonable basis for our opinion.
PricewaterhouseCoopers LLP
Baltimore, MDFebruary 10, 2017
22
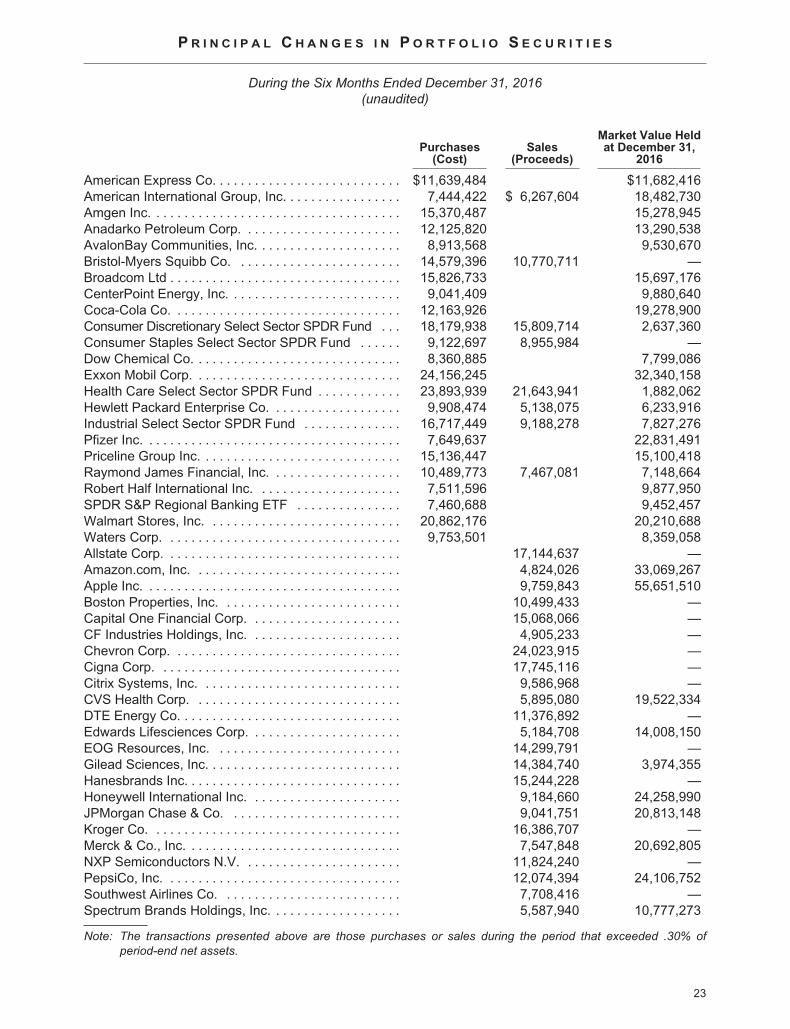
P R I N C I P A L C H A N G E S I N P O R T F O L I O S E C U R I T I E S
During the Six Months Ended December 31, 2016(unaudited)
Purchases(Cost)
Sales(Proceeds)
Market Value Heldat December 31,
2016
American Express Co. . . . . . . . . . . . . . . . . . . . . . . . . . . $11,639,484 $11,682,416American International Group, Inc. . . . . . . . . . . . . . . . . 7,444,422 $ 6,267,604 18,482,730Amgen Inc. . . . . . . . . . . . . . . . . . . . . . . . . . . . . . . . . . . . 15,370,487 15,278,945Anadarko Petroleum Corp. . . . . . . . . . . . . . . . . . . . . . . 12,125,820 13,290,538AvalonBay Communities, Inc. . . . . . . . . . . . . . . . . . . . . 8,913,568 9,530,670Bristol-Myers Squibb Co. . . . . . . . . . . . . . . . . . . . . . . . 14,579,396 10,770,711 —Broadcom Ltd . . . . . . . . . . . . . . . . . . . . . . . . . . . . . . . . . 15,826,733 15,697,176CenterPoint Energy, Inc. . . . . . . . . . . . . . . . . . . . . . . . . 9,041,409 9,880,640Coca-Cola Co. . . . . . . . . . . . . . . . . . . . . . . . . . . . . . . . . 12,163,926 19,278,900Consumer Discretionary Select Sector SPDR Fund . . . 18,179,938 15,809,714 2,637,360Consumer Staples Select Sector SPDR Fund . . . . . . 9,122,697 8,955,984 —Dow Chemical Co. . . . . . . . . . . . . . . . . . . . . . . . . . . . . . 8,360,885 7,799,086Exxon Mobil Corp. . . . . . . . . . . . . . . . . . . . . . . . . . . . . . 24,156,245 32,340,158Health Care Select Sector SPDR Fund . . . . . . . . . . . . 23,893,939 21,643,941 1,882,062Hewlett Packard Enterprise Co. . . . . . . . . . . . . . . . . . . 9,908,474 5,138,075 6,233,916Industrial Select Sector SPDR Fund . . . . . . . . . . . . . . 16,717,449 9,188,278 7,827,276Pfizer Inc. . . . . . . . . . . . . . . . . . . . . . . . . . . . . . . . . . . . . 7,649,637 22,831,491Priceline Group Inc. . . . . . . . . . . . . . . . . . . . . . . . . . . . . 15,136,447 15,100,418Raymond James Financial, Inc. . . . . . . . . . . . . . . . . . . 10,489,773 7,467,081 7,148,664Robert Half International Inc. . . . . . . . . . . . . . . . . . . . . 7,511,596 9,877,950SPDR S&P Regional Banking ETF . . . . . . . . . . . . . . . 7,460,688 9,452,457Walmart Stores, Inc. . . . . . . . . . . . . . . . . . . . . . . . . . . . 20,862,176 20,210,688Waters Corp. . . . . . . . . . . . . . . . . . . . . . . . . . . . . . . . . . 9,753,501 8,359,058Allstate Corp. . . . . . . . . . . . . . . . . . . . . . . . . . . . . . . . . . 17,144,637 —Amazon.com, Inc. . . . . . . . . . . . . . . . . . . . . . . . . . . . . . 4,824,026 33,069,267Apple Inc. . . . . . . . . . . . . . . . . . . . . . . . . . . . . . . . . . . . . 9,759,843 55,651,510Boston Properties, Inc. . . . . . . . . . . . . . . . . . . . . . . . . . 10,499,433 —Capital One Financial Corp. . . . . . . . . . . . . . . . . . . . . . 15,068,066 —CF Industries Holdings, Inc. . . . . . . . . . . . . . . . . . . . . . 4,905,233 —Chevron Corp. . . . . . . . . . . . . . . . . . . . . . . . . . . . . . . . . 24,023,915 —Cigna Corp. . . . . . . . . . . . . . . . . . . . . . . . . . . . . . . . . . . 17,745,116 —Citrix Systems, Inc. . . . . . . . . . . . . . . . . . . . . . . . . . . . . 9,586,968 —CVS Health Corp. . . . . . . . . . . . . . . . . . . . . . . . . . . . . . 5,895,080 19,522,334DTE Energy Co. . . . . . . . . . . . . . . . . . . . . . . . . . . . . . . . 11,376,892 —Edwards Lifesciences Corp. . . . . . . . . . . . . . . . . . . . . . 5,184,708 14,008,150EOG Resources, Inc. . . . . . . . . . . . . . . . . . . . . . . . . . . 14,299,791 —Gilead Sciences, Inc. . . . . . . . . . . . . . . . . . . . . . . . . . . . 14,384,740 3,974,355Hanesbrands Inc. . . . . . . . . . . . . . . . . . . . . . . . . . . . . . . 15,244,228 —Honeywell International Inc. . . . . . . . . . . . . . . . . . . . . . 9,184,660 24,258,990JPMorgan Chase & Co. . . . . . . . . . . . . . . . . . . . . . . . . 9,041,751 20,813,148Kroger Co. . . . . . . . . . . . . . . . . . . . . . . . . . . . . . . . . . . . 16,386,707 —Merck & Co., Inc. . . . . . . . . . . . . . . . . . . . . . . . . . . . . . . 7,547,848 20,692,805NXP Semiconductors N.V. . . . . . . . . . . . . . . . . . . . . . . 11,824,240 —PepsiCo, Inc. . . . . . . . . . . . . . . . . . . . . . . . . . . . . . . . . . 12,074,394 24,106,752Southwest Airlines Co. . . . . . . . . . . . . . . . . . . . . . . . . . 7,708,416 —Spectrum Brands Holdings, Inc. . . . . . . . . . . . . . . . . . . 5,587,940 10,777,273
Note: The transactions presented above are those purchases or sales during the period that exceeded .30% ofperiod-end net assets.
23
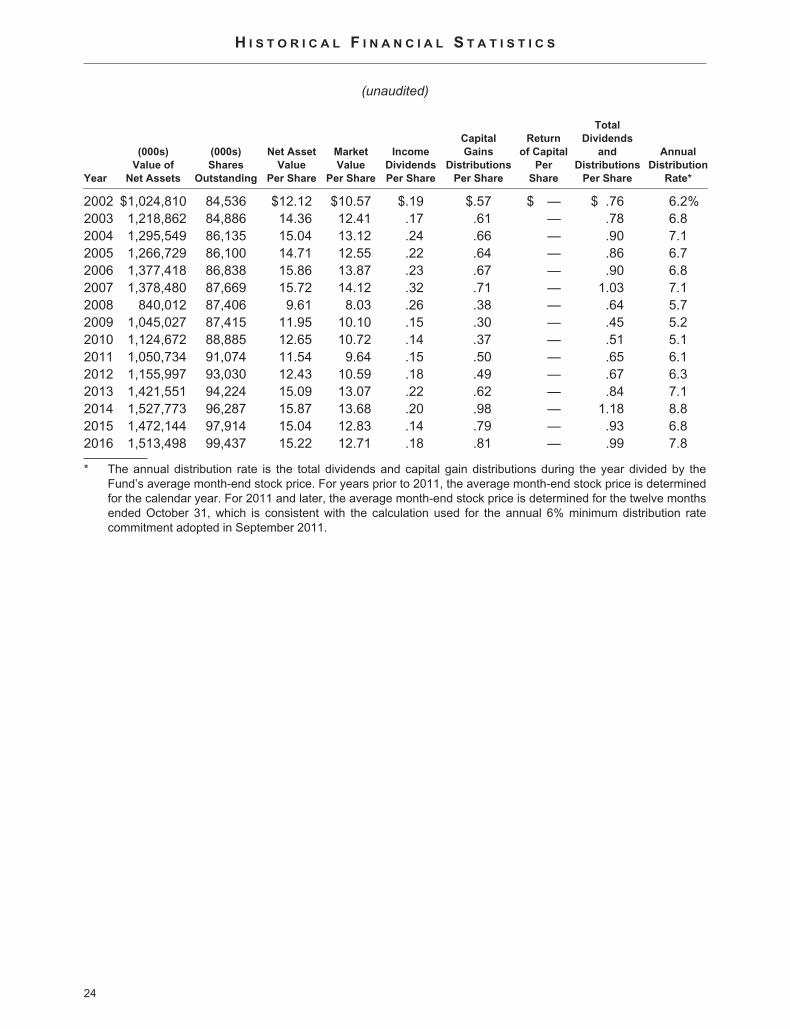
H I S T O R I C A L F I N A N C I A L S T A T I S T I C S
(unaudited)
Year
(000s)
Value of
Net Assets
(000s)
Shares
Outstanding
Net Asset
Value
Per Share
Market
Value
Per Share
Income
Dividends
Per Share
Capital
Gains
Distributions
Per Share
Return
of Capital
Per
Share
Total
Dividends
and
Distributions
Per Share
Annual
Distribution
Rate*
2002 $1,024,810 84,536 $12.12 $10.57 $.19 $.57 $ — $ .76 6.2%2003 1,218,862 84,886 14.36 12.41 .17 .61 — .78 6.82004 1,295,549 86,135 15.04 13.12 .24 .66 — .90 7.12005 1,266,729 86,100 14.71 12.55 .22 .64 — .86 6.72006 1,377,418 86,838 15.86 13.87 .23 .67 — .90 6.82007 1,378,480 87,669 15.72 14.12 .32 .71 — 1.03 7.12008 840,012 87,406 9.61 8.03 .26 .38 — .64 5.72009 1,045,027 87,415 11.95 10.10 .15 .30 — .45 5.22010 1,124,672 88,885 12.65 10.72 .14 .37 — .51 5.12011 1,050,734 91,074 11.54 9.64 .15 .50 — .65 6.12012 1,155,997 93,030 12.43 10.59 .18 .49 — .67 6.32013 1,421,551 94,224 15.09 13.07 .22 .62 — .84 7.12014 1,527,773 96,287 15.87 13.68 .20 .98 — 1.18 8.82015 1,472,144 97,914 15.04 12.83 .14 .79 — .93 6.82016 1,513,498 99,437 15.22 12.71 .18 .81 — .99 7.8
* The annual distribution rate is the total dividends and capital gain distributions during the year divided by theFund’s average month-end stock price. For years prior to 2011, the average month-end stock price is determinedfor the calendar year. For 2011 and later, the average month-end stock price is determined for the twelve monthsended October 31, which is consistent with the calculation used for the annual 6% minimum distribution ratecommitment adopted in September 2011.
24
O T H E R I N F O R M A T I O N
Annual Certification
The Fund’s CEO has submitted to the New York Stock Exchange the annual CEO certification asrequired by Section 303A.12(a) of the NYSE Listed Company Manual.
Dividend Payment Schedule
The Fund presently pays dividends four times a year, as follows: (a) three interim distributions on or aboutMarch 1, June 1, and September 1, and (b) a “year-end” distribution, payable in late December,consisting of the estimated balance of the net investment income for the year, the net realized capitalgains earned through October 31 and, if applicable, a return of capital. Shareholders may elect to receivethe year-end distribution in stock or cash. In connection with this distribution, all shareholders of recordare sent a dividend announcement notice and an election card in mid-November. Shareholders holding
shares in “street” or brokerage accounts may make their election by notifying their brokerage
house representative.
Electronic Delivery of Shareholder Reports
The Fund offers shareholders the benefits and convenience of viewing Quarterly and Annual Reports andother shareholder materials on-line. With your consent, paper copies of these documents will cease withthe next mailing and will be provided via e-mail. Reduce paper mailed to your home and help lower theFund’s printing and mailing costs. To enroll, please visit the following websites:
Registered shareholders with AST: www.amstock.com/mainShareholders using brokerage accounts: http://enroll.icsdelivery.com/ADX
Privacy Policy
In order to conduct its business, the Fund, through its transfer agent, American Stock Transfer & TrustCompany, collects and maintains certain nonpublic personal information about our shareholders of recordwith respect to their transactions in shares of our securities. This information includes the shareholder’saddress, tax identification or Social Security number, share balances, and dividend elections. We do notcollect or maintain personal information about shareholders whose shares of our securities are held in“street name” by a financial institution such as a bank or broker.
We do not disclose any nonpublic personal information about you, our other shareholders or our formershareholders to third parties unless necessary to process a transaction, service an account or asotherwise permitted by law.
To protect your personal information internally, we restrict access to nonpublic personal information aboutour shareholders to those employees who need to know that information to provide services to ourshareholders. We also maintain certain other safeguards to protect your nonpublic personal information.
Proxy Voting Policies and Record
A description of the policies and procedures that the Fund uses to determine how to vote proxies relatingto portfolio securities owned by the Fund and the Fund’s proxy voting record for the 12-month periodended June 30, 2016 are available (i) without charge, upon request, by calling the Fund’s toll free numberat (800) 638-2479; (ii) on the Fund’s website: www.adamsfunds.com under the headings “Funds” andthen “Reports & Literature”; and (iii) on the Securities and Exchange Commission’swebsite: www.sec.gov.
25

O T H E R I N F O R M A T I O N ( C O N T I N U E D )
Statement on Quarterly Filing of Complete Portfolio Schedule
In addition to publishing its complete schedule of portfolio holdings in the First and Third Quarter Reportsto shareholders, the Fund also files its complete schedule of portfolio holdings with the Securities andExchange Commission for the first and third quarters of each fiscal year on Form N-Q. The Fund’s FormsN-Q are available on the Commission’s website: www.sec.gov. The Fund’s Forms N-Q may be reviewedand copied at the Commission’s Public Reference Room, and information on the operation of the PublicReference Room may be obtained by calling 1-800-SEC-0330. The Fund also posts a link to its FormsN-Q on its website: www.adamsfunds.com under the headings “Funds” and then “Reports & Literature”.
INVESTORS CHOICE
INVESTORS CHOICE is a direct stock purchase and sale plan, as well as a dividend reinvestment plan,sponsored and administered by our transfer agent, American Stock Transfer & Trust Company (AST).The Plan provides registered shareholders and interested first time investors an affordable alternative forbuying, selling, and reinvesting in Fund shares. A brochure which further details the benefits and featuresof INVESTORS CHOICE as well as an enrollment form may be obtained by contacting AST.
The costs to participants in administrative service fees and brokerage commissions for each type oftransaction are listed below. Fees are subject to change at any time.
FeesInitial Enrollment and Optional Cash
Investments:Service Fee $2.50 per investmentBrokerage Commission $0.05 per share
Reinvestment of Dividends*:Service Fee 2% of amount invested(maximum of $2.50 per investment)Brokerage Commission $0.05 per share
Sale of Shares:Service Fee $10.00Brokerage Commission $0.05 per share
Deposit of Certificates for safekeeping $7.50(waived if sold)
Book to Book Transfers IncludedTo transfer shares to another participant or to anew participant
* The year-end dividend and capital gain distribution willusually be made in newly issued shares of Common Stock.There are no fees or commissions in connection with thisdividend and capital gain distribution when made in newlyissued shares.
Minimum and Maximum Cash Investments:Initial minimum investment (non-holders) $500
Minimum optional investment (existing holders)$50
Electronic Funds Transfer (monthly minimum)$50
Maximum per transaction $25,000
Maximum per year NONE
INVESTORS CHOICE Mailing Address:Attention: Dividend ReinvestmentP.O. Box 922Wall Street StationNew York, NY 10269-0560Website: www.amstock.comE-mail: [email protected]
For shareholders whose stock is held by a broker in “street” name, the AST INVESTORS CHOICE DirectStock Purchase and Sale Plan remains available through many registered investment security dealers. Ifyour shares are currently held in a “street” name or brokerage account, please contact your broker fordetails about how you can participate in AST’s Plan or contact AST.
26
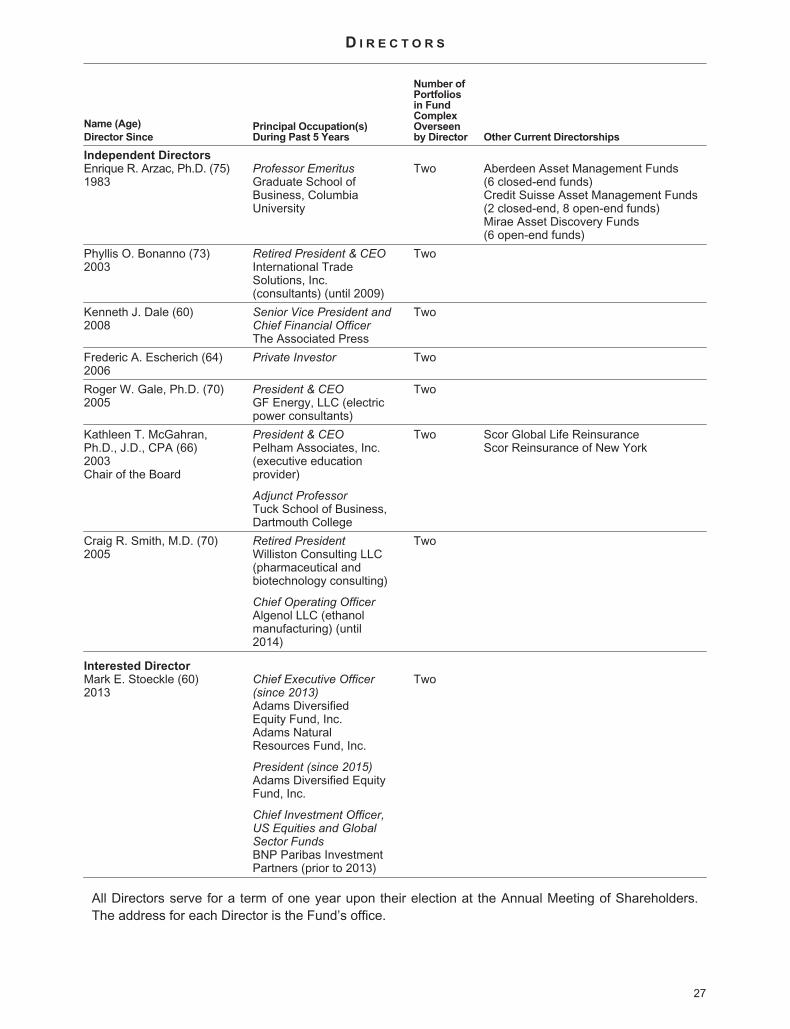
D I R E C T O R S
Name (Age)
Director SincePrincipal Occupation(s)During Past 5 Years
Number ofPortfoliosin FundComplexOverseenby Director Other Current Directorships
Independent DirectorsEnrique R. Arzac, Ph.D. (75)1983
Professor EmeritusGraduate School ofBusiness, ColumbiaUniversity
Two Aberdeen Asset Management Funds(6 closed-end funds)Credit Suisse Asset Management Funds(2 closed-end, 8 open-end funds)Mirae Asset Discovery Funds(6 open-end funds)
Phyllis O. Bonanno (73)2003
Retired President & CEOInternational TradeSolutions, Inc.(consultants) (until 2009)
Two
Kenneth J. Dale (60)2008
Senior Vice President andChief Financial OfficerThe Associated Press
Two
Frederic A. Escherich (64)2006
Private Investor Two
Roger W. Gale, Ph.D. (70)2005
President & CEOGF Energy, LLC (electricpower consultants)
Two
Kathleen T. McGahran,Ph.D., J.D., CPA (66)2003Chair of the Board
President & CEOPelham Associates, Inc.(executive educationprovider)
Adjunct ProfessorTuck School of Business,Dartmouth College
Two Scor Global Life ReinsuranceScor Reinsurance of New York
Craig R. Smith, M.D. (70)2005
Retired PresidentWilliston Consulting LLC(pharmaceutical andbiotechnology consulting)
Chief Operating OfficerAlgenol LLC (ethanolmanufacturing) (until2014)
Two
Interested DirectorMark E. Stoeckle (60)2013
Chief Executive Officer(since 2013)Adams DiversifiedEquity Fund, Inc.Adams NaturalResources Fund, Inc.
President (since 2015)Adams Diversified EquityFund, Inc.
Chief Investment Officer,US Equities and GlobalSector FundsBNP Paribas InvestmentPartners (prior to 2013)
Two
All Directors serve for a term of one year upon their election at the Annual Meeting of Shareholders.The address for each Director is the Fund’s office.
27

O F F I C E R S
Name (Age)
Employee Since Principal Occupation(s) During Past 5 Years
Mark E. Stoeckle (60)2013
Chief Executive Officer of the Fund and Adams Natural Resources Fund, Inc. since2013 and President of the Fund since 2015; Chief Investment Officer, U.S. Equitiesand Global Sector Funds, BNP Paribas Investment Partners (prior to 2013)
James P. Haynie, CFA (54)2013
Executive Vice President of the Fund and President of Adams Natural ResourcesFund, Inc. since 2015; President of the Fund and Executive Vice President ofAdams Natural Resources Fund, Inc. (2013-2015); Chief Investment Officer, USEquities and Global Sector Funds, BNP Paribas Investment Partners (2013); SeniorPortfolio Manager, BNP Paribas Investment Partners (prior to 2013)
D. Cotton Swindell, CFA (53)2002
Executive Vice President since 2015; Vice President-Research (prior to 2015)
Nancy J. F. Prue, CFA (62)1982
Executive Vice President, Director of Shareholder Communications of the Fund andAdams Natural Resources Fund, Inc. since 2015; Executive Vice President of theFund (prior to 2015); President of Adams Natural Resources Fund, Inc. (2012-2015); Executive Vice President of Adams Natural Resources Fund, Inc. (prior to2012)
Brian S. Hook, CFA, CPA (47)2008
Vice President, Chief Financial Officer and Treasurer of the Fund and AdamsNatural Resources Fund, Inc. since 2013; Chief Financial Officer and Treasurer ofthe Fund and Adams Natural Resources Fund, Inc. (2012-2013); Treasurer of theFund and Adams Natural Resources Fund, Inc. (prior to 2012)
Lawrence L. Hooper, Jr. (64)1997
Vice President, General Counsel, Secretary and Chief Compliance Officer of theFund and Adams Natural Resources Fund, Inc.
Steven R. Crain, CFA (45)2012
Vice President-Research since 2014; Senior Research Analyst (2012-2014); EquityAnalyst and Portfolio Manager, MTB Investment Advisors (prior to 2012)
Michael E. Rega, CFA (57)2014
Vice President-Research of the Fund and Adams Natural Resources Fund, Inc.since 2014; Senior Equity Analyst and Portfolio Manager, BNP Paribas InvestmentPartners (prior to 2014)
David R. Schiminger, CFA (45)2002
Vice President-Research
Christine M. Sloan, CPA (44)1999
Assistant Treasurer of the Fund and Adams Natural Resources Fund, Inc.
All officers serve for a term of one year upon their election by the Board of Directors at the annualorganization meeting. The address for each officer is the Fund’s office.
S E R V I C E P R O V I D E R S
Counsel Chadbourne & Parke LLPIndependent Registered Public Accounting Firm PricewaterhouseCoopers LLP
Custodian of Securities The Northern Trust CompanyTransfer Agent & Registrar American Stock Transfer & Trust Company, LLC
Stockholder Relations Department6201 15th AvenueBrooklyn, NY 11219(877) 260-8188Website: www.amstock.comE-mail: [email protected]
28

ADAMS FUNDS500 East Pratt Street Suite 1300 Baltimore, MD 21202 410.752.5900 800.638.2479
Please visit our website adamsfunds.com
Trusted by investors for generationsSM