Adam Csepeti - uni-corvinus.hu
357
Adam Csepeti ENVIRONMENTAL ADAPTATION PATTERNS IN THE HUNGARIAN PUBLIC RETAIL DRUG SUPPLY TESTING THE APPLICABILITY OF MILES AND SNOW’S STRATEGIC TYPOLOGY IN REGULATED INDUSTRIAL SETTING
Transcript of Adam Csepeti - uni-corvinus.hu

Adam Csepeti
ENVIRONMENTAL ADAPTATION PATTERNS IN THE HUNGARIAN PUBLIC RETAIL DRUG SUPPLY
TESTING THE APPLICABILITY OF MILES AND SNOW’S STRATEGIC TYPOLOGY
IN REGULATED INDUSTRIAL SETTING

2
Doctoral School of Management and Business Administration
Doctoral dissertation
Adam Csepeti:
Environmental Adaptation Patterns in the Hungarian Public Retail Drug Supply – Testing the Applicability of Miles and Snow’s Strategic Typology in Regulated Industrial Setting
to Ph.D. dissertation
Supervisor:
András Bauer, CSc
professor
© Adam Csepeti

3
Budapest, 2015 Department of Marketing
Doctoral dissertation
Adam Csepeti:
Environmental Adaptation Patterns in the Hungarian Public Retail Drug Supply – Testing the Applicability of Miles and Snow’s Strategic Typology in Regulated Industrial Setting
to Ph.D. dissertation
Supervisor:
András Bauer, CSc professor
© Adam Csepeti

4
Acknowledgements I would like to say thank to my supervisor, Dr. András Bauer who contributed greatly to this doctoral dissertation with his excellent advices, insights on scientific literature and constructive sector-specific recommendations. My sincere thanks are due to Dr. Zoltán Hankó, president of the Hungarian Chamber of Pharmacists for his role in providing support to deliver the survey data collection and for acquainting me with the professional, legal and market environments of the Hungarian public drug supply system. I would also like to say thanks to Dr. László Hetényi, Dr. Ferenc Brezanóczy, Dr. Imre Kőhegyi, Dr. László Nyíri and Dr. József Schmidt, the presidents of the Budapest, as well as the Pest, Baranya, BAZ and Vas county regional organisations of the Hungarian Chamber of Pharmacists for their help in the operative conduct of the empirical data-collection and for the exploration of the detailed professional and managerial aspects of pharmacy operation. Thanks is also due to the Institute of Marketing and Media of Corvinus University of Budapest, a leading domestic professional community in adapting international scientific criteria and standards, that contributed to the completion of my doctoral dissertation. Special thanks go to my colleagues Dr. Zsófia Kenesei, Dr. Judit Simon, Dr. József Berács, Dr. Tamás Gyulavári and Dr. Dezső Molnár for their theoretical, methodological and personal support. I thank all my students who encouraged me by giving positive feedbacks regarding my educational activities. It is important for me to emphasise the support of those companies and their chiefs that greatly helped me establish a stable background to complete my dissertation by regularly providing consulting and research opportunities. I would like to thank my former teachers, educators and pedagogues at Újlak Street Elementary School, Ágoston Trefort Practice High School of ELTE and Corvinus University of Budapest for their contribution to the extension of my knowledge and the development of my personal competencies. The years I spent in the vanguard of Hungarian handball assured me the will-power and humility necessary for being persistent in my work. At last, it is the most important to express my gratitude to my dear parents, grandparents, my younger brother, kins and friends without whose years-long support I would not have been given the chance to write a doctoral dissertation and who could hardly meet me in person in the past few years.

5
Table of contents List of figures .......................................................................................................................... 10 List of tables ............................................................................................................................ 11 1. Research summary ............................................................................................................. 15 2. Introduction ........................................................................................................................ 19 3. Approaches of the concept of strategy in scientific literature ........................................ 20
3.1. Historical and military scientific roots .......................................................................... 20 3.2. The semantic content of strategy in business economics .............................................. 21 3.3. The approaches of strategy in Hungarian scientific literature ....................................... 23 3.4. Relevant strategic concepts from the point of view of the doctoral research ............... 24 3.5. Summarising thoughts on the interpretation of strategy in business economics ........... 25
4. Introducing strategic management ................................................................................... 25 4.1. A modern academic discipline ....................................................................................... 25 4.2. What does strategic management deal with? ................................................................ 26 4.3. Research philosophies in strategic management ........................................................... 26 4.4. The treatment of fracture lines ...................................................................................... 28
5. Introduction of the positioning school .............................................................................. 29 5.1. A short introduction of the research stream ................................................................... 29 5.2. Strategic groups ............................................................................................................. 29 5.3. The basic methodological approaches of the identification of strategic groups ........... 30
6. The strategic adaptation typology of Miles and Snow .................................................... 31 6.1. Epoch-making strategic classifications ......................................................................... 31 6.2. Changing environmental conditions.............................................................................. 31 6.3. The adaptive cycle, as the central construct of Miles and Snow’s typology ................. 32 6.4. The original strategic orientations of Miles and Snow.................................................. 32
6.4.1. Prospectors ............................................................................................................. 33 6.4.2. Defenders ............................................................................................................... 33 6.4.3.Analysers ................................................................................................................. 33 6.4.4. Reactors .................................................................................................................. 33
6.5. Examples of Miles and Snow’s strategic orientations from the global business world 34 6.6. The modification of the original typology .................................................................... 35 6.7. The importance of Miles and Snow’s typology............................................................. 36 6.8. Early criticism ............................................................................................................... 36
7. The classification of the researches of M&S’s strategic typology .................................. 37 7.1. Early and profile-setting studies .................................................................................... 37 7.2. External environmental adaptation ................................................................................ 37 7.3. Internal environmental adaptation ................................................................................. 37 7.4. The depiction of top-performer companies ................................................................... 38 7.5. Thought-provoking studies, methodological and review articles ................................. 38
8. The approach of business performance in strategic literature ...................................... 38 8.1. The definition and operationalisation of business performance .................................... 39 8.2. The dimensions of business performance measurement ............................................... 39
8.2.1. Effectiveness .......................................................................................................... 39 8.2.2. Efficiency ............................................................................................................... 39 8.2.3. Adaptability ............................................................................................................ 40 8.2.4. Innovativity ............................................................................................................ 40
8.3. The time-horizon of performance dimensions .............................................................. 40 8.4. Interactions and research interest .................................................................................. 40
9. The examination of the stochastic relationship between Miles and Snows’s strategic
6
orientations and business performance ................................................................................ 41 9.1. Early notions on the BP of Prospectors, Analysers, Defenders and Reactors ............... 41 9.2. Donald Hambrick’s modification: market effectiveness and financial efficiency ........ 41 9.3. Bourgeois’ slack resource theory .................................................................................. 41
10. External and internal environmental conditions influencing business performance 42 10.1. Primary factors ............................................................................................................ 42 10.2. Secondary factors ........................................................................................................ 42 10.3. The ideal environment of Miles and Snow’s strategic orientations ............................ 43 10.4. The frequency of distribution of Miles and Snow’s strategic orientations ................. 44 10.5. The introduction of industry-specific and environmental characteristics determining business performance of Miles and Snow’s strategic orientations ....................................... 44 10.6. Special influencing factors .......................................................................................... 46 10.7. Control variables ......................................................................................................... 47
11. The business performance of M&S’s strategic orientations ......................................... 48 11.1. Miles and Snow’s first presumption ............................................................................ 48 11.2. Miles and Snow’s second assumption ......................................................................... 48 11.3. The profiles of „top-performer” organisations ............................................................ 49
11.3.1. Strategic configuration ......................................................................................... 49 11.3.2. Fit theory .............................................................................................................. 50 11.3.3. The characteristics of the most successful business practices .............................. 50
12. Perceived environmental uncertainty ............................................................................. 51 12.1. About perceived environmental uncertainty in general ............................................... 51 12.2. The relationship between perceived environmental uncertainty and SO .................... 53 12.3. Interrelations of perceived environmental uncertainty and business performance ..... 54 12.4. The relationship between strategic orientation, PEU and business performance ........ 55 12.5. The potential moderating effect of perceived environmental uncertainty on the relationship between strategic orientation and business performance ................................. 55 12.6. Identification and classification of moderator variables in social science researches 56 12.7. Empirical experiences regarding the exploration of the potential moderating effect of PEU on the relationship between strategic orientation and business performance .............. 57
13. Geographical location ...................................................................................................... 58 14. What we know about Miles and Snow’s typology ......................................................... 59 15. The shortcomings and limitations of previous empirical researches ........................... 60 16. The scientific significance of the doctoral dissertation ................................................. 63 17. The introduction of the Hungarian public retail drug supply ..................................... 65
17.1. The interpretation of the activites of pharmacies in the microeconomic context of public and private goods ...................................................................................................... 65 17.2. Attributes of micro-level strategic planning and management in the public sector .... 68 17.3. Chronology: Milestones in sectoral legislation after the centrally planned economy 69 17. 4. Ethical vs. mercantile model ...................................................................................... 71 17.5. The operation of Hungarian pharmacies in the era of Ethical model (1994-2006) ..... 72 17.6. Legal changes in the era of the Mercantile model (2006-2011) affecting the foundation and operation of pharmacies .............................................................................. 73 17.7. Main consequences of the liberalisation in the Hungarian public retail drug supply . 74
17.7.1. Increase in the number of sectoral participants and in competitive intensity ...... 74 17.7.2. Management difficulties and performance variations .......................................... 74 17.7.3. Concentration, vertical integration and horizontal cooperations ......................... 75
17.7.3.1. Pharmacy Chains ........................................................................................... 75 17.7.3.2. Franchise-type cooperations .......................................................................... 75 17.7.3.3. Bottom-up cooperations – procurement associations .................................... 75

7
17.7.3.4. Independent pharmacies ................................................................................ 76 17.8. The restoration process towards the ethical model ..................................................... 76
18. The sector-specific and business policy relevance of our research .............................. 77 19. The conceptual model of our doctoral research ............................................................ 80
19.1. Strategic orientation .................................................................................................... 80 19.2. Business performance ................................................................................................. 81 19.3. Perceived environmental uncertainty .......................................................................... 81 19.4. Geographical location ................................................................................................. 81 19.5. Control variables ......................................................................................................... 81
20. Operationalisation of theoretical constructs examined in the Ph.D. research ............ 82 20.1. The identification of strategic orientations .................................................................. 83
20.1.1. Self-typing Paragraph Method ............................................................................. 83 20.1.2. Segev’s multi-item scale ...................................................................................... 83 20.1.3. The method of objective indicators ...................................................................... 83 20.1.4. Classification method ........................................................................................... 84
20.2. The operationalisation of perceived environmental uncertainty ................................. 84 20.3. Geographical location ................................................................................................. 85 20.4. Business performance ................................................................................................. 85
21. The qualitative phase of the primary research .............................................................. 86 21.1. The development process of the applied measurement instruments ........................... 89
21.1.1. Exploring multi-item scales and other measurement instruments ....................... 89 21.1.2. Generating additional scale items ........................................................................ 89 21.1.3. Linguistic formulation of content and formal elements of measurement tools .... 89 21.1.4. Pre-testing dimensionality and reliability ............................................................ 90 21.1.5. The finalisation of measurement instruments ...................................................... 90
21.2. The most important results of the pre-tests ................................................................. 90 21.2.1. Segev’s multi-item scale operationalising M&S’s SOs ....................................... 90 21.2.2. The self-typing paragraph method ....................................................................... 92 21.2.3. The method of objective indicators ...................................................................... 92 21.2.4. The perceived environmental uncertainty scale of Miles and Snow .................... 93 21.2.5. Geographical location .......................................................................................... 94 21.2.6. Business performance .......................................................................................... 95
22. General research questions of the doctoral dissertation ............................................... 95 22.1. Relevance of the M&S typology and the prevalence of its strategic orientations ...... 96 22.2. The distribution of the Miles and Snow’s strategic orientations and the perception of the operational environment’s elements ............................................................................... 97
23. The hypotheses of our doctoral research ...................................................................... 100 23.1. The relationship between Miles and Snow strategic orientations and business performance ........................................................................................................................ 100 23.2. The potential moderating effect of perceived environmental uncertainty on the relationship between strategic orientation and business performance ............................... 103 23.3. The potential moderating effect of geographical location of pharmacies on the relationship between strategic orientation and business performance ............................... 105 23.4. The combined moderating effect of perceived environmental uncertainty and geographical location on the stochastic relationship between strategic orientation and business performance ......................................................................................................... 106 23.5. The robustness of the effect of strategic orientation on business performance ......... 108
24. The quantitative phase of the doctoral research ......................................................... 109 24.1. Large sample survey data collection ......................................................................... 109 24.2. The definition of population ...................................................................................... 109

8
24.3. Organising the sampling frame ................................................................................. 110 24.4. Selection of the sampling technique .......................................................................... 110 24.5. Conducting the data collection .................................................................................. 110 24.6. Response rate ............................................................................................................. 111 24.7. Sample structure ........................................................................................................ 111
25. Introduction of the applied mathematical-statistical methods................................... 112 25.1. A short introduction of structural equation modeling (SEM) .................................... 113 25.2.Widely used methods of structural equation modeling .............................................. 114 25.3. Application criteria of structural equation modeling ................................................. 115 25.4. The introduction of SEM-based techniques applied to explore moderating effects . 117
25.4.1. The introduction of the multi-group moderation technique ............................... 117 25.4.2. The introduction of the interaction moderation technique ................................. 118 25.4.3. The introduction of the moderated moderation technique ................................. 118
25.5. The interpretation of the results and fit indices of structural models ........................ 119 26. Evaluating the quality criteria of applied measurement instruments ....................... 119
26.1. Objectivity ................................................................................................................. 119 26.2. Generalisability ......................................................................................................... 120 26.3. Validity and reliability ............................................................................................... 121
27. Validity............................................................................................................................. 121 27.1. Face validity .............................................................................................................. 121 27.2. Content validity ......................................................................................................... 121 27.3. Criterion validity ....................................................................................................... 122 27.4. Construct validity ...................................................................................................... 122
27.4.1. Discriminant validity .......................................................................................... 122 27.4.1.1. Exploratory factor analysis .......................................................................... 123 27.4.1.2. Confirmatory factor analysis ....................................................................... 124 27.4.1.3. The reliability of indicators ......................................................................... 125 27.4.1.4. The examination of connections between latent constructs ........................ 125 27.4.1.5. The comparison of alternative CFA structures ........................................... 126 27.4.1.6. Fornell-Larcker’s criterion and validity of cross-loadings .......................... 127
27.4.2. Summary of the results of discriminant validity checks .................................... 127 27.4.3. Convergent validity ............................................................................................ 128 27.4.4. Nomological validity .......................................................................................... 129 27.4.5. The evaluation of construct validity ................................................................... 130
28. The consequences of discriminant validity examinations regarding the research questions and hypotheses of our doctoral dissertation ..................................................... 130 29. Reliability ........................................................................................................................ 132 30. Common method variance............................................................................................. 133 31. Non-response bias ........................................................................................................... 136 32. The identification of Miles and Snow’s strategic orientations and the comparison of their distribution ratio ......................................................................................................... 137
32.1. The strategic orientation of pharmacies according to the results of original measurement intruments .................................................................................................... 137 32.2. The identification of relevant strategic orientations in the Hungarian public retail drug supply ................................................................................................................................. 138 32.3. Testing convergent validity in its classical approach ................................................ 139 32.4. Comparison of the distribution ratios of Miles and Snow’s strategic orientations ... 140 32.5. The evaluation of the distribution ratios of M&S’s strategic orientations ................ 141
33. Strategy and environment ............................................................................................. 142 33.1. Correlation between perceived environmental uncertainty and strategic orientations

9
............................................................................................................................................ 143 33.2. The association between strategic orientations and perceived environmental uncertainty .......................................................................................................................... 143 33.3. The differences between strategic orientations regarding PEU ................................ 144 33.4. The differences between groups characterised by high and low perceived environmental uncertainty regarding the prevalence of M&S’s strategic orientations ...... 145 33.5. Interactions of strategic orientation and perceived environmental uncertainty ........ 145
34. Evaluation of the answers given to the formulated research questions of the dissertation ............................................................................................................................ 147 35. Preliminary regression analyses for the exploration of the moderating effects of PEU and GL on the relationship between strategic orientation and business performance .. 148
35.1. The correlation between strategic orientation, business performance, geographical location and perceived environmental uncertainty ............................................................. 148 35.2. The moderating effect of PEU in the relationship of strategic orientation and sales 149 35.3. The moderating effect of PEU on the relationship between SO and net profit ......... 150 35.4. The moderating effect of GL on the relationship between SO and sales .................. 152 35.5. The potential moderating effect of geographical location on the relationship between strategic orientation and net profit ..................................................................................... 154 35.6. Control variables: Methodological implications of regressions for SEM models .... 155
36. The relationship between strategic orientations and business performance ............ 156 36.1. The relationship between strategic orientations and sales of pharmacies ................. 156 36.2. The realationship between strategic orientations and net profit ................................ 157
37. The potential moderating effect of perceived environmental uncertainty on the relationship between strategic orientations and business performance .......................... 157
37.1. The moderating effect of PEU on the relationship of strategic orientation and sales 157 37.2. Evaluating the role of PEU in the relationship of strategic orientation and sales ..... 158 37.3. The moderating effect of PEU on the relationship between SO and NP................... 158 37.4. Evaluating the moderating effect of PEU in the relationship of SO and net profit ... 159
38. The potential moderating effect of geographical location on the relationship between strategic orientation and business performance of pharmacies ....................................... 159
38.1. The moderating effect of GL on the relationship between SO and sales .................. 160 38.2. The evaluation of the moderating effect of geographical location on the relationship between strategic orientation and sales .............................................................................. 161 38.3. The moderating effect of GL on the relationship between SO and net profit ........... 161 38.4. The evaluation of the moderating effect of geographical location on the relationship between strategic orientations and profitability ................................................................. 162
39. The combined moderating effect of PEU and geographical location on the relationship between strategic orientation and business performance ........................... 163
39.1. The combined moderating effect of perceived environmental uncertainty and geographical location on the relationship between strategic orientation and sales ............ 163 39.2. The combined moderating effect of geographical location and perceived environmental uncertainty on the relationship between strategic orientation and profitability of pharmacies ..................................................................................................................... 164
40. The robustness of the connections – explored by multi-variate data analyses – in the relationship between strategic orientation and business performance ........................... 165
40.1. The combined moderating effect of geographical location and PEU on the relationship between strategic orientation and sales by integrating relevant control variables ............. 165 40.2. The combined moderating effect of GL and PEU on the relationship between strategic orientation and NP by integrating relevant contol variables .............................................. 166
41. The evaluation of hypotheses tested in our dissertation ............................................. 167
10
42. The evaluation of the moderating effects on the relationship between strategic orientations and business performance .............................................................................. 170
42.1. The role of PEU in the relationship between strategic orientation and sales ............ 170 42.2. The role of PEU in the relationship between strategic orientation and net profit ..... 173 42.3. Role of GL in the relationship of strategic orientation and sales .............................. 173 42.4. The role of GL in the relationship of strategic orientation and net profit ................. 174
43. Findings ........................................................................................................................... 176 44. Discussion ........................................................................................................................ 178 45. Limitations of our dissertation and potential directions of future research ............. 185 46. Managerial implications ................................................................................................ 189
46.1. Managerial implications concerning the strategic orientations of pharmacies ......... 189 46.2. Connections between the characteristics of strategic-level management and BP ..... 191
47. References ....................................................................................................................... 193 48. Tables ............................................................................................................................... 240 49. Figures ............................................................................................................................. 330 50. Publications of the author in the topic of the doctoral dissertation ........................... 357 List of figures Figure I: Flowchart of the framework of the Ph.D. research ................................................... 18 Figure VI: The conceptual model of our doctoral research ...................................................... 82 Figure VIII: Comprehensive scheme of the research questions of our doctoral dissertation. 100 Figure IX: Displaying research hypotheses in the conceptual model of the Ph.D. thesis ...... 109 Table XXI: Original English version of Segev’s multi-item scale identifying M&S’s SOs .. 281 Figure II: The interrelation of environment and strategy – theoretical integration ................ 330 Figure III: The assumed business performance exhibited by M&S’s SOs ............................ 330 Figure IV: Market effectiveness and financial efficiency of M&S’s SOs .............................. 331 Figure V: The assumed relationship between M&S’s SOs and BP ........................................ 331 Figure VII: The applied identification methods of M&S’s SOs ............................................ 331 Figure X: CFA of Segev scale operationalising the original SOs of M&S ............................ 332 Figure XI: The confirmatory factor analysis (CFA) of Segev scale operationalising the industry specific SOs of M&S relevant in HPRDS................................................................ 333 Figure XII: The conformatory factor analysis (CFA) of M&S’s PEU scale .......................... 334 Figure XIII: The common single latent factor analysis of M&S’s PEU scale ....................... 335 Figure XIV: The common single latent factor analysis of the Segev scale operationalising the original 4 SOs of M&S ........................................................................................................... 336 Figure XV: The common single latent factor analysis of the Segev scale operationalising M&S’s SOs by the application of the industry-specific 3 factors solution ............................ 337 Figure XVI: Testing common method variance of PEU scale by marker variable technique with the integration of factor „Defenders” from Segev scale operationalising M&S’s SOs . 338 Figure XVII: Testing common method variance of Segev scale by marker variable technique with the integration of factor („Regulatory authorities”) from M&S’s PEU scale ................ 339 Figure XVIII: The effect of M&S’s SOs on PEU .................................................................. 340 Figure XIX: The influence of strategic orientation on perceived environmental uncertainty 341 Source: Figure made by the author (SEM) ............................................................................. 341 Figure XX: The effect of perceived environmental uncertainty on SO of pharmacies .......... 342 Figure XXI: The effect of M&S’s SOs on the sales of pharmacies ....................................... 343 Figure XXII: The effect of the SOs of M&S on the net profit of pharmacies ....................... 344 Figure XXIII: Revealing the moderation effect of PEU by multigroup moderation (sales) .. 345 Figure XXIV.: Revealing the moderation effect of PEU by interaction moderation (sales) .. 346

11
Figure XXV: Revealing the moderation effect of PEU by multigroup moderation (NP) ...... 347 Figure XXVI: Revealing the moderation effect of PEU by interaction moderation (NP) ..... 348 Figure XXVII: The moderating effect of GL by interaction moderation (sales) ................... 349 Figure XXVIII: The moderating effect of GL by multigroup moderation (sales) ................. 350 Figure XXIX: The moderating effect of GL by interaction moderation (net profit) .............. 351 Figure XXX: The moderating effect of GL by multigroup moderation (net profit) .............. 352 Figure XXXI: The combined moderating effect of GL and PEU in the relationship of M&S’s strategic orientations and sales ............................................................................................... 353 Figure XXXII: The combined moderating effect of GL and PEU in the relationship of M&S’s strategic orientations and NP .................................................................................................. 354 Figure XXXIII: Revealing the combined moderating effect of GL and PEU in the relationship between SOs of M&S and sales by integrating relevant control variables ............................ 355 Figure XXXIV: Revealing the combined moderating effect of GL and PEU in the relationship between SOs of M&S and net profit by integrating relevant control variables ..................... 356 List of tables Table I: Guide to the abbreviations of the doctoral dissertation .............................................. 19 Table XVIII: Classification of economic goods according to rivalry and excludability ......... 66 Table XXVII: Operationalisation of theoretical constructs examined in empirical research .. 86 Table XXVIII: Overview of the main sections of the doctoral research, their objectives and applied methodologies .............................................................................................................. 88 Table LXXVII: The summary of responses given to the research questions of the thesis ..... 147 Table CXIII: Summarised evaluation of the results of our hypotheses formulated and tested in the doctoral dissertation I. ...................................................................................................... 168 Table CXIV: Summarised evaluation of the results of the hypotheses formulated and tested in the doctoral dissertation II. ..................................................................................................... 169 Table CXV: The moderating effect of perceived environmental uncertainty in the relationship of strategic orientation and business performance ................................................................. 171 Table CXVI: The moderating effect of geographical location in the relationship of strategic orientation and business performance .................................................................................... 171 Table CXVII: Evaluation of the combined moderating effect of perceived environmental uncertainty and geographical location (Sales) ....................................................................... 172 Table CXVIII: Evaluation of the combined moderating effect of perceived environmental uncertainty and geographical location (Net profit) ................................................................ 172 Table CXIX: Evaluating the potential moderating role of PEU in the relationship of M&S’s SOs and BP of pharmacies ..................................................................................................... 175 Table CXX: Evaluating the potential moderating role of GL in the relationship between M&S’s SOs and BP of pharmacies ......................................................................................... 175 Table II: Strategy-matrix: The breakdown of the concept of strategy .................................... 240 Table III: Research streams regarding content elements of strategy ...................................... 240 Table IV: The main idiosyncratic characteristics of Miles and Snow’s strategic orientations241 Table V: Thematic classification of researches regarding strategic typology of M&S .......... 243 Table VI: Business performance indicators applied in M&S strategic research .................... 244 VII. Table: The distribution of the M&S’s strategic orientations in the academic studies .... 247 Table VIII: Industries and their environmental characteristics examined in M&S research . 250 Table IX: The performance implications of M&S’s strategic orientations ............................ 254 Table X: Depicting the organisational profiles of top performing M&S’s SOs ..................... 258 Table XI: Classification and terms of specification variables ................................................ 259 Table XII: Summary of the moderating effect of environmental factors influencing the
12
relationship between strategy and performance ..................................................................... 260 Table XIII: The conceptual approach of public and private goods ........................................ 274 Table XIV: Comparison of public and private goods based on certain microeconomic characteristics I. ...................................................................................................................... 275 Table XV: Comparison of public and private goods based on certain microeconomic characteristics II. .................................................................................................................... 276 Table XVI: Comparison of public and private goods based on certain microeconomic characteristics III. ................................................................................................................... 277 Table XVII: Comparison of public and private goods based on certain microeconomic characteristics IV. ................................................................................................................... 278 Table: XX: General English and Hungarian descriptions operationalising M&S’s SOs ....... 280 Table XXII: Supplementing the formal and content elements of Segev’s multi-item scale (1987) identifying M&S’s SOs with items deriving from Conant et al. scale (1990) ............ 282 Table XXIII: Problematic items of Segev scale identified during the „card matching tasks” 283 Table XXIV: The Segev scale identifying M&S’s SOs – final version applied in the survey 284 Table XXV: Wording of descriptions featured in self-typing paragraph method applied for identifying SOs of M&S ........................................................................................................ 286 Table XXVI: Operationalisating the construct of PEU via the industry-specific adaptation of multi-item scale developed by M&S (1978) .......................................................................... 287 Table XXIX: Regional distribution of sample and respondents............................................. 289 Table XXX: Description of the sample by main socio-demographic characteristics............. 289 Table XXXI: Compliance with the application criteria of SEM: Number of observations ... 290 Table XXXII: Multivariate techniques used to test our research questions and hypotheses . 290 Table XXXIII: 3 and 4 factor structure solutions as resulting from EFA of Segev scale ...... 291 Table XXXIV: 5 and 2 factor structure solutions resulting from EFA of Segev scale ........... 292 Table XXXV: Exploratory factor analysis of M&S’s PEU scale ........................................... 293 Table XXXVI: Fit indices of confirmatory factor analysis of Segev scale ............................ 294 Table XXXVII: Fit indices of confirmatory factor analysis of PEU scale ............................. 294 Table XXXVIII: Confirmatory factor structure of SOs relevant in the Hungarian public retail drug supply based on Segev’s (1987) scale ............................................................................ 295 Table XXXIX: Confirmatory factor structure of PEU scale in HPRDS I. ............................. 296 Table XL: Confirmatory factor structure of PEU scale in HPRDS II. ................................... 297 Table XLI: Strength of relationships between latent constructs of Segev scale..................... 298 Table XLII: Strength of relationships between latent constructs of PEU scale ..................... 298 Table XLIII: Comparing the CFA results of Segev scale with and without fixed covariance values between latent constructs ............................................................................................ 298 Table XLIV: CFA results of PEU scale with(out) fixed covariance between latent constructs ................................................................................................................................................ 299 Table XLV: Examining discriminant validity based on Fornell-Lacker criterion in case of 3 and 4 factor structure solutions of Segev’s strategic identification scale ............................... 299 Table XLVI: Discriminant validity of PEU scale (Fornell-Larcker criteria) ......................... 299 Table XLVII: Evaluation of discriminant validity of measurement instruments ................... 300 Table XLVIII: Differences in behavioural characteristics between Prospectors, Analysers and Defender/Reactors .................................................................................................................. 301 Table XLIX: AVE indicators of constructs of multi-item Segev and PEU scales .................. 302 Table L: Correlation matrix of the behavioural characteristics of Defender/Reactor SO ...... 303 Table LI: The degree of prevalence of Defender and Reactor characteristics in case of pharmacies classified as Defender/Reactors .......................................................................... 304 Table LII: Comparison of means of pharmacists’ evaluations for assessing the prevalence of Defender and Reactor characteristics in case pharmacies pursuing Defender/Reactor SO ... 305
13
Table LIII: Modifications made on our original research questions and hypotheses ............. 305 Table LIV: Reliability based on internal consistency in case of 3 and 4 factor structure solutions of Segev and the origonal 7 factor structure of PEU scales .................................... 305 Table LV: The Composite Reliability indicator of multi-item Segev and PEU scales ........... 306 Table LVI: Harman’s single factor method for testing CMV ................................................. 306 Table LVII: Common single latent factor analysis for testing CMV ..................................... 306 Table LVIII: Testing the problem of CMV with „marker” variable method in Segev scale by the integration of latent constructs of PEU scale ................................................................... 306 Table LIX: Testing of CMV with „marker” variable method in PEU scale by the inclusion of latent constructs of Segev scale .............................................................................................. 307 Table LX: Summary of quantitative tests applied for testing CMV ...................................... 307 Table LXI: Significance of differences between evaluations of pharmacists regarding variables integrated in non-response bias tests, early and late respondents by county .......... 307 Table LXII: Sample distribution of SOs identified by self-typing paragraph method and Segev multi-item scale exhibiting 4 factors (strategic orientations) ................................................. 308 Table LXIII: Sample distribution of SOs identified by self-typing paragraph method and multi-item Segev scale exhibiting 3 factors (strategic orientations) ...................................... 308 Table LXIV: The degree of internal identity in the case of self-typing paragraph methods providing 3 and 4 SOs and Segev scale exhibiting 3 and 4 factor structure solutions ........... 308 Table LXV: The degree of external (between measurement instruments) identity of SOs identified by self-typing parargraph method and multi-item Segev scale.............................. 309 Table LXVI: The degree of identity between classification results of original self-typing paragraphs and multi-item Segev scale operationalising 4 strategic orientations of M&S ... 309 Table LXVII: Comparing the classification results of identification methods applied for operationalising strategic orientations relevant in HPRDS .................................................... 309 Table LXVIII: Convergence in the classification results of measurement instruments ......... 309 Table LXIX: Comparing the distribution of SOs identified by original measurement tools . 310 Table LXX: Comparing the distribution of relevant SOs observable in HPRDS .................. 310 Table LXXI: Correlation between SOs, degree of PEU, GL and BP indicators .................... 310 Table LXXII: Associations between SOs and perceived environmental uncertainty ............ 311 Table LXXIII: Differences in PEU between pharmacies pursuing Prospector, Analyser and Defender/Reactor strategic orientations ................................................................................. 312 Table LXXIV: Paired differences between strategic orientations in terms of PEU ............... 312 Table LXXV: Effect of M&S’s SOs on the degree of PEU ................................................... 313 Table LXXVI: Differences between pharmacies characterised by low and high PEU with regard to the prevalence of M&S’s SOs ................................................................................. 313 Table LXXVIII: The potential moderating effect of PEU by pharmacists in the relationship between M&S’s SOs and sales of pharmacies ....................................................................... 314 Table LXXIX: Explanatory power of hierarchical moderated regression models exploring the potential moderating effect of PEU in the relationship of SO and pharmacies’ sales ............ 315 Table LXXX: Potential moderating effect of PEU in the relationship of SO and sales ......... 315 Table LXXXI: Potential moderating effect of PEU in the relationship of SO and sales ....... 315 Table LXXXII: Potential moderating effect of PEU in the relationship of SO and NP ......... 316 Table LXXXIII: Explanatory power of regression models exploring the potential moderating effect of PEU in the relationship between SO and NP ........................................................... 317 Table LXXXIV: Potential moderating effect of PEU in the relationship of SO and NP ....... 317 Table LXXXV: Potential moderating effect of PEU in the relationship of SO and net profit 317 Table LXXXVI: Potential moderating effect of GL in the relationship of SO and sales ....... 318 Table LXXXVII: Explanatory power of regression models exploring the potential moderating effect of GL in the relationship between SO and NP ............................................................. 319
14
Table LXXXVIII: Moderating effect of GL in the relationship between SO and sales ......... 319 Table LXXIX: Explanatory power of regression models demonstrating the potential moderating effect of GL in the relationship between SO and sales ....................................... 319 Table XC: Potential moderating effect of GL in the relationship between SO and NP ......... 320 Table XCI: Explanatory power of regression models demonstrating the potential moderating effect of GL in the relationship between SO and NP ............................................................. 320 Table XCII: Moderating effect of geographical location between SO and NP ...................... 321 Table XCIII: Moderating effect of GL in the relationship between SO and NP .................... 321 Table XCIV: The correlation between socio-demographic characteristics, locational and site attributes of the pharmacies and the BP indicators (sales and net profit) .............................. 321 Table XCV: The relationship between strategic orientations and sales of pharmacies .......... 321 Table XCVI: Differences in sales of pharmacies exhibiting different SOs of M&S ............. 322 Table XCVII: Pairwise differences between sales exhibited by Prospector, Analyser, Defender/Reactor strategic orientations ................................................................................. 322 Table XCVIII: The relationship between SOs and net profit of pharmacies ......................... 323 Table XCIX: Differences in NP of pharmacies following different SOs of M&S ................. 323 Table C: Pairwise differences in NP realised by Prospectors, Analysers, Defender/Reactors323 Table CI: The moderating effect of PEU in the relationship between SO and sales .............. 324 Table CII: Moderating effect of PEU in the relationship of SO and pharmacies’ SAL ......... 324 Table CIII: Moderating effect of PEU in the relationship between SO and NP .................... 324 Table CIV: Moderating effect of PEU in the relationship between SO and pharmacies’ NP 324 Table CV: Moderating effect of GL in the relationship of SO and pharmacies’ SAL ............ 324 Table CVI: The moderating effect of GL in the relationship between SO and SAL ............. 325 Table CVII: Moderating effect of GL in the relationship between SO and pharmacies’ NP . 325 Table CVIII: Moderating effect of GL in the relationship of SO and NP of pharmacies ....... 325 Table CIX: Combined moderating effect of PEU and GL in the relationship of SO and SAL ................................................................................................................................................ 325 Table CX: Combined moderating effect of PEU and GL in the relationship of SO and NP . 326 Table CXI: Combined moderating effect of PEU and GL in the relationship between SO and SAL by controling for relevant, industry-specific variables .................................................. 326 Table CXII: Combined moderating effect of PEU and GL in the relationship between SO and NP by integrating the relevant, industry-specific control variables ....................................... 326 Table CXXI: Correlation between behavioural attributes of M&S’s SOs and BP indicators 327 Table CXXII: Effect of M&S’s SOs’ behavioural characteristics on sales of pharmacies .... 328 Table CXXIII: Effect of M&S’s SOs’ behavioural characteristics on NP of pharmacies ...... 329
15
1. Research summary Adaptation to changing environmental conditions plays a decisive role in the life of organisations. In the academic discipline of strategic management it is generally accepted by most researchers that during the period of economic turbulence and intensifying competition the tool kit of conventional managerial intuition and empirical wisdom becomes significantly useless (Barney, 1986). As a corollary, by lacking a theoretically well-grounded, then successfully implemented strategy, the prosperity of businesses is going to be severely hampered. To achieve their long term effectiveness as well as efficiency objectives, firms increasingly need to develop consistent patterns of adaptive behaviour. Our doctoral dissertation deals with one of the most prominent strategic taxonomies of business economics, the classification that has been developed by Raymond Miles and Charles Snow (1978). Our empirical research considered explicitly testing the Miles and Snow (M&S) typology as a priority within a special industrial context – the Hungarian Public Retail Drug Supply (HPRDS) – severely restricted by state regulations and featured by the unique manifestation of microeconomic characteristics of public, as well as private goods. We tried to do our best to eliminate the scientific-theoretical and methodological shortcomings of past studies. Therefore we employed various techniques for the identification of strategic orientations, our research focus was aimed at micro enterprises that are often neglected in strategic management, and our analyses also included firms pursuing inconsistent, Reactor strategic orientation. Moreover, we highlighted those aspects of Miles and Snow’s typology that have not been given much attention in international research so far (e.g. the relationship between strategic orientation and the perceived uncertainties regarding the development of the conditions and the behaviour of key stakeholders of the operational environment characterised by strict governmental regulations, as well as the identification of „hybrid”/”mix” strategic adaptation patterns). The literature review of theoretical constructs such as Miles and Snow’s environmental adaptation taxonomy, business performance, perceived environmental uncertainty and geographical location contributed to the elaboration of the conceptual model of our doctoral research. The more than 30 preliminary in-depth interviews conducted with representatives of a wide range of industrial stakeholder groups (e.g. pharmacists, wholesalers, producers, pharmacy visiting agents, advocacies of pharamacists’, National Health Insurance Fund of Hungary officials, physicians) from the drug supply chain were essential in the finalisation of measurement instruments suitable for the operationalisation of constructs examined in the empirical data collection. During the quantitative section of our empirical research, data collection has been delivered by survey inquiry with the support of the president of the Hungarian Chamber of Pharmacists (HCP) and its regional leaders. The census-like data collection was organised in the city of Budapest, moreover in Baranya, Borsod-Abaúj-Zemplén, Pest and Vas counties. Questionnaires were distributed by post to more than 900 pharmacy managers. After reminder mails and telephone calls, all in all 207 completed questionnaires – featured by high quality data, thus applicable in multivariate analysis – have been returned, which means a 22% response rate. The quantitative stage of our empirical examination directed towards the exploration of (in)consistent behavioural patterns observable in the environmental adaptation process of

16
domestic pharmacies. In our research questions we aimed to learn more about how many of the original SOs of M&S and in what form they are observable in the HPRDS which is characterised by bureaucratic coordination mechanisms and limited competitive intensity. We identified SOs pursued by pharmacies by the application of numerous measurement tools, thus by comparing their classification results we could draw valid and reliable conclusions about the relative distribution of Prospector, Analyser, Defender and Reactor pharmacies. In our dissertation we have also examined the manifestation of interactions between strategy and environment. By using various methods we quantified the influence of perceived environmental uncertainty by pharmacists on the choice and development of strategic orientations pursued by pharmacies, as well as the effect of the consciously chosen strategic orientation by pharmacists on the perception of changes in external environmental conditions and key industrial stakeholders’ behaviour. Beside the sector-specific manifestation of Miles and Snow’s strategic orientations, in the second stage of our survey data collection we paid special attention to examine the business performance of Prospector, Analyser, Defender and Reactor pharmacies. Our hypotheses placed great emphasis on identifying factors – such as perceived environmental uncertainty by pharmacists and geographical location of pharmacies – potentially playing moderating role in the stochastic relationship between strategic orientations and business performance. By the application of various mathematical-statistical methods we examined the potential moderating effect of perceived environmental uncertainty by pharmacists and geographical location of pharmacies on the relationship between strategic orientations and sales/net profit. According to our experiences, all of the 4 original strategic orientations of M&S can not be observed in the Hungarian public retail drug supply. The behavioural characteristics of Defenders and Reactors seem to have mixed to a great extent, thus, besides „pure” Prospector and Analyser adaptation patterns, we identified a Defender/Reactor „mix” strategic orientation. The convergent validity between the results of various measurement instruments identifying strategic orientations, has been confirmed even in its classical approach in case of operationalising the 3 „sector-relevant” behavioural patterns. As per observations, in the Hungarian public retail drug supply the relative majority of pharmacies pursue the Defender/Reactor strategic orientation, showing inconsistent adaptation behaviour and exhibiting suboptimal business performance. They are followed by Analysers, and then come Prospectors. By applying various multivariate methodologies we highlighted that the effect of strategic orientation consciously chosen by pharmacists on the extent of perceived environmental uncertainty proved to be stronger than the determining influence of environmental conditions on the choice and realisation of strategic orientation. Our results show that although Miles and Snow’s strategic orientations had a significant contribution to the development of pharmacy sales, they did not influence net profit significantly. The sales of Prospector pharmacies exceeded the sales of Analysers and that of the Defender/Reactors, while at the same we did not experience significant differences in the profitability of strategic orientations. They – depending on the applied methodology and the integration of moderating and control variables – explained 13,1-48% of the variance of market effectiveness and 1-40,7% of financial efficiency. Of perceived environmental uncertainty by pharmacists, we can say that all in all it did not moderate the relationship between strategic orientation and business performance of
17
pharmacies. While geographical location of pharmacies – depending on the chosen multi-variate methodology – did moderate the relationship between Miles and Snow’s strategic orientations and business performance. It is discernible, that the effect of the realisation of Prospector, Analyser and Defender/Reactor strategic orientations on business performance strengthens in rural context compared to our experiences in urban environment. Examining the combined moderating effect of geographical location and perceived environmental uncertainty by pharmacists, we experienced in some cases that changes in perceived environmental uncertainty modify the influence of certain strategic orientations on business performance in urban and/or rural context. As an example, the negative effects of numerous strategic orientations on business performance strengthen if the degree of perceived environmental uncertainty by pharmacists falls back. In our dissertation the revealed interrelations between strategic orientations, perceived environmental uncertainty by pharmacists, geographical location and business performance of pharmacies remained more or less robust even after controlling for the effects of sector-specific, socio-demographic features and variables pertaining to pharmacies’ sites. The results of the dissertation end with the structured summary of the combined potential moderating effects of perceived environmental uncertainty and geographical location on the relationship between strategic orientation and business performance by means of various multivariate methodological techniques – e.g. hierarchical interaction and multigroup regressions and SEM analyses, like moderated moderation (SEM). The final chapter of the Ph.D. thesis draws its theoretical conclusions, discusses the more exciting and contradictory research findings, emphasises the limitations of our study, formulates future research directions and finally reaches its end with the introduction of managerial implications. The key content elements and milestones of our Ph.D. research are illustrated in Figure I.

18
Figure I: Flowchart of the framework of the Ph.D. research
Source: Figure made by the author
STRATEGY
Conceptual approach Strategic management
Miles and Snow strategic typology
CONSTRUCTS
Strategic orientation Business performance
Perceived environmental uncertainty
Geographical location
SCIENTIFIC RELEVANCE
Classification of previous
researches, assessment of their results and shortcomings
Highlight the gap-filling role of the dissertation
INDUSTRIAL CONTEXT
Introduction to the Hungarian public
retail drug supply sector in the context of private and public goods
Identify the sectoral relevance of the dissertation
CONCEPTUAL MODEL
Outline the assumed relationships among
constructs
OPERATIONA-LISATION
Select measurement
instruments intended to apply in Ph.D. research
to capture constructs
PRIMARY QUALITATIVE RESEARCH
In-depth interviews with industrial stakeholders and
strategic management researchers Development process of applied
measurement tools
RESEARCH QUESTIONS AND
HYPOTHESES
PRIMARY QUANTITATIVE
RESEARCH
Survey data collection Presentation of the sample
Description of applied mathematical and statistical methods
VALIDATION OF MEASUREMENT INSTRUMENTS
Dimensionality Validity
Reliability Generalisability
Common Method Variance Non-response bias
RESULTS
Reveal the potential moderating effect of geographical location and perceived environmental uncertainty by pharmacy
managers in the relationship between the pharmacies’ strategic orientation and
business performance.
CONCLUSIONS
Findings Discussion
Future research directions Managerial implications
1 2 3 4
5 6 7 8
9 10 11 12

19
Due to length limits and in order to avoid monotonity accidentally experienced while reading, the crucial and repeatedly used scientific-, industrial and business policy constructs and basic concepts of the dissertation have been abbreviated. Table I. below lists the acronyms for the most frequently used basic concepts. Table I: Guide to the abbreviations of the doctoral dissertation Abbreviation Original expression
M&S (Raymond) Miles és (Charles) Snow SO Strategic Orientation
PROSPECTOR, PRO, P, K Prospector strategic orientation
DEFENDER, DEF, D, V Defender strategic orientation
ANALYSER, ANA, A, E Analyser strategic orientation
REACTOR, REA, R, R Reactor strategic orientation
PEU Perceived Environmental Uncertainty PEU_WHS Perceived Environmental Uncertainty in the behaviour of Wholesalers PEU_PROD Perceived Environmental Uncertainty in the behaviour of Producers PEU_PAT Perceived Environmental Uncertainty in the behaviour Patients
PEU_COMP Perceived Environmental Uncertainty in the behaviour of Competitor pharmacies PEU_REG Perceived Environmental Uncertainty in the behaviour Regulatory authorities
PEU_HCP Perceived Environmental Uncertainty in the behaviour of the Hungarian Chamber of Pharmacists
PEU_FIN Perceived Environmental Uncertainty in the development of Financial conditions GL Geographical Location BP Business Performance
SAL Sales NP Net Profit
SEM Structural Equation Modeling
CMV Common Method Variance: variance (distortion) resulting from the application of the common method
CSLF Common Single Latent Factor method for testing CMV SBU Strategic Business Unit
HPRDS Hungarian public retail drug supply HCP Hungarian Chamber of Pharmacists - Magyar Gyógyszerészi Kamara (MGYK)
NHIFH National Health Insurance Fund of Hungary - Országos Egészségbiztosítási Pénztár (OEP)
NIP
National Institute of Pharmaceutics -Országos Gyógyszerészeti Intézet (OGYI) (From 2011 onwards the National Institute for Quality- and Organisational Development in Healthcare and Medicines) – Gyógyszerészeti és Egészségügyi Minőség- és Szervezetfejlesztési Intézet (GYEMSZI)
NPHMOS National Public Health and Medical Offer Service – Állami Népegészségügyi és Tisztiorvosi Szolgálat (ÁNTSZ)
HCSO Hungarian Central Statistical Office (KSH) – Központi Statisztikai Hivatal ADD Act of drug distribution - Gyógyszer-forgalmazási törvény(GYFTV)
Source: Table made by the author 2. Introduction
„Statesmen and generals have at all times endeavoured to avoid the decisive battle. Contemporary history has destroyed this illusion” – Carl von Clausewitz

20
Prominent Prussian military general of the Napoleonic Wars and later statesman Carl von Clausewitz was not only an epochal philosopher in military science. The main messages of his works had such a huge influence on representatives of other scientific discplines, including economics as well, that circa 150 years later prestigious universities would be quite quick in the successful integration of his doctrines. His works On War or „Strategische Beleuchtung mehrerer Feldzüge von Gustav Adolph, Turenne, Luxemburg und andere historische Materialien zur Strategie” are now listed among either the obligatory or recommended readings of business strategy, marketing, game theory and other courses of such world-famous business schools as Harvard Business School, London Business School or HEC. Due to students’ warm welcome, the military policy implications of Clausewitz’s works – for example the critical analysis of the opponent’s resources, the power of surprising offensive, the advantages of developing stable defensive positions, or the importance of psychological warfare (Clausewitz, 1832) – has gained ground fast even in the world of business. The saturation of business-to-business and consumer markets and the intensified competition experienced in the second half of the 20th century demanded a more conscious action on part of the companies. Firms had difficulties in increasing the market potential of their products and services and so were often forced to expand at each others’ positions. In such a competitive environment the political-military analogies of Clausewitz were regarded actual and therefore they became popular devices in business planning and strategic consulting. (Ghychy et al., 2001). However, Clausewitz’s references in many cases were applied without proper conceptual bases as managers were not aware of the exact definition, or the content- and process elements of strategy. In our doctoral thesis we analysed in detail the strategic aspects of the intensified competition in HPRDS as a consequece of Act XCVIII of 2006 „on the general regulations of safe and cost-efficient supply and distribution of drugs and medical devices” (Act of Drug Distribution – ADD). In order to do this, it proved to be essential to define strategy as a central theoretical constuct. In the next sections we plan to give a short historical overview of the international and Hungarian scientific approaches of strategy. 3. Approaches of the concept of strategy in scientific literature 3.1. Historical and military scientific roots Strategy is one of the oldest concepts of human civilisation, the word itself originates from the Greek „strategos” which means general. Ancient Greeks used the term from the 5th century B.C. onwards and mankind was going to interpret it exclusively in the military field for the following almost 2500 years (Barakonyi-Lorange, 1993). Another cradle of the development of strategic thought was the ancient China. Not surprisingly, the first written theory of strategy came to light in the „Empire of Heavenly Peace”, where general Szun-cu put down his strategic ideas on the political-military state of the country in around 300 B.C. The strategy concepts of later ages emphasised its military semantic content as well. By developing the doctrines of Clausewitz, Helmuth von Moltke, chief of the general staff, establishing the XIX. century Prussian continental military hegemony defined strategy this way: „Strategy is nothing else, but the employment of common sense in military command.” (Barakonyi, 1999, pg. 18.) The military-scientific approach still prevails in the definitions of Hungarian and international concise dictionaries even today: „Strategy is the science and art of conducting a military campaign in its large scale and long term aspects” (The New Webster’s Dictionary, 1993).
21
According to the Hungarian Révai Encyclopedia „strategy is all of the commanding activities that aim to lead a mobilised army to confront with the enemy” (Barakonyi, 1999, pg. 18.). 3.2. The semantic content of strategy in business economics In the 20th century, the development of technological conditions and the ease of legal criteria promoting the worldwide proliferation of goods and services led to a dynamic penetration of markets, where competition between companies – just as once in the battlefields – became a question of „life and death” (Ronda-Pupo – Guerras-Martín, 2012). This provided excellent opportunity for managers to implement the accepted concepts and methods of generalship in management. Parallel to this, strategic philosophy and its employment in solutions to economic problems were taking roots in educational and scientific spheres as well. Hereinafter we summarise the semantic content of strategy and its modern approaches in business policy. One the most important representatives of the cradle of strategic management, the Harvard-school, is Kenneth Andrews. He defined strategy as a pattern observable in managerial decisions which contains the objectives and goals, assigns the actions, steps necessary to achieve the goals and defines the scope of product/market domain and operation of the company. Furthermore, strategy specifies the economically and widely interpreted role of the company in society and designates the type, nature of economic and other devices with which it intends to contribute to the welfare of its owners, employees, consumers and other socially affected stakeholders. (Andrews, 1971). Russian-born pioneer of strategic planning and decision-making, Igor Ansoff endowed the approach of strategy with rigorous economic-theoretical bases and mathematical methodology. (Hart, 1994). Compared to Andrews, he had a rather technocratic view and narrowed the domain of strategy, which, according to him, focuses strictly on the product/market decisions of the company. Ansoff interprets strategy as an engineering mechanism that supports company management and helps in anticipating environmental conditions and bringing decisions concerning the future of the firm (Ansoff, 1957, 1965). An excellent business philosopher of the „West Coast”, founder of California Management Review, George A. Steiner stated that there is no mutual agreement even among businessmen and academics on the concept and semantic content of strategy. In his significant work, „Strategic planning” in 1979 he observed that strategy is a complex set of counter reactions to the actual, or future, probable activities of competitors. This also reflects to the age of Steiner that did not wish to conceal the military policy-origins of business strategy at all. In contrast to the abovementioned authors, he did not not take strategy unambiguously, mixing various strategic motives and using numerous definitions and approaches. These are (Steiner, 1979): 1. Strategy is a matter of top management, as its importance is essential in the life of the
organisation 2. Strategy refers to the most important policies – namely to objectives and mission of
organisational operations 3. Strategy consists of top management decisions that lead the company in the right direction
and help to realise company objectives 4. Strategy is the answer to the question regarding what the company should do 5. Strategy determines the desirable final state of the firm and the way to achieve this position

22
As one can see, Steiner interpreted strategy as a rather heterogeneous concept. Not even in his book titled „Strategic planning” (1979) were the conceptual frames of strategy cleared, so from a scientific point of view, the conceptualisation of strategy as a theoretical construct is incomplete and plastic. Approaches found in the footnotes of his work regard strategy as a plan, a competitive tool, a task, a perspective and a desirable position. On the other hand, the most stressed motives of Steiner’s strategy definitions are perspective and objectives, that is vision and mission. For years, academics had difficulties in handling Steiner’s conceptually quite plastic definitions which disturbed and hampered scientific research to some extent (Nickols, 2010). The world-famous theorist of management and organisational sciences, Henry Mintzberg shares Steiner’s opinion, namely that the approach of strategy is very heterogeneous. According to the systematic analysis summarising his observations of many decades, representatives of business economics interpret the expression of strategy in four different ways (Mintzberg, 1994, Ronda-Pupo – Guerras-Martín, 2012): 1. A plan concerning „how”, that contains the tools with which the company can get from
one point to another 2. Strategy is an enduring behavioural pattern in the attitude of organisations, which is
observable in various business activities 3. Strategy is a position which is reflected in the answers to the following questions: what
range of products/services is being offered to what market segments compared to competitors
4. A perspective that contains the vision and the potential evolutionary tendencies of the firm Mintzberg’s strategy concept – especially its content and formal elements and the sharp distinction between intended and realised strategy (Mintzberg-Waters, 1985) – is to be discussed in detail in Chapter 4 intoducing the history of the academic discipline of strategic management. Today’s popular strategic management guru, Michael Porter interprets strategy exclusively in its competitive context (Porter, 1980). According to him, any strategy is a competitive strategy that aims to achieve and manage sustainable competitive advantages (Porter, 1996a). In his works he points out that strategy is an intended and conscious choice of tools so that companies can offer a special value proposition or value-mix to their customers. Besides, strategy is the combination of the final states of companies that managers aim to reach by making various decisions and taking adequate measures (Porter, 1985). Porter’s approach therefore embraces strategy as a plan, perspective and position. According to Gary Hamel and C.K. Prahalad, representatives of the resource and capability-based business theory, strategy to companies means the choice and permanent development of resources that fit the external and internal environmental opportunities and its top priority is the acquisition of competitive advantages (Hamel-Prahalad, 1990). The content and formal elements of strategic process are both greatly stressed in this definition. The resource and competence-based approach gives the interpretation of competitive strategy remarkable dynamics, since it focuses on „manoeuvering for actions” instead of static battles for positions” (Stalk et al, 1992) and pays special attention to developing competencies necessary for environmental adaptation (Day, 1994). All in all we can say that the „how”-type normative recommendations concerning the achievement of final positions – e.g. the plan and perspective motives – dominate in the works of this stream (Hamel-Prahalad, 1989).

23
Nevertheless during the past two decades the resource and capability-based view has changed a great deal and besides the more abstract plan and perspective motives, more practical approximations stressing managerial decision-making, behaviour and measures have strengthened again (Hunt-Lambe, 2000, Ramos-Rodriguez – Navarro, 2004). A fine example for this is the definition of Thompson and his colleagues, (the authors of one of the most famous strategy textbook) according to which strategic management is a process, during which a company sets its objectives and defines those actions with the help of which the objectives can be achieved within a given period of time. Then performs the actions and continuously evaluates the results (Thompson et al, 2008). In our days, besides the dominantion of resource-based business theory and various strategic typologies, we may witness the evolution of an „old-new” strategic construct. With sociologists, psychologysts and anthropoligsts more decidedly advancing even in this discipline, the behavioural approach of strategy has strengthened and gained a specific focus. (Powell et al., 2011). The representatives of this stream, regard strategy as a resultant of empirical and psychological factors rather than a model-like outcome of rational economic factors (Hodgkinson-Healey, 2011, Levinthal, 2011). Theorists of this stream getting more and more important positions even at mainstream international strategic journals by interpreting firms as biological entities, and comprehend strategy as a subjective empirical and psychological construct. Latest neurostrategic empirical quests correlate strategy with the subjective emotional and motivational base of managers and implement analogies into business context from medical sciences, especially from diciplines examining cerebral functions. (Powell, 2011, Powell et al., 2011). Implicitly, this stream concentrates on the plan and behavioural pattern motives of strategy. 3.3. The approaches of strategy in Hungarian scientific literature In our opinion, Hungarian management science properly does not take a rigorous position in the conceptual definiton of strategy. According to our experiences, domestic education and research of strategy are founded primarily on Porter’s theoretical frames, respectively on resource, capability and knowledge-based business theories (Porter, 1980, Wernerfelt, 1984, Hamel-Prahalad, 1990, Grant, 1996). According to Attila Chikán, doctor of Hungarian Academy of Sciences, „strategy deals with the overall objectives and the organisational structure of companies including the relationship between certain organisational units and the headquarter” (Chikán, 2006, pg. 466). Károly Barakonyi also has a wider interpretation of strategy, although it is doubtless that operational (behavioural pattern) and engineering motives (plan) seem to dominate in his approaches. According to the economist, „strategy consists of the basic steps managers must take in order to realise objectives” (action). „Strategy is a path to follow towards achieving vision, mission and goals”(perspective). „Strategy includes the tasks and choices that lead to success on a certain level” (engineering). (Barakonyi, 1999, pg. 21.). According to József Vörös, corresponding member of Hungarian Academy of Sciences „Strategy is a set of operations/actions that aims to create a unique, profitable position” Strategy is therefore a goal and a tool at the same time that helps a company get into a desirable future position. All this is achievable through the coordination of interorganisational actions (behavioural pattern) and their symbiosis-like interaction. (Vörös, 1995)

24
According to the well-known representatives of our narrowed field of interest – the Hungarian marketing science – András Bauer and József Berács, marketing strategy excels the rest of the functional strategies in significance since its priority is the definition of the product/market domain and competitive tools of the organisation (Day, 1992). The authors explicate in detail that marketing strategy can only be interpreted in a hierarchical structure. As per these, basic marketing strategy consists of the setting of the general objectives of the company and the long-term definition of those methods by which, with a proper management of the marketing function, these objectives can be achieved. While „partial marketing strategy” comprises of the definition of marketing objectives and the realisation of certain marketing activities (tools)”. (Bauer-Berács, 2006, pg. 537-538.). Hungarian approaches compared to western definitions are perceptibly less concrete in specifying the concept of business strategy and try to emphasise objectives, tools, engineering and decision-making, that is to say, motives having the widest semantic content. 3.4. Relevant strategic concepts from the point of view of the doctoral research Basically, the strategy concept of our doctoral dissertation was greatly influenced by the approaches of two authors. According to L. Jay Bourgeois, strategy can be depicted as an essential decision-making which determines the development of the relationship between company and its environment in the interest of reaching the objectives of the organisation. Compared to his academic colleagues, Bourgeois correlates strategy with environment to a greater extent and regards strategy as inseparable from external, operational conditions. In his epoch-making theoretical dissertation he discusses both strategy and environment in a dual-approach (Bourgeois, 1980a). He makes a distinction between the definitions of primary and secondary strategy and also between general and task-oriented approaches of environment. Primary strategy aims at the selection of the product/market and operational domain of the company, while secondary strategy refers to the proper choice and employment of competitive tools applicable in a given product category and customer segment. The general environment of the company implies the main variables of the macrosphere, whereas task environment includes the sectoral- and organisational level system of conditions and participants. According to Bourgeois, due to the dual, hierarchical structures of both strategy and environment, it is very difficult to create a generally interpretable strategic definintion. Therefore it is the task of researchers to develop a differentiated approach of strategy and emphasise which aspect of the concept is just to be inspected. The dual structure of strategy and environment and the interrelationship between them are illustrated in Figure II. In HPRDS examined in our dissertation, as a result of the liberalisation process between 2006 and 2011, such notable changes took place that modified to a great deal all six elements of the theoretical integration observable in Figure II, therefore Bourgeois’s theoretical frame is of extraordinary relevance from the point of view of our Ph.D. dissertation. In the literarure review stage of our dissertation, the strategic approach of Donald Hambrick, professor of Columbia University, was of the greatest importance to us. The fact that Hambrick is the most prestigious researcher of M&S’s strategic typology, which is the central theoretical construct of our doctoral research, contributed to our choice greatly. According to him, strategy is a consistent pattern of such important managerial decisions and actions, that 1) guides the company in keeping contact with the external environment 2) influences the internal structure and processes of the firm and 3) decisively affects the development of

25
business performance. (Hambrick, 1980). We emphasise that due to the research objectives of our dissertation we consider Hambrick’s definition as authoritative. We explain it by stating that the examination of the business performance exhibited by pharmacies pursuing various M&S’s SOs appears as priority in the empirical research and the summary of scientific literature of our dissertation as well, just as it does in Hambrick’s definition. 3.5. Summarising thoughts on the interpretation of strategy in business economics As a summary of the introduction concerning the definition of strategy we can make several statements. Business economics adopted strategy as „terminus technicus” to incorporate into its theoretical bases from the field of military sciences. The implementation of certain more important theoretical constructs and analogies proved to be fast and successful in the intensive competition and maneuverings for positions between companies. Definitions outline 4 frequently recurring motives in the approach of strategy. According to these strategy can be interpreted as a perspective, a plan, a position, or a certain behavioural pattern. These four approximations can be found in all of the definitions, yet one or the other is more stressed in turn (Ramos-Rodriguez – Navarro, 2004). It sounds a bit more sophisticated if we interpret startegy as a complex net of thoughts, ideas, inspections, experiences, objectives, expertise, perceptions and managerial expectations which serves as a guidance for the top management regarding what choices to be made in order to achieve the objectives of the company (Nickols, 2012). The semantic content of strategy contains both the achievable objectives of firms and the ways to achieve these objectives, yet in our opinion, the definitions of academics discussed put greater emphasis on the „how”, that is, the ways of achievement and the applicable competitive tools. According to the definitions we can say that strategy can be interpreted as a four-element structure. The first element refers to the set objectives, or the achievable final states. The second level contains a plan that assigns what resources a company must mobilise in order to fulfil the set objectives. The third element of strategy has a tactical implication as well, as it focuses on the capabilities of the company, which are the ways of applying these resources and competitive tools, while the fourth pillar is a detailed analysis of the assigned resources and capabilities. This way we might say that strategy and its related tactical programs serve as a bridge between company objectives and tools. Figure II. borrowed from Bourgeois finely illustrates the relationship between these four components. After the introduction and conceptual clarification of the rich semantic content of strategy, we can direct our attention towards the short historical overview of the strategic management discipline. 4. Introducing strategic management 4.1. A modern academic discipline Strategic management, as an academic discipline, is a young branch of science. Its research domain embraces the strategic behaviour of organisations, „i.e. the practice of business management based on the integrated unity of strategy-making, realisation and feedbacks” (Chikán, 2006, pg. 483.). The implementation of military-scientific results in the civilian sector led to the permeation of the conceptual kit of strategy in economics after the Second World War. Nevertheless the new management science could not have itself accepted in the academic sphere. The reason for that was the discipline did not have theoretical roots related to economics. The conceptual frames and methodological instruments, upon which it could

26
have based its consequences, were not ready. Therefore strategic management borrowed its theoretical foundations by alloying three important fields of economics. These were 1) business policy 2) industrial organisation and 3) organisational behaviour. Scientific research got under way in the 50’s and 60’s, due to the works of Ansoff (1957, 1965) and Chandler (1962), and the achievements of the scholars of the Harvard Business School (Andrews, Quinn, Christensen, Guth). The publications of descriptive (positive) approach relied on the experiences of case studies above all and focused on company growth, diversification and the necessary organisational reconfigurations (e.g. structure). The 70’s may be regarded as the most fertile period of strategic literature. During these years emerged those models and procedures (BCG portfolio-matrix, SWOT analysis, scenarios, etc.) that are often used even in today’s business consulting and that may be characterised with a normative profile chiefly, which were interpreted as a recipe for success by both researchers and managers alike (Tari, 1995). The „vogue” of normative school was later forced back and gave way gradually to exploratory and synthetising theoretical studies as well as scientific researches applying mainstream mathematical-statistical toolkit. 4.2. What does strategic management deal with? Objects of strategic researches basically fall under two groups (Miller, 1989, Chakravarthy, 1992). One stream of the scientific works examine the content and types of business strategies. It seeks to answer questions like these: What factors determine strategy? What competitive tools are used by companies following various strategies? How does the relationship develop between strategy and structure? What effect does strategy have on BP? etc. The other stream of academic inquiries treats strategy as a process and concentrates on its specific characteristics. The constructs of strategy-making (engineering), implementation, execution and control (feedback) are in the focus of its interest. Researchers of this stream are engaged in learning more about the followings: Who takes part in the engineering process? What techniques do they use in position or situation analyses? Do external consultants take part in the engineering process? Who are responsible for the realisation of strategy? According to which criteria do they monitor the implementation of strategy? etc. (Langley, 1988, Hart, 1994, Antal-Mokos et al., 1992). In the early stages of strategic management literature, researchers – due to the relatively predictable environmental conditions – focused on the procedural characteristics of strategy, decisively on the process of strategic planning. Following the crude oil price crises of the 70’s – although the importance of engineering still remained – in the 80’s the industrial and company-, and entrepreneurial-level examinations aiming at the realisation and monitoring of strategies took a greater role. Parallel to this, the research stream striving to explore the content elements of strategies in detail also settled. The two trends were not isolated from each other and did not operate separately of course, as there is a great number of studies in scientific literature that connect the content and formal aspects of strategies (e.g. to what extent do certain planning and engineering approaches result in business strategies with different contents, what effects does the fit of applied position/situation analysing techniques and chosen competitive tools have on BP etc. Mintzberg, 1973, 1978, Buzzell-Gale, 1987). 4.3. Research philosophies in strategic management According to prominent Hungarian strategy researcher, Zoltán Antal Mokos (1993) in the periods of strategic management literature a conflict between two, in many ways quite diverse

27
scientific approaches can be observed. Researches willing to meet the requirements of the rigorous expectations of „scientification” (validity, reliability and generalisability) employing quantitative methodological techniques on a high level, search for the relationships between the variables defined and operationalised within the internal/external environment of companies. Contrarily, the interpretative school applying qualitative research tools puts the emphasis on answering relevant, more „down-to-earth” and practical questions managers are concerned with. (Antal-Mokos, 1990). The disctinction experienced in the scientific approach of strategy may still be regarded as sharp. Even leading scientific journals of strategic management can be separated in that either empirical researches employing rigorous quantitative methodologies (e.g. Strategic Management Journal, Journal of Marketing), or interpretative, „case study”–type publications dominate their pages (e.g. Academy of Management Review, Academy of Management Journal, Administrative Science Quarterly). Of course, among strategic researches we could identify countless other philosophies or fracture lines, yet, by all means, at least one of them is worth mentioning. Academic examinations sharply stand apart by their interpretations of strategy and especially of the process elements (e.g. strategic planning) of strategy. As per sources of scientific literature, the content developed as a result of strategy-making and planning can be discussed from three stand-points: (Langley, 1988, Schwenk, 1988 in. Balaton, 1994):
1. Strategy, as a result of rational decision-making process 2. Strategy, as a product of organisational processes 3. Strategy, as a function of the political-power relations of the organisation
Naturally, the rigorous economic approach strives to describe strategy as a result of a rational decision-making process, while the interpretative school (mostly consisting of representatives of organisational behaviour) besides considering these factors, regards the organisational theory and management attributes and often – concerning the interests of certain special organisational stakeholders – the political aspects of strategy as priority (Cyert-March, 1963). Nevertheless, the above classification is for analytic purposes only, in business practice all three approaches are simultaneously present, with the domination of one or the other. (Antal-Mokos et al, 1992). As we already stressed in the previous chapter of our dissertation, the research orientation directed towards the search for optimal „one best way” type decisions – based on the rational assessment of production factors, resources and capabilities as well as environmental conditions – was forced back in the 2000’s. Authors mention three reasons for that (Powell et al, 2011). First, strategic management did not keep pace with the development of behavioural theories. Secondly, the theories of strategic management psychologically were not properly grounded. Finally, it was time to unite the disciplines of psychology and strategic management. (Hodgkinson-Healey, 2011). Still, the revival of behavioural approach did not necessarily result in the overshadowing of rigorous mathematical-statistical research: as a matter of fact, in many cases, the quantitative operationalisation of 40-50 years-old organisation-sociological and -psychological constructs may be regarded as one of the main characteristics of the new behavorist paradigm. (Levinthal, 2011). In spite of the abovementioned, the new behavioural scientific approach greatly eased the attitude of managerial decision-making that relied on mathematical-statistical modeling, based on the examination of a limited number of factors and which was theretofore dominant in strategic management. According to Levinthal (2011) we must accept that a theoretically

28
modelable optimal decision does not exist, since those model only a small part of the world („small world solution”) and that they ignore numerous existing practical factors. The latter phenomenon can be observed in the publications of Bromiley (2010) and Bromiley-Rau (2014) as well. Based on the Prospect Theory of Tversky and Kahnemann (1979), their researches examine more factors and employ less mathematical formulas. 4.4. The treatment of fracture lines Fracture lines observable in the discipline are reflected in academic studies as well, since the preferred approaches of strategic research to which they pay more attention are usually determined by the professional background and scientific objectives of authors. The resolution of fracture lines is by no means impossible though. In order to meet requirements of theoretical and methodological grounding as well as of promoting practical decision-making, academics need to be more sophisticated in approaching the concept of strategy as a unit of analysis. In international forums Henry Mintzberg (1978), in Hungarian literature Zoltán Antal-Mokos (1993) made successful efforts to do so, as illustrated in Table II. According to the table prior to examinations researchers have to clearly define the way they regard strategy, outline the objective and target audience of their research and that exactly which of Mintzberg’s strategic concept they consider to be the object of their empirical examination. Intended strategy implies the future strategic notions and plans of managers, while realised strategy is the actually exhibited behavioural patterns often different from ideas due to changing environmental conditions (Mintzberg-Waters, 1985). Content and formal aspects of both strategic concepts may be examined, the emphasis in the cases of all four cells of the matrix is put on whether academics are able to find the methodology fitting best the given strategic field and whether they are able to give reasons for the assumed relationship between process and content variables of intended and realised strategy, as well as what role rational and organisational-political determinants of the examined strategic constructs play. Antal-Mokos argues the conceptual and methodological universality of strategic researches and considers the effort to develop a unified-shallow adequation sytem of criteria futile, what is more expressly impractical (Antal-Mokos, 1993, pg. 104.). According to him, strategic literature has developed in a positive direction and after the millenium it is approaching the period of maturity. It has been outlined in the variety of academic works and the clear-cut definitions of specific objectives, examined constructs and applied methodological tools. The positive issue that academics often perform more significant research with the help of practicioners also supported this view. The involvement of managers in defining problems, constructing theories as well as in planning and executing research methodology greatly eased the conflicts between different research philosophies. As a result of the aforementioned, examinations directed towards the content and formal elements of strategy focused attention on the experimental knowledge, emotions, motivations, cognitions and subjective perceptions of external and internal environment etc. of managers (Ireland et al., 1987, Doty et al., 2006, Tsai-Huang, 2008). Bromiley and Rau (2014) suggest that the prevailing resources and capabilities-based paradigm (Resource Based View) should be replaced with a Practice Based View in which the experiences and skills of managers constitute the sustainable sources of competitive advantages and affect BP. The reflexivity and triangulation between the attitudes and interests of various stakeholder groups of strategic research greatly helped academics come up with real alternatives for

29
managers instead of fabricating perfect methodological works for their own micro-spheres (Van de Ven, 2007). This practice made it possible for internationally acclaimed researchers to be able to choose which interpretations and stressed aspects of the concept of strategy they should use in various circumstances of time, target audience, etc. Although researchers retained fracture lines, but by emphasising relationships between studies focusing on special strategic fields, they acquired significant synergy and „scientific fertility”. 5. Introduction of the positioning school 5.1. A short introduction of the research stream During the planning of our Ph.D. dissertation we decidedly relied on the conceptual basis of one of the most important stream of strategic management which is called positional school. Contrary to the stategy-making process, this trend treats the exploration of the content elements of business strategies as priority. In positional school, strategy is centered around so called heuristics, or procedures during which instead of exclusively applying rigorous mathematical-statistical methods, researchers starting from their premises draw their conclusions by experimental and logical arguments (Ronda-Pupo – Geurras Martín, 2012). Positioning school pays special attention in its consequences to managerial implications, that is, it formulates normative recommendations regarding company structure, competitive tools, administrative processes and further organisational factors that influence BP (Hortoványi et al, 2006). In the school Mintzberg distinguishes four main research streams which are illustrated in Table III (Mintzberg et al, 2005). In the case of positioning school we can observe the blending of intended and realised strategy in the semantic content and conceptual approach of strategy, although empirical researches so far have stressed the necessity and the manner of developing strategies (intended) in order to achieve outstanding BP, instead of describing the ways strategies develop (realised). In our research we dealt with the questions which are contained in the upper right cell of Table III, that is we examined the factor clusters of various strategic groups in a cross-sectional research, within methodologically static environmental conditions. 5.2. Strategic groups Strategic groups contain firms pursuing the same or similar SOs in a given industry. Strategic orientation (SO) refers to the way of internal and external environmental adaptation processes of companies, with special regard to the content elements of these processes (Chakravarty, 1982). Strategic literature is rich in sectoral and interindustrial studies that identify and characterise the SOs of competing companies in detail (Dranove et al., 1998). This research trend is rooted in the structural contingency theory of Max Weber (Weber, 1947) and its priority is the classification of schematic behavioural patterns observable in the environmental adaptation of companies (Ketchen et al, 1997). Academics often call these adaptation behavioural patterns strategic configurations referring to the importance of proper fit of numerous organisational and environmental factors (Van de Ven, 1976, Doty et al., 1993). It is notable that the new „behavioural approach” formulated more positive critics for the strategic classifications-based positioning school. According to the representatives of the new stream the sources competitive advantage and strategic orientations based on distinctive resources and capabilities – due to the effect of turbulently changing organisational,

30
environmental and managerial factors – are very plastic, they permanently transform, former ones cease to exist while new ones arise. Therefore, as per D’Aveni et al. (2010), instead of static positioning, strategy should be interpreted as „dynamic manoeuvering” in the modern age and managers eventually have to be ready to learn and acquire a variety of strategies to employ adequate solutions in order to adapt to environmental conditions. For this reason according to Bingham and Eisenhardt (2011) the number of SOs defined by certain typologies are permanently increasing and parallel to the fragmentation of classifications, the role of „unique” heuristics and „industry- and company-specific” SOs comes into the limelight. It’s important to notice that instead of the number of heuristics it is their quality that promotes proper business strategy. Bingham and Eisenhardt (2011) emphasise that heuristics based on simple rules lead to more rational strategies than those derived from analytic methods based on a complex lot of information. However, contrary to this, greater attention is paid to „hybrid” or „mix” SOs both in scientific and business context (Conant et al., 1993, Pertusa-Ortega et al., 2008). The application of these opens up the opportunity to implement as many parameters as possible to certain models and theoretical frames, moreover, the criteria and attributes which constitute a base for classification, according to the recommendations of the organisational-sociological and psychological approach, can be modified based upon subjective judgements on managerial personality, company size, market environment etc. As a result of positive critics and fertile intradisciplinary disputes, researches dealing with organisational configurations have become more suitable for exploring the relationship between strategy, external environmental and internal organisational factors and BP (Drazin-Van de Ven, 1985, Dess et al, 1993, Powell, 2011). In line with the above, conceptual and methodological bases of our research reflect on the changes that took place in the positioning school. Examples for this are 1) the relationship of SO and environmental uncertainty based on the subjective perception of pharmacists, 2) the appearence of the valorising dynamic manoeuvering in the context of turbulent environmental changes in HPRDS, and 3) the examination of „mix” or „hybrid” SOs (Gray et al., 1999, Doty et al., 2006). 5.3. The basic methodological approaches of the identification of strategic groups The strategic configurations of companies can be identified with two scientific approaches. M&S’s strategic typology (1978) and the classifications of Mintzberg (1973, 1978, 1979) and Porter (1980) were all elaborated on the bases of business case studies and in-depth interviews with company managers and sectoral experts with the help of „grounded theory” without „a priori” theoretical conceptions. This rather inductive approach using „lower-level” tactical- and operative elements observable in the behavioural patterns of firms endeavours to give a kind of „a posteriori” picture of the strategies of organisations (Morrison-Roth, 1992). The inductive approach often employs mathematical-statistical methods (e.g. cluster analysis) to classify firms into SOs based on similarities among their functional activities. From the theory-building view of our dissertation the use of M&S’s strategic classification as the central construct of the doctoral research means having a deductive approach, as we work out our conceptual model, research questions and hypotheses with the help of „a prori” theoretical notions. According to Ketchen and his colleagues, SOs obtained by deductive and inductive approaches can not be considered as inferior or superior to each other, because their distinctive power and predictive capability regarding the behaviour and BP of firms are quite similar (Ketchen et al., 1997). Contrarily, Doty et al. think that relevance and predictive power
31
of typologies having stable theoretical bases and identified by deductive approach surpasses that of strategic classifications determined by inductive technique (Doty et al, 1993). In our dissertation we deal with one of the most significant business taxonomies of the deductive approach, M&S’s strategic typology. A bit away from the traditions of the positioning school, our empirical examination focuses on the realised strategies currently followed by Hungarian pharmacies. Representing the normative profile of the positioning school we draw up managerial implications for pharmacists about which SOs result in optimal BP in an environment strictly regulated by governmental rules. 6. The strategic adaptation typology of Miles and Snow 6.1. Epoch-making strategic classifications Representatives of strategic management discipline have failed for a long time to develop theoretical frameworks capable of classifying SOs pursued by companies (Doty-Glick, 1994). However, in the last third of the XXth century several remarkable strategic typologies have been emerged, amongst of which the taxonomies of Miles and Snow (1980), Mintzberg (1973, 1978, 1979) and Porter (1980) are especially noteworthy. In contrast with Mintzberg’s typology characterised by internal orientation and by having a focus on the configurations of organisations, as well as with Porter’s framework which is rather featured by external competitor orientation, the taxonomy of Miles and Snow is distinguished by its comprehensive manner and it approaches firms as complex system-entities. Beyond the abovementioned frameworks, further classifications appeared in strategic literature, of which the typologies elaborated by Glueck (1976), Hofer (1980), Fayerweather (1981), Ohmae (1982), Miller-Friesen (1983) and Morrison-Roth (1992) are worth mentioning. 6.2. Changing environmental conditions Strategic typologies of management sciences used all around the world emerged primarily from observing firms that have been operating in relatively predictable environmental conditions – apart from a few, more turbulent periods (e.g. oil crises, privatisations) – in the past 60 years. The financial and enonomic crisis that broke out in 2008 led to varying extents of withdrawal in market coordination and to the strengthening of bureaucratic coordination mechanisms, which greatly influenced the strategic behaviour of companies as well (Kornai, 1983). Recession processes forced states and international communities to intervene following unconventional economic policies. The role of governmental authorities and their tools regulating the operation of firms are currently stronger than they once were in the Bretton Woods system (1944) or framed in the Washington Consensus (1989) (Stiglitz, 2010). This tendency, although in varying degrees, is observable in both developed and emerging countries. (Luo, 1997). For enterprises facing with more and more turbulent environmental changes (e.g. the evolution of information technology, the removal of trade barriers, increasing competitive intensity) environmental adaptation has become of key importance. The relevance of strategic typologies elaborated during the presence of less volatile macro-environmental factors was questioned by numerous researches (Smart-Vertinsky, 1984, Bourgeois, 1985, Hamel, 2009). Empirical examinations more often comprised countries and industrial sectors either characterised by turbulent environmental changes, crises or, where various regulatory authorities restricted the domination of market coordination mechanisms (Lou, 1997, 2001).

32
Because of this, the strategic adaptation of organisations has been enriched with the incorporation of several environmental variables. The theoretical framework of our Ph.D. thesis, the M&S’s strategic typology also focuses on the environmental adaptation process of organisations. In the M&S research stream we can also spot a faint, yet noteworthy shift toward the adaptation to the strengthening bureaucratic coordination’s numerous measures, and to the exploration of their impact on the BP of companies (Dyer-Song, 1997, DeSarbo et al, 2005). In studies where examinations also include companies not only operating in classical market economic conditions, authors try to come to terms on a traditional question of contingency theory, namely whether managers („managerial choice”) (Child, 1962, Augier-Teece, 2009), or environmental conditions („environmental determinism”) have a more determining effect on (the development of) business strategy (Kahn-Katz, 1966, Hrebiniak-Joyce, 1985). The characterisation of strategic behaviour regulated by various governmental laws is of special importance even in the case of HPRDS treated in our doctoral dissertation. 6.3. The adaptive cycle, as the central construct of Miles and Snow’s typology The central construct of the classification – which was elaborated by the professors of UC Berkeley (Miles) and Wharton Business School (Snow) – is the so called adaptive cycle, according to which companies need to come up with adequate solutions to three main problems (Miles-Snow, 1978). To the solution of the entrepreneurial problem the organisation have to define the products/services it would like to produce/sell and identify the market segments to target (“product/market domain”). By addressing the engineering problem, companies should develop a feasible operating system for the production and sales of their products/services (Miles et al., 1978). This includes the selection of production and distribution technologies and might extend over the engineering and operation of numerous other business activities – e.g. R+D, marketing logistics, IT – as well. The adaptive cycle’s third element is the administrative problem, where companies should form such mechanisms – e.g. (in)formalisation, (de)centralisation, specialisation, control, reward systems – which ensure the seamless running of systems set up at the entrepreneurial and engineering stages (Hage-Aiken, 1967). The adaptive cycle – according to the semantic reference of the terminology – can not be considered as a static concept. Depending on the changes of external and internal environmental factors, organisations continuously have to work out solutions to certain aspects of the entrepreneurial, engineering and administrative problems. Accordingly, in certain cases firms have to change their range of products, modify the production processes, or refashion organisational structure. Thus, the modification motive inherent in the adaptation process gives partly a dynamic feature to M&S’s strategic typology. On the other hand, the perpetually plastic nature of the adaptation process does not necessarily mean that companies do not develop more or less clearly identifiable, permanent, enduring adaptation patterns. These – consistent behavioural patterns that serve as alternative solutions to all three problems of the adaptative cycle – can be called SOs in the context of M&S. 6.4. The original strategic orientations of Miles and Snow The authors examined the market of textbook publishers in their first research. They discovered four relatively easy to identify enduring adaptation patterns (SOs) by observing

33
the environmental adaptation behaviour of companies. These were (Miles-Snow, 1978): „Prospectors”, „Defenders”, „Analysers”, „Reactors”. Below is a brief introduction of the profiles of these strategic orientations. 6.4.1. Prospectors Prospectors (“Kutatók“) continuously strive to identify new business opportunities, locate and target new product/customer segments. They consciously search for alternatives offered by changing environmental conditions, what is more, it is often these companies that proactively bring forth sectoral changes. Prospectors are leaders in R+D and product innovation and they try to avoid being committed to using a single-line production and distribution technology. Their continuous developments are accomplished in less hierarchical organisational mechanisms which are characterised by informality, decentralisation and low-levels of control. Regarding BP they primarily focus on market effectiveness (sales, market-share) and satisfying various customer needs with a wide range of products and services. 6.4.2. Defenders Unlike Prospectors, Defenders (“Védekezők“) consider the long-term service and exploitation of stable product/market segments as priority. Their range of products and customers are usually narrow, on the other hand, due to their standardised production processes and relatively homogenous product portfolio, they are able to provide, if necessary, quite wide, yet from the standpoint of the use of products, less colorful consumer groups mainly with mass market products. The primary focus of their production and distribution technologies is on maximising cost-efficiency, which, in many cases is the result of a perfectly developed single dominant technological process. In solving the administrative problem, Defenders want to ensure the maximum efficiency of production and distribution, therefore formal structures and rigid rules, centralised decision-making and the strict control of work processes are all characteristics of organisations pursuing similar SOs. 6.4.3.Analysers Standing in the middle of the strategic adaptation continuum, Analysers („Elemzők”), by seeking to create an optimal combination of strengths of Prospectors and Defenders, both want to ensure cost-efficiency and to leverage the potential lying in product innovation. Accordingly, they strive to keep their conventional markets and develop new ones simultaneously. In adapting product innovations they precautiously follow Prospectors, try to correct the mistakes of early entrants and to appear in the second wave of products with alternatives more satisfying to consumer demands. Their technological processes also fit this dual approach, since Analysers usually have two production and distribution technologies, ensuring flexibility and stability at the same time. Their organisational characteristics are quite heterogeneous: compared to Defenders, they are less formal and have less control, while, compared to Prospectors, their decision-making process is less decentralised. In many cases, the dual character of Analyser companies results in a matrix-structure. 6.4.4. Reactors Contrary to the prior three SOs, Reactors (“Reagálók”) are not capable of consciously developing a consistent behavioural pattern, which is crucial in successful environmental adaptation. Reactors in most cases do not have a clear, well-articulated strategy. Therefore, the

34
state of uncertainty and permanent instability are typical of them. They are able to carry out modifications only in the last resort, forced by external environmental factors. M&S basically give three reasons for classifying a company as a Reactor: 1) senior management is unable to formulate a clear SO, 2) organisational structure and processes do not fit properly the pursued SO, 3) in spite of turbulent environmental changes, senior management insists on maintaining the “status quo” by preserving outdated technology, organisational structure and the service of declining market segments. In Table IV, the more significant characteristics of M&S’s SOs have been gathered together according to the stages of the adaptive cycle. The main dimensions of the entrepreneurial, engineering and administrative problems have been adopted from the original research of M&S. After the questions concerning the problems and the answers provided by SOs at the end of each stage we have summarised the advantages and risks observable in the behaviours of Prospectors, Defenders, Analysers and Reactors. 6.5. Examples of Miles and Snow’s strategic orientations from the global business world To make it easier to interpret and understand the concepts of M&S’s Prospector, Defender, Analyser and Reactor SOs, it is worth mentioning real-life examples of companies pursuing the above SOs. Apple or General Electric are fine examples of the Prospector SO. Apple has been a leader in product-innovation for decades. In the market of home entertainment electronics (e.g. iPod, iPhone, iPad) the company considers persuading customers to accept its latest technological innovations quickly and keeping up a fast-paced global market penetration of its products as priorities. Due to technological obsolescence, the product/market domains of the company are subject to permanent changes. GE is an innovative corporation performing maybe the most diverse activities in the world. The American firm is present in almost all product/market segments, where it discovers unexplored business opportunities. GE holds firm positions in the fields of conventional and renewable energy sources, nuclear energy, financial and health services, information technology, lighting and also in the production of railway and air transportation equipments. We could write a long list of true examples of Defenders as well. American fast-food chain McDonald’s expects its guests with a very narrow product and service range quite cleansed by rational considerations from the beginning. It is well-known that the fast food chain’s back office processes are characterised by the highest level of standardisation, specialisation, control and quality assurance, that jointly result in an outstanding cost-efficiency for the company. In no way underestimating their R+D activities, we may regard as rather more classical Defenders those firms that operate chiefly in B2B sectors, like the American Intel or the German Knorr-Bemse. Not only the narrowing of product portfolio, but the low number of customers are also observable in their cases. Intel produces processors in huge quantities for a few leading computer producers, while Knorr-Bremse manufactures reliable brake-systems for a relatively small number of vehicle producers. These firms have been concentrating their resources and capabilities on their core activities for decades, their research and development efforts mainly aim at the improvement of their products and processes. One of the most successful example of companies pursuing Analyser SO is Toyota. The Japanese firm has managed to blend in its vehicles technological refinement, outstanding performance, high quality and reliability as well as the application of extremely specialised, highly controlled production and distribution systems ensuring maximum efficiency. The Japanese manufacturer was wise in bidding his time for a favorable opportunity regarding
35
which product innovations can remain permanently successful in the long run and drawing the consequences from mistakes of Prospectors, in many cases it was Toyota who introduced the first viable models of mass production (e.g. the hybrid drive-system Toyota Prius). Its success is proved by the optimum balance of outstanding financial and market BP indicators, for Toyota counts as the world’s leading automobile manufacturer according to sales and net profit (Fortune, 2014). Quite surprisingly, we can give examples of companies lacking a clear product/market domain and a consistent SO, exhibiting the behavioural patterns of Reactors in environmental adaptation, even among world-famous firms. American automobile producer syndicate, former autocrat for many decades, General Motors in the 2000’s gradually lost its competitive advantages. The company that ignored the changes in consumer demands almost completely „slept through” the quality, energy-saving-, and environmentally friendly trends of global automobile industry and in spite of having the widest range of brands available, it had to file for a bankruptcy-protection from U.S. administration in the 2008 outbreak of the financial and economic crisis. Is sounds astonishing, yet the model company in global information technology, leader in R+D, Microsoft frequently shows the characteristics of Reactor companies. It has continous difficulties in the penetration of the latest version of Windows in the operation system- market. Explorer slowly loses its popularity in the market of internet browsers, while in the search engine market Bing did not have such an impact as top management had expected. The operation period of Microsoft between 2011 and 2013 thus may be called a strategic strategic bottom, the firm now has hopes chiefly for the successes of the 8,5 Bn. USD-purchased Skype, the cooperation with Nokia, Windows Phone operation systems, cloud-based applications and B2B markets. At the same time we must make it clear, that according to researchers of strategic management, parallel to the decrease in firm size, the distribution of Reactors increases, therefore we can search for companies that underperform in environmental adaptation decisively in the small and medium sized entrepreneurial sector (Olson et al., 2005, Balaton, 2009). 6.6. The modification of the original typology M&S extended the their original, case-study like research which had studied textbook publisher companies and later included companies of three more sectors – food processing, electronics (semi-conductor production) and health care services – in their further examination (Miles et al., 1978b). Results clearly confirmed the identifiability of SOs. Besides, Walker and Ruekert (1987) in their article combined the strategic typologies of M&S and Porter with outstanding logical reasoning and theoretical grounding. Based on the type of competitive advantages, Defenders were divided into two groups of Low-Cost Defenders and Differentiated-Defenders. The profile of the first one is practically the same as that of the original Defenders, while Differentiated Defenders are characterised by serving a market niche consisted of an extremely narrow, stable consumer segment, which requires excellent quality products and additional services. The relevance of the above two types of Defender SOs have been confirmed several times – and in spite of the methodological shortcomings of their identifiability – they have been incorporated as bases of empirical examinations many times (Slater-Olson, 2000, 2001, Slater et al. 2005, 2006).

36
6.7. The importance of Miles and Snow’s typology The M&S typology – following the work of Michael Porter (1980) – is the second most often cited classification of strategic management discipline in the United States (Hambrick, 2003), while in Hungary both in the fields of education and scientific research it has attracted a rather small attention. Academics explain the persistent nature of the theoretical frame with numerous factors among which it is especially remarkable that although authors connected a number of aspects of company operations explicitly to environmental adaptation, they managed to preserve their holistic approach treating the organisation as an overall, complex system (Hambrick, 1983a) to the last. Therefore the implications of the typology prove to be scientifically well-grounded while preserving their easy-to-follow, normative nature which is interpretable to managers as well (Zahra-Pierce, 1990). 6.8. Early criticism Naturally, M&S’s strategic typology also possesses several weak points, among which it is absolutely necessary to mention that in spite of the holistic approach based on the concept of strategic configurations, there is only a limited set of organisational variables and sectoral environmental factors upon which the typology was elaborated (Bowman, 2008, Malik-Naeem, 2011). Hambrick in many of his studies (1983a, 1984) points out that the authors neglecting the rigorous quantitative methodology apparently explored an unambiguous relationship between certain resources, capabilities and the identified SOs, yet had no evidence supported with statistical arguments on the development of functional characteristics and BP of Prospectors, Defenders, Analysers and Reactors. According to these, the validity, reliability, generalisability and the BP implications of the taxonomy demand a permanent examination (Doty-Glick, 1994, Hambrick, 2003). Moreover, the typology to a great extent – though, by no means irreconcilably – conflicts with the prevailing paradigm of strategic management academic discipline, the approach of contingency theory. It basically reveals itself in two fields (Hrebiniak-Joyce, 1985): 1. As per contingency theory, specific environmental characteristics decisively determine
what SOs are observable in a given market (Katz-Kahn, 1966, Lawrence-Lorsch, 1967, Donaldson, 1996, Boyd et al., 2012). Contrarily, in the original research of M&S, after examining a limited number of firms from one, later altogether only from 4 sectors, authors would come to the conclusions that all four strategic behavioural patterns are present in certain sectors and that the distribution ratio of Prospectors, Defenders, Analysers are more or less the same, while the number of Reactors is insignificant.
2. Contingency theory establishes that specific sectoral factors determine, quasi select firms exhibiting permanently optimal BP (Hofer, 1975, Ruekert et al., 1985). On the contrary, studies of M&S did not examine explicitly, applying mathematical-statistical methods, the industrial specifications and unique characteristics of markets of either textbook-publishers, food-processing, semi-conductor production or health care services. At the same time, in their assumptions they declare that all three viable SOs (Prospectors, Defenders, Analysers) can be equally successful in any sectoral environment and their BP exceed that of Reactors in case of any environmental conditions (Miles-Snow, 1978).
In the following chapters of our dissertation we refer to the above contradictions related to M&S’s strategic typology several times and we plan to deal with their detailed examination in

37
testing our research questions and hypotheses. These objectives of ours are supported by the fact that the canon of strategic science and the managerial society both treat the examinations of environmental adaptation and BP of SOs as priority (Rumelt, 1972). 7. The classification of the researches of M&S’s strategic typology Scientific publications dealing with the characterisation of M&S’s strategic behavioural patterns and their BP implications basically fall into 5 groups according to their perspectives they approach the environmental adaptation of organisations with (Table V): 7.1. Early and profile-setting studies The pioneers of researches focusing on the examination of SOs discovered by M&S were from the circle of aquaintances of the authors (Snow-Hrebiniak, 1980, Miles et al., 1980, Hambrick, 1981, 1982, 1983). The first profile-setting publications intended to explore in detail the characteristics of Prospectors, Analysers, Defenders and Reactors. These aimed to identify the idiosyncratic features of SOs, while later the emphasis was put on determining functional (e.g. production, marketing, logistics, HR, financial) specifications and competencies. The profile-setting examinations in the 2000’s were carried out with a rather profile-expanding purpose to improve the development of behaviours of certain SOs observable in companies’ environmental adaptation. These articles examined such functional activities and special constructs like sales management, technological orientation, market research, personal characteristics of top managers, horizontal/vertical relationships etc. (Schenk, 1994, Slater-Olson, 2000, Kabanoff-Brown, 2008). 7.2. External environmental adaptation Studies focusing on external environmental adaptation (Snow-Hrebiniak, 1980, Hambrick 1983a, McKee et al., 1989, Forte et al., 2000, Desarbo et al., 2005, Short et al, 2007) try to find answers to questions regarding the distribution, development and performance of certain SOs in the cases of various industrial contingencies. Since marketing, as the boundary-spanning function of the company (Hutt et al., 1986, Zahra-Covin, 1993, Achrol-Kotler, 1999) plays a special role in the external environmental adaptation of organisations – in keeping contact with customers, competitors, strategic partners and regulatory authorities – these studies are basically dominated by the strategic marketing approach (Day, 1992). Due to our interest in marketing strategy, this dissertation concentrates on the exploration of the potential moderating effect of environmental conditions on the development of the relationship between SO and BP, therefore the BP implications of the external environmental adaptation of Prospectors, Analysers, Defenders and Reactors are to be dealt with in detail later. 7.3. Internal environmental adaptation Studies on internal environmental adaptation and strategic implementation explore the degree of match between various internal characteristics of companies, that is, the configuration of certain organisational variables and the pursued M&S’s SOs and its BP implications. In their epoch-making studies Gailbraith and Kazanjian (1986) and Venkatraman (1989) highlighted the importance of implementation based on the fit of strategy and internal processes. Over the 25 years that passed since then, implementation process of M&S’s SOs have been scrutinised from several organisational perspectives focusing attention on various internal constructs.

38
In short these were: resources and capabilities necessary for strategy implementation (Aragón-Sanchez – Sanchez-Marín, 2005, Desarbo et al., 2005, Short et al., 2007), personal characteristics of managers (Gupta-Govindarajan, 1984, Slater, 1989), unique specifications of strategic engineering and planning systems (Veliyath-Shortell, 1993), HR management policy (Miles-Snow, 1984, Rajagopalan, 1997), technological processes (Dvir et al., 1993, Schenk, 1994), characteristics of organisational structure (Vorhies-Morgan, 2003, Olson et al., 2005), control and reward mechanisms (Govindarajan-Fisher, 1990, Slater-Olson, 2000), the relationship between headquarter and SBUs (Golden, 1992, Narver-Slater, 1993), the role of lower-level decision-makers in the implementation of strategy (Floyd-Wooldridge, 1992) as well as top management consensus (Bourgeois, 1980c, Homburg et al., 1999b). Articles belonging to this group are basically characterised by the use of languages of organisation theory, organisational behaviour and classical management disciplines. 7.4. The depiction of top-performer companies The new wave of studies dealing with the assessment of BP and depiction of SOs propose to create the behavioural profile of Prospectors, Analysers, Defenders and Reactors exhibiting outstanding BP observable in certain sectors (Pleshko et al., 1995, Thomas et al., 1995, Slater-Olson, 2000, 2001, Olson et al., 2005). In such publications approaching from quite heterogeneous aspects, according to the empirical observation of several organisational and external environmental variables (organisational features of marketing function, behavioural orientation, personal traits of CEO, mature or emerging industrial environment, sudden environmental shock etc.) academics strive to give a more complete picture of the strategic configuration of top-performer companies. Such studies are dominated by the systems approach of strategic management discipline (Drazin-Van de Ven, 1985, Venkatraman, 1989). 7.5. Thought-provoking studies, methodological and review articles Besides the above research streams there are also such methodological works that intend to approximate the features of M&S’s SOs and their BP implications by applying „perfect” set of mathematical-statistical tools and qualitative research techniques. Additionallly, the more than thirty years old past of researches on strategic typology made it possible for academics to write „thought-provoking” articles (Walker-Ruekert, 1987, Hambrick, 2003, Malik-Naeem, 2011) and meta-analyses (Zahra-Pierce, 1990) summarising empirical experiences, drawing up limitations and potential, fruitful, future research directions. Table V illustrates the studies dealing with research on M&S’s strategic typology according to the above classification. Researches indicated in Table V dealing with various aspects of M&S’s strategic typology examined the traits of Prospectors, Analysers, Defenders and Reactors from the perspective of certain management functions (production, marketing, logistics, HR) and scientific areas (e.g. organisational behaviour). Our dissertation – targeting our research objectives – continues with the exploration of the most significant BP implications of M&S’s strategic typology. 8. The approach of business performance in strategic literature Of the practical relevance of M&S’s typology we can say that the development of the BP of companies pursuing certain adaptation patterns is of primary interest of managerial society (Lewis-Thomas, 1990). In strategic management BP is judged by the external and internal environmental adaptation of companies in the short and the long run (Chakravarthy, 1981). Scientific literature highlights that the environmental adaptation of a company can be assessed

39
by several aspects. These are (Chakravarthy, 1986): 1. To what extent does business strategy suit the characteristics of industry structure and
competitive context? 2. How does the organisational structure of a company fit the environment and the chosen
strategy? 3. How does the management system of a company suit the strategy and organisational
environment? 4. To what extent do managerial style and mechanisms „tailored” to strategic context? In our dissertation of the above assessment aspects we put emphasis on the first one. The reason for this is that in the empirical stage of the research we test the relevance of M&S’s strategic typology and examine its BP implications in a special sector, the HPRDS characterised by limited competitive intensity and a severe governmental regulation. Besides, pharmacies statistically count as micro and small sized enterprises, therefore in their cases it is difficult to interpret the organisational structure and management system constructs of the adaptive cycle’s administrative problem that have been employed rather in corporational context so far. Nevertheless, the management system, style and mechanisms formulated in points 2-4. can not be considered absolutely irrelevant in case of small enterprises either, although due to the strategic-level approach and BP-oriented focus of our dissertation we have paid very little attention to such organisational variables. 8.1. The definition and operationalisation of business performance The conceptualisation of BP may be regarded as a complicated issue of strategic management discipline. BP is a multi-dimensional construct lacking both a generally accepted universal conceptual base and an operationalisation mechanism (Chakravarty, 1982). Researchers in many cases are not only unable to approximate the concept of BP uniformly, but even the exact circumscription of the concept of business strategy proves to be problematic. Approving the definition of Donald Hambrick (Chapter 3.4.), our task is to paint a possibly most complete picture of the strategic operation of companies even in evaluating their BP. 8.2. The dimensions of business performance measurement To define the BP of companies, strategic literature usually employs such quantitative indicators and qualitative constructs that fit well one of the four theoretical categories below (Walker-Ruekert, 1987, Kaplan-Norton, 1996): 8.2.1. Effectiveness Market effectiveness is the success of the products and programs, actions, measures, campaigns of a company compared to its major competitors. By effectiveness we mean chiefly the extent of long and short-term realisation of business and marketing objectives (Bauer-Berács, 2006), since primarily it is the marketing function and customer perspective that play special roles in its development (Drucker, 1985, Kaplan-Norton, 1996). Effectiveness is measured most often with such indicators like SAL, market share, percentage change in SAL or market share, customer satisfaction, customer loyalty etc. 8.2.2. Efficiency
40
Efficiency proposes to quantify the profitability of companies. In economics, all efficiency indicators in a way measure the ratio of applied input resources to output products (Sajtos, 2004). The often used efficiency indicators are well-known from corporate finance literature: return on investment (ROI), return on assets (ROA), return on equity (ROE), return on capital employed (ROCE), return on sales (ROS), net profit after taxation etc. It is notable that in the past 20 years various management disciplines (marketing, HR management, logistics, IT) have made efforts to justify their strategic added value quantitatively. That is how for example shareholder value would emerge from among efficiency BP indicators that regard the interests of investors as priority and became a popular instrument in assessing strategies and tactical-level programs (Day-Fahey, 1988, Srivastava et al., 1999, Doyle, 2000). 8.2.3. Adaptability Adaptability is the response capability of firms to permanently changing external and internal environmental factors. It can be evaluated in various ways, its widely used indicators are (Barrett-Windham, 1984, Robinson et al., 1992): the successful launch of new products compared to major competitors in the market, percentage share of turnover generated by new products in total SAL, rate of workforce fluctuation during economic crisis or prosperity etc. 8.2.4. Innovativity Altough the definition of innovation is still based in many aspects on the production-oriented approach of Joseph Alois Schumpeter (1939), classic author of the subject, in regard with the strategic approach of our dissertation we would prefer stressing the consumer perspective of Peter Drucker. According to this, innovativity is the fast exploration of such market opportunities by companies like new knowledge, demographic changes, changes in attitude of consumers, structural changes of the industry, unexpected events, contradictions and process needs (Drucker, 1985). As the operationalisation of the innovativity performance indicators is quite complicated, researchers in many cases relied on applying such essential objective indicators as R+D costs compared to total expenditures or SAL of the company. 8.3. The time-horizon of performance dimensions Effectiveness and efficiency mostly evaluate past performances of SOs pursued by companies since they examine the market and financial results of realised processes expressed with various indicators. However, adaptability and innovativity, besides assessing the past market activities of companies, also try to inform us on the probable future strategic potential of organisations. Accordingly, BP indicator groups fit properly the various constucts of Kaplan-Norton’s „Balance Scorecard” (1996). Effectiveness and efficiency can be paralleled with the financial and operational dimension, while adaptability and innovativity show similarities with customer and learning/growth perspectives. 8.4. Interactions and research interest The development of certain BP indicator groups are naturally not independent of each other. For example, it is worth consdering that the outstanding adaptation or innovativity in the short run can result in increasing SAL, greater market-share and eventually higher return indicators as well (Buzzell-Gale, 1987). Researches examining M&S’s strategic typology evaluated the BP of SOs concentrating mainly on effectiveness and efficiency dimensions. The prior „simplification” is also supported by Hungarian strategic marketing literature with a proper

41
theoretical base that regards the following interpretations as priorities: „marketing efficiency is the return – usually expressed as a percentage of SAL – of marketing expenditures, while marketing effectiveness is the long term efficacy of the marketing objective set – which in most cases is equal to achieving proper and desired market position” (Bauer-Berács, 2006, pg. 19.). Table VI draws our attention to the variety of BP indicators applied in studies revealing the BP implications of M&S’s SOs. 9. The examination of the stochastic relationship between Miles and Snows’s strategic orientations and business performance 9.1. Early notions on the BP of Prospectors, Analysers, Defenders and Reactors The hereby dissertation amongst others subjects two hypotheses originally formulated by M&S concerning the BPs of Prospectors, Analysers, Defenders and Reactors to a detailed empirical examination (Miles-Snow, 1978): 1) The BP of Prospectors, Defenders, and Analysers in any cases – that is, in optional
industrial environmental conditions - exceed that of Reactors. 2) Prospectors, Analysers and Defenders are able to exhibit almost the same levels of BP in
any optional industrial environment, if the chosen SO is implemented in a consistent way. Although later researches would explore many other aspects of the BP implications of certain SOs, the analysis of the above two propositions at least implicitly emerged in almost all of the studies. The original propositions regarding the BP of Prospectors, Analysers, Defenders and Reactors are illustrated in Figure III. 9.2. Donald Hambrick’s modification: market effectiveness and financial efficiency M&S defined the dependent variable quite widely in their examinations of the BP of SOs. The operationalisation of the performance construct did not prove to be concrete either, authors employed a so-called general BP „terminus”, which must have been a composite index of market and financial indicators based on objective and managerial judgements as well. Hambrick, who modified the somewhat obscure BP implications of Prospectors, Analysers, Defenders and Reactors, in his empirical research highlighted that due to various adaptation capabilities the market effectiveness BP indicators of Prospectors exceed that of Analysers, Defenders and Reactors, while along the financial, profitability dimension the BP of Defenders surpassess that of the rest of the SOs (Hambrick, 1983a) as illustrated in Figure IV. 9.3. Bourgeois’ slack resource theory The debate in scientific literature regarding the BP of M&S’s SOs evolved with the headway of the concept of „slack” resources. According to Bourgeois (1980b), the set of „slack” resources implying flexibility, resilience or endurance of organisations decisively influences the success of environmental adaptation. Companies having too many slack resources necessary for environmental adaptation perform outstandingly in effectiveness, adaptability and innovativity aspects, whereas firms with insufficient adaptation resources, owing their stable product/market segment and standardised production processes excel in efficiency. As per this train of thought, we may suppose that in general Analysers, „qualified as „golden

42
means” can be regarded as the most successful companies and the BP of the 3 viable SOs of M&S describes a curve similar to the Gaussian one. (Figure V) (McKee et al. 1989). 10. External and internal environmental conditions influencing business performance 10.1. Primary factors Companies pursuing various M&S’s SOs are of course influenced by several organisational – and sector-specific factors. The examination of factors determining and influencing BP is a field of strategic management literature which brings about intensive research interest (Rumelt et al., 1994). Academics explain the variances observable in the BP of companies with the following factors, or so-called primary analytic levels (Short et al., 2007): Firm-effect is to be explored by researches (Wernerfelt, 1984, Barney, 1991, Song et al.,
2007) that explain the develoment of BP with the availability and use-pattern of the resources and capabilites of companies (Hamel-Prahalad, 1990) as per the interpretation of the resource-based theory of the firm (Penrose, 1959).
Strategic group effect assumes that according to the configuration of certain organisational
variables companies demonstrating similar environmental adaptation behaviour can be grouped into strategic clusters and one part of the variance in BP can be explained with belonging to a certain SO (Porter, 1980, Lewis-Thomas, 1990, Fiegenbaum-Thomas, 1995).
In accordance with the industry effect, BP of companies pursuing similar SOs and having
more or less similar resources and capabilities could differ from each other, which can be explained with specific factors (market turbulence, technological changes, perceived uncertainty, product-life cycle etc.) characteristic of the sectoral environment (Schmalensee, 1985, Rumelt, 1991, McGahan-Porter, 1997).
As per the effect of geographical factors, the BP of various companies are decisively
influenced by what settlements, regions, countries and international communities (e.g. EU, NAFTA, CIS etc.) they operate in (Krugman, 1991, Dunning, 1988).
In our dissertation we continue to deal with the examination of the relationships between BP and behavioural patterns observable in the environmental adaptation of pharmacies, and also with the determining influence of an environment characterised by strict governmental regulation and limited competitive intensity on BP. 10.2. Secondary factors The secondary, interorganisational analytic levels of BP evaluation are the following:
Corporate level Strategic Business Unit level Functional or departmental level
The development of BP may be influenced by the perspective, and the level of its approach by researchers. This primarily pertains to the distinction between the whole company and its

43
SBUs, since in these two fields various significant questions have to be answered. On the organisational level according to the interpretation of Bourgeois’ (1980a) primary strategy concept the main challenges are the proper selection and delineation of the firm’s operational (product/market) domain. Examining BP on SBU-level – as per the secondary strategy approach – they evaluate the selection and the way of application of competitive tools. In the case of pharmacies regarded as micro and small sized enterprises examined in our dissertation we can not use the above mentioned various analytic levels, as the corporate, business unit and departmental areas would be completely blurred (Jelen, 1995). Therefore in the followings, we plan to deal with external environmental and sector-specific factors influencing the development of the relationship between SO and BP. 10.3. The ideal environment of Miles and Snow’s strategic orientations As per the implications of the contingency theory which can be regarded as one of the dominant mainstreams of strategic management literature, external environmental conditions greatly determine the development of the BP of companies (Kahn-Katz, 1966, Starbuck, 1976, Ward et al., 1995, Doty et al., 2012). According to this, firms need to develop such adaptation behavioural patterns that fit properly the conditions of the operational environment of the enterprise. The degree of fit between SOs and external environmental conditions was treated as priority even in M&S’s strategic researches, since the idiosyncratic resources and competencies of Prospectors, Defenders, Analysers and Reactors in various contingencial conditions contribute to the development of BP to varying extents. Based on the experiences of empirical examinations, Prospectors have a greater frequency of distribution in sectors characterised by high technological and market turbulence, which are favourabe to their efforts to initiate new products and to locate and address new markets (Miles-Snow, 1978). Due to their innovative operation and their approach proactively influencing sectoral trends, they can „precede” dynamically changing consumer preferencies, therefore it may result in their outstanding market effectiveness. Unlike Prospectors, firms pursuing Defender SOs prefer stable, predictable technological, market, and legal environments (Hambrick, 1983a). It does not mean that they do not appear in sectors featured by either intensive growth or recession, yet what is worth mentioning in their case is that according to examinations, they are less able to adapt to sudden changes and radical shocks (Meyer, 1982). In less volatile markets they are able to exhibit optimal BP due to their stable, high-quality customer/supplier relationships and/or production efficiency. Analyser firms can operate both in stable, predictable and dinamically changing settings. As a result of their dual production and distribution focus, they react smoothly to significant changes in the market (McKee et al., 1989, Forte et al., 2000). Experiences show that Analysers are quite „resistant” organistaions, and can be found in prospering, stagnating and declining industries as well, although their more complicated business structures may eventually block them from successfully making substantial changes. Reactors also exist within various environmental conditions. We can locate companies with great ideas that use management techniques improperly in dinamically growing markets, just as well there are firms acting in haste in declining sectors. In spite of having the disantadvage of inconsistent environmental adaptation, still, there’s a potential in Reactors which, under critical and acute environmental pressures, may result in their taking proper strategic action.

44
These firms may be very flexible, as they lack a well-established, long-standing successful business model, the removal of which would lead to organisational resistance and sunk costs (Hawes-Crittenden, 1984, McKee et al., 1989, Dyer-Song, 1997). 10.4. The frequency of distribution of Miles and Snow’s strategic orientations The frequencies of distribution of Prospectors, Defenders, Analysers and Reactors have been collected in Table VII on the basis of the most significant M&S studies of the past 30 years. Although researches applied various identification techniques, results may put a different and interesting complexion on the relationship between sectoral environments and SO as well as on the effect of the degree of fit between environment and SO on BP (Hrebiniak-Joyce, 1985). Based on available data Table VII also indicates the absolute and relative distributions of SOs. The industrial, environmental features of the reviewed studies are included in Table VIII. As shown, the distribution of Prospectors, Defenders, Analysers and Reactors in sectors explored by various examinations – contrary to the early observations of M&S – is quite heterogeneous (McDaniel-Kolari, 1987, Conant et al., 1990, Desarbo et al., 2006, Song et al., 2007). In their original research M&S presumed that the distribution ratios of all three viable SOs in certain industries are almost the same and that they greatly exceed the proportion of Reactors. Though the general minority of Reactors seems unambiguous, on the ground of the results of Table VII and VIII answering the question whether there is a discernible relationship between certain sector-specific features (e.g. volatility, competitive intensity, innovatity, market turbulence, entry barriers etc.) and the frequencies of distribution of SOs would require a complete research in contingency theory, which is outside of our scope and possibilities. Still, a research question of what distribution ratios of Prospector, Defender, Analyser and Reactor pharmacies are observable in HPRDS strictly determined by governmental regulations seems to be an exciting one (Dye, 2004). 10.5. The introduction of industry-specific and environmental characteristics determining business performance of Miles and Snow’s strategic orientations The empirical examination of M&S’s strategic typology – as illustrated in Table VIII – were carried out in quite various industries. They studied the potential influencing effect of several sector-specific and environmental factors on the BP of Prospector, Defender, Analyser and Reactor companies. In the following we present a list of short definitons of the most often studied external factors which are related to the BP implications of SOs. Volatility: Markets of high volatility can be characterised by a hectically changing demand
and the fluctuation and irregular, uneven development of market growth rate. Moderately volatile markets are determined by a lower degree, yet permanent growth rate, while low volatility can be described as a stable market with contracting growth potential and declining sales opportunities (McKee et al., 1989).
Competitive intensity: In markets of high competitive intensity the number of sellers is
significant, entry barriers are low, product differentiation is less typical, so consumers have a number of purchase alternatives available to satisfy their needs (Porter, 1979). In case of low competitive intensity the number of participants of the supply-side is limited, thus consumers trying to satisfy their needs and preferences are compelled to turn to a narrow company population. In case of high competitive intensity the competition between firms is
45
determined by powerful promotion, cost-efficiency and a price-based competition, where competitors can easily reproduce each other’s offerings (Jaworski-Kohli, 1993).
Technological turbulence is the degree of the rate of change in engineering and
technological conditions in the production and distribution structure of a certain sector. The greater the degree of technological turbulence, the faster is the obsolescence of products, though the possibilities of customer value creation are also greatly increased (Dvir et al., 1993, Narver-Slater, 1990).
Market turbulence: In markets characterised by high turbulence customers and the composition of their needs and preferences change in a fast pace. Companies operating in similar settings often modify their range of products in order to meet the requirements of permanently changing customer needs (Narver-Slater, 1990, Slater-Narver, 1993).
Sudden environmental shock is a hardly definable and operationaliseable construct
influencing strategic behaviour and BP. Compared to high volatility and powerful turbulence it modifies the operational mechanism and the „way of doing business” of a given sector and its participants more significantly and radically. As for shocks, we can distinguish external (e.g. oil price-boom, nationalisation) and internal (sectoral, interorganisational) sudden, drastic changes (Mankiw, 2003), although both have significant effects on the behaviour of companies and the pressure of their environmental adaptation. The adaptation of M&S’s SOs have been examined in case of several environmental shocks: e.g. medical strike (Meyer, 1982), tightening supervision of banks (Fox-Wolfgramm et al., 1998), modified financing of health-insurance funds (Barrett-Windham, 1984, Forte et al., 2000), the appearance of generic private label brands (James-Hatten, 1995) etc.
Degree of sectoral innovativity: As per the interpretation of the customer-oriented approach,
innovation is a change taking place in macro-environment, industry or within organisation which is related to customer value creation and a higher level quality service of consumers (Drucker, 1985). Strategic management literature operationalise this sectoral factor most often by quantifying the modern production and distribution methods of new products and services introduced in the market in the examined period, perhaps by their share realised in market volume or sales (Hambrick, 1983a).
Products and industries in different stages of life-cycle: The special conditions (different
competitive intensity and competitive tools etc.) of the various stages of life-cycle may have a significant determining effect on the BP of companies in different stages of the life-cycle – introduction, growth, maturity, continuance, decline, renewal – operating in diverse sectoral environments and offering different ranges of products (Vernon, 1966). The discipline of strategic management most often declares a product or sector as belonging to a certain life-cycle on the basis of sales volume or growth rate of turnover (Hambrick, 1983b, Anderson-Zeithaml, 1984, Conant et al., 1989).
Deregulation: Governments turn to deregulation if they intend to increase competitive
intensity in a monopol or oligopolistic market structure. This means the moderation of entry barriers, the cancellation of targeted governmental subsidies, the suspension of price ceilings and the redundant rules concerning products and services (Varian, 2004). The strategy of companies in sectors liberated from the limitations of regulations radically change resulting in a significant effect on their BP (Snow-Hrebiniak, 1980, James-Hatten, 1995, Vorhies-Morgan, 2003).

46
Regulation: Contrary to deregulation, the regulation of sectors is the tool of minimising the
negative effects of externalities induced by natural monopolies and oligopolies (Bod, 2003). In many cases it means the – often unreasonable – protection of a company or a whole sector regarded as highly important from a certain aspect. Whether it is about a reasonable governmental intervention, or an unnecessary shielding, authority measures greatly determine the development of companies’ SO and BP (Snow-Hrebiniak, 1980, Pleshko et al., 1995, Shortell-Zajac, 1989, Ghobadian et al., 1998).
Prosperity or recession period: Cycles of prosperity are observable in real economics and
have been studied by representatives of neoclassical economics (Kondratieff, 1925, Keynes, 1936, Solow, 1956 Kehoe-Prescott, 2007). The theory concerning these cycles not by chance drew attention in various disciplines of business administration, including strategic management as well. The adaptation behavioural patterns of companies are subject to changes in the periods of both economic upswing and downturn. Academics in most cases tried to discover the BP implications of the SOs of companies operating in recession environments. Researches carried out in recession waves contrast BP of companies concentrating on the preservation and most efficient reorganisation of their basic profiles, and firms interpreting environmental changes of crises as opportunities to be „seized”. (Hambrick, 1983a, Dyer-Song, 1997, Desarbo et al., 2005).
10.6. Special influencing factors On the other hand, the development of BP exhibited by companies may be significantly influenced by further factors – widely used in strategic management – such as:
The type of selected BP indicators: In judging the BP of SOs it is an especially important
aspect, since they lay different emphasis on effectiveness and efficiency. Prospectors focus rather on the former, Defenders on the latter (Hambrick, 1983a), while Analysers strive to keep an optimal balance between the two BP dimensions (McKee et al., 1989).
Time-horizon of performance assessment: Long and short term time horizons presume the
priority of different BP indicators and they also determine those to a great extent. It is worth considering that the achievement of higher market share in the short run most often demands high investments, which decreases profitability (Anderson-Zeithaml, 1984).
Subjective vs. objective BP indicators: BP indicators based on subjective managerial judgements might differ from those recorded in objective sources (balance sheets, profit and loss accounts, cash-flow reports etc.). Then again, numerous researches justified that the divergence between the subjective evaluation of company managers concerning BP and objective indicators did not prove to be significant (Morgan et al., 2004).
Stakeholders: Investors, managers, employees, tax authorities, governments, local
communities, non-govermental organisations, trade unions, greens and many other organisations are concerned with various types of BP indicators (Chikán, 2003).
Company size: Several authors pointed out the relationship between firm size and BP (Smith
et al., 1986, Buzzell-Gale, 1987). According to PIMS researches companies with higher market share also realise higher sales, which due to the competitive advantages of scale-economies is accompanied by increasing return indicators mostly. Company size is
47
operationalised by scientific literature according to the sales, equity capital or the number of employees of the company.
Ownership structure: The identity of owners, percentage of their share, objectives, mission,
and vision decisively determine the judgement of the importance of applied BP indicators, just as they do the development of BP and SO of the company. Strategic literature considers it salient in researches to distinguish between private and national property, professional and financial investors, private, individual and institutional owners, family vs. non-family property as well as making distinctions regarding nationality or cultural background of owners (Chaganti-Damanpour, 1991, Yip et al., 1997, Spector et al., 1998, Hofstede, 2001, Peng et al., 2004).
Geographical location: As a result of the significant differentiation of income disparities
and consumer needs and preferences there are very few enterpises whose SO and BP are not influenced by its location of operation. GL can be interpreted on global (continents, international communities) macro- (country, regions within country), meso- (smaller regional units, settlements) and micro- (settlement areas, street, building, location or placement within a store etc.) level, although GL gains a special interpretation almost in each sector. In defining BP in the oil-industry e.g. due to transportation, refinement and network capacities it is mainly the global and macro factors, while in HPRDS treated in our doctoral research it is the meso- (the type of settlement in which a pharmacy operates) and micro-level geographical factors (e.g. it is located in a shopping mall or close to a healthcare center) that can be regarded as crucial (Krugman, 1991, Gimenez, 2000, Szabó, 2009).
The structural-, technological- and competitive intensity etc. characteristics of industries
examined or compared: Sectors have strikingly different features, so in examinations where researchers compare the strategic behaviours of companies operating in a variety of sectors, the multitude of special industrial characteristics may influence the success of the environmental adaptation of firms (Buzzell-Gale, 1987). Therefore tracking down and applying sector-specific BP indicators and their influencing factors are feasible in studies. (Rumelt, 1991, McGahan-Porter, 1997, Ghobadian et al., 1998, Andrews et al., 2006).
10.7. Control variables Filtering the effect of sector-specific control variables that greatly influence BP, the practical interpretation of results is getting a bit unrealistic, though it might shed proper light on the connections between certain organisational variables and their influences on BP. Researches uncovering BP implications of M&S’s SOs aimed at controlling for the effects of company size (SAL and the number or employees), GL, ownership structure and the field of activities (e.g. manufacturing or service) on BP to serve as a guide for managers of Prospector, Defender, Analyser and Reactor companies in achieving the formulation of consistent strategic configuration and in realising outstanding BP (Hawes-Crittenden, 1984, McDaniel-Kolari, 1987, McKee et al., 1989, Short et al., 2007). After a detailed introduction of various sector-specific and external environmental conditions and their effects on BP of enterprises, the BP implications of M&S’s SOs can be evaluated in a more sophisticated aspect. In the following chapter based on the experiences of intra- and interindustrial examinations of the past 30 years we aim at assessing the development of BP exhibited by Prospector, Defender, Analyser and Reactor SOs.
48
11. The business performance of M&S’s strategic orientations Table IX summarises the empirical results regarding the development of the BP of M&S’s SOs. In accordance with the priority of the dissertation – instead of presenting the fragmented BP implications in detail – we paid special attention to the two original propositions of M&S. These were: 1) The BP of Prospectors, Analysers and Defenders exceed that of Reactors, as well as 2) Prospectors, Analysers and Defenders exhibit almost qually the same BP. 11.1. Miles and Snow’s first presumption According to the results of empirical studies on M&S’s first BP proposal we can say that a significant part of researches – because of the problematic identifiability due to their inconsistent strategic approach – does not deal explicitly with Reactors, so regarding their BP compared to the three viable SOs they do not settle anything noteworthy. This is a serious insufficiency of these articles, since making known the means of shift towards the direction of conscious strategic behaviour and the formulation of recommendations concerning the improvement of suboptimal BP for managers of similar companies would result in significant implications (Miles-Snow, 1994). Secondly, we can clearly point out that the overwhelming majority of empirical examinations integrating Reactor companies as well justified that the BP of Reactors in most sectors even under the influence of various environmental affecting factors consequently falls behind the BP of Prospector, Analyser and Defender companies (Hambrick, 1981, 1983b, Parnell-Wright, 1993, Desarbo et al., 2005, Kabanoff-Brown, 2008). This has been confirmed in the most various primary, secondary and tertiary sectors, especially if a given sector was not exposed to major shocks. Thirdly, within exceptional environmental conditions Reactors can also exhibit outstanding BP and occasionally outperform Prospectors, Analysers and Defenders. Such sectors may serve as examples for this which, as a result of the operation of some governmental regulatory organisations are relatively protected and can be characterised by low competitive intenstiy (e.g. the American air transport market of the 1970’s) (Snow-Hrebiniak, 1980, McKee et al., 1989, Forte et al., 2000). It is notable that according to studies examining the adaptation to shocks, Reactors are faster and more effective in surviving turbulent periods than Defenders which are also sensitive to drastic environmental changes (Hawes-Crittenden, 1984, McKee et al., 1989, Dyer-Song, 1997, Forte et al., 2000). 11.2. Miles and Snow’s second assumption The empirical studies examining M&S’s second observation regarding the equal BP of SOs were far from producing unambigous results. The articles that confirmed the equal BP of Prospectors, Analysers and Defenders are in minority (Smith et al.,1989., Conant et al., 1990, Vorhies-Morgan, 2003). Because of the various results, the introduction of the BP implications of M&S’s viable SOs demands a differentiated approach. In most industries featured by moderate volatility, Analysers seeking to keep balance between effectiveness, adaptability, innovativity and profitability BP indicators proved to be the most outstanding companies (Snow-Hrebiniak, 1980, James-Hatten, 1995, Kabanoff-Brown, 2008). This does not necessarily mean they accomplished the maximum in all dimensions, but performed well above average, so on the whole their BP may be regarded as optimal, thus
49
opposed to M&S’s proposition, the hypotheses of Bourgeois’ (1980a) „slack” resources concept seem to prove true. In case of indicators pertaining to market effectiveness, adaptability and innovativiy we can establish that the BP of Defenders – apart from two researches conducted in turbulent environments (McKee et al., 1989, Dvir et al., 1993) – successively lags behind that of Prospectors and Analysers. The opposite of this statement – according to which Defenders outperform the rest of the SOs in the efficiency dimension – in contrast with Hambrick’s assumption is by no means verifiable, since in numerous sectoral settings they failed to approach Prospectors and Analysers with regard to profitability as well (Hawes-Crittenden, 1984, Veliyath-Shortell, 1993). Of Defenders we can say that although they may be prosperous in many sectors, they prove to be most outstanding in merely just a few ones. It is difficult to make pivotal statements regarding the BP of Prospectors and Analysers. In general, along general BP and its efficiency dimensions it is Analysers, whereas in market-effectiveness it is Prospectors that prove to be more successful (Robinson et al., 1992). Nevertheless in efficiency indicators the disadvantage of Prospectors is more significant than the difference observable to their advantage concerning effectiveness. In volatile sectors characterised by turbulent market and technological changes both adapt well to such conditions (Meyer, 1982, Forte et al., 2000), while in periods of recession the position of Analysers is more stable (McKee et al., 1989). In sum, regarding the proposition of contingency theory formulated in an earlier stage of our dissertation, based on the results of M&S researches we can say that Prospectors, Analysers and Defenders can potentially exhibit optimal BP in any environments (Miles-Snow, 1994). However, various sectoral contexts are favorable to the resources and capabilities of certain SOs, while to others they are less beneficial (Boyd et al., 2012). This is the cause for certain strategic behavioural patterns in certain sectors realising outstanding BP in large numbers, while other SOs obtain only moderate performance results. Thus the answer to which of the three viable SOs lead to outstanding BP is indeed, but only partly can be regarded as a determining effect of environmental, industry-specific characteristics. 11.3. The profiles of „top-performer” organisations 11.3.1. Strategic configuration A great deal of researches ignored the examination of BP variations observable within certain M&S’s SOs (Cool-Schendel, 1988). The reason for this is researchers treated various SOs as homogeneous categories. Companies were often classified according to four idealtypical behavioural patterns created by academics which were not accurately distinguished from each other methodologically, therefore differences regarding behaviour and performance within certain adaptation patterns were blurred. M&S in their original work established that they interpreted Prospector, Defender, Analyser and Reactor companies as the idealtypical configuration of external environmental, and interorganisational variables, that is to say, as „pure” SOs (Miles-Snow, 1978). By doing so they implicitly admitted the disparities – as experienced in the behaviour of environmental adaptation – within certain SOs and even the existence of the so-called hybrid adaptation patterns which had been shaped by the combination of behavioural characteristics. (Pertusa-Ortega et al., 2008).
50
11.3.2. Fit theory As per the fit theory that examines the configuration of organisational and environmental variables (Van de Ven, 1976), companies must aspire to develop a perfect configuration. At the same time, defining this can not be called as an obvious task. The strategic classifications of M&S and Porter presume that approaching idealtypical strategic patterns is a desired objective for companies, as they can exhibit maximum BP in this case (Forte et al., 2000). On the contrary, more rigorous representatives of the contingency theory (Mintzberg, 1979) maintain that besides fitting a pure strategic configuration, „adjusting” the organisation to permanently changing environmental conditions is at least as much cardinal. The latter do not necessarily correspond with the environmental characteristics of idealtypical SOs and does not automatically assume the priority of developing idealtypical configurations. It is an interesting question whether the shortcomings of the fit to given environmental characteristics or the deviation from the idealtypical, pure strategic configuration leads to greater BP fluctuation to organisations, but it goes beyond the length limits of our Ph.D dissertation (Pinto-Curto, 2007). What we can state is a great number of researchers agree that presuming a simultaneous, perfect fit to idealtypical SOs and environmental conditions seems quite improbable and illusory. The majority of adaptation patterns are hybrid organisational configurations that try to approach the pure profiles of Prospectors, Defenders, Analysers and Reactors, as well as those environmental conditions which are favorable to them. Companies classified into the same SO can not be considered strictly as a homogenous population either, as each organisation represents a specific configuration. Thus the extents of their fit to the idealtypical SO and environmental circumstances also differ, which may lead to BP differences even within given SOs (Veliyath-Shortell, 1993, Pinto-Curto, 2007). 11.3.3. The characteristics of the most successful business practices The description of the most effective and efficient business practices observable within various SOs, as well as the circumscription of the behavioural profiles of top-performer Prospector, Defender, Analyser and Reactor companies would transcend the limits of our dissertation. Besides presenting the theoretical grounds of the question, we summarised in the form of a table (in Table X) the ways former researches characterised companies pursuing the same SO and exhibiting at least optimal BP. We must emphasise that the number of dimensions of analysis – based on which academics describe the organisational profiles of top-performer companies – is still very limited (35-40), since this quite new stream of empirical research which have produced relatively few studies so far, have not revealed all aspects of organisational operation either (Segev, 1989). Due to their suboptimal BP and frequent exclusions from inspections Reactors are not included in Table X, while Defenders appear in Walker-Ruekert’s breakdown (Low-Cost and Differentiated Defenders). Following the overview of the development of BP exhibited by M&S’s strategic behavioural patterns, we present the third significant theoretical construct of our dissertation – PEU – in the context of SO and BP. The BP implications of the extent of fit of SOs and evironmental conditions is to be discussed later in details, since one of the main empirical objective of our Ph.D. dissertation is to discover the moderating effect of PEU by pharmacy managers and GL of pharmacies on the relationship between SO and BP.

51
12. Perceived environmental uncertainty In the description of M&S’s strategic typology we stressed that according to the representatives of contingency theory (Lawrence-Lorsch, 1967, Miller-Friesen, 1983, Russell-Russell, 1992) internal (organisational) and external environmental factors greatly determine what SOs are pursued by the companies of a given sector. In addition, as per their reasoning, the exhibited BP of Prospector, Defender, Analyser and Reactor companies are also more or less influenced by various internal and external environmental conditions, as well as by the development of the behaviour of stakeholders having a decisive effect on the operation of a given sector. Thus the combination of contingencial conditions determine which SOs will be successful and which ones will be less effective/efficient in a given competitive context. On the contrary, representatives of another mainstream of strategic management assume that it is rather the subjective decision and conscious strategic choice of managers that influence various aspects of how they observe and perceive operational environment (Child, 1972, Starbuck, 1976). Accoring to „managerial choice” theory, it is neither environmental conditions, nor the behaviour of stakeholders that determine the SO to be pursued, but the choices of managers. Choosing a strategy that fits the subjective professional knowledge and skills as well as the business policy attitude of managers is not only equal to the perception of the environment, but also implies a proactive influence on the elements of the industrial context (Sharma-Vredenburg, 1998). Similar researches of the scientific literature seek to answer whether perceived environmental factors or conscious managerial choices determine SOs pursued by organisations more heavily (Hrebiniak-Joyce, 1985, Boyd et al., 2012). Accordingly, the interdependence between environment and SO is represented with more emphasis in the conceptual model and operationalisation mechanisms of our dissertation as well (Khandwalla, 1972). Regarding that M&S’s classification is rather based on the implications of John Child’s „managerial choice” theory, in our thesis directed towards identifying strategic behavioural patterns observable in HPRDS we put theoretical construct of PEU by phamacists in the center of our focus of attention (Duncan, 1972, Downey et al., 1975, Buchko, 1994, Agbejule, 2005). 12.1. About perceived environmental uncertainty in general In order to select and pursue a consistent SO, company managers have to interpret factors observable in external and internal environment adequately (Sharma, 2000). Strategic management literature basically typifies changes experienced in external environment according to five criteria (Dess-Rasheed, 1991). The first one is the simple vs. complex continuum, where the former means that the operation of the enterprise is influenced by only a few external factors and behaviours of stakeholders, whereas in case of the latter, the number of these effects is quite considerable (Lukas et al., 2001, Tan, 2002, Tan-Tan, 2005, Gotteland-Boulé, 2006, Kabadayi et al., 2007). The second feature is stable vs. unstable, pertaining to what extent the changes of these factors and the behaviour of stakeholders of the external environment are predictable or uncertain (Miller, 1988, Venkatraman-Prescott, 1988, Yeung et al., 2013, White et al., 2013). A third dimension of analysis captures the rate of change in external environmental conditions and stakeholders’ behaviour and examines these on the basis of their pace and how long they take (McArthur-Nystrom, 1991, Zahra, 1996, Pelham, 1999, Menguc-Auh, 2008, Bechor et al., 2010).

52
The fourth one refers to the hostile or proponent nature of the development of external conditions and behaviour of affected groups from the standpoint of a company („hostility vs. munificence”) (Miller-Friesen, 1978, Goll-Rasheed, 1997, Zahra-Bogner, 1999, Davis-Walters, 2004, Nandakumar et al., 2010). The fifth variable describing PEU is quantity and quality of information available to decision-making managers (Aguilar, 1967, Hambrick, 1982, Starbuck-Milliken 1988, Daft et al., 1988, Newkirk-Lederer, 2006). Based on the above, idealtypically we can say that in case of a predictable development and supportive attitude of a small number of environmental factors and stakeholders, as well as the availability of easily accessible, relevant and large amount of information gathered from the environment, executives perceive the operational setting of their firms predictable and stable (Milliken, 1987, Priem et al., 2002). Conversely, an operational environment characterised by numerous and rapidly modifying factors and „hostile” stakeholders demonstrating turbulently changing behaviours, as well as the hard availability of relevant information, is perceived by managers as unstable and unpredictable. (Duncan, 1972). A management activity performed by companies to understand environmental processes is a more or less conscious, formal or informal environmental monitoring (Hambrick, 1982, Jennings-Lumpkin, 1992, Boyd-Fulk, 1996), during which managers and other internal stakeholders collect, scan and analyse external environmental stimuli, changes and trends going off there. Compared to the behaviour observable in environmental monitoring activities of corporations, managers of micro, small and medium size enterprises rather rely on (their) personal contacts and informal channels in interpreting external environment (Smeltzer et al., 1988, Beal, 2000, Némethné, 2010). Aguilar’s (1967) study oriented to explore external environmental factors points out that managers turn primarily to subordinates and colleagues if they wish to learn or interpret something about their external environment. Additionally, the article also draws attention to the importance of loose and informal ties with customers, suppliers and competitors. As Kemelgor et al., (2011) noted it is especially typical of micro, small and medium sized enterprises that managers – to interpret the behaviours of environmental factors and stakeholders appropriately – provide themselves important information through a network of close, personal contacts. Naturally, emerging sectors described by high growth rates either recession or strong governmental regulation can be regarded as more uncertain (Luo, 1997, Yeung et al., 2013, Wang et al., 2013, White et al., 2013). The unpredictability of the behaviours of external and internal environmental conditions and relevant stakeholder groups is further increased by structural reconfigurations, large-scale governmental interventions, transformations and authority regulations observable in certain sectors, just as those we could witness in the past years in HPRDS treated in our doctoral research. Many authors (Forte et al., 2000, Zinn et al., 2008, Matanda-Freeman, 2009) confirm that companies operating in similar settings perceive a greater extent of environmental uncertainty. At best, they reply to uncertainty by a more flexible solution promoting permanent adaptation, at worst they give a more „plastic”, inconsistent strategic response. Conversely, companies facing stable contingencial conditions and a more predictable behaviour of stakeholders pursue a more clear, more obvious and a more robust SO (Lester-Parnell, 2007, Mintzberg-Waters, 1985). Strategic management literature abounds in implications rather concerning the PEU of big corporations so in this regard (too) little attention has been paid to the examination of micro

53
enterprises. Micro, small and medium sized firms targeting mostly „niche” markets are usually featured by more stable and less complex perceived environmental conditions by scientific literature (Freel, 2005, Balaton, 2009, Matanda-Freeman, 2009). As a result of their narrow operational focus as well as their limited resources and capacities they can perceive and process only a very small number of environmental conditions and are less able to recognise the need for participation in the complex „race for information” (McGee-Peterson, 2000). Many empirical studies highlighted that such enterprises lacking resources and competencies having ventured into unpredictable and unfamiliar environmental conditions, they would exhibit suboptimal BP (Babakus et al., 2006). 12.2. The relationship between perceived environmental uncertainty and SO Research on the interaction between environment and strategy emphasises that environmental factors do not affect SO of companies in their „pure”, objective way but through the filter of managers (Child, 1972, Buchko, 1994). The different subjective perception of environmental factors and the behaviour of relevant stakeholder groups can lead to a variety of managerial interpretations of identical industrial contingencies, and a result in various strategic decisions as responses (Hambrick, 1981, Meyer, 1982, Forte et al., 2000, Desarbo et al., 2005). Earlier studies also analysed the interrelations between PEU and SO (Miles et al., 1974, Bourgeois, 1980a, Badri et al., 2000, Bastian-Muchlisch, 2009). According to Parnell et al. (2000), enterprises pursuing a „balancing” SO (for example Analysers) perceive different aspects of their operational environment to be more predictable than companies pursuing other SOs. M&S’s strategic theory is in accord with this train of thought as well. Managers of Defender companies perceive contingencial conditions to be stable, so such firms appear most likely in the midst of predictable environmental contexts (Miles-Snow, 1978). The idealtypical behavioural attributes of Prospectors on the far end of the strategic continuum benefit from dynamic, changeable industrial-operational conditions, because their managers regard certain elements of environmental turbulence as business opportunities to seize (Gray et al., 1999, Namiki, 1999). Defenders direct much attention to develop an efficient production and distribution structure for their conventional product/market segments in an environment that is predictable and ideal for them. However, when environmental factors change, they tend to try to avoid dangers by taking measures increasing efficiency and they keep away from innovations demanding allocations of significant resources (Hambrick, 1983a, Laugen et al., 2006). Prospectors on the other hand do not focus on defense against threats in response to intensification of the turbulence, but rather on proactively identifying and locating new product/market opportunities, although they have difficulties in standardising their operational processes and increasing their operational efficiency under stable environmental conditions (Miles et al., 1978, DeSarbo et al., 2005). Managers of Analyser companies, that are located somewhere between Prospectors and Defenders in the strategic adaptation continuum (having a dual product/market approach) can perceive both stability and dynamism in their operational environment. Thus they may appear in predictable and turbulently changing sectors as well, but their efforts – according to their resources and capabilities – are directed towards a most detailed analysis and prediction of changing contingencial conditions (Hambrick, 2003, Zinn et al., 2008). Reactor enterprises, which have been characterised as inconsistent strategies, appear both in stable and erratic environments, but their less conscious SO and less consistent management features can easily
54
lead to suboptimal BP even in predictable, but especially within uncertain environmental conditions (Barney, 1986, Ray, 2004, Tan-Tan, 2005). It must be established however that the relationship between the degree of PEU by managers and the distribution of companies following M&S’s SOs is by no means to regarded as function-like (Hambrick, 1981, Meyer, 1982, Forte et al., 2000, Desarbo et al., 2005). Most probably in our doctoral thesis we can find amongst pharmacists pursuing both Prospector and Defender SOs, who characterise the changes experienced in HPRDS with a high and low PEU alike. According to the mainstream of strategic management, the degree of fit between PEU and the followed SO significantly influences BP realised by enterprises (Venkatraman-Prescott, 1990, Lukas et al., 2001, Davies-Walters, 2004). Pharmacies following a Prospector SO and characterised with low PEU will not for example be inclined to expand the product and service portfolio best fitted to their resources and competences, which may result in a decrease in their prioritised market effectiveness BP indicators (Di Benedetto-Song, 2003, DeSarbo et al., 2005). Likewise, Defender pharmacies, when perceiving uncertain changes in their operational environment, can easily be forced to expand their portfolio, to target and address new patient segments or to adapt different business practices which are not compatible with their idealtypical competences. This can lead to a decrease in profitability, their main BP priority, through not allocating resources to standardise their processes in conventional product/market domains (Song et al, 2007). 12.3. Interrelations of perceived environmental uncertainty and business performance The interpretation of the interdependence of PEU and SO is further complicated by the integration of BP into the relationship of the constructs. According to authors of a certain group of international strategic research stream, managers judge the degree of the predictability of their environment based on the development of either present or former periods’ BP indicators (Downey et al., 1975, Swamidass-Newell, 1987, Daft et al., 1988). This peculiar perception can in some extreme cases lead to a distorted experience of external environmental conditions and of the relevant stakeholder groups’ behaviour. Simplifying the opinion of the representatives of this trend, we can say that BP realised by companies is regarded as a sort of determining factor, an explanatory variable in the subjective managerial assessment of the development of external environmental conditions (Child, 1972, Waldman et al., 2001, Bastian-Muchlish, 2012). Contrarily, other distinguished scholars of the discipline claim that the extent of PEU by managers – regarding the behaviour of industrial stakeholders and changes in external environmental conditions – affects BP significantly (Kotha-Nair, 1995, Namiki, 1999, Agbejule, 2005, Matanda-Freeman, 2009). According to their argumentation, the perception of stable or unpredictable environmental conditions strongly influences the management characteristics of companies, their structure, operational processes and the various aspects of their organisational culture (e.g. values, norms, discipline, morale). However, since the latter constructs are also strongly linked to the SO of companies, it was evident to start researches exploring the implications of the interactions between SO, PEU and BP, which relation is also considered as the central subject of interest of our Ph.D. dissertation (Tan-Tan, 2005, Tsai-Huang, 2008, Nandakumar et al., 2010).
55
12.4. The relationship between strategic orientation, PEU and business performance As we have seen, companies choose their SO according to the interaction between the determining effect of environmental conditions and its interpretation by managers (Ward et al., 1995). Ideally, the chosen and followed SO harmonises with the capabilities of the organisations and directs the attention of executives towards different BP dimensions, therefore managers will allocate available resources towards functional activities contributing the most to the achievement of BP objectives they consider as priority both on tactical and on operative level as well (Hitt et al., 1982, Ireland et al., 1987). Experience suggests that SO pursued by successful companies and the environmental conditions of firms fit beneficiently (Doty et al., 1993, Kabadayi et al., 2007). The equivocal or contradictory results of past researches inspecting the connection between SO and BP compelled the integration of constructs pertaining to both internal and external conditions. Studies discovering the content and process elements of corporate and SBU-level strategies and BP implications of environmental fit are „evergreen issues” of strategic management discipline (Li et al., 2005). Scientific literature has adopted the terminus technicus of „strategic fit” to describe the congruence between SO of companies and their internal and external contingencial conditions, as well as to draw the BP implications of the degree of this „fit” (Drazin-Van de Ven, 1985). This strategic fit can basically be examined on the bases of six different theoretical and methodological approaches (Venkatraman, 1989, Lukas et al., 2001, DeSarbo et al., 2005). These are: 1) fit as moderation 2) fit as mediation 3) the proper matching of environment and strategy 4) fit as in the Gestalt school 5) the methodology of the deviation (misalignment) from the theoretically idealtypical profile 6) suitability based on covariance. In our Ph.D research we used the „fit as moderation” approach to examine the relationship between SO and BP in detail (Song et al., 2007). According to our forecasts, pharmacists perceive turbulent changes experienced in the HPRDS strictly regulated by the government as predictable or uncertain to varying degrees. We presumed that this perception significantly influences the relationship between the chosen and pursued SO as well as the market effectiveness and profitability of pharmacies. So in the following chapter we briefly summarise the main points of past empirical researches on the potential moderating effect of environment on the relationship of strategy and performance. 12.5. The potential moderating effect of perceived environmental uncertainty on the relationship between strategic orientation and business performance The identification and quantification of the influences of moderating variables that refine the stochastic relationship between SO and BP is of special interest to strategic management. Many studies can be found in the M&S research tradition, in which excellent points were made about the development of the relationship between Prospector, Analyser, Defender and Reactor SOs and BP by integrating various moderating variables (Lukas et al., 2001, O’Reagan-Ghobadian, 2005, Menguc-Auh, 2008, Bastian-Muchlisch, 2012, Parnell et al., 2012). Among moderators potentially changing the strength and nature of the connection between independent and dependent variables there are usually factors, the modification of which cannot be considered independent from the decisions and measures of managers. Similar constructs examined frequently in scientific literature are: environmental complexity and dynamism, hostile or munificent nature of the environment and market, technological and

56
regulatory turbulence (Tan, 2002, Li et al., 2005, Tan-Tan, 2005, Olson et al., 2005). Prior to introducing the influence of moderating variables (examined by previous studies) on the stochastic relationship between SO and BP, we draw our attention to the theoretical and methodological approaches of moderating variables. We may regard the following approach as generally approved in social sciences to identify and characterise (by their role „in refining” the relationship between two theoretical constructs) moderating variables. 12.6. Identification and classification of moderator variables in social science researches Variables that can change the significance, strength, direction and shape of the connection between independent (explanatory) and dependent (criterion) variables are called specification factors (Klarmann, 2011). In a rigorous interpretation, moderators are only a narrower subset of the specification variables, even though some use these terms as synonyms. Methodological literature basically distinguishes between two kinds of moderating variables: one changes the significance and/or strength of the connection between independent and dependent variables, while the other type of moderating variables modify the direction and/or shape of the connection as well (Cronbach, 1987). Sharma et al. (1981) established a typology for classification of specification variables in one of the most epoch-making methodological articles of academic marketing research. The taxonomy is based on two criterion according to which there are specification variables that are connected to the dependent variable and there are others which are not. As per the second one, we must distinguish between those specification variables, that interact with the explanatory variable and their interaction has a significant effect on dependent variable and those ones whose interaction does not have a significant effect on the criterion variable. This way there are two possibilities for each classification dimension, thus the classification of specification variables is shown in a 2*2 matrix of Table XI (Sharma et al., 1981). As the matrix illustrates those specification variables that are connected to dependent and/or independent variables and their interaction with explanatory variables has no significant effect on the dependent variable, can fill in for many functions. The colorful terms given to these specification factors also refer to their „multifunctionality”: Intervening, Exogenous, Antecedent, Suppressor and Independent. Their effects can be interpreted in various ways in terms of the connection between independent and dependent variables. Homologiser moderators influence the strength of the connection between independent and dependent variables. A specification variable is called Homologiser, if it does not show correlation with independent/dependent variables under examination, and its interaction with the explanatory variable does not influence criterion variable considerably. Quasi moderators and Pure moderators are different from Homologiser moderators and Intervening, Exogenous, Antecedent, Suppressor and Independent variables in that their effects may change the previously experienced direction and shape of the relationship between explanatory and criterion variables. The interaction effect of both Quasi moderator, Pure moderator and explanatory variables does have a significant influence on the dependent variable under examination. The difference between them is that while Quasi moderator is in correlation either with the explanatory or dependent variables, or both, Pure moderator is not.
57
12.7. Empirical experiences regarding the exploration of the potential moderating effect of PEU on the relationship between strategic orientation and business performance As we have seen in the previous chapters, according to earlier researches of strategic management, some SOs can be successful only under certain environmental conditions. Following theoretical implications, the measure of fit between the SO pursued by companies and external environmental conditions can significantly influence BP. Thus the effect of SO on BP depends partly on the fit between the content and process elements of strategy and external environmental conditions, the latter being made up of general macro-environmental, industry-specific contingencies and their subjective managerial perception. We would like to draw attention here to the fact, that even though strategic literature deals with the moderating influences of both external (macroeconomic and industrial) and internal (organisational) environmental elements upon the relationship between SO and BP, in our Ph.D. thesis we only examine the potential moderating effect of external environmental conditions and the behaviour of stakeholder groups. This is why we have collected together those important studies of research from the last decades of strategic management literature in Table XII, in which research was decisively centered around the moderating effects of the determining aspects of external environment. As it can be deduced from Table XII, researchers examined several moderating variables to explore external influences which have an affect in the development of the connection between SO and performance. Fine examples are theoretical constructs, like contingencial variables pertaining to environmental complexity, stability, and dynamics, information availability, the degree of change, hostile or munificent conditions and stakeholder behaviour and, industrial life cycle, competitive intensity, degree of market and technological turbulence, governmental regulations (Child, 1972, Miller, 1988, Venkatraman-Prescott, 1988, 1990, Song et al., 2001, Tan, 2002, Davies-Walters, 2004, Desarbo et al., 2005, Wang et al., 2012, Yeung et al., 2013, White et al.,2013). There are also works of research in scientific literature, that framed M&S’s SOs – as external, environmental adaptation patterns selected and followed by managers – into their conceptual and measurement models as moderators (Matsuno-Mentzer, 2000, Slater et al., 2006, Song et al., 2007, Nandakumar et al., 2010). The conclusion of Table XII is of special importance, especially from the standpoint of the scientific relevance of our dissertation: namely, international research on the potential moderating effect of external environment – „refining” the stochastic relationship between strategy and performance – has come up with mixed results and conclusions (Miller, 1988, Ensley et al., 2006, Newkirk-Lederer, 2006). According to experiences we have to discern those researches in which external environmental moderating variables did not have a significant effect on the relationship between SO and BP (Venkatraman-Prescott, 1988, Slater-Narver, 1994, Waldman et al., 2001, Srnivasan, 2011). On the other hand, another group of studies emphasises the significant influence of the interaction effects of environmental moderating factors and explanatory variables on BP (Zahra, 1996, Zahra-Boegner, 1999, Agbejule, 2005, Bstelier, 2005, Hoque, 2005, Tan-Tan, 2005, Wang et al., 2012, White et al., 2013). These also point out that the explanatory power (R2 Change) of models would significantly increase after including moderating variables. Thus, scientific researches were not able to draw decisive conclusions concerning the moderating effect of PEU on the relationship between SO and BP, which is why there are still
58
many questions open for debate and many aspects demanding further examinations. In our thesis we would like to fill in some gaps by testing the potential moderating effect of PEU in a special market which can be characterised by the unique mix of attributes of both public and private goods, in the HPRDS which, though strictly regulated by the government, is still undergoing dynamic changes. We continue our dissertation by shortly introducing the fourth major theoretical construct integrated into our research, the geographical location (GL) and its implications associated to SO and BP in scientific literature. 13. Geographical location The fourth main theoretical construct of our Ph.D. research is the GL of pharmacies. We have already discussed the effect of GL of companies on BP briefly earlier in the Ph.D. thesis in a macroeconomic context (Dunning, 1988, Krugman, 1991). According to the empirical experiences of economics, economic geography and sociology, geographical location plays a significant role in the impacts of economic activities on progress, growth and equality (Wallerstein, 1983, Krugman-Obstfeld, 2003). That is why scientists of the abovementioned fields have always paid special attention to the macro-level consequences of similarities, interaction and differences between centre and periphery as well as urban and rural areas (Berend-Ránki, 1966, Andorka, 2001). After the abolishment of restrictions on trading activities and working capital investments in the past few years, researchers of international business economics and various marketing disciplines have shown an increasing interest in analysing the effects of GL on management activities and their BP (Hymer, 1960, Rugman, 1981, Dunning, 1998, Luo, 2001). The majority of researches on location-specific factors primarily centre around the fit between the SO, organisational structure and tactical-level management processes of transnational companies (lately also of small and medium sized enterprises) and external environmental conditions, as well as its BP implications (Buckley-Casson, 1976, Rugman-Verbeke, 2001, Buckley-Ghauri, 2004, Li et al., 2011). Due to our research focus on HPRDS, the determining effect of GL on the SO and BP of companies does not make sense in a global context, but rather on an intrastate-level, thus, this chapter highlights the aspects of GL experienced on the strategic level of micro-scale management. There is a significant interest on part of retail economics, marketing and strategic management in exploring the effect of GL on the SO and BP of companies (Stearns et al., 1995, Roberts-Stimpson, 1998, Sakarya, 2010). The specific local attributes of regional units strongly influence the operational aspects of companies as well (Lengyel-Rechnitzer, 2004, Nemes Nagy, 2009). Researches pay much attention to urban or rural context and their effects for example on the SO of enterprises, the operation of functional areas, the behaviour of stakeholders (e.g. consumers), the willingness of managers to cooperate or take risks, etc. (Sun-Wu, 2004, Velayudham, 2007). Empirical research results of retail management reveal, that GL and the choice of company site greatly determine the sales and profitability opportunities of retail businesses (Wolinsky, 1983, Ghosh-McLafferty, 1987, Levy-Weitz, 2012). Adequately selecting the GL of stores may give companies a sustainable source of competitive advantage through beneficient sales and operational conditions. These competitive advantages largely derive from the size of the agglomeration, transit traffic and purchasing power, the degree of overlapping of the target market segments and the inhabitants of the

59
agglomeration, the presence of companies offering complementary or substitute products and different operational conditions (e.g. rental costs, overhead costs, local taxes, etc.) (Hotelling, 1929, Huff, 1964, Ghosh, 1986). Choosing the right GL and the company site is also of critical importance, because it is very hard to change it afterwards and is only possible by using up significant additional resources (Achabal et al., 1982). This is why managers of retail companies, such as pharmacies operating in the HPRDS, tend to estimate the potential effects of GL on demand and operational costs more and more often (Drummey, 1984). Besides, GL and site of firms, due to their great influence on BP, procreate a distinct element of marketing mix in their own right in retail management (Agárdi, 2010). Early researches treated GL of companies as an independent variable that influences SO and BP directly (Barrett-Windham, 1984, Kean et al., 1998, Premkumar-Roberts, 1999). Later, prestigious internatonal publications began to integrate it into certain conceptual and measurement models as control variable (Russo-Fouts, 1997, Goldstein et al., 2002). Authors of the latter research stream examine the stochastic relationships between certain, predefined constructs: how robust they are, or to what extent they change if the effect of GL on independent and dependent variables is filtered. It is notable that with the advancement of telecommunication and transport infrastructure, the degree of mobility has significantly increased, which induced serious changes concerning the business policies of companies as well. The structure and density of populated areas have changed, the increasing number of greenfield and brownfield investments and the appearance of commuter workforce led to the fading of geographical constraints of enterprises, and the increase of flexibility in changing the company site. (Rechnitzer-Smahó, 2005). At the same time such studies and articles were published in management sciences, that did not interpret GL as a given attribute, but as a factor changeable by managers, and integrated it as a moderating variable into certain models (Smith et al., 2002, Minai-Lucky, 2011). The pharmacy liberalisation process taken place between 2006 and 2011 made it easier to found new pharmacies and thus valorised the importance of the role of GL, so we try to shed light on the potential moderating effect of GL on the relationship between the pursued SO and the BP of pharmacies. We continue our dissertation with summarising the consequencies of scientific literature about M&S’s strategic typology. 14. What we know about Miles and Snow’s typology As a conclusion of the literature review stage we give a synthetising summary of the research on the central theoretical construct of our dissertation. After a detailed description of the environmental relevance and BP implications of M&S’s SOs, we summarise what general statements we can make about the typology in spite of the heterogeneous conclusions of various empirical studies. These cannot be viewed as universal truths; they just reflect the most proven hypotheses. 1. The strategic typology of M&S has been proven to be relevant and stable primarily in US
markets, yet it has been identified several times in other countries as well. 2. Markedly distinct environmental adaptation behavioural patterns develop different
resources and capabilities, which are also manifested in the dissimilarities of managerial decisions and actions as well.

60
3. Academics managed to identify all four M&S’s SOs in most industries. 4. Researchers have not found equality in most industries regarding the distribution of
companies that pursue Prospector, Analyser, Defender or Reactor SO. 5. The distinction between Low-cost and Differentiatied Defenders is theoretically
reasonable, but their operationalisation is exceedingly complicated. 6. Prospectors regard the development of effectiveness performance indicators as priorities,
whereas Defenders prioritise efficiency indicators. Analysers strive for an above average level in terms of effectiveness and profitability indicators simultaneously.
7. The degree of fit between SO and industry-specific, external environmental factors
significantly influences the BP of Prospectors, Analysers, Defenders and Reactors. 8. Apart from a few counter-examples, the BP of companies pursuing a Prospector, Analyser
and Defender SO always exceeds that of Reactors in turn. 15. The shortcomings and limitations of previous empirical researches The strategic typology of M&S has been successful from its start, numerous studies have paid special attention to it, and its practical applicability has been proven as well (Hambrick, 2003). It has been, however, many times in the centre of academic or managerial disputes. Beginning with its theoretical bases, from methodological instruments to the consequences drawn upon business life, most aspects of the researches directed towards examining the typology have been criticised. In this chapter we discuss those areas which make up the major limitations and shortcomings of past researches, and we also make proposals on the potential treatment of certain problematic issues. The identification of SOs: One of the cardinal points of scientific research is the methodology that scholars apply to identify M&S’s SOs pursued by firms examined. There are four basic methodological approaches to extract Prospectors, Analysers, Defenders és Reactors (Snow-Hrebiniak, 1980, Segev, 1987, Conant et al., 1990): Applying the self-typing paragraph method managers are asked to choose one among
M&S’s SOs formulated and phrased in one extended sentence or dense paragraph that describes best the environmental adaptation behaviour of their company.
Classification by the authors: researchers, after getting acquainted in detail with the
activities of companies examined, are able classify firms into SOs according to a few arbitrarily chosen criteria.
Judgement of independent industrial experts: in this case an expert who has an intimate
and deep knowledge of M&S’s SOs classifies companies upon request. Identification based on objective indicators: researchers classify companies into SOs
based on carefully selected quantitative indicators taken from annual fiscal reports, professional reports of chambers, analyses of competition authorities and such similar documents.
61
Scales: multi-item scales containing statements on certain stages of the adaptive cycle (entrepreneurial, engineering and administrative) are especially suitable tools for researchers to extract SOs via managerial evaluations.
The most widely-spread method is of self-typing paragraphs. It is very practical, though it has many deficiencies. The sentences describing SOs are over-simplified and mirror far too idealtypical behavioural patterns. Phrases focus mainly on the entrepreneurial problem of the adaptive cycle, that is, the product/market and operational domain of the company. This way, by neglecting the elements of the administrative and engineering problems, there is a danger of managers reporting a nonexistent, artificial SO more likely to have been created by academics (Hambrick, 1983). To ensure the validity of future researches, it is worth identifying the SOs of companies examined with at least two different methods, then comparing the results obtained by statistical tests. The difficult identifiability of Reactors: Another weak point of the self-typing paragraph method is that it identifies far less Reactor companies than there exist in fact. The cause of this phenomenon lies in the rather black-and-white definition of Reactor SO: „Reactors are not able to develop a consistent behavioural pattern of strategic adaptation, nor to identify a clear product/market domain. Their orientation is primarily short-term, their actions most of the time are forced by the pressures of competitive, technological, etc. conditions of market environment.” (Slater-Olson, 2000, pg. 829.) After reading the definition, it must be clear why responding managers are unwilling to sort their company into this SO. Because of this flaw, the simultaneous, combined use of several strategy extraction techniques is reasonable by which the observation of Reactors can be assured. The exclusion of Reactors from examinations: Many studies have already excluded Reactors, arguing that they are able to exhibit a consistent strategic behavioural pattern, therefore creating their profile is difficult. Most researches also show that their BP falls behind those of other SOs. To encourage conscious strategic behaviour however, it is necessary for researchers to learn more about the main characteristics of Reactors, in order to formulate recommendations concerning the successful environmental adaptation for them. The incomplete profile of Analyser companies: Even though this SO is represented in great numbers, we know very little of Analysers’ behavioural characteristics. To support managerial decisions, it must be clarified whether Analysers are a combination of Prospectors and Defenders, or to what extent they form a separate SO with its own set of management attributes (Hambrick, 2003). Dominance of large corporations in researches: Studies on M&S’s strategic typology focus mostly on large corporations. The examination of SO and BP of micro, small, and medium sized enterprises which make up an overwhelming majority of businesses employing a great number of workers has mostly eluded the attention of researchers. In order to explain this, some claim that SMSs might not develop conscious behavioural patterns in environmental adaptation at all (Lindblom, 1959, Inkpen-Choudhury, 1995, Olson et al., 2005). The statement is provocative, its refutation or verification is up to the future researchers. The lack of multitple respondents design: Most researches apply a method with single-respondents technique. This may be due to various limits of resources, but if researchers have the possibility, they should reach more than one respondent manager per company (Bowman-Ambrosini, 1997). The opinion of only one executive may show a distorted picture according

62
to his personality, the information he owns, his interests, functional background etc. Managers for example usually have little information about the way determining problems of the administrative stage manifest themselves on lower levels of the organisation. Therefore, to increase the validity and reliability of researches, it is recommended to apply multiple respondents techniques (Podsakoff et al., 2003). Doubts about validity, reliability and generalisability: Concerning validity, reliability and generalisability doubts in M&S research arise mostly during the comparison of BP of companies from various industries (Babbie, 1995). For the sake of generalisability many studies have been published, which compared SO and BP of companies operating in different sectors with totally distinct features raising serious doubts about validity. For example the comparison of BP of firms of retail and biotechnology or that of the banking sector and agriculture on the basis of market share or ROI seems as rather illusory. In order to provide higher degrees of reliability and validity, researchers have to be more careful and rather draw conclusions on the BP of M&S’s SOs based on companies of the same industry. This might narrow the generalisability of the results of researches, but offers less edge to criticism. An optimal solution would be to conduct as many industry-specific research as possible. This requires resources as only having these could we reach an equilibrium in the current „trade-off” type connection that exists between validity, reliability and generalisability. The prevalence of performance indicators based on subjective judgement: Though many methodological studies prove that there is a strong correlation observable between BP based on subjective managerial evaluations and BP identified on the bases of objecive indicators, (Ramanujam-Venkatraman, 1986, Morgan et al., 2004) it can be reasonable to check subjective indicators with objective ones for the sake of higher validity and reliability. This is especially useful in the case of turbulently changing, reconfigurating sectors, since managerial views and insights can not always keep pace with real industrial processes in similar instance (e.g. the appearance of new entrants en masse, dynamic growth or decline). Intended vs. realised strategy: Responding managers often do not clearly understand, which strategy researchers are gathering information upon, current or future strategy, intended or already realised strategy (Mintzberg, 1978)? This must be stated by all means in the very first phase of data collection. The distinction between SOs from this perspective might be of serious scientific added value. If researchers can have the opportunity to compare intended and realised SOs at different points of time, they can make useful recommendations on modifying SO and on the process of strategic transition. The lack of longitudinal research: The majority of research done on M&S strategic typology was cross-sectional. As in strategic management literature in general, in the cases of M&S research especially, there is a great need to execute longitudinal, panel-type examinations. This way researchers could solve many problems outlined in the previous point: they could formulate managerial recommendations about how to change SO, what characteristics describe the process of strategic transition, what choices to be made to manage it etc. The limited number of stakeholders during performance evaluation: In the future it would be appropriate to avoid the notion, that only effectiveness and efficiency indicators important to managers and investors are viewed as priority. New, up-to-date indicators have to be introduced in evaluating BP of M&S’s SOs, which are demanded (as employee satisfaction, customer loyalty, environmental impact) by further individuals or stakeholder groups (e.g. employees, environmentalists, non-governmental organisations).

63
The lack of the inspection of performance differences within strategic orientations: Authors usually focus on BP variations between Prospectors, Analysers, Defenders (Low-cost vs. Differentiated) and Reactors. Researchers in the future should pay more attention to BP differences within certain SOs and reveal factors contributing these differences to managers. The prevalence of researches in Anglo-Saxon business cultures: Apart from a few exceptions (Dyer-Song, 1997, Peng et al., 2004, Pinto-Curto, 2007, Kabanoff-Brown, 2008, Datta et al., 2009) authors of the M&S literature draw their consequences based usually on experiences about companies operating in US markets. The examination of SOs poses a challenge in countries and regions, where there does not exist a huge, unified market, and whose markets can not entirely be characterised by the „standards” of Anglo-Saxon business culture. The industries of the BRIC (Brazil, Russia, India, China) countries, which are traditionally characterised by turbulent environmental changes and strong governmental interventions, just as well the developed and powerful European markets (whose business culture is a bit different from that of Anglo-Saxon markets), like Germany or France are priority research targets of M&S focused strategic approach. Neglecting the examination of markets of smaller countries: Researchers should pay more attention to what extent M&S’s typology can be regarded relevant in the markets of relatively small countries, like Hungary. Berács et al. (1995) analysed marketing strategies of Hungarian companies in a post hoc manner in the early and mid 1990s. They distinguished between five strongly different SOs by examining business environment and four other factors which are especially important in the development of marketing strategy (strategic objectives, the competitive method to achieve objectives, market segmentation and targeting, as well as positioning based on price and quality). Defenders striving for Efficiency, Quality, Low-cost, as well as the Offensive and Balanced Growing strategies produced remarkable overlappings with the Low-cost, Differentiated Defender and Prospector SOs of M&S and Walker-Ruekert. Of course many other theoretical and methodological defects and underresearched fields could be listed apart from those mentioned above. There seems to be a huge demand for researches focusing on today’s prioritised aspects of administrative problem (e.g. the composition of top management team, strategic thinking of senior managers, corporate culture, organisational values and norms, etc.). It seems to be an endless potential target for researches to examine to what extent and with what tactical and operative activities different business functions (marketing, HR, logistics, controlling) can contribute to the development of BP of firms following different M&S’s SOs. Also the turbulently changing environment of global economy calls for research into the risk aversive and risk-taking behaviour of M&S’s SOs, even in financial, investment and numerous other operational aspects as well (Hambrick, 2003). In the following sections we summarise the objectives of our PhD research, which also respond to the open questions and shortcomings of earlier academic studies. 16. The scientific significance of the doctoral dissertation The academic significance of our dissertation lies in the fact that it tests one of the most well-known typology of strategic management literature that has not been explicitly examined in Hungarian research before, moreover, in a regulated industrial environment (Berács et al., 1995). Our empirical research tries to eliminate the conceptual and methodological shortcomings of past international studies as far as possible. Thus, our thesis contains the following scientific approaches and methodological solutions, which are novel from the

64
perspective of strategic management discipline (Csepeti, 2010): 1. We examine the relevance of M&S’s strategic typology among firms operating in a special
industry that can be described with a particular mixture of micro-economic attributes of public and private goods, and which is characterised by strong state regulations (Fiegenbaum-Thomas, 1995, McGahan-Porter, 1997, Andrews et al. 2006, 2009).
2. The degree of competitive intensity in the HPRDS – featured by bureaucratic coordination
mechanisms and strict ethical norms – is limited. This is exceedingly rare in mainstream strategic management research as most of these studies examine companies whose operational environment can be described with high degrees of competitive intensity and strong market coordination mechanisms (Ghobadian et al., 1998, Luo, 2001, Boyne-Walker, 2004, Bastian-Muchlish, 2012). This poses a challenge to our dissertation in determining to what extent companies pursuing a Prospector, Analyser, Defender and Reactor SO are observable and what BP they exhibit in the HPRDS characterised by a recently increased, otherwise still limited competitive intensity.
3. We examine the prevalence of M&S’s strategic classification in a special industry of a
country, the companies of which are less influenced by those economic and sociological attributes of the Anglo-Saxon business culture that have been dominant in prior researches (Dyer-Song, 1997, Kabanoff-Brown, 2008).
4. We test M&S’s strategic taxonomy in the market of a relatively small country, for which
there is only a little precedence in previous researches (Pinto-Curto, 2007, Talpová, 2012). 5. Our research aimed at identifying Prospector, Analyser, Defender and Reactor SOs and
revealing their BP implications among the population of pharmacies that statistically count as micro and small enterprises, contrary to the dominance of corporations in mainstream research on M&S strategic typology.
6. In spite of the operationalisation difficulties in identifying Reactor companies, we also
integrate pharmacies pursuing Reactor SO into our research (Vorhies-Morgan, 2003, Olson et al., 2005) and we endeavour to help them turn towards a consistent strategic behaviour with our suggestions based on empirical evidence.
7. To ensure higher degrees of validity and reliability, we apply three measurement tools to
operationalise behavioural patterns observable in the environmental adaptation of firms and to classify pharmacies according to their SO: the self-typing paragraph method, Segev’s multi-item scale and the method of objective indicators (Snow-Hambrick, 1980, Conant et al., 1990). To confirm convergent validatity in its classical sense, we examined the degree of concordance or difference between the classification results of the three measurement tools by using statistical tests as well.
8. In order to achieve higher degrees of validity and reliability, we substitute subjective BP evaluations which are based on managerial judgements and often applied in strategic literature with SAL (sales) measuring market effectiveness and NP (net profit) describing financial profitability in our research.
9. In the HPRDS characterised by bureaucratic coordination mechanisms and limited
competitive intensity, turbulent scale governmental interventions took place in the past years. A decisive empirical objective of our dissertation is to examine how the PEU by
65
pharmacists affects the development of the stochastic relationship between SO pursued by pharmacies and their BP. Our dissertation is meant to contribute to the clarification of mixed results previous researches have come up with in analysing the effect of potential moderating factors on the relationship between SOs and BP and to add more implications to the topic by narrowing the current „knowledge gaps”.
10. After the loosening of the legal requirements regarding pharmacy foundation, the GL of
pharmacies cannot be viewed anymore as an „unalterable” attribute for managers and its development might presumably influence the SO and BP of enterprises. It is our stressed methodological priority to shed light on the combined moderating effect the GL of pharmacies and PEU by pharmacists might have on the development of the relationship between SO and BP. By integrating control variables pertaining to the socio-demographic characteristics and site attributes of pharmacies we test the robustness of the effect SOs and potential environmental moderating factors might have on BP.
11. By the explixit methodological contrasting of the definitive mainstream of contingency
theory in strategic management discipline and the managerial choice approach developed by John Child we plan to explore whether the SO of pharmacies is determined by turbulent changes in environmental conditions and in the behaviour of sectoral stakeholders or the subjective perception of changes taking place in external environment contributes to conscious strategic choice of pharmacy managers (Boyd et al., 2012).
In the previous paragraphs we have often mentioned that we test the relevance of the M&S strategic typology in a market that bears the characteristics of both private and public goods, in the HPRDS featured by bureaucratic coordination mechanisms and limited competitive intensity. Thus in Chapter 17 we delineate the main micro-economic differences between public goods and private goods and present the industrial context of our empirical research, i.e. we briefly explain those turbulent changes that took place in the operational environment of the sector radically altering the conditions of pharmacy management and seriously influencing SO and BP of pharmacies. 17. The introduction of the Hungarian public retail drug supply 17.1. The interpretation of the activites of pharmacies in the microeconomic context of public and private goods The scientific significance of our dissertation is greatly determined by the fact that the „retailer” participants of HPRDS sell a special kind of „value proposition” which can be characterised with the traits of public and private goods at the same time. This special „value proposition” is health in general, and the right to a healthy life and providing equal access to health care products and pharmaceutical services in particular (Pollitt-Bouckaert, 2004). Therefore it is necessary to summarise the microeconomic differences and similarities of public and private goods in a few paragraphs in order to understand the operational and regulatory mechanisms of HPRDS as well as the micro-level management of pharmacies (for a detailed comparison see Tables XIII-XIV-XV-XVI-XVII). Paul A. Samuelson, a significant Nobel-laureate economist claimed (1954) that economic goods can be classified on the basis of two properties: Rivalry and excludability. Rivalry pertains to the measure of how the consumption of a good by a certain individual reduces the utility of other consumers. Excludability means the measure of how the consumer of the
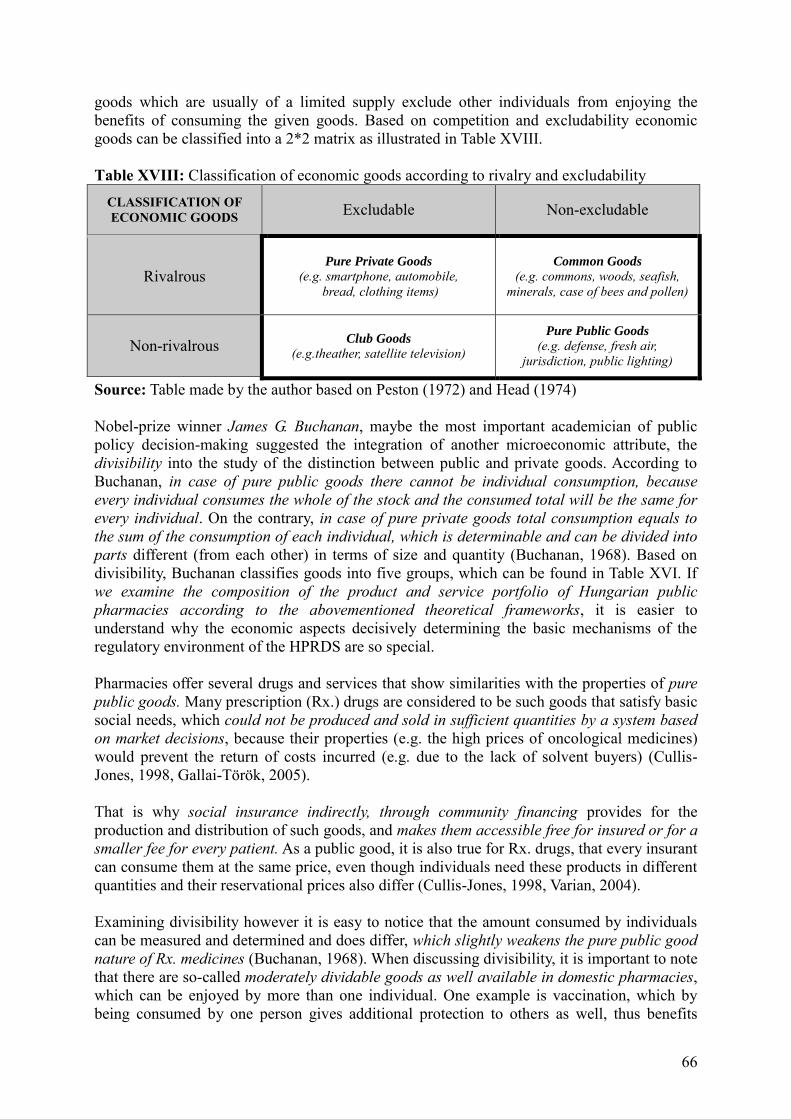
66
goods which are usually of a limited supply exclude other individuals from enjoying the benefits of consuming the given goods. Based on competition and excludability economic goods can be classified into a 2*2 matrix as illustrated in Table XVIII. Table XVIII: Classification of economic goods according to rivalry and excludability
CLASSIFICATION OF ECONOMIC GOODS
Excludable
Non-excludable
Rivalrous
Pure Private Goods
(e.g. smartphone, automobile, bread, clothing items)
Common Goods
(e.g. commons, woods, seafish, minerals, case of bees and pollen)
Non-rivalrous
Club Goods
(e.g.theather, satellite television)
Pure Public Goods
(e.g. defense, fresh air, jurisdiction, public lighting)
Source: Table made by the author based on Peston (1972) and Head (1974) Nobel-prize winner James G. Buchanan, maybe the most important academician of public policy decision-making suggested the integration of another microeconomic attribute, the divisibility into the study of the distinction between public and private goods. According to Buchanan, in case of pure public goods there cannot be individual consumption, because every individual consumes the whole of the stock and the consumed total will be the same for every individual. On the contrary, in case of pure private goods total consumption equals to the sum of the consumption of each individual, which is determinable and can be divided into parts different (from each other) in terms of size and quantity (Buchanan, 1968). Based on divisibility, Buchanan classifies goods into five groups, which can be found in Table XVI. If we examine the composition of the product and service portfolio of Hungarian public pharmacies according to the abovementioned theoretical frameworks, it is easier to understand why the economic aspects decisively determining the basic mechanisms of the regulatory environment of the HPRDS are so special. Pharmacies offer several drugs and services that show similarities with the properties of pure public goods. Many prescription (Rx.) drugs are considered to be such goods that satisfy basic social needs, which could not be produced and sold in sufficient quantities by a system based on market decisions, because their properties (e.g. the high prices of oncological medicines) would prevent the return of costs incurred (e.g. due to the lack of solvent buyers) (Cullis-Jones, 1998, Gallai-Török, 2005). That is why social insurance indirectly, through community financing provides for the production and distribution of such goods, and makes them accessible free for insured or for a smaller fee for every patient. As a public good, it is also true for Rx. drugs, that every insurant can consume them at the same price, even though individuals need these products in different quantities and their reservational prices also differ (Cullis-Jones, 1998, Varian, 2004). Examining divisibility however it is easy to notice that the amount consumed by individuals can be measured and determined and does differ, which slightly weakens the pure public good nature of Rx. medicines (Buchanan, 1968). When discussing divisibility, it is important to note that there are so-called moderately dividable goods as well available in domestic pharmacies, which can be enjoyed by more than one individual. One example is vaccination, which by being consumed by one person gives additional protection to others as well, thus benefits

67
multiple individuals with a positive external effect (Meade, 1952). When legislation and healthcare government claim for example that those enjoying insurance and other actors in the healthcare and pharmaceutical system „irresponsibly overconsume” certain publicly funded medicines, they actually emphasise those attributes of these products which are characteristics of common goods. In such cases they remind stakeholders that if non-excludability is interpreted falsely, then sooner or later there will be those who, because of scarce and diminishing resources and stock, will not be able to access healthcare products, or that not those will access them who would need them most according to a medical or a pharmacist professional point of view. This latter phenomenon leads to the reduction of the utility of some individuals, which in turn is a cardinal trait of competing products. There are many medicines and other products being sold in pharmacies, which demonstrate the idealtypical traits of pure private goods as well. According to the state, allowing market coordination mechanisms to ensure the production and distribution of OTC medicines or cosmetical products does not violate the right of citizens to equal access to healthcare (Kay, 2007). These goods are rivalrous in the sense that consumption of an individual lessens the utility of other individuals potentially intending to enjoy the consumption of the given good (especially because these are produced in limited quantities, a priori not made for all members of the society). When dealing with private goods there is also the possibility of exclusion, since their consumption is only possible after paying their full price. Anyone can be excluded from consumption who cannot gain „possession rights” of these goods due to a lack of financial resources. In the case of OTC medicines and other products available in pharmacies, the divisibility of consumption among individuals prevails. Many sector-specific situations can be identified in the HPRDS, in which pharmacies and some of their products or services act as club goods. This may occur when the equilibrium of supply and demand in the consumption of goods that are basically not rivalrous can be ensured for example via the introduction of capacity limits, which can lead to the exclusion of some of the individuals. In this case, the utility of those who can access the goods will not decrease compared to each other, but that of those who cannot, will be. Such a situation can manifest when a patient faces shortage of stock of an Rx. medicine, or when there are too many customers waiting in the officina and thus the pharmacy is simply unable to serve any more patient at a given time. The challenges of managing „club” goods may increase in the near future especially in connection with the expansion of the institution of the so-called pharmacist’s care. A possible redirection of certain simple healthcare services – e.g. examinations and screenings or vaccination – into pharmacies may further raise capacity limits (e.g. number of expediators, service counters), which can lead to severe „bottlenecks” and an increase in excludability (Buchanan, 1968, Pollitt-Bouckaert, 2004). In the past paragraphs we have tried to prove with the toolkit of mainstream economics dealing with public goods why the operation of Hungarian public pharmacies can be regarded as business and public activities incorporating the special traits of both private and public goods simultaneously. The microeconomic founding of this duality was absolutely necessary in order to understand the continuous fracture lines and ongoing debates experienced in the regulatory processes of the HPRDS and their effects on the SO and BP of pharmacies later on.

68
17.2. Attributes of micro-level strategic planning and management in the public sector With full knowledge of the specific characteristics of the HPRDS, which bears all the microeconomic features of both public and private goods, we can presume that these characteristics will lead to different manifestations of the strategic-level aspects – e.g. planning, implementation, execution, feedback, and correction – in the case of operation of public pharmacies (Bryson, 1995, Davis et al., 2001, Boyne-Walker, 2004, Andrews et al., 2006, 2009). However, it is important to note that, from a statistical point of view, most pharmacies are considered to be micro or small enterprises, thus from the point of view of organisational theory their strategic management procedures are determined by the characteristics of these entrepreneurial forms (Davig, 1986, Chaganti, 1987, Gibbons-O’Connor, 2005, Spillan-Parnell, 2006). Additionally, after the wave of privatisation in 1994-96, pharmacies that were operating as parts of public property before have become private property, and despite corporate enterprises emerging as financial investors during the pharmacy liberalisation period of 2006-2011, almost 2/3 of the entire Hungarian public pharmacy population is owned by pharmacists and their family members or friends (Hankó, 1996, Bodrogi et al., 2010). Table XIX exhibits all of the dimensions that characterise the unique, ideal-typical manifestations of the strategic management procedures of companies operating in public sectors, in the form of SME, in family ownership, or within conventional, competitive markets. The table illustrates that the “soft fiscal constraints” typical of the public sector (Kornai, 1980) results in a different approach regarding the interpretation of BP and in the prioritisation between various BP indicators that is radically distinct from that of companies participating in the competitive market (Boyne-Walker, 2004, Zinn, 2009). Political groups and legislative bodies having significant bargaining power among external stakeholders exerts a great influence on both the content and formal elements of the strategies of companies producing or distributing public goods (Cullis-Jones, 1998, Llewellyn-Tappin, 2003). A general goal of managers of publicly-owned companies and/or of firms operated by taxes is to maintain balanced power relations and positions (Stevens-McGowan, 1983). Thus, they usually refrain from making high-risk strategic decisions – e.g. targeting the modification of the range of products/markets. The high demand for transparency and significant media coverage also contribute to this phenomenon (Walsh, 1994, Li et al., 2008). Rigid structures, high degree of formalisation, departmentalisation and centralisation that generally characterise firms in the public sector usually result in these organisations leaning towards more retractive, compliant and passive SOs (Cervera et al., 2001, Andrews et al., 2009). However, the attributes of private micro, small, and medium sized enterprises can impart remarkable heterogeneity to the slightly “unidimensional” and “monocultural” strategic management characteristics of companies operating within the public sector (Ghobadian et al., 1998, Gimenez, 2000, Ghobadian-O’Reagan, 2006a). For example, a company leader who is concerned with sustaining his/her family and the succession issues of the family business works towards the lasting prosperity of the enterprise for decades, has little interest in political cycles (Ghobadian-O’Reagan, 2006b). Managers of such firms as being professionals of their trade, know the particularities of the sector, and have stable customer and supplier relations, and recognise the necessity of adapting to the changing needs and preferences of key stakeholders (Harris et al., 1994, Pittino-Visintin, 2009).
69
This results in the appearance of market coordination mechanisms both in the strategic planning and management processes of family enterprises (Kornai, 1983, Appiah-adu – Singh, 1998, Gibbons-O’Connor, 2005). Despite the centralised decision-making procedures of enterprise managers, there is a potential for these companies to follow a consistent SO, due to their less rigid organisational structures and operational attributes (Pelham, 1999, Aragón-Sanchez – Sanchez-Marín, 2005). In an optimal case, this can result in the incremental alteration of the product/market domain and the applied competitive tools. Based on the factors listed above, it is safe to say that strategic behaviour of pharmacies examined in our dissertation – which operate within the public sector, but are otherwise private property – are characterised by a peculiar ‘mixture’ of the idealtypical particularities of the community, SME sector and family enterprises. Even though the central theoretical construct of our thesis, the strategic typology of Miles and Snow has been examined by a few research studies within the context of public services and family businesses (Ghobadian et al., 1998, Andrews et al., 2009, Pittino-Visintin, 2009, Zinn et al., 2009), to the best of our knowledge, there has never been a similar empirical research within a public sector where societal needs are covered by privately held micro enterprises. Previous research projects observed the dominance of Defender and Reactor SOs in the public sector, but enterprises pursuing Prospector SO are also quite frequent (Ring-Perry, 1985, Andrews et al., 2009). The latter mostly applies to smaller organisations, even though the difference between Prospectors and Defenders, Analysers, Reactors is not as significant in this context as it is on the competitive market (Boyne-Walker, 2004, Zinn et al., 2009). Past M&S research pertaining to the examination of micro enterprises shed light on the fact that the margin of strategic “manoeuvre” of these enterprises is highly determined by the informal interactions between family members, as well as the way they collectively interpret environmental changes as a group (Ghobadian-O’Reagan, 2006a, Ghobadian-O’Reagan, 2006b, Pittino-Visintin, 2009). This, despite the general minority of Analysers experienced in the case of entrepreneurial forms of this sort, results in the emergence of a relative variety of SOs, where the distinction between Prospectors, Defenders and Reactors is quite clear. In our doctoral research, we were attempting to examine the degree to which strategic behavioural patterns of M&S are observable in the HPRDS, which bears the idealtypical characteristics of both public and private goods. We were also eager to reveal the consequences of sector-specific shifts and modifications in the manifestations of M&S’s SOs and in the development of their BP implications as well. Now we continue our dissertation with the presentation of changes that took place in the environment of HPRDS during the course of the last 25 years. 17.3. Chronology: Milestones in sectoral legislation after the centrally planned economy In the era of the socialist planned economy, the pharmaceutical supply chain and its key stakeholders have been public property for more than forty years. This closed, strictly regulated structure has limited the intensity of competition and assured stability for its participants for decades. Products manufactured by Hungarian pharmaceutical companies (Richter, Egis, Chinoin, Biogal, Alkaloida) were distributed by the “Pharmaceutical Sales Company” (Gyógyáru Értékesítő Vállalat – Gyógyért), as the sole domestic wholesaler (Antalóczy, 1993). The exclusive import rights on the domestic distribution of foreign products were owned by the international pharmaceutical wholesaler Medimpex, which was also obliged to forward the imported products to Gyógyért (Szabó, 2009). After these medical

70
products were obtained by Gyógyért (the predecessor of Hungaropharma), it distributed them among the non-overlapping “pharmacy centres” operating in the capital and in nineteen counties of Hungary. These centres then coordinated the stocking and the delivery of these products to public pharmacies (Bárd, 2009). The supply of hospitals was carried out directly by Gyógyért, without the involvement of pharmacy centres. Political and economic transitions of 1989-90 quickly shed light on conflicts of interest between participants. The process of privatisation took longer than expected, since there was a lengthy debate on whether the income from the assets of pharmacies sold should belong to central budget or local governments. This debate has been set by Act LIV of 1994 on “the establishment and cartain rules of pharmacies’ operation”, which adjudged the income to municipal governments (Poszmik-Barta, 2009). The most significant wave of pharmacy privatisation (in 1994-96) took place within this legislative framework. As a result of the special sectoral structure, simultaneous privatisation of pharmacies and pharmacy centres meant that the entire pharmaceutical wholesale and retail trade became private property at the same time (Antalóczy, 2001). This resulted in the emergence of various privatisation techniques and owners in each region. Most pharmacies were bought for a fair price by pharmacists formerly operating them, but some pharmacists, especially in the capital and western part of the country, were unable to buy pharmacies they operated due to lack of funds, and thus they needed to obtain loans or resort to the help of financial investors (Szabó, 2009). Privatisation has changed the intensity of competition among the participants, both in a horizontal and a vertical approach. In the new system, privatised pharmacy centres and a number of tighter cooperations organised by individual pharmacists managed to obtain a wholesale distribution authorisation, and thus they took up wholesaler’s functions, such as the stocking and distribution of drugs. However, this meant direct competition for Gyógyért, which had a monopoly previously, as well as for the foreign wholesalers that started distributing in Hungary in the meantime (e.g. Phoenix Pharma) (Bárd, 2009). It led to a relatively large number of wholesalers that were competing for the right to supply public and institutional (e.g. hospital) pharmacies. During the period of consolidation, wholesalers with a well-capitalised ownership gradually obtained pharmacy centres, and later some of the more significant participants have merged or have aquired (e.g. Hungaropharma, Medimpex and Pannonmedicina) (Poszmik-Barta, 1995). About 1800-2000 pharmacies were established within the HPRDS, most of which were independent and owned by pharmacists, however, various forms of cooperation (e.g. procurement associations) have already appeared. Privatisation has also occurred on the side of production: the most important Hungarian pharmaceutical companies were purchased by foreigners, medicine was imported in large quantities after the liberalisation of the market, and significant global pharmaceutical producers founded subsidiaries and commercial presences in Hungary (Antalóczy, 1997, 2001). The time period between 1994 and 2006 is commonly referred to as the era of the “Ethical model” within the HPRDS. Act XCVIII of 2006, “on the general regulations of safe and cost-efficient supply and distribution of drugs and medical devices” has dramatically changed the operational mechanisms of stakeholders of HPRDS. The necessity of the Act of Drug Distribution (ADD) has been underlined by legislative bodies as follows (Mihályi, 2006, Bodrogi, 2010):
1. Hungarian citizens consume more drugs than necessary
71
2. The price of – mostly generic – products available in Hungary is higher than the European average
3. The central budget and the National Health Insurance Fund of Hungary subsidise more medical products and to an excessive extent which is not necessary and sustainable
4. As a result, annual deficit of the state pharmaceutical budget is bigger than planned 5. Competitive intensity between pharmacies is rather low, the quality of service is not
optimal, and patients’ access to pharmacies’ services is low and uneven. Our thesis is not attempting to decide which of the aforementioned points proved to be realistic, it merely summarises the results of the taken governmental measures. Cuts on the range of subsidised products and the extent of subsidies, reference pricing, delisting and payments from manufacturers helped eliminating the tens of billions (HUF) of deficit the state pharmaceutical budget had to face, as well as achieving a positive balance (Dankó.Molnár 2011). There was a decline in state-supplements for prices of drugs, which led to a minor fall, and later stagnation in consumption. The National Health Insurance Fund of Hungary (NHIFH) and the National Institute of Pharmaceutics (NIP) have introduced a new system of subsidy and admission policies, more attention has been focused on generic drugs, and the rise in prices of medical products has been stopped (Dankó, 2012). There has been a minimal improvement in the public accessibility of pharmacies, but inequalities between smaller settlements and larger cities have further increased (Bodrogi et al. 2011). The percentage of the price margin provided by legislation for retailers and wholesalers has dropped, however, OTC products were sorted into the category of open-fare goods by legislative bodies (Kuti, 2009). There was a 20% increase in the number of pharmacies, which led to an intensifying degree of competition, to changes in pharmacy management and operations, and to significant differences in BP. The time period between 2006 and 2011 is often called the “Mercantile” era of the HPRDS. 17. 4. Ethical vs. mercantile model For the systemic characterisation of the pharmaceutical supply chain the terms of ethical and mercantile dichotomy are often used by professionals of health care sector. In the member states of the European Union, legal aspects of the operational environment of pharmacies are often determined by the peculiarites of ethical and mercantile philosophies. In addition, the degree of prevalence of the idealtypical characteristics of both philosophies significantly influences the management procedures of pharmacies as well. Based on international experience, the choice of an appropriate model itself does not necessarily result in the perfect operation of the public drug supply sectors of individual countries (Melia et al. 2010). The emphasis is on the quality of management of systems running within an ethical or a mercantile legislative framework, and thus both models have the potential to be effective and efficient (Taylor-Harding, 2011). In a European context, the ehical model is applied in Germany, France, Austria and Sweden, while a mercantile system is operating in the UK, the Netherlands, the Irish Republic and Belgium (Bíró, 2009, de Aguiar et al. 2014). The key merits of the ethical model are the emphasis on public drug supply as community service, solidarity, social fairness, and the principle of equal access to public goods. The ideal typical features of the ethical model are the following ones (Szabó, 2009):
Pharmacies can only be owned by qualified, professional pharmacists A pharmacist is only allowed to own one pharmacy

72
The pharmacist in charge, who has specific, so-called “personal rights” to lead a pharmacy, is not allowed to have another profession besides being a pharmacist
The pharmacist and his/her pharmacy maintain a monopoly within the boundaries of a given geographical location regarding the distribution of human medicines
A pharmacy is only permitted to sell drugs and other pharmaceutical products directly associated to healthcare (e.g. medical devices)
Due to a low intensity of competition marketing activity of pharmacies is rudimentary In contrary, mercantile philosophy values market-economic competition, efficiency, entrepreneurial mindset and satisfaction of consumers’ needs and preferences. The idealtypical attributes of mercantile model are the following (Holdford, 2007, Feller, 2010, Melia et al. 2010):
Anyone (e.g. private individuals, enterprises with/without legal personality) is allowed to own a pharmacy
The pharmacist in charge can be replaced Pharmacy owners are allowed to own multiple pharmacies, thus it is possible for them
to operate a pharmacy chain The pharmacist in charge is allowed to have another profession which is compatible
with his position Regulations on the range of products/services offered in the pharmacy are less limited,
or non-existent Some medicines can be purchased by patients not only in pharmacies, but at other
retail units (e.g. drugstores, gas stations) as well Naturally, neither the ethical, nor the mercantile model can be observed in its “pure”, ideal typical form in any country (Taylor-Harding, 2001). As a result of the complex system of societal requirements, various hybrid structures have emerged during the implementation of the different institutional models with remarkable shifts of emphasis (O’Toole, 2000). A similar description applies to the last two decades of Hungarian regulation as well, since, for a long time, pharmacies were mostly operated according to the ethical model until the mercantile turn of 2006, while a reorganisation towards the ethical model can be observed since 2011. This gives a unique, “mixed” quality to the environment of pharmacy operation (Hankó, 2012, Hankó-Zalai, 2012). In the following sections, we present the trends associated with the application of the ethical and mercantile models in the Hungarian public retail drug supply, and investigate the particularities of pharmacy management largely determined by the characteristics of the regulated industrial environment. 17.5. The operation of Hungarian pharmacies in the era of Ethical model (1994-2006) The legislative foundation of the operation of the HPRDS has been established with Act LIV of 1994. Moreover, due to the social embededdness and a large number of stakeholders of the pharmaceutical supply sector, further legal measures (laws, ministerial decrees) have also contributed to the development of its framework. It is important to highlight Act LXXXVII of 1990 (on the prices), Act XXV of 1998 (on drugs), and decree no. 22/2001 of the Ministry of Healthcare, on the marketing and advertisement of human medicines and non-medical healthcare products (Székely, 2009, Feller, 2010). By accepting Act LIV of 1994 on the establishment and operations of pharmacies determining the main rules and guidelines of HPRDS, the parliament has practically removed the sector

73
from under the effect of mechanisms prevailing in free market economy, giving these special enterprises (pharmacies) engaged in public drug distribution a unique, local monopoly. This protection was granted by the following legislative measures (Hankó, 1996, Szabó, 2009):
Public pharmacies could only be established and operated by pharmacists who were natural persons officially approved as professionals possessing specific rights/responsibilities and registered by the NPHMOS
It was a strict constraint regarding the foundation of pharmacies that in order to ensure local monopoly and improve accessibility, the rule of “every 5000 citizens get one pharmacy” was required to be obeyed
A new pharmacy could only be opened at a minimum distance of 300 m from already operating pharmacies. In cities with a population above 50.000, this distance was required to be at least 250 m.
A public pharmacy could only be founded in the form of a private enterprise or a limited partnership. Other economic associations (e.g. limited liability companies or joint stock companies) were not allowed to own pharmacies. In the case of limited partnerships, pharmacist with legal personality was required to be an internal partner, and the share of internal partners’ ownership was required to be over 25%
It is apparent that the parliament gave the right to the retail supply of medical products to independent pharmacies for the most part. The exclusion of wholesalers, manufacturers and other investors from pharmacy ownership – especially from the position of internal partner possessing the rights to control over pharmacy operations – put this sector in a system that was completely different from traditional entrepreneurial forms, strongly hindering initiatives for vertical integration (Poszmik-Barta, 1995). However, due to a number of ‘tricky’ techniques, financial investors and wholesalers started to “pop-up” among pharmacy owners from the 90’s, albeit in an “undercover” form. Moreover, even though regulations have been adjusted to the needs of independent private pharmacies, pharmacists have also recognised the need for unified actions against wholesalers and manufacturers dominating the market. This coordination manifested itself in various procurement association initiatives or other forms of cooperation, which were not entirely successful for the most part (Szabó, 2009). 17.6. Legal changes in the era of the Mercantile model (2006-2011) affecting the foundation and operation of pharmacies The ethical system has been radically transformed by Act XCVIII of 2006. In the following sections, we summarised those provisions of the law on economical pharmaceutical supply – affecting the operation of the total Hungarian healthcare system – that especially pertained to the establishment and operation of pharmacies. By creating the Act of Drug Distribution, government advocated the improvement of the quality of service as well as accessibility, and the reduction of the prices of medical products. This was mostly reflected by the fact that even though it kept “pro forma” the regulatory frameworks of Act LIV. of 1994, but it made the establishment of pharmacies in Hungary easier by creating a number of simple “loopholes” (Grabarits, 2006). The set of main legislative measures initiating the process commonly known as “pharmacy liberalisation” by citizens are listed below (Feller, 2010): The establishment of new pharmacies can be allowed even in the light of the regulations
regarding the population limit of 5000 citizens, in case the pharmacy offers certain additional healthcare, pharmaceutical and retail services in its portfolio.

74
Such additional services are, for example, longer opening hours. The law enables new pharmacies to be established if they are open for 24 hours a day, or for 60 hours a week; or if they are open for 40 hours a week but ensures continuous stand-by.
If pharmacy owners agree to deliver the necessary medical products for in-patients – by
their request – within a 2 km geographical radius of the pharmacy, or launch a website which allows users to order drugs online, they are relieved from under the previous regulations and are allowed to establish new pharmacies.
One of the most important legislative measures of Act XCVIII of 2006 was the
moderation of ownership regulations on companies operating pharmacies. According to this law, any kind of economic association – e.g. limited liability companies and joint stock companies as well – could gain ownership shares in a pharmacy.
Regarding ownership shares compulsory belonging to pharmacists, the law only stated
that the pharmacist possessing specific rights to lead a pharmacy must gain ownership shares. In practice, this could have even meant a 1% share in a limited liability company. As a result, the influence of pharmacists (natural persons) – possessing the specific rights and responsibilites for professional operation – in the management procedures of these new pharmacies decreased.
17.7. Main consequences of the liberalisation in the Hungarian public retail drug supply 17.7.1. Increase in the number of sectoral participants and in competitive intensity In the light of the Act of drug Distribution, in practice anyone could open a pharmacy at any location. The “pharmacy boom” meant that the number of pharmacies operating in Hungary, which was about 2000 in the ethical era, has risen by 20%, thus, there are around 2400 public pharmacies operating in Hungary today (Bodrogi et al., 2012). The fact that the moratorium on the establishment of pharmacies has been extended by the parliament until the beginning of 2011 has also contributed to the increase in the number of pharmacies, even though by that time it was obvious that a market of this size is unable to hold this many participants. From an economic perspective it comes as no surprise that if the number of participants on the “supply” side increases by 20% while drugs’ sales volumes are stagnating, the degree of competitive intensity among pharmacies also increases, which can lead to the “market exit” of certain players (Hankó et al., 2014). 17.7.2. Management difficulties and performance variations The rapidly increasing number of new market entrants to the sector resulted in a significant drop in the average sales and absolute gross margins per pharmacy. Rising operation costs (e.g. utilities, salaries) and additional administrative expenses (e.g. compulsory auditing, solidarity fees) put additional obstacles in the way of pharmacies (Bodrogi-Hankó, 2008). The system suffered from great inequalities, which led to significant variations in the BP of pharmacies. According to reports issued by the HCP, almost a quarter of domestic pharmacies were operating at a loss (Bodrogi et al., 2010), while those businesses that were able to adapt to turbulently changing legislative conditions and developed an innovative strategic attitude, were exhibiting outstanding financial results (de Aguiar et al., 2014). In larger cities, pharmacies were competing each other, while in rural areas were struggling against lowering purchasing power, depopulation, and urban pharmacies attracting their

75
conventional patients (Lindblom, 1959, Hankó et al. 2014). 17.7.3. Concentration, vertical integration and horizontal cooperations 17.7.3.1. Pharmacy Chains The fact that the degree of concentration, vertical integration and horizontal cooperations in the sector was rapidly growing was also an important consequence of the Act of Drug Distribution (Douglas-Dowling, 1990, Szabó, 2009). A large number of wholesalers and financial investors have gained pharmacy ownerships at a rapid pace. These well-capitalised enterprises have often established pharmacy chains to make use of synergies derived from economies of sale and their bargaining power against other stakeholders to enhance their own competitiveness (Jambulingam et al., 2005, Hamilton, 2009). These chains had coherent rules for marketing, procurement and stock management, which sometimes limited the professional and management autonomy of pharmacists. However, they often resorted to loans and contributions from wholesalers to fund their first investments and initial stocks, which resulted in serious debts to wholesalers and credit institutions (Bodrogi et al., 2010, de Aguiar, 2014). Meanwhile independent pharmacies have also realised that the key to long-term stability of operations is to develop some form of cooperation (Dollinger-Golden, 1992). 17.7.3.2. Franchise-type cooperations The initiatives of Hungaropharma and Phoenix Pharma (both wholesalers) offered independent pharmacies a unique alternative for cooperation and strategic partnership. “GyöngyPatika” and “Szimpatika” – the programmes that most resemble franchise-type partnerships – provide their members with a broad range of additional services, as well as the opportunity to purchase medicine at a reduced price (Feller, 2010). The significant marketing support, which involved the usage of a large scale of ATL and BTL advertising media channels and tools, and aimed at building a homogenous brand image, has to be highlighted (Holford, 2007, Lengyel, 2014). Favourable payment terms, additional benefits concerning bank account holding, and the purchase of vehicles as well as discounts for fixed and working capital investments are also worth mentioning. Pharmacies joining these programmes run by wholesalers were bound by contract to make most of their purchases (80-85%) through the wholesaler, with the possibility of a symbolic financial contribution in exchange for certain services or benefits (Jambulingam et al., 2009, Szabó, 2009). The appeal of these programmes largely comes from the fact that they offer purchasing benefits, marketing support and other services without wholesalers acquiring a share of ownership in participating pharmacies, so the professional and managerial autonomy of pharmacists can be preserved (Kay, 2007, Feller, 2010). Hundreds of pharmacies have joined these initiatives so far, and “GyöngyPatika” and “Szimpatika” programmes have been positively received. However, it is considered too soon to establish that these franchise cooperation projects will be those institutional forms that provide struggling pharmacies with a stable and profitable position (Csepeti, 2014). 17.7.3.3. Bottom-up cooperations – procurement associations A large number of independent pharmacies – unwilling to join either the chains of wholesalers
76
and financial investors, or the franchise-type strategic partnerships of wholesalers – were looking for alternative ways of cooperation. In most cases, these pharmacies gathered into procurement associations, in order to gain benefits from wholesalers and producers (Cannon-Perreault, 1999, Srnivasan, 2011). They strived to fund and carry out shared marketing programmes, and were looking for more extensive and more organised ways of communication and professional consultation with patients as well as physicians (Berry, 1995, Hamilton, 2009). Cooperation, however, requires the strict and disciplined management (e.g. in stock management or at sales promotion campaigns) as well as the acceptance of shared ambitions, solidarity towards member pharmacies, and the omission of opportunistic forms of behaviour (Dollinger-Golden, 1992). In view of all this, it appears that the success rate of such initiatives is largely variable (Szabó, 2009). 17.7.3.4. Independent pharmacies Not all of the pharmacies were striving to take part in chains or strategic partnerships. The number of traditionally independent pharmacies giving prominence to professionalism and heavily stressing autonomy of pharmacists is still considerable, even these days (Hankó et al., 2014). Observations suggests that these self-dependent pharmacies are usually located in rural areas holding local monopolies, or at promising well-frequented urban sites and have been more successful even before the liberalisation of pharmacies by maintaining excellent relationships with stakeholders (Hankó et al., 2013, Csepeti, 2014a, b). 17.8. The restoration process towards the ethical model Up to this day, no objective, politically and economically unbiased study has been carried out on the impact of the process of liberalisation initiated by the Act of Drug Distribution accepted in 2006. The present dissertation does not aim at producing such an assessment, it merely points out that opening the market in this field has yielded positive results and extreme anomalies as well. The government formed after the elections of 2010 rather focused on the reduction of these anomalies, adopting the correctional proposals of the HCP which was known to oppose the aforementioned liberalisation process from the beginning. In recent years, the ADD has been modified in order to help restructure the supply chain of medicinal products, and several other laws and regulations have been passed, the most significant ones of which are listed here (Hankó, 2012, Hankó, 2013, Sohajda, 2013, Miles and Snow, 2014): According to the legislative amendment concerning the ownership structure of pharmacies,
a minimum of 51% majority ownership of pharmacists is required in order to establish a pharmacy from 2011 onwards. Pharmacies already in operation have to conform to these criteria in two stages: they are required to reach a minority ownership by pharmacists of 25% by 2014, and a majority ownership by professionals of 51% by 1 January 2017. Share of wholesalers can be maintained and chains can also keep up to 25% of their interests, though they are not allowed to gain additional ownership and recruit further members.
The HCP – in cooperation with the governing bodies of domestic healthcare, various credit
institutions and funds – has developed a subsidised loan programme to stimulate the support for the purchase of shares of ownership for pharmacists possessing personal rights.
According to the changes in legislation, from 2011 onwards, it will only be possible to open
a new pharmacy if geographical and population criteria deem it necessary. Nevertheless, the government, opposing several lobbies of professional organisations of advocacies, did
77
not put a ban on the foundation of new pharmacies in the summer of 2010, but postponed putting it into force to the aforementioned date. More than 150 requests to found new pharmacies were submitted to the NPHMOS even during this half-year period. This measure, which can be viewed as an interphase of the mercantile model, supported mostly the opening of pharmacies that provide additional services, and were of substantial interest to financial investors and wholesalers.
In order to raise the quality standards of services provided in pharmacies and ease the
workload of pharmacy employees, legislative bodies have regulated heavily the minimum number of pharmacists and specialised support personnel employed by pharmacies depending on their weekly opening hours. According to the new regulations, pharmacies are required to employ at least three pharmacists and specialised support personnel in pharmacies that are open for more than 60 hours a week, and at least four pharmacists and specialised support personnel in pharmacies that are open for more than 70 hours a week. This legislation resulted in additional expenditure especially for pharmacies operating with longer opening hours in an urban context, participating in equity-based or franchise-type cooperation projects to a larger extent.
These changes in legislation imposed stronger regulations on pharmacy marketing
activities, especially regarding customer loyalty programmes (Bódis, 2011). According to the 8th subparagraph of the 17th paragraph of the ADD, the price of drugs subsidised by NHIFH cannot be further reduced by any price- or not price-based discount. Moreover, in the case of drugs not subsidised by the social security fund, additional benefits can only be used for the services of pharmacist’s care provided in the pharmacy. Benefits listed under this law (e.g. free samples, vouchers, coupons, loyalty points of purchase) can only be given for items not listed as medicines, i.e. other products. This means that benefits granted by loyalty programmes can only be implemented in connection with non-medicinal products or additional services of pharmacist’s care. Loyal customers may further receive price-based discounts for non-prescribed medications as usual.
Despite continuous legislative corrections, the characteristic traits of the mercantile model still determine most domains of pharmacy management. Due to emerging forms of cooperation, increased competitive intensity, the stagnation of demand, the transition of patients’ preferences, and several other factors influenced by the legislation (e.g. the expansion of generic products, lowered subsidies of the NHIFH, price margins’ regulations, regulations on prescription practice, the institution of pharmacist’s care) pharmacy management cannot return to the conventional practices of the ethical era (Gill et al., 2010). Conscious and ethical marketing activities, rational stock management, extensive correspondence with stakeholders, and efficient organisation of work and HR management are also indispensable criteria of outstanding BP in the period of restoration, which brings about turbulence in the market, professional and legislative environment (Willink, 2009, IMS Health, 2012). Following the introduction of the industry our research examines, we present the practical relevance of our thesis. 18. The sector-specific and business policy relevance of our research By presenting the consistent behavioural patterns firms exhibit while adapting to their environment, M&S did not only create an academic construct, but by focusing on BP implications also attracted substantial interest in the fields of management and economic policy as well. The practical relevance of our thesis on the behavioural patterns of pharmacies

78
pursuing Prospector, Analyser, Defender and Reactor SOs can be summarised as follows. The ADD of 2006 has drastically changed the conditionalities of pharmacy operation. External environmental turbulence has transformed the management processes of pharmacies to a great extent. Numerous managerial tasks – e.g. the adjustment of the portfolio of pharmaceutical products and services to the turbulently changing demands and preferences of patients, the rationalisation of stock management, the professionality of marketing activities and the development of relations with stakeholders of the pharmaceutical supply chain – became prominent (Gummesson, 2002, Spillan-Parnell, 2006). However, the majority of pharmacists were lacking the business knowledge and competences required for the effective and effecient performance of these tasks (IMS Health, 2012, de Aguiar, 2014). Ideally, the aforementioned tactical-level management tasks can be derived from a consistent environmental adaptation pattern (Lindblom, 1959, Inkpen-Choudhury, 1995), the identification of which no one has endeavoured to applying rigorous statistical methodology in a Hungarian industrial environment so far. Furthermore, a number of previous research projects in the field of strategic management tend to deny the diversity, at times even the presence of consistent SOs in regulated sectors (Dranove et al., 1998, Hambrick-Fredrickson, 2001). The fact that studies examining environmental adaptation patterns of pharmacies have identified scientifically less well-grounded SOs primarily based on international, secondary results, further confirms the necessity of the present dissertation from a sector-specific perspective (Jambulingam-Doucette, 1999, Jambulingam et al., 2005). Based on prior research, most striking distinction was observable between managerial features of marketing- and sales-oriented pharmacies (Jambulingam et al., 2005, Harrison, 2005). Distinction was based on criteria such as range of products, intensity of market research, innovation capacity, level of stocks, role of front-line employees, equipment, opening hours and other similar dimensions. Idealtypically, at developed, marketing-oriented pharmacies pharmacists offer general lifestyle counselling services, actively cooperate with several stakeholders, and influence their needs through a proactive attitude (Prahalad-Ramaswamy, 2004, Bauer-Mitev, 2008, Willink, 2009, Saini-Visht, 2014). At sales-oriented pharmacies cost-efficiency is one of the highest priorities. As a result, personal contact between pharmacists and their customers is scarce and sporadic, patients get what they demand, while pharmacists only passively cater to their needs (Mitev-Bauer, 2008a, Feletto et al., 2010). International research have also concluded that besides environmental adaptation patterns pharmacies display, pharmacists themselves can also be sorted into a number of different behavioural clusters (Feletto et al., 2010, Jambulingam et al., 2005). Based on marketing activities, the quality of service and willingness for generic substitution, it is possible to classify pharmacists into four groups: Customer-friendly, Manager, Conservative and Passive (Hindle-Cutting, 2002, Gill et al., 2010). These examinations usually categorise pharmacies on the basis of entrepreneurial mindset, and the level of managerial proactivity. We believe that results listed above may lead to the conclusion that M&S’s strategic typology can have relevance concerning HPRDS. Since 2011, HPRDS has been undergoing another series of turbulent environmental changes. The elimination of the harmful effects of pharmacy liberalisation has begun, as well as a clear rearrangement towards the ethical model. Among government actions aimed at the consolidation of public finances, austerity measures concerning national pharmaceutical budget were of utmost importance. The so-called “Széll Kálmán plan”, for example, has

79
lowered governmental subsidies on publicly funded medications from 343 billion HUF to 190 billion HUF within the course of three years (Szepesi, 2012). As a result of blind bidding procedures, the percentage share of cheaper, generic products among state-subsidised drugs has dramatically risen. Thus beneficial savings have been achieved in the budget, however, stakeholders of the drug supply chain – including pharmacies – suffered a significant loss of income, as well as various anomalies regarding operational processes (e.g. due to lower levels of realised gross margins) (Hankó et al., 2014). The unfavourable evolution of the macroeconomic environment (2007-2012) have led to a fall in purchasing power and a stagnation in the demand for drugs while the increase in workforce and overhead expenses intensified the difficulties in pharmacy management. On the other hand, several industrial policy measures have been taken in order to improve the BP of pharmacies (e.g. generic compensation, service fee, solidarity contribution, and the correction of wholesaler’s margin). These measures were also striving to minimise dissimilarities between high and low turnover pharmacies (Hankó, 2012b, Hankó-Zalai, 2012b). According to the best of our knowledge, there is no short-term prognosis for the radical improvement of macroeconomic factors providing solutions for management problems pharmacies have to face, thus their successful adaptation to environmental changes and the professional management and development of micro-level management processes have been highlighted (Gray et al., 1999, Davis et al., 2001, Némethné, 2010). We believe that by consciously choosing and consistently implementing a SO, pharmacies are able to influence their BP and attenuate the negative effects of restrictive macroeconomic, and the turbulently changing industrial environment (Dye, 2004). The aim of our dissertation is to examine the relevant questions concerning pharmacy operation, and to formulate managerial proposals. Thus, it offers the following benefits to pharmacy managers and industrial policy makers:
1. With the help of multivariate statistical methods and various strategy identification
techniques applied in our thesis, it is possible to determine whether there are any consistent SOs observable in the HPRDS, and if so, how many behavioural patterns can be detected and distinguished (Lindblom, 1959, Mintzberg-McHugh, 1998).
2. By identifying SOs in HPRDS, sectoral decision makers get a detailed picture of the
differences between strategic-level management features displayed by pharmacies adapting to environmental changes by developing distinct adaptation patterns.
3. By examining PEU by pharmacists, stakeholders of the sector can get a clear picture
regarding to what extent pharmacies pursuing different SOs find changes experienced in operational conditions and in the behaviour of stakeholders predictable or unpredictable. Based on our findings decision makers can seek to optimally alter key environmental factors and influence stakeholders’ behaviour accordingly.
4. Based on the revealed relationships between M&S’s SOs and BP, managerial
implications can be drawn to highlight strategic-level management characteristics that increase BP under certain environmental conditions.
5. In view of BP implications, differentiated, “customised” industrial policy decisions
can be made and measures can be taken in order to improve insufficient business knowledge and management competences of pharmacists pursuing different SOs.

80
6. By the application of various mathematical-statistical methods demonstrated in our dissertation, it is possible to establish to what extent variance observed in BP of pharmacies can be explained by their SO, thus enabling us to determine the amount of resources and competencies worth allocating to develop and consistently pursue them.
. 7. By exploring the potential moderating effects of PEU and GL on the relationship
between SO and BP, we can offer guidelines to pharmacy managers to show which behavioural characteristics of given SOs contribute to optimal BP within different perceived environmental conditions and various local contexts.
8. Through the integration of control variables concerning pharmacies’ socio-,
demographic and site characteristics, the effect of additional factors (beyond SOs) on pharmacies’ BP can also be proven or refuted.
Having demonstrated the sectoral topicality and relevance of our dissertation, let us present the conceptual model that serves as a basis of our empirical research. 19. The conceptual model of our doctoral research After reviewing literature on the theoretical implications of M&S’s strategic typology, and on the interrelations of SO, PEU, GL and BP, let us direct our attention towards the formulation of the conceptual model of our doctoral dissertation. Besides publications in scientific literature (Jambulingam et al., 2004, Bliss, 2007, Hamilton, 2009), secondary sectoral sources (e.g. reports of HCP) have been also of great assistance in developing our conceptual model aiming the identification of strategic behavioural patterns and exploring their BP implications in the HPRDS (Szabó, 2009, Feller, 2010, Bodrogi et al., 2012, Hankó et al., 2014). Studies and industrial reports published in the pharmaceutical press largely contributed to narrow the scope of our theoretical constructs examined herein. The aforementioned theoretical constructs served as a basis for our main research questions and hypotheses. The assumed directions and strength of connections between our theoretical constructs, however, to be discussed in chapters 22 and 23 titled “General research questions and hypotheses of our doctoral dissertation”. What follows here is merely a short, scientific and sector-specific interpretation and summary of the theoretical constructs that constitute our conceptual model. 19.1. Strategic orientation During the analysis of strategic literature and the processing of the secondary sources of HPRDS, we were attempting to identify factors that may actually determine the effectiveness and efficiency of pharmacy management. Even though the performance of enterprises of the sector are mostly determined by systemic variables, recently – in order to counterbalance unfavourable macroeconomic conditions and healthcare policy measures, and to utilise favourable ones – the role of conscious, strategic, micro-level pharmacy management has become increasingly important. Previous studies inspecting the sector have led to the conclusion that most domestic pharmacies do not possess a consistent strategic orientation required for successful environmental adaptation, however, most pharmacists have recognised its necessity and have taken initiative in order to achieve it. Literature has also taken notice of the underdeveloped strategic consciousness of micro and small enterprises (Jambulingam et al., 2005, Olson et al., 2005). However, it also often points out that the adoption of a consistent adaptation pattern

81
can help improve the BP of similar organisations significantly (Jelen, 1995, Vecsenyi-Kovach, 1996, Gimenez, 2000, Aragón-Sanchez – Sanchez-Marín, 2005). Thus, the central theoretical construct of our research is focused on the SOs of M&S – Prospectors, Analysers, Defenders and Reactors – which we attempt to identify in the context of HPRDS featuring bureaucratic coordination mechanisms and limited competitive intensity, and exhibiting the microeconomic characteristics of both public and private goods. 19.2. Business performance Perhaps the most frequently examined interrelation of strategic management literature is the stochastic relationship between SO and BP (Chakravarthy, 1986, Buzzell-Gale, 1987, Ketchen et al., 1997, Jennings et al., 2003). Thus, the most important dependent variables of our dissertation imply the BP indices regarding market effectiveness and financial profitability. We intend to answer the question of what influence the prevalence of Prospector, Analyser, Defender, and Reactor SOs may exert on the development of SAL and NP of pharmacies (Hambrick, 1983, Parnell-Wright, 1993, Moore, 2005, Helmig et al., 2014). 19.3. Perceived environmental uncertainty An important objective of our dissertation is to explore the potential moderating effect of PEU by pharmacy managers on the relationship between SOs of M&S and BP of pharmacies. The integration of PEU as a potential moderating construct can be regarded as plausible, since its development is not an unalterable, fix factor, but rather it is based on the pharmacy manager’s subjective perceptions pertaining to the conditions of the market, pharmaceutical and legal environments as well as the behaviour of key stakeholders of HPRDS, thus it may change and is changeable (Ireland et al., 1987, Miller, 1993, Frishammar, 2006). On the basis of secondary sectoral sources, we assume that the effect Prospector, Analyser, Defender, and Reactor SOs have on BP varies depending on the degree of PEU by pharmacy managers (Mitev-Bauer, 2008a, b, c, Csepeti, 2014b). 19.4. Geographical location Based on the inspirations gained from strategic management literature (Kean et al., 1998, Sun-Wu, 2004, Velayudham, 2007) and sectoral observations made in the qualitative stage of our research presented later, GL of pharmacies as a variable – similarly to PEU – has been integrated as a potential moderating factor, not as a control variable. Our decision was justified by results of in-depth interviews we conducted with wide-ranging stakeholders of HPRDS, especially with pharmacy managers, colleagues of the HCP, and wholesaler’s representatives. According to interviewees, M&S’s SOs can manifest in various content and process elements, depending on the GL of pharmacies. Likewise, the BP of such business entities of this sector typically featured by bureaucratic coordination mechanisms and limited competitive intensity is strongly determined by the settlement where the pharmacy is located (Bliss, Desselle-Zgarrick, 2004, Bliss, 2007, Csepeti, 2014a). Therefore, if we presume that GL of pharmacies is in correlation with their SO and BP, then it is logical to integrate GL as a factor having a potential moderating effect on the relationship of SO and BP (Sharma, 1981, Prescott, 1986). Empirical findings supporting our decision are listed in subchapter 21.2.5. 19.5. Control variables In the light of the statistics of HCP (Bodrogi et al., 2010) and other industrial research
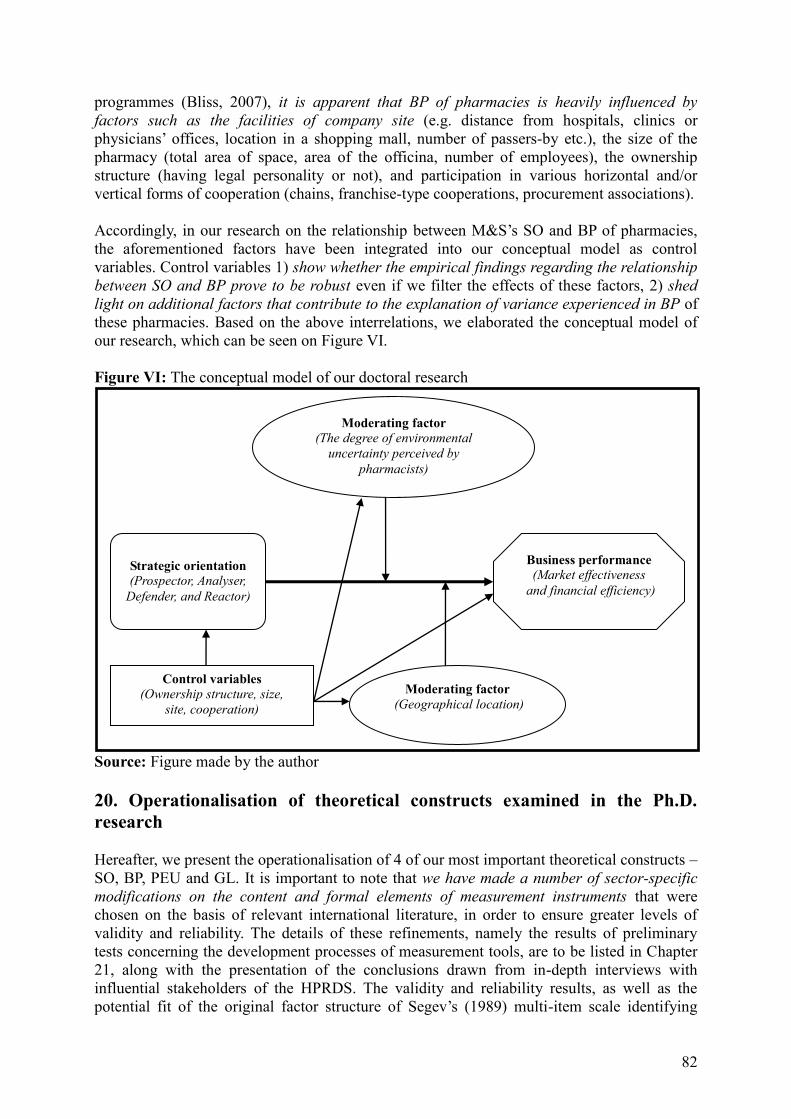
82
programmes (Bliss, 2007), it is apparent that BP of pharmacies is heavily influenced by factors such as the facilities of company site (e.g. distance from hospitals, clinics or physicians’ offices, location in a shopping mall, number of passers-by etc.), the size of the pharmacy (total area of space, area of the officina, number of employees), the ownership structure (having legal personality or not), and participation in various horizontal and/or vertical forms of cooperation (chains, franchise-type cooperations, procurement associations). Accordingly, in our research on the relationship between M&S’s SO and BP of pharmacies, the aforementioned factors have been integrated into our conceptual model as control variables. Control variables 1) show whether the empirical findings regarding the relationship between SO and BP prove to be robust even if we filter the effects of these factors, 2) shed light on additional factors that contribute to the explanation of variance experienced in BP of these pharmacies. Based on the above interrelations, we elaborated the conceptual model of our research, which can be seen on Figure VI. Figure VI: The conceptual model of our doctoral research
Source: Figure made by the author 20. Operationalisation of theoretical constructs examined in the Ph.D. research Hereafter, we present the operationalisation of 4 of our most important theoretical constructs – SO, BP, PEU and GL. It is important to note that we have made a number of sector-specific modifications on the content and formal elements of measurement instruments that were chosen on the basis of relevant international literature, in order to ensure greater levels of validity and reliability. The details of these refinements, namely the results of preliminary tests concerning the development processes of measurement tools, are to be listed in Chapter 21, along with the presentation of the conclusions drawn from in-depth interviews with influential stakeholders of the HPRDS. The validity and reliability results, as well as the potential fit of the original factor structure of Segev’s (1989) multi-item scale identifying
Moderating factor (Geographical location)
Business performance (Market effectiveness
and financial efficiency)
Strategic orientation (Prospector, Analyser,
Defender, and Reactor)
Moderating factor (The degree of environmental
uncertainty perceived by pharmacists)
Control variables (Ownership structure, size,
site, cooperation)

83
M&S’s SOs and multi-item PEU scale of M&S (1978) – tailor-made for the specific attributes of the sector and its stakeholders based on in-depth interviews conducted with pharmacists – is to be discussed in detail in Chapters 27-30. 20.1. The identification of strategic orientations In listing the shortcomings of the strategic research of M&S, we have already emphasised that the combined use of multiple strategy identification techniques is needed in order to ensure a more robust reliability and validity of the strategic typology. Consequently, we apply three, internationally acclaimed extraction methods in our Ph.D. research, the concept of which is illustrated in Figure VII. These are 1) a multi-item scale developed by Segev (1987), 2) the most popular, “self-typing paragraph method” alternative (McKee et al., 1989, Vorhies-Morgan, 2003), and 3) the method of objective indicators (Snow-Hambrick, 1980). The relevance of described strategic extraction methods has also been confirmed by statistical tests in past international research (James-Hatten, 1995, Moore, 2005). 20.1.1. Self-typing Paragraph Method In self-typing paragraph method we asked pharmacy managers to choose one among the definitions of M&S’s SOs drafted in one extended sentence or short paragraph that describes best the adaptation pattern their pharmacy exhibits (Snow-Hrebiniak, 1980, James-Hatten, 1995, Slater-Olson, 2000, 2001). Table XX. contains the English-language definitions of the Prospector, Analyser, Defender, and Reactor SOs previously used in international research, as well as Hungarian translations produced by translators specialised in economics and researchers with an expertise in strategic management literature. The final version of SOs including sector-specific modifications in content and formal elements (Table XXV) is presented at the pre-tests concerning validity and reliability carried out during in-depth interviews conducted with pharmacy managers in Chapter 21.2.1. 20.1.2. Segev’s multi-item scale Multi-item scale of Segev, which has been recognised in various international research, and also proved valid and reliable, asks pharmacists to evaluate the behavioural characteristics – particularly those shown in dealing with the entrepreneurial problem – of Prospector, Analyser, Defender, and Reactor SOs. Pharmacy managers’ responses have been recorded in a metric, five-point Likert scale, where value 1 stood for the given behavioural pattern does not suit the pharmacy at all, while value 5 meant that it is absolutely suits the pharmacy (Dyer-Strong, 1997, Moore, 2005, DeSarbo et al., 2005, 2006). The use of metric scales provided an excellent opportunity for the application of sophisticated mathematical-statistical analyses – e.g. confirmatory factor analysis (CFA), structural equation modelling (SEM) – the results of which may be considered as the most important methodological elements of our theis. The original version of Segev’s scale identifying M&S’s SOs can be found in Table XXI, while its sector-specific adaptation in Hungarian is presented in Table XXIV. 20.1.3. The method of objective indicators The method of objective indicators applicable to the identification of M&S’s SOs is a technique based on indices concerning accounting or other functional fields of management. We were intending to detect indicators that can potentially be used for the observation of Prospectors, Analysers, Defenders and Reactors, based on the implications of strategic

84
management literature, and our “a priori” experiences regarding HPRDS. We attempted to find such sector-specific indicators that can be connected to the central construct of the strategic theory of M&S, the adaptation cycle. We have selected several indices tested in in-depth interviews with pharmacists to measure the different width and depth of product and service portfolios associated to certain SOs, and the varying degrees to which these portfolios are modified by pharmacy managers (Chapter 21.2.3.). 20.1.4. Classification method In order to identify the SO of pharmacies, for each technique we employed different guidelines widely used in international research (Conant et al., 1990, Helmig et al., 2014). In the case of self-typing paragraph method, which is considered to be a nominal measurement tool, classification is the easiest task, since pharmacy managers had to choose only one paragraph which describes the SO that fits best the behavioural pattern displayed in environmental adaptation by their enterprise. Segev’s multi-item scale is a metric measurement tool, in which the weighted average of the evaluations of behavioural characteristics (items) belonging to each SO were compared, on the basis of which we could determine whether responding pharmacies pursue either Prospector, Analyser, Defender, or Reactor SOs (Segev, 1987). The method of objective indicators is, also a metric measurement instrument, which, according to the theoretical guidelines classifies enterprises into M&S’s SOs with quartiles made up on the basis of evaluations concerning the breadth, depth and the alteration rate in the composition of the product and service portfolio. The final classification of companies, combining the results of all three strategy extraction techniques, can be made based on the majority rule (3:0, 2:1). If these three techniques identified three different SOs, then – in the absence of Reactor among the results (that is, in case of P, A, D) – the pharmacy is classified as an Analyser, while if one of the classification results is a Reactor, it is categorised as such (Conant et al., 1990). The validity and reliability of measurement instruments have been tested according to the standard recommendations of methodological literature (Campbell-Fiske, 1959, Churchill, 1979, Anderson-Gerbing, 1988), while the extent of concordance among the results obtained by various identification techniques and especially concerning the distribution ratio (%) of M&S’s SOs in HPRDS have been verified with the help of statistical tests (Chapter 32). 20.2. The operationalisation of perceived environmental uncertainty According to strategic management literature, certain groups of firms perceive dynamic environmental changes as business opportunities, while others regard environmental turbulence as a constant source of uncertainty and threat (Lawrence-Lorsch, 1967, Duncan, 1972). We have to note, that during the selection of measurement instruments for the evaluation of the environment of HPRDS, priority was rather given to academic requirements. Consequently, we introduced multi-item PEU-scale developed by Miles and Snow (1978) into our survey in order to reveal complex relationships between environment, SO, GL and BP. Since the strategic typology of the authors serve as the central theoretical construct of our doctoral research, for its operationalisation, it seemed appropriate to choose a measurement tool that is rooted in the same theory, from a lot of several possible quantitative approaches of PEU (Milliken, 1987, Dess-Rasheed, 1991, Miller, 1993). Our decision is supported by the fact that the validity and reliability of the aforementioned scale has been confirmed by numerous outstanding international studies (Namiki, 1989, Buchko, 1994).
85
Another supporting methodological argument for the application of M&S’s PEU scale is that, according to previous research, it has a confirmatory factor structure, so can be integrated into structural models (SEM), thus it allows us to draw sophisticated conclusions regarding the relationship of “environment-strategy-performance”. The PEU scale of M&S quantifies the degree of perceived changes in the behavioural aspects of certain stakeholders (e.g. suppliers, competitors, regulatory authorities) based on the subjective evaluation of pharmacy managers (Priem et al., 2002). The answers were recorded on a five-point Likert-scale, where value 1 stood for complete unpredictability, while value 5 represented complete predictability. M&S’s PEU scale featured in our survey data collection is presented in Table XXVI. 20.3. Geographical location The operationalisation of the GL of pharmacies has been adapted to the general practice of the Hungarian Central Statistical Office and the sector-specific guidelines of HCP. In our survey data collection, GL of Hungarian public pharmacies has been recorded on an ordinal scale based on the number of inhabitants of the settlement where they were operating. Responding pharmacy managers had to choose one out of five alternatives to indicate clearly the population of the settlement where their pharmacy was located. The possible answers were the following: 1) Budapest, 2) city with population over 50.000 3) city with between 10.000 and 50.000 inhabitants 4) township with a population between 5000 and 10.000 5) settlement with inhabitants under 5000. The categorisation was deemed appropriate, since, according to the in-depth interviews made with stakeholders of the HPRDS, there are significant differences between the SO and BP of pharmacies located in settlements with different sized populations. The possible response alternatives listed in the survey covered the total possible population of pharmacies and they have proven to be mutually exclusive. 20.4. Business performance When operationalising BP of pharmacies, our intention was to use indicators concerning market effectiveness and financial profitability alike. The most relevant and measurable BP indicators in pharmacy management are the following: average monthly sales, annual sales, average realised price margin (%), average monthly gross margin, annual realised gross margin, NP, ROS (Return on Sales), the stock of short and long term liabilities, structure of expenditures (e.g. staff and material costs, overheads, depreciation), etc. (Carroll, 2006, Pillittere-Dugan, 2009). It is worth mentioning that, as a result of tensions in the sector during the past few years, pharmacists tend to be mistrustful in sharing relevant and sensitive data, thus, during our in-depth interviews, besides the use of objective BP indicators, we questioned interviewees about the possibilities of the application of subjective BP indicators compared to sectoral average and/or main competitors, operationalised on a Likert-scale. In spite of the distrust, we decided to ask for concrete, quantifiable BP indicators in our final survey, among which we focused on annual net SAL (market effectiveness), and NP (financial profitability) in our statistical analyses. The measurement instruments applied for the operationalisation of the four main theoretical constructs of our dissertation – the SOs of M&S, BP, PEU and GL – are summarised in Table XXVII.
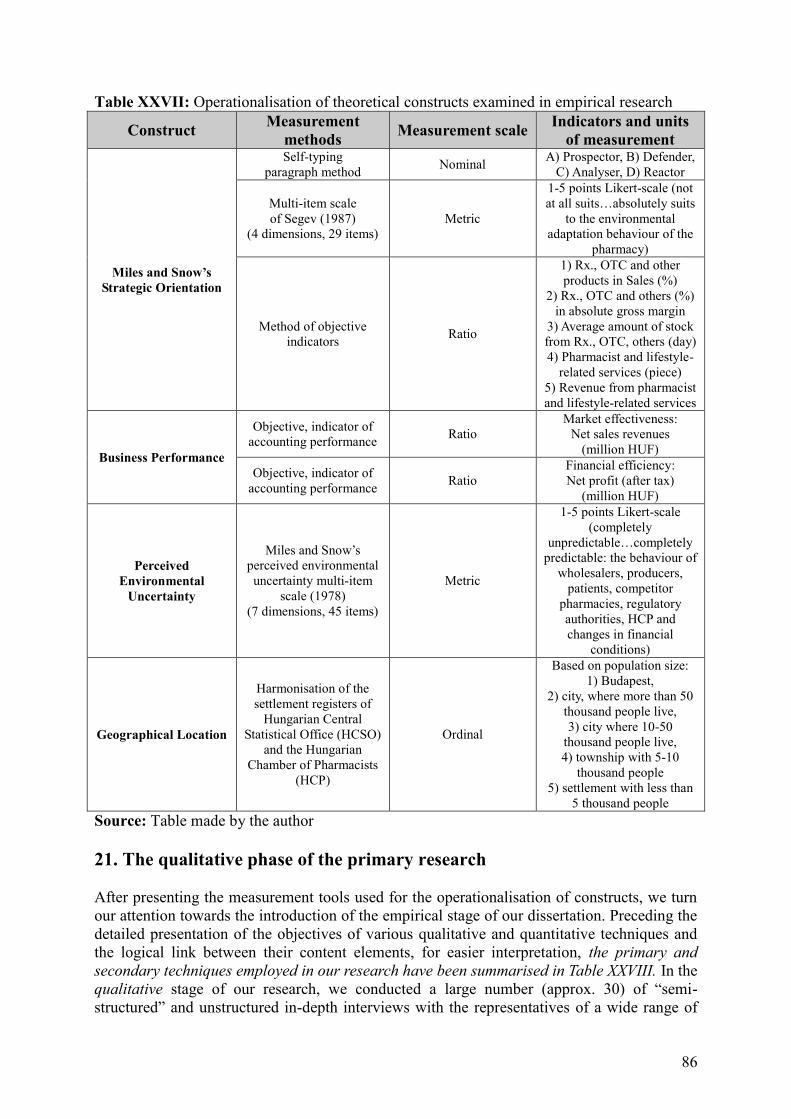
86
Table XXVII: Operationalisation of theoretical constructs examined in empirical research
Construct Measurement methods Measurement scale Indicators and units
of measurement
Miles and Snow’s Strategic Orientation
Self-typing paragraph method Nominal A) Prospector, B) Defender,
C) Analyser, D) Reactor
Multi-item scale of Segev (1987)
(4 dimensions, 29 items) Metric
1-5 points Likert-scale (not at all suits…absolutely suits
to the environmental adaptation behaviour of the
pharmacy)
Method of objective indicators Ratio
1) Rx., OTC and other products in Sales (%)
2) Rx., OTC and others (%) in absolute gross margin
3) Average amount of stock from Rx., OTC, others (day) 4) Pharmacist and lifestyle-
related services (piece) 5) Revenue from pharmacist and lifestyle-related services
Business Performance
Objective, indicator of accounting performance Ratio
Market effectiveness: Net sales revenues
(million HUF)
Objective, indicator of accounting performance Ratio
Financial efficiency: Net profit (after tax)
(million HUF)
Perceived Environmental
Uncertainty
Miles and Snow’s perceived environmental uncertainty multi-item
scale (1978) (7 dimensions, 45 items)
Metric
1-5 points Likert-scale (completely
unpredictable…completely predictable: the behaviour of
wholesalers, producers, patients, competitor
pharmacies, regulatory authorities, HCP and changes in financial
conditions)
Geographical Location
Harmonisation of the settlement registers of
Hungarian Central Statistical Office (HCSO)
and the Hungarian Chamber of Pharmacists
(HCP)
Ordinal
Based on population size: 1) Budapest,
2) city, where more than 50 thousand people live, 3) city where 10-50
thousand people live, 4) township with 5-10
thousand people 5) settlement with less than
5 thousand people Source: Table made by the author 21. The qualitative phase of the primary research After presenting the measurement tools used for the operationalisation of constructs, we turn our attention towards the introduction of the empirical stage of our dissertation. Preceding the detailed presentation of the objectives of various qualitative and quantitative techniques and the logical link between their content elements, for easier interpretation, the primary and secondary techniques employed in our research have been summarised in Table XXVIII. In the qualitative stage of our research, we conducted a large number (approx. 30) of “semi-structured” and unstructured in-depth interviews with the representatives of a wide range of

87
stakeholder groups of HPRDS. Among the interviewees, there were pharmacy managers, leaders of advocacies of pharmacists, wholesaler associates, representatives of producers, pharmacy visiting agents, NHIFH representatives, general practitioners, physicians-specialists, private health fund associates, managers of nursing homes, and of course, patients. The interviews conducted with the stakeholders of HPRDS served the following purposes: Understanding of the various changes and trends ongoing in the environment of HPRDS Get acquainted with the stakeholders and their interests present within the sector Mastering the linguistic peculiarities of pharmacists’ profession Exploring the strategic behaviour and the characteristics and procedures of pharmacy
management processes, and revealing factors determining BP Refining the conceptual model of our doctoral research Composing and refining the scales and other measurement tools applied in the quantitative
stage of our research for the operationalisation of the major theoretical constructs In the light of the fact that our dissertation has to meet a number of strict methodological requirements, in the qualitative phase of our research the main focus was on the last of the aforementioned objectives, the development and perfection of measurement tools used in for appropriate operationalisation of theoretical constructs. Consequently, during our in-depth interviews with sectoral representatives, especially with practicing pharmacy managers, we dealt in detail with the operationalisation methods of the four main theoretical constructs of our research: SO, PEU, BP and GL. In the following chapters, we highlight the essential steps in the process of development, modification and sector-specific customisation of our measurement tools such as the self-typing paragraph method, Segev’s multi-item scale, and Miles and Snow’s PEU scale, as well as the BP indicators concerning market effectiveness and financial profitability of pharmacies.

88
Table XXVIII: Overview of the main sections of the doctoral research, their objectives and applied methodologies
Source: Table made by the author
Research methodology Objectives of the research Sources Schedule
SEC
ON
DA
RY
Lite
ratu
re r
evie
w Circumscription of the construct of strategy and introduction to the development of strategic management
International and domestic academic
journals and economic textbooks
September 2009 – November
2011 Review of the strategic typology developed by Miles and Snow The approach of business performance in the strategic management discipline Conceptualisation of PEU and GL and the introduction of their relationship to BP and SO March 2011 –
October 2012 The micro-economic and strategic characteristics of private and public goods
Recognition of ongoing economic and legal processes of HPRDS and exploration of actual pharmacy management challenges
Industry-specific press (e.g.
Pharmacists’ News)
March 2011 – March 2015
PRIM
AR
Y
Qua
litat
ive
expe
rt in
terv
iew
s
Perception of changes in the trends and environment of HPRDS Cca. 30 interviews (pharmacists, wholesalers,
producers, patients, pharmacy visitors, representatives of advocacies, NHIF
officials, physicians, private health funds, nursing homes etc.)
September 2010 – June 2011
Getting deep acquaintance with the key sectoral stakeholders and their interests Acquirement of the linguistic peculiarities of pharmacists’ profession
Revealing the strategic behaviour, operation mechanisms and management processes of pharmacies, as well as the detailed exploration of influential factors on pharmacies’ BP
Finalisation of the conceptual model of our doctoral research Pharmacy managers, representatives of
HCP, strategic management
researchers and English-Hungarian
economic translators
July 2011– November 2011
Pretesting the validity, reliability, dimensionality and finalisation of the measurement instruments applied in survey research
March 2012 – September 2012
Ex-post discussion of the results, consequences and limitations of the dissertation October – December 2014
Surv
ey d
ata
colle
ctio
n
Identification of the observable SOs in HPRDS
207 responses of pharmacy managers from Budapest and
Pest, Baranya, BAZ, Vas counties
October 2012 – June 2013
Evaluation of the convergent validity of applied strategy extraction methods Definition of the relative distribution of M&S’s SOs identified in HPRDS The examination of contingency theory’s „environmental determinism” and John Child’s „managerial choice” approaches in the context of interactions between SO and PEU Quantification of the stochastic relationship between M&S’s SOs and BP Revealing the potential moderating effects of PEU and GL in the relationship between SO and BP Evaluation of the robustness of the identified interrelations between SO and BP

89
21.1. The development process of the applied measurement instruments The selection of well-defined, theoretically grounded constructs, and their adjustment to the specificities of the industrial context, is an essential prerequisite of high-level quality research projects. This is mainly because quality of the operationalisation following the conceptualisation of the constructs determines the extent to which measurement tools used in empirical examination prove to be valid and reliable (Churchill, 1979, Rossiter, 2002). It has to be emphasised that in the case of our research, this process did not imply the development of brand new scales, but rather the modification of the formal and content elements of measurement tools adapted from international literature, adapting its items to local, sector-specific conditions (Anderson-Gerbing, 1982). Refining the measurement tools took up several months, and involved excessive consultation in the qualitative phase of the research. In the next chapter, we present the results of the pre-tests, the basis on which we slightly altered the items of the Segev and M&S’s PEU scales, and the descriptions of self-typing paragraph method (Bailey et al., 2000). 21.1.1. Exploring multi-item scales and other measurement instruments Based on the processed literature on strategic management and marketing strategy, we collected measurement tools that are capable of the identification of M&S’s SOs and the operationalisation of the environmental uncertainty perceived by pharmacists, and have been applied successfully in previous empirical research (Duncan, 1972, Miles-Snow, 1978, Milliken, 1987, Buchko, 1994, Slater et al, 2005). Based on the in-depth interviews conducted with domestic and international researchers with an expertise in strategic management, as well as leaders of pharmacists’ advocacies within the sector, we have selected measurement instruments that – regarding the relevance of their semantic and content elements – best fit key stakeholders’ (pharmacy managers) requirements involved in the study. 21.1.2. Generating additional scale items We have also gathered some scale items from among the measurement tools that were not used in the empirical phase of our research (e.g. the scale of Conant et al. from 1990), the integration of which was necessary in order to assure the highest possible degree of validity and reliability (Sureshchandar et al., 2002). With the help of domestic and foreign professors, pharmacists and chamber leaders, we have selected additional scale items that help formulate statements that cover the most important theoretical and strategic aspects of a given construct also from the practical perspective of pharmacy operation as well. 21.1.3. Linguistic formulation of content and formal elements of measurement tools Several studies draw attention to the face validity of measurement instruments, since the linguistic deficits of multi-item scales can exert a great influence upon the mathematically and statistically quantified validity and reliability values of the constructs (Parasuraman et al., 1991). During the process, which methodological literature simply calls “translation-back translation”, we have cooperated with two specialised lectors from the field of economy. The linguistic adaptation of measurement tools took place in three steps. First, with the help of one of the translators, we transferred the vocabulary of the original versions of PEU scale (1978) and the Segev-scale (1987) indentifying M&S’s SOs into Hungarian. After that, the other translator specialised on business administration translated back the

90
vocabulary of the Hungarian-language measurement tools into English, and then the reasons behind the discrepancies identified when comparing the original vocabulary and the one translated back into English were discussed in the presence of both translators (Brislin, 1970). After reaching a consensus, in cooperation with the translators, we have created the Hungarian-language “prototypes” of the measurement instruments forming the backbone of the pre-tests conducted with strategic management researchers, sectoral professionals, and pharmacy managers. Finally, the “translation-back translation” method was used again for incorporating the ex-post linguistic observations of the interviewees in order to optimally customised our survey applied in the process of large-sample data collection. 21.1.4. Pre-testing dimensionality and reliability In order to maximise construct validity, next we had to refine the scales that were chosen and completed with additional items. It was important to correct ambiguous phrases, as well as to modify, replace or eliminate scale items that, in terms of formal and content elements, were not perceived coherent with the theoretically appropriate scientific construct by potential respondent pharmacists (Anderson-Gerbing, 1982, Ahire et al., 1995). During the course of the pre-test procedure, we have personally consulted with nine pharmacy managers, and six leaders of the HCP. The in-depth interviews begun with the pre-validity and pre-reliability procedures elaborated by Davis (1986), first we presented in detail the main constructs of our survey – M&S’s SOs, PEU, GL and BP – from the point of view of strategic management theory. Afterwards, the interviewees have been introduced to the latent constructs of SO and PEU, and the manifest scale items attached to them. After they were familiarised with the key concepts and the definitions of the dimensions and items, we went on to pre-testing the dimensionality and reliability of the constructs by the application of a special card task (Gwet, 2014). The essence of the card task can be summarised as follows: the interviewees were asked to assign randomly mixed statements from the scales to the appropriate scientific constructs they were already familiar with (Ahire et al., 1995, Bergkvist-Rossiter, 2007). The results of the task have given us an insight on the extent to which potential respondents of the survey are able to assign randomly presented scale items to the theoretically appropriate constructs. As far as the convergence and divergence in the ratings of participants are concerned, we note that degree of fit of constructs and the items assigned to them were evaluated with the calculation of the inter-rater reliability index (Saal et al., 1980). 21.1.5. The finalisation of measurement instruments In light of the results of the card tasks, we eliminated scale items that were frequently incorrectly classified by participants of the pre-tests, and we deleted or refined any inconsistent or ambiguous phrasing, and also merged few scale items (Bailey et al., 2000). After conducting the mostly qualitative pre-tests on dimensionality, reliability and validity we have come to the end of the finalisation process of the questionnaire used in the large-sample data collection. The key theoretical aspects and methodological results of the pre-tests of the main measurement instruments are listed in the following chapter. 21.2. The most important results of the pre-tests 21.2.1. Segev’s multi-item scale operationalising M&S’s SOs

91
From methodological point of view, the Segev scale has proven to be an ideal choice, but some of the substantive content and formal elements of the Conant et al. (1990) scale, which is an alternative to the Segev scale in international research, have also been integrated (Sureshchandar et al., 2002, Helmig et al., 2014). The Segev scale was refined and completed with the relevant elements of the Conant et al. scale (1990) according to the scientific standards (Churchill, 1979, Nunally, 1988). We have to emphasise that these modifications – proposed by sectoral stakeholders, strategic management researchers, and English translators specialised on economics – did not change the original structure of the Segev scale, all 29 statements have been preserved, the items were merely refined to a minimal extent with regards to their formal and content elements to meet industry-specific requirements. The adoption and adaptation of certain elements of the phrasing in the Conant et al. (1990) scale to the Hungarian version of the Segev scale is illustrated in Table XXII. Table XXIII presents the scale items which – in order to preserve the dimensionality of the original scale – required minimal modifications in their formal and/or content elements based on the conclusions drawn from our interviews with pharmacists. In the case of the operationalisation of the Prospector, Analyser, Defender and Reactor SOs, the content elements of the scale items were deemed consistent with the theory of M&S by the professionals questioned. We highlighted two statements, in case of which even strategic management professionals were unsure whether they can be considered typical of the given SOs. These were the following: “The effort our pharmacy puts into the introduction of new products and services often does not prove to be profitable.”(P) and “In recent years, our pharmacy was aiming at developing a range of products and services that meet patients’ requirements”(R). According to the professionals we questioned, the first statement is not exclusively a characteristic of the Prospector SO, since it can appear in the case of any of M&S’s SOs. Moreover, despite our theoretical accuracy a single word “profitability” had to be explained in detail, since pharmacists questioned could not automatically distinguish between the two concepts of “effectiveness” and “efficiency”. The second statement referring to the Reactor SO failed to verbalise to an appropriate extent the inconsistent, “flustered” behaviour managers exhibit in developing their product and service portfolio. Consequently, we made the following modifications regarding the aforementioned statements: “It is not uncommon that efforts made by our pharmacy to introduce new products and pharmaceutical services turn out to be unsuccessful and unprofitable” (P) and “In recent years our pharmacy has been attempting to adapt its product and service portfolio to the ever changing needs and preferences of our patients (R) Regarding the formal aspects of the statements, only a few modifications were suggested, mostly because of unclear translations. One example was the expression “product or range of products”, the definition of which in the tertiary sector includes services as well, however, according to the experiences of researchers, this would not be clear for those respondents of the survey who do not possess the appropriate background knowledge in the field of economics. Thus, we used the term “product and service portfolio” consequently in the final version of the questionnaire. There was another refinement concerning translation in one of the statements about Reactors: instead of “Our pharmacy is often compelled to act under direct pressure from market and legislative environment”, we wrote of “Our pharmacy often acts upon the direct pressures of the market and regulatory environments”, since the first
92
phrasing was too rigorous and exaggerated, and it questioned the firm’s independence and capacity to act on its own. Apparently, in case of the card tasks conducted with pharmacy managers and strategic management researchers, it was the correct classification of scale items pertaining to Reactor SO that proved to be the most difficult and problematic. According to their opinion, the characteristics of the Reactor SO can appear in the cases of Prospector, Analyser and Defender pharmacies as well. Based on the inconsistencies noticed during the pre-test phase, we predicted a number of validity, reliability and dimensionality concerns regarding the behavioural characteristics of Reactor SO, which will be presented in detail in the mathematical-statistical analyses performed after the survey. Based on the results of the card tasks aiming at matching scale items to SOs, the behavioural attributes of Defender SO were the most clearly phrased ones. Based on all the aforementioned sections, the final version of the Segev-scale identifying M&S’s SOs can be found in Table XXIV. 21.2.2. The self-typing paragraph method The paragraphs – phrased with the help of researchers proficient in the theoretical implications of M&S’s typology, English translators specialised on economics and practicing pharmacy managers – were modified based on the qualitative in-depth interviews made with pharmacy managers. These modifications were mostly sector-specific, and were connected to resources, competences and strategic management processes unique to or better characterising the operation of micro and small enterprises (McGee-Patterson, 2000). In order to increase face and content validity of statements describing Prospector, Analyser, Defender and Reactor SOs, we have phrased them according to the professional vocabulary used by pharmacists. During survey data collection, pharmacists had to select one out of the descriptions of M&S’s SOs – as presented in Table XXV – that best applied to the environmental adaptation behaviour of their pharmacy. We did not include the names of SOs, and referred to them as strategies A, B, C, and D instead. It is important to note that during the pre-tests, pharmacists had no difficulties in classifying their pharmacy as either Prospector, Analyser, Defender or Reactor, based on the final descriptions of SOs (James-Hatten, 1995). 21.2.3. The method of objective indicators Based on the interviews with pharmacy managers the following indicators related to pharmacy management were integrated into our survey in order to help identify the SOs: The relative percentage of prescription (Rx.), OTC, and other products in annual SAL The relative percentage of the aforementioned categories in annual realised gross margin The average size of stock of these categories in the pharmacy (day) The annual SAL of the pharmacy from pharmaceutical, healthcare and lifestyle services The number of pharmaceutical, healthcare and lifestyle services offered by the pharmacy According to the theoretical guidelines of M&S, mostly based on indicators referring to the range of the product and service portfolio, we attempted to identify the Prospector, Analyser, Defender and Reactor pharmacies (Snow-Hambrick, 1980, Hawes-Crittenden, 1980, McDaniel-Kolari, 1987). We divided the results for each indicator into quartiles. Based on the evaluation of pharmacy managers, pharmacies that fall into the highest quartile are considered to be Prospectors, the ones that fall into the second one are Analysers, the ones in the third one are Defenders, while the ones that fall into the last quartile are classified to be Reactors.

93
21.2.4. The perceived environmental uncertainty scale of Miles and Snow Relying on the unanimous opinion of pharmacists questioned, a new dimension was inserted into the PEU scale in addition to the six constructs found in the original measurement instrument. According to pharmacists, beside items pertaining to the behaviour of sector-specific stakeholders, statements regarding general financial conditions, and the financial terms of pharmacy management were missing. In their view, the development of e.g. the rental fees of pharmacies operated in a rented location, overhead expenses, the costs of employment, or the interest rates of loans on working capital are all factors that the (un)predictability of which determine the strategic possibilities of a pharmacy to a great extent. Naturally, the reduction of the scope of scale items regarding the set of financial conditions of pharmacy management, as well as the finalisation of their content and linguistic elements, all were carried out with the involvement of practicing pharmacy managers. Trade unions, featured in the original M&S’s PEU scale as external stakeholders, were modified. The reason for modification was that there are no trade unions operating in HPRDS, while there are several other professional advocacies influencing the mechanisms of the sector. The most significant one is the Hungarian Chamber of Pharmacists, which is licensed as a public body, and the membership of which – in light of a parliamentary resolution pertaining to the obligatory HCP membership of professionals – equals the total population of Hungarian pharmacists (Zalai, 2011). Consequently, instead of the dimension of associated originally to trade unions, the HCP, which assisted us with our research, was integrated into the survey. Our decision is supported by the fact that the sectoral policy proposals of HCP are the ones that frequently reach legislative bodies. Thus the operation of HCP has a great effect on professional, management and ethical aspects of pharmacy operation. The finalisation of statements concerning the level of (un)predictability regarding the activities of HCP was discussed with pharmacists and leaders of the chamber at a special “research forum”. Pharmacists reported difficulties with the interpretation of one of the constructs of PEU scale (competitors), and problems regarding the dimensionality of another factor (financial conditions). The most ambivalent construct of the PEU scale was the one which exhibited statements concerning the behaviour of competitor pharmacies. Most pharmacists simply suggested deleting the construct, since they believed that most pharmacies have no local competitors. Even if they have, they do not monitor them consciously, and even if they did, they would only gain limited insight to the management procedures of competitor pharmacies. Adopting rather scientific point of view, we have included the statements about competitors in the quantitative survey, even if this was against the suggestions of pharmacists, since after the liberalisation, the geographical and demographical limitations on the placement of pharmacies – due to the opened legal “loopholes” – have practically disappeared. This, along with a stagnant market volume, led to the intensification of competition. An existential struggle has erupted between urban pharmacies that were too close to one another, while pharmacies in the cities have attracted patients of those operating in small villages. After processing and discussing the results of the card tasks, we have noticed a divergence in the classification of the items regarding the effect of environmental uncertainty perceived in the development of financial conditions, as most participants have assigned the statements into two groups. The first four statements – short-term loans (e.g. for working capital), long-term loans (e.g. for development), the fluctuation of interest rates, exchange rates – formed one of the groups, while the another four items – the evolution of terms of payment,
94
deadlines, labour costs of pharmacy employees, fluctuation of rental fees and overhead expenses – have been sorted into another cluster. According to the pharmacists, the reason behind this is that the first four statements are in connection with changes concerning the macro factors that are less relevant to them, while the second cluster of phrases refer to everyday aspects of pharmacy management. In spite of all this, we again decided to include the all the eight scale items into the same dimension, since splitting the construct into two during the EFA of CFA analyses later on would not make the interpretation of the statements any more difficult or “risky” neither from a theoretical, nor from a sectoral point of view. In order to increase face validity, pharmacy managers and scholars proficient in strategic management have both suggested the modification of the terms “buyer” and “customer” to “patient”. The main reason for this is that the vocabulary of the competitive market is unfamiliar to most of the pharmacists, and thus many of them would perceive the usage of the word “customer” to describe patients as a sign of “commercialisation”, which is irreconcilable with the ethical norms of the sector, degrading the prestige of the pharmacist’s profession. We decided to fulfil this demand. The final version of the perceived environmental uncertainty scale, which was used in our survey data collection, appears in Table XXVI. 21.2.5. Geographical location In the light of various recommendations coming from literature, we have put a great emphasis on the examination of the role of GL in our doctoral research during our interviews with stakeholders of the HPRDS. Respondents confirmed that GL of pharmacies certainly has an effect on the manifestation of the SO they follow. In the case of Prospector SO, for example, the expansion of the product and service portfolio can occur at a different pace, depth and width in the context of urban pharmacies, from that of pharmacies operating in rural areas. Similarly, according to both the secondary sources and the interviewees, BP of the participants of the HPRDS is largely determined by the type of the settlement where the pharmacy operates (Bodrogi, 2010, Csepeti, 2014a, Hankó et al., 2014). The experiences of interviewees show that even a consistently implemented SO can not guarantee outstanding BP in case of pharmacies that operate in small villages characterised by unfavorable demand conditions. On the other hand, pharmacies in larger cities can operate in an effective and efficient way even without the conscious development of a consistent pattern of adaptation, since more favourable urban environmental conditions enable this. Consequently, it can be predicted that the nature and strength of the effect Prospector, Analyser, Defender and Reactor SOs exert on the BP of pharmacies is different in urban environments than in rural ones. According to the interviewees, as a result of the contingencial features of the HPRDS, it is not worth filtering the effect of pharmacies’ GL when exploring the relationship of SO and BP, since it is exactly the GL variable that can shed light on the possible differences between the consequences of pursuing certain SO regarding the effectiveness and profitability of pharmacies depending on their urban or rural location. By the reason of the heightened sectoral inquiry, the GL construct has been integrated into our conceptual and measurement models as a factor moderating the stochastic relationship of SO and BP. Our decision is supported by the fact that, since the period of pharmacy liberalisation, the modification of parameters affecting GL of pharmacies has been made
95
possible by the concessions connected to the criteria of the foundation of pharmacies. “Investors” (e.g. capital companies, wholesalers) wishing to increase the number of pharmacies they own, the choice of GL and site facilities of their existing and new pharmacies was a cardinal issue, but a large number of rural pharmacies were also attempting to open a new unit in a busy, urban area. Hence, for managers GL cannot be considered as an unalterable factor in the operation and environmental adaptation of pharmacies, and thus it cannot be interpreted solely as a control variable even from a methodological point of view. The measurement instrument which categorises the possible settlements where pharmacies operate on a 5-point ordinal scale, and has been used for the operationalisation of GL, was fully supported by the interviewees to be applied in the survey, but – as it is clear from the aforementioned examples – they recommended the distinction of “urban” and “rural” areas for the purposes of better data analyses and interpretation. 21.2.6. Business performance The vast majority of pharmacists and chamber leaders participating in the qualitative phase of our research agreed that the development of the most important BP indicators should be surveyed in a quantitative way, striving to specify the concrete value. The evaluation of the relative BP (compared to sectoral average or to competitor pharmacies) on a Likert-scale, as suggested by strategic management researchers, was rejected, because BP of individual pharmacies is less transparent in this turbulently changing sector full of conflicts of interests. Our interviewees have also claimed that they seldom read sectoral statistics, and not only do they have little to no information on the BP of their competitors, sometimes they find it hard even to identify them. None of the respondent pharmacists had difficulties in determining SAL – which is considered the most important dependent variable of our research – in the pre-tests. However, a number of pharmacists have noted that when answering the question regarding NP, survey respondents will probably give the value featured in the account books, instead of the actual one, and the latter one usually surpasses the former. Pharmacists had to face serious difficulties in distinguishing between relative and gross margins realised on main product categories (Rx., OTC,others), as well as evoking appropriate data (or finding it in a software). It has been pointed out that pharmacists with insufficient business knowledge and management competences are likely to provide unreliable data on recent BP indicators. Nevertheless, BP indicators pertaining to effectiveness and profitability were mostly deemed relevant, clear and answerable by pharmacists from the point of view of the doctoral research. Pharmacists have called our attention to the fact that as long as issues such as anonymity and strictly confidential data processing are sufficiently stressed in the cover letter, the willingness of respondents to provide answers to questions related to BP of their pharmacy will also significantly increases (Tourangeau et al., 2000). 22. General research questions of the doctoral dissertation Following the presentation of the literature-based implications of M&S strategic typology, the HPRDS, the specific practical and microeconomic characteristics of pharmacy management and the development processes of our measurement instruments, we formulated the research questions of our doctoral dissertation.

96
22.1. Relevance of the M&S typology and the prevalence of its strategic orientations The relevance of the M&S typology has been examined predominantly within various industries of the US, but Prospector, Analyser, Defender and Reactor SOs have been successfully identified also for example in Great-Britain, Australia, Canada, Japan, Portugal and Brazil. Following the recommendation of Hambrick (2003) – although the typology is widely used and is proved to be able to forecast the BP – its validity, reliability and generalisability requires constant inquiry. This is especially true if it is examined in an unconventional environment, different from the one in the US – for example in a relatively small market characterised by limited competition intensity and majority of micro-enterprises. The priority of our research is to test the M&S classification in a sector characterised by strong bureaucratic coordination mechanisms. The environment of HPRDS has been characterised by radical changes in the past years. To this turbulence even stakeholders entering the market during the ethical era reacted differently, interpreted changes made by the legislation in different ways and each of them formulated heterogeneous strategic approaches. The liberalisation of the pharmacies offered a possibility to several hundred new market entrants to carve out a part of the market for themselves, so this group viewed these changes also differently – mostly in a positive light – and initiated an intensive expansion. The recent ethical restoration processes, the system-wide transformations, the behaviour of the stakeholders and the unpredictability of the environmental conditions provoke wildly varied reactions from the pharmacists, so their answer is also featured by a variety of business policies reflecting to the new challenges. During the mid-2000s, when pharmacies constituted a more or less monolith, homogenious block from a strategic point of view, due to the liberialisation and the intensifying degree of competition we have witnessed a significant divergence in their management behaviour. Based on theoretical implications, drastically changed environmental conditions forced homogenious strategic behavioural patterns to disappear in a turbulent rate. According to the interviews conducted with representatives of key sectoral stakeholders, the broadening of the legal and business „playfield” opened up the possibility of numerous SOs for pharmacies to pursue. So in our first research question (Q1) we examined the following: Q1: According to the environmental adaptation behaviour of pharmacies, can we observe
all the original SOs of M&S (Prospectors, Analysers, Defenders and Reactors) in the HPRDS?
As one of the main consequence of the liberalisation process between 2006 and 2011 can be considered the increased degree of competitive intensity in the HPRDS. The urge for better performance and existential struggle induced by stagnating market volumes revalorised the role of classical management functions. In certain areas of pharmacy management (like inventory management or marketing activities) the effective and efficient performance of the arising tactical and operative level tasks necessitated a well-grounded strategic positioning, situation analysis and entrepreneurial approach. Pharmacy managers assessing the external market, pharmaceutical and legal conditions of the environment and considering their own resources and competencies, exhibited more and more conscious SOs. As a consequence of the abovementioned, we could identify companies having significantly different strategic approaches and business practice in regards of pharmaceutical product and service portfolio, segmentation of the patients and positioning of the pharmacy. This process

97
has not been interrupted by even the ethical restoration after 2011, the prolonging effects of economic downturn and austerity measures of fiscal policy further developed the strategic consciousness and managerial competencies of pharmacists. Our second research question (Q2) focused on the stage, which the process of divergence observed in the pharmacies’ SOs is. We intended to know that amongst pharmacies pursuing Prospector, Analyser, Defender and Reactor SOs what kind of different behavioural patterns have been emerged and/or to what extent the management characteristics of the idealtypical SOs of M&S have been mixed. Q2: In the HPRDS whether markedly distinguished, pure SOs or hybrid/mix
environmental adaptation patterns can be identified? The third research question (Q3) of our doctoral dissertation possesses accentuated importance from an academic perspective, as it concerns the operationalisation of the M&S’s SOs. In our research, to assure robust degrees of validity, we applied 3 strategy identification methods to reveal Prospector, Analyser, Defender and Reactor pharmacies. This is of paramount importance, hence according to earlier research the number of identified SOs in certain sectors and their relative distribution to each other significantly differed based on the chosen measurement instruments. The previous empirical studies are lacking in the sense that to observe strategic behavioural patterns they usually applied only one extraction method which thus provided less valid and reliable classification results. We assume that the combined application of the self-typing paragraph method, the multi item scale of Segev and the method of objective indicators substantially contributes to obtain thoughtful evaluations by respondents regarding the behavioural aspects of the SO pursued by their pharmacies. So in our Q3 research question we tested convergent validity of various measurement instruments used to identify M&S’s SOs in its classical sense and we examined the following: Q3: To what extent distribution ratios of pharmacies – following Prospector, Defender,
Analyser and Reactor SOs identified in HPRDS – differs based on the classification results of diverse strategy extraction techniques applied in our research?
22.2. The distribution of the Miles and Snow’s strategic orientations and the perception of the operational environment’s elements In the literature review sections of our thesis we already treated the question in detail whether we can find any relationship between the emergence of companies exhibiting various strategic behavioural patterns and the operational environment defined by sector-specific characteristics. We came to the conclusion that the distribution of Prospectors, Analysers, Defenders and Reactors in the previous studies – in contrast to the initial observations of M&S – has shown a various picture. Research examining the interaction between environment and strategy also pointed out that the environmental conditions do not affect companies’ SO in their pure, objective form, but rather through the filter of managers. The subjective and different perception of environmental conditions and stakeholders’ behaviour by managers can lead to the situation where they interpret similar sectoral contingencies in different ways and provide differing strategic responses. Empirical research of the M&S typology also showed that given environmental and industrial conditions prefer the prevalence of certain resources and the capabilities of specific SOs, while less favor the idiosyncratic behavioural characteristics of other SOs. The prevalence of
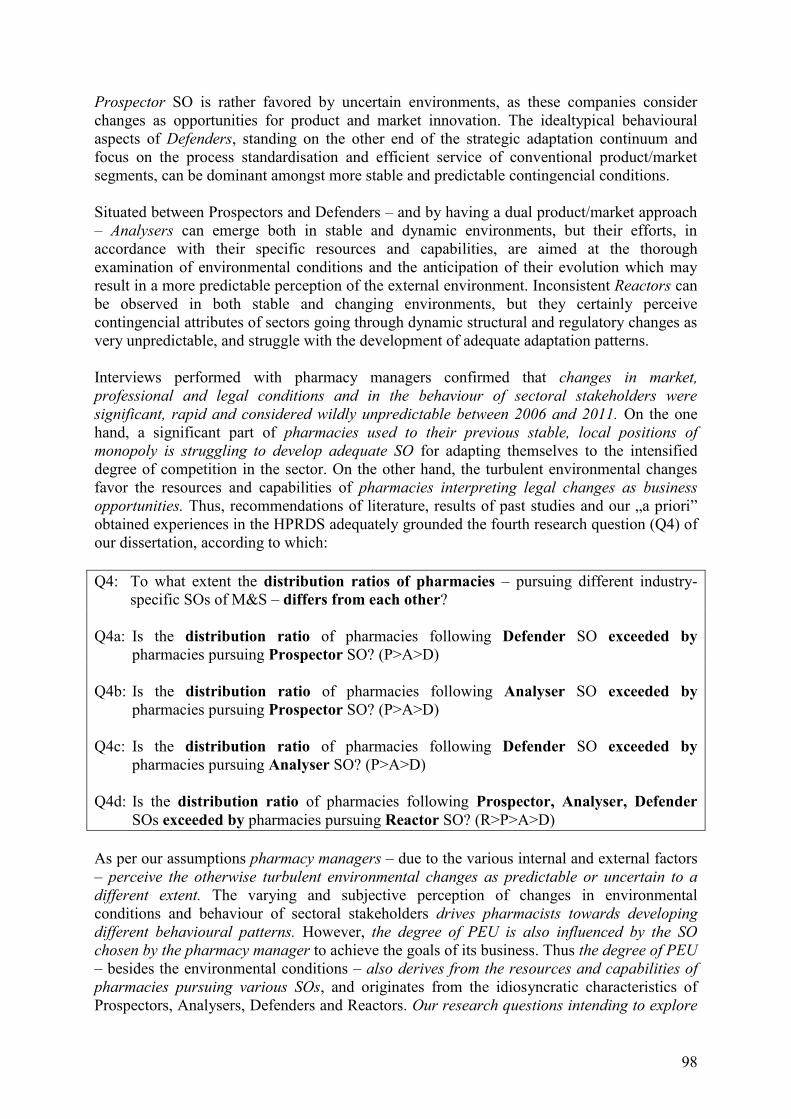
98
Prospector SO is rather favored by uncertain environments, as these companies consider changes as opportunities for product and market innovation. The idealtypical behavioural aspects of Defenders, standing on the other end of the strategic adaptation continuum and focus on the process standardisation and efficient service of conventional product/market segments, can be dominant amongst more stable and predictable contingencial conditions. Situated between Prospectors and Defenders – and by having a dual product/market approach – Analysers can emerge both in stable and dynamic environments, but their efforts, in accordance with their specific resources and capabilities, are aimed at the thorough examination of environmental conditions and the anticipation of their evolution which may result in a more predictable perception of the external environment. Inconsistent Reactors can be observed in both stable and changing environments, but they certainly perceive contingencial attributes of sectors going through dynamic structural and regulatory changes as very unpredictable, and struggle with the development of adequate adaptation patterns. Interviews performed with pharmacy managers confirmed that changes in market, professional and legal conditions and in the behaviour of sectoral stakeholders were significant, rapid and considered wildly unpredictable between 2006 and 2011. On the one hand, a significant part of pharmacies used to their previous stable, local positions of monopoly is struggling to develop adequate SO for adapting themselves to the intensified degree of competition in the sector. On the other hand, the turbulent environmental changes favor the resources and capabilities of pharmacies interpreting legal changes as business opportunities. Thus, recommendations of literature, results of past studies and our „a priori” obtained experiences in the HPRDS adequately grounded the fourth research question (Q4) of our dissertation, according to which: Q4: To what extent the distribution ratios of pharmacies – pursuing different industry-
specific SOs of M&S – differs from each other? Q4a: Is the distribution ratio of pharmacies following Defender SO exceeded by
pharmacies pursuing Prospector SO? (P>A>D) Q4b: Is the distribution ratio of pharmacies following Analyser SO exceeded by
pharmacies pursuing Prospector SO? (P>A>D) Q4c: Is the distribution ratio of pharmacies following Defender SO exceeded by
pharmacies pursuing Analyser SO? (P>A>D) Q4d: Is the distribution ratio of pharmacies following Prospector, Analyser, Defender
SOs exceeded by pharmacies pursuing Reactor SO? (R>P>A>D) As per our assumptions pharmacy managers – due to the various internal and external factors – perceive the otherwise turbulent environmental changes as predictable or uncertain to a different extent. The varying and subjective perception of changes in environmental conditions and behaviour of sectoral stakeholders drives pharmacists towards developing different behavioural patterns. However, the degree of PEU is also influenced by the SO chosen by the pharmacy manager to achieve the goals of its business. Thus the degree of PEU – besides the environmental conditions – also derives from the resources and capabilities of pharmacies pursuing various SOs, and originates from the idiosyncratic characteristics of Prospectors, Analysers, Defenders and Reactors. Our research questions intending to explore

99
the relationship between PEU and M&S’s SOs were built up step by step. First, we approached the interaction between strategy and environment from Child’s (1972) managerial choice theory, i.e. from the SOs consciously selected by pharmacists. Q5: Does the degree of PEU by pharmacy managers – following different SOs of M&S –
differ from each other? Q5a: Is the degree of PEU by pharmacists following Analyser SO exceeded by the degree
of PEU by pharmacists pursuing Prospector SO? (P>A>D) Q5b: Is the degree of PEU by pharmacists following Defender SO exceeded by the degree
of PEU by pharmacists pursuing Analyser SO? (P>A>D) Q5c: Is the degree of PEU by pharmacists following Defender SO exceeded by the degree
of PEU by pharmacists pursuing Prospector SO? (P>A>D) Q5d: Is the degree of PEU by pharmacists following Prospector, Analyser, Defender SOs
exceeded by the degree of PEU by pharmacists pursuing Reactor SO? (R>P>A>D) Our sixth research question (Q6) according to the propositions of contingency theory is interpreting the relationship between PEU and the prevalence of Prospector, Analyser, Defender and Reactor pharmacies from the perspective of the determining effect of environmental conditions (Hofer, 1975). Based on contingency theory’s implications, we examined whether pharmacies perceiving various degrees of unpredictability in environmental conditions and sectoral stakeholders’ behaviour exhibit different SOs or not. Q6: Does the prevalence (i.e. distribution ratio and strategic-level management
characteristics) of different SOs of M&S differ according to groups of pharmacies characterised by either high or low degrees of PEU?
Q6a: In the group of pharmacies characterised by high degrees of PEU is the prevalence of
Prospector SO greater than in the group featured by low degrees of PEU? Q6b: In the group of pharmacies characterised by high degrees of PEU is the prevalence of
Defender SO lesser than in the group featured by low degrees of PEU? Q6c: In the group of pharmacies characterised by high degrees of PEU is the prevalence of
Analyser SO lesser than in the group featured by low degrees of PEU? Q6d: In the group of pharmacies characterised by high degrees of PEU is the prevalence of
Reactor SO greater than in the group featured by low degrees of PEU? Based on the research findings of strategic management literature, in regards to the degree of perceived (un)predictability in the behaviour of stakeholders of external environment and the development of contingencial conditions, the direction and strength of the casual relationship between PEU and SOs of companies are not unambiguous. On the one hand, the external environmental conditions may determine which SOs would be followed by the managers, while on the other, the perception of external conditions by managers could be influenced by the SO chosen based on the availability of resources and capabilities of their businesses. Before the liberalisation, in the period featured by a more limited intensity of competition,
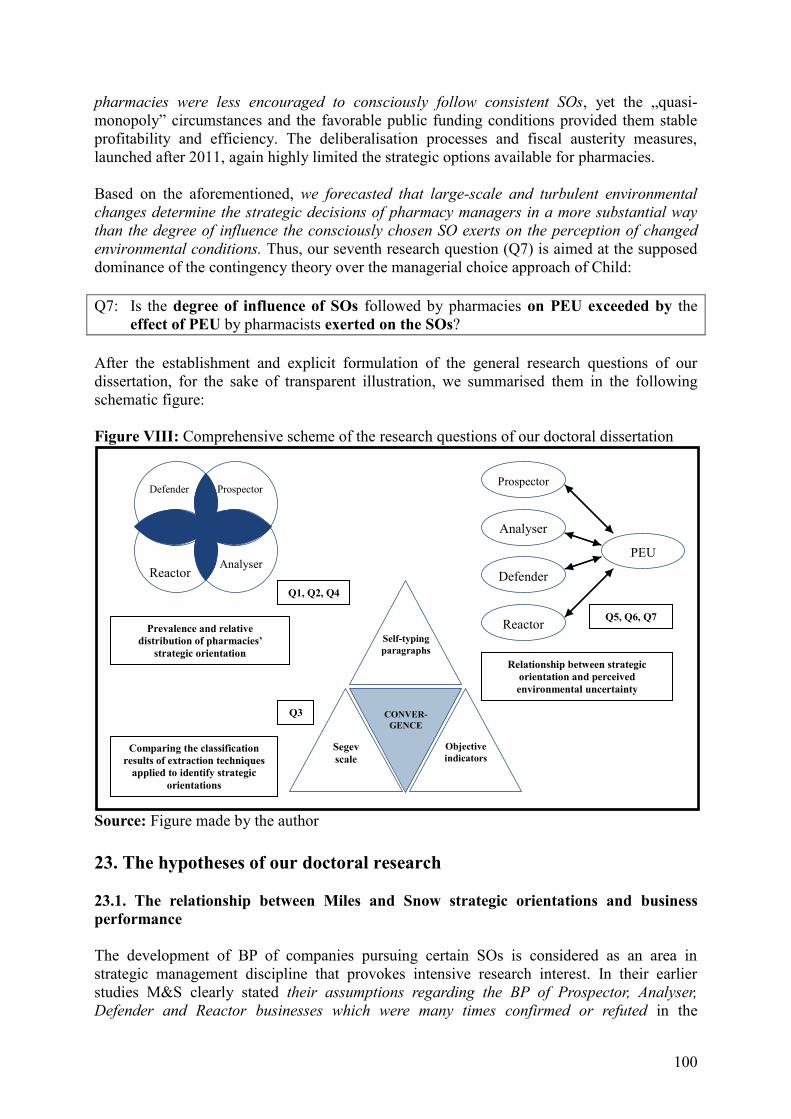
100
pharmacies were less encouraged to consciously follow consistent SOs, yet the „quasi-monopoly” circumstances and the favorable public funding conditions provided them stable profitability and efficiency. The deliberalisation processes and fiscal austerity measures, launched after 2011, again highly limited the strategic options available for pharmacies. Based on the aforementioned, we forecasted that large-scale and turbulent environmental changes determine the strategic decisions of pharmacy managers in a more substantial way than the degree of influence the consciously chosen SO exerts on the perception of changed environmental conditions. Thus, our seventh research question (Q7) is aimed at the supposed dominance of the contingency theory over the managerial choice approach of Child: Q7: Is the degree of influence of SOs followed by pharmacies on PEU exceeded by the
effect of PEU by pharmacists exerted on the SOs? After the establishment and explicit formulation of the general research questions of our dissertation, for the sake of transparent illustration, we summarised them in the following schematic figure: Figure VIII: Comprehensive scheme of the research questions of our doctoral dissertation
Source: Figure made by the author 23. The hypotheses of our doctoral research 23.1. The relationship between Miles and Snow strategic orientations and business performance The development of BP of companies pursuing certain SOs is considered as an area in strategic management discipline that provokes intensive research interest. In their earlier studies M&S clearly stated their assumptions regarding the BP of Prospector, Analyser, Defender and Reactor businesses which were many times confirmed or refuted in the
Q5, Q6, Q7
Self-typing paragraphs
CONVER-GENCE
Objective indicators
Segev scale
Defender Prospector
Reactor
Prospector
Analyser
Reactor
Defender
PEU
Q1, Q2, Q4
Q3
Relationship between strategic orientation and perceived environmental uncertainty
Prevalence and relative distribution of pharmacies’
strategic orientation
Comparing the classification results of extraction techniques
applied to identify strategic orientations
Analyser

101
academic works of the next 30 years (Table IX). Therefore in our thesis investigating the relevance of M&S’s strategic typology in Hungary, we also tested their original propositions. Due to the turbulent changes in HPRDS (e.g. increased competitive intensity, decreasing public funding, the spread of horizontal and vertical integration forms etc.) resulted in the fact that considerable part of pharmacies are operating at a loss and variances in their BP increased remarkably. The in-depth interviews conducted with key stakeholders of the sector revealed that certain groups of the pharmacists’ population „socialised” within limited competitive conditions of the past decades have less managerial skills and less developed management competencies which is making difficult to adapt their business to the changing environment. At the same time, pharmacies make a serious effort to continuously improve their business practices and management processes. Therefore in our research we assumed a wide variation regarding the market effectiveness (sales) and financial profitability (net profit) BP indicators realised by domestic pharmacies. Based on the degree of fit or misalignment of SO and PEU, we assumed differences between BPs exhibited by Prospector, Analyser and Defender pharmacies. Prospectors, considered as pioneers in intensive search for product/market innovations, interpret turbulent changes experienced in HPRDS as a business opportunity. They offer specific and deliberate strategic responses to unpredictable environmental conditions aiming at the expansion of their product and service portfolio and locating new patient segments, which in turn can result in higher levels of SAL. Defenders, more interested in improving their conventional product offerings and in the standardisation of management processes are more likely to respond to turbulent environmental changes by taking measures directed to enhance the degree of loyalty of their patient segments. Due to their nature to minimise business risks, they tend to economise financial resources and are less open to improvementd of the conventional product offerings and the standardisation of management processes, so they realise lower levels of SAL compared to Prospectors. The response of Analysers to the unpredictable environmental conditions – combining the behavioural aspects of Prospectors and Defenders – aims at the cautious expansion of product and service portfolio, yet simultaneously keeping their patient segments with conventional products. Due to the introduction of promising products and services and the prudent use of resources to find new perspective patient segments, Analysers’ SAL are expected to be higher than that of Defenders, but lower than that of Prospectors. Hence, our first hypothesis (H1) is formulated to test the relationship between the SOs of M&S and pharmacies’ SAL: H1: The strength of the relationship between Prospector, Analyser, Defender SOs and
the sales of pharmacies differs from each other. (P>A>D) H1a: The strength of the positive relationship between Prospector SO and sales of
pharmacies exceeds the degree of the positive relationship between Analyser SO and sales of pharmacies. (P>A>D)
H1b: The strength of the positive relationship between Prospector SO and sales of
pharmacies exceeds the degree of the positive relationship between Defender SO and sales of pharmacies. (P>A>D)

102
H1c: The strength of the positive relationship between Analyser SO and sales of pharmacies exceeds the degree of the positive relationship between Defender SO and sales of pharmacies. (P>A>D)
The empirical observations of Hambrick (1983a) and the majority of research studying BP implications proved that the individual M&S’s SOs have a different BP focus and also show different results based on these various performance dimensions. The methodological distinction between market effectiveness (sales) and financial profitability (net profit) was assumed to be well-grounded and justified in our thesis too. The degree of PEU regarding the behaviour of HPRDS’s stakeholders and the changes in the regulatory conditions, encourages Defenders to the deeper exploitation of their actual product/service segments’ potential, as well as the rational use of financial resources and the improvement of efficiency by the standardisation of management processes. As a result, a significant increase of NP for Defender pharmacies can be predicted. In contrast to Defenders, pharmacies following Prospector SO react to the turbulent environmental changes with the expansion of product and service portfolio, reaching and addressing new patient segments and introducing innovative business practices. However, these necessitate significant financial investment, so the profitability of Prospectors is expected to fall behind compared to the Defenders. Analyser pharmacies operating by dual product/market approach are expected to split their financial resources, channeling one part of it to introduce new value propositions and while the rest to retain existing patient segments and standardise management processes. As a consequence, their NP is expected to lag behind that of Defenders, but exceeds the profitability of Prospectors. Thus, our second hypothesis (H1) concerning the effect of SOs on NP of pharmacies is the following: H2: The strength of the relationship between Prospector, Analyser, Defender SOs and
the net profit of pharmacies differs from each other. (D>A>P) H2a: The strength of the positive relationship between Defender SO and the net profit of
pharmacies exceeds the degree of the positive relationship between Analyser SO and the net profit of pharmacies. (D>A>P)
H2b: The strength of the positive relationship between Defender SO and the net profit of
pharmacies exceeds the degree of the positive relationship between Prospector SO and the net profit of pharmacies. (D>A>P)
H2c: The strength of the positive relationship between Analyser SO and the net profit of
pharmacies exceeds the degree of the positive relationship between Prospector SO and the net profit of pharmacies. (D>A>P)
The majority of the M&S typology research studying its BP implications proved that the BP of the organisations exhibiting consistent SO exceeds that of Reactors. However, in the studies demonstrating the possibility of realisation of optimal BP for Reactors, authors examined precisely those sectors which were characterised by limited competitive intensity due to certain state authorities and regulations. However, despite the prevalence of bureaucratic coordination mechanisms – based on the

103
interviews with the pharmacy managers – we still hypothesised suboptimal BP for pharmacies pursuing inconsistent SOs. We assume Reactors are unable to respond by deliberate and decisive strategic answers to the erratic behaviour of HPRDS’s stakeholders and to the instability of environmental conditions. They are „drifting” and „muddling” with the regulatory changes, in most cases just waiting for the slowdown of the environmental turbulence and the assistance of sectoral policy decision makers. Even if environmental pressures force them to act, due to the lack of adequate resources and capabilities they are not able to develop a successful behavoral pattern of environmental adaptation and strategic-level management. They make unfounded decisions regarding product and service portfolio expansion, are not able to address new patient segments and fail to conserve their conventional markets and to streamline their management processes. Thus, in our hypotheses we forecast that Reactors realise suboptimal BP, so their SAL and NP are also fall behind compared to Prospectors, Analysers and Defenders: H1d: Following Reactor SO exerts a negative influence on the sales of pharmacies. H2d: Following Reactor SO has a negative effect on the net profit of pharmacies. 23.2. The potential moderating effect of perceived environmental uncertainty on the relationship between strategic orientation and business performance In Chapter 12.2. we concluded that strategic management discipline maintains the opinion that various SOs can also emerge in environmental conditions which are not idealtypical for them. It also claims that if there is a discrepancy in the fit between the perception of environmental conditions by managers and the pursued SO, then its negative effects can be detected in the BP of the firm. Thus we did not predict either that in groups of pharmacies characterised by low or high PEU only those pharmacies can be found which pursue a theoretically adequate SO, but we certainly assumed that the degree of PEU can influence the development of the relationship between SO followed by pharmacies and their BP. Resources and competencies of pharmacies pursuing Prospector SO are suitable to seize business opportunities arising in the changes of market, pharmaceutical and regulatory environments. Based on our reasoning, it is logical that in parallel to the increase of the degree of PEU Prospectors – interested in the innovative expansion of their product and service portfolio – are continuously able to reach new patient segments which results in the increase of their SAL. Similarly, in case of the decrease of PEU, Prospectors are discouraged to expand their exact product and service portfolio which would be the most compatible with their resources and competencies, thus resulting in a decrease of their turnover. In an analogical manner, the increase of PEU makes it less possible for pharmacies pursuing Defender SO to conduct a business behaviour compatible with their skill set. The turbulent environmental changes divert resources from serving efficiently the conventional product/market domains, leading to the decrease in Defenders’ NP. However, the decrease of the perceived unpredictability by pharmacy managers allows Defenders to optimise management processes and to exploit existing patient segments by conventional products, which can cause an increase in their profitability. The BP of Analysers, running by dual product/market approach, is characterised by a healthy balance which is manifested by an average optimal level in regards of both efficiency and effectiveness. Turbulent changes in the market, professional and legal environments of the

104
HPRDS shift Analyser pharmacies to partially give up the balance between the conventional and innovative product/service segments. Based on our experience obtained via the in-depth interviews, the increase of competitive intensity forces decisive steps on the part of pharmacies to expand their product and service portfolio, overshadowing the efficient serving of existing patient segments with conventional products. Based on the abovementioned, in our third hypothesis (H3) we assumed that with the increase of PEU the relationship between viable SOs and SAL is getting stronger, while compared to NP it is weakening: H3: PEU moderates the relationships between M&S’s SOs and sales of pharmacies. H3a: In parallel to the increased degree of PEU the positive relationship between
Prospector SO and sales of pharmacies strengthens. H3b: In parallel to the increased degree of PEU the positive relationship between Analyser
SO and sales of pharmacies strengthens. H3c: In parallel to the increased degree of PEU the positive relationship between Defender
SO and sales of pharmacies strengthens. H4: PEU moderates the relationships between M&S’s SOs and net profit of pharmacies. H4a: In parallel to the increased degree of PEU the positive relationship between
Prospector SO and net profit of pharmacies weakens. H4b: In parallel to the increased degree of PEU the positive relationship between Defender
SO and net profit of pharmacies weakens. H4c: In parallel to the increased degree of PEU the positive relationship between Defender
SO and net profit of pharmacies weakens. Reactors are reluctant to make bold decisions and to take decisive managerial actions in response to changed environmental conditions. These pharmacies supposedly refrain from the introduction of new products and services, as well as are less willing to reach new patient segments and adopting innovative business practices. However, if they perceive the degree of environmental turbulence too high, they tend to make their business decisions from mere necessity and it is likely that this pressure leads to an even more inconsistent managerial decision-making. The ill-conceived policies of resource allocation and development of competences result in portfolio expansions not suitable for local patient needs and further deterioration of BP. Therefore, with the increase of PEU, we assumed the decrease of both SAL and NP in the case of pharmacies pursuing Reactor SO: H3d: In parallel to the increased degree of PEU the negative relationship between Reactor
SO and sales of pharmacies strengthens. H4d: In parallel to the increased degree of PEU the negative relationship between Reactor
SO and net profit of pharmacies strengthens.
105
23.3. The potential moderating effect of geographical location of pharmacies on the relationship between strategic orientation and business performance Based on the knowledge of environmental and management characteristics of HPRDS, as a function of pharmacies’ GL, we assume M&S’s SOs can prevail in different ways regarding their BP. Professional interviews made with sectoral stakeholders showed that pharmacies pursuing Prospector, Analyser, Defender and Reactor SOs in urban environments can not be treated the same way as their counterparts operating within rural conditions. Due to differences experienced in the degree of competitive intensity, magnitude of purchasing power, accessibility and patients’ needs and preferences, the management characteristics of SOs can show up differently depending on the GL of the pharmacy. According to the opinion of sectoral decision-makers, different business policy „margins” available for pharmacies in cities and in the countryside can lead to divergence not only in behavioural patterns of Prospector, Analyser, Defender and Reactor SOs, but in their BP too. Therefore – as we have already discussed it earlier in our dissertation – we integrated GL variable into our research as a moderating factor, and in our hypotheses regarding the potential moderating effect of the pharmacies’ GL we assumed that the relationship between Prospector, Analyser, Defender and Reactor SOs, the degree of PEU by pharmacists and BP shapes a different picture in the case of pharmacies operating in cities and in the countryside. For pharmacies pursuing Prospector SO the conditions of the urban environment are certainly more favorable as they facilitate the expansion of product and service portfolio, the reach of new patient segments, and thus the increase of turnover. However, in the countryside, Prospectors have less options to portfolio expansions to increase sales, due to the adverse demand conditions. This also certainly prevents them from directing irrational amount of their resources to diversification, which in turn, reduces the profitability losses of Prospector pharmacies operating in rural context. For pharmacies pursuing Defender SO, rural environments offer more favorable conditions for the deeper exploitation of the benefits deriving from their conventional products/markets. This is due to the fact that the composition of the patient population and the change in their needs and preferences is not considered to be significant which allows them – by adequately applying their resources and capabilities – to concentrate on the standardisation of management processes, thus increasing their efficiency. We also assumed that to increase SAL as a secondary item in their BP focus, Defenders also have more chance in the cities characterised by more favorable demand conditions. According to our assumptions in case of Analyser pharmacies characterised by dual product/market core, for effectiveness it is the conditions of urban environment, for profitability it is those of rural one that are more favorable. In cities, higher purchasing power, heterogeneity of patient needs and preferences as well as the more likely adoption of innovations encourage the product portfolio expansion measures and boost the SAL. As far as the countryside is concerned, here Analysers also have the opportunity to serve existing patient segments with conventional products and to optimise predictable management processes, i.e. to increase their NP. According to interviews with pharmacy managers, Reactor pharmacies – pursuing an inconsistent SO due to deficiencies in their resource and capability set – are not even able to take advantage of the otherwise favorable urban demand conditions. Their underdeveloped management competencies are not suited to offer a product and service portfolio consciously
106
matching to the changing patient needs. Despite this fact and because of the higher degrees of competitive intensity, even Reactor pharmacies in the cities are forced to take – in most cases not well-thought – steps to expand their product and service portfolio, however, it requires considerable financial expenses. Therefore, in the case of urban Reactor pharmacies we assume the further deterioration of both SAL and NP compared to their counterparts operated in a less competitive (e.g. rural) environment. Based on the above, we formulated the following hypotheses for the potential moderating effect of GL of pharmacies played in the relationship between SO and BP: H5: GL of pharmacies moderates the relationship between the SOs and sales of pharmacies H5a: In urban context the positive relationship between Prospector SO and sales of
pharmacies becomes stronger compared to that experienced in rural environments. H5b: In urban context the positive relationship between Defender SO and sales of
pharmacies becomes stronger compared to that experienced in rural environments. H5c: In urban context the positive relationship between Analyser SO and sales of
pharmacies becomes stronger compared to that experienced in rural environments. H5d: In urban context the negative relationship between Reactor SO and sales of
pharmacies becomes stronger compared to that experienced in rural environments. H6: GL of pharmacies moderates the relationship between SOs and net profit. H6a: In urban context the positive relationship between Prospector SO and the net profit of
pharmacies is weaker than that experienced in rural environments. H6b: In rural context the positive relationship between Defender SO and the net profit of
pharmacies is stronger than that experienced in urban environments. H6c: In urban context the positive relationship between Analyser SO and the net profit of
pharmacies is weaker than that experienced in rural environments. H6d: In urban context the negative relationship between Reactor SO and the net profit of
pharmacies is stronger than that experienced in rural environments 23.4. The combined moderating effect of perceived environmental uncertainty and geographical location on the stochastic relationship between strategic orientation and business performance Based on M&S’s theoretical implications and experience gained from the interviews with representatives of HPRDS stakeholder groups we assumed that the impact of PEU, playing a potentially moderating role in the relationship between SO pursued by the pharmacies and BP, can occur differently in urban and rural environments. The turbulent environmental changes in the sector encourage pharmacies pursuing various SOs to expand their product and service portfolio, address new patient segments and introduce innovative business applications. However, in our opinion, the success rate of these business policy measures depend not only on the idiosyncratic characteristics of the various SOs, but also on whether the pharmacy is operated in an urban or in a rural environment.

107
In cities, characterised by more favorable conditions for pharmacy operation, portfolio expansion initiatives in response of the rise in the degree of competitive intensity are expected to generate more demand. This is likely to enhance SAL in a more considerable way, than it would be expected in the case of rural pharmacies. Despite the fact that different resource and competency base of M&S’s SOs support to a various extent the success of portfolio expansion initiatives, we assume the efforts aimed to reach new patient segments and introduce innovative business practices in case of all three viable SOs – Prospector, Analyser, Defender – contribute to the increase in SAL more in the cities and less in the countryside. However, the product and service portfolio expansion in response to the increasing degree of PEU requires significant financial and human resource investments from pharmacies. In urban pharmacies novelties are expected to generate more demand and the newly introduced value propositions can be sold at a higher margin. This is likely to mean that portfolio expansion measures taken in reaction to PEU tend to contribute less to the profitability of pharmacies in the countryside, than in the cities. Based on the less heterogeneous patient needs, the lower willingness to accept innovations and the lower purchasing power characterising the countryside, we predicted that in case of consistent SOs these initiatives contribute less to the increase in NP of pharmacies than in the cities. In case of the most likely suboptimally performing Reactors we expect that favorable urban environments can partly compensate for the negative impact on the effectiveness and profitability by the inconsistent and hasty strategic-level measures taken in response of the increasing PEU in the product and service portfolio expansion, reaching for new patient segments and the implementation of innovative business applications. We assume that increasing degree of PEU by pharmacy managers degrades the SAL and NP of Reactor pharmacies in a more considerable way in the countryside than in cities. In consequence, we formulated the following hypotheses for the combined potential moderating effect of PEU and GL in the relationship between SO pursued by the pharmacies and BP: H7: PEU in combination with GL moderates the relationships between M&S’s SOs and
sales of pharmacies. H7a: In urban context the increasing degree of PEU makes the positive relationship
between Prospector SO and sales of pharmacies stronger than that experienced in rural environment.
H7b: In urban context the increasing degree of PEU makes the positive relationship
between Analyser SO and sales of pharmacies stronger than that experienced in rural environment.
H7c: In urban context the increasing degree of PEU makes the positive relationship
between Defender SO and sales of pharmacies stronger than that experienced in rural environment.
H7d: In rural context the increasing degree of PEU makes the negative relationship
between Reactor SO and sales of pharmacies stronger than that experienced in urban environment.

108
H8: PEU in combination with GL moderates the relationship between M&S’s SOs and net profit of pharmacies.
H8a: In rural context the increasing degree of PEU makes the positive relationship between
Prospector SO and net profit of pharmacies weaker than that experienced in urban environment.
H8b: In rural context the increasing degree of PEU makes the positive relationship between
Analyser SO and net profit of pharmacies weaker than that experienced in urban environment.
H8c: In rural context the increasing degree of PEU makes the positive relationship between
Defender SO and net profit of pharmacies weaker than that experienced in urban environment.
H8d: In rural context the increasing degree of PEU makes the negative relationship
between Reactor SO and net profit of pharmacies stronger than that experienced in urban environment.
23.5. The robustness of the effect of strategic orientation on business performance The main research focus of our dissertation from both theoretical and methodological perspectives is to explore the moderating effect of PEU by pharmacy managers and the GL of pharmacies in the relationship between SOs and BP. However, we can not either forget about the fact that the variance in BP – beyond the effects of SO, PEU and GL – is influenced also by company-specific, sectoral and macro-level factors. Based on the guidelines of strategic management and on the qualitative experience obtained from stakeholders of HPRDS stakeholders, we integrated into our conceptual research model ownership structure of pharmacies, total area of space of pharmacy and the officina, number of employees, participation in horizontal and/or vertical cooperation forms and variables partaining to site characteristics of pharmacies. In our research we examined whether we filter the effect of control variables most probably determining BP of pharmacies, are the connections formulated in our hypotheses H1-H8 still maintained regarding the complex relationships between SO, PEU, GL and BP. Our attention was directed to observe whether the impact of the pursued SOs is still significant to the change in SAL and NP along with ownership structure, size, cooperation and site conditions of pharmacies influencing BP. If this is the case and these relations remain significant even by controlling for the effect of the abovementioned variables, then it proves our hypothesis that in HPRDS characterised by turbulent environmental changes and limited, but increased competitive intensity, conscious choice of micro-level environmental adaptation behavioural patterns and consistent accomplishment of strategic-level tasks have a major role in influencing pharmacies’ BP. Based on this, we formulated the final hypothesis of our research: H9: The interrelations – established as a result of the potential moderating influence of
PEU and GL on the relationship between the SO and BP – are robust after controlling for the effect of relevant industry-specific variables.
H9a: The observed relationships between the SOs of Miles and Snow and sales of
pharmacies are robust.

109
H9b: The observed relationships between the SOs of Miles and Snow and net profit of
pharmacies are robust. The hypotheses tested and formulated in the previous chapters of our doctoral research are displayed in the conceptual model of Figure IX. Figure IX: Displaying research hypotheses in the conceptual model of the Ph.D. thesis
Source: Figure made by the author 24. The quantitative phase of the doctoral research After finalising the measurment instruments suitable to the operationalisation of M&S’s SOs, PEU and BP, we turned our attention to the organisation of the quantitative research for the empirical examination of our conceptual model. The backbone of the quantitative phase of our primary research was given by a large sample survey data collection and after processing the results of which we sought to test our formulated hypotheses by mathematical-statistical methods and draw generalised conclusions. 24.1. Large sample survey data collection For the completion of our PhD research, the most cardinal problem proved to be the organisation and execution of the data collection for the large sample quantitative survey. Several factors played role in the complexity of our task, but we need to mention the harsh conflict of interest between the stakeholders of domestic drug supply system, the mistrust and huge workload of pharmacists, the relatively high cost of the sampling and the expectedly low response rate. During the sampling procedure we had to plan carefully the following five steps (Malhotra-Simon, 2009): 24.2. The definition of population
Moderating factor (Geographical location)
Business performance (Net sales revenues
and net profit)
Strategic orientation (Prospector, Analyser,
Defender, and Reactor)
Moderating factor (The degree of environmental
uncertainty perceived by pharmacists)
Control variables (Ownership structure, size,
site, cooperation)
H1, H2
H3, H4
H5, H6
H7
H8
H9

110
In our thesis the population naturally meant the public pharmacies in Hungary, their number in the period of data collection (Fall 2012 – Summer 2013) exceeded 2400. The hospital, institutional, the so-called „doctors’ pharmacies” and „affiliates” of public pharmacies were not part of the population of public pharmacies from any statistical or sectoral point of view, so these firms were not considered as subjects in the empirical research. 24.3. Organising the sampling frame In scientific research it is a rare occasion that scholars would have a list at their disposal which contains all the elements of the population supporting greatly the sampling process. It is important to note that from the 1st of January 2011, due to a change in the regulations, only those can be employed in the Hungarian health care sector who are members of a medical (e.g. physician, pharmacist, or professional) chamber organisation. In practice this meant that the contact details of all Hungarian pharmacists – including naturally pharmacy managers with personal rights – were available at the HCP and its assigned county offices. Due to the assistance of the Department of Marketing and Doctoral School of Business Administration of Corvinus University of Budapest we concluded a cooperation agreement with the president of the HCP who willingly offered his support to make us available the contact details of pharmacy managers for our research. The presidium of HCP assisted in the conduct of the survey regarding the strategic behaviour of pharmacies in Budapest and in 4 other counties characterised by having pharmacies with different socio-demographic criteria. These four were Baranya, BAZ, Pest és Vas counties, thus pharmacies operating in these geographical units formed the sampling frame of our doctoral research. This meant a total of 983 pharmacies which made up about 40% of the total national population. 24.4. Selection of the sampling technique In our thesis, there is no point to talk about a probability or non-probability sampling technique. The reason for this is that in support of performing a survey based research on the strategic behaviour of pharmacies, the presidents of local chambers of Budapest and the counties Pest, Baranya, BAZ and Vas made us available the contact details of all the regional pharmacy managers. This way we had the opportunity in given regional units to distribute our survey in a census-like way to all members of pharmacy manager list (Hunyadi-Vita, 2003). 24.5. Conducting the data collection Based on the recommendations embraced during the in-depth interviews with the representatives of HCP and pharmacists, we decided to launch a mail delivery based survey process (Dillman, 1978). This was motivated by the distrust of pharmacists against electronic data retrieval infused by the fear of the inability to assure a complete anonimity. One week before the delivery of the questionnaires, we sent an electronic cover letter signed by the president of the HCP and its regional leaders to every pharmacy manager in the capital and in the counties of Pest, Baranya, BAZ and Vas. In this letter we drew their attention to the fact that our research is non-profit, serves only for academic purposes and expenses were funded by the Doctoral School of Business Administration of Corvinus University of Budapest. In addition, we assured pharmacists that response is voluntary and completely anonymous, returned questionnaires will be treated as

111
strictly confidential and individual answers are not to be shared to any third party even anonymously (Act CXII of 2011). Surveys were delivered afterwards, the research package included a cover letter stamped and signed by HCP leaders, the questionnaire on the strategic behaviour of pharmacies and a pre-paid, in advance addressed return envelope for responses. One week after the dispatch of the questionnaires, with the cooperation of HCP regional officials, we sent out an electronic reminder to pharmacists, kindly asking them again to fill our questionnaires in (Groves et al., 2001). A week after the first reminders we contacted all the pharmacy managers of each county by phone as well. During the conversations, we had the opportunity to explain potential respondents the purpose and relevance of our doctoral research aiming the exploration of the strategic management of pharmacies from a sectoral-policy perspective. Our experience shed light on the fact, that phone calls reduced considerably the mistrust of pharmacists and increased response rate which resulted in a significant increase in the number of returned response letters (Tourangeau et al., 2000). 24.6. Response rate For the determination of response rate, we needed to define the population of pharmacies in Budapest and counties of Pest, Baranya, BAZ and Vas. In the period of our survey data collection, based on the official national pharmacy register of HCP and National Public Health Service the number of operating public pharmacies was stated as follows: 424 in Budapest, 261 in Pest county, 153 in BAZ county, 99 in Baranya county and 46 in Vas county. This means that a total of 983 pharmacy managers could have received our questionnaires on the strategic behaviour of pharmacies. At the end of our data collection 236 response-envelopes returned to our university. Not counting the incomplete or incorrectly filled out and thus excluded items from the quantitative analysis, we obtained 207 pieces of completed questionnaires which could be incorporated into mathematical and statistical analyses (De Vaus, 2002). Thus, response rate in our research amounted to 21% which is in line with the average experienced in similar international strategic studies (Baruch-Holton, 2008). As it can be seen in Table XXIX, the willingness to response of the pharmacy managers in Pest county was outstanding in both absolute and relative terms. Compared to the population of the pharmacies in Budapest, metropolitan respondents are represented only by a small percentage in the sample. The response rate experienced in rural counties roughly met our expectations, we can state that in the counties of Baranya, BAZ and Vas, approximately 1/5 of the pharmacy managers completed and returned our questionnaire evaluating the strategic behaviour of pharmacies. The potential sector-specific reasons of the differences in response rates are not detailed here due to the size limits of the dissertation. 24.7. Sample structure In Table XXX, the number and distribution of responding pharmacies are listed by the relevant sector-specific, socio-demographic characteristics. By the results of Tables XXIX-XXX and the knowledge of the structure of domestic public pharmacies, we can conclude that the criteria of representativity are more or less violated. This was determined by the sampling frame because we only gained support for the data collection from the HCP regional presidents of Budapest and four more – Baranya, BAZ, Pest and Vas – counties. At the same time, socio-demographic and sector-specific characteristics of chosen counties pretty well approximate the structural attributes of the total pharmacy population. Therefore our sample composed of the 207 responding pharmacy managers is relatively heterogeneous, and

112
representative as for the settlement structure, BP and corporate/legal form, while not representative regarding ownership structure and the participation in horizontal and vertical forms of cooperation. Hence, pertaining to the generalisation of results, we formulate our research conclusions in a very cautious way by highlighting the proper interpretation barriers. 25. Introduction of the applied mathematical-statistical methods In Chapters 22-23 of our dissertation we established our research questions and hypotheses from scientific-theoretical and sector-specific perspectives which were answered and tested by performing diverse multivariate methodologies of data analyses. In this chapter, we present the mathematical-statistical methods applied in our dissertation. Due to length limitations we were unable to describe all the applied methodological approaches, so in the following sections we only detail the multivariate techniques used to examine the interrelations between the central constructs – SO, PEU, GL and BP – of our PhD thesis. The three most important goal of our empirical research are 1) to identify strategic behaviour patterns observable in the HPRDS, 2) to examine the interrelations between SO and PEU, 3) and to explore the potential moderating effects of PEU of pharmacists and GL of pharmacies in relationship of the M&S’s SOs and BP. To realise the first objective, we focused mainly on testing of the validity and reliability of multi-item scale of Segev (1987) used to identify the SOs of M&S. The reason for this is that to answer our Q1 and Q2 research questions addressing the identification of M&S’s SOs and determination of their number in the HPRDS as well as exploration of their potentially markedly distinguishable behavioural characteristics, discriminant validity analysis of the Segev scale has been given a major importance, according to which the conduct of exploratory (EFA) and confirmatory (CFA) factor analyses (Barna-Székelyi, 2009, Hair et al., 2010) played a great role in our examinations. CFA is a suitable method for examining the fit of a theoretically established – composed of latent and manifest variables – structure to the data obtained in the empirical research (Jöreskog, 1969, Kline, 2010), its role is thus crucial in the identification and definition of the number of SOs observed in the HPRDS (Q1). In addition, the analysis of covariance between the M&S’s SOs operationalised as latent constructs in the CFA can be used to decide to what extent are the SOs revealed in the sector markedly different (Q2) (Thompson, 2004). Reflecting on the weaknesses of previous studies examining M&S strategic typology, we put a great emphasis in our thesis on the examination of convergent validity in its classical sense. In our research, we intended to identify the SOs observed in the HPRDS by applying three measurement instruments. To answer our third research question (Q3), we took the results regarding the sample distribution of Prospector, Analyser, Defender and Reactor pharmacies determined by the method of self-typing paragraphs, the multi-item Segev scale and the objective indicators, and – coded as Dummy variables – we compared them by running cross tabs analyses and McNemar tests (McNemar, 1947, Maxwell, 1970, Yang et al., 2010). By testing the differences between the distribution results of a specific strategy identification technique, we examined the percentage distribution of Prospector, Analyser, Defender and Reactor pharmacies to check whether we find significant differences (Q4). To answer the fourth research question (Q4), we took the results pertaining to the SOs’ relative frequencies – obtained by the classification procedure of each strategy extraction method (i.e. self-typing
113
paragraphs, the Segev scale and the objective indicators) – and compared them by Dummy variables and paired sample t-tests (David-Gunnink, 1997, Zimmerman, 1997). The second objective of the PhD thesis was to examine the prevalence of the contingency theory and the " managerial choice" approach in the HPRDS (Q5, Q6 and Q7). The degree of PEU (Q5) by pharmacy managers pursuing different M&S’s SOs and the distribution of Prospector, Analyser, Defender and Reactor pharmacies in the groups characterised by low and high PEU (Q6) were determined by cross tabs, ANOVA and SEM analyses. The exploration of the interactions between SO and PEU (Q7) was also done by structural equation modeling (SEM) based on the examination of the explicit degree of influence of the two latent constructs on each other (Hair et al., 2010). To test hypotheses H1-H9 formulated to achieve the third objective of our thesis, we performed preliminary regression analyses. We also wanted to explore the potential moderating effect of PEU by pharmacy managers and the GL of pharmacies – playing potentially a „refining” role in the relationship between SO and BP – by hierarchical interaction and multigroup regression analyses (Garson, 2006, Ho, 2006). By the integration of relevant socio-demographic characteristics and site attributes of pharmacies into these regression analyses we examined whether the influence of SO on BP remains robust, even in case we filter the effect of abovementioned control variables (Cohen et al, 2013). The main methodological element of our dissertation, the application of SEM, played an important role in the confirmation of results obtained via performing hierarchical interaction and multigroup regression analyses. The measurement instruments already tested in previous studies and exhibiting confirmatory factor structure – i.e. multi-item scales operationalising M&S’s SOs (Segev, 1987) and PEU (Miles-Snow, 1978) – can be perfectly integrated into various structural models which then could be used to test our hypotheses H1-H9 revealing the potential moderating effects of PEU and GL on the relationship between SO and BP. 25.1. A short introduction of structural equation modeling (SEM) The SEM is a frequently used multivariate mathematical-statistical methodological toolbar, widely spread in prestigious international studies and publications. One of the great advantages of SEM that it is able to validate the multi-item scales previously applied in empirical studies in different context (Klarmann, 2011). Another outstanding feature of SEM that it is suitable for testing complex relationships between latent constructs and indicator variables and also the latent constructs (Kaplan, 2010). In our dissertation the operationalisation of SO and PEU as latent constructs was justified by the following methodological aspect. Based on the experience of the in-depth interviews, the majority of pharmacists having limited business knowledge and less developed management competencies had difficulties in answering the explicit questions about their SO and PEU. Thus it was more effective to ask them about the manifestations of the characteristics of Prospector, Analyser, Defender and Reactor SOs and PEU with which the respondents could be encountered during the daily operation of the pharmacies. In most cases, researchers have the opportunity both in a so-called reflective and informative way for the operationalisation of theoretical constructs integrated into structural models (Diamantopoulos-Siguaw, 2006). In case of reflective measurement models, we make the assumption that causal processes move from the latent constructs in the direction of the

114
indicators, so changes in a latent variable will modify the manifestation of indicator variables too (Coltman et al., 2008). The name of the reflective measurement models comes from the fact that indicators (manifest or measured variables) are actually the reflection or manifestation of an unobservable latent variable (Bollen, Lennox, 1991). Therefore, in the graphic illustration of reflective models, arrows depicting the direction and strength of the stochastic relationships are moving from the latent construct in the direction of the indicator variables. Consumer behaviour literature abounds with reflective constructs, such as attitude, willingness to buy, consumer ethnocentrism etc, which are not observable phenomena and determine the measurable aspects of consumer behaviour. Unlike reflective models, in the case of formative constructs the indicators define the latent variable (Henseler-Ringle, 2010). Researchers assume that the changes occurring in the measurable indicators induce modifications in the latent construct (Temme-Hildebrandt, 2006). In the graphical representation of the formative measurement models, the arrows point from the indicator variables to the latent construct. The meaning and development of the causal latent variable is determined by the common variance of the indicators. Another major difference between reflective and formative measurement models that while we assume a correlation between the indicator variables in the former case, we do not for the latter (Diamantopoulos et al., 2008). This means that in the case of formative models, the removal of any indicator variable could result in the modification of the core content of the whole construct (Collier-Bienstock, 2009). For a formative construct a great example would be the quality of life which can be determined by such measurable indicator variables like health, financial and marital status of consumers (Bollen-Ting, 2000). In our research, the relationship between SOs (latent constructs) and their scale items (indicator variables) pertaining to the strategic-level management aspects in the environmental behaviour of pharmacies has a reflective nature (Jarvis et al., 2003). This means that the reason of the manifestation of explicitly measurable behavioural characteristics is the common latent construct, the behavioural pattern observable in the environmental adaptation of firms, i.e. the SO (Mintzberg-McHugh, 1985, Diamantopoulos-Winkelhofer, 2001). Similarly, we can state that the relationship between PEU and associated manifest variables is also reflective by nature, because the opinion formed about the HPRDS conditions and the behaviour of key stakeholders is largely determined by pharmacy managers’ general subjective perception of the sectoral-operational environment (Bagozzi-Yi, 2012). Accordingly, in Figures XXI-XXIV depicting our measurement models and SEM analyses the arrows point from the latent constructs toward the measurable indicator variables. 25.2.Widely used methods of structural equation modeling The statisctical literature distinguishes covariance- and variance based structural equation modeling methods, accordingly the software packages used in quantitative and social science studies are trying to examine the structure of empirical data fit to the theoretical models based on the same. Among softwares based on covariance, we have to mention Lisrel (Linear Structural Relations, Jöreskog-Sörbom, 1979) and AMOS (Analysis of Moment Structures), while among the variance based techniques PLS (Partial Least Squares) can be regarded as most dominant (Chin-Newsted, 1999, Vinzi et al., 2010). AMOS and Lisrel are considered as universal methodologies, as they are suitable to test the

115
validity and reliability of full models, while PLS examines mostly the relationship between latent constructs and is less used for full model fit testing and examining the complex causal interrelations between the elements of the total variable set (Hair et al., 2012). The penetration of PLS methodology is mainly due to the fact that it is able to give a reliable estimation in case of samples with even a very small number of elements (50) and it is less sensitive to the infringement of the multivariate normality criterion of the distibution of variables integrated into the analyses (Henseler, 2009). Methodological literature is considering LISREL as the most professional SEM methodology, because based on experience, it very accurately estimates parameters, able to integrate variables measured on almost all type of scales and it can be used to compare longitudinal data structures as well (Reinartz et al., 2009, Narayanan, 2012). In our thesis, we used IBM SPSS AMOS 20 structural equation modeling software, because 1) we tested validity and reliability of scales exhibiting confirmatory factor structure and already applied in international studies, 2) we examined the complex interrelations between SOs pursued by pharmacies, PEU of pharmacy managers, GL of pharmacies and the development of BP, 3) during the data collection 207 pharmacists completed our questionnaire and this relatively high number of elements did not justify to limit ourselves to the application of PLS methodology. This conclusion has been confirmed by the use of criteria determined by methodological literature concerning the application of SEM. 25.3. Application criteria of structural equation modeling Literature suggests that the number of empirical observations is one of the most important conditions of the application of SEM. According to many, for reliable and valid SEM based estimations the necessary sample size can be described by the n/q>5 formula (Bentler-Chou, 1987). The n in the formula is the sample size, while q is the estimated number of parameters in the model. This latter includes all the parameters, so latent constructs, indicator variables and error terms as well. By this rule, the number of elements in the sample should be at least five times more as the number of parameters. According to a less rigorous approach, structural analysis can be done with models fulfilling the n-q>50 criteria (Bagozzi, 1981). However, professionals, taking into consideration realistically the significant resource and time constraints of research, consider in most cases the sample of minimum 200 respondents as the milestone for the acceptable application of structural equations (Hair et al., 2010). Table XXXI examines the compliance with the abovementioned criteria of sample size regarding the application of SEM in the context of our research. The results showed that neither of the multi-item scales used in our doctoral research met the the most rigorous requirements of Bentler-Chou. However, the sample containing the 207 completed questionnaires fulfils the Bagozzi (1981) and Hair et al. (2012) criteria, so both the PEU and the Segev scales are suitable to be integrated into SEM analyses. Covariance based SEM procedures are based on the Maximum Likelihood estimation method, and the criterion of its application is the multivariate normal distribution of the evaluations of variables integrated into the study (Byrne, 2001). Based on the way of operationalisation of the variables (5-point Likert scale) and the potentially diverse perception of radical environmental changes occured during the last years in the HPRDS we could expect that our empirical data would not follow a normal distribution (Kline, 2010). First we tested the univariate normal distribution of the items belonging to the M&S’s SOs

116
and PEU. As expected, the Kolmogorov-Smirnov and Shapiro-Wilks tests indicated significant deviation from normal distribution (Mitev-Sajtos, 2007). Kurtosis and skewness values of the evaluations of examined variables approached the (-1, +1) range, but it is not sufficient for the normal distribution. To test multivariate normality the so-called Mardia’s test is the most frequently used in AMOS, which provides a coefficient and an associated critical value (C.R.) to determine multivariate kurtosis (Mardia, 1970). Multivariate normality of data is met if at 95% reliability level the C.R. value is less than 1,96 and the kurtosis coefficient of the Mardia’s test is exceeds the p*(p+2) threshold value, where p is equal to the number of manifest variables integrated into the structural model (Schumacker-Lomax, 2010). In the context of our doctoral research, the Mardia’s test was first used for the Segev scale identifying SOs, then for the confirmatory factor model (CFA) of the multi-item PEU scale of M&S. The number of manifest variables of the Segev scale was 29, while this number was 45 for the PEU scale. As expected, the Mardia’s kurtosis coefficients did not exceed the 29*(29+2)=899 and 45*(45+2)=2115 values in any of the cases. The kurtosis coefficient of the Segev scale was 103,058 with 17,484 C.R. value which is below 1,96. In the case of the PEU scale the coefficient was 197,821, while the C.R. value ended around 21,8. Out of curiosity, we performed Mardia’s multivariate normality test in case of the SEM quantifying the effect of M&S’s SOs on BP of pharmacies, but results did not improve even with the integration of SAL and NP as dependent variables into our models. In the former case, the kurtosis coefficient was 133.898 with 21.983 C.R. value, in the latter 17.163 and 104.541. We could have used Mardia’s test in the case of the – more sophisticated and using more manifest variables – models presented in the subsequent chapters of our dissertation, but their expected results would have been certainly even further from the p*(p+2) and 1,96 thershold criteria. Therefore, in the data analysis context of our thesis the criterion of multivariate normality was not met. However, the Maximum Likelihood estimation method commonly used in AMOS fairly robust to the violations of multivariate normality (Kline, 2010). The sample size of 207, the elimination of extreme outliers and the „bootstrapping” process can remedy the problems of multivariate normality violation (Rencher, 1995). Based on the Mahalanobis distance, the exclusion of outliers in case of Likert scales can cause serious loss of information, so we did it only for BP indicators, but even this was not enough to meet the criteria of Mardia’s test. At the same time, the use of „bootstrapping” and the sample consisting of 207 questionnaires completed by pharmacists is encouraging to conduct valid and reliable SEM analyses. Another important condition for the application of SEM is the minimal multicollinearity which is the interfering – amplifying or debilitating effect exerted on dependent variables – influence between the independent (explanatory) variables. There are three basic approaches for the examination of multicollinearity (Klarmann, 2009). 1. The application of the rule of thumb by „visual inspection” of the results. For example,
standardised regression weights with frequently changing signs and magnitude, standardised regression weights greater than 1, extremely high proportions of variance explained (R2), correlation values over 0,9 between the manifest variables, all increase the probability of the presence of multicollinearity’s distorting effects.

117
2. Tests regarding the decomposition of variance. For example, the examination of tolerance value (1-R2 should not be less than 0.1) or the calculation of the widely known and frequently used VIF indicator (not greater than 5).
3. Methods based on factor analysis amongst which we need to highlight the approval of
discriminant validity by the so-called Fornell-Larcker citeria. As we highlight it repeatedly in the later sections of our dissertation examining discriminant validity, the fit results of our models integrated into SEM analyses were not disturbed by the phenomenon of multicollinearity. In the following chapters we present the SEM based methodological techniques used to reveal the potential moderating effect of PEU of pharmacy managers and GL of pharmacies in the stochastic relationship of the M&S’s SOs and BP. 25.4. The introduction of SEM-based techniques applied to explore moderating effects In addition to the hierarchical interaction and multigroup regressions, to explore the potential moderating effect of PEU and GL of pharmacies – influencing the relationship between Prospector, Analyser, Defender and Reactor SOs and BP – in our dissertation we performed a sort of methodological series of several SEM-based techniques. By the application of the so-called multigroup and interaction moderation structural equations, as well as the moderated moderation analyses regarded as the combination of the elements of the previous techniques – building up our measurement models step by step – we examined the potential moderating effect of PEU and GL in the relationship between M&S’s SOs, the market effectiveness and the financial efficiency (Kline, 2010). Our goal was to draw – compared to the results of regression analyses – more valid and reliable conclusions via operationalisating SOs as latent constructs (Gefen et al., 2000). 25.4.1. The introduction of the multi-group moderation technique For the identification and clarification of the roles of potential moderator variables the method of multigroup structural equations can only be used if the potential moderator is operationalised as dichotomous variable (Kaplan, 2000, Klarmann, 2011). PEU evaluations originally operationalised by the five-point Likert scale were transformed into a dichotomous form by „medium split” method, thus we created the groups of pharmacy managers/pharmacies perceiving low and high degrees of environmental uncertainty. We also performed scale transformation for the ease of application of mathematical-statistical methods able to test the potential moderating effect of GL on the relationship between pharmacies’ SO and BP. We created dichotomous, categorised variables from the original five response alternatives registrating the location of pharmacies based on the population of the settlement, where they operate. We formed two categories based on the follow-up consultations with active pharmacy managers and the leaders of HCP. During the multigroup and interaction regression analyses, we coded pharmacies operating in urban environments by 0 and the ones in rural context by 1. In the following, for the sake of simplicity, we classified pharmacies operated in settlements with a population above 10 000 as „urban” pharmacies and the ones below 10 000 as „rural” pharmacies, the size of the two respondent groups was about the same. Based on the in-depth interviews key the stakeholders of HPRDS this distinction is justifiable, because interrelations between SO, BP and PEU by pharmacy managers of urban pharmacies
118
characterised by outstanding demand conditions is likely different from the one experienced in the case of rural pharmacies with more unfavorable factors. This has been proved later by our quantitative research results as well. Structural models established to examine the relationship of SO and BP can be run in both groups formed on the basis of different values of each moderating variables. To explore moderation effects, we have to examine if there is a significant difference in the standardised regression weights between the independent and dependent constructs across the two groups (Bollen 1989, Jöreskog-Sörbom 1979). In our thesis this means wheter the effect of the M&S’s SOs on BP differs significantly or not between pharmacy managers perceiving high and low environmental uncertainty and between urban and rural pharmacies. The additional advantage of the multigroup moderation is that it allows taking into account the measurement errors, it estimates the standardised regression coefficients with less errors and provides more information on the operation of the Segev scale – identifying Prospector, Analyser, Defender and Reactor SOs – and its psychometric characteristics (Matsuno-Mentzer, 2000). During multigroup moderations, we tested differences between pharmacies characterised by low and high PEU and between urban and rural pharmacies on two levels. In the first case, we examined the difference between the entire models, while in the second between the specific effects of Prospector, Analyser, Defender and Reactor SOs on BP, along with various values of the dichotomous moderator. We used statistical analyses to reveal discrepancies both between the entire models and between the standardised regression weights quantifying the effect of specific SOs on BP. The significance of differences between model permitting the free movement of parameters („Unconstrained”) and the one fixing them at equal value („Constrained”) and the standardised regression coefficients („Path-by-path”) were examined by χ2 tests (Homburg-Giering, 2001). 25.4.2. The introduction of the interaction moderation technique Besides multigroup moderations, to explore the potential moderating role of PEU by pharmacy managers and GL of pharmacies on the relationship of SO and BP, the interaction moderation also proved to be an applicable methodology. During this latter, by inputing SO and PEU – operationalised as latent variables of our measurement model in AMOS – into SPSS after the standardisation of the variables, we created the interaction variables between SOs and PEU as well as SOs and GL (Klarmann, 2011). Subsequently, these variables and the corresponding values were entered again into AMOS. These transformations made it possible to quantify the interaction effects of SOs – originally oprationalised as latent variables – as well as PEU and GL on BP through the creation of their product terms. 25.4.3. The introduction of the moderated moderation technique During SEM studies, we also explored the combined moderating role – played in the stochastic relationship of SO and BP – of PEU by pharmacy managers and GL of pharmacies. To this end, we used the so-called moderated moderation technique in case of both SAL and NP. In moderated moderation (SEM) technique, according to the measurement level of moderating variables, the moderating effect of PEU (metric scale) has been examined by interaction moderation, while the effect of the GL (nominal, dichotomous) by multigroup moderation, under the same model (Steenkamp-Baumgartner, 1998, Lowry-Gaskin, 2014). Based on the interviews conducted with key stakeholders of HPRDS and the correlation

119
values shown in Table XCIV, relevant control variables were included into the moderated moderation analysis. The goal of integration the most important socio-demographic and site characteristics of pharmacies was to 1) examine whether the direction, strength and significance of the relationship between SO and BP change by filtering the effect of control variables, and 2) to identify additional factors contributing significantly to the evolution of SAL and NP of pharmacies. The important, originally latent theoretical constructs (PEU and M&S’s SOs) included into the moderated moderation analyses have been integrated into our measurement model as manifest variables, after the inputational transformation (AMOS-SPSS-AMOS) detailed above, so the fit indices can not be interpreted in this methodology. 25.5. The interpretation of the results and fit indices of structural models When calculating the fit indices of structural models quantifying the relationship of SOs and BP, and exploring the potential moderating effect of PEU and GL of pharmacies in the same relation, we sought to preserve consequently the „original” structure of the theoretical and measurement models. None of the items related to latent constructs were deleted, we only improved the fit of our models only by merging the error terms of relevant manifest variables and by reducing the values of modification indices (Steiger, 1990, Byrne, 2001, Kline, 2010). Therefore, in some cases the value of certain fit indices fell behind the threshold criteria set by the methodological literature (Hu-Bentler, 1999). This happened mostly in the case of the SRMR (Standardised Root Mean Square) indicator – quantifiable by the square root of the difference between the residuals of empirical and hypothetical covariance matrices – showing the general fit of the models, its strict 0.08 threshold criterium was never reached in our structural models (Bentler-Bonett, 1980, Hooper et al., 2008). At the same time, we have to make it clear that in all of the structural models if we had eliminated the manifest variables linked to the latent constructs with lower standardised regression coefficients, then the fit indices could have surpassed the threshold criterion of SRMR. However, with such measures we would have lost important information which could have damaged the main theoretical objective of our thesis, namely the theoretical relevance of the M&S strategic typology (Collier-Bienstock, 2009) within a regulated industrial setting. In chapters 36-40, which presents the most important methodological part of our dissertation, we proceeded from simple models to the more complex structures. At each step – in order to increase the degree of transparency and interpretability – we also showed the graphic representation of the given structural model with the help of a „Print Screen” copy-pasted from AMOS. For the interpretation of tables illustrating the results of regressions and structural models, we draw the attention to the fact that PEU scale was reverse-coded, which means that in order to facilitate responses, value 1 meant the total unpredictability, while value 5 the complete predictability. The mathematical-statistical techniques used for the examination of our research questions and hypotheses are summarised in Table XXXII. 26. Evaluating the quality criteria of applied measurement instruments The assessment of the quality of empirical research in social sciences can be performed basically by the detailed examination of four factors. These are the objectivity, reliability, validity and generalisability (Babbie, 1995). 26.1. Objectivity

120
According to the criterion of objectivity, the research process and its results are independent of the personality, the values and the motivation of the researcher, as well as his/her attitude and preconceptions regarding the studied subject (Porter, 1996b). An empirical data collection and analysis is objective if it is carried out by two different researchers and the same result would be granted (Neumann-Bódi, 2012). Research in social sciences can not be strictly considered as objective – as much as researchers strive to achieve that – since it is impossible to fully eliminate the subjective elements. With some self-criticism, we believe that if we would trust one of our colleagues with the testing of the main questions and hypotheses of our research, the results would probably be not the same, but rather similar to ours. Despite this, we strived for objectivity in the theoretical and methodological stages of the thesis, especially when it comes to the objective presentation of the results and conclusions. When examining objectivity, we can evaluate the objectivity of the research process, the data analysis and the interpretation of the results. Our empirical research focused on a quantitative survey successfully conducted by the coordination of the president of the HCP who provided personal support. The structure of the survey focused mainly on the business- and sectoral-policy aspects of pharmacy management, representatives of HCP and responding pharmacists had only limited information about the scientific objectives of the study, the latent constructs and the suspected causal relations between variables. Though the fieldwork was not carried out by an independent market researcher, but by the authors themselves, we made significant effort in all phases of the data collection process to eliminate subjective elements. There is little doubt concerning the objectivity of the data analysis methods due to the strict application criteria of mathematical-statistical techniques and their results are also evaluated along standard international thresholds. The subjective margin of researchers is limited here only to the use of stricter or more lenient thresholds from methodological literature when evaluating the results. The interpretation of quantitative research results can be mostly the terrain where subjectivity could gain ground. When drawing conclusions from raw results, we tried to correlate them to the relations validated in earlier studies and revealed in research literature. Originating from the idiosynchratic characteristics of HPRDS we put great emphasis on the objectivity of scientific, managerial and sectoral-policy recommendations as well, somewhat differing from what is experienced in the conventional strategic literature. 26.2. Generalisability The determining quality gauge of the studies is that to what extent can the results gained from the sample examined in the empirical phase be extended onto the total population. The main criterion of generalisation is the representativeness of the sample. The representativeness means that the composition of the sample – according to relevant scientific, sectoral and socio-demographic characteristics – is equal to the composition of the population (Malhotra, 2009). The fulfilment of representativeness is often regarded – incorrectly – dependent of the higher sample size. A sample of 1 000 can be more representative than a large sample of 10 000 respondents if the structure of the previous based on specific characteristics (e.g. gender, age, residence, etc) better approximates the total population (Hair et al., 2010). As we previously indicated, based on Tables XXIX-XXX, we managed to obtain representative sample for settlement structure, business performance, corporate legal form, but we did not for ownership structure and participation in horizontal and vertical forms of cooperation. So we formulated our conclusions cautiously – highlighting the proper

121
interpretation barriers – regarding the generalisation of our results. 26.3. Validity and reliability Studies in social sciences also pay great attention to testing the validity and reliability of measurement instruments. We mentioned in connection with multi-item scales following confirmatory factor structure that the Segev (1987) scale identifying SOs and PEU scale developed by M&S (1978) were tested by statistical methods and found to be valid and reliable in previous studies. However, the Hungarian translation of the measurement instruments, the slight modification of their content and formal elements and their adaptation for the characteristics of HPRDS required to further test their validity and reliability according to international statistical standards (Campbell-Fiske, 1959, Nunally, 1978, Churchill, 1979, Peter, 1979, Anderson-Gerbing, 1988, Hair et al., 2010, Weiber-Mülhaus, 2010). We had the possibility to perform one part of validity and reliability checks before the large sample empirical study, i.e. in the development stage of measurement tools, while most of it was done during the mathematical-statistical analyses, after obtaining the survey results. 27. Validity In the following, we test in detail the validity of the M&S’s (1978) PEU and Segev’s (1987) multi-item scale identifying SOs by a given mathematical-statistical toolbox. We can not stress enough that the discriminant validity test of the Segev scale, able to identify M&S’s SOs, served at the same time to answer research questions Q1 and Q2 of our doctoral dissertation as well. We learned this way how many SOs can be observed (Q1) in the HPRDS characterised by bureaucratic coordination mechanisms and limited competitive intensity. We examined also in this chapter by running several exploratory (EFA) and confirmatory factor analyses (CFA) whether we can observe M&S’s SOs in their original form in a sector heavily regulated by the government or different behavioural patterns can be identified. We also tested whether we can identify significant differences between the adaptation patterns of Prospectors, Analysers, Defenders and Reactors, i.e. we would meet clearly distinct SOs or not according to prevalence of their behavioural characteristics (Q2). 27.1. Face validity During the systematic, but subjective testing of face validity researchers examine to what extent „at first glance” the multi-item scales measure the theoretical construct which is really intended to be measured (Malhotra-Simon, 2009). Face validity evaluates the correctness of the wording of items, mainly on the basis of stylistic, grammatical, lexical and scientific aspects. We ensured face validity of our measurement instruments by consultations with scientific researchers well versed in strategic management discipline, university professors, as well as pharmacists and leaders of pharmacists’ advocacies particularly respecting the traditional terminology of the professional, pharmaceutical language (Chapter 21). 27.2. Content validity This is an arbitrary and systematic consideration – often called professional or expert validity test – of how the content of the scale items depicts the measurement task (Hair et al., 2010). To increase content validity, we conducted discussions with strategic management researchers and key stakeholders of HPRDS. We found out which are the scale items not belonging to a specific theoretical construct and what domains of the theoretical constructs statements did

122
not cover fully (Chapter 21), i.e. where did we need to add or remove items due to the slight interpretational differences (Churchill, 1979). The matching of scale items to preliminary dimensions – SOs or environmental stakeholders – was performed by card task. The extent of convergence in evaluations made by professionals was also tested (inter-rater reliability). 27.3. Criterion validity During the examination of criterion validity, researchers test whether the measurement scale based on specified variables is functioning according to the theoretical or the empirical-historical standards or not (Malhotra-Simon, 2009). In the case of measurement instruments identifying SOs and defining PEU, GL and BP, to gauge criterion validity we need to examine the assumed links between the constructs. The hypotheses of our dissertation focus on the development of the stochastic relations between the previously mentioned constructs, so their testing is at the same time can be considered as the examination of criterion validity of our measurement instruments. 27.4. Construct validity Construct validity can be regarded as a complex set of criterion validity applied in high quality international studies. This means that the measurement of a latent or explicit construct is not distorted by systematic errors from another variable or another source, like the used measurement instrument or specific environmental conditions (Peter, 1981). Construct validity of measurement instruments is based on three pillars. These are the discriminant, the convergent and the nomological validities. Construct validity holds when scales used in the empirical research equally satisfy the criteria of convergent, discriminant and nomological validities. We start the examination of construct validity by the mathematical-statistical analyses of discriminant validity which is simultaneously able to decide Q1 and Q2 research questions concerning the crucial findings of our dissertation. 27.4.1. Discriminant validity Discriminant validity examines to what extent the operationalisation of a theoretical construct leads to a different outcome, than the measurement of a related, but still interpretation-wise distinct construct (Bagozzi et al., 1991). According to a successful discriminant validity test the latent variables and/or the associated scale items are only minimally correlated to scale items and/or latent variables which were developed for the operationalisation of other theoretical constructs (Heeler-Ray, 1972). Discriminant validity maintains if measurement results of related variables differ, i.e. the specific latent variables of the scale and the associated indicators don not correlate with the measurement results of other constructs from which they should be different based on theoretical and sectoral experiences. The discriminant validity can be regarded as one of the most important criterion of high quality SEM studies. Discriminant validity deserved a special attention in our thesis, as we could decide by the examination of discriminant validity of Segev scale identifying SOs that how many of Prospector, Analyser, Defender and Reactor behavioural patterns can be observed in the HPRDS (Q1). In addition, we tested by mathematical-statistical methods associated to the analysis of discriminant validity to see whether we can observe the original SOs of M&S or their variations to some degree with modified content elements, i.e. we encounter pure or hybrid, maybe „mix” environmental adaptation patterns in this regulated sector characterised by different contingencial characteristics than previously studied ones. Also, we

123
highlighted it here whether we experience significant differencees between the behavioural characteristics of M&S’s SOs identified in the HPRDS (Q2). Discriminant validity can be tested by a number of techniques, amongst which we used the six most dominant methodologies in case of the multi-tem Segev and M&S’s PEU scales. 27.4.1.1. Exploratory factor analysis One much-discussed, yet very effective and popular methodology for testing discriminant validity is the EFA. If empirical data reproduce well the theoretically expected factor structure, then it can be considered as a significant step in determining discriminant validity. This means that each latent construct (factor) is indeed loaded by the indicator variables (scale items) which are theoretically associated to it (Füstös et al., 2004). Regarding the Segev scale our empirical data structure was suitable to execute EFA, as it satisfied the conditions for the application of principal component analysis (PCA). The Kaiser-Meyer-Olkin (KMO) index (0.854) was higher than the 0.6 threshold and we rejected the nulhypothesis of Bartlett’s sphericity test (χ2=1756,432 és p=0,000), so variables of data structure were not uncorrelated. More than ¾ of the elements of correlation matrix indicated significant interrelations and the coefficients fluctuated around the ideal, medium strength relation. The MSA (Measure of Sampling Adequacy) values measuring the strength of relationship of a given variable with all other statements exceeded 0.5, so no scale item was eliminated (Mitev-Sajtos, 2007). In accordance with the original 4 SOs of M&S’s typology, we tested first the four-factor solution (Table XXXIII). Eigen-value of each factor was higher than 1 and they explained 56,47% of variance of the data. However, the scrutiny of the composition of factors suggested an inconsistency in the content elements of strategic behavioural patterns. The behavioural characteristics of SOs showed up as mixed which concerned mainly Reactors and Defenders. Results of EFA foreshadowed that the four-factor solution does not seem to be relevant to the population of pharmacies (Q1) and the dimensions depicting the individual SOs were not loaded by the items relevant to the literature (Q2). We examined the results of PCA in case of 3, 4 and also 5 factor solutions (Table XXXIII-XXXIV). The 2 factor solution did not prove to be a suitable structure, neither from theoretical, methodological nor sectoral perspective, because it classified into one factor the behavioural characteristics of Prospector and Defender SOs, both of which offer completely different answers for environmental adaptation. Furthermore the proportion of variance (42,095%) explained by the two factors was significantly lower than in the case of the other factor solutions. The five-factor structure is also not likely to map properly the number and composition of behavioural aspects of SOs observable in the HPRDS. This is because the added value of the fifth factor to total variance explained (61,18%) is insignificant (5,034%) and no scale item correlated strongly with the fifth factor, while the third and fourth dimensions divided into two different „factors” exactly the robustly cohesive characteristics of Defender SO, which contradicts theoretical implications and our experiences of qualitative in-depth interviews, Based on the still tolerable explained variance proportion (51,68%) and the professional review of the mixing behavioural characteristics, the three-factor solution fitted best to the observed data structure (Barna-Székelyi, 2009) (Table XXXIII). The indicated factor structure outlines that Defenders and Reactors representing two different SOs in the literature,

124
were loaded into a common factor. This result was anticipated based on the in-depth interviews with stakeholders of HPRDS, as between pharmacies following an unassertive, passive and inconsistent business behaviour we experienced rarely a sharp distinction. After the principal component analysis (PCA), we also performed factor analysis of Segev scale using Maximum Likelihood (ML) method. Based on the experience, we can state that in case of 2, 3, 4 and 5 factor solutions the composition of resulting factor structures were almost unchanged. Results of Goodness of Fit tests showed no significant difference between the degree of fit of factor structures containing 2, 3, 4, and 5 SOs and the original data structure (2:χ2=1218,205, df=349, sig=0,000; 3: χ2=752,848, df=322, sig=0,000; 4: χ2=588,235, df=296, sig=0,000; 5: χ2=482,087, df=271, sig=0,000). We explain in Chapter 44 (Discussion) the role of statements (DEF_5 and REA_4) „disrupting” the theoretically and methodologically consistent content elements and composition of the Prospector and Analyser SOs in the three-factor solution which is most optimal for sectoral specificities. Besides, in subchapter 26.4.1.2. along with the CFA results we discuss the doubts about the four-factor solution and further methodological confirmation regarding the plausability of the three SOs observed in HPRDS is demonstrated. Application criteria of EFA analysis for the Perceived Environmental Uncertainty scale were met, the value of KMO indicator is 0,812, the nulhypothesis – that the variables are uncorrelated – of Bartlett’s sphericity test was rejected (χ2=1159, 936, p=0,000), the MSA values of Anti-Image matrix were all above 0.5 and more than 75% of the values in the correlation matrix indicated significant correlation. The seven-factor solution examined by the PCA explained 59,112% of the total variance of the data and Eigen-value of all factors were higher than 1. The seven factors were identical to the latent theoretical constructs of the original PEU scale. The dimensions of the perceived uncertainty construct in the behaviour of wholesalers, manufacturers, patients, competitor pharmacies, regulatory authorities and the HCP, also in the change of financial conditions were all loaded by their originally corresponding indicator variables (Table XXXV). 27.4.1.2. Confirmatory factor analysis Confirmatory factor analysis (CFA) is the most standard tool for testing discriminant validity. Its role goes far beyond a simple "validity check”, since carrying it out reveals whether multi-item scales used in previous international studies are applicable or not in environmental contexts having different characteristics, i.e. do they prove to be valid and reliable by scientific standards. In our dissertation, during the CFA analysis of Segev scale identifying SOs, we performed CFA to compare fit indices of the three-factor solution identified in the EFA analysis to the results of the original 4 SO structure (Q1 and Q2). Relying on the theoretical model CFA is designed to generate the empirical variance-covariance matrix with the least difference (Hu-Bentler, 1999). For the assessment of fit of empirical data structure and the theoretical factor model there is no any comprehensive index, thus methodological literature suggests the use of several indicators together (Bentler-Bonnett, 1980). The most important fit index of CFA models derives from the χ2 test and its nulhypothesis asserts that fit of empirical data structure and the theoretical model is suitable. The output of χ2 test, the CMIN/df, is a general fit indicator which compares the model’s capability to predict the empirical variance-covariance matrix to the hypothetic baseline that "there is no any a priori theoretical base model" (Weiber-Mühlhaus, 2010). The exclusive use
125
of the χ2 test has been criticised since it is sensitive to sample size, number of estimated parameters in the model and normal distribution of integrated varibles. Therefore other fit indicators have been developed, which are described briefly below. The RMSEA (Root Mean Square Error of Approximation) index quantifies, by the analysis of the residual terms, the deviation between the variance-covariance matrices predicted by the model and obtained by empirical observation (Byrne, 2001). It sets up a testable hypothesis to decide whether the RMSEA index falls into a given confidence interval or not (Chen et al., 2009). The CFI (Comparative Fit Index), the NFI (Normed Fit Index and the TLI (Tucker-Lewis Index) belong to the group of incremental or comparative indicators („modification indices”) (Bentler-Bonett, 1980). These are used when on the original factor structure – by eliminating, interchanging items, or allowing the covariance between certain error terms – moderate modifications are carried out and the results are compared to a basic model specified in an earlier stage (Lowry-Gaskin, 2014). First, we subjected Segev scale to CFA analysis. Due to the results of EFA, we integrated both the 3 and 4 factor solution models, the first grouping Defender and Reactor SOs into one dimension, while the other handling them separately (Figure X-XI). In line with our expectations fit indicators of the original four-factor solution produced lower values compared to the three-factor solution, which is the consequence of the „mixed” behavioural characteristics, discussed during the EFA analysis. Table XXXVI shows the fit indices of confirmatory factor models operationalising the 3 and 4 SOs as latent constructs. Results were created by keeping the composition of original factor structures, without deleting any single indicator variable. According to Table XXXVI, the fit indices of the three-factor solution fulfil the criteria of methodological literature to a greater extent, than the factor structure containing 4 SOs. Thus the Prospector, Analyser and Defender/Reactor SOs fit better to the data structure, and are markedly separated from each other. Hence, in HPRDS discriminant validity exists and it is stronger than in case of the original classification of M&S, treating Defender and Reactor SOs as distinct, separated environmental adaptation patterns (Q1 and Q2). Table XXXVII contains the evaluation of fit indices experienced during the CFA analysis of PEU scale. Results were developed by preserving the original structure of 7 factor model without deleting any single indicator variable (Figure XII). The table reveals that fit indicators of confirmatory factor model confirm the theoretical factor structure, thereby corroborating the discriminant validity of this measurement instrument. 27.4.1.3. The reliability of indicators After running the CFA, we had an opportunity to examine the reliability of indicators for each latent variable which is one of the simplest test for the confirmation of discriminant validity. Tables XXXVIII-XXXIX-XL illustrate the results of CFA analyses of the 3 SOs (factor) Segev and PEU scales. We can conclude that the standardised regression weight of neither indicator variable is less than the 0.4 value specified by Churchill (1979), thus, neither of them had to be removed from any individual constructs of the model. 27.4.1.4. The examination of connections between latent constructs The confirmation of discriminant validity by the most fitting way to its theoretical meaning is

126
the analysis of the relations between latent constructs. If after the CFA the covariance and correlation values between latent variables are high, then discriminant validity of the measurement instrument is doubtful (Bagozzi et al., 1991). In this case there is a risk that latent constructs are „blurred" with each other and, in extreme cases, scale items can measure only one, hidden latent factor. To confirm discriminant validity after the CFA, we have to verify how strong relations we can find between latent variables. M&S’s SOs can be considered as latent variables of the Segev scale. To answer our Q1 and Q2 research questions it was a key element to examine whether SOs in the 3 and 4 factor solutions’ structures are significantly separated from each other or not. Therefore in Table XLI, we indicated covariance and correlation values between latent constructs obtained after the CFA of factor models containing both 3 and 4 SOs. In the factor model containing 3 M&S’s SOs connections between latent constructs are lower than in the original 4 factor classification, where we registered higher interrelations between Defenders and Reactors. In the case of the 3 factor solution, the covariance values and correlation coefficients between the Prospectors, Analysers, Defenders/Reactors are under the 0.5 level (Weiber-Mühlhaus, 2010). It is important that in accordance with the theory, the sign of covariance and correlation values between Prospector and Defender/Reactor SOs, located at the two opposite ends of strategic adaptation continuum, is negative. Thus, discriminant validity of Segev scale’s 3 factor solution is confirmed once again, Prospectors, Analysers, Defenders/Reactors are significantly distinct from methodological aspect as well. As the results of Table XLII clearly show, we did not experience higher covariance and correlation than the allowed 0.5 in any of the latent factors of the PEU scale. Based on the findings, discriminant validity of this measurement instrument was also confirmed. 27.4.1.5. The comparison of alternative CFA structures Discriminant validity can be also confirmed by running two consecutive CFA. The first examines the fit of the original factor structure, while in the second we fix covariance parameters indicating the relations between latent constructs to the value of 1. This assumes that there is a function-like relationship between the measured latent variables. If fit indicators of the second factor model are worse than the ones of the first, discriminant validity of the measurement instrument can be confirmed (Fornell-Larcker, 1981). Table XLIII illustrates the results of CFA models assuming relations between the SOs and carried out with fixed covariance values equal to 1 between latent constructs, and also illustrates the comparison to the results of the original CFA in case of both the 3 and 4 factor solutions of Segev scale. It is evident that if we assume a totally interdependent relation (cov = 1) between the M&S’s SOs, then fit indicators of models are also deteriorating in the 3 and 4 factor structure. Hence, discriminant validity of the Segev scale is again confirmed also by the „discrepancy” method. In the case of PEU scale, Table XLIV is comparing fit indicators of the original CFA analysis and the one fixing the covariance values of latent constructs at 1. The majority of fit indicators of the second model also meet the academic threshold criteria, but are slightly worse compared to the values experienced in the original confirmatory factor model. Discriminant validity of the PEU scale of M&S was confirmed again. It is important to note that the minor differences between the two models is ideal from both methodological and theoretical point of view, since it indicates that we measured a single, robust latent construct (PEU), but the dimensions forming the construct are still distinctly differing from each other.
127
27.4.1.6. Fornell-Larcker’s criterion and validity of cross-loadings A strict condition for the confirmation of discriminant validity is the so-called Fornell-Larcker criterion (Fornell-Larcker, 1981). According to this, the variance of a latent construct is influenced more by its own indicators than by indicators associated to another latent construct, and the indicators of a specific latent construct explain to lesser extent the variance of another latent construct. The Fornell-Larcker criterion is met if the AVE (Average Variance Extracted) indicators of all latent constructs are higher, than the square of the correlation between a given construct and any other latent constructs (Farrell, 2010). In Chapter 27.4.3. concerning convergent validity we discuss in a more detailed way the meaning and calculation of AVE indicator. The so-called cross-loading validity is very similar to Fornell-Larcker criterion. According to the former the correlation between a given indicator and its latent construct is higher, than the measured correlation between the given indicator and any other latent construct (Henseler-Ringle, 2010). In Table XLV, we show the AVE values of the constructs of Segev scale operationalising M&S’s SOs and the square of the correlations measured between them, both in the case of the 3 and 4 factor solutions. The structure of the 4 factor Segev scale does not meet the Fornell-Larcker criterion as expected, because the high correlation between Defender and Reactor SOs exceeds the lower value of the two constructs’ AVE indicator. However, Fornell-Larcker criterion is met in the case of 3 factor structure, as the AVE indicator of all the constructs exceeds the square of the correlation coefficients measured between any two constructs. Thus, discriminant validity of the Segev scale having a 3 factor structure is confirmed by the Fornell-Larcker methodology. Table XLVI depicts the AVE values of the constructs of PEU scale and the correlation coefficients measured between them. Fornell-Larcker criterion is met as the AVE indicator of all latent constructs is higher, than the square of the correlations measured between them. Due to length limitations of the thesis, we could not present in detail the results of the cross-loading validity analyses. However, the criteria of the cross-loading validity were also met, since we could not find neither in the PEU scale, nor in the 3 factor Segev scale identifying Prospector, Analyser and Defender/Reactor SOs, any indicator variables displaying a correlation higher with another latent construct than with its own. 27.4.2. Summary of the results of discriminant validity checks We dealt exhaustively with the issue of discriminant validity which is really important to answer our Q1 and Q2 research questions. After a fragmented description of evaluations, we summarised in Table XLVII the results of methods testing discriminant validity of PEU scale and the 3 and 4 factor solutions of Segev scale identifying SOs. This proves that discriminant validity of PEU scale was confirmed by all the mathematical-statistical tests. Discriminant validity of the original, 4 factor structure Segev scale operationalising M&S’s SOs was not confirmed by several tests. However, the 3 factor solution earlier approved based on the results of the EFA and CFA analyses, satisfied the criteria of discriminant validity. Based on our results, to answer our Q1 research question regarding the number of M&S’s strategic behavioural patterns observable in the HPRDS, we can state that pharmacies are pursuing 3 SOs. The items of the original Defender and Reactor behavioural patterns of environmental adaptation were largely loaded on one common factor, which we denoted as Defender/Reactor SO. According to this, in our answer to research question Q2, we can

128
confirm that M&S’s SOs can not be observed in their original, pure form in this environment characterised by bureaucratic coordination mechanisms and limited competitive intensity, as the Defender/Reactor can be seen as a certain hybrid or mix of Defender and Reactor behavioural characteristics. For the grounding of our response to Q2 research question, we not only verified the distinction of SOs, but we tested the differences in the manifestation of certain behavioural characteristics of Prospectors, Analysers and Defender/Reactors relevant in the HPRDS. We tested the significance of the overall differences between the means of evaluations given by pharmacists concerning the behavioural characteristics using ANOVA, while we performed post-hoc Tukey, Scheffe and Bonferroni tests to pairwise compare the SOs (Table XLVIII). Based on the F values regarded as the output of the variance analyses, we did not experience a difference only in the manifestation of REA_4 – „In recent years our pharmacy has been attempting to adapt its product and service portfolio to the ever changing needs and preferences of our patients” – behavioural characteristic between Prospector, Analyser and Defender/Reactor SOs. Thus, Prospector, Analyser and Defender/Reactor SOs observed in HPRDS and pursued by public pharmacies are significantly different based on their behavioural characteristics, so we can identify three fairly distinct strategic behavioural patterns. Therefore we can refine our answer to research question Q2 that while we could not observe the M&S’s SOs in their original form due to the „overlap” of Defenders and Reactors in the HPRDS, we can define a significant distinction of the three relevant SOs observable in this special sectoral context. It does not change our results, only puts them into a more nuanced perspective and bears a bit different shade of interpretation that the post-hoc Tukey, Scheffe and Bonferroni tests used for the pairwise comparisons indicate that individual SOs do not differ so sharply from each other based on specific behavioural aspects. In particular, we found no such significant difference in the relation between Analysers and Prospectors. This suggests that we found significant differencens between the general behavioural patterns observed in the environmental adaptation of pharmacies, but between the manifestations of certain content elements of the SOs there is a smaller discrepancy in the strategic-level management practice of Prospector, Analyser and Defender/Reactor pharmacies. We detail this phenomenon and the results concerning the REA_4 statement in the Discussion (Chapter 44) of our doctoral dissertation. 27.4.3. Convergent validity It is a requirement in social and natural sciences as well that one construct could be measured with at least two methodology (Churchill, 1979). Convergent validity examines, in its classical sense, the extent of which the instruments applied for the operationalisation of given constructs lead to the same result (Cunningham et al., 2001, Farrell, 2010). For example, is the room’s height turns out to be the same when we use a mesauring tape, a folding rule, our own eyes or a laser range-finder? During research, the operationalisation of constructs is often limited to the use of single measurement instrument, and performing multiple measurement methods for the same constructs simultaneously is rarely feasible. In strategic management parallel application of several questionnaires and in-depth interviews or focus group discussions may prove to be the most realistic option for this. As we mentioned, unfortunately it is a rare possibility that a given theoretical construct could be measured by several quantitative methodological techniques in the same study (Demerouti

129
et al., 2003). In the academic profile of our dissertation convergent validity had an important role, since we applied several identification techniques for the observation of M&S’s SOs. The degree of convergence in results made by different measurement instruments was examined by association tests and to answer our Q3 research question the sample distribution ratios of Prospector, Analyser, Defender and Reactor pharmacies identified by the 3 various strategy extraction techniques were compared via statistical tests. We deal with the examination of convergent validity in its classical approach in Chapter 32. In this chapter, we persent which standard mathematical-statistical tests can be used by researchers to examine convergent validity of the multi-item scales integrated into our research. In empirical studies where only one measurement instrument is available, international methodological literature considers conventionally AVE indiactor as the most accepted tool to test convergent validity (Fornell-Larcker, 1981). The criterion for the confirmation of convergent validity is that AVE indicator of latent variables operationalised by multi-item scales should exceed the 0.5 threshold value (Baumgartner-Homburg, 1996). The average variance explained indicator can be calculated by using the following formula: AVE= (∑λi
2)/ [(∑λi2)+ ∑(1- λi
2)] = (∑λi2)/k
The (∑λi2) used both in the numerator and denominator of the formula denotes the sum of square of the standardised regression weights of all indicator variables associated to the given latent construct, while k is the number of indicators of the construct. Table XLIX shows the AVE indicators of the dimensions of PEU scale and Segev scale identifying SOs, both in the case of 3 and 4 factor solution. AVE indicators of the latent constructs exceeded the 0.5 threshold value in the case of PEU scale of M&S and the Segev scale identifying SOs, so we can confirm the convergent validity of our main measurement instruments. In the Segev scale, we calculated AVE values for both the original 4 factor and the 3 factor solution better fitting the data structure. As expected, the AVE indicators of the latter are much higher, so in this case the convergent validity of the measurement instrument is also stronger. 27.4.4. Nomological validity The nomological or conceptual validity is usually the most common met criterion of construct validity which can be partly explained by the fact that no rigorous mathematical and statistical methods were developed for its testing (Peter, 1981). The nomological validity is therefore a qualitative measure of construct validity and its existence depends on the extent to which constructs examined in a given research can be regarded as a close-knit nomological, theoretical as well as industry-specific and practical "network". SO, PEU, GL and BP are considered as the four main scientific constructs of our dissertation. These four constructs shape a strongly coherent, interdependent conceptual network from the perspective of business economics, strategic management and marketing, which is supported by the the previous studies examining the relationships between them on numerous occasions (Nandakumar et al., 2010, Parnell, et al., 2012). The examined research questions and the obtained results related to this nomological network were described in detail in the literature review chapters of our thesis (Table XII). Thus, the scientific constructs used in our doctoral research really form a coherent theoretical net, fulfilling the criteria of nomological validity.

130
27.4.5. The evaluation of construct validity Overall, we can ascertain based on the analyses of nomological, convergent and discriminant validities that conditions of nomological validity of measurment instruments applied in our doctoral research were fulfilled, while the criteria of convergent and discriminant validity were also met almost fully, hence the construct validity in our study can be confirmed. 28. The consequences of discriminant validity examinations regarding the research questions and hypotheses of our doctoral dissertation However, it is an interesting theoretical question of strategic management whether the Defender/Reactor SO 1) can be considered to be a simple mix of the Defender and Reactor strategic behavioural patterns or 2) forms a completely independent, hybrid SO based on the organic configuration of the various behavioural characteristics. To answer this question, of course, requires further studies and modifications on the measurement instruments, but we can draw several exciting insights from the scrutiny of the 3 factor structure of Segev scale (Table XXXVIII). In our opinion, Defender/Reactor SO examined in the HPRDS could be regarded more like as a mix approach, rather than an independent, organic hybrid SO. Our statement is is supported by the following methodological facts: ● According to the factor loadings, Defender behavioural characteristics constituting the
Defender/Reactor SO closely correlate with the Defender/Reactor factor, while the connection of the Reactor behavioural aspects is less strong to this dimension, their factor loadings are significantly less than those of the Defender items.
● We did not observe any „mixture” in the structure of the items constituting the
Defender/Reactor SO (factor), Defender items are situated „below and beside” each other and are „followed” by Reactor statements located also „below and beside” each other.
● If we examine Table L depicting the correlation coefficients between the behavioural
characteristics of the Defender/Reactor SO, we can see that correlations between Reactor behavioural characteristics are usually higher, than the correlation coefficients between the Reactor and Defender behavioural characteristics.
● Accordingly, the correlation values between Defender behavioural characteristics
consistenly exceed the correlation coefficients between the Defender and Reactor behavioural aspects (Table L).
The above observations therefore suggest that in Defender/Reactor SO 1) the Defender behavioural characteristics are linked closely to each other, 2) the Reactor behavioural characteristics are also strongly related to each other, 3) the two groups of behavioural characteristics are relatively distinct. However, if Defender/Reactor SO observed in the HPRDS is regarded as a strategic mix – and not as an independent, hybrid SO based on the organic configuration of the behavioural characteristics – then the question arises: is it more similar to the Defender or to the Reactor SO? The question is relevant not only from theoretical, but from a sectoral point of view, as it is not at all trivial that the attributes of a conscious and viable strategic behavioural pattern (Defender) characterise predominantly pharmacies pursuing similar SOs or rather the behavioural features of an inconsistent and doomed SO (Reactor) prevail in their case.

131
To answer this question, we summarised in Table LI how certain characteristics of the Reactor and Defender behavioural patterns were evaluated in the Segev scale on average by pharmacy managers listed under the Defender/Reactor SO. This reveals that these pharmacists gave higher values in general to the Reactor behavioural characteristics and consistently judged their prevalence as stronger than those of the behavioural aspects of Defender SO. In addition, Table LII shows that the average evaluation assigned by pharmacy managers to the behavioural characteristics of Defender SO of the 89 pharmacies identified as Defender/Reactor were exceeded – with a few exceptions by a statistically significant degree – by the average evaluations given to the behavioural aspects of Reactor SO. In the case of Defender/Reactor pharmacies, the dominance of Reactor behavioural characteristics is reinforced also by the original results of the self-typing paragraphs. As we show it at the classical convergent validity tests of the measurement instruments identifying the SOs (Chapter 32), during the use of the self-typing paragraph method extracting SOs on a nominal scale in explicit form, among the pharmacy managers only 10 rated the SO of their pharmacy as Reactor, while 80 reported that their company pursues Defender SO. In contrast, based on the results of the more valid and reliable multi-item Segev scale operationalising SOs as latent constructs, the number of Reactor pharmacies drastically increased from 10 to 80, while that of Defenders radically decreased from 80 to 45. Based on this, pharmacies pursuing Defender/Reactor SO sampled in our doctoral research are more likely to resemble to the inconsistent Reactor SO. Our statement is also confirmed by the results of the regression and structural models – established for analysing the relationship between SOs and BP – presented in the latter parts of our thesis (Chapter 35-40). According to these, BP of pharmacies pursuing Defender/Reactor SO significantly in the case of SAL and insignificantly in the case of NP, but falls behind the performance of Prospectors and Analysers, which is largely in line with the theoretical implications of M&S. Thus, we identified 3 SOs of M&S in the HPRDS, of which the Defender/Reactor SO forms a unique, „mix” behavioural pattern, characterised – despite the higher loadings of Defender items – dominantly by Reactor attributes. However, this has an important impact on the answers to the research questions of our doctoral dissertation and the testing of its hypotheses. The reason of this is that our research questions and hypotheses – stemming from the implications of M&S strategic theory and from the experiences of in-depth interviews with key stakeholders of the HPRDS – all established the assumed relationships regarding the 4 original SOs – Prospectors, Analysers, Defenders and Reactors – of the M&S strategic typology and the other constructs (BP, PEU, GL) examined in the thesis. Due to the relevance of the Defender/Reactors observed in the sectoral context of our research and the predominant behavioural characteristics of Reactors within this „mix” SO, we came to two important decisions: 1. We eliminate all our research questions and hypotheses concerning Defender SO and its
interrelations to other constructs of our thesis (BP, PEU, GL, socio-demographic characteristics and site attrubutes).
2. We evaluate empirical results obtained for Defender/Reactors based on the content
elements (e.g. relationships) of research questions and hypotheses set up for Reactors.

132
All of this, from the point of view of the interpretation of results, is reflected in the changes indicated in Table LIII. Given the findings of discriminant validity tests affecting greatly the answers to our research questions and hypotheses, we continue our thesis with the reliability tests of our applied measurement instruments (multi-item scales of Segev and M&S). 29. Reliability In addition to insuring validity, an important criterion for the measurement instruments (i.g. multi-item scales) used in scientific studies is that they have to offer consistent results when the measure is performed repeatedly on a given variable (Füstös et al, 2004). Taking into consideration that the appropriate resources are rarely available to repeat the data collection process, academic studies in most cases examine the alternative of reliability based on internal consistency. Its wisely accepted measure is the Cronbach’s Alpha coefficient, which is the average of the correlation coefficients calculated from every possible „split” into two parts of the scale items associated to the measurement of a given construct (Cronbach, 1951). During the scale developing pre-tests conducted with pharmacy managers, we had the opportunity – with the elimination, reformulation or addition of certain items – to meet the 0.7 threshold value formulated by Nunally (1978) or at least the 0.6 threshold value proposed by Malhotra for scales still in the development phase (Malhotra-Simon, 2009). Naturally we could have improved reliability coefficients by item eliminations after obtaining the survey results, but it is less accepted when we validate such scales in domestic context which were already applied and tested in past international studies (Peter, 1979). The elimination of items less supportive in the measurement of certain constructs could cause a loss of information in a given situation, so we tried consistently preventing this during the whole data analysis process – thus, in the SEM analyses, too – of the doctoral research. In Table LIV, we presented the values of Cronbach’s Alpha indicators gained for the reliability of the multi-item scales operationalising our main constructs (M&S’s SOs and PEU). As seen, Cronbach’s Alpha indicators of all latent variables of the PEU scale exceeds the expected 0.7 threshold value, but the items regarding Reactors from the Segev scale identifying the four original M&S’s SOs were not proved to be sufficiently reliable. This was expected based on the pre-tests of qualitative research and the experiences of discriminant validity examinations. According to the EFA and CFA analyses of the Segev scale, in HPRDS we differentiated 3 relevant M&S’s SOs instead of the 4 original ones. Therefore, we also indicated the Cronbach’s Alpha indicators of Prospector, Analyser and Defender/Reactor latent constructs in Table LIV. The latter is greater than 0.7, so the reliability based on the internal consistency of these dimensions can be confirmed. We can find several criticism regarding Cronbach’s Alpha indicator in the statistical literature (Graham, 2006), of which we have to highlight that by increasing the number of items the value of the coefficient can be increased arbitrarily. Another important criticism is that its application for measuring the reliability of latent constructs is limited, since at the beginning researchers developed its methodology based only on explicitly measured, i.e. directly operationalised (asked) variables (Sijtsma, 2009). Therefore studies using structural models prove with additional indicators the reliability of estimated latent constructs. Among them we have to highlight the so-called Composite Reliabilty (CR) indicator and the indicator reliability associated with each individual indicator (Raykov, 1998). We already discussed the examination of the latter during the confirmation of discriminant validity and

133
we determined that indicator reliability is also confirmed in the case of PEU and Segev scales. However, the value of Composite Reliability can be considered the most important overall reliability indicator when estimating latent constructs during SEM analyses, and it can be calculated by the following formula (Weiber-Mülhaus, 2010). CR = (∑λi)2/[(∑λi)2 + ∑(1- λi
2)] The (∑λi)2 shown in both the numerator and denominator of the formula is the square of sum of standardised regression weights of all the indicator variables associated to the given latent construct. According to the criterion, CR value of every latent variable used in the model has to reach 0.7, but some authors accept also the 0.6 threshold value (Backhaus et al., 2008). In Table LV, under the Segev scale identifying SOs, we indicated the constructs’ reliability values in case of both the original 4 and the 3 factor – relevant after the discriminant validity tests – structure solutions. In the case of multi-item scales applied in our research, CR values of the individual latent constructs generally exceed steadily the 0.7 threshold value regarded as the criterion of methodological literature. Therefore, measurement instruments used in our dissertation examining the relationships between SOs, PEU, GL and BP in the HPRDS can all be considered reliable. 30. Common method variance Prestigious scientific journals lately are increasingly excepting their authors to avoid distortions stemming from the so-called Common Method Variance (CMV) in survey-type examinations by performing additional validity and reliability tests (Kline et al., 2000). CMV is especially prone to cause problems in cases, when the independent and dependent constructs of the questionnaire are both evaluated by a single respondent and the evaluations were operationalised on a scale based on subjective judgement (e.g. Likert-scale) of respondents (Podsakoff-Organ, 1986, Lindell-Whitney, 2001, Spector, 2006). According to general methodological experiences CMV results in a false internal consistency due to the single respondent design (Malhotra et al., 2006), as respondents may be inclined to provide compatible, professionally consistent answers to the statements of the multi-item scales, even if their real evaluations and actions deviate from those. Due this „item-to-item” and „item-to-total” correlations will be artificially high, even though the applied measurement instrument suffers from systematic errors (Chang et al., 2010). Validity distortions stemming from CMV – apart from efforts to provide consistent answers – may be induced by other factors as well, such as the „compulsion” to provide socially accaptable answers, lack of information and knowledge or environmental stimuli of the research situation that disturb the respondent etc. (Podsakoff et al., 2003). We have the Likert-scale surveys used in our research filled out by a single respondent (the pharmacy manager) either, which anticipated the problem of CMV and the necessity to handle it. Amongst the procedures used to deal with the CMV problem scientific literature differentiates qualitative methods applied before the data collection process, and „post-hoc” mathematical-statistical techniques. To minimise CMV we took the following „precautonary” steps before data collection (Lindell-Whitney, 2001): During the data collection process we asked pharmacy managers, as it is probably them –
and not their employees – who are in possession of knowledge required to fill out a

134
strategy-themed questionnaire, and are also less effected by the factors of the need to comply as detailed above (Tan-Tan, 2005).
We did not place the independent and dependent variables directly following each other
within the survey, but wedged questions regarding sectoral policy and tactical level management between them.
First we inquired pharmacists about independent variables, and only continued with
introducing dependent variables after that, in order to avoid a strong influence of an early inquiry about BP on the respondent’s evaluations provided for the independent variables (Pfeffer-Salancik, 1997).
We placed questions regarding BP of pharmacies among items pertaining to pharmacies'
several other socio-demographic characteristics and site attributes. With this we intended to achieve that BP indicators „blend into their environments” and are not perceived as questions with an emphasised focus by the respondents.
We placed the question block pertaining to socio-demographic characteristics, site
attributes and BP indicators at the end of the questionnaire, as we easily could have detered pharmacicts from answering the most important constructs – PEU and M&S’s SOs – of the research by asking about concrete figures regarding the more confidential areas of pharmacy management on the first page of the questionnaire.
According to methodological literature anonymity of respondents and confidential
treatment of received answers increase the validity and reliability of results (Babbie, 1995). Therefore we placed the following caption in the request cover letter accompanying the questionnaire: The survey is voluntary and anonymous, and we kindly ask you not to fill out the „Sender” space found on the return envelope. Completed questionnaires are received by the Department of Marketing of Corvinus University of Budapest. We treat every returned surveys with strict confidentiality, and we assure you that your answers can not be provided to a third party even in their anonymous form (Act CXII., 2011).
Following the qualitative „cautonary” measures taken before the data collection by survey we turned our attention towards the testing of the CMV problematics by mathematical-statistical methods. We strived to perform as many checks common in scientific literature, and complying with the nature of our research and improving validity, as possible (Spector, 2006): 1. The Harman one factor test is a commonly used method for post-hoc identification of
distortions caused by CMV (Williams-Brown, 1994). It is based on the experience that when the single – i. e. the first – dimension explains more than 50% of the total variance after the EFA analysis of the multi-item scales operationalising the latent constructs in the empirical research, then that applied measurement tool distorts the received results (Richardson et al., 2009).
We ran the Harman one factor test both for the M&S’s PEU and Segev scales identifying SOs. Table LVI depicts the results of the unrotated – as required by methodological criteria – (Spector, 2006) single factor solutions performed in SPSS with various methodological extraction techniques (PCA, ML). According to the Harman’s CMV test the effect of the first factor, explaining a given proportion of total variance does not even approach the threshold of 50%, i. e. the validity of multi-item scales answered by a single respondent were not

135
influenced by the distortion stemming from the measurement method of choice. 2. The next methodology suitable for testing CMV is the Common Single Latent Factor –
CSLF – analysis. The method attaches an additional latent construct to the applied multi-item measurement model (Figures XIII-XIV-XV). By quantifying all connections between the new common, latent variable and the manifest variables of the original model we receive the common variance, which according to CMV theory is the result of the distortion caused by the single respondent design and the single measurement methodology. During CSLF analysis two conditions must be met in order to confirm the validity of applied measurement instruments (Podsakoff et al, 2003, Lowry-Gaskin, 2014).
The square of the regression weights between CSLF and original manifest variables must
not exceed the threshold value of 0,25, otherwise the variance from the common method is disturbingly high.
No significant change occurs in the regression weights between original latent constructs
and manifest variables by introducing CSLF, thusly demonstrating that the common variance explained by the new, latent variable is low.
According to Table LVII square of the regression weights between the additional common, latent variable (CSLF) and the original manifest variables does not reach the threshold value of 25%, therefore validity distortions stemming from CMV are not significant for multi-item scales identifying either PEU or SO. The other condition of CSLF method – namely the stagnation of the regression weights of the original latent variables and the manifest variables connected to them – is met as well, as based on the χ2 tests ran after integrating the common latent variable neither the complete models, nor the individual regression weights differed significantly from each other. 3. The marker variable technique can be regarded as an expansion of the CSLF method, and
may be the most accurate test of variance stemming from common measurement instruments (Williams et al., 2010). The essence of the marker variable technique, which was based on the basic idea of partial correlation, is that parallelly to the CSLF added earlier it integrates a further latent construct into the multi-item measurement instrument. Demonstrating the covariance of the marker variable and the original, latent constructs is meant to reduce the variance stemming from a common method, as the effect of CSLF on manifest variables has to decrease by incorporating a latent variable that seemingly „does not fit in”. This basically amounts to filtering the partial effect. The marker variable hence is a construct that – according to the assumption of most reseachers – shares a slight connection with other latent variables.
In our research we examined the validity of PEU and Segev scales via the method of marker variables. Based on the set of variables we elected additional marker constructs for the Segev scale from the PEU scale, and vica versa, for the PEU scale from the Segev scale. Considering the length limitations of our thesis we showcased marker variable testing of CMV solely in Figures XVI and XVII, wherein we only depicted the inclusion of a single marker variable – the Segev scale's Defender factor for the M&S’s PEU scale, and the Regulatory Authorities factor of the PEU scale for the Segev scale – for both the M&S’s PEU scale and Segev’s scale identifying SOs of M&S. Table LVIII illustrates the results for the Segev scale obtained when the latent constructs of
136
the PEU scale were integrated as marker variables parallelly to CSLF. It is evident that the value of common variance respectively decreased further compared to the experiences of CSLF method by the individual inclusion of PEU scale's latent constructs, so validity distortions stemming from CMV are negligible in case of Segev scale operationalising SOs. According to Table LIX common variance did not decrease in case of either 3 or 4 factor solutions by including CSLF and marker constructs additionally attached to the PEU scale, yet it even slightly increased. Based on this the validity of responses given to the PEU scale are influenced by the distortion originating from CMV, if only slightly. Table LX – summarising the results of the 3 methodologies used for the examination of CMV – suggests the negligible presence of the variance caused by the common measurement instrument, and it is solely based on the marker variable technique that we can assume a minimal distortion of validity in the responses provided for the PEU scale. 31. Non-response bias Validity, reliability and especially generalisability of results – apart from the differences between the composition of the sample and the total population – could strongly be influenced by the degree of discrepancies found between early and late respondents based on the variables essential to the research and the main socio-demographic characteristics (Armstrong-Overton, 1977). The basic assumption of the so-called „non-response bias” problem is that significant differences encountered between the first and second wave of responses to a survey research can possibly lead to serious distortions (Groves et al., 2001). This assumption is based on the fact that respondents of the questionnaires received during the second wave showed similarities rather with the group of non-responders (Jobber-Saunders, 1989). If the phenomenon of non-response bias prevails, the ratio of respondents – answering the questionnaire during the later wave in a „negligent”, inconsistent way that provides low quality data – may increase, which necessitates the splitting of the sample into two sub-samples, as well as the comparison of those (Gatignon-Xuereb, 1997). In our survey exploring strategic behaviour of pharmacies we examined non-response bias in relation to main theoretical, as well as main socio-demographic and sectoral characteristics. We did this based on a breakdown to the geographical units that served as the location of data collection, as we received permission to conduct our research in Budapest and 4 other counties. We determined the sub-samples of early and late respondents in each regional unit by using the „median-split” method based on the number of days between dispatching the questionnaires and receiving the answers, as suggested by the postal stamp's date on the return envelope. We inspected significant differences between early and late respondents via analysis of variance in case of metric (scale) variables, and by contingency tables (cross-tabs) in case of nominal variables. Table LXI quantifies the results of non-response bias tests of examined individual variables, broken down to counties. Despite the large number of variables included in non-response bias test we found only 5 cases, in which answers received during the first wave showed a significant difference to those registered in the second one. Furthermore, results of the in-depth interviews conducted afterwards with representatives of HCP could not shed light on the possible professional causes of differences, either. Based on the theoretical, socio-demographic and sector-specific attributes the first wave of respondents showed no significant differences to the second wave in either of the counties, thus we could not assume respondents from the second wave would rather be similar to the population of non-respondents. Thus, validity, reliability and

137
generalisibility of results of our research are not distorted by non-response bias problematics. 32. The identification of Miles and Snow’s strategic orientations and the comparison of their distribution ratio Answering research question Q3 regarding the methodology of identifying M&S’s SOs can be viewed as a main empirical challenge of our dissertation. Based on the turbulent changes experienced within the regulatory environment and the results of in-depth interviews conducted with pharmacists we assumed in our research question Q4, that the distribution of SOs identified within HPRDS is not identical, meaning that the behavioural patterns of M&S can not be observed in a close to equal ratio. In our questionnaire aiming at the examination of strategic-level management processes of pharmacies we used 3 different measurement instruments in order to identify SOs followed by pharmacies. When answering our research question Q3 we examined the convergent validity of the operationalisation procedures aimed at identifying M&S’s SOs – namely the self-typing paragraph technique, the multi-item Segev scale (1987) and the method of objective indicators. In the classical scientific-methodological sense convergent validity is met, when a phenomenon is examined via a multitude of measurement instruments, and the application of those instruments yields near identical results (Peter, 1981, Babbie, 1995). Our research question Q3, regarding convergent validity, and Q4, dealing with the comparison of the distribution ratios of M&S’s SOs’ to each other show a strong, related content. Below we first start by presenting the results of the three measurement tools used for the identification of pharmacies' SOs. Following that we examine the sameness of the results of the techniques that helped us to classify pharmacies to SOs (Q3), and then proceed to compare distribution ratios of pharmacies following different M&S’s SOs to each other via statistical tests (Q4). We point to the detail, that besides Prospector, Analyser and Defender/Reactor SOs identified in discriminant validity examinations we also evaluated the results stemming from measurement instruments operationalising the original 4 behavioural patterns of M&S. 32.1. The strategic orientation of pharmacies according to the results of original measurement intruments Regarding the operationalisation of M&S’s behavioural patterns it is first important to state that we managed to apply only two of the originally planned strategic extraction techniques aimed at the identification of Prospectors, Analysers, Defenders and Reactors. Contrary to the multi-item scale of Segev and the self-typing paragraphs, the method of objective indicators unfortunately could not contribute to assigning pharmacies to SOs in our research. Probable reasons for this are that 1) pharmacists refrained from answering questions concerning performance and strategic-level management indicators that were required for the classification, or 2) they provided distorted, unrealistic data. Practical unusability of the objective indicators’ method is a methodological deficiency of our research, as lacking their assignment results only two of three methodologies required for a robust identification of pharmacies' SOs were available to us. We detail consequences of this in the chapters of Discussion and Directions of future research. Lacking the results of objective indicators we were only able to compare the frequency and distribution of SOs identified by self-typing paragraphs and Segev scale in order to answer

138
our research question Q3. Table LXII depicts the results of the self-typing paragraph method, offering the original 4 strategic alternatives and the multi-item Segev scale, operationalising the 4 strategic behavioural patterns, i. e. the assignment of pharmacies to SOs. For the identification of Prospectors we received near identical results by applying the two original measurement instruments. We however experienced a quite notable discrepancy in case of Analysers, as according to the self-typing paragraph method 1/3, yet based on the results of Segev scale only approximately 1/5 of pharmacists assigned their firm into this SO. We registered an even greater difference between the results of self-typing paragraph technique and Segev scale when identifying Defender and Reactor SOs. Self-typing paragraph method identified nearly twice as many Defenders in the sample, while it greatly underestimated the presence of Reactor pharmacies as compared to the results of Segev scale. Of course there could be several possible reasons for this. For one thing, statements of the multi item scale of Segev ask about changes in pharmacies' strategic behavioural patterns in a very detailed manner, one by one, while the self-typing paragraph method compresses statements regarding the behaviour of Propsector, Analyser, Defender and Reactor SOs into a single paragraph for each respectively. Therefore respondents find it easier to retain their overview and to distinguish with the self-typing paragraph method than in case of evaluating the statements of the Segev scale, when they had to consider deeply and provide their evaluations from statement to statement. The difference between the distribution of Defenders and Reactors may also have been partly caused by the phenomenon, that the formulation of Reactors' behavioural characteristics proved to be „less desirable” for responding pharmacists in case of self-typing paragraph method, even though during the preliminary tests we made every effort to not make this seem as the response alternative clearly representing the unsuccessful SO. The Analyser behavioural pattern is positioned in the middle of the imaginary environmental adaptation continuum, which might have directed responding pharmacy managers from the two „extreme” idealtypical SOs (Prospectors and Defenders) towards the „center”, for which reason Analysers are likely over-represented by the self-typing paragraph method. Placement of the two measurement tools may also have played a role in the differences between results, as it is possible, that after answering the statements of Segev scale at the beginning of the questionnaire, respondents automatically chose a SO with a dominant behavioural characteristic that remained with a greater emphasis in their short-term memory during the self-typing paragraphs, featured later in the questionairre. In the next chapter we present the results received for the identification of the relevant Prospector, Analyser and Defender/Reactor SOs within HPRDS in regard of the self-typing paragraphs and Segev scale. 32.2. The identification of relevant strategic orientations in the Hungarian public retail drug supply By performing PCA and CFA analyses we determined that within HPRDS only 3 of the original 4 M&S’s SOs can be observed. The examination of the degree of fit of factor structures to data revealed a large „interlacement” of the Defender and Reactor SOs' behavioural characteristics, therefore it proved indispensable in order to answer our research question Q3 to evaluate it based on the distribution ratio of Prospectors, Analysers and Defender/Reactors relevant within the sector.

139
To achieve this, we first rearranged the statements within the Segev scale according to the relevant 3 factor structure, based on which we re-calculated the weighted average of pharmacicts' evaluations provided for Prospector, Analyser and Defender/Reactor SOs. In case of the self-typing paragraph method we summarised the responses given to the paragraphs describing Reactor and Defender SOs in a single variable. Table LXIII thus already shows the results of the strategy identification techniques in consideration of the fact, that disriminant validity tests revealed the presence of 3 relevant SOs within HPRDS. Results of the self-typing paragraph method showed close to no difference compared to the 4 SO solution, we only expanded the number of Defenders by adding those 10 pharmacies, which earlier were assigned to the Reactor behavioural pattern by their managers. The identification results of the Segev scale however were notably altered by the rearrangement of items of the original factor structure, just as we expected. As seen in Table LXIII we identified 55 Prospector, 63 Analyser and 89 Defender/Reactor pharmacies. As we can see, the composition and evaluation of statements loading the SOs (dimensions) changed due to the rearrangement of the factor structure, therefore not all pharmacies identified previously as Defenders or Reactors were classified to the factor „representing” the Defender/Reactor SO. Based on experiences we can state that we registered greater or lesser differences between the results of the strategy extraction techniques used in our research. Thus, differences between the frequency and distribution ratio of pharmacies following various M&S’s SOs may largely depend on 1) the applied measurement instrument and 2) whether we accept the operationalisation approach aimed at original four SOs or the three strategic behavioural patterns that proved to be relevant within the HPRDS. Therefore, in order to answer our research question Q3, we examined the discrepancies experienced between the classification results in regard of the two measurement instruments in the cases of both the 3 and the 4 SO approach when evaluating convergent validity in its classical sense. 32.3. Testing convergent validity in its classical approach When testing convergent validity of the self-typing paragraph technique and the Segev scale (Q3) we first inspected the „internal” convergent validity of the measurement instruments. Table LXIV shows the degree of identical results received for the uncovering of strategic behavioural patterns depending on the acceptance of either the originally applied approach of 4 SOs, or the 3 confirmed by PCA and CFA analyses, within a given measurement instrument. In case of the self-typing paragraph method „internal” convergence is completely fulfilled, as the difference between pharmacies classified to identical SOs in the 3 and 4 alternatives’ approach are those 10 Reactor pharmacies, which we assigned to Defender/Reactors during the relevant 3 SOs approach. We experienced a sizable match between the 3 and 4 factor approach as well. Ratio of pharmacies classified to identical SOs approached 80% even despite of the fact that averages changed due to the rearrangement of scale-items, while the ratio of pharmacies categorised differently was approximately 1/5. „Internal” convergence validity of the two measurement tools can be confirmed, as accepting either the 3 or 4 SO approach for a given measurement instrument, did not largely change the classification results for pharmacies. In Table LXV at the same time we examined the convergent validity between measurement instruments used for identifying SOs. In the classical sense convergent validity can be confirmed, if results regarding the classification of pharmacies to M&S’s SOs of both the

140
Segev scale and the self-typing paragraphs approximate each other. According to Table LXV we experienced a large divergence in the results of the self-typing paragraph method and the multi-item Segev scale, applied to identify the original 4 M&S’s SOs. Ratio of pharmacies assigned to identical SOs by the two methodologies did not reach 40%. However, according to results regarding the identification of the 3 strategic behavioural patterns observed within HPRDS, the ratio of pharmacies classified to identical SOs significantly increased, and almost reached 2/3. In order to answer our research question Q3 aimed at the examination of convergent validity, we tested the significance of the difference between the classification results of the two strategy extraction techniques by means of statistical tests. In case of the 3 and 4 factor solutions, as well as the self-typing paragraph method and the multi-item Segev scale we compared the means of the SOs operationalised as dichotomous dummy variables based on McNemar’s χ2 test. The McNemar test, indicating a significant difference denotes that the classification results of Prospector, Analyser, Defender and Reactor pharmacies differ from each other. Accordingly, convergent validity between the two measurement instruments are indicated by the insignificant McNemar’s χ2 tests, based on which assignment results show no differences. Tables LXVI and LXVII depict the sameness of the classification results of SOs operationalised as dichotomous dummy variables in case of both methodologies and either the original 4 or the 3 SOs relevant within HPRDS. From results of the McNemar χ2 tests indicated in Table LXVIII it is evident, that in case of acceptance of the original 4 M&S’s SOs approach the convergent validity of the two strategy identification techniques is not fulfilled (Q3). According to results of the McNemar χ2 tests classification results of the Segev scale and the self-typing paragraph method showed notable differences. Only the ratio of pharmacies assigned to the Prospector SO showed sameness in regard to the two measurement instruments (χ2=0,522 and Sig=0,476). At the same time we found no statistical differences between the classification results of Segev scale and self-typing paragraph method, identifying 3 SOs, in case of any of the SOs. Based on the high concordance of pharmacies classified into the HPRDS-relevant Prospector, Analyser or Defender/Reactor SOs by both methodologies, the classical convergent validity of our measurement tools can be confirmed (Q3). In Chapter 32.4 we focus on answering research question Q4 and comparing the distribution ratios of M&S SOs. 32.4. Comparison of the distribution ratios of Miles and Snow’s strategic orientations With our fourth research question (Q4) we examined by comparing the distribution ratios of M&S’s SOs, to what extent pharmacies following different environmental adaptation behavioural patterns are either over- or under-represented compared to each other within HPRDS, this special environment characterised by bureaucratic coordination mechanisms and limited competitive intensity (Q4b, Q4d). To answer this question, we first tested the differences between classification results of the self-typing paragraph method and the Segev scale, both operationalising the 4 original SOs featured in data collection. We determined the respective distribution ratio of Prospectors, Analysers, Defenders and Reactors by comparing the means of dichotomous dummy variables derived from SOs via paired sample t-tests. Difference between the distribution ratio of Defenders and Reactors, Prospectors and Reactors, as well as Analysers and Reactors proved to be significant in case of both strategy
141
identification techniques (Table LXIX). However, this difference shows an opposite tendency for the two methodologies, as while the self-typing paragraph technique denoted a minority of inconsistent Reactors, at the same time Segev scale confirmed a relative excess of the Defender/Reactor SO. Based on the results we observed discrepancies regarding the two strategy extraction techniques in the evaluation of differences between the distribution ratio of Analysers and Prospectors, as well as Defenders and Prospectors. While the self-typing paragraph method confirms Prospectors' relative minority in both relations, classification results of Segev scale did not show difference between these two SOs. None of the methods showed any differences between the distribution ratio of Defenders and Analysers. Based on the measurement instruments operationalising the 4 SOs originally featured in data collection, it can be stated about the occurence of M&S SOs that according to the self-typing paragraph technique within HPRDS the presence of Defenders is dominant, closely followed by Analysers, while emergence of Prospectors is minimal, and Reactors appear at a completely vanishing ratio. Based on the pairwise comparisons between SOs only Defenders' majority against Analysers did not prove statiscally significant. According to the classification results of Segev scale pharmacies following Reactor SO represent a significant relative majority in HPRDS, and we did not register any difference in the respective ratio of Prospectors, Analysers and Defenders, all falling behind regarding their frequency. At the same time our research question Q4 can be answered most effectively by comparing the distribution ratios of Prospector, Analyser and Defender/Reactor behavioural patterns observed in HPRDS. To answer our secondary questions Q4b and Q4d – remaining relevant even after eliminating the original Defender SO – we examined the distribution ratios of Prospectors, Analysers and Defender/Reactors by comparing the means of SOs operationalised as dichotomous dummy variables via paired sample t-tests. Results are summarised in Table LXX. As it can be plainly seen, measurement instruments identifying the 3 SOs confirm the dominance of Defender/Reactors, for which reason we answer „yes” to our secondary question Q4d. Prepotency of Defender/Reactors' distribution ratio as opposed to Prospectors proved to be significant based on classifications of both self-typing paragraph technique and Segev scale. Relative majority of Defender/Reactors as opposed to Analysers was as well denoted by both methodologies, yet the difference between the distribution ratios of the two SOs was only significant in case of the Segev scale. Prospectors' relative minority could be observed in case of both strategy extraction techniques, yet while the Segev scale showed no significant differences during the comparison with Analysers' distribution ratio, the self-typing paragraph method did. Based on latter results we can reject the relation formulated in our secondary question Q4b. 32.5. The evaluation of the distribution ratios of M&S’s strategic orientations After the fragmented presentation of our experiences regarding the comparison of the results of measurement instruments used for the identification of M&S’s SOs, as well as the distribution ratio of Protector, Analyser and Defender/Reactor SOs found within HPRDS, we summarise our answers to our research questions Q3 and Q4 within this chapter. To our research question Q3 we can formulate the answer that assuming the original 4 strategic behavioural patterns of M&S we found a large difference between the results of measurement instruments applied in the survey data collection. According to the self-typing

142
paragraph method the ratio of Prospector, Analyser, Defender and Reactor SOs showed a notable difference to the classification results of the Segev scale. Thus it can be stated, that convergent validity is not fulfilled in case of the original measurement instruments that assumed the original 4 M&S’s SOs. However we experienced no significant differences between the classification results of the two measurement instruments in case of the approach based on the 3 strategic behavioural patterns observed in HPRDS. We experienced a remarkable concordance between pharmacies assigned to either Prospector, Analyser, or Defender/Reactor SOs according to both Segev scale and self-typing paragraph method, therefore it is safe to state that – in case of accepting the industry-relevant 3 SOs – convergent validity of the two measurement instruments was met. As far as answers to research question Q4 are concerned, according to the results of self-typing paragraph method and Segev scale operationalising the 3 strategic behavioural patterns observed in HPRDS the established „rankings” – concerning the distribution ratio of sector-relevant M&S SOs – do comply. Based on this dominance of pharmacies following Defender/Reactor SOs over Prospectors proved significant in the case of both methodologies, while its vantage opposed to Analysers' distribution ratio was significant only on the Segev scale. Despite of the latter, and at the same time relying on the more reliable and valid results of the Segev scale – operationalising 3 SOs – we answered „yes” to our secondary question Q4d. Difference between the distribution ratio of Analysers and Prospectors in case of self-typing paragraphs can, while in case of Segev scale can not be considered significant. However, considering that both methodologies indicated the minority of Prospectors compared to Analysers, our answer to question Q4b is „no”. More simplified we can state that within HPRDS, characterised by a limited competitive intensity and a strong bureaucratic coordination a relative majority of Defender/Reactors can be observed, followed by Analysers, while Prospectors can only be found in small numbers. In the next chapter of the PhD thesis we turn our attention towards the interrelationship of SO and PEU (Q5, Q6, Q7). 33. Strategy and environment One of the most important research areas of strategic management concerns the study of connections between strategic behaviour of enterprises and the external environment. International experiences report of mixed and equivocal results regarding the relevance of the „managerial choice” theory hallmarked by the name of John Child and the contingency theory approach (Augier-Teece, 2009). For this reason the examination of the interrelation between pharmacies' SO and the degree of PEU by pharmacy managers received special attention in our dissertation as well. We built up our answers to research questions Q5, Q6 and Q7 of the thesis step by step in the following subchapters. Starting with more simple methodological techniques and by progressing towards more complex mathematical-statistical analyses, we were eager to reveal whether Hungarian pharmacies' SO is determined more powerfully by the turbulently changing operating environment, or it is rather the SO chosen consciously by pharmacy managers that exerts a significant influence on the degree they perceive changes occuring in the HPRDS as unpredictable. It is important to note, that we integrated exclusively Prospector, Analyser and Defender/Reactor SOs observed within HPRDS and confirmed by earlier discriminant validity tests into the examination of the connections between M&S’s strategic behavioural patterns and PEU, which we operationalised by the Segev scale. Also, for the interpretation of

143
the tables showing the results pertaining to the relationships between M&S’s SOs and PEU we point toward the fact that the PEU scale was reverse-coded, meaning that the value of 1 stood for complete unpredictability, while 5 stood for complete predictability. 33.1. Correlation between perceived environmental uncertainty and strategic orientations To identify initial connections between the prevalence of M&S’s SOs and the degree of PEU by pharmacists we performed correlation analyses. Table LXXI shows in preparation to the answers given to research questions Q5, Q6 and Q7 the extent and direction of correlation between average evaluations provided for the HPRDS-relevant Prospector, Analyser and Defender/Reactor SOs and the evaluations given for PEU and BP. According to the table prevalence of Defender/Reactor and Prospector SOs showed no significant correlation with changes in the degree of PEU by pharmacists. Contrary to this – and in compliance with the implications of M&S’s strategic theory – managers operating pharmacies pursuing Analyser SO significantly perceived the unpredictability regarding the behaviour of external environment's stakeholders and changes of conditions to be lower. Thus the results of our correlation matrix show rather very moderate connections between the degree of pharmacy managers' PEU and pharmacies' SO, only the prevalence of Analyser SO produced a positive correlation with the decrease in degree of PEU. 33.2. The association between strategic orientations and perceived environmental uncertainty We also grounded research questions Q5, Q6 and Q7 regarding the development of the interaction between contingency theory's „environmental determinism” and the conscious strategic choice of John Child by a contingency table (cross-tabs) analysis. Following the partial results of the correlation matrix we had to prove, whether a general association between pharmacies' SOs and the degree of pharmacy managers' PEU can be determined at all within the HPRDS. Based on methodological attributes of the contingency table analysis and performing the χ2 tests used in the association tests, we can interpret the connections between the prevalence of Prospector, Analyser and Defender/Reactor pharmacies and the degree of PEU by pharmacy managers in two ways: We can shed light on, whether pharmacies following either Prospector, Analyser or
Defender/Reactor SOs perceive changes in environmental conditions and stakeholders' behaviour rather as predictible or uncertain (Q5).
We can examine, whether we find some kind of an association within groups
characterised by either low or high PEU regarding the prevalence of M&S’s SOs (Q6). Based on the weighted averages of the evaluations given for the items of Segev scale we classified respondents to the HPRDS-relevant Prospector, Analyser and Defender/Reactor SOs, while in case of pharmacy managers' PEU we created groups of pharmacies either perceiving a low or a high unpredictability. The contingency table (cross-tab) seen in Table LXXII shows whether we experienced a general association between SO and PEU, which may validate further analysis of the answers given to our research questions Q5, Q6 and Q7. The expected count of observations was never less than 5 in any of the cells, i. e. the results of

144
the contingency table (cross-tab) analysis are reliable. According to the results of the Pearson χ2 test (χ2=6,521 and Sig=0,038) we experienced a general, significant association between pharmacies' SO and the degree of PEU by pharmacy managers in the HPRDS. Beside the significant association we can also detect certain patterns in the connection between the prevalence of particular M&S’s SOs and PEU, based on the values of Adjusted Residuals. Unsurprisingly, emergence of Analysers (Q6b) is more likely in the group of pharmacies perceiving lower environmental unpredictability (-2,6 vs. 2,6), while Defender/Reactors (Q6d) are more characteristic for the group of pharmacists perceiving high environmental uncertainity (1,4 vs. -1,4). Prospectors meanwhile may be found (Q6a) in groups characterised by both a low or a high PEU (1,1 vs. -1,1). Based on the values of Adjusted Residual indicators pharmacy managers following Analyser SO perceive lower (Q5c), while managers of Defender/Reactor pharmacies perceive higher environmental uncertainity in the changes of HPRDS (Q5d). Perception of Prospector pharmacies' managers is varied, even though their majority tend to describe environmental changes by high unpredictability (Q5a). Although based on the implications of our contingency table (cross-tab) analysis the possible answers to our research questions Q5 and Q6 start to take shape, but in order to explicitly compare the degree of PEU between pharmacy managers following either Prospector, Analyser or Defender/Reactor SOs, as well as to examine the prevalence of individual SOs within groups characterised by either high or low PEU, we had to progress to further mathematical-statistical methods. 33.3. The differences between strategic orientations regarding PEU We formulated our research question Q5 in order to test the implications of the „managerial choice” theory hallmarked by the name of John Child within the HPRDS. To clarify the results of the contingency table (cross-tab), we examined whether managers of pharmacies following either Prospector, Analyser or Defender/Reactor SOs perceive the changes of environmental stakeholders' behaviour and conditions to various degrees via analysis of variance (ANOVA) as well. We examined the general difference between SOs by an F-test (Q5), while for the paired differences of Prospectors, Analysers and Defender/Reactors we performed Scheffe, Tuckey and Bonferroni tests (Q5a and Q5d). According to ANOVA table (Table LXXIII) we found significant difference for PEU by pharmacists following Prospector, Analyser and Defender/Reactor SOs (F=5,205 and Sig=0,006) (Q5). It was primarily caused by the phenomenon that Analysers perceived changes of environmental conditions significantly more predictable than Prospectors and Defender/Reactors, amongst whom we did not observe any notable differences (Q5a, Q5d). Results of the Tuckey, Scheffe and Bonferroni tests used for testing the pairwise differences between SOs showed a notable „convergence” (Table LXXIV). In regard to PEU Analysers differ from both Prospectors and Defender/Reactors, and perceive the environment to be significantly more predictable. We did not identify significant difference between the perceptions of Prospectors and Defender/Reactors, for which reason we answered „yes” to our research question Q5a and „no” to Q5d. In order to satisfy the need for methodological completeness we also examined the differences regarding PEU between managers of pharmacies exhibiting different M&S strategic behavioural patterns by the application of SEM (Q5). In this context we quantified the effect
145
of Prospector, Analyser and Defender/Reactor SOs – oparationalised as latent constructs and confirmed during the discriminant validity tests – on pharmacy managers' PEU. We derived the complex latent construct of PEU from the original dimensions and operationalised it as a so-called second-order factor (Chen et al., 2005). We illustrated the measurement model in Figure XVIII, while the results can be found in Table LXXV. Fit indices of the structural model are: CMIN/df=1,871, RMSEA=0,055, CFI=0,912 and SRMR=0,0967. With exception of the SRMR indicator the gained values comply with the cut-off criteria determined by methodological literature (Bentler-Bonett, 1980). Prevalence of Prospector and Defender/Analyser SOs does not exert a significant effect on the degree of PEU by pharmacy managers. In accordance with our previous empirical experiences the degree of PEU by managers operating pharmacies following Prospector or Defender/Reactor SO shows no difference. In compliance with the theory prevalence of Analyser SO largely contributed to a decrease of pharmacy managers' PEU, therefore PEU of Analysers is significantly lower than the ones experienced in case of Prospectors and Defender/Reactors. Results of the more valid and reliable SEM examination did not change our earlier experiences either, thus our answers for research questions Q5a and Q5d were confirmed. 33.4. The differences between groups characterised by high and low perceived environmental uncertainty regarding the prevalence of M&S’s strategic orientations Contrary to the methodologies aiming at exploring the effect of SOs on PEU detailed in the previous subchapter, in the following analysis of variance we examined the determining influence of unpredictability perceived in the changes of environmental conditions and behaviour of sectoral stakeholders on pharmacies' SO. We hoped to answer our research question Q6 via an F-test, in which we tested the significance of differences experienced between groups characterised by either a low or a high PEU in regard to the prevalence of M&S’s SOs (Q6a, Q6c, Q6d). According to results of Table LXXVI we experienced no significant differences between the SOs of pharmacies led by managers perceiving the external environmental conditions of HPRDS as either uncertain or predictable (Q6). Based on our experiences prevalence of Defender/Reactor and Prospector SOs is contingency-independent (Q6d, Q6a), although prevalence of the Analyser SO was more probable in the group perceiving a low environmental uncertainity, yet even this difference only approximated significance (Q6c). Therefore we gave the answer of „no” to our research questions Q6, Q6a, Q6c and Q6d. Based on the comparison of the ANOVA and SEM examinations assisting in answering of our research questions Q5 and Q6 it seems that the conscious strategic choice of pharmacy managers exerted a stronger influence on the degree to which they perceive the development of turbulently changing environmental conditions, than the extent to which PEU had a determining influence on the selection and following of pharmacies' SO. The best methodological solution for answering our research question Q7 regarding the strength of the hypothesised causal relationships between M&S’s SOs pursued by pharmacies and PEU however was possibly the further application of structural equation modeling (SEM). 33.5. Interactions of strategic orientation and perceived environmental uncertainty To examine the interactions between SO and PEU we repeatedly operationalised them as second-order latent constructs. From a theoretical point of view we were able to do so for the

146
SO as well, because the Segev scale extracts the M&S’s SOs primarily only along the line of the adaptive cycle's first phase, i. e. the entrepreneurial problem. This means that it derives the Prospector, Analyser and Defender/Reactor SOs from an underlying latent construct, namely the „product/market domain” and its rate of change. By inspecting the standardised regression coefficients between the latent constructs of SO and PEU it can be revealed, whether the degree of perceiving sectoral changes as (un)predictable is determined by the conscious choice of pharmacy managers, or whether pharmacies' SO is rather determined by the degree of PEU by pharmacists. We present the SEM models examining the interactions between SO and PEU in Figures XIX and XX, with the former one quantifying SO's effect on PEU, and the latter one the influence of PEU on SO. According to the results of our structural model SO's exerted effect on PEU is β=0,174, based on which a SO consciously chosen and consistently followed by pharmacy managers had a significant influence on the perception of environmental changes and sectoral stakeholders' behaviour (sig=0,042). The fit indices are: CMIN/df=1,967 CFI=0,889, RMSEA=0,057 and SRMR=0,0987. With the exception of the SRMR indicator the obtained values can be accepted (Chen et al., 2009). After quantifying the effect of SO on PEU we demonstrated in our next SEM analysis the influence exerted by pharmacy managers' PEU on pharmacies' SO. According to our results the effect of pharmacy managers' PEU on SO amounts to β=0,043. This implies that perception of environmental conditions and sectoral stakeholders' behaviour had no significant effect (sig=0,650) on the SO of pharmacies. The model's fit indices are basically identical to those found previously: CMIN/df=1,970, CFI=0,882, RMSEA=0,058 and SRMR=0,1007. The received values – with the exception of SRMR indicator – are tolerable (Hu-Bentler, 1999). Based on our empirical experiences the effect of SOs followed by pharmacy managers on PEU does not fall behind the effects of pharmacy managers' PEU on SO. Even more so, a conscious choice of SO by pharmacists tends more to exert a significant effect on their perception of HPRDS' environmental conditions. Therefore we formulated a „no” answer for our research question Q7. According to the experiences of the correlation and contingency tables (cross-tab), ANOVA and SEM analyses in the HPRDS the SO followed by pharmacies is not a result of pharmacists' different perception of the turbulently changing environment, but on the contrary, the SO consciously chosen and consistently implemented by them had the most influence on the way they evaluate the behaviour of environmental stakeholders and changes of conditions. Thus in the sectoral context of our dissertation John Child's „managerial choice” theory mostly prevails over the contingency theory approach. In the next chapter of our thesis we summarised the answers given to our research questions Q1 to Q7 in Table LXXVII.
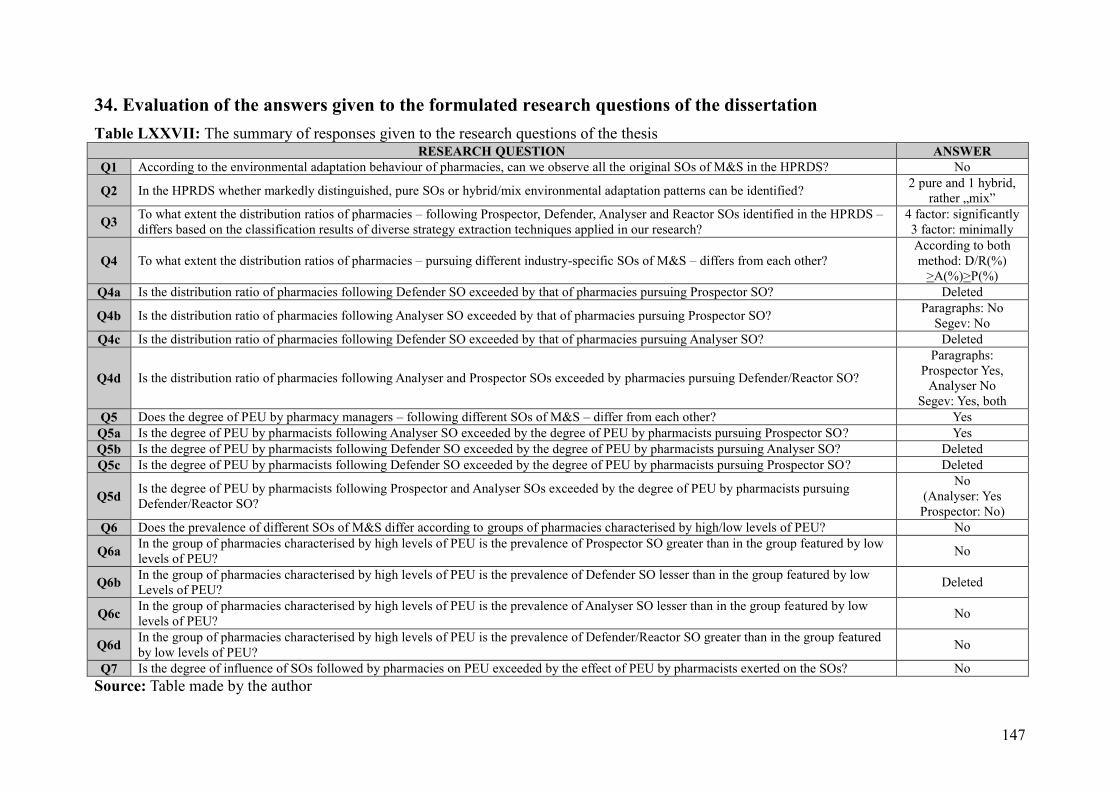
147
34. Evaluation of the answers given to the formulated research questions of the dissertation
Table LXXVII: The summary of responses given to the research questions of the thesis RESEARCH QUESTION ANSWER
Q1 According to the environmental adaptation behaviour of pharmacies, can we observe all the original SOs of M&S in the HPRDS? No
Q2 In the HPRDS whether markedly distinguished, pure SOs or hybrid/mix environmental adaptation patterns can be identified? 2 pure and 1 hybrid, rather „mix”
Q3 To what extent the distribution ratios of pharmacies – following Prospector, Defender, Analyser and Reactor SOs identified in the HPRDS – differs based on the classification results of diverse strategy extraction techniques applied in our research?
4 factor: significantly 3 factor: minimally
Q4 To what extent the distribution ratios of pharmacies – pursuing different industry-specific SOs of M&S – differs from each other? According to both method: D/R(%)
>A(%)>P(%) Q4a Is the distribution ratio of pharmacies following Defender SO exceeded by that of pharmacies pursuing Prospector SO? Deleted
Q4b Is the distribution ratio of pharmacies following Analyser SO exceeded by that of pharmacies pursuing Prospector SO? Paragraphs: No Segev: No
Q4c Is the distribution ratio of pharmacies following Defender SO exceeded by that of pharmacies pursuing Analyser SO? Deleted
Q4d Is the distribution ratio of pharmacies following Analyser and Prospector SOs exceeded by pharmacies pursuing Defender/Reactor SO?
Paragraphs: Prospector Yes,
Analyser No Segev: Yes, both
Q5 Does the degree of PEU by pharmacy managers – following different SOs of M&S – differ from each other? Yes Q5a Is the degree of PEU by pharmacists following Analyser SO exceeded by the degree of PEU by pharmacists pursuing Prospector SO? Yes Q5b Is the degree of PEU by pharmacists following Defender SO exceeded by the degree of PEU by pharmacists pursuing Analyser SO? Deleted Q5c Is the degree of PEU by pharmacists following Defender SO exceeded by the degree of PEU by pharmacists pursuing Prospector SO? Deleted
Q5d Is the degree of PEU by pharmacists following Prospector and Analyser SOs exceeded by the degree of PEU by pharmacists pursuing Defender/Reactor SO?
No (Analyser: Yes Prospector: No)
Q6 Does the prevalence of different SOs of M&S differ according to groups of pharmacies characterised by high/low levels of PEU? No
Q6a In the group of pharmacies characterised by high levels of PEU is the prevalence of Prospector SO greater than in the group featured by low levels of PEU? No
Q6b In the group of pharmacies characterised by high levels of PEU is the prevalence of Defender SO lesser than in the group featured by low Levels of PEU? Deleted
Q6c In the group of pharmacies characterised by high levels of PEU is the prevalence of Analyser SO lesser than in the group featured by low levels of PEU? No
Q6d In the group of pharmacies characterised by high levels of PEU is the prevalence of Defender/Reactor SO greater than in the group featured by low levels of PEU? No
Q7 Is the degree of influence of SOs followed by pharmacies on PEU exceeded by the effect of PEU by pharmacists exerted on the SOs? No Source: Table made by the author
148
35. Preliminary regression analyses for the exploration of the moderating effects of PEU and GL on the relationship between strategic orientation and business performance The main empirical research focus of our dissertation lies on the relationship between M&S’s SOs and BP of pharmacies. Based on our hypotheses formulated in Chapter 23 the degree of PEU and GL of pharmacies have a potential moderating effect on the stochastic relationship between Prospector, Analyser and Defender/Reactor SOs identified during the discriminant validity analyses and their effectiveness and profitability. Prior to structural models providing the backbone of our mathematical-statistical analyses we delivered the preliminary testing of our hypotheses H1-H6 regarding the complex interrelations between the SOs and BP by applying variables derived from the manifest scale items via so-called hierarchical interaction and multigroup moderated regression analyses. We approached the effect of SOs on SAL and NP of pharmacies step by step, by adding PEU and GL (moderators), as well as socio-demographic characteristics and the site attributes of any given pharmacy (control variables). We ran regressions for both dependent variables by first gradually, then collectively introducing the independent variables, i. e. integrating the specified main- and interaction effects and control variables by blocks. In regard of interpreting the results it is important to note that PEU scale was reverse-coded, meaning the value 1 stood for complete unpredictability, while 5 stood for complete predictability. We operationalised GL as a dichotomous variable (0=Urban and 1=Rural). The selection of socio-demographic and site control variables featured in the regressions was based on experience gathered from interviews with relevant stakeholders of the HPRDS and variables conventionally referred to in strategic literature. Into the SEM examinations detailed in later sections of our thesis we integrated only those, relevant control variables that showed significant correlation to the changes of BP (Table XCIV). We clarify the „refining” role of PEU and GL in the relationship of SO and BP and label the types of potential moderator variables in Chapter 42, where we evaluate regression analyses and SEM results together. 35.1. The correlation between strategic orientation, business performance, geographical location and perceived environmental uncertainty We begin the description of our results by reminding of the correlation table demonstrating the interrelations of independent and dependent variables included in the regression analyses (Table LXXI). Knowledge of the correlation matrix showcasing the direction, strength and significance of the covariance between explanatory and criterion variables is necessary for identifying the potential moderating effects and labeling the type of the moderator variable. When interpreting the results obtained after running the regressions, it is based on those correlation values that we will be able to decide whether the PEU by pharmacists and GL function as Pure, Quasi, Homologiser Moderators, or rather as Intervening, Antecedent, Exogenous, Suppressor, Independent factors in the relation of SO and BP. According to the guidelines of Sharma et al. (1981) this can only be judged on the basis of the significance of interaction effects, moreover by the significance of the potential moderating factor’s correlation values measured with independent (SO) and dependent (BP) variables. It is apparent that the PEU by pharmacy managers only showed significant correlation with the Analyser SO. According to this the strong prevalence of the Analyser SO changes in parallel with the reduction of the degree of PEU, which is consistent with the theoretical

149
implications of M&S. PEU showed no interaction neither with SAL nor with NP of pharmacies. However, the prevalence of Defender/Reactor and Prospector SOs showed significant interaction with the GL of pharmacies. Besides, GL also showed covariance with pharmacies' BP to some degree – in case of rural pharmacies SAL significantly, while NP was slightly surpassed by that of their urban counterparts. After exploring the interrelations of PEU and GL with M&S’s SOs and BP we performed hierarchical interaction and multigroup moderated regressions in order to clarify the effect of moderating variables and to label their types. We began our analyses by specifying the moderating effect of PEU, then continued to examine the role of GL. 35.2. The moderating effect of PEU in the relationship of strategic orientation and sales Table LXXVIII illustrates the results of the hierarchical interaction regression analysis examining the potential moderating role of PEU in the stochastic relationship of SOs and pharmacies’ SAL (H3). The main effects derived from the SOs show that Prospectors had a significant positive, and the Defenders/Reactors a significant negative influence on the development of SAL, while the Analyser SO produced no substantial contribution to BP (H1a, H1d). PEU, as an independent variable expressing the main effect – in consistency with the correlation matrix – showed no significant contribution to the SAL of pharmacies during any stage of the regression model. By integrating PEU we examined whether beyond SOs it can contribute substantially to the explanation of changes occuring in SAL, and also whether it is capable of sheding light on a more „nuanced” interpretation between SO and market effectiveness (H3). The interaction effects of SO and PEU did not prove to be significant during any stage of the regression model (H3a, H3b, H3d). This lead us to the preliminary conclusion that the degree of PEU by pharmacists does not influence the effect of SOs on BP. During the 3. stage of hierarchical regression we included socio-demographic characteristics as control variables. We were eager to study whether the influence of SOs on SAL kept their significance even after the effect of control variables had been filtered (H9a), and also which variables identified in the interviews with representatives of HPRDS would be able to additionally explain SAL of pharmacies in a significant way, if any. GL and number of employees shows a significant, while the pharmacy's total area of space shows a slight connection with the development of SAL. The main effect of SOs on SAL remained significant during the model's 3. stage too. Prospector SO exerted a positive effect, Defender/Reactor SO a negative one on SAL, while Analyser SO had no significant influence (H1a, H1d). That is, the influence of main effects remained robust even after the effects of socio-demographic characteristics included as control variables were filtered (H9a). The same can be ascertained about the insignificance of interaction effects of SOs and PEU. During the 4. stage of regression analysis we integrated pharmacies' site characteristics. To our surprise none of the site attributes proved to be significant in regards to SAL. Prospector, Analyser and Defender/Reactor SOs' main effects remained unchanged, and so did the insignificant interaction effects of SOs and PEU (H9a). Results found in the rightmost column (Sig. R2 Change) of Table LXXIX, demonstrating the explanatory power of models introduced during various stages of hierarchical moderation,

150
verify that the main effects of Prospector, Analyser and Defender/Reactor SOs are able to explain significantly, at 16,5% the proportion of variance encountered in SAL of pharmacies (R2=0,165). During the 2. stage of regression analysis the interaction effects of PEU and the SOs did not contribute substantially to the changes in SAL compared to the main effects (Sig. R2 Change=0,511). The model's explanatory power increased from the 1st stage's 16,5% to merely 17,6% (R2=0,176). Socio-demographic characteristics integrated during the 3. stage of hierarchical interaction moderation however increased the regression model's explanatory power in a significant way (Sig. R2 Change=0,000). By introducing these control variables the model's explanatory power regarding the development of pharmacies' SAL improved vastly (R2=0,467). During the 4. stage of regression analysis, adding site attributes of pharmacies did not contribute significantly to changes in market effectiveness (Sig. R2 Change=0,669). The model containing main and interaction effects, as well as socio-demographic and site characteristics were able to explain 48% of the variance in pharmacies’ SAL. Based on the results gained from regression models regarding SAL, the nature of strategic and environmental main and interaction effects did not change substantially even after filtering the effects of socio-demographic and site characteristics. In order to provide a more grounded basis for the insignificant moderating effect of PEU – as uncovered in the relationship between SO and SAL – we applied further preliminary mathematical-statistical methods (H3). We ran our regression model directed at examining the connection between SO and SAL within the groups of pharmacies characterised by low and high PEU. Performing multigroup regression analysis we examined to what degree the experiences of hierarchical interaction moderations can be confirmed. As Table LXXX shows, the prevalence of Prospector SO – confirming the experiences gathered from the hierarchical interaction regression – generated a significantly positive effect on the development of SAL within context of low and high PEU equally (H1a, H3a). Following an Analyser SO – again, reinforcing our previous experiences – also exerted an insignificant influence on changes in SAL, regardless of the degree of PEU (H3b). The sole difference was encountered in case of Defender/Reactors, according to which following a similar SO only eroded the SAL of pharmacies significantly amongst pharmacy managers that could be described by low levels of PEU (H3d). According to Table LXXXI, illustrating the explanatory power of multigroup regression, both of our models contributed in a significant way to predicting SAL. Based on it M&S’s SOs managed to explain 24,4% of proportion of variance found within SAL of pharmacies in a context characterised by high PEU and 19,3% of low PEU environments. The results of our multigroup moderated regression analysis seemingly also confirms that PEU in fact does not moderate the relationship of SO and SAL in a substantial manner (H3). After examining the effect of pharmacy managers' PEU on the interrelation between SO and SAL, we turned our attention towards uncovering the role of PEU regarding the relationship between SO and NP. 35.3. The moderating effect of PEU on the relationship between SO and net profit After expounding the connection between M&S’s SOs and SAL, we moved on to examine the potential moderating effect of PEU on the relationship between Prospector, Analyser and Defender/Reactor SOs and the NP of pharmacies (H4). Experiences gathered from our hierarchical interaction regression analysis regarding profitability can be found in Table

151
LXXXII. Upon taking a closer look at the main effects of SOs, then – based on the 1. stage of regression analysis – it is safe to announce that neither the prevalence of Prospector, nor that of Defender/Reactor, nor even Analyser SO did provide any significant effect on the development of pharmacies' NP (H2c, H2d). The main effect of PEU did not show a significant relationship to the changes of NP during any stage of the regression model. Applying the 2. model we examined whether the degree of PEU by pharmacy managers is able to contribute to the explanation of NP beyond SOs, and also whether it could illuminate changes in the relationship between SOs and profitability in a more „chiselled” way. The interaction effects of SOs and PEU on profitability turned out to be non-significant in case of Prospectors, Analysers or Defenders/Reactors, too (H4a, H4b, H4d). The same can be observed in the model's 3. and 4. stages: PEU's formerly hypothesised moderating effect regarding the relationship of SO and NP showed far from significant. Seeing as how neither main effects of SOs, nor interaction effects of PEU and SOs exerted any significant influence on NP, we had to redefine the role of socio-demographic and site characteristics integrated in stages 3 and 4. We could not handle it as a priority anymore to examine whether main and interaction effects remained the same after filtering the effect of those control variables, as they were not significant to start with (H9b). Thus upon including control variables we only tried to identify additional factors potentially explaining NP. As for socio-demographic variables, the total area of space of pharmacies showed a strong, while the number of employees produced a slightly positive interrelation with the development of NP. Contrary to our expectations based upon interviews with sectoral stakeholders, GL of pharmacies did not exert any substantial influence on changes in profitability, i. e. we could not register any significant differences between NP of urban and rural pharmacies. Regarding site characteristics only the proximity of the pharmacy to malls, shops and other retail spots managed to approach any significance. Based on the results found in the rightmost column (Sig. R2 Change) of Table LXXXIII, quantifying the explanatory power of the regression model, not even the main effects of the SOs are fit to contribute to NP of pharmacies in a significant way (Sig. R2 Change=0,151) (H2). Prevalence of Prospector, Analyser and Defender/Reactor SOs could only explain 3,7% of the proportion of variance observed in NP of pharmacies (R2=0,037). Interaction effects of PEU and SOs did not provide any additional explanatory power beyond the main effects. Their contribution to the changes of NP are minimal (Sig. R2 Change=0,619). Upon introducing interaction effects, the explanatory power of 2. stage's regression model „jumped” from the 1. stage's estimation of 3,7% to 4,7% (R2=0,047). The socio-demographic variables integrated during the 3. stage of hierarchical moderation significantly increased the explanatory power of the regression model (Sig. R2 Change =0,002). The inclusion of control variables largely contributed to the NP of pharmacies, thus the estimations of the model, cumulated with strategic main effects and the interaction effects with PEU are able to explain 16,9% of the variance in profitability of pharmacies (R2=0,169). Integrating site characteristics did not contribute significantly to changes of NP (Sig. R2 Change=0,249). The sole variable – labelled as „proximity of retail units (e.g. shopping malls, hypermarkets, shops etc.)” – showing some significant connection „boosted” the model with
152
another 4% of explanatory power. The regression model integrating main and interaction effects, as well as control variables expressing socio-demographic and site characteristics managed to explain the variance in NP (R2=0,208) at a percentage of 20,8%. To confirm the insignificant moderating effects of PEU discovered in the relationship between SO and NP we ran our regression repeatedly for the groups of pharmacies characterised by low and high PEU. Based on Table LXXXIV, which summarises the experiences of multigroup regression, the influence of Prospector, Analyser and Defender/Reactor SOs on profitability can be explicitly compared. We can ascertain that regardless of the degree of PEU by pharmacist’ the effect of Prospector, Analyser and Defender/Reactor SOs was still insignificant (H2c, H2d), meaning that PEU played no moderating role (H4). However, similar to the experiences from multigroup regression ran for SAL, the effect of the Defender/Reactor SO on profitability showed near significant differences between contexts characterised by low and high degrees of PEU. According to Table LXXXV the explanatory power of regression model applied for the extimation of SOs’ effect on profitability proved to be significant within the group of pharmacy managers perceiving high degrees of environmental uncertainty, where it explained 12% of the variance in NP. Yet in a context characterised by low PEU the prevalence of M&S’s SOs could only explain a vanishing 1% of the proportion of variance in pharmacies' NP, still the slightly substantial difference between the two contexts did not prove sufficient to change the effect of respective SOs of M&S on NP. Based on our preminilary regression results we can state that PEU seemingly does not moderate the relationship between SO and NP (H4). After examining the moderating effect of PEU by pharmacists we turned our attention to reveal the potential moderating role of GL in the relationship between SO and BP. 35.4. The moderating effect of GL on the relationship between SO and sales To ground the SEM analyses that provided the methodological pillar of our dissertation we also performed hierarchical interaction and multigroup moderated regressions for the identification of GL's potential moderating function (H5 & H6). Tables LXXXVI and LXXXVII quantify the influence of GL on the relationship between SOs and SAL based on the experiences of interaction moderation (H5). Referring to the SOs' main effects depicted in Table LXXXVI it can be discerned that the prevalence of Prospector SO has exerted a significant positive, and that of Defender/Reactor SO a significant negative influence on the development of sales, while Analyser SO did not show a relevant contribution to SAL (H1a, H1d). The main effect of GL also exerted a significant influence on market effectiveness, as rural pharmacies' SAL tended to fall below the turnover of their urban counterparts. According to Table LXXXVII the model containing the main effects contributed significantly to the explanation of SAL (Sig. R2 change=0,000), and the model set up in the 1. stage of hierarchical regression analysis explained the proportion of variance of SAL to an extent of 23,5% (R2=0,235). Contrary to our expectations the interaction effects of SOs and GL turned out to be insignificant (H5a, H5c, H5d). According to our results GL did not exert a moderating effect on the stochastic relationship between SO and pharmacies' SAL during any stage of hierarchical moderated regression analysis (Table LXXXVI) (H5). The model integrating the interaction effects derived from the product of Defender/Reactor, Prospector, as well as
153
Analyser SOs and GL did not contribute substantially to the development of pharmacies' SAL (Sig. R2 change=0,728), and was able to explain 24,1% of proportion of variance in SAL (R2=0,241), which, compared to main effects, is a diminutive increase (Table LXXXVII). The socio-demographic variables integrated in the 3. stage of regression produced a notable effect on the development of SAL. The model including main and interaction effects, as well as control variables explained 46,3% of pharmacies' SAL (R2=0,463), which means a significant increase (Sig. R2 change=0,000) (Table LXXXVII). Number of employees showed strong correlation with SAL, while total area of space proved to be close to positively significant. It is important to note that main effects of Defender/Reactor and Prospector SOs remained significant even after integrating control variables, i. e. their effect on SAL was not „repressed” by the effect of socio-demographic variables (Table LXXXVI) (H9a). The explanatory power of the model introduced during the 4. stage of hierarchical regression did not improve significantly (Sig. R2 change=0,708), as site characteristics of pharmacies did not exert a relevant, additional influence on the development of SAL. The main effect of Prospector SO however turned out to be insignificant (H9a), which was possibly caused by the fact that close vicinity of healthcare institutions and retail units exerted an insignificant, yet relatively strong effect on market effectiveness (Table LXXXVI). According to Table LXXXVII the regression model including main and interaction effects of SOs and GL, as well as the socio-demographic and site characteristics was able to explain 47,6% of proportion of variance (R2=0,476) in SAL. Based on the results stemming from hierarchical interaction regression analysis GL of pharmacies did not moderate the relationship between SO and SAL. This result is quite surprising, as one would logically assume from a theoretical and industry-specific perspective as well, that the effect of a given SO's prevalence on SAL would differ for urban pharmacies characterised by favorable demand conditions as compared to rural ones characterised by less favorable factors for operation. Thus we ran the regression model established for the relationship of SO and SAL within the subsamples of urban and rural pharmacies as well, the results of which can be discerned from Tables LXXXVIII and LXXXIX. From the results of multigroup regression it appears to be evident that – contrary to the experiences obtained from the earlier hierarchical interaction regression analysis – GL produces a significantly moderating effect on the relationship between SO and SAL (H5). As seen in Table LXXXXVIII, the negative effect of Defender/Reactor SO on market effectiveness is not significant in case of urban environment, yet managed to strongly erode the SAL of pharmacies on rural sites (H5d). Prevelance of Analyser SO did not cause any notable decrease in SAL on urban sites, while it strongly deflated the turnover of rural pharmacies following similar SOs (H5c). Prospector SO produced a significant positive influence on SAL at both urban and rural sites, but it is worth to mention that beneficiary effects of its prevelance appeared to be stronger in rural context (H5a). Results shown in Table LXXXIX confirm that the prevelance of M&S’s SOs in both urban and rural environments contributed significantly to the explanation of pharmacies' SAL. The model explained the proportion of variance found for urban pharmacies' SAL to an extent of 13,1%, and 34% of rural ones. To summarise, interaction and multigroup moderations produced different results in respect of GL's moderating effect. Based on the former, GL did not moderate the development of the relationship between SO and SAL, while according to the latter it did. We will pay stressed attention to the confirmation of these mixed results during

154
the following SEM analyses. 35.5. The potential moderating effect of geographical location on the relationship between strategic orientation and net profit After examining SAL we explored the potential moderating effect of pharmacies' GL on the relationship between M&S’s SOs and NP. We performed the preliminary testing of H6 again via hierarchical interaction and multigroup moderated regressions. Tables XC and XCI show the results of the hierarchical interaction moderation. As seen in Table XC, neither Prospector, Defender/Reactor, nor Analyser SOs' prevelance exerted a significant effect on NP (H2c, H2d). GL's main effect on profitability of pharmacies also only approximated significance. According to this, rural pharmacies' NP fell slightly, yet not significantly behind profitability of urban ones. Table XCI shows that the model including main effects did not contribute in a significant way to the estimation of pharmacies' profitability (Sig. R2 change=0,09), as it only explained the proportion of variance of pharmacies' NP to an extent of 4,4 (R2=0,044). Interaction effects of M&S’s SOs and GL were insignificant in all stages of hierarchical regression (H6a, H6c, H6d). According to our results GL did not exert a moderating effect on the relationship of Prospector, Analyser, Defender/Reactor SOs and pharmacies' NP (Table XC) (H6). The model enhanced with interaction effects of SOs and GL did not contribute to the development of profitability in a significant way (Sig. R2 change=0,633), and was able to explain only 5,4% of the proportion of variance in NP of pharmacies (R2=0,054) (Table XCI). The socio-demographic variables integrated during the 3. stage of regression analysis had a notable effect on profitability of pharmacies. As depicted in Table XC, the model including main and interaction effects, as well as control variables succeeded in explaining 15,1% of the variance in pharmacies' NP (R2=0,151), which means a significant increase (Sig. R2 change=0,002). Number of employees and total area of space showed a significant positive correlation with changes in NP. While main and interaction effects remained insignificant (H9b), it is important to emphasise that after introducing control variables the effect of socio-demographic factors suppressed the influence of GL on profitability (Table XCI). The explanatory power of the model established in the 4. stage of hierarchical regression did not improve after integrating control variables regarding site attributes (Sig. R2 change=0,339), and as seen in Tables XC and XCI these variables did not have a substantial influence on the development of pharmacies' profitability. By including site characteristics, beyond main and interaction effects the influence of the number of employees also proved to be insignificant (H9b). The regression model containing the main and interaction effects of SOs and GL, as well as socio-demographic and site attributes explain 18,6% of NP's proportion of variance (R2=0,186). Hierarchical interaction regression showed that pharmacies' GL did not moderate the relationship between SO and NP. Based on our former industry-related experiences this is not very surprising, as contrary to the changes in SAL, organising the costs of operations of a pharmacy is less dependent on GL, than it is upon the pharmacists’ management competences. This seems to be backed by the fact that according to industry reports several needs of developments and stock financing of urban pharmacies were funded by irresponsible loans during the period of 2006 to 2011 (Bodrogi et al., 2010). We performed yet another

155
multigroup regression to explicitly compare the effect of SO on profitability of urban and rural pharmacies. Tables XCII and XCIII summarise our gathered experiences. Multigroup regression shows that GL of pharmacies still moderates the relationship between SO and NP. No prevelance of any M&S’s SO contributed to the development of pharmacies' profitability in urban environments. Contrary to this Defender/Reactor SO significantly worsened (H6d), while Prospector SO significantly improved the NP for rural pharmacies (H6a). In rural context the negative effect of Analyser SO on profitability approximated, yet in fact did not reach the level of significance. As seen in Table XCIII, the regression model established for estimating changes within urban pharmacies' profitability did not contribute notably to the development of NP (Sig. R2 change=0,911), the main effects of SOs managed to explain only 0,5% of profitability (R2=0,005). In the case of rural pharmacies however main effects of SOs contributed substantially to the changes in profitability (Sig. R2 change=0,003), the significant regression model succeeded in explaining 15,5% of the proportion of variance experienced in NP of pharmacies (R2=0,155). Summarising the results it is fair to state that interaction and multigroup moderations had different implications on the potential moderating effect of GL yet again. According to the former GL does not, while according to the latter it indeed does moderate the relationship between SO and profitability. Confirming or refuting our mixed results falls to the SEM analyses of Chapter 38, in which M&S’s SOs are operationalised as latent constructs. 35.6. Control variables: Methodological implications of regressions for SEM models Based on experiences from regressions regarding SAL and NP, the nature of main and interaction influences did not change radically by filtering the socio-demographic and site characteristics of pharmacies. Despite of this fact during the SEM analyses detailed in the following chapters of the thesis we still quantified the effect of only those control variables that showed significant correlation with pharmacies' SAL and NP (Figures XXXIII-XXXIV). In order to preserve methodological purity we also did not include control variables related insignificantly to BP in cases whenever representatives of HPRDS showed a pronounced interest in them. Table XCIV illustrates the correlations between control variables and BP indicators prominent in our PhD research. The same table shows that SAL of pharmacies were influenced by most control variables, except for the following three: close vicinity of shopping centers, location within shopping malls, and equity-based cooperation. However, a multitude of variables did not show any significant correlation with NP. These were: drugstores, close vicinity of gas stations and competitor pharmacies, location within shopping malls, ownership structure, membership in equity- and relationship-based cooperations. According to guidelines of methodological literature in case of clear and interpretable structural models researchers must aspire to reasonably reduce the number of control variables (Hair et al., 2012). For this reason we narrowed the circle of control variables significantly correlating with BP before integrating them into our SEM models. Based on the unanimous opinion of the interviewed industrial experts, the number of employees is a consequence, rather than a determining factor of pharmacies' BP, thus it was not included as a control variable. The distinction between pharmacies' total area of space and that of the

156
officina was deemed as redundant by the interviewed pharmacists after data collection, therefore the total area of space variable – showing a higher a correlation with BP – was included into the SEM models. 36. The relationship between strategic orientations and business performance After running the regression analyses we tried to confirm our preliminary results for the development of the stochastic relationship between M&S’s SOs and pharmacies' BP via SEM examinations, in which we operationalised SOs as latent constructs. We started our analysis with exploring the relationship between the prevalence of Propspector, Analyser and Defender/Reactor SOs as well as SAL and NP of pharmacies, i. e. testing our hypotheses H1 and H2. We present our structural models regarding the relationship of SO and BP, as well as the potential moderating effect of the degree of PEU by pharmacy managers and pharmacies' GL in Figures XXI to XXXIV, which accompany Chapters 36 to 40, while our experiences are gathered in tabular form. Interpretation of results, as well as comparisons of experiences stemming from regression and SEM analyses can be found at the end of each chapter. 36.1. The relationship between strategic orientations and sales of pharmacies After running the structural model outlined in Figure XXI, Table XCV shows the effects exerted by Prospector, Analyser, and Defender/Reactor SOs forming latent constructs on the development of SAL of Hungarian public pharmacies (H1). It can be stated that Prospector SO had a significant positive, while Defender/Reactor SO a significant negative effect on changes in SAL. Prevalence of Analyser SO showed no significant connection with the development of SAL. The results of testing our hypothesis H1 confirm those of our earlier regression analyses, i. e. there is a difference between SAL of pharmacies following either Prospector, Analyser or Defender/Reactor SOs (H1), with that of Prospectors being the highest (H1a), Defender/Reactor's being the lowest (H1d), and Analyser's pending in the wide range between the two. The results of SEM also illuminated that 22% of proportion of variance experienced in SAL of pharmacies can be explained by the prevalence of M&S’s SOs (R2=0,22). Based on the results of earlier research in strategic management this rate is perfectly acceptable (Cool-Schendel, 1988, Ketchen et al., 1997, Shook et al., 2004). The fit indices of the structural model exhibiting the development of the relationship between Prospector, Analyser, Defender/Reactor SOs and SAL are the following: CMIN/df=544/357=1,524, CFI=0,936, RMSEA=0,05 and SRMR=0,0906. With the exception of the SRMR indicator these values comply with the criteria of methodological literature (Hu-Bentler, 1999). The difference in SAL of pharmacies following different M&S’s SOs are also confirmed by the results of Table XCVI (ANOVA) and of the post-hoc Scheffe, Tukey and Bonferroni tests, which perform a pairwise comparison of SAL exhibited by each SO (Table XCVII). Thus it was verified that within HPRDS the highest SAL are realised by Prospectors, followed by Analysers, while Defender/Reactors produce the lowest turnover. With the exception of of the Bonferroni test's results regarding the difference between Defender/Reactors and Analysers, pairwise comparisions also showed significant discrepancies between the SAL of SOs. Concludingly, we were able to accept our hypotheses H1, H1a and H1d.

157
36.2. The realationship between strategic orientations and net profit After expounding the effect of SOs on SAL we also examined the effect exerted by Prospector, Analyser and Defender/Reactor SOs on pharmacies' NP to test our hypothesis H2 (Figure XXII). According to the estimated parameters depicted in Table XCVIII neither the Prospector, nor the Analyser, nor the Defender/Reactor SO showed a significant influence on pharmacies' NP (H2). Prospector SO's prevalence contributed most to NP (H2a), while that of Defender/Reactor SO the least (H2d). Prevalence of the Analyser SO showed no connection with the profitability of pharmacies (H2c). All in all, M&S’s SOs explained only 3% of NP's variance (R2=0,03). Fit indices of the SEM exhibiting the development of the relationship between Prospector, Analyser, Defender/Reactor SOs and NP are the following: CMIN/df=586/359=1,633, CFI=0,922, RMSEA=0,055 and SRMR=0,093. Based on this it can be stated that with exception of SRMR indicator the values comply with the threshold criteria of mathematical-statistical literature (Baumgartner-Homburg, 1996). The convergence of NP of pharmacies following varying M&S’s SOs is confirmed by both the ANOVA table and the results of the post-hoc Scheffe, Tukey and Bonferroni tests, which perform a pairwise comparision of Prospector, Analyser and Defender/Reactor SOs' profitability (Tables XCIX and C). Although based on these results it can be stated that within HPRDS the highest NP is realised by Prospectors, followed by Analysers, while Defender/Reactors produce the lowest profitability, the differences however did not prove significant. The Tukey, Scheffe and Bonferroni tests did not show significant discrepancies in any relation, so we rejected our hypotheses H2, H2a and H2d. 37. The potential moderating effect of perceived environmental uncertainty on the relationship between strategic orientations and business performance In our hypotheses H3 and H4 we focused on the potential moderating effect of PEU by pharmacists on the relationship between M&S’s SOs and BP of pharmacies. Based on our presumption pharmacists' subjective perception regarding the degree of uncertainity of changes occuring in an environment characterised by limited competitive intensity and bureaucratic coordination mechanisms would notably influence the nature of the relationship of SO as well as SAL and NP. We tested our hypotheses via SEM, more precisely by applying the two different methodological approaches of multigroup and interaction moderations. 37.1. The moderating effect of PEU on the relationship of strategic orientation and sales To test our hypothesis H3 we first examined the potential moderating effect of the degree of PEU by pharmacy managers on the relationship between M&S’s SOs and SAL of pharmacies via multigroup moderation (Figure XXIII). The results are showcased in Table CI. As seen, the the degree of PEU by pharmacists had a minimal moderating effect on the relationship between M&S’s SOs and SAL. Prospector SO exerted a positive significant effect on turnover of pharmacies regardless of the degree of PEU (H3a). Analyser SO did not influence the development of SAL in case of pharmacies ran by managers perceiving either low or high environmental uncertainity, although its negative effect on turnover is not negligible in case of high PEU (H3b). Although the Defender/Reactor SO did not decrease the

158
SAL notably in a context characterised by high PEU, its prevalence did however exert a significant negative effect on pharmacies' SAL in case of lower degrees of PEU (H3d). The difference (Δχ2=24,7 és Δdf=29) between the original „Unconstrained” (χ2=1696,7 and df=800) model, allowing free movement of parameters and the „Constrained” (χ2=1721 and df=829) model, assuming the equality of the standardised regression coefficients did not prove to be significant (H3), as the critical value (0,95 and 29)=42,6 is greater than the empirical one (24,7). According to the results of „path by path” analyses we witnessed a discrepancy only in case of the standardised regression coefficients between the Defender/Reactor SO and SAL, while the nature of the relationship between Prospectors or Analysers and SAL did not change. The fit indices of the structural model demonstrating the development of the relationship between SOs and SAL in respect of PEU are: CMIN/df=1086/692=1,57, CFI=0,874, RMSEA=0,053 and SRMR=0,1034. The value of the χ2 test measuring general fit, as well as the value of the RMSEA indicator quantifying differences between the estimated and empirical models based on examination of standardised residuals comply with the methodological threshold criteria (Shook et al., 2004). The value of CFI indicator, although with reservation, can be tolerated, while SRMR indicator falls short of the recommended threshold value of 0,08 (Byrne, 2001). According to our results 26% (R2=0,26) of variance of SAL found for pharmacies with a high PEU can be explained by the prevalence of M&S’s SOs, while in case of pharmacies characterised by lowPEU it is 21% (R2=0,21). To further test our hypothesis H3 pertaining to the potential moderating effect of PEU on the relationship between SOs and SAL of pharmacies we applied interaction moderation in our next examination (Figure XXIV). Based on the examination of main and interaction effects presented in Table CII, prevalence of Prospector SO exerted a significant positive effect on pharmacies' SAL, which was not even influenced notably by the degree of PEU by pharmacy managers (H3a). Defender/Reactor SO, having a substantial negative effect on SAL significantly eroded pharmacies' turnover, even in cases when the degree of PEU by pharmacy managers decreased (H3d). Analyser SO had no influence on SAL either by itself or in interaction with PEU (H3b). We found that PEU also showed no direct connection to changes in pharmacies' SAL. According to our SEM results main and interaction effects of PEU and SOs managed to explain 25% (R2=0,25) of the variance experienced in pharmacies' SAL, which is a slight increase compared to the 22% explained by the three SOs as discussed earlier in Chapter 36. 37.2. Evaluating the role of PEU in the relationship of strategic orientation and sales The regression and SEM analyses showed that PEU had no significant influence on the development of the relationship between Prospector or Analyser SOs and SAL of pharmacies, hence we rejected our hypotheses H3a and H3b. In contrary to regression analyses the reduction in the degree of pharmacy manager's PEU significantly lessened the SAL of Defender/Reactor pharmacies according to both multigroup and intaraction moderation SEM examinations (H3d). This means a moderation counteractive to that formulated in our presumption, which led us to also reject our hypothesis H3d, as it was the decrease (and not the increase) of PEU that contributed to the lessening of Defender/Reactor pharmacies' SAL. 37.3. The moderating effect of PEU on the relationship between SO and NP

159
In our hypothesis H4 we forecasted that the degree of PEU by of pharmacy managers would influence the relationship between SO and NP. To test H4 we first examined the moderating effect of PEU via multigroup moderation (Figure XXV.). As seen in Table CIII the degree of PEU by pharmacists did not influence the development of the relationship between SOs and NP (H4). Although it can be vaguely discerned that in case of a high PEU context Prospector SO had a positive (H4a), while Defender/Reactor (H4d) and Analyser (H4c) SOs had a negative influence on NP, those relations are not significant. In case of low PEU the positive effect of Prospector SO disappears, while the negative effect of Defender/Reactor and the Analyser SOs decreases. The difference of the „Unconstrained” (χ2=1720 and df=800) and the „Constrained” (χ2=1746,2 and df=829) models is not significant (H4), as the critical value (0,95 and 29) =42,6 is greater than the empirical one (26,2). According to „path by path” analyses we found a difference only for the standardised regression coefficients of Defender/Reactor SO and NP. The fit indices are: CMIN/df=1175/720=1,632, CFI=0,854, RMSEA=0,056 and SRMR=0,1066. The results of the χ2 test and the RMSEA indicator comply with the threshold criteria of mathematical-statistical literature (Hu-Bentler, 1999). The value of CFI can be tolerated with reservation, but SRMR falls short of the recommended value of 0,08. According to our results 14% (R2=0,14) of the variance experienced in the profitability of pharmacies characterised by high PEU can be explained with the prevalence of M&S’s SOs, while in case of a low PEU context this amounts only to 1% (R2=0,01), yet still these vast discrepancies are not sufficient to mark the difference of the two models to be significant. To further test H4 we examined the moderating effect of PEU also via interaction moderation besides multigroup moderation (Figure XXVI). Results of Table CIV confirm that in regard of the relationship between SO and NP we indeed found no difference between groups characterised by either high or low PEU. It is evident that the relationship between SOs and profitability of pharmacies was not significantly influenced by the degree of PEU by pharmacists (H4). Neither main (SOs), nor interaction effects (PEU*SOs) exerted a significant effect on NP of Prospectors, Analysers and Defender/Reactors (H4a, H4c, H4d). According to our structural model main and interaction effects of PEU and SOs explained 3% (R2=0,03) of the variance in pharmacies' profitability. 37.4. Evaluating the moderating effect of PEU in the relationship of SO and net profit PEU did not exert an influence on the development of the relationship between Prospector SO and NP of pharmacies (H4a). For this reason we rejected our hypothesis H4a. According to both regressions and multigroup and interaction moderations (SEM) the development of the degree of PEU by pharmacists did not have a significant influence on the relationship of Analyser SO and pharmacies' profitability (H4b). Therefore we did not accept our hypothesis H4b, either. Interaction between Defender/Reactor SO and PEU proved also to be insignificant (H4d). The negative effect of its prevalence on NP approached significance only for pharmacists characterised by high PEU in case of running multigroup moderation. Thus we also rejected our hypothesis H4d. 38. The potential moderating effect of geographical location on the relationship between strategic orientation and business performance of pharmacies
160
While inspecting the influence of SOs on the BP of pharmacies, we also greatly emphasised the potential moderating effect of GL. In our hypotheses H5 and H6 we presumed the nature of the relationship between SO as well as market effictiveness and financial profitability changes between the groups of pharmacies operating in urban and rural contexts. We tested our hypotheses by performing both multigroup and intaraction moderations (SEM). We began our examination by uncovering the effects influencing the development of sales (H5). 38.1. The moderating effect of GL on the relationship between SO and sales To explore the potential moderating effect of GL on the relationship between SO and SAL we first performed an interaction moderation (Figure XXVII). Results can be discerned from Table CV. As seen, GL played no moderating role in the relationship between SO and sales (H5). The interaction effects derived from the product terms of Prospector, Analyser and Defender/Reactor SOs and GL exerted an insignificant influence on the development of SAL in all three cases (H5a, H5c, H5d). At the same time the main effects of Prospector and Defender/Reactor SOs and GL remained significant, the prevalence of Prospector SO strongly enhanced, while that of Defender/Reactor eroded SAL. Rural pharmacies' turnover is significantly lower than that of their urban counterparts. It has to be noted that the influence exerted on SAL by Prospector SO surpassed that of GL. The SEM quantifying main and interaction effects of SOs and GL explained 30,2% (R2=0,302) of the variance in SAL. Interaction moderation managed to confirm the experiences gathered from our earlier regression, namely that the moderating influences exerted by GL on pharmacies' SAL are insignifiant, if operationalised by interaction effects. However, we examined the potential moderating effect of GL on the relationship between M&S’s SOs and SAL of pharmacies also by applying multigroup moderation (SEM). Our choice was founded by the fact that multigroup regression analyses performed on groups of both urban and rural pharmacies showed a significant difference in the influence exerted on SAL by paricular SOs. We were eager to investigate, whether insignificant interaction effects discovered during the former interaction moderation change if we compare the SO's effect on turnover explicitly between the groups of urban and rural pharmacies (Figure XXVIII). As seen in Table CVI, contrary to the results of interaction moderation, the effect of SOs on SAL showed a significant difference between urban and rural pharmacies (H5). Within an urban environment only Prospector SO contributed significantly to the increase in SAL, although its effect can not be viewed as stronger than that experienced in rural environments (H5a). Effects of Defender/Reactor and Analyser SOs within cities did not prove to be significant, the negative influence of Analyser and Defender/Reactor SOs in the countryside however increases significantly (H5c, H5d). The difference (Δχ2=43,2 and Δdf=29) between the „Unconstrained” (χ2=1600,1 and df=800) and „Constrained” (χ2=1643,3 and df=829) structural models is significant (H5), as critical value (0,95 and 29) =42,6 is lower than the empirical 43,2. According to the „path by path” analyses this was predominantly caused by the discrepancies between standardised regression coefficients of Defenders/Reactors and Analysers, observed in urban and rural environments. Fit indices of our model demonstrating the relationship between SOs and SAL in regards to GL are: CMIN/df=1104/728=1,517, CFI=0,864, RMSEA=0,051 and SRMR=0,0971.

161
The value of the χ2 test measuring general fit and the RMSEA indicator, measuring the differences between data estimated by the model and the results observed via examining the standardised residuals comply with threshold criteria established by methodological literature (Bentler-Bonett, 1980). The value of the CFI indicator can be accepted with reservations, yet the SRMR indicator still falls short of the recommended threshold value of 0,08. Our structural model managed to explain only 14% (R2=0,14) of proportion of variance found for SAL of urban pharmacies by the prevalence of M&S’s SOs, but within rural context this amounted to as much as 31% (R2=0,31). 38.2. The evaluation of the moderating effect of geographical location on the relationship between strategic orientation and sales As it can be discerned from interaction regression and structural moderation (SEM), GL did not influence the relationship between the prevalence of Prospector, Analyser and Defender/Reactor SOs and SAL (H5). According to results of multigroup regression and SEM moderation the relationship between M&S’s SOs and SAL however largely depends on either urban or rural location of pharmacies (H5). Based on multigroup experiences the prevalence of Prospector SO had significant positive influence on turnover in both cities and the countryside, although its effect turned out to be stronger in rural context than in case of urban pharmacies (H5a). Thus we rejected our hypothesis H5a, as we registered the increase of Prospector SO's effect on SAL not in the cities, but in the countryside. Multigroup techniques brought to attention that the relationship between Analyser SO and pharmacies' SAL changes in respect to GL (H5). As opposed to our assumptions Analyser SO's negative effect on SAL did increase and gained significance not in the cities, but in the countryside. Based on this we did not accept our hypothesis H5c, either. According to multigroup results the negative relationship of Defender/Reactor SO and turnover varies depending on pharmacies' GL (H5d). Contrary to our expectations the negative relationship between Defender/Reactor SO and SAL increased significantly in the countryside, while it did not manage to significantly lessen turnover in cities characterised by favorable demand conditions. Therefore we rejected our hypothesis H5d. According to multigroup regressions and SEM moderations GL definitely moderates the connection between SO and sales, hence or hypothesis H5 was accepted. Yet in case of the single SOs we experienced results contradicting the assumptions of our hypotheses, for which reason we rejected hypotheses H5a, H5c and H5d. We examine the discrepancies of the multigroup and interaction moderations' results in the Discussion Chapter of our PhD thesis. 38.3. The moderating effect of GL on the relationship between SO and net profit To test our sixth hypothesis (H6), we first performed interaction moderation (SEM) to explore the moderating role of GL played in the relationship between SO and NP (Figure XXIX). As shown in the results of Table CVII, the relationship of SO and NP is independent from the GL of pharmacy (H6). According to experiences stemming from interaction moderation neither the main effects of Prospector, Analyser or Defender/Reactor SOs, nor the interaction effects derived from the product term of SOs and GL proved to be significant (H6a, H6c, H6d). The structural model established for the estimation of pharmacies' profitability could explain only 6,5% (R2=0,065) of NP's proportion of variance, which is no meaningful increase compared to the 3% explained by SOs. Hence it can be deemed probable that GL
162
does not moderate the relationship between SO and NP, which confirms the experiences of our interaction regression. However, we examined the potential moderating effect of GL on the relationship between M&S’s SOs and NP of pharmacies also via multigroup moderation (SEM) (Figure XXX). Our decision was based on the fact that regressions run for the groups of urban and rural pharmacies denoted significant differences between the effect of particular SOs on profitability. So we tried to reveal, whether the robust insignificant effects identified during interaction moderation change if we explicitly compare the effects of SOs on profitability between urban and rural pharmacies. As depicted in Table CVIII, the effect of SOs exerted on NP – contrary to experiences gathered from interaction moderation – produces significantly differing results depending on pharmacies' GL (H6). We found no difference between the profitabilities of Prospector, Defender/Reactor and Analyser SOs within cities. In case of rural pharmacies however we observed that Prospector SO had a significant positive (H6a), while Defender/Reactor (H6d) and Analyser SOs (H6c) had a significant negative impact on profitability. The difference (Δχ2=43,2 és Δdf=29) of „Unconstrained” (χ2=1632 and df=801) and „Constrained” (χ2=1675,2 and df=829) models is significant (H6), as the critical value (0,95 and 28) is lower than the empirical one (43,2). According to „path by path” analyses the effect of SOs on NP significantly differs between pharmacies run in both urban and rural environments for each Prospectors, Analysers and Defender/Reactors (H6a, H6c, H6d). The fit indices are as follows: CMIN/df=1109/722=1,537, CFI=0,869, RMSEA=0,052 and SRMR=0,0992. The value of the χ2 test, as well as those of the RMSEA indicator comply with the criteria of methodological literature. The value of CFI indicator is tolerable with reservations, but SRMR indicator falls short of the recommended threshold value of 0,08. According to multigroup moderation SOs were able to explain 21% (R2=0,21) of NP’s variance in rural environment, while in case of urban pharmacies the model's explanatory power amounted to only 1% (R2=0,01). 38.4. The evaluation of the moderating effect of geographical location on the relationship between strategic orientations and profitability Experiences gathered from regressions and SEM yet again resulted in contradictory results regarding the moderating effect of pharmacies' GL on the relationship of SO and NP. According to interaction regression and moderation (SEM) GL did not influence the relationship of Prospector, Analyser, Defender/Reactor SOs and profitability (H6). Yet results from multigroup regression and moderation (SEM) suggest that the development of relationship between M&S’s SOs and pharmacies’ NP largely depends on urban or rural location (H6). According to results from multigroup regression and structural moderation (SEM) the Prospector SO's positive effect on profitability significantly increased within rural environments (H6a). Therefore we accepted our hypothesis H6a. Based on multigroup methods the effect of Analyser SO on pharmacies' NP got stronger in rural context, and eroded profitability – significantly according to SEM, and close to significantly in case of regression – of pharmacies pursuing similar SO (H6c). This concurs with our presumptions, so we also accepted our hypothesis H6c.

163
Both our multigroup regression and SEM results confirmed that NP of pharmacies following Defender/Reactor SO in the countryside significantly decreased compared to their urban counterparts (H6d). Since we anticipated this very effect for urban pharmacies, we had to reject our hypothesis H6d. According to multigroup techniques pharmacies' GL moderated the relationship between SO and NP. We examine in detail GL's potential moderating effect on the relationship between pharmacies' SO and profitability, as well as possible explanations for discrepancies between results of interaction and multigroup moderations in Chapter 44 (Discussion). 39. The combined moderating effect of PEU and geographical location on the relationship between strategic orientation and business performance Due to methodological limitations of regression analyses we had to combine interaction and multigroup moderations – thus performing a so-called moderated moderation (SEM) – in order to test our hypotheses H7 and H8 and to examine to what extent the degree of PEU by pharmacy managers and pharmacies' GL „refine” the stochastic relationship between SO, as well as market effictiveness and financial profitability. 39.1. The combined moderating effect of perceived environmental uncertainty and geographical location on the relationship between strategic orientation and sales In our hypothesis H7 we assumed that changes in the degree of PEU exert varying effects on the relationship between M&S’s SOs and SAL depending on the pharmacies' GL (Figure XXXI). The results of moderated moderation (SEM), combining multigroup and interaction techniques are illustrated Table CIX. Evidently Prospector SO had a significant and positive influence on SAL in both urban and rural environments. Although in the countryside the prevalence of Analyser SO lessens SAL parallelly to the decrease of PEU, yet even this effect only approximates significance (H7a). Seeing as how changes in the degree of PEU had close to no effect on Prospector's SAL – not even in cities specified in our assumption – we rejected our hypothesis H7a. Prevalence of Analyser SO also showed no significant correlation with changes in the degree of PEU in either urban or rural pharmacies. Development of PEU by pharmacy managers – independently from GL – had no influence on Analyser's SAL (H7b). In the countryside Analyser SO exerted a slightly negative effect on turnover, yet this did not proved to be significant either. Based on this we also could not accept our hypothesis H7b, as we did not register any changes in the otherwise negative relationship between Analysers and SAL. Defender/Reactor SO exerted a strong, negative effect on SAL, but its main effect proved to be significant only for rural pharmacies. Interestingly, a decrease in the degree of PEU by pharmacy managers did not significantly lessen turnover of rural Defender/Reactor pharmacies (H7d). Influence of decrease in PEU on the negative relationship between Defender/Reactor SOs and turnover only approached significance even in cities. Our hypothesis H7d had also to be rejected, as it was PEU's decrease, not its increase that contributed to the not even significant lessening of SAL, which we registered not for rural, but for urban pharmacies anyway. Results for our hypotheses H7a, H7c and H7d confirmed that PEU – depending on GL – also did not influence development of relationship between M&S’s SOs and SAL of pharmacies,

164
which is why we rejected our hypothesis H7 regarding the combined moderating effect of PEU and GL. According to experiences obtained by moderated moderation (SEM) main and interaction effects of SO and PEU explained 22,59% (R2=0,2259) of the variance in pharmacies' SAL, which amounted to almost 31% in a rural context (R2=0,3108). 39.2. The combined moderating effect of geographical location and perceived environmental uncertainty on the relationship between strategic orientation and profitability of pharmacies In order to test H8 (Table CX) we applied moderated moderation (SEM) also to further reveal the relationship between M&S’s SOs and NP (Figure XXXII), during which we examined whether changes in the degree of PEU exert a significant influence on the relationship between Prospector, Analyser or Defender SOs and profitability within groups of either urban or rural pharmacies. According to the results of Table CX neither SOs' main effects, nor their interaction effects with PEU influenced pharmacies' NP in cities. Here the development of the relationship between SOs and pharmacies' profitability is independent from the degree of PEU. In the countryside main effects were stronger, but only the prevalence of Defender/Reactor SO decreased NP significantly. Within townships PEU's decrease also significantly worsened the profitability of pharmacies following Prospector SO, which otherwise can be viewed as positive facilitator of BP (H8a). This partly contradicts our hypothesis, as we predicted this strengthening effect with the increase of PEU, which is why we rejected our hypothesis H8a. Changes in the degree of PEU had no significant effect on Analyser's NP in urban or rural environments whatsoever (H8b). We registered but one significant interaction effect, according to which rural Analyser pharmacies' profitability slightly improves in parallel to decrease of PEU. Seeing as how Analyser's profitability insignificantly improves with with the decrease of the degree of PEU, we also did not accept our hypothesis H8b. Prevalence of Defender/Reactor SO – parallelly to changes in the degree of PEU by pharmacy managers – had no effect on NP (H8d). In the countryside the main effect of the Defender/Reactor SO – independently from the degree of PEU – significanctly worsened pharmacies' profitability, while positive interaction effect of PEU and Defender/Reactor SO did not even approach significance in urban and rural contexts alike. Therefore our hypothesis H8d could not be confirmed either. Experiences resulting from testing H8a, H8c and H8d confirmed that PEU, irrespectively to GL did not influence the relationship between M&S’s SOs and pharmacies' NP, hence we rejected our hypothesis H8 regarding the combined moderating effect of PEU and GL. Based on the structural model main and interaction effects of SO and PEU managed to explain only 6,3% (R2=0,063) of the variance of pharmacies' NP in cities, yet in rural context this amounted to as much as 27% (R2=0,27). Interestingly by introducing GL, the main effect of PEU – originally showing no connection to profitability – on NP became significant in case of cities, according to which decrease of PEU improved the profitability of pharmacies.
165
40. The robustness of the connections – explored by multi-variate data analyses – in the relationship between strategic orientation and business performance In the last empirical stage of our dissertation we examined the robustness of the interrelationships between SO, PEU by pharmacy managers, pharmacies' GL and BP established during the preceeding regression and structural analyses by integrating control variables that proved to be relevant based on results of the correlation matrix (Table XCIV). Our main interest lay in determining, whether the influence of SOs' prevalence on effectiveness and profitability remains the same, if we filter the additional effects determining pharmacies' BP in our model. We begin testing our hypotheses by describing the results regarding SAL of pharmacies (H9a). 40.1. The combined moderating effect of geographical location and PEU on the relationship between strategic orientation and sales by integrating relevant control variables To test H9a we examined the potential influencing effects on the stochastic relationship of M&S’s SOs and turnover of pharmacies by yet again performing a moderated moderation (SEM). From the socio-demographic variables we included pharmacies' total area of space, ownership structure, as well as participation in equity- and relationship-based cooperations into our structural model. From site characteristics we integrated the proximity of competitor pharmacies, drugstores, gas stations and the vicinity of other retail units (Figure XXXIII). According to Table CXI, Prospector SO continued to favorably influence SAL of pharmacies. That is, even the additional explanatory power of the control variables connected to turnover and integrated into our model could not manage to „suppress” Prospector SO's substantial contribution to SAL in either urban or rural environments. Interaction effect of Prospector SO and PEU remains negligible, yet decrease in PEU lessens SAL to an almost significant degree in the countryside. The connections of Prospector SO and SAL established in earlier analyses were not modified notably even after including control variables, the only slight change encountered is that it showed a stronger contribution to SAL in cities, not in the countryside. Analyser SO exerted an insignificant influence on pharmacies' SAL after filtering the effects of control variables in both urban and rural environments. Decrease of PEU produced close to no additional effects, while in the countryside – complying with theoretical implications – it had a nearly significant positive impact on SAL. Nature of Analyser SO's main and interaction effects with PEU on turnover did not change. It might be worth to mention that in the countryside the effect of Analyser SO on SAL showed significance, but the connections identified during former multigroup methods remain robust nonetheless. Defender/Reactor SO exerted negative influence on pharmacies' SAL in both urban and rural environments. In the countryside decrease in the degree of PEU did not significantly worsen Defender/Reactor's default suboptimal performance. Compared to connections established during preliminary analyses, the difference is that by eliminating effects of control variables pertaining to socio-demographic and site characteristics of pharmacies, prevalence of Defender/Reactor SO had a negative influence even on turnover of urban pharmacies. Furthermore, in cities decrease of PEU by pharmacy managers influenced pharmacies' SAL in a negative way, but similar to former analyses moderating effect of PEU is not significant. Connections established for the relationship between Defender/Reactor SO and SAL remained
166
robust, except for the main effect experienced in cities. Main effect of PEU remained insignificant even after including control variables, but in cities increase of predictability varied with the increase of SAL. In the countryside decrease of PEU barely lessened turnover. Among socio-demographic variables and site characteristics integrated into the model only total area of space contributed in a significant, positive way to pharmacies' SAL. Explanatory power of the extended model by including control variables grew, and managed to explain 30,6% (R2=0,306) of the variance in SAL within cities, as well as 42,1% in case of rural pharmacies. Confirming our former experiences, filtering the effects of control variables demonstrated that SO's influence on BP is stronger in the countryside. Filtering the effects of control variables did not notably alter patterns found earlier for the relationship of pharmacies' SO and SAL in regard of PEU. However, differences based on GL did moderately change or even disappeared in the relationship between Prospector, Analyser or Defender/Reactor SOs and SAL. Thus, we can only partially accept our hypothesis H9a. 40.2. The combined moderating effect of GL and PEU on the relationship between strategic orientation and NP by integrating relevant contol variables While testing H9b via moderated moderation (SEM) and by integrating relevant control variables we tried to find out, whether connections established in former multivariate analyses remained robust for the relationship between SO and NP, and for the moderating effects of PEU and GL even after eliminating additional factors influencing profitability. Our model included total area of space from socio-demographic attributes, vicinity of hospitals, medical stations, and other retail stores, as well as the number of passers-by near the pharmacy (Figure XXXIV). Results are summarised in Table CXII. It is discernible that Prospector SO did not significantly influence NP of pharmacies in either urban or rural environments. Changes in the degree of PEU had an insignificant impact on the relationship between Prospector SO and NP within cities, yet just as in former moderated moderations its decrease significantly eroded profitability, which „suppressed” the effects experienced during preceding multigroup methods. Conclundingly connections established for Prospectors' NP did not change in respect of PEU, while they did change slightly in respect of GL. Analyser SOs had an insignificant influence in both rural and urban environments even after introducing relevant control variables. GL significantly moderated the relationship between Analyser SO and pharmacies' profitability, but we found a digression regarding PEU's moderating effect when integrating socio-demographic variables and site attributes. Contrary to our former multivariate results – in line with theoretical implications – decrease in the degree of PEU showed positive significant correlation with NP of Analysers. Prevalence of the Defender/Reactor SO exerted an insignificant influence on the development of NP within cities, but in case of rural pharmacies it still significantly eroded profitability. Relationship between Defender/Reactor SO and NP did not change in respect of the degree of PEU even after eliminating control variables. GL, however – confirming our experiences from former analyses – moderated the relationship of Defender/Reactor SO and profitability even by integrating the effect of socio-demographic characteristics and site variables. Main effect of PEU remained significant in cities, while in the countryside PEU by

167
pharmacists' showed no connection to pharmacies' profitability. Amongst socio-demographic and site characteristics, total area of space had a significant positive influence on NP in both urban and rural contexts. Vicinity of retail units significantly enhanced profitability in cities, while in the countryside it was increase in numbers of passers-by that significantly contributed to pharmacies' NP. Our structural model managed to explain 15,6% (R2=0,156) of variance of pharmacies' profitability within cities, while in case of rural sites this was significanctly higher with a value of 40,7%. (R2=0,407). Eliminating the effects of control variables yet again confirmed our former experiences, according to which influence of M&S’s SOs on BP is mostly critical in a rural context. After filterig the effects of control variables, influence of SOs on changes of NP was only slightly altered. Only GL's moderating effect on Prospectors disappeared, while moderating effect of PEU continues to be relevant rather in the countryside. With the exception of rural Defender/Reactors, M&S’s SOs altogether still explain pharmacies' profitability to only a minimal extent. Hence our hypothesis H9b can also only be accepted partially. 41. The evaluation of hypotheses tested in our dissertation The main focus of our PhD thesis laid on the stochastic relationship between M&S’s SOs and BP of pharmacies. We revealed via a multitude of mathematical-statistical methodologies the factors that could possibly moderate the relationship between SOs and pharmacies' BP within HPRDS, a sector best characterised by bureaucratic coordination mechanisms and limited competitive intensity. Based on this our hypotheses formulated in the earlier sections of the dissertation examined the potential moderating role of two industry-specific factors – namely pharmacies’ GL and the degree of PEU by pharmacy managers – in the relationship between M&S’s SOs as well as market effectiveness and financial efficiency. We examined our hypotheses by hierachical interaction and multigroup regression analyses, as well as interaction, multigroup and moderated SEM moderations. By eliminating the effects of additonal industry-specific factors influencing pharmacies' BP (control variables) we also inspected how robust the connections established for the development of the relationship between Prospector, Analyser, Defender/Reactor SOs, as well as SAL and NP are. We summarised our answers to our hypotheses H1-H9 in tabulatory form in order to provide an easier way of intepretation of the several, often meticulous and fragmented methodological techniques (Tables CXIII to CXIV).
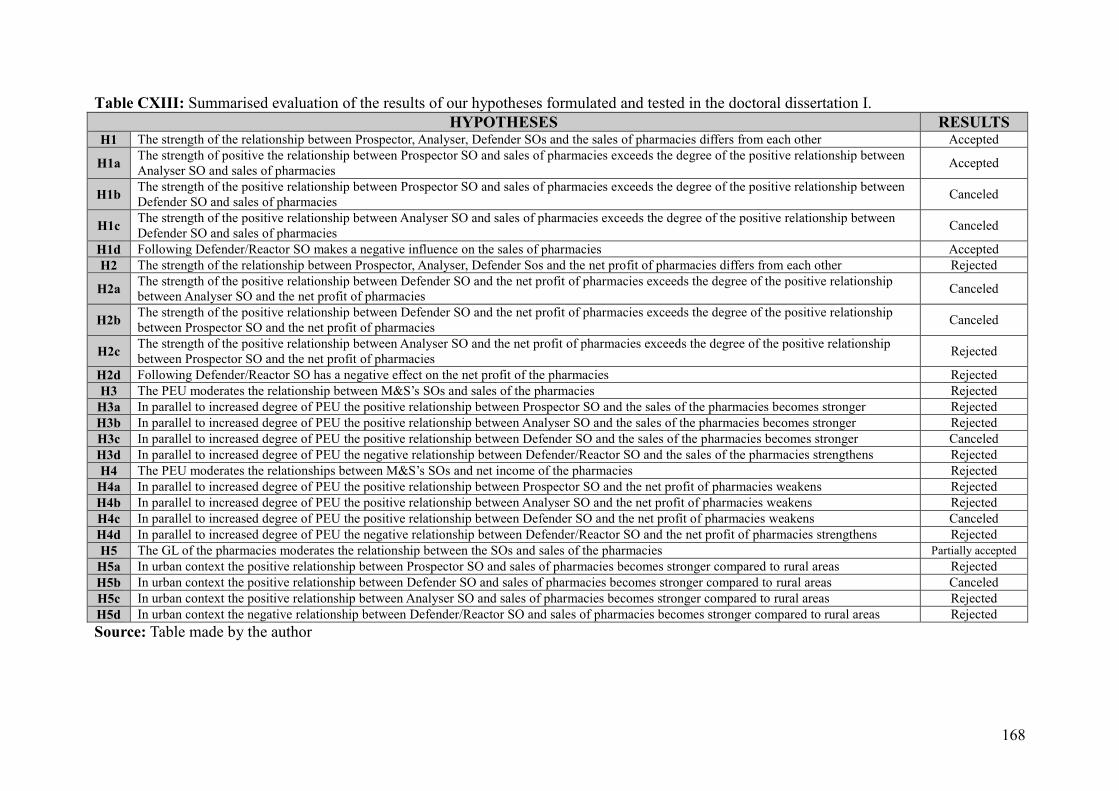
168
Table CXIII: Summarised evaluation of the results of our hypotheses formulated and tested in the doctoral dissertation I. HYPOTHESES RESULTS
H1 The strength of the relationship between Prospector, Analyser, Defender SOs and the sales of pharmacies differs from each other Accepted
H1a The strength of positive the relationship between Prospector SO and sales of pharmacies exceeds the degree of the positive relationship between Analyser SO and sales of pharmacies Accepted
H1b The strength of the positive relationship between Prospector SO and sales of pharmacies exceeds the degree of the positive relationship between Defender SO and sales of pharmacies Canceled
H1c The strength of the positive relationship between Analyser SO and sales of pharmacies exceeds the degree of the positive relationship between Defender SO and sales of pharmacies Canceled
H1d Following Defender/Reactor SO makes a negative influence on the sales of pharmacies Accepted H2 The strength of the relationship between Prospector, Analyser, Defender Sos and the net profit of pharmacies differs from each other Rejected
H2a The strength of the positive relationship between Defender SO and the net profit of pharmacies exceeds the degree of the positive relationship between Analyser SO and the net profit of pharmacies Canceled
H2b The strength of the positive relationship between Defender SO and the net profit of pharmacies exceeds the degree of the positive relationship between Prospector SO and the net profit of pharmacies Canceled
H2c The strength of the positive relationship between Analyser SO and the net profit of pharmacies exceeds the degree of the positive relationship between Prospector SO and the net profit of pharmacies Rejected
H2d Following Defender/Reactor SO has a negative effect on the net profit of the pharmacies Rejected H3 The PEU moderates the relationship between M&S’s SOs and sales of the pharmacies Rejected
H3a In parallel to increased degree of PEU the positive relationship between Prospector SO and the sales of the pharmacies becomes stronger Rejected H3b In parallel to increased degree of PEU the positive relationship between Analyser SO and the sales of the pharmacies becomes stronger Rejected H3c In parallel to increased degree of PEU the positive relationship between Defender SO and the sales of the pharmacies becomes stronger Canceled H3d In parallel to increased degree of PEU the negative relationship between Defender/Reactor SO and the sales of the pharmacies strengthens Rejected H4 The PEU moderates the relationships between M&S’s SOs and net income of the pharmacies Rejected
H4a In parallel to increased degree of PEU the positive relationship between Prospector SO and the net profit of pharmacies weakens Rejected H4b In parallel to increased degree of PEU the positive relationship between Analyser SO and the net profit of pharmacies weakens Rejected H4c In parallel to increased degree of PEU the positive relationship between Defender SO and the net profit of pharmacies weakens Canceled H4d In parallel to increased degree of PEU the negative relationship between Defender/Reactor SO and the net profit of pharmacies strengthens Rejected H5 The GL of the pharmacies moderates the relationship between the SOs and sales of the pharmacies Partially accepted
H5a In urban context the positive relationship between Prospector SO and sales of pharmacies becomes stronger compared to rural areas Rejected H5b In urban context the positive relationship between Defender SO and sales of pharmacies becomes stronger compared to rural areas Canceled H5c In urban context the positive relationship between Analyser SO and sales of pharmacies becomes stronger compared to rural areas Rejected H5d In urban context the negative relationship between Defender/Reactor SO and sales of pharmacies becomes stronger compared to rural areas Rejected Source: Table made by the author

169
Table CXIV: Summarised evaluation of the results of the hypotheses formulated and tested in the doctoral dissertation II. HYPOTHESES RESULTS
H6 The GL of pharmacies moderates the relationship between the SOs and net profit of pharmacies Partially accepted H6a In urban context the positive relationship between Prospector SO and the net profit of pharmacies is weaker than in rural areas Accepted H6b In rural context the positive relationship between Defender SO and the net profit of pharmacies is stronger than in urban areas Canceled H6c In urban context the positive relationship between Analyser SO and the net profit of pharmacies is weaker than in rural areas Accepted H6d In urban context the negative relationship between Defender/Reactor SO and the net profit of pharmacies is stronger than in rural areas Rejected H7 PEU in combination with GL moderates the relationships between M&S’s SOs and the sales of pharmacies Rejected
H7a In urban context the increasing degree of PEU makes the positive relationship between Prospector SO and the sales of pharmacies stronger than that experienced in rural environment Rejected
H7b In urban context the increasing degree of PEU makes the positive relationship between Analyser SO and the sales of pharmacies stronger than that experienced in rural environment Rejected
H7c In urban context the increasing degree of PEU makes the positive relationship between Defender SO and the sales of the pharmacies stronger than that experienced in rural environment Canceled
H7d In rural context the increasing degree of PEU makes the negative relationship between Defender/Reactor SO and the sales of the pharmacies stronger than that experienced in urban environment Rejected
H8 PEU in combination with GL moderates the relationships between M&S’s SOs and the net profit of pharmacies Rejected
H8a In rural context the increasing degree of PEU makes the positive relationship between Prospector SO and the net profit of pharmacies weaker than that experienced in urban environment Rejected
H8b In rural context the increasing degree of PEU makes the positive relationship between Analyser SO and the net profit of pharmacies weaker than that experienced in urban environment Rejected
H8c In rural context the increasing degree of PEU makes the positive relationship between Defender SO and the net profit of pharmacies weaker than that experienced in urban environment Canceled
H8d In rural context the increasing degree of PEU makes the negative relationship between Defender/Reactor SO and the net profit of pharmacies stronger than that experienced in urban environment Rejected
H9 The interrelations established as a result of the potential moderating influence of the PEU and GL – on the relationship between the SO and BP are robust after controlling for the effect of relevant industry-specific variables Partially accepted
H9a The observed relationships between the SOs of Miles and Snow and sales of pharmacies are robust Partially accepted H9b The observed relationships between the SOs of Miles and Snow and net profit of pharmacies are robust Partially accepted Source: Table made by the author

170
42. The evaluation of the moderating effects on the relationship between strategic orientations and business performance 42.1. The role of PEU in the relationship between strategic orientation and sales In the current subchapter we summarised our empirical experiences regarding the moderating effect of the degree of PEU by pharmacy managers and pharmacies' GL on the relationship between M&S’s SOs and BP. It is also here that we label the types of specification variables based on the correlation matrix (Table LXXI), as well as on the results of regression and structural models. Tables CXV-CXVIII provide an overview of the results stemming from the multitude of mathematical-statistical methods.

171
Table CXV: The moderating effect of perceived environmental uncertainty in the relationship of strategic orientation and business performance Moderating variable:
Perceived environmental uncertainty Applied mathematical-statistical methods
Strategic orientation Business performance
Hierarchical (interaction) moderated regression
Multigroup moderated regression Interaction
moderation (SEM)
Multigroup moderation (SEM)
High Low High Low
β Sig. β Sig. β Sig. β Sig. β Sig. β Sig. Prospector Sales -0,074 0,392 0,375 0,000 0,265 0,007 -0,057 0,448 0,401 0,000 0,248 0,033 Analyser Sales 0,059 0,498 -0,171 0,074 -0,001 0,994 0,095 0,167 -0,174 0,088 0,021 0,850
Defender/Reactor Sales -0,099 0,172 -0,165 0,102 -0,304 0,002 -0,162 0,027 -0,147 0,199 -0,334 0,009 Prospector Net profit -0,075 0,424 0,158 0,145 0,036 0,734 -0,034 0,684 0,153 0,201 0,056 0,630 Analyser Net profit 0,071 0,452 -0,123 0,207 0,086 0,420 0,060 0,442 -0,114 0,282 0,085 0,482
Defender/Reactor Net profit 0,066 0,399 -0,207 0,066 0,009 0,935 0,045 0,589 -0,241 0,059 0,0012 0,918 Source: Table made by the author Table CXVI: The moderating effect of geographical location in the relationship of strategic orientation and business performance
Moderating variable: Geographical location Applied mathematical-statistical methods
Strategic orientation Business performance
Hierarchical (interaction) moderated regression
Multigroup moderated regression Interaction
moderation (SEM)
Multigroup moderation (SEM)
Urban Rural Urban Rural
β Sig. β Sig. β Sig. β Sig. β Sig. β Sig. Prospector Sales -0,039 0,615 0,276 0,004 0,396 0,000 -0,024 0,727 0,279 0,015 0,384 0,002 Analyser Sales -0,050 0,515 -0,028 0,773 -0,332 0,001 -0,077 0,244 -0,023 0,845 -0,302 0,013
Defender/Reactor Sales -0,016 0,814 -0,160 0,120 -0,290 0,002 -0,053 0,456 -0,134 0,280 -0,325 0,030 Prospector Net profit 0,010 0,910 0,056 0,574 0,199 0,051 0,026 0,742 0,037 0,741 0,244 0,039 Analyser Net profit -0,019 0,822 0,028 0,793 -0,190 0,081 -0,091 0,233 0,079 0,524 -0,271 0,029
Defender/Reactor Net profit -0,093 0,237 0,028 0,800 -0,308 0,004 -0,104 0,203 0,006 0,961 -0,342 0,028 Source: Table made by the author

172
Table CXVII: Evaluation of the combined moderating effect of perceived environmental uncertainty and geographical location (Sales) Moderating variable:
Perceived environmental uncertainty Moderating variable: Geographical location Applied mathematical-statistical methods
Strategic orientation Business performance Moderated moderation (SEM) Moderated moderation (SEM)
by integrating relevant, industry-specific control variables Urban Rural Urban Rural
β Sig. β Sig. β Sig. β Sig. Prospector Sales 0,311 0,002 0,342 0,000 0,262 0,010 0,204 0,049
Prospector*PEU Sales -0,023 0,814 -0,214 0,055 -0,030 0,761 -0,205 0,052 Defender/Reactor Sales -0,158 0,143 -0,304 0,002 -0,219 0,043 -0,232 0,017
Defender/Reactor*PEU Sales -0,188 0,085 -0,153 0,222 -0,196 0,073 -0,101 0,391 Analyser Sales -0,082 0,439 -0,180 0,081 -0,089 0,389 -0,130 0,089
Analyser*PEU Sales 0,124 0,253 0,125 0,241 0,080 0,450 0,162 0,080 Source: Table made by the author Table CXVIII: Evaluation of the combined moderating effect of perceived environmental uncertainty and geographical location (Net profit)
Moderating variable: Perceived environmental uncertainty
Moderating variable: Geographical location Applied mathematical-statistical methods
Strategic orientation Business performance Moderated moderation (SEM) Moderated moderation (SEM)
by integrating relevant, industry-specific control variables Urban Rural Urban Rural
β Sig. β Sig. β Sig. β Sig. Prospector Net profit 0,020 0,857 0,174 0,100 -0,066 0,561 0,051 0,631
Prospector*PEU Net profit 0,017 0,876 -0,260 0,024 -0,023 0,826 -0,274 0,009 Defender/Reactor Net profit 0,004 0,974 -0,298 0,003 -0,045 0,696 -0,276 0,005
Defender/Reactor*PEU Net profit 0,131 0,277 0,069 0,592 0,156 0,182 0,074 0,532 Analyser Net profit 0,007 0,955 -0,166 0,120 0,037 0,743 -0,157 0,121
Analyser*PEU Net profit -0,017 0,884 0,193 0,078 -0,006 0,959 0,230 0,022 Source: Table made by the author
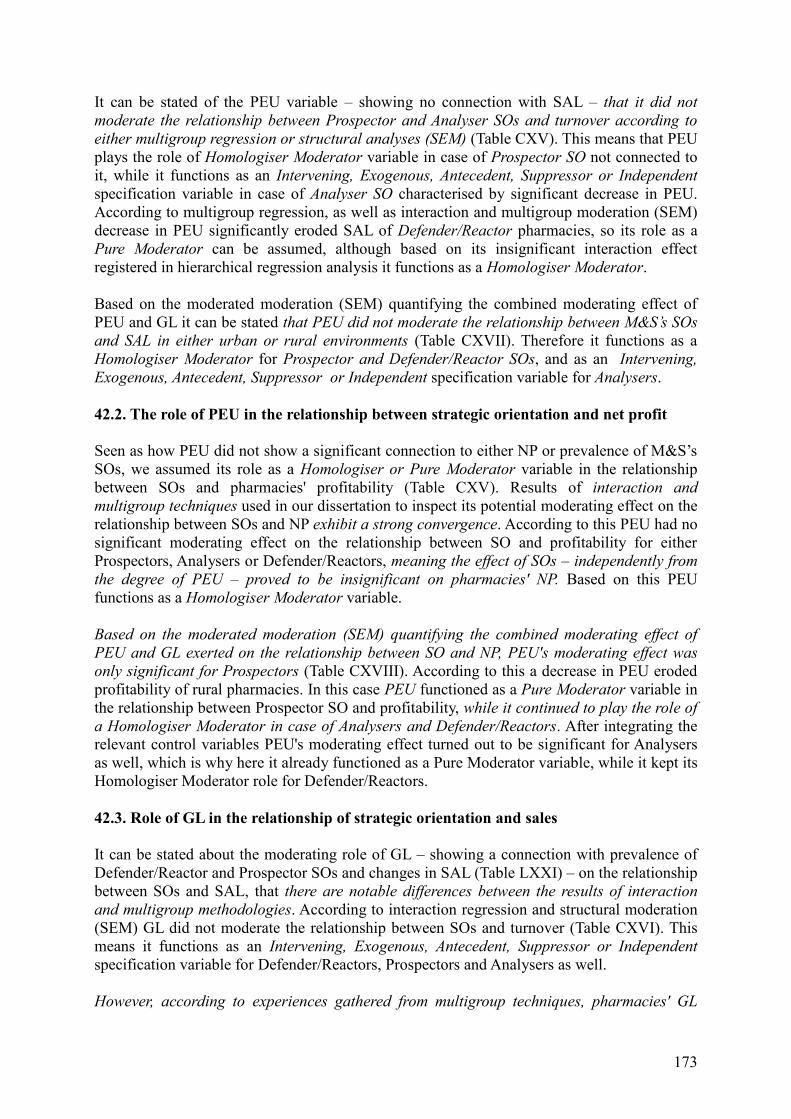
173
It can be stated of the PEU variable – showing no connection with SAL – that it did not moderate the relationship between Prospector and Analyser SOs and turnover according to either multigroup regression or structural analyses (SEM) (Table CXV). This means that PEU plays the role of Homologiser Moderator variable in case of Prospector SO not connected to it, while it functions as an Intervening, Exogenous, Antecedent, Suppressor or Independent specification variable in case of Analyser SO characterised by significant decrease in PEU. According to multigroup regression, as well as interaction and multigroup moderation (SEM) decrease in PEU significantly eroded SAL of Defender/Reactor pharmacies, so its role as a Pure Moderator can be assumed, although based on its insignificant interaction effect registered in hierarchical regression analysis it functions as a Homologiser Moderator. Based on the moderated moderation (SEM) quantifying the combined moderating effect of PEU and GL it can be stated that PEU did not moderate the relationship between M&S’s SOs and SAL in either urban or rural environments (Table CXVII). Therefore it functions as a Homologiser Moderator for Prospector and Defender/Reactor SOs, and as an Intervening, Exogenous, Antecedent, Suppressor or Independent specification variable for Analysers. 42.2. The role of PEU in the relationship between strategic orientation and net profit Seen as how PEU did not show a significant connection to either NP or prevalence of M&S’s SOs, we assumed its role as a Homologiser or Pure Moderator variable in the relationship between SOs and pharmacies' profitability (Table CXV). Results of interaction and multigroup techniques used in our dissertation to inspect its potential moderating effect on the relationship between SOs and NP exhibit a strong convergence. According to this PEU had no significant moderating effect on the relationship between SO and profitability for either Prospectors, Analysers or Defender/Reactors, meaning the effect of SOs – independently from the degree of PEU – proved to be insignificant on pharmacies' NP. Based on this PEU functions as a Homologiser Moderator variable. Based on the moderated moderation (SEM) quantifying the combined moderating effect of PEU and GL exerted on the relationship between SO and NP, PEU's moderating effect was only significant for Prospectors (Table CXVIII). According to this a decrease in PEU eroded profitability of rural pharmacies. In this case PEU functioned as a Pure Moderator variable in the relationship between Prospector SO and profitability, while it continued to play the role of a Homologiser Moderator in case of Analysers and Defender/Reactors. After integrating the relevant control variables PEU's moderating effect turned out to be significant for Analysers as well, which is why here it already functioned as a Pure Moderator variable, while it kept its Homologiser Moderator role for Defender/Reactors. 42.3. Role of GL in the relationship of strategic orientation and sales It can be stated about the moderating role of GL – showing a connection with prevalence of Defender/Reactor and Prospector SOs and changes in SAL (Table LXXI) – on the relationship between SOs and SAL, that there are notable differences between the results of interaction and multigroup methodologies. According to interaction regression and structural moderation (SEM) GL did not moderate the relationship between SOs and turnover (Table CXVI). This means it functions as an Intervening, Exogenous, Antecedent, Suppressor or Independent specification variable for Defender/Reactors, Prospectors and Analysers as well. However, according to experiences gathered from multigroup techniques, pharmacies' GL

174
significantly moderated the relationship between Defender/Reactor and Analyser SOs and pharmacies' SAL (Table CXVI). This means that in these cases GL can be viewed as a Quasi Moderator variable, while for Analysers – exerting a robust positive effect on SAL in both urban and rural context – it can be interpreted as an Intervening, Exogenous, Antecedent, Suppressor or Independent specification variable. According to moderated moderation (SEM) examinations neither Prospector SO's strong, nor Analysers' insignificant influence on turnover changes depending on the pharmacy's urban or rural location (Table CXVII). Based on this GL's role in the relationship between the two SOs and SAL as an Intervening, Exogenous, Antecedent, Suppressor or Independent specification variable can be confirmed. Negative effect of Defender/Reactor SOs on SAL within a rural context increases, yet eliminating the effects of control variables additionally determining BP eroded turnover of pharmacies even in cities. For this reason in case of Defender/Reactors GL functions as a Quasi Moderator during moderated moderation, while as an Intervening, Exogenous, Antecedent, Suppressor or Independent specification variable after integrating control variables. 42.4. The role of GL in the relationship of strategic orientation and net profit Based on the results of the correlation matrix (Table LXXI) GL also showed a slight connection with NP in case of prevalence of Defender/Reactor and Analyser SOs. We obtained similar results for the moderating effect of GL on the relationship of M&S’s SOs and NP of pharmacies as for SAL (Table CXVI). According to experiences from interaction methods GL generally did not moderate the relationship between Prospector, Analyser or Defender/Reactor SO and pharmacies' profitability. Therefore it can be interpreted as an Intervening, Exogenous, Antecedent, Suppressor or Independent specification variable. On the other hand, multigroup techniques yet again yielded different results, SEM based multigroup moderation for instance showed a strong moderating effect of GL in case of all three M&S’s SOs (Table CXVI). Based on this GL's role as a Quasi Moderator can be assumed. Multigroup regression analysis resulted in a clear decrease of BP within rural context only in case of Defender/Reactors, thus for them GL functions as a Quasi Moderator, while for Prospectors and Analysers – although its moderating effects approaches significance – it serves as an Intervening, Exogenous, Antecedent, Suppressor or Independent specification variable. After integrating control variables additionally influencing profitability, moderated moderations (SEM) mostly confirmed the results of interaction techniques (Table CXVIII). SO’s effect on NP changed as a function of the pharmacy's GL only in case of Defender/Reactor pharmacies. Thus, GL's function as a Quasi Moderator can be confirmed for them, just like its role as an Intervening, Exogenous, Antecedent, Suppressor or Independent specification variable in case of Prospectors and Analysers. Based on their potential moderating effect on the stochastic relationship between the prevalence of M&S’s SOs and BP exhibited by pharmacies, we summarised in Tables CXIX-CXX the type of specification variables that PEU by pharmacy managers and GL can be considered as according to the results of our various mathematical-statistical examinations.

175
Table CXIX: Evaluating the potential moderating role of PEU in the relationship of M&S’s SOs and BP of pharmacies
Strategic orientation Business
performance indicator
Hierarchical interaction regression
Multigroup regression
Interaction moderation
(SEM)
Multigroup moderation
(SEM)
Moderated moderation
Moderated moderation by
integrating control variables
PEU
Prospector Sales Homologiser Moderator
Homologiser Moderator
Homologiser Moderator
Homologiser Moderator
Homologiser Moderator
Homologiser Moderator
Defender/Reactor Sales Homologiser Moderator Pure Moderator Pure
Moderator Pure Moderator Homologiser Moderator
Homologiser Moderator
Analyser Sales Intervening, Exogenious, Antecedent, Suppressor, Independent specification variable
PEU
Prospector Net profit Homologiser Moderator
Homologiser Moderator
Homologiser Moderator
Homologiser Moderator
Pure Moderator Pure Moderator
Defender/Reactor Net profit Homologiser Moderator
Homologiser Moderator
Homologiser Moderator
Homologiser Moderator
Homologiser Moderator
Homologiser Moderator
Analyser Net profit Homologiser Moderator
Homologiser Moderator
Homologiser Moderator
Homologiser Moderator
Homologiser Moderator Pure Moderator
Source: Table made by the author Table CXX: Evaluating the potential moderating role of GL in the relationship between M&S’s SOs and BP of pharmacies Strategic
orientation
Business performance
indicator
Hierarchical interaction regression
Multigroup regression
Interaction moderation
(SEM)
Multigroup moderation
(SEM)
Moderated moderation
Moderated moderation by integrating control
variables
Geo
grap
hica
l lo
catio
n
Prospector Sales Intervening, Exogenious, Antecedent, Suppressor, Independent specification variable
Defender/Reactor Sales Intervening, Exogenious, Antecedent, Suppressor, Independent specification
variable
Quasi Moderator Intervening, Exogenious, Antecedent, Suppressor, Independent specification
variable
Quasi Moderator
Quasi Moderator
Intervening, Exogenious, Antecedent, Suppressor,
Independent specification variable
Analyser Sales Quasi Moderator Quasi Moderator
Intervening, Exogenious, Antecedent, Suppressor, Independent specification variable
Geo
grap
hica
l lo
catio
n
Prospector Net profit Intervening, Exogenious, Antecedent, Suppressor,
Independent specification variable
Quasi Moderator
Intervening, Exogenious, Antecedent, Suppressor, Independent specification variable
Defender/Reactor Net profit Quasi Moderator
Quasi Moderator Quasi Moderator
Analyser Net profit Quasi Moderator Quasi Moderator
Intervening, Exogenious, Antecedent, Suppressor, Independent specification variable
Source: Table made by the author

176
43. Findings In our PhD research we assumed that in a sector combining the microeconomic attributes of both public and private goods, as well as characterised by the prevalence of bureaucratic coordination mechanisms and strong regulation by state authortites, pharmacies develop more or less conscious behavioural patterns of adaptation in regard to turbulently changing environmental conditions. Based on strategic management's scientific literature and in-depth interviews with representatives of HPRDS we decided the strategic typology of Raymond Miles and Charles Snow would serve as a sufficient theoretical frame for uncovering the implications of pharmacies' SO and BP. Relevance of our decision was backed from a theoretical, methodological and managerial point of view as well by the fact that we examined the emergence of Prospector, Analyser and Defender/Reactor SOs within a sector characterised by limited competive intensity, as well as significant structural and legal transformations, and which is occupied mainly by microenterprises interested in developing consistent SOs and avoiding suboptimal BP. Below we summarised the „fragmented” results detailed in the methodological chapters in the form of brief, comprehensible statements: 1. Our dissertation revealed that the 4 original strategic behavioural patterns of M&S can
not be observed in the HPRDS characterised by special contingencies. According to the results of EFA and CFA analyses performed at the discriminant validity examinations the behavioural characteristics of Defender and Reactor SOs were loaded in a single factor, thus by identifying the Defender/Reactor „mix” – beside Prospectors and Analysers – 3 relevant SOs have been observed in the environmental adaptation of pharmacies.
2. Based on EFA and CFA structures the Defender/Reactor SO observed in HPRDS can not
be considered as a distinct, separate, organic, „hybrid” behavioural pattern, but rather as a particular „mix” of Defenders and Reactors. This SO – according to the scrutiny of pharmacists’ answers – is dominated by the inconsistent behavioural features of Reactors.
3. The 2 „pure” and 1 „mix” SOs identified within HPRDS markedly dissever from each
other, and the behavourial characteristics of Prospector, Analyser and Defender/Reactor SOs also significantly differ based on post-hoc Tukey, Scheffe and Bonferroni tests.
4. We experienced but diminutive differences between the results of the two successfully
applied strategy extraction techniques, namely the multi item scale of Segev and the self-typing pharagraph method. Pharmacies identified as either Prospectors, Analysers or Defender/Reactors received near identical classification after comparing results of the two methods. Ratio of pharmacies classified into the same SO by the two measurement instruments exceeded 75%. Convergent validity of the two measurement tools was also confirmed in the classical interpretation too, by performing statistical tests.
5. Regarding the distribution ratio of M&S’ SOs in relation to each other we found that
despite the increased competitive intensity as a consequence of the liberalisation process between 2006 and 2011, relative majority of Defender/Reactor pharmacies – exhibiting suboptimal BP and considered as an inconsistent SO – continues to prevail in HPRDS. These are followed by Analysers, while well-performing Prospector pharmacies, that view turbulent legal changes as business opportunities and provide explicit answers by expanding their range of products and services, are in the relative minority.
6. Managers of pharmacies following different SOs perceived changes in environmental

177
conditions and in behaviour of industrial stakeholders to be unpredictable to various degrees. Analysers significantly perceived changes in external conditions and behaviour of key stakeholders of drug supply chain to be more predictable, while we found no substantial differences between Prospectors and Defender/Reactors in this regard.
7. We encountered no significant difference between groups characterised by either low or
high PEU regarding the emergence of Prospector, Analyser and Defender/Reactor SOs and prevalence of their behavioural attributes. Similarly, when we examined the presence of pharmacies identified as Prospectors, Analysers or Defender/Reactors within groups of pharmacy managers characterised by either low or high PEU via association tests, we also did not find significant differences in the distribution ratios of SOs.
8. Within HPRDS, pharmacy manager's conscious choice of strategy had a stronger impact
on the degree of their perceived unpredictability of the environment than the extent to which external industrial conditions, strictly regulated by the state determined pharmacies' margin in selecting and following their SOs.
9. Sales of pharmacies following the observed Prospector, Analyser and Defender/Reactor
SOs in the HPRDS are significantly different. Sales of pharmacies pursuing Prospector SO have exceeded the turnover of Analysers and Defender/Reactors.
10. The profitability of pharmacies pursuing Prospector, Analyser and Defender/Reactor SOs
showed no significant difference. Although net profit of Prospectors slightly exceeded the profitability of Analysers and Defender/Reactors, this gap did not prove to be significant.
11. In terms of effectiveness Prospectors and Analysers, rated as viable SOs in scientific
literature, surpassed significantly the BP of pharmacies pursuing inconsistent Defender/Reactor SO, but this difference proved to be insignificant regarding profitability. Thus, the 1. recommendation of M&S on BP has by and large been fulfilled in practice. As for differences between BP of viable SOs it can be stated that sales of Prospectors exceeded significantly the turnover of Analysers. Considering net profit Prospectors had only an insignificant edge on Analysers, so the 2. recommendation of M&S on BP – which proposed that the consistent SOs perform equally well – could not be verified based on our research experiences.
12. Experiences stemming from regressions and SEM analyses altogether confirmed that –
not counting a few exceptional cases (e.g. Prospectors' profitability within a rural context, Defenders' sales in urban environments) – the degree of PEU by pharmacy managers did not moderate the relationship between pharmacies' SO as well as sales and net profit.
13. We experienced mixed results regarding the potential moderating effect of pharmacies'
GL on the relationship between M&S’s SOs and BP. According to interaction techniques GL does not, while based on multigroup methods it indeed does exert a moderating influence on the relationship of pharmacies' SO, sales and net profit. It is observable that the effect of Prospector, Analyser and Defender/Reactor SOs' prevalence on BP increases in rural context, which can be characterised by less favorable conditions of demand.
14. The majority of the revealed interrelations for the development of PEU's and GL's
potential moderating effect on the stochastic relationship between M&S’s SO and BP remained robust after controlling for variables originally having a significant effect on

178
the effectiveness and profitability of pharmacies. The influence of pharmacies’ SOs on BP has not been “suppressed” by such sector-specific and socio-demographic characteristics (e.g. total area of space, number of employees) and variables pertaining to pharmacies’ sites (e.g. number of people passing-by the pharmacy, vicinity of healthcare institutes and retail stores), which had substantial additional effect on pharmacies’ BP.
15. According to our regression and SEM analyses prevalence of M&S’s SOs – depending on
the methodological specifics of the various techniques – by themselves managed to explain between 16,5 and 23,5 % of variance found for pharmacies' SAL. By integrating PEU this did not increase significantly (17,6 to 30,2%), showing results between 19,3 to 21% for a low, and 24,4 to 26% for high PEU. By including GL and examining its combined effect with PEU 13,1 to 31,8% of turnover's proportion of variance can be explained by M&S’s SOs, which amounted to 13,1 to 22,59% in cities, and to as much as 31,08% in the countryside. Extended models by socio-demographic and site characteristics explained 30,6 to 48% of sales' proportion of variance, depending on the context's urban or rural nature. Therefore M&S’s SOs can be viewed as useful proxy variables in explaining pharmacies' SAL.
16. Based on our research M&S’s SOs by themselves could only explain 3 to 4,4% of
proportion of variance found for pharmacies' NP. According to interaction techniques this barely increased to 5,4 to 6,5% by including PEU, yet multigroup techniques show that in a context characterised by high PEU this can amount to as much as 12 to 14%, while it results in around 1% for low PEU context. By integrating GL and inspecting its combined effect with PEU, M&S’s SOs – although explaining only 0,5 to 6,3% of the variance in pharmacies' turnover within cities – managed to explain as much as 15,5 to 27% of the same in the countryside. By adding further socio-demographic and site characteristics, the explanatory power of the model prediciting pharmacies' net profit increased to a maximum of 18,6% in cities, and 40,7% in the countryside. According to our results SOs proved to be less adequate proxy variables of profitability.
44. Discussion In our Discussion we make an attempt at interpreting and approaching results and findings gained for the main theoretical constructs of our thesis in a more „critical” way. Below we look for factors capable of explaining the more interesting results regarding the connections of SO, PEU, GL and BP. For a deeper interpretation of open questions and unclear research experiences we strived to uncover the potential effect of theoretical and methodological reasons, as well as industry-specific characteristics. 1. According to our results within the HPRDS following a Prospector SO proved to be the
most successful, as their SAL significantly, while their NP insignificantly, but nonetheless exceeded BP of Analyser and Defender/Reactor SOs. Prevalence of Propsectors' idealtypical behavioural characteristics had a positive effect on the development of SAL, even independently from the degree of PEU. Although decrease of pharmacy managers' PEU insignificantly worsened Prospectors' turnover and profitability in cities, this negative influence was anymore found to be significant for pharmacies operating in rural context. Prospectors realised highest SAL in case of both urban and rural pharmacies, it has to be noted however, that Prospector SO had a stronger effect on SAL of pharmacies in the countryside than in cities.

179
Prevalence of Prospector SO significantly increased profitability of rural pharmacies, but had only an insignificant effect on it in cities. Our experiences rather confirm the results of those M&S research, that found a difference in BP of viable SOs (Abernethy-Guthrie, 1994, James-Hatten, 1995, Aragón-Sanchez – Sanchez-Marín, 2005, Bastian-Muchlish, 2012, Talpová, 2012). Scientific literature offers numerous studies, according to which Prospectors' BP exceeds that of Analysers and Defenders, but it is uncommon for this to also show – even though insignificantly – in profitability and not only effectiveness. Regarding HPRDS, characterised by lower competitive intensity the „layman” would assume that income is secure, yet despite the fact that cost management is not one of Prospectors' main strengths (Hambrick, 1983a, b), it is still their NP that is highest (Hawes-Crittenden, 1984, Croteau-Bergeron, 2001, 1999, DeSarbo et al., 2005).
2. Contrary to theoretical implications the evaluations given by pharmacists to PRO_6 item
of Segev scale („Our pharmacy's attempts at introducing new products and pharmaceutical services often prove not to be successful and profitable”) varied in the opposite direction to Prospector SO's other behavioural characteristics. According to past research Prospectors – characterised by continuous diversification – by broadening their range of products and services, often enter markets, where their operation is not always profitable (McKee et al., 1989, Woodside et al., 1999, Di Benedetto-Song, 2003). However based on our EFA and CFA analyses this behavioural aspect functioned as an item that loaded on Prospector SO as a factor with a negative factor loading. This was something we already concluded based on the results of our measurement tools' qualitative testing. In HPRDS it can be interpreted by still rating attempts of Prospectors – leading introduction of product/service innovations to market – as profitable.
Our presumpiton was confirmed by the fact that item PRO_6 showed a negative correlation with NP, and also that Prospector pharmacies' profitability exceeded, although not significantly that of Analysers and Defender/Reactors. Profitability of Prospectors' innovation attempts can be potentially explained by several industry-specific characteristics. For instance, expansions of pharmacies' range of products and services are mainly realised within categories of OTC drugs and other products that can be marketed at a higher margin of profit (Desselle-Zgarrick, 2004, Bliss, 2007). Contrary to this, margin of profit of prescription (Rx.) products, that provide most of the turnover of pharmacies less interested in diversification, showed a steady decrease in recent years due to severe restrictions of the pharmaceutical budget and the spread of generic drugs (Bodrogi et al., 2010, Dankó, 2012). In light of this it can be deemed probable, why item PRO_6 showed a „reversed” correlation with Prospector SO's other behavioural characteristics despite theoretical expectations.
3. Despite insignificant results, based on the majority of our empirical tests prevalence of
Analyser SO worsened BP to an almost significant degree for rural pharmacies. It is possible that in their case the „over-analysis” of turbulent and complex environmental conditions received too much attention, which could have impaired reactivity and obstructed explicit managerial decision-making (Hambrick, 1983b, Zahra-Pierce, 1990, Forte et al., 2000, Ghobadian-O’Reagan, 2005). It is likely, that rural pharmacists also lacked sufficient management skills and competences for successfully implementing Analyser SO (Di Benedetto-Song, 2003, DeSarbo et al., 2006, Mitev-Bauer, 2008a). For pharmacies specialised in conventional Rx. drugs competing with other settlements' pharmacies and other healthcare or retail providers proves to be a huge challenge.

180
Financial resources necessary to introduce new products and services are often scarce, suitable marketing skills for reaching new patient segments are often lacking, which makes it more difficult to implement the complex Analyser SO. In contrary to Prospectors and Defender/Reactors, decrease in Analyser pharmacy managers' PEU did not absolutely result in a lessening of BP, and regarding SAL Analyser pharmacies' BP worsened significantly within a context characterised by an explicitly high PEU. This is consistent with theoretical implications of M&S, as according to the authors' guidelines the essence of Analysers' behaviour lies in exploring environmental conditions to the highest possible degree and in predicting their changes (McDaniel-Kolari, 1987). By failing to do this, they have to face suboptimal BP (Hambrick, 2003, Akbolat, 2009). At the same time however, in light of the balanced effectiveness and profitability registered for Analysers in earlier research (Snow-Hrebiniak, 1980, Segev, 1989, Tan, 2002, Pleshko-Nickerson, 2008), this SO's insignificant effect on BP is somewhat surprising.
4. Prevalence of Defender/Reactor SO mostly exerted a significant negative effect on
pharmacies' BP. Seeing as manifestations of the content elements of this SO are dominated by Reactors' behavioural characteristics, our result complies with experiences of most M&S research (Parnell et al., 2000, Slater-Olson, 200, DeSarbo et al., 2005, Garrigos-Simon et al., 2005). At the same time, being aware of HPRDS' contingencial attributes, we would not have been surprised, if Defender/Reactors' BP had turned out to be optimal. Some publications brought to attention that within industries characterised by bureaucratic coordination mechanisms and limited competitive intensity even companies following inconsistent SOs might prove to be succesful (Snow-Hrebiniak, 1980, Rajagopalan, 1997, Meier et al., 2007).
Our results however do not confirm these experiences, as Defender/Reactors produced an acceptable BP only in cities. Additionally, with decrease in the degree of PEU by pharmacists the prevalence of this SO significantly or almost significantly reduced pharmacies' SAL, which negative effect was especially strong in the countryside. It is probable, that cities' more favorable demand conditions are to some degree able to compensate negative effects of Defender/Reactors characteristics less succesful in environmental adaptation. As it seems, despite the „quasi” monopolised position demarcated by size of population and geographical distance and the margin of profit secured for Rx. drugs, Defender/Reactor pharmacies perform poorly even within this regulated sector.
Nevertheless, the retreating Defender/Reactor SO significantly reduced pharmacies' turnover within a rural context. It is noteworthy, that Defender/Reactor pharmacy managers in cities with more favorable perspective of BP perceive the – otherwise turbulently changing – environment as less uncertain (Oosthuizen, 1997). In their case decrease in BP caused by „becoming too comfortable” is not significant only because the more favorable conditions of demand provide them with some protection for a shorter or longer time, while lack of explicit strategic responses leads to an immediate decrease in BP within the smaller settlements (McKee et al., 1989, de Aguiar et al, 2014, Helmig et al., 2014). After eliminating the effects of control variables it became evident, that Defender/Reactor SO is not an appropiate answer to the challenges of a turbulently changing environment, and thus leads to suboptimal BP.
5. Difference in results shown by multigroup and interaction techniques aimed at
uncovering GL's potential moderating effect can be viewed upon as the single biggest

181
methodological „mystery” of our disstertation. Interaction regressions and structural models showed no moderating effect of GL on either SAL or NP. Contrary to this, according to multigroup regressions and structural models prevalence of Defender/Reactor and Analyser SOs worsens pharmacies' turnover more strongly in the countryside. Also, in case of NP rural Prospectors' positive, while Defender/Reactor and Analyser SOs' eroding effect on BP is enhanced as compared to cities.
When further examining these contradicting results we performed multigroup and interaction techniques again by operationalising contexts characterised by either low or high PEU, as well as urban or rural locations as dichotomous variables not coded by 0 and 1, but by 1 and 2 instead (Baumgartner-Homburg, 1996, Klarmann, 2011, Chatterjee et al., 2013). Our assumption at this point was, that the influence of product terms quantifying the moderating effect would change in case of interaction methodology, if one of their factors is not 0. However, our results did not change even after repeatedly running the models.
Based on in-depth interviews with representatives of key sectoral stakeholders conducted beforehand and after obtaining our results, we accepted the experiences gathered from multigroup mathematical-statistical techniques in our dissertation. It seems logical, that SO exerts a more substantial impact on BP in case of rural pharmacies characterised by less favorable demand conditions, than in case of urban pharmacies characterised by larger population, higher purchasing power and a diversity of patients’ needs and preferences. We are nonetheless aware of the fact, that the contradicting results of the interaction and multigroup techniques applied for the examination of GL's moderating effects provide one of the critical surfaces of our PhD thesis.
6. Based on both scientific literature and our in-depth interviews we predicted a notable
contribution of site characteristics to BP (Bauer-Mitev, 2001, Roberts-Keith, 2002, Pillittere et al., 2009). The correlation matrix (Table XCIV) also unveiled numerous significant connections between these variables and pharmacies' SAL and NP. Yet when applying more complex methodological techniques and when integrating them with SO, PEU, GL and basic socio-demographic characteristics, site attributes' added value to the explanation of BP proved to be marginal.
It was only the number of passers-by the pharmacy that exerted a significant positive effect on both SAL and NP. Close vicinity of retail units had a positive effect on NP, but did not influence SAL. Curiously even the effect of hospitals’ and other healthcare institutions’ vicinity only approached significance. Pharmacies' BP hence was determined rather by socio-demographic characteristics and SO, collectively „suppressing” partial effects of site attributes. Our result contradicts the majority of retail economics' empirical experiences (Huff, 1964, Achabal, 1982, Bauer-Mitev, 2001, Levy-Weitz, 2012).
7. Based on both studies regarding pharmacies' management and the in-depth interviews
conducted with representatives of key industrial stakeholders we expected pharmacies' BP to be largely determined by socio-demographic characteristics (Mitev-Bauer, 2008c, Szabó, 2009, Feller, 2010). According to Table XCIV, if we handle these factors separately and inspect their correlation with BP, ownership structure, participation in a strategic alliance or procurement association, the total area of space of the pharmacy and offcina, as well as number of employees all show a significant connection with changes of SAL. Yet when integrating above variables into the more complex regression and SEM

182
analyses with SO, PEU, GL and site characteristics, only the variables total area of space and number of employees exerted a significant influence on changes of turnover.
Number of employees is more of a consequence than a cause of SAL, as probably the basic relationship of „the higher the turnover, the more employees are needed” prevailed (Bliss, 2007, Helmons et al., 2014). It is irrealistic to assume pharmacies would hire more employees just in order to generate SAL by directing more human resources on expanding their portfolio, on stock management and marketing activities. The significance of total area of space as compared to the officina’s size is surprising, as based on conventional marketing logic it is the larger sales area that leads to higher SAL, not larger storage room, back office or laboratory (Turley, 2000, Desselle-Zgarrick, 2004, Feller, 2010). Area of officina and pharmacies’ total space however correlate with each other, which could confirm the sectoral experience according to which a sizeable „back office” capacity is needed in order to run pharmacies generating high turnover and offering a wide range of products (Christopher-White, 2009, Agárdi, 2011). Based on regression and SEM models, from amongst socio-demographic characteristics only total area of space exerted a significant positive effect on changes in NP.
8. According to best fitting EFA and CFA structures Defender/Reactors can not be regarded
as representing a perfect „mix” of the Defender and Reactor SOs. Based on its factor loading value item REA_4 – „In recent years our pharmacy has been attempting to adapt its product and service portfolio to the ever changing needs and preferences of our patients” – fit more to Prospector SO. It is partly due to this phenomenon that when assigning pharmacies to SOs the sum of pharmacies identified as Defenders and Reactors in case of the 4 factorial Segev scale's results did not equal the sum of Defender/Reactor pharmacies observed in the 3 factor solution.
The theoretical and methodological doubts underlying the discrepancy are not without concern, as they raise the question, why a viable SO would adopt the characteristic of an inconsistent behavioural pattern (Zahra-Pierce, 1990, Moore, 2005). Although item REA_4 does not correlate too strongly with the Prospector factor, this only partially answers the question. It is likely, that item REA_4 has to be re-formulated, in order to „urge” respondents more clearly towards one of the SOs. Further development of the Segev scale however exceeds the limitations of our dissertation and validating any changes have to be the methodological objective of a new research (James-Hatten, 1995, Hambrick, 2003, DeSarbo et al., 2006).
9. After performing EFA and CFA analyses on the Segev scale we found that based on its
factor loading item DEF_5 – „To maintain and enhance its market position our pharmacy keeps prices lower compared to its competitors.” – showed correlation with Analyser SO instead of Defender factor. M&S theory rather suggests that downward pressure on expenses and prices in order to preserve efficient operations and stable product/market segments is a behavioural characteristic of Defenders (Snow-Hrebiniak, 1980, Kabanoff-Brown, 2008, Song et al., 2008). We however believe that conscious use of pricing policy means fits with Analysers' profile, especially on a market, where the degree of competitive intensity abruptly increased after 2006 and where for a long time the existence of competitor pharmacies counted as a taboo theme for several stakeholders (Conant et al., 1990, Jusoh-Parnell, 2008, Talpová, 2012).
A possible explanation would be that within HPRDS pharmacies following Low Cost

183
Defender and Differentiated Defender SOs can be observed (Walker-Ruekert, 1987, Slater-Olson, 2000), amongst which it is certainly the former that tries to keep its patients with lower prices. This however is less probable due to the fact that Defender management attributes rather tended to form a common SO with the characteristics of inconsistent Reactors. We are not in possession of valid and reliable experiences for answering this question, as in order to do so we should have formulated paragraphs for not 4, but 5 SOs in the self-typing paragraph method. Furthermore, to the best of our knowledge no multi-item measurement instrument for identification of Low Cost and Differentiated Defenders is available (James-Hatten, 1995, Olson et al., 2005), and the development of such a scale was not an objective of our research. Therefore it can not be decided, whether the poorly performing Defender/Reactor pharmacies have the behavioural aspects of Low Cost or rather that of Differentiated Defenders besides the dominance of Reactor attributes.
10. The „mix-up” of M&S’s SOs' behavourial characteristics appeared in the focus of
research during recent years (DeSarbo et al., 2006, 2009, DeSarbo-Grewal, 2008, Helmig et al., 2014). Progress of multivariate mathematical-statistical methods made it possible to uncover environmental adaptation behavioural patterns complying much more with reality instead of classifying pharmacies to idealtypical SOs artificially created by academics (Hambrick, 2003). In our Ph.D. thesis we determined that micro and small enterprises functioning within HPRDS, characterised by bureaucratic coordination mechanisms, indeed develop enduring adaptation patterns, although there are 3, not 4 of these SOs, and they are also not „pure”, but „mixed”.
Earlier research tended not to surpass the identification of „mixed” adaptation patterns (Pinto-Curto, 2007, Kabanoff-Brown, 2008), thus our thesis is certainly novel in the aspect that it examined the content elements, reasons and consequences on BP of abovementioned „mix-ups”. Our dissertation strived to markedly distinguish between simple the „mixture” and „organic” connection of behavioural characteristics. We demonstrated via diverse multivariate methodologies, that 1) the factor structure of the Defender/Reactor SO is dominated by Reactor behavioural aspects, and 2), the mix of these do not result in an organic, hybrid adaptation pattern.
Based on our results one probable reason for this is that although due to turbulent environmental changes pharmacies previously following Reactor SO launched a conscious process to change their strategies, but these initiatives are still at an early stage (Mintzberg-McHugh, 1985). As – based on their behavioural aspects of adaptation – it is Defenders standing closest to Reactors, it might appear logical that these firms took their first steps towards the development of latter SO. However in HPRDS BP of Prospector and Analyser SOs exceeded that of Defender/Reactors, so it can be assumed that in the future latter ones will also invest more into the development of less passive and retrieving SOs. Development of managerial skills and pharmacists’ competences required for this count as promising research areas and sectoral policy challenges.
11. M&S’s SOs – ceteris paribus – showed a significant connection with the changes of pharmacies' SAL, but we found no substantial contribution of their influence on pharmacies' NP. We indicated in the correlation matrix (Table LXXXI) that pharmacies' SAL and NP were closely connected to each other in our sample. Based on this alone we can not yet assume a causal relationship between these two BP indicators, but the question arises, that if SOs had a significant influence on turnover, and we also
184
experienced a positive significant connection between SAL and NP, then why does SO not contribute substantially to the development of pharmacies' NP?
It is possible, that changes in SAL could be better explained by integrating additional management characteristics of tactical and operative level, this however would fall outside the frame of our thesis. It is presumable, that SAL plays the role of a mediating variable in the stochastic relationship between SOs and NP, i.e. prevalence of Prospector, Analyser and Defender/Reactor SOs exerts an indirect influence on profitability via turnover (Baron-Kenny, 1986, Baumgartner-Homburg, 1996). According to our results in the HPRDS the implication of PIMS research seems to be slightly confirmed, namely that changes of BP indicators (SAL) determine profitability of enterprises (NP), although not significantly (Buzzell-Gale, 1987, Ambler-Clark, 2001) in our analyses.
12. Apart from PEU's by and large insignificant moderating effect on the relationship
between SOs and BP, it still exerted some influence on changes of pharmacies' BP in some cases. We point towards the potential worsening of BP caused by „becoming too comfortable” parallelly to a decreased degree of PEU, as there indeed were some situations, when a decrease of PEU and pharmacies' BP exhibited correlation (e.g. in case of turnover of urban pharmacies after filtering control variables). We have to note that strategic literature is no stranger to the viewpoint according to which managers judge the development of environmental conditions and stakeholders' behaviour based on the current BP of their enterprise (Swamidass-Newell, 1987, Daft et al., 1988, Waldman et al., 2001, Bastian-Muchlish, 2012).
It is however probable that this viewpoint did not prevail in our research, as we did not experience a general connection between PEU and BP (Table LXXI). We can not state, either, that BP was effected directly by perception of the turbulent changes occuring within the HPRDS. Based on our fragmented results we can only say, that in case of certain GL and site characteristics decrease in the degree of PEU – via implementation of SO – might exert a significant or marginal influence on BP.
13. One of our PhD thesis' experiences most worthy of consideration is that pharmacy managers' conscious choice of strategy had a stronger impact on the degree of their perceived unpredictability of the environment, than the degree to which pharmacies' margin in selecting and following SOs was determined by contingencial conditions strongly regulated by bureaucratic coordination mechanisms. Yet according to implications of contingency theory (Lawrence-Lorsch, 1967, Khandwalla, 1972, Hofer, 1975, Russell-Russell, 1992) and the experiences of primary qualitative research we predicted the opposite of this – i.e. dominance of environmental determination – in contrary to managers' conscious choice of strategy (Child, 1972, Schoonhoven, 1981, Child, 1972, Sharma 2000, Aragón-Correa – Sharma, 2003, Boyd et al., 2012).
There are several possible explanations for our results, the most idealistic being that pharmacists within HPRDS recognised (e.g. because of large variations in BP) the necessity of evolving a consistent SO compliant with pharmacy's local attributes, resources and competences (Barney, 1986, Augier-Teece, 2009). In turn, pharmacists pursuing different SOs probably perceive changes of environmental conditions and stakeholders' behaviour differently – in a manner fitting their SO and confirming their own choice (Di Benedetto-Song, 2003, DeSarbo et al., 2005, Song et al, 2007).

185
It might also come to mind, that the various adaptation patterns of M&S are no direct „products” of pharmacy managers, but rather indeed the results of the turbulent environmental changes of 2006-2011. Although not apparent from our cross-sectional study, it appears possible that today's distinctly different SOs evolved due to the environmental determination from a few years ago (Drazin-Van de Ven, 1985, Hrebiniak-Joyce, 1985). „Defeat” of the contingency theory may have also been partly brought forth by methodological causes (Podsakoff et al., 2003): in regard of pharmacy managers' PEU significant difference between SOs was primary caused by the prevalence of Analyser SO’s behavioural aspects. Analyser SO is a quite „likeable and preferred” strategic option amongst respondent pharmacy managers, as it emphasises balance, i.e. conventional pharmaceutical and innovative business practice to an equal degree, thus dominance of the „managerial choice” theory's implications may have been partly caused by respondents' „tendency toward the middle option” (Baron, 1996, Albaum, 1997).
45. Limitations of our dissertation and potential directions of future research In below section we formulated directions of future research aimed at handling limitations encountered in our dissertation, as well as faults and deficiencies that arose during the various stages of empirical examination. Amongst the limitations of the thesis we find theoretical and methodological deficiencies equally, for which reason we tried to classify and connect both the study's limitations and future research opportunities according to this distinction. 1. Both the Segev scale and the self-typing paragraph method applied for identification of
the SOs primarily focus on the first stage of the evironmental adaptation cycle, namely on aspects of the entrepreneurial problem. In future both the engineering and administrative phases should play a greater role in identifying Prospectors, Analysers, Defenders and Reactors, even in cases of similar micro and small enterprises. For this measurement instruments directed at the management characteristics of engineering and administrative problems have to be developed (e.g. multi-item scales). Currently this was not possible, as both the conditions of data collection and research objectives were rather aimed at testing the relevance of M&S’s adaptation patterns within a regulated sector. Scales operationalising the engineering and administrative areas could possibly provide a more refined picture of pharmacies' environmental adaptation, at the same time producing more valid and reliable results regarding the classification of companies to SOs.
2. Prevalence of the Prospector, Analyser and Defender/Reactor SOs identified by the
measurement instruments applied in our dissertation did not contribute substantially to the explanation of pharmacies' profitability. This may have been partly caused by the methodological imperfection, that strategy extraction techniques used during our research did not lay enough emphasis on the approach of engineering and administrative problems observed in pharmacies' management. Scales directed at the examination of tactical and operative level management characteristics of pharmacy operation's „functional” areas (for instance stock management, marketing activity, human resources management) could provide a more precise picture of resource-allocation and cost management features of pharmacies as well, which eventually would contribute to the explanation of pharmacies' NP in a more meaningful way.
3. By the permission of the president of HCP and its regional leaders the official survey data
collection was only possible to organise in Budapest, as well as Pest, BAZ, Baranya and

186
Vas counties. In order to provide greater levels of reliability, validity and generalisability of results future research have to shift towards probability (random) during the sampling procedure, although – given sufficient support and organisation – addressing the entire pharmacy population (census) is not entirely impossible, either.
4. Although environmental developments within HPRDS are quite powerful, they by no
means appeared or exerted their influence on pharmacies' strategic behaviour instantaneously. Due to the cross-sectional nature of our doctoral research it only provides a snapshot of pharmacies' strategic responses to the (de)liberating regulatory processes occuring in the sector. Development of strategic awareness and trends in changes of SOs observed within the sector can only be quantified via longitudinal studies. In this case panel research studies – in which the composition of responding pharmacy managers' representative pattern does not change - would be the most expedient. A similar series of studies could provide a credible picture about how SOs followed by pharmacies and the content elements of these would change and develop due to the consequences of legal changes effecting the sector.
5. Longitudinal studies would also be able to expose what kind of a long-term effect
changes of environmental conditions and stakeholders' behaviour would exert on pharmacies' SO and BP. Our dissertation had no possibility to examine partial effects of aspects observed in environmental conditions and behaviour of HPRDS' stakeholders. Future research could eventually quantify exactly which changes contribute most to development and BP of Prospector, Analyser, Defender and Reactor SOs. That way it would be possible to draw more explicit conclusions about PEU's and GL's moderating effect on the relationship between SO and BP. Such experiences would hugely facilitate sectoral decision makers' efforts in elaborating adequate policies.
6. After the appearance of horizontal and vertical integration forms functions of ownership
and management got separeted in several segments of the population of domestic pharmacies. Pharmacy managers and co-owners hold a specified share in authority regarding pharmacies' management and responsibility. To ensure higher validity and reliability, but more important, to avoid distortions stemming from CMV it may be justified to use multiple (e.g. two) respondents-designed questionnaires as means of data collection in the future.
7. One of the methodological defiencies of our PhD thesis lies in the fact that we only
managed to apply 2 of the originally planned 3 extraction techniques aimed at the identification of Prospectors, Analysers, Defenders and Reactors. Besides the Segev scale and the method of self-typing paragraphs, the method of objective indicators did not contribute to the assignment of pharmacies to SOs. The reason for this is that pharmacy managers either refrained from responding to the indicators, or otherwise provided distorted, irrealistic data. During later research indicators operationalising the composition, rate and degree of change in the product and service portfolio have to be developed in cooperation with pharmacists.
8. Featuring a 3. measurement instrument would be important beacause it could clarify the
classification of pharmacies to SOs. Knowing the results of 3 different extraction techniques it would be easier to decide which behavourial pattern in environmental adaptation is followed by a given pharmacy. We were unable to decide this clearly in our thesis, as in case of a difference between responses given to either the Segev scale or the
187
self-typing paragraph method, a 3. measurement instrument was not available. Therefore we performed our quantitative examinations with the Segev scale, trusting it would provide more valid and reliable results due to the „more sporadic” position of M&S’s SOs' behavioural characteristics within the questionnaire. Our decision was backed by it being an internationally tested, valid and reliable measurement instrument exhibiting a confirmatory factor structure. However if we manage to identify companies' SO by applying 3 extraction techniques in the future, more robust conclusions can be made regarding the BP of Prospectors, Analysers, Defenders and Reactors, as well as the moderating effect of PEU and GL.
9. It might prove valuable to extend our dissertation's geographical focus to other countries
within the confines of a future research. Prolonging effects of European recession, aging societies and less and less sustainable social insurance systems exert a notable fiscal „pressure” on governments. Narrowing the range of drugs subsidised by the state, as well as reduction of the socially inclined financial subvention of their prices automatically necessitate the transformation and „re-regulation” of drug supply system to some extent. However, adapting to unfavorable macro-environmental and sectoral conditions also means new business challenges for pharmacy managers, and developing and following consistent SOs is indispensable for pharmacists in order to achieve an optimal BP. M&S’s SOs therefore could be relevant in several countries, but for instance it is also an interesting research question, that with what content and formal elements they would emerge within drug supply sectors characterised by individual national, industry-specific and cultural attributes.
10. Examining strategic behavioural patterns observed in various horizontal and vertical
integration forms may prove as a promising and gap-filling direction of research even in international scientific literature. One interesting question for instance is, to what degree pharmacies participating in chain structures follow identical or differing SOs. Do individual members adopt strategic behavioural patterns of the „headquarter”, or is there rather an opportunistic divergence in their environmental adaptation? What consequences could those convergences or divergences possibly exert on the BP of pharmacies? Due to low response willingness of pharmacies taking part in equity-based cooperations we could not hope to approach similar research questions in our thesis. These questions however are relevant as well as timely both in case of pharmacies participating in strategic cooperations organised by wholesalers and in procurement associations.
11. Doubts regarding the validity and reliability of SOs' identification can be viewed upon as
permanent research challenges. The two extraction techniques applied in our thesis also relied on subjective evaluation of respondents when searching for consistent behavioural patterns in the environmental adaptation of pharmacies. Considering the items of the Segev scale and the wording of the self-typing paragraph method it is entirely possible that several pharmacists encountered SOs and management behavioural characteristicts of a nature they never had before.
Discrepancies between the classification results of the 4 factor Segev scale and the self-typing paragraph method add to our fear that respondents were not entirely aware of individual behavioural aspects' meaning and evaluated their pharmacies' SO in a less conscious and consistent manner. Research conducted within sectors characterised by limited competitive intensity have to take stressed care that response options of their measurement tools do not „force” conscious SOs on respondents who are less prepared in

188
management skills or do not follow a consistent behavioural pattern. Thus, it is necessary to develop and apply new measurement instruments (e.g. evaluation by independent sectoral experts, assignment by researchers or method of objective indicators).
12. Already at the very beginning of data collection process we made notable efforts to make respondents clear that in our questions we are interested in their evaluations regarding the pharmacy's current, i.e. realised SO. Yet we were worried about the possibility that when facing the behavioural aspects of M&S’s SOs, managers following a less conscious, inconsistent SO would rather share their evaluations regarding a planned SO they intended to develop in the future. In order to resolve this dilemma and to handle problems with validity and reliability we yet again recommend the application of further extraction techniques. Evaluation by independent sectoral experts, assignment by researchers or the method of objective indicators are equally fit to discern whether responding pharmacists formulated their evaluations in respect of intended or realised SOs.
13. Pharmacy managers are excellent professionals, yet many of them lack strategic
knowledge, skills and developed their managerial competences throughout the years in a self-educated way, based on everyday experiences of pharmacy operation. It is probably largely due to this that at times they provided us with values far-fetched from the reality when determining indicators for pharmacies' effectiveness and profitability. During future data collections for pharmacies' realistic SAL and NP, researchers might find it useful to 1) fill questionnaires out via personal interviews and 2) acces BP indicators from profit-and-loss-statements featured in official company registers. This however could harm respondents' anonymity, and distrust in turn may lead to distorted responses.
14. BP has several dimensions, each of which can be assigned to various qualitative and
quantitative „indicators”. In a sector characterised by microeconomic attributes of public and private goods, a multitude of BP indicators exist besides SAL and NP that fall into various stakeholders' focus of interest. Theoretical and sectoral relevance of research could be possibly enhanced by expanding evaluation of BP with dimensions approaching the role of the pharmacy as a community healthcare provider (e.g. indicators directed at satisfaction, loyalty, degree of patients’ compliance, or even effectiveness of drug therapy). Integrating indicators motivating producers, wholesalers, physicians, professional advocacies to various degrees may contribute to our complete view of pharmacies' BP.
15. Although methodological conditions were given, due to length limits the dissertation did
not examine differences of BP within the groups of pharmacies following the same SO. Differences of BP within SOs are worthy of future attention, as is the exploration of dissimilarities of behavioural characteristics that evoke discrepancies of BP in the groups of Prospectors, Analysers, Defenders and Reactors.
16. Defining „best practices” observed within various M&S’s SOs, as well as depicting the
behavioural profiles of Prospector, Defender, Analyser and Reactor pharmacies exhibiting the best performance stresses the size limits of a dissertation by itself. A future scientific publication could possibly shed light on the distribution to which pharmacies following either Prospector, Analyser or Defender/Reactor SOs are represented amongst those showing outstanding BP. Furthermore it could be answered, to what extent successful pharmacies follow either pure SOs or can be viewed as hybrids or mixes of individual M&S’s behavioural patterns.

189
17. One of our dissertation's methodological defiencies is that the distribution of pharmacy
managers' evaluation regarding the Segev scale's behavioural characteristics and items of the PEU scale is not normal. Based on follow-up in-depth interviews with representatives of HPRDS and our personal experiences we presume that the data would not fulfil the conditions of multivariate normal distribution required for structural equation modeling (SEM), even if eventually repeating the survey data collection. Therefore future reseach have to strive for a larger sample, a handling of missing or extremely outlying data with other techniques, or a more conscious use of „bootstrapping”.
46. Managerial implications To demonstrate the practical relevance of the thesis, based on the experiences of our mathematical-statistical analyses we formulate industry-specific, business-policy suggestions and managerial implications directed at pharmacy managers and sectoral decision-makers. Strategic-level implications aimed at pharmacists' main interest, namely the improvement of pharmacies' SAL and NP occupy a prominent position among our recommendations. 46.1. Managerial implications concerning the strategic orientations of pharmacies Based on our results, following a Prospector SO proved to be the most successful within HPRDS. It is important to note, that – even independently from pharmacy managers’ PEU and pharmacy's GL – BP of Prospectors proved to be outstanding. Prevalence of Prospector SO partly „shields” pharmacists less aware of turbulent environmental changes, and negative effects of „getting too comfortable” due to pharmacy managers' relatively low PEU on BP are less strong in their case. The majority of our empirical experiences made clear that Prospector SO's positive effect on BP was especially strong in case of rural pharmacies, which suggests that a consistent and proactive approach – efforts to expand the range of products and services, as well as addressing new patient segments – can be an effective answer to the „demand draining” effect of urban pharmacies and other retail units. Following the „mix” behavioural pattern of Defender/Reactor SO is not recommended within HPRDS characterised by turbulent changes and heightened competitive intensity. Our research revealed that pharmacies characterised by prevalence of Defender/Reactor SO ecountered a suboptimal BP in regard to the dimensions of both SAL and NP. According to our experiences PEU in some cases moderated the relationship between Defender/Reactor SO and BP, i.e. „getting too comfortable” due to low PEU often significantly eroded turnover and profitability. Therefore it is utterly important for Defender/Reactor pharmacies to constantly monitor changes in environmental conditions of pharmacy management and stakeholders' behaviour, and to develop conscious managerial response reactions in order to avoid further decrease in BP. Defender/Reactors should at least partially abandon their current retreating, risk-minimising business behaviour, and consciously take steps towards a more consistent SO – for instance either Prospector or Analyser. Although this means the partial abandonment of current management approach and practice „entrenched” for many years, but radical regulatory changes and level of competitive intensity experienced in the sectoral transformation condemn them to a suboptimal BP. This is especially true for rural, but also for urban pharmacies, and the negative consequences caused by the latter's inconsistent behaviour can only be compensated by more favorable conditions of demand only for ever so long.
190
Defender/Reactors' lack of a strategic turn may necessitate increasingly frequent state subventions and financial „solidarity” contributions from more succesful pharmacies, which harbors sectoral and social tension. Pharmacists, sectoral decision-makers and professional associations (e.g. HCP) should play a principal role in facilitating a consistent SO, as well as supporting the acquisition of managerial skills and competences required for this. Analysers face a serious challenge, as the turbulent changes of environmental conditions and the behaviour of the pharmaceutical supply chain's stakeholders make the consistent realisation of this SO very difficult. The fact that the prevalence of Analyser SO had no significant effect on SAL and NP proves this. In some cases a decrease in PEU lead to a lessening in Analysers' turnover, yet an increase in profitability. Thus it can be assumed that Analysers' efforts to learn about environmental conditions and predict changes of stakeholders' behaviour did not succeed in increasing turnover, although they resulted in a notable rationalisation on the side of expenses. As it is evident from above experiences, intensive environmental monitoring must not deprive resources from explicit managerial decision-making, strategic responsiveness, and the introduction of new practices. This negative phenomenon is backed by the fact that rural Analyser SOs' BP significantly fell behind from that of their urban counterparts. „Over-analysing” contingencial conditions was able to worsen Analyser pharmacies' BP especially in the countryside, which spurs pharmacies of small settlements to decisive action, expansion of the range of products and services, and addressing new patient segments based on market research. Managerial skills and competencies required for the analysis of environmental conditions from a business perspective are less developed, so it is the task of pharmacists and professional associations to play a proactive role in terminating those defiencies. Based on our dissertation’s results rural pharmacies are not condemned to a suboptimal BP. Although of course urban pharmacies characterised by a higher population and purchasing power have a higher turnover, we found no notable difference in profitability between urban and rural pharmacies. Thus with a well grounded and consciously implemented SO and consistent tending to accompanying tactical- and operative-level managerial tasks rural pharmacies can function just as profitably as their urban counterparts. Based on the results regarding PEU Prospector, Analyser and Defender/Reactor SOs each can be advised to stay constantly „alert”, and to react to turbulent and unpredictable environmental changes by a proactive approach, decisive product and market innovations and new business applications. It is expedient for pharmacies to adapt permanently uncertain industrial conditions and to take decisive management measures on their own initiative in order to achieve optimal BP in stead of waiting for external assistance. Development of micro-level managerial skills and competences is required for this, either. We found no differences of SAL or NP of pharmacies either participating or not taking part in equity-based cooperations (e.g. pharmacy chains). This has to be handled carefully, as only a few pharmacists completed our questionnaire who run several pharmacies or a member-pharmacy of a chain. Despite of this similar horizontal and vertical integration forms did not provide any clear advantages that contributed to optimal BP for the concerned pharmacies. NP of pharmacies participating in pharmacy chains even fell behind that of their peers not taking part in similar cooperations. Therefore joining such a group can not be explicitly recommended for pharmacicts. Pharmacies already participating can be advised to strive for a better coordination with sectoral stakeholders, as well as to look for the professional and

191
managerial balance between the „headquarters” and individual members. Turnover of pharmacies participating in strategic cooperations organised by wholesalers and procurement associations built from the bottom exceeded that of those who are no members of similar forms of cooperation. We however found no difference in profitability between pharmacies taking part in strategic cooperations or procurement associations and their peers not participating in similar forms of cooperation. Our result is somewhat surprising, as based on realisation of procurement discounts we expected that participating in similar forms of cooperation would rather enhance NP of pharmacies. According to our experiences participation in a strategic cooperation and/or procurement associations is not an undisputed recipe for successful pharmacy-management, either, as tending to tasks consistently complying with the SO had a more meaningful impact on what advantages the pharmacy is able to reap from its membership. Based on the participation's marginal contribution to BP, pharmacists should be advised to mobilise only limited resources and competences on the management of similar cooperations. Main criteria for a successful cooperation are the disciplined, coordinated management (e.g. in the areas of stock purchase and marketing activities), solidarity of individual members, and cancellation of opportunistic behavioural forms. Management of pharmacies' site characteristics require slightly less resources. According to our results prevalence of a consistent SO and socio-demographic characteristics have a larger impact on BP than site attributes. Although initial results from the correlation matrix between site characteristics and BP (Table XCIV) predicted a larger role of these variables, both our regression and structural analyses showed marginal contribution of site attributes. Despite of this pedestrian traffic in front of the pharmacy had a positive influence on changes of both SAL and NP, so preference of more frequented areas are still expedient in choosing site location. Also, if financial resources allow for it, it is advised to make patients aware of the pharmacy and its offerings by adequate marketing applications (billboards, decorative show-windows, flashy logo and entrance, localisation-based online marketing tools etc.), thus directing pedestrian traffic towards the pharmacy (Bitner, 1992, Bitner-Meuter, 2000). From among the socio-demographic characteristics, besides GL's role we have to emphasise total area of space. In our research larger total area of space exerted a significant positive influence on changes of both SAL and NP. Expanding the range of products and services, or addressing new patient segments can lead to an increased demand towards the pharmacy. In order to attractively showcase the continuously expanding portfolio and to serve the increased number of patients – both having a positive influence of BP – more terminals and assistants, also larger spaces are needed, so that turnover rate can be increased by minimising waiting time and without harming professional and ethical aspects (Donovan et al., 1994). Also a larger „back office” capacity is required in order to store the more diversified stockpile. 46.2. Connections between the characteristics of strategic-level management and BP We formulated strategic-level recommendations especially important for pharmacy managers regarding BP in the following structure. First, from behavioural characteristics connected to respective SOs we selected the ones that contributed to changes in pharmacies' BP in a significant way. Then, based on our regression analyses compiled from Prospector, Analyser and Defender/Reactor SOs' behavourial characteristics we named those that had a significant positive effect on SAL and NP (Tables CXXII to CXXIII). The correlation matrix found in
192
Table CXXI shows the connection of M&S’s SOs' behavourial characteristics to changes of pharmacies' SAL and NP. In order to increase turnover it is recommended for Prospector pharmacies to continuously expand their portfolio with new products and services, to influence the intensity and nature of competition between nearby pharmacies via intensive marketing activity, and also to proactively react to changes occuring in the professional, market and regulatory environments, interpreting them as opportunities at the same time. Expansion of the portfolio however must not be careless or self-serving, and Prospectors also should turn their well-considered attention towards product and service categories that are able to provide them with competitive advanteges and success. This can not only increase their SAL, but also their NP. All behavioural characteristics of Defender/Reactor SOs showed a significant negative relationship with effectiveness and profitability. This also confirms that managers of Defender/Reactor pharmacies should initiate a strategy altering process, i.e. development of a consistent behavioural adaptation pattern as soon as possible. Defender/Reactors have to paricularly avoid several BP-damaging behavioural characteristics in order to stop reduction of BP. Therefore Defender/Reactors must not „get stuck” in offering a portfolio consisting of a few conventional products, but rather should try to increase SAL and NP by introducing new product categories and pharmaceutical services. Expansion of their portfolio provides them with an opportunity to address new patient segments, which may help to reduce the negative perspectives regarding BP. The insignificant influence of the Analyser SO's behavioural characteristics on BP are also demonstrated by Table CXXI. It is evident, that according to our results pharmacies' BP is eroded by the prevalence of the theoretically most Analyser-specific behavioural aspects. Therefore Analysers also have to take steps towards Prospector-specific behavioural characteristics as much as possible, i.e. they must not be overly careful with expanding their range of products and services. To develop decisive reactions to turbulent environmental changes they have to be present with their innovations on the market of various patient segments simultaneously with Prospectors, among the first ones and as early as possible. In Table CXXII we illustrated in a linear regression analysis the effect of M&S SOs' every behavourial characteristic included in the Segev scale on SAL. Based on the results, from among the advisable management behaviour's main characteristics the following stand out (printed in grey): high quality serving of patients, introduction of product and service innovations, well-considered expansion of product and service portfolio based on potential competitive advantages and strong competitor-orientation. These are the behavioural characteristics that contribute most to the increase of pharmacies' SAL. Our regression analysis is significant, its explanatory power explained 31% of variance in SAL. Table CXXIII showcases the results of the regression analysis examining the effect of Prospector, Analyser and Defender/Reactor SOs' behavioural characteristics on NP. As discernible, the insignificant results detailed during earlier stages of our doctoral research make a new appearance here, as statements regarding the product and service portfolio's broad or narrow nature sometimes exerted a counterproductive, inconsistent effect on BP. At the same time a thoroughly considered expansion of the portfolio that was grounded on potential competitive advantages had also a notable effect on the increase of profitability. Our suggestion, that pharmacists should implement their efforts toward expansion of their product and service portfolio in a quick and decisive manner, was confirmed as well.

193
As a conclusion it can be stated that it is definitely expedient for pharmacists to take steps towards the realisation of Prospector behavioural characteristics. Constant monitoring of opportunities for expanding the range of pharmaceutical products and services, as well as timely introduction of promising novelties is advised. This does not mean pharmacies should be turned into „chandleries”, expansion is only necessary for product categories that comply with local patient needs and preferences, and the resources and competences of the pharmacy. Solutions supporting the high quality serving of patients, quick implementation of business applications, and interpretation of environmental changes as business opportunities all contribute to an increase in turnover. Another distinctive feature of successful pharmacies is their strong competitor-orientation, their willingness to continously track their competitors' supply, and even to influence with their proactive marketing activity the competitive intensity between pharmacies operating in their vicinity. Pharmacists have to realise that patients can be directed to pharmacies by continously improving the supply of products and services. In the category of OTC drugs and other products pharmacies have encountered a multitude of retail competitors, against which a retreating, defensive behaviour yields no results, and competition with other channels offering healthcare products must indeed be embraced by integrating new product categories. This requires opening of new markets, addressing new patient segments, and a positioning that consciously influence their behaviour. It is our explicit vision, that the introduction and marketing of innovations could be enhanced if offering novelties was accompanied by additional services with high added values (e.g. pharmacist’s care) and performed by skilled employees within the pharmacies, which would simultaneously help in reaching patients and maintaining their loyalty (Prahalad-Ramaswamy, 2004). 47. References Abernethy, Margareth A. – Cameron H. Guthrie (1994), An Empirical Assessment of the
Fit between Strategy and Management Information System Design, Accounting and Finance, Vol. 34, No. 2, pp. 49-66. (DOI: 10.1111/j.1467-629X.1994.tb00269.x)
Achabal, Dale D. – W. L. Gorr – Vijay Mahajan (1982), MULTILOC: A Multiple Store
Location Decision Model, Journal of Retailing, Vol. 58, No. 2, pp. 5-25. Agárdi Irma (2010), Kereskedelmi marketing és menedzsment, Akadémiai Kiadó,
Budapest Agbejule, Adebayo (2005), The Relationship between Management Accounting Systems
and Perceived Environmental Uncertainty on Managerial Performance: a Research Note, Accounting and Business Research, Vol. 35, No. 4, pp. 295-305. (DOI:10.1080/00014788.2005.9729996)
Aguiar, Antónió Hipólíto de – Francisco Batel Marques – Luis Manuel Martins (2014),
Pharmacies and the European Crisis, International Journal of Healthcare Management, Vol. 7, No. 4, pp. 251-257. (DOI: http://dx.doi.org/10.1179/2047971914Y.0000000077)
Aguilar, Francis J. (1967), Scanning and Business Environment, MacMillan, New York. (DOI: 10.1016/0024-6301(81)90148-5)

194
Ahire, S.L. – D.Y. Golhar – M.A. Walker (1995), Development and Validation of TQM Implementation Constructs, Decision Sciences, Vol. 27, No. 1, pp. 23-56.(DOI: 10.1111/j.1540-5915.1996.tb00842.x)
Akbolat, Mahmut (2009) Türk Saglik Sektöründe Miles ve Snow’un stratejik tipolojisi:
Hastaneler Üzerine bir Arastirma, Gazi Üniversitesi Iktisadi ve Idali Bilimler Dergisi, Vol. 11, No. 3, pp. 127-146.
Albaum, Gerald (1997), The Likert Scale Revisited: An Alternate Version, Journal of the
Market Research Society, Vol. 39, No. 2, pp. 331-348.
Ambler, Tim – Bruce H. Clark (2001), Marketing Performance Measurement: Evolution of Research and Practice, International Journal of Business Performance Measurement, Vol. 3, No. 2, pp. 231-244.
Anderson, C. R. – C. P. Zeithaml (1984), Stage of the Product Life Cycle, Business
Strategy, and Business Performance, Academy of Management Journal, Vol. 27, No. 1, pp. 5-24. (DOI: 10.2307/255954)
Anderson, James C. – David W. Gerbing (1982), Some Methods for Respecifying
Measurement Models to Obtain Unidimensional Construct Measurement, Journal of Marketing Research, Vol. 19, No. 4, pp. 453-460. (DOI: 10.2307/3151719)
Anderson, James C. – David W. Gerbing (1988), Structural Equation Modeling in
Practice: A Review and Recommended Two-Step Approach, Psychological Bulletin, Vol. 103, No. 5, pp. 411-423. (DOI: http://dx.doi.org/10.1037/0033-2909.103.3.411)
Andorka Rudolf (2001), Bevezetés a szociológiába, Osiris, Budapest
Andrews, Kenneth R. (1971), The Concept of Corporate Strategy, Dow Jones-Irwin,
Homewood, IL, USA. (DOI: 10.1016/0024-6301(84)90143-2) Andrews, Rhys – George A. Boyne – Riachard M. Walker (2006), Strategy Content and
Organisational Performance: An Empirical Analysis, Public Administration Review, Vol. 66, No. 1, pp. 52-63. (DOI: 10.1111/j.1540-6210.2006.00555.x)
Andrews, Rhys – George A. Boyne – Jennifer Law – Richard M. Walker (2009), Strategy,
Structure and Process in the Public Sector: A Test of the Miles and Snow Model, Public Administration, Vol. 87, No. 4, pp. 732-749.(DOI: 10.1111/j.1467-9299.2009.01760.x)
Ansoff, Igor (1957), Strategies for Diversification, Harvard Business Review, Vol. 2, No.
5, pp. 113-124. (DOI: 10.1016/0007-6813(86)90007-8)
Ansoff, Igor (1965), Corporate Strategy: An Analytic Approach to Business Policy for Growth and Expansion, McGraw-Hill, New York (DOI:10.1016/0090-2616(95)90032-2)
Antal-Mokos Zoltán (1990), A stratégia tartalma, kialakulásának folyamata és a szervezeti
struktúra, Vezetéstudomány, XXI. Évf., 2. Szám, 5-14. old.

195
Antal-Mokos Zoltán (1993) Stratégiakutatás – rigorózus vagy releváns, Vezetéstudomány, XXIV. Évf., 1-2. Szám, 99-105. old.
Antal-Mokos Zoltán – Balaton Károly – Drótos György – Tari Ernő (1992), Új
megközelítések a stratégia vizsgálatában, Vezetéstudomány, XXIII. Évf., 3. Szám, 10-21. old.
Antal-Mokos Zoltán – Balaton Károly – Drótos György – Tari Ernő (1997), Vállalati
stratégiák és stratégiai menedzsment a magyar gazdaságban, Versenyképesség Kutatások Műhelytanulmányok-Sorozat, Z22. sz. műhelytanulmány kötete, Budapesti Corvinus Egyetem, Vállalatgazdaságtan Intézet
Antalóczy Katalin (1993), Privatizációs stratégiák a gyógyszeriparban, Külgazdaság,
XXXVII. Évf., 7. Szám, 64-76. old. Antalóczy Katalin (1997), A magyar gyógyszeripar versenyképessége – adatok,
hipotézisek, töprengések, Versenyben a Világgal, Műhelytanulmány, 17. Kötet, BCE Vállalatgazdaságtan Tanszék, Budapest
Antalóczy Katalin (2001), Magyar gyógyszeripar – privatizáció után, Külgazdaság, XLV.
Évf., 2. Szám, 41-61. old. Appiah-Adu, Kwaku – Satyendra Singh (1998), Customer Orientation and Performance: A
Study of SMEs, Management Decision, Vol. 36, No. 6, pp. 385-394. (DOI: http://dx.doi.org/10.1108/00251749810223592)
Aragón-Sanchez, Antonio – Grégorio Sanchez-Marín (2005), Strategic Orientation,
Management Characteristics, and Performance: A Study of Spanish SMEs, Journal of Small Business Management, Vol. 43, No. 3, pp. 287-308. (DOI: 10.1111/j.1540-627X.2005.00138.x)
Armstrong, J. Scott – Terry S. Overton (1977), Estimating Non-Response Bias in Mail
Surveys, Journal of Marketing Research, Vol. 14, No. 3, pp. 396-402. (DOI: 10.1016/0148-2963 (92) 90036-B)
Achrol, Ravi S. – Philip Kotler (1999), Marketing in the Network Economy, Journal of
Marketing, Vol. 63, Special Issue of 1999, pp. 146-163. (DOI: http://dx.doi.org/10.2307/1252108)
Augier, Mie. – David J. Teece (2009), Dynamic Capabilities and the Role of Managers in
Business Strategy and Economic Performance, Organisation Science, Vol. 20, No. 2, pp. 410-421. (DOI: http://dx.doi.org/10.1287/orsc.1090.0424)
Babakus, Emin – Ugur Yavas – Antti Haahti, (2006), Perceived Uncertainty, Networking
and Export Performance: A Study of Nordic SMEs, European Business Review, Vol. 18, No. 1, pp. 4-13.(DOI: http://dx.doi.org/10.1108/09555340610639815)
Babbie, Earl, (1995), A társadalomtudományi kutatás gyakorlata, Balassi Kiadó,
Budapest
196
Backhaus, Klaus – Bernd Erichson – Wulff Plinke – Rolf Weiber (2008), Multivariate
Analysemethoden: Eine Anwendungsorientierte Einführung, Springer, Heidelberg-Berlin (DOI: 10.1007/978-3-8349-9937-5_8)
Badri, Masood A. – Donald Davis – Donna Davis (2000), Operations Strategy,
Environmental Uncertainty and Performance: A Path Analytic Model of Industries in Developing Countries, Omega – The International Journal of Management Science, Vol. 28, No. 3, pp. 155-173. (DOI: 10.1016/S0305-0483(99)00041-9)
Bagozzi, Richard P. (1981), Evaluating Structural Equation Models with Unobservable
Variables and Measurement Error: A Comment, Journal of Marketing Research, Vol. 18, No. 3, pp. 375-381. (DOI: 10.2307/3150979)
Bagozzi, Richard P. – Youjae Yi – Lynn W. Philips (1991), Assessing Construct Validity in
Organisational Research, Administrative Science Quarterly, Vol. 36, No. 3, pp. 421-458. (DOI: 10.1002/j.2158-1592.2008.tb00088.x)
Bagozzi, Richard P. – Youjae Yi (2012), Specification, Evaluation and Interpretation of
Structural Equation Models, Journal of the Academy of Marketing Science, Vol. 40, No. 1, pp. 8-34.(DOI: 10.1007/s11747-011-0278-x)
Bailey, Andy – Gerry Johnson – Kevin Daniels (2000), Validation of a Multidimensional
Measure of Strategy Development Processes, British Journal of Management, Vol. 11, No. 1, pp. 151-162. (DOI: 10.1111/1467-8551.t01-1-00157)
Balaton Károly (1994), Vállalati stratégiai magatartás az átmenet időszakában,
Vezetéstudomány, XXV. Évf., 9. szám, 5-17. old.
Balaton Károly (2009), Az EU csatlakozást követő változások és azok hatásai a vállalati stratégiákra, Versenyképesség Kutatások Műhelytanulmányok-Sorozat, 55. sz. műhelytanulmány, Budapesti Corvinus Egyetem, Vállalatgazdaságtan Intézet
Barakonyi Károly – Peter Lorange (1993), Stratégiai Menedzsment, Közgazdasági és Jogi
Könyvkiadó, Budapest
Barakonyi Károly (1999), Stratégiai tervezés, Nemzeti Tankönyvkiadó, Budapest
Bárd Szabolcs (2009), Marketing eszközök és technikák alkalmazhatósága a magyarországi gyógyszertárakban, Szakdolgozat, Szegedi Tudományegyetem, Gyógyszerésztudományi Kar
Barna Ildikó – Székelyi Mária (2008), Túlélőkészlet az SPSS-hez: Többváltozós elemzési
technikákról társadalomkutatók számára, Typotex, Budapest
Barney, Jay B. (1986), Strategic Factor Markets: Expectations, Luck, and Business Strategy, Management Science, Vol. 32, No. 10, pp. 1231-1241. (DOI: http://dx.doi.org/10.1287/mnsc.32.10.1231)

197
Barney, Jay B. (1991), Firm Resources and Sustained Competitive Advantage, Journal of Management, Vol. 17, No.1, pp. 99-121. (DOI: 10.1177/014920639101700108)
Baron, Reuben M. – David A. Kenny (1986), The Moderator-Mediator Variable
Distinction in Social Psychological Research: Conceptual, Strategic, and Statistical Considerations, Journal of Personality and Social Psychology, Vol. 51, No. 6, pp. 1173-1182.(DOI: http://dx.doi.org/10.1037/0022-3514.51.6.1173)
Baron, Hele (1996), Strenghts and Limitations of Ipsative Measurement, Journal of
Occupational and Organisational Psychology, Vol. 69, No. 1, pp. 49-56. (DOI: 10.1111/j.2044-8325.1996.tb00599.x)
Barrett, Diana – Susan R. Windham (1984), Hospital Boards and Adaptability to
Competitive Environments, Health Care Management Review, Vol. 9, No. 4, pp. 11-20. (DOI: 10.1177/107755878504200107)
Baruch, Yehuda – Brook C. Holton (2008), Survey Response Rate Levels and Trends in
Organisational Research, Human Relations, Vol. 61, No. 8, pp. 1139-1160. (DOI: 10.1177/0018726708094863)
Bastian, Elvin – Munawar Muchlish (2012), Perceived Environmental Uncerntainty,
Business Strategy, Performance Measurement Systems and Organisational Performance, Procedia – Social and Behavioural Sciences, Vol. 65, No. 10, pp.787-792. (DOI: 10.1016/j.sbspro.2012.11.200)
Bauer András – Berács József (2006), Marketing, Aula Kiadó, Budapest
Bauer András – Mitev Ariel (2001), Marketing a gyógyszertárban, Magyar
Gyógyszerészeti Társaság - Dictum Kiadó, Budapest
Bauer András – Mitev Ariel (2008), Eladásmenedzsment, Akadémiai Kiadó, Budapest
Baumgartner, Hans – Christian Homburg (1996), Applications of Structural Equation Modeling in Marketing and Consumer Research: A Review, International Journal of Research in Marketing, Vol. 13, No. 2, pp. 139-161. (DOI: 10.1016/0167-8116 (95) 00038-0)
Beal, Reginald M. (2000), Competing Effectively: Environmental Scanning, Competitive
Strategy and Organisational Performance in Small Manufacturing Firms, Journal of Small Business Management, Vol. 38, No. 1, pp. 27-47.
Bechor, Tamir – Seev Neumann – Moshe Zviran – Chanan Gleze (2010), A Contingency
Model for Estimating Success of Strategic Information Systems Planning, Information & Management, Vol. 47, No. 1, pp. 17-29. (DOI: 10.1016/j.im.2009.09.004)
Bednall, David – Michael J. Valos (2005), Marketing Research Performance and Strategy,
International Journal of Productivity and Performance Management, Vol. 54, No. 5-6, pp. 438-450.(DOI: http://dx.doi.org/10.1108/17410400510604575)
198
Beekun, Rafik I. – Gregory O. Ginn (1993), Business Strategy and Interorganisational Linkages within the Acute Care Hospital Industry: an Expansion of the Miles and Snow Typology, Human Relations, Vol. 46, No. 11, pp. 1291-1318. (DOI: 10.1177/001872679304601102)
Bentler, Peter M. – Douglas G. Bonett (1980), Significance Tests and Goodness of Fit
Tests in the Analysis of Covariance Structures, Psychological Bulletin, Vol. 88, No. 3, pp. 588-606. (DOI: http://dx.doi.org/10.1037/0033-2909.88.3.588)
Berács József – Graham Hooley – Kolos Krisztina (1995), Marketingstratégia
Magyarországon: A hazai vállalatok tipológiája, Vezetéstudomány, XXVI. Évf., 6. szám, 1995, 5-11. old.
Berend T. Iván – Ránki György (1976), Közép-Kelet-Európa gazdasági fejlődése a 19-20.
században, Közgazdasági és Jogi Könyvkiadó, Budapest Bergkvist, L. – John R. Rossiter (2007), The Predictive Validity of Multi-Item versus
Single-Item Measures of the Same Constructs, Journal of Marketing Research, Vol. 44, No. 2, pp. 175-184. (DOI: http://dx.doi.org/10.1509/jmkr.44.2.175)
Berry, L. Leonard (1995), Relationship Marketing of Services – Growing Interests,
Emerging Perspectives, Journal of the Academy of Marketing Science, Vol. 23, No. 4, pp. 236-245.(DOI: 10.1177/009207039502300402)
Bingham, Christopher B. – Kathleen M. Eisenhardt (2011), Rational Heuristics: The
Simple Rules that Strategists Learn from Process Experience, Strategic Management Journal, Vol. 32, No. 13, pp. 1437-1464. (DOI: 10.1002/smj.965)
Bitner, Mary Jo (1992), Servicescapes: The Impact of Physical Surroundings on
Customers and Employees, Journal of Marketing, Vol. 56, No. 2, pp. 57-71. (DOI: http://dx.doi.org/10.2307/1252042)
Bitner, Mary Jo – Matthew L. Meuter (2000), Technology Infusion in Service Encounters,
Journal of the Academy of Marketing Science, Vol. 28, No. 1, pp. 138-149. (DOI: 10.1177/0092070300281013)
Bíró Beáta Krisztina (2009), A patikaliberalizáció hatásai és következményei a magyar
gyógyszerszektorban, Szakdolgozat, BCE, Budapest Bisbe, Josep – Ricardo Malagueno (2012), Using Strategic Performance Measurement
Systems for Strategy Formulation: Does It Work in Dynamic Environments?, Management Acoounting Research, Vol. 23, No. 4, pp. 296-311. (DOI: 10.1016/j.mar.2012.05.002)
Bliss, Susan J. (2007), High-Performance Pharmacy: Coming Soon to your Health
System?, Medscape Pharmacists, Vol. 3, No. 1, pp. 1-3.
Bod Péter Ákos (2003), Gazdaságpolitika, Aula Kiadó, Budapest

199
Bódis Lászlóné (2011), Álláspont a marketingről, http://www.mgygysz.hu/hir.php?hid=1053 – letöltés ideje: 2011-06-12
Bodrogi József (2010), A magyar egészségÜgy – Társadalmi-gazdasági megfontolások és
ágazati véleménytérkép, Semmelweis Kiadó és Multimédia Stúdió, Budapest
Bodrogi József – Hankó Zoltán (2008), Sok kárt okozott a patikaliberalizáció, http://www.vg.hu/kozelet/tarsadalom/sok-kart-okozott-a-patikaliberalizacio-240904 – letöltési idő: 2011-06-12
Bodrogi József – Hankó Zoltán (2009), Ellenérdekelt gyógyszerészek,
http://www.mgyk.hu/index.php?id=20100212ellenerdekelt_gyogyszereszek_-_dr__bodrogi_jozsef_es_dr__hanko_zoltan_irasa_a_vilaggazdasagban – letöltés ideje: 2011-07-13
Bodrogi József – Torma Árpád – Hankó Zoltán (2010), Gyógyszerpiaci egyensúlyvesztés
számokban:http://www.mgyk.hu/index.php?id=20101201gyogyszerpiaci_egyensulyvesztes_szamokban – letöltési idő: 2011-03-16
Bodrogi József – Hankó Zoltán – Torma Árpád (2012), Mi lesz veletek, patikák?,
Gyógyszerészi Hírlap, XXIII. Évf., 1. Szám, 15-18. old.
Bollen, Kenneth A. (1989): Structural Equations with Latent Variables, Wiley, New York. (DOI: http://dx.doi.org/10.1037/0033-2909.110.2.305)
Bollen, Kenneth A. – Richard Lennox, (1991), Conventional Wisdom on Measurement: A
Structural Equation Perspective, Psychological Bulletin, Vol. 110, No. 2, pp. 305–314. (DOI: http://dx.doi.org/10.1037/0033-2909.110.2.305)
Bollen, Kenneth A. – K. Ting, (2000), A Tetrad Test for Causal Indicators. Psychological
Methods, Vol. 5, No. 1, pp. 3-22. (DOI: http://dx.doi.org/10.1037/1082-989X.5.1.3) Bourgeois, L. J. (1980a), Strategy and Environment: a Conceptual Integration, Academy of
Management Review, Vol. 5, No. 1, pp. 25-39. (DOI: 10.5465/AMR.1980.4288844) Bourgeois, L. J. (1980b), On the Measurement of Organisational Slack, Academy of
Management Review, Vol. 6, No. 1, pp. 29-39. (DOI: 10.5465/AMR.1981.4287985)
Bourgeois, L. J. (1985), Strategic Goals, Perceived Uncertainty, and Economic Performance in Volatile Environments, Academy of Management Journal, Vol. 28, No. 3, pp. 548-573. (DOI: 10.2307/256113)
Boyd, Brian K. – Janet Fulk (1996), Executive Scanning and Perceived Uncertainty: A
Multidimensional Model, Journal of Management, Vol. 22, No. 1, pp. 1-21. (DOI: 10.1177/014920639602200101)
Boyd, Brian K. – Katalin Takács Haynes – Michael A. Hitt – Donald D. Bergh – David J.
Ketchen Jr. (2012), Contingency Hypotheses in Strategic Management Research: Use,

200
Disuse or Misuse?, Journal of Management, Vol. 38, No. 1, pp. 278-313. (DOI: 10.1177/0149206311418662)
Boyne, George A. – Richard M. Walker (2004), Strategy Content and Public Service
Organisations, Journal of Public Administration Research and Theory, Vol. 14, No. 2, pp. 367-394. (DOI: 10.1093/jopart/muh015)
Bowman, Cliff – Véronique Ambrosini (1997), Using Single Respondents in Strategy
research, British Journal of Management, Vol. 8, No. 2, pp. 119-131. (DOI: 10.1111/1467-8551.0045)
Bowman, Cliff (2008), Generic Strategies: A Substitute for Thinking?, Ashridge Journal,
Vol. 32, No. 1, Spring, pp. 6-11. Brislin, Richard W. (1970), Back-Translation for Cross-Cultural Research, Journal of
Cross-Cultural Psychology, Vol. 1, No. 3, pp. 185-216. (DOI: 10.1177/135910457000100301)
Bromiley, Philip (2010), Research Notes and Commentaries: Looking at Prospect Theory,
Strategic Management Journal, Vol. 31, No. 13, pp. 1357-1370. (DOI: 10.1002/smj.885) Bromiley, Philip – Rau Devaki (2014), Towards a Practice-Based View of Strategy,
Strategic Management Journal, Vol. 35, No. 8, pp. 1249-1256. (DOI: 10.1002/smj.2238)
Brunk, S. E. (2003), From Theory to Practice: Applying Miles and Snow’s Ideas to Understand and Improve Firm Performance, Academy of Management Executive, Vol. 17, No. 4, pp. 105-108. (DOI: 10.5465/AME.2003.11851877)
Bryson, John M. (1995), Strategic Planning for Public and Non-profit Organisations,
Jossey-Bass, San Francisco, CA, USA
Bstieler, Ludwig (2005), The Moderating Effect of Environmental Uncertainty on New Product Development and Time Efficiency, The Journal of Product Innovation Management, Vol. 22, No. 3, pp. 267–284. (DOI: 10.1111/j.0737-6782.2005.00122.x)
Buchanan, James M. (1968), Demand and Supply of Public Goods, Rand McNally,
Chicago. (DOI: 10.1007/BF00163783) Buchko, Aaron A. (1994), Conceptualization and Measurement of Environmental
Uncertainty: An Assessment of the Miles and Snow Perceived Environmental Uncertainty Scale, Academy of Management Journal, Vol. 37, No. 2, pp. 410-425. (DOI: 10.2307/256836)
Buckley, Peter J. – Mark Casson (1976), The Future of Multinational Enterprise,
MacMillan, London. (DOI: http://dx.doi.org/10.1057/palgrave.jibs.8491021) Buckley, Peter J. – Pervez N. Ghauri (2004), Globalisation, Economic Geography and the
Strategy of Multinational Enterprises, Journal of International Business Studies, Vol. 35, No. 2, pp. 81-98. (DOI: 10.1057/palgrave.jibs.8400076)

201
Buzzell, Robert D. – Bradley T. Gale (1987), The PIMS Principles: Linking Strategy to
Performance, Free Press, New York (DOI: 10.1016/0148-2963(88)90026-4)
Byrne, Barbara M. (2001), Structural Equation Modeling with AMOS, Erlbaum, Mahwah, NJ, USA. (DOI:10.1207/S15327574IJT0101_4)
Cambell, Donald R. – Donald W. Fiske (1959), Convergent and Discriminant Validation
by the Multitrait-Multimethod Matrix, Psychological Bulletin, Vol. 56, No. 2, pp. 81-105.(DOI: http://dx.doi.org/10.1037/h0046016)
Cannon, Joseph P. – William D. Perreault Jr. (1999), Buyer-Seller Relationships in
Business Markets, Journal of Marketing Research, Vol. 36, No. 4, pp. 439-460. (DOI: 10.2307/3151999)
Carroll, Norman V. (2006), Financial Management for Pharmacists: A Decision-Making
Approach, Lippincott Williams and Wilkins, Baltimore Cervera, Amparo – Alejandro Mollá – Manuel Sanchez (2001), Antecedents and
Consequences of Market Orientation in Public Organisations, European Journal of Marketing, Vol. 35, No. 11-12, pp. 1259-1288. (DOI: http://dx.doi.org/10.1108/EUM0000000006476)
Chaganti, Radha (1987), Small Business Strategies in Different Industry Growth
Environments, Journal of Small Business Management, Vol. 25, No. 3, pp. 61-68. (DOI: 10.1016/0019-8501(91)90024-A)
Chaganti, Rajeswararao – Fariborz Damanpour (1991), Institutional Ownership, Capital
Structure and Firm Performance, Strategic Management Journal, Vol. 12, No. 7, pp. 479-491. (DOI: 10.1002/smj.4250120702)
Chakravarthy, Balaji S. (1981), Managing Coal: A Challenge in Adaptation, SUNY Press,
Albany, NY, USA (DOI: 10.5465/AMR.1982.4285396) Chakravarthy, Balaji S. (1982), Adaptation: a Promising Metaphor for Strategic
Management, Academy of Management Review, Vol. 7, No. 1, 35-44. (DOI: http://dx.doi.org/10.1108/09534819110006193)
Chakravarthy, Balaji S. (1986), Measuring Strategic Performance, Strategic Management
Journal, Vol. 7, No. 5, pp. 437-458. (DOI: 10.1002/smj.4250070505) Chakravarthy, Balaji S. (1992), Strategy Process Research: Focusing on Corporate Self-
Renewal, Strategic Management Journal, Summer Special Issue, pp. 5-14. (DOI: 10.1002/smj.4250131003)
Chandler, Alfred D. (1962), Strategy and Srtucture: Chapters in the History of American
Industrial Enterprise, MIT Press, Cambridge. (DOI: 10.1016/0148-2963(94)00060-R)

202
Chang, Sea-Jin – Arjen van Witteloostuijn – Lorraine Eden (2010), From the Editors: Common Method Variance in International Business research, Journal of International Business Studies, Vol. 41, pp. 178–184. (DOI: 10.1057/jibs.2009.88)
Chathoth, Prakash K. – Michael D. Olsen (2007), The Effect of Environment Risk,
Corporate Strategy, and Capital Structure on Firm Performance: An Empirical Investigation of Restaurant firms, Hospitality Management, Vol. 26, 502-516. (DOI: 10.1016/j.ijhm.2006.03.007)
Chatterjee, Samprit – Ali S. Hadi – B. Price (2013), Regression Analysis by Example,
Wiley, New York Chen, F. Feininan – H. K. Sousa – S. G. West (2005), Testing Measurement Invariance of
Second-Order Factor Models, Structural Equation Modelling, Vol. 12, No. 3, pp. 471-492. (DOI: 10.1207/s15328007sem1203_7)
Chen, F. Feininan – Patrick J. Curran – Kenneth A. Bollen – James Kirby – Pamela
Paxton (2009), An Empirical Evaluation of the Use of Fixed Cutoff Points in RMSEA Test Statistic in Structural Equation Models, Sociological Methods and Research, Vol. 36, No. 4, pp. 462-494. (DOI: 10.1177/0049124108314720
Chikán Attila (2006), Vállalatgazdaságtan, Aula Kiadó, Budapest Child, John (1972), Organisational Structure, Environment and Performance: the Role of
Strategic Choice, Sociology, Vol. 6, No. 1, pp. 1-22. (DOI: 10.1177/003803857200600101)
Chin W. W. – P. R. Newsted (1999), Structural Equation Modeling Analysis with Small
Samples Using Partial Least Squares, In: Statistical Strategies for Small Sample Research, Sage Publications, Thousand Oaks, CA, USA
Choe, Jong-Min (2003), The Effect on Environmental Uncertainty and Strategic
Application of IS on a Firm’s Performance, Information & Management, Vol. 40, No. 4, pp. 257-268. (DOI: 10.1016/S0378-7206(02)00008-3)
Chong, Vincent K. – Kar Ming Chong (1997), Strategic Choices, Environmental
Uncertainty and SBU Performance: A Note on the Intervening Role of Management Accounting Systems, Accounting and Business Research, Vol. 27, No. 4, pp. 268-276.(DOI: 10.1080/00014788.1997.9729553)
Christensen, Dale – Troy Trigstad – Robert Sullivan – Jennifer Garmise – Steven E.
Wegner (2004), A Pharmacy Management Intervention for Optimizing Drug therapy for Nursing Home Patients, The American Journal of Geriatric Pharmacotherapy, Vol. 2, No. 4, pp. 248-256. (DOI: 10.1016/j.amjopharm.2004.12.002)
Churchill, Gilbert Jr. (1979), A Paradigm for Developing Better Measures for Marketing
Constructs, Journal of Marketing Research, Vol. 16, No. 1, pp. 64-73. (DOI: 10.2307/3150876)

203
Clark, Christopher – Lesley White (2009), Entry Barriers in Retail Pharmacy: A Novel Model, International Journal of Pharmaceutical and Healthcare Marketing, Vol. 3, No. 3, pp. 279-293 (DOI: http://dx.doi.org/10.1108/17506120910989688)
Clausewitz, Carl von (1832), A háborúról, Magyar nyelvű kiadás (1999), Göttinger
Kiadó, Veszprém
Cohen, Jacob – Patricia Cohen – Stephen G. West – Leona S. Aiken (2013), Applied Multiple Regression and Correalation Analysis for Behavioural Sciences, Lawrence Erlbaum Associates, Hillsdale, NJ, USA
Collier, J. E. – C. C. Bienstock (2009), Model Misspecification: Contrasting Formative
and Reflective Indicators For a Model of E-Service Quality, Journal of Marketing Theory and Practice, Vol. 17, No. 3, pp. 283-293. (DOI: 10.2753/MTP1069-6679170306)
Coltman, T. – T. M. Devinney – D. F. Midgley – S. Venaik (2008), Formative versus
Reflective Measurement Models: Two Applications of Formative Measurement, Journal of Business Research, Vol. 61, No. 12, pp. 1250-1262. (DOI: 10.1016/j.jbusres.2008.01.013)
Conant, Jeffrey S. – Michael P. Mokwa – P. Rajan Varadarajan (1990), Strategic Types,
Distinctive Marketing Competencies and Organisational Performance: a Multiple Measures-Based Study, Strategic Management Journal, Vol. 11, No. 9, pp. 365-384. (DOI: 10.1002/smj.4250110504)
Conant, Jeffrey S. – Denise T. Smart – Roberto Solano-Mendez (1993), Generic Retailing
Types, Distinctive Marketing Competencies and Competitive Advantage, Journal of Retailing, Vol. 69, No. 3, pp. 254-279. (DOI: 10.1016/0022-4359 (93) 90008-7)
Cool, Karel. – Dan Schendel (1988), Performance Differences among Strategic Group
Members, Strategic Management Journal, Vol. 9, No.2, pp. 207-223. (DOI: 10.1002/smj.4250090302)
Cronbach, Lee Joseph (1951), Coefficient Alpha and the Internal Structure of Tests,
Psychometrika, Vol. 16, No. 3, pp. 297-334. (DOI: 10.1007/BF02310555)
Cronbach, Lee Joseph (1955), Construct Validity in Psychological Tests, Psychological Bulletin, Vol. 52, pp. 281-302. (DOI: http://dx.doi.org/10.1037/h0040957)
Cronbach, Lee Joseph (1987), Statistical Tests for Moderator Variables: Flaws in Analyses
Recently Proposed, Psychological Bulletin, Vol. 102, No. 3, pp. 414-417. (DOI: http://dx.doi.org/10.1037/0033-2909.102.3.414)
Croteau, Anne-Marie – L. Raymond – Francois Bergeron (1999), Testing the Validity of
Miles and Snow’s Typology, Academy of Information and Management Sciences Journal, Vol. 2, No. 2, pp. 1-7.
Croteau, Anne-Marie – Francois Bergeron (2001), An Information Technology Trilogy:
Business Strategy, Technological Deployment and Organisational Performnce, Journal of
204
Strategic Informations Systems, Vol. 10, No. 2, pp. 77-99. (DOI: 10.1016/S0963-8687(01)00044-0)
Cullis, John – Philip Jones (1998), Public Finance and Public Choice, Oxford University
Press, Oxford, UK. (DOI: 10.1016/S1574-0064(00)80036-0) Cunningham, William A. – Kristopher J. Preacher – Mahzarin R. Banaji (2001), Implicit
Attitude Measures: Consistency, Stability and Convergent Validity, Psychological Science, Vol. 12, No. 2, pp. 163-170. (DOI: 10.1111/1467-9280.00328)
Cyert, Richard M. – James G. March (1963), A Behavioural Theory of the Firm, Prentice
Hall, Englewood Cliffs. (DOI: 10.1016/0167-2681(88)90004-2)
Csepeti Ádám (2010), A Miles és Snow-féle stratégiai tipológia kutatási kérdései, Vezetéstudomány, XLI. Évf., 11. Szám, 15-30. old.
Csepeti Ádám (2014a), A gyógyszertárak gazdálkodásáról – I. rész, Gyógyszerészi Hírlap,
XXV. Évf., 1. Szám, 16-19. old. Csepeti Ádám (2014b), A gyógyszertárak gazdálkodásáról – II. rész, Gyógyszerészi
Hírlap, XXV. Évf., 2. Szám, 12-16. old. D’Aveni, Richard A. – Giovanni Battista Dagnino – Ken G. Smith (2010), The Age of
Temporary Advantage, Strategic Management Journal, Vol. 31, No. 13, pp. 1371-1385. (DOI: 10.1002/smj.897)
Daft, Richard L. – Juhani Sormunen – Don Parks (1988), Chief Executive Scanning,
Environmental Characteristics, and Company Performance: An Empirical Study, Strategic Management Journal, Vol. 9, No. 2, pp. 123-139. (DOI: 10.1002/smj.4250090204)
Dankó Dávid – Molnár Márk Péter (2011), Gyógyszertámogatás, rendszerek, eszközök,
perspektívák, Medicina Könyvkiadó Rt., Budapest Dankó Dávid (2012), Erőforrás-menedzsment egy hosszú megtérülési idejű iparágban – A
hatékonyság fokozása a gyógyszerek értéklánca mentén, Doktori Értekezés, BCE Gazdálkodástani Doktori Iskola, Budapest
Datta, Deepak K. – Xin Liang – Martina Musteen (2009), Strategic Orientation and the
Choice of Foreign Market Entry Mode: An Empirical Examination, Management International Review, Vol. 49, No. 3, pp. 269-290. (DOI: 10.1007/s11575-009-0143-z)
David, H.A. – Jason L. Gunnink (1997), The Paired t Test under Artificial Pairing, The
American Statistician, Vol. 51, No. 1, pp. 9-12. (DOI: 10.1080/00031305.1997.10473578) Davies, Howard – Peter Walters (2004), Emerging Patterns of Strategy, Environment in a
Transition Economy, Strategic Management Journal, Vol. 25, No. 4, pp. 347-364. (DOI: 10.1002/smj.380)

205
Davig, William (1986), Business Strategies in Smaller Manufacturing Firms, Journal of Small Business Management, Vol. 24, No. 1, pp. 38-46.
Davis, Jullet A. – Diane Brannon – Jacqueline Zinn – Vincent Mor (2001), Strategy,
Structure and Performance in Nursing Facilities, Advances in Healthcare Management, Vol. 2, No. 2, pp. 291-314.
Day George S. (1992), Marketing’s Contribution to the Strategy Dialogue, Journal of the
Academy of Marketing Science, Vol. 20, No. 4, pp. 323-329. (DOI: 10.1007/BF02725208)
Day, George S. (1994), The Capabilities of Market Driven Organisations, Journal of Marketing, Vol. 58, No. 4, pp. 37-52. (DOI: http://dx.doi.org/10.2307/1251915)
Day, George S. – Liam Fahey (1988), Valuing Market Strategies, Journal of Marketing,
Vol. 52, No. 3, pp. 45-57. (DOI: http://dx.doi.org/10.2307/1251449) De Vaus, David (2002), Surveys in Social Research, Fifth Edition, Routledge, London Demerouti, Evangelia – Arnold B. Bakker – Ioanna Vardakou – Aristotelis Kantas (2003),
The Convergent Validity of Two Burnout Instruments: A Multitrait-Multimethod Analysis, European Journal of Psychological Assessment, Vol. 19, No. 1, pp. 12-23. (DOI: http://dx.doi.org/10.1027//1015-5759.19.1.12)
DeSarbo, Wayne S. – C. Anthony Di Benedetto – Michael Song – Indrajit Sinha (2005),
Revisiting the Miles and Snow Strategic Framework: Uncovering Interrelationships between Strategic Types, Capabilities, Environmental Uncertainty and Firm Performance, Strategic Management Journal, Vol. 26, No. 1, pp. 47-74. (DOI: 10.1002/smj.431)
DeSarbo, Wayne S. – C. Anthony Di Benedetto – Kamel Jedidi – Michael Song (2006),
Identifying Sources of Heterogeneity for Empirically Deriving Strategic Types: A Constrained Finite-Mixture Structural-Equation Methodology, Management Science, Vol. 52, No. 6, pp. 909-924. (DOI: http://dx.doi.org/10.1287/mnsc.1060.0529)
DeSarbo, Wayne S. – Rajdeep Grewal (2008), Hybrid Strategic Groups, Strategic
Management Journal, Vol. 29, No. 2, pp. 69-87. (DOI: 10.1002/smj.658)
DeSarbo, Wayne S. – Rajdeep Grewal – Rui Wang (2009), Dynamic Strategic Groups: Deriving Spatial Evolutionary Path, Strategic Management Journal, Vol. 30, Iss. 13, pp. 1420-1439. (DOI: 10.1002/smj.788)
Dess, Gregory G. – Abdul M. A. Rasheed (1991), Conceptualising and Measuring
Organisational Environments: A Critique and Suggestions. Journal of Management, Vol. 17, No. 4, pp. 701-710. (DOI: 10.1177/014920639101700404)
Dess, Gregory G. – Stephanie Newport – Abdul M. A. Rasheed (1993), Configuration
Research in Strategic Management: Key Issues and Suggestions, Journal of Management, pp. 775-795. (DOI: 10.1177/014920639301900403)

206
Desselle, Shane P. – David P. Zgarrick (2004), Pharmacy Management: Essentials for All Practice Settings, McGraw-Hill Professional, New York
Dickson, Pat H. – Mark K. Weaver (1997), Environmental Determinants and Individual-
Level Moderators of Alliance Use, The Academy of Management Journal, Vol. 40, No. 2, Special Research Forum on Alliances and Networks, pp. 404-425. (DOI: 10.2307/256888)
Diamantopoulos, Adamantios – Heide W. Winkelhofer (2001), Index Construction with
Formative Indicators: An Alternative to Scale Development, Journal of Marketing Research, Vol. 38, pp. 269 – 277.(DOI: http://dx.doi.org/10.1509/jmkr.38.2.269.18845)
Diamantopoulos, Adamantios – J. A. Siguaw (2006), Formative Versus Reflective
Indicators in Organisational Measure Development: A Comparison and Empirical Illustration. British Journal of Management, Vol. 17, No. 4, pp. 262-282. (DOI: 10.1111/j.1467-8551.2006.00500.x)
Diamantopoulos, Adamantios, P. Riefler – K.P. Roth (2008), Advancing Formative
Measurement Models, Journal of Business Research, Vol. 61, No. 12, pp. 1203-1218. (DOI: 10.1016/j.jbusres.2008.01.009)
Di Benedetto, Anthony C. – Michael Song (2003), The Relationship between Strategic
Type and Firm Capabilities in Chinese Firms, International Marketing Review, Vol. 20, No. 5, pp. 514-533.(DOI: http://dx.doi.org/10.1108/02651330310498762)
Diffenbach, John (1983), Corporate Environmental Analysis in Large US Corporations,
Long Range Planning, Vol. 16, No. 3, pp. 109-113. (DOI: 10.1016/0024-6301(83)90037-7)
Dillman, Don A. (1978), Mail and Telephone Surveys: The Total Design Method, John
Wiley and Sons, New York. (DOI: 10.1016/S0022-4359(99)80092-X)
Dollinger, Marc J. – Peggy A. Golden (1992), Inter-Organisational and Collective Strategies in Small Firms: Environmental Effects and Performance, Journal of Management, Vol. 18, No. pp. 695-715. (DOI: 10.1177/014920639201800406)
Donaldson, Lex (1996), The Normal Science of Structural Contingency Theory In. Clegg-
Hardy-Nord (Ed.) (1996) Handbook of Organisation Studies, Sage, London
Donovan, Robert J. – John Rossiter – Gilian Marcoolyn – Andrew Nesdale (1994), Store Atmosphere and Purchasing Behaviour, Journal of Retailing, Vol. 70, No. 3, pp. 283-294. (DOI: 10.1016/0022-4359(94)90037-X)
Doty, D. Harold – William H. Glick (1994), Typologies as a Unique Form of Theory
Building: Toward Improved Understanding and Modelling, Academy of Management Review, Vol. 19, No. 2, pp. 230-251. (DOI: 10.5465/AMR.1994.9410210748)
Doty, D. Harold – William H. Glick – George P. Huber (1993), Fit, Equifinality, and
Organisational Effectiveness: A Test of Two Configurational Theories, The Academy of Management Journal, Vol. 36, No. 6, pp. 1196-1250. (DOI: 10.2307/256810)

207
Doty, Harold D. – Mousumi Bhattacharya – Kathleen K. Wheatley – Kathleen M.
Sutcliffe (2006), Divergence between Informant and Archival Measures of the Environment: Real Differences, Artifact or Perceptual error?, Journal of Business Research, Vol. 59, No. pp. 268-277. (DOI: 10.1016/j.jbusres.2005.04.005)
Douglas, Conrad – William L. Dowling (1990), Verical Integration in Health Services:
Theory and Managerial Implications, Health Care Management Review, Vol. 15, No. 4, pp. 5-85.
Downey, Kirk H. – Don Hellriegel – John. W. Slocum Jr. (1975), Environmental
Uncertainty: The Construct and its Application, Administrative Science Quarterly, Vol. 20, No. 4, pp. 613-629.
Doyle, Peter (2002), Értékvezérelt Marketing, Panem Kiadó, Budapest
Dranove, David – Margareth Peteraf – Mark Shanley (1998), Do Strategic Groups Exist?
An Economic Framework for Analysis, Strategic Management Journal, Vol. 19, No. 11, pp. 1029-1044. (DOI: 10.1002/(SICI)1097-0266(1998110)19:11<1029::AID-SMJ992>)
Drazin, Robert – Andrew H. Van de Ven (1985), Alternative Forms of Fit in Contingency
Theory, Administrative Science Quarterly, Vol. 30, No.4, pp. 514-539. (DOI: 10.1002/j.2158-1592.2007.tb00060.x)
Droege, Scott B. – Matthew R. Marvel (2009), Perceived Strategic Uncertainty and
Strategy Formation in Emerging Markets, Journal of Small Business Strategy, Vol. 20, No. 2, pp. 43-60.
Dröge, Cornelia – Roger Calantone (1996), New Product Strategy, Structure and
Performance in two Environments, Industrial Marketing Management, Vol. 25, No. 6, 555-566. (DOI: 10.1016/S0019-8501(96)00064-8)
Drucker, Peter Ferdinand (1985), Innovation and Entrepreneurship, Harper and Row, New
York Drummey, G. L. (1984), Traditional Methods for Sales Forecasting, In Davies, R. L. –
David. S. Rogers (1984), Store Location and Store Assessment Research, John Wiley and Sons, New York
Duncan, Robert B. (1972), Characteristics of Organisational Environments and Perceived
Environmental Uncertainty, Administrative Science Quarterly, Vol. 17, No. 3, pp. 313-327.
Dunning, John H. (1988), The Eclectic Paradigm of International Production: A
Restatement and Some Possible Extensions, Journal of International Business Studies, Vol. 19, No. 1, pp. 1-31. (DOI: 10.1057/palgrave.jibs.8490372)
208
Dunning, John H. (1998), Location and the Multinational Enterprise: A Neglected Factor?, Journal of International Business Studies, Vol. 29, No. 1, pp. 45-66. (DOI: 10.1057/palgrave.jibs.8490024)
Dvir, Dov – Eli Segev – Aaron J. Shenhar (1993), Technology’s Varying Impact on the
Success of Strategic Business Units within the Miles and Snow Typology, Strategic Management Journal, Vol. 14, No. 2, pp. 155-161. (DOI: 10.1002/smj.4250140206)
Dye, Ronald A. (2004), Strategy Selection and Performance Measurement Choice When
Profit Drivers are Uncertain, Management Science, Vol. 50, No. 12, pp. 1624-1637. (DOI: http://dx.doi.org/10.1287/mnsc.1030.0160)
Dyer, Barbara – X. Michael Song (1997), The Impact of Strategy on Conflict: a Cross-
National Comparative Study of U.S. and Japanese Firms, Journal of Business Studies, Vol. 27, No.3, pp. 467-493. (DOI: 10.1057/palgrave.jibs.8490108)
Evans, Jocelyn D. – Corliss L. Green (2000), Marketing Strategy, Constituent Influence
and Resource Allocation: An Application of the Miles and Snow Typology to Closely Held Firms in Chapter 11 Bankruptcy, Journal of Business Research, Vol. 50, No. 4, pp. 225-231. (DOI: 10.1016/S0148-2963(99)00036-3)
Ensley, Michael D. – Craig L. Pearce – Keith M. Hmieleski (2006), The Moderating
Effect of Environmental Dynamism on the Relationship between Entrepreneur Leadership Behaviour and New Venture Performance, Journal of Business Venturing, Vol. 21, No. 3, pp. 243–263. (DOI: 10.1016/j.jbusvent.2005.04.006)
Farrell, Andrew M. (2010), Insufficient Discriminant Validity: A Comment on Bove,
Pervan, Beatty and Shiu, Journal of Business Research, Vol. 63, No. 3, pp. 324-327. (DOI: 10.1016/j.jbusres.2009.05.003)
Fayerweather, John (1981), Four Winning Strategies for the International Corporation, The
Journal of Business Strategy, Vol. 2, No. 2. pp. 25-36. (DOI: http://dx.doi.org/10.1108/eb038933)
Feletto, E. – L. K. Wilson – A. S. Roberts – S. I. Benrimoj (2010), Flexibility in
Community Pharmacy: A Qualitative Study of Business Models and Cognitive Services, Pharmacy World and Science, Vol. 32, No. 2, pp. 130-138. (DOI: 10.1007/s11096-009-9355-3)
Feller Antal (2010), A magyarországi gyógyszertárak marketingtevékenysége, Corvinus
School of Management, MBA diplomamunka Fiegenbaum, Avi – Howard Thomas (1995), Strategic Groups as Reference Groups:
Theory, Modelling and Empirical Examination of Industry and Competitive Strategy, Strategic Management Journal, Vol. 16, No. 6, pp. 461-476. (DOI: 10.1002/smj.4250160605)

209
Floyd S. – R. Woolridge (1992), Middle Management Involvement in Strategy and its Associations with Strategy Type, Strategic Management Journal, Vol. 13, Summer Special Issue, pp. 153-167. (DOI: 10.1002/smj.4250131012)
Fornell, Claes – David G. Larcker (1981), Evaluating Structural Equation Models with
Unobservable Variables and Measurement Error, Journal of Marketing Research, Vol. 18, No. 1, pp. 39-50. (DOI: 10.2307/3151312)
Forte, Monique – James J. Hoffmann – Bruce T. Lamont – Erich N. Brockmann (2000),
Organisational Form and Environment: An Analysis of Between-form and Within-form Responses to Environmental Change, Strategic Management Journal, Vol. 21, No. 7, pp. 753-773. (DOI: 10.1002/1097-0266(200007))
Fortune (2014), List of Global Top 500 Companies, http://fortune.com/global500/toyota-
motor-9/ - letöltés ideje: 2015-01-25
Fox-Wolfgramm, Susan J. – Kimberly B. Boal – James G. Hunt (1998), Organisational Adaptation to Institutional Change: A Comparative Study of First-Order Change in Prospector and Defender Banks, Administrative Science Quarterly, Vol. 43, No. 1, pp. 87-126.
Fredrickson, James W. – Terrence R. Mitchell (1984), Strategic Decision Processes:
Comprehensiveness and Performance in an Industry with an Unstable Environment, Academy of Management Journal, Vol. 27, No. 2, pp. 399-423. (DOI: 10.2307/255932)
Freel, Mark S. (2005), Perceived Environmental Uncertainty and Innovation in Small
Firms, Small Business Economics, Vol. 25, No. 1, pp. 49-64. (DOI:10.1007/s11187-005-4257-9)
Frishammar, Johan (2006), Organisational Environment Revisited: A Conceptual Review
and Integration, International Studies of Management and Organisation, Vol. 36, No. 3, pp. 22-49.
Füstös László – Kovács Erzsébet – Meszéna György – Simonné Mosolygó Nóra (2004),
Alakfelismerés: Sokváltozós statisztikai módszerek, Új Mandátum Kiadó, Budapest
Gailbraith, Jay R. – Robert K. Kazanjian (1986), Strategy Implementation: Structure, Systems and Process, West Publishing, St. Paul, MN.
Gallai Sándor – Török Gábor (Szerk.) (2005), Politika és politikatudomány, Aula Kiadó,
Budapest Garrigós-Simón, Fernando J. – Daniel Palacios Marqués – Yeamduan Narangajavana
(2005), Competitive Strategies and Performance in Spanish Hospitality Firms, International Journal of Contemporary Hospitality Management, Vol. 17 No. 1, pp. 22 – 38. (DOI: http://dx.doi.org/10.1108/09596110510577653)
Garson, David G. (2006), Hierarchical Linear Modelling: Guide and Applications, Sage
Publications, Thousand Oaks, CA, USA

210
Gatignon, Hubert – Jean-Marc Xuereb (1997), Strategic Orientation of the Firm and New
Product Performance, Journal of Marketing Research, Vol. 34, No. 1, pp. 77-90. (DOI: 10.2307/3152066)
Gefen, David – Detmar W. Straub – Marie Claude Boudreau (2000), Structural Equation
Modeling and Regression: Guidelines for Research Practice, Communications of the Association for Information Systems, Vol. 4, No. 7, pp. 1-77.
Ghobadian, Abby – Philip James – Jonathan Liu – Howard Viney (1998), Evaluating the
Applicability of the Miles and Snow Typology in a Regulated Public Utility Environment, British Journal of Management, Vol. 9, Issue Supplement, September, pp. 71-83. (DOI: 10.1111/1467-8551.9.s1.7)
Ghobadian, Abby – Nicholas O’Reagan (2005), Innovation in SMEs: The Impact of
Strategic Orientation and Environmental Perceptions, International Journal of Productivity and Performance Management, Vol. 54, Iss. 2, pp. 81-97. (DOI: http://dx.doi.org/10.1108/17410400510576595)
Ghobadian, Abby – Nicholas O’Reagan (2006a), Perceptions of Generic Strategies of
Small and Medium Sized Engineering and Electronics Manufacturers in the UK: The Applicability of the Miles and Snow Typology, Journal of Manufacturing Technology Management, Vol. 17, No. 5, pp. 603-620. (DOI: http://dx.doi.org/10.1108/17410380610668540)
Ghobadian, Abby – Nicholas O’Reagan (2006b), The Impact of Ownership on Small Firm
Behaviour and Performance, International Small Business Journal, Vol. 24, No. 6, pp. 555-586. (DOI: 10.1177/0266242606069267)
Ghosh, Avijit (1986), The Value of a Mall and Other Insights from a Revised Central
Place Model, Journal of Retailing, Vol. 62, No. 1, pp. 79-97. (DOI: 10.1016/S0022-4359(99)80091-8)
Ghosh, Avijit – Sara L. McLafferty (1987), Location Strategies for Retail and Service
Firms, Lexington Books, Lexington, MA, USA. (DOI: 10.1111/j.1467-9787.1989.tb01226.x)
Ghychy, Tiha von – Christopher Bassford – Bolko von Oetinger (2001), Clausewitz on
Strategy – Inspiration and Insight from a Master Strategist, Wiley, New York
Gibbons, P.T. – T. O’Connor (2005), Influences on Strategic Planning Processes among Irish SME’s, Journal of Small Business Management, Vol. 43, No. 2, pp. 170-186. (DOI: 10.1111/j.1540-627x.2005.00132.x)
Gill, Liz – Anu Helkkula – Nicola Cobelli – Lesley White (2010), How Do Customers and
Pharmacists Experience Generic Substitution, International Journal of Healthcare and Pharmaceutical Marketing, Vol. 4, No. 4, pp. 375-395. (DOI: http://dx.doi.org/10.1108/17506121011095218)

211
Gimenez, Fernando A.P. (2000), The Benefits of a Coherent Strategy for Innovation and Corporate Change: a Study Applying Miles and Snow’s Model in the Context of Small Firms, Creativity and Innovation Management, Vol. 9, Iss. 4, pp. 235-244. (DOI: 10.1111/1467-8691.00197)
Glueck, William F. (1976), Business Policy: Strategy Formation and Management Action,
The McGraw-Hill Company, New York. (DOI: 10.1016/0024-6301(81)90104-7)
Golden, B.R. (1992), SBU Strategy and Performance: The Moderating Effect of the Corporate-SBU relationship, Strategic Management Journal, Vol. 13, No. 2, pp. 145-158. (DOI: 10.1002/smj.4250130206)
Goldstein, Susan Meyer – Peter T. Ward – G. Keong Leong – Timothy W. Butler (2002),
The Effect of Location, Strategy and Operations Technology on Hospital Performance, Journal of Operations Management, Vol. 20, No. 1, pp. 63-75. (DOI: 10.1016/S0272-6963(01)00081-X)
Goll, Irene – Abdul M.A. Rasheed (1997), Rational Decision-Making and Firm
Performance: The Moderating Role of the Environment, Strategic Management Journal, Vol. 18, No. 7, pp. 583-591. (DOI: 10.1002/(SICI)1097-0266(199708))
Gotteland, David – Jean-Marie Boulé (2006), The Market Orientation-New Product
Performance Relationship: Redefining the Moderating Role of Environmental Conditions, International Journal of Research in Marketing, Vol. 23, pp. 171–185. (DOI: 10.1016/j.ijresmar.2005.08.001)
Govindarajan, V. – J. Fisher (1990), Strategy, Control Systems and Resource Sharing:
Effects on Business Unit Performance, Academy of Management Journal, Vol. 33, No. 2, pp. 259-285. (DOI: 10.2307/256325)
Grabarits István (2006), Kitekintés a kis magyar patikaliberalizációra, Gyógyszerészi
Hírlap, XVII. Évf., 12. Szám, 8-9. old. Graham, J. M. (2006), Congeneric and (Essentially) Tau-equivalent Estimates of Score
Reliability, Educational and Psychological Measurement, Vol. 66. No. 6. pp. 930-944. (DOI: 10.1177/0013164406288165)
Grant, Robert M. (1996), Toward a Knowledge-Based Theory of the Firm, Strategic
Management Journal, Vol. 17, Winter Special Issue, pp. 109-122. (DOI: 10.1002/smj.4250171110)
Gray, Brendan J. – Gordon E. Greenley – Sheelagh M. Matear – Philip K. Matheson
(1999), Thriving on Turbulence, Journal of Market Focused Management, Vol. 4, No. 3, pp. 231-257. (DOI: 10.1023/A:1009827103329)
Groves, Robert M. – Don A. Dillmann – John L. Eltinge – Roderick J.A. Little (2001),
Survey Nonresponse, Wiley-Interscience, New York
212
Gummesson, Evert (2002), Total Relationship Marketing, Butterworth-Heinemann, Oxford. (DOI: http://dx.doi.org/10.1108/08858620310492365)
Gupta, A.K. – V. Govindarajan (1984), Business Unit Strategy, Managerial
Characteristics, and Business Unit Effectiveness at Strategy Implementation, Academy of Management Journal, Vol. 27, No. 1, pp. 25-41. (DOI: 10.2307/255955)
Gwet, Kilem L. (2014), Handbook of Inter-Rater Reliability, STATAXIS, Gaithersburg,
USA
Hage, Jerald. – Michael Aiken (1967), Relationship of Centralization to Other Structural Properties, Administrative Science Quarterly, Vol. 12, No. 1, pp. 72-93.
Hair, Joseph F. Jr. – William C. Black – Barry J. Babin – Rolph E. Anderson (2010),
Multivariate Data Analysis, Pearson Education Ltd., Upper Saddle River, NJ, USA Hair, Joseph F. Jr. – Marko Sarstedt – Torsten M. Pieper – Christian M. Ringle (2012),
The Use of Partial Least Squares Structural Equation Modeling in Strategic Management Research: A Review of Past Practices and Recommendations for Future Applications, Long Range Planning, Vol. 45, No. 5, pp. 320-340. (DOI: 10.1016/j.lrp.2012.09.008)
Hambrick, Donald C. (1980), Operationalizing the Concept of Business-Level Strategy in
Research, Academy of Management Review, Vol. 5, No. 4, pp. 567-575. (DOI: 10.5465/AMR.1980.4288961)
Hambrick, Donald C. (1981), Strategic Awareness within Top Management Teams,
Strategic Management Journal, Vol. 2, No. 3, pp. 263-279. (DOI: 10.1002/smj.4250020305)
Hambrick, Donald C. (1982), Environmental Scanning and Organisational Strategy,
Strategic Management Journal, Vol. 3, No. 2, pp. 159-174. (DOI: 10.1002/smj.4250030207)
Hambrick, Donald C. (1983a), Some Tests of the Effectiveness and Functional Attributes
of Miles and Snow’s Strategic Types, Academy of Management Journal, Vol. 26, No. 1, pp. 5-26. (DOI: 10.2307/256132)
Hambrick, Donald C. (1983b), High Profit Strategies in Mature Capital Goods Industries:
a Contingency Approach, Academy of Management Journal, Vol. 26, No. 4, pp. 687-707. (DOI: 10.2307/255916)
Hambrick, Donald C. – James W. Fredrickson (2001) Are You Sure You Have a Strategy?
Academy of Management Executive, Vol. 15, No. 2, pp. 48-59. (DOI: 10.5465/AME.2001.5897655)
Hambrick, Donald C. (2003), On The Staying Power of Defenders, Analysers, and
Prospectors, Academy of Management Executive, Vol. 17, No. 4, pp. 115-118. (DOI: 10.5465/AME.2003.11851883)
213
Hamel, Gary (2009), Moon Shots for Management, Harvard Business Review, Vol. 87, No. 2, pp. 91-98.
Hamel, Gary – C. K. Prahalad (1989), Strategic Intent, Harvard Business Review, Vol. 67,
No. 3, pp. 63-77.
Hamel, Gary – C. K. Prahalad (1990), The Core Competence of the Corporation, Harvard Business Review, Vol. 68, No. 3, pp. 79-93.
Hamilton, John (2009), Building a Targeted Pharmacy-Customer Engagement Approach,
International Journal of Pharmaceutical and Healthcare Marketing, Vol. 3, No. 4, pp. 381-396. (DOI: http://dx.doi.org/10.1108/17506120911006065)
Hankó Zoltán (Szerk.) (1996), A gyógyszertárvezetés szakmai, jogi és számviteli alapjai,
Magángyógyszerészek Országos Szövetsége, Kecskemét Hankó Zoltán (2012a), Módosulnak a gyógyszerellátás szabályai, Gyógyszerészi Hírlap,
XXIII. Évf., 1. Szám, 8-9. old. Hankó Zoltán (2012b), Szolgáltatás, Szakértelem…, Gyógyszerészi Hírlap, XXIII. Évf., 9.
Szám, 8-10. old. Hankó Zoltán (2013), A létszámszabályozásról, Gyógyszerészi Hírlap, XXIV. Évf., 5.
Szám, 7-8. old. Hankó Zoltán – Zalai Károly (2012a), A gyógyszertárak helyzetéről és a kamara
szakmapoltikai céljairól, Gyógyszerészi Hírlap, XXIII. Évf., 5. Szám, 8-9. old. Hankó Zoltán – Zalai Károly (2012b), Téma az árrés-átcsoportosítás, Gyógyszerészi
Hírlap, XXIII. Évf., 9. Szám, 10-11. old. Hankó Zoltán – Torma Árpád – Sohajda Attila (2013), Hogyan tovább patikák?,
Gyógyszerészi Hírlap, XXIV. Évf., 3. Szám, 5-8. old. Hankó Zoltán – Nagy Vilmos – Sohajda Attila – Torma Árpád (2014), Kilábalás a
válságból?, Gyógyszerészi Hírlap, XXV. Évf., 1. Szám, 10-16. old. Harris, Dawn – Jon I. Martinez – John L. Ward (1994), Is Strategy Different for the
Family-Owned Business?, Family Business Review, Vol. 7, No. 2, pp. 159-174. (DOI: 10.1111/j.1741-6248.1994.00159.x)
Harrison, Donald L. (2005), Strategic Planning by Independent Community Pharmacies,
Journal of the American Pharmacists Association, Vol. 45, No. 6, pp. 726-733. (DOI: 10.1331/154434505774909652)
Hart, Stuart (1994), How Strategy Making Process Can Make a Difference, Strategic
Management Journal, Vol. 15, No. 3, pp. 251-269. (DOI: 10.1002/smj.4250150402)
214
Hawes, Jon M. – William F. Crittenden (1984), A Taxonomy of Competitive Retailing Strategies, Strategic Management Journal, Vol.5, No. 3, pp. 275-287. (DOI: 10.1002/smj.4250050307)
Head, John G. (1974), Public Goods and Public Welfare, Duke University Press, Durham Heeler, Roger M. – Michael L. Ray (1972), Measure Validation in Marketing, Journal of
Marketing Research, Vol. 9, No. 4, pp. 361-370. (DOI: 10.2307/3149297) Helmig, Bernd – Vera Hinz – Stefan Ingerfurth (2014), Extending Miles and Snow
Strategic Choice Typology to the German Hospital Sector, Health Policy, Vol. 118, No. 3, pp. 363-376. (DOI: 10.1016/j.healthpol.2014.06.006)
Helmons, Peter J. – Jos G. W. Kosterink – Charles E. Daniels (2014), Formulary
Compliance and Pharmacy Labor Costs Associated with Systematic Formulary Management Strategy, American Journal of Health Systems-Pharmacists, Vol. 71, No. 3, pp. 407-415. (DOI: 10.2146/ajhp130219)
Henseler, J. (2009), Structural Equation Modeling Using PLS Path Modeling, Handbook
of Doctoral Seminar, CUB, Budapest, 4/5 June, 2009 Henseler, Jörg – Christian Ringle (2010), Structural Equation Modeling Using PLS Path
Modeling, Handbook of Doctoral Seminar, CUB, Budapest, 21/22 June, 2010 Hindle, Kevin – Neil Cutting (2002), Can Applied Entrepreneurship Education Enhance
Job Satisfaction and Financial Performance? An Empirical Investigation in the Australian Pharmacy Profession, Journal of Small Business Management, Vol. 40, No. 2, pp. 154-161. (DOI: 10.1111/1540-627X.00048)
Hitt, Michael A. – R. Duane Ireland – K.A. Palia (1982), Industrial Firms’ Grand Strategy
and Functional Importance: Moderating Effects of Technology and Uncertainty, The Academy of Management Journal, Vol. 25, No. 2, pp. 265-298. (DOI 10.2307/255990)
Ho, Robert (2006), Handbook of Univariate and Multivariate Data Analysis and
Interpretation with SPSS, Taylor and Francis Group, Boca Routon, FL, USA Hodgkinson, Gerard P. – Mark P. Healey (2011), Psychological Foundations of Dynamic
Capabilities: Reflexion and Reflection in Strategic Management, Strategic Management Journal, Vol. 32, No. 13, pp. 1500-1516. (DOI: 10.1002/smj.964)
Hofer, Charles W. (1975), Toward a Contingency Theory of Business Strategy, The
Academy of Management Journal, Vol. 18, No. 4, pp. 784-810. (DOI: 10.2307/255379)
Hofer, Charles W. (1980), Turnaround Strategies, Journal of Business Strategy, Vol. 1, No. 1, pp. 19-31. (DOI: http://dx.doi.org/10.1108/eb038886)
Hofstede, Geert (2001), Culture’s Consequences: Comparing Values, Behaviours,
Institutions and Organisations Across Nations, Second Edition, Sage Publications, Thousand Oaks
215
Holdford, David A. (2007), Marketing for Pharmacists, American Pharmacists
Association, Washington Homburg, Christian – Annette Giering (2001), Personal Characteristics as Moderators of
the Relationship between Customer Satisfaction and Loyalty: An Empirical Analysis, Psychology and Marketing, Vol. 18, No. 1, pp. 43-66. (DOI: 10.1002/1520-6793(200101)18:1<43::AID-MAR3>3.0.CO;2-I)
Homburg, Christian – John P. Workman – Harley Krohmer (1999b), Marketing’s
Influence within the Firm, Journal of Marketing, Vol. 63, No. 2, pp. 1-17. (DOI: 10.1002/1520-6793(200101)18:1<43::AID-MAR3>3.0.CO;2-I)
Hooper, Daire – Joseph Coughlan – Michael R. Mullen (2008), Structural Equation
Modeling: Guidelines for Determining Model Fit, Electronic Journal of Business Research Methods, Vol. 6, No. 1, pp. 53-60. (DOI: 10.5897/AJBM12.445)
Hoque, Zahirul (2004) A Contingency Model of the Association between Strategy,
Environmental Uncertainty and Percformance Measures: Impact on Organisational Performance, International Business Review, Vol. 13, No. 4, pp. 485-502. (DOI: 10.1016/j.ibusrev.2004.04.003)
Hoque, Zahirul (2005), Linking Environmental Uncertainty to Non-Financial Performance
Measures and Performance: A Research Note, The British Accounting Review, Vol. 37, No. , pp. 471-481. (DOI: 10.1016/j.bar.2005.08.003)
Hortoványi Lilla – Lackó Márk – Szabó Zsolt Roland (2006), Stratégiatípusok
napjainkban Magyarországon, Versenyképesség Kutatások Műhelytanulmányok-Sorozat, 25. sz. műhelytanulmány, Budapesti Corvinus Egyetem, Vállalatgazdaságtan Intézet
Hotelling, Harold (1929), Stability in Competiton, The Economic Journal, Vol. 39, No.
153, pp. 41-57. (DOI: 10.1007/978-1-4613-8905-7_4)
Hrebiniak, Lawrence G. – William F. Joyce (1985), Organisational Adaptation: Strategic Choice and Environmental Determinism, Administrative Science Quarterly, Vol. 30, No. 3, pp. 336-349. (DOI: 10.1016/0022-4359(93)90008-7)
Hu, Li-tze – Peter M. Bentler (1999), Cutoff Criteria for Fit Indexes in Covariance
Structure Analysis: Conventional Criteria versus New Alternatives, Structural Equation Modeling: A Multidisciplinary Journal, Vol. 6, No. 1, pp. 1-55. (DOI: 10.1080/10705519909540118)
Huff, David L. (1964), Defining and Estimating a Trade Area, Journal of Marketing, Vol.
28, No. 3, pp. 34-38. (DOI: http://dx.doi.org/10.2307/1249154)
Hunt, Shelby D. – C. Jay Lambe (2000), Marketing’s Contribution to Business Strategy: Market Orientation, Relationship Marketing and Resource Advantage Theory, International Journal of Management Reviews, Vol. 2, No. 1, pp. 17-43. (DOI: 10.1111/1468-2370.00029)

216
Hunyadi László – Vita László (2003), Statisztika Közgazdászoknak, KSH, Budapest
Hutt, Michael D. – Michael P. Shapiro – Stanley J. Shapiro (1986), The Politics of
Marketing: Analysing the Parallel Political Marketplace, Journal of Marketing, Vol. 50, No.1, pp. 40-51. (DOI: http://dx.doi.org/10.2307/1251277)
Hymer, Stephen Herbert (1960), The International Operations of National Firms: A Study
of Foreign Direct Investment, MIT Press, Cambridge, MA, USA. (DOI: 10.1016/j.ibusrev.2005.03.008)
IMS Health (2010), Túlélőkészlet gyógyszerészeknek, Gyógyszerészi Hírlap, XXIII. Évf.,
2. Szám, 10. old.
Inkpen, Andrew. – Nandan Choudhury (1995), The Seeking of Strategy Where There is Not: Toward a Theory of Strategy Abscence, Strategic Management Journal, Vol. 15, No. 3, pp. 313-323. (DOI: 10.1002/smj.4250160405)
Ireland, R. Duane – Michael A. Hitt – R.A. Bettis – D.A. de Porras (1987), Strategy
Formulation Processes: Differences in Perceptions of Strengths and Weaknesses Indicators and Environmental Uncertainty at Managerial Level, Strategic Management Journal, Vol. 8, No. 5, pp. 469-485. (DOI :10.1002/smj.4250080506)
Jaccard, James. – Robert Turrisi – Choi K. Wan (1990), Interaction Effects in Multiple
Regression, Sage, Newbury Park, CA, USA. (DOI: 10.1016/S0022-4359(97)90018-X)
Jambulingam, Thanigavelan – Ravi Kathuria – William R. Doucette (2004), Entrepreneurial Orientation as a Basis for Classification within a Service Industry: the Case of Retail Pharmacy Industry, Journal of Operations Management, Vol. 23, No. 1, pp. 23-42. (DOI: 10.1016/j.jom.2004.09.003)
Jambulingam, Thanigavelan – Ravi Kathuria – John R. Nevin (2009), How Fairness
Garners Loyalty in the Pharmaceutical Supply Chain: Role of Trust in the Wholesaler-Pharmacy Relationship, International Journal of Pharmaceutical and Healthcare Marketing, Vol. 3, No. 4, pp. 305-322 (DOI: http://dx.doi.org/10.1108/17506120911006029)
James, William L. – Kenneth J. Hatten (1995), Further Evidence on the Validity of the
Self-Typing Paragraph Approach: Miles and Snow Strategic Archetypes in Banking, Strategic Management Journal, Vol. 16, No. 2, pp. 161-168. (DOI: 10.1002/smj.4250160206)
Jarvis, Cheryl Burke – Scott B. MacKenzie – Peter M. Podsakoff (2003), A Critical
Review of Construct Indicators and Measurement Model Misspecification in Marketing and Monsumer research, Journal of Consumer Research, Vol. 30, No. 2, pp. 199-218. (DOI: http://www.jstor.org/stable/10.1086/376806)
217
Jaworski, Bernard J. – Ajay K. Kohli (1993), Market Orientation: Antecedents and Consequences, Journal of Marketing, Vol. 57, No. 3, pp. 53-70. (DOI: http://dx.doi.org/10.2307/1251854)
Jelen Tibor (1995), Gondolatok a kisvállalati stratégiai tervezésről, Vezetéstudomány,
XXV. Évf., 10. Szám, 56-61. old.
Jennings, Daniel F – James R. Lumpkin (1992), Insights between Environmental Scanning Activities and Porter's Generic Strategies: An Empirical Analysis. Journal of Management, Vol. 18, Iss. 4, pp. 791-803. (DOI: 10.1177/014920639201800411)
Jennings, Daniel F. – Daniel Rajaratnam – Barry F. Lawrence (2003), Strategy-
Performance Relationships in Service Firms: A Test for Equifinality, Journal of Managerial Issues, Vol. 15, No. 2, pp. 208-220.
Jiao, Hao – Ilan Alon – Chun Kwong Kuu – Yu Cui (2013) When Should Organisational
Change be Implemented? The Moderating Effect of Environmental Dynamism between Dynamic Capabilities and New Venture Performance, Journal Engineering and Technology Management, Vol. 30, No. 4, pp. 188-205. (DOI: 10.1016/j.jengtecman.2013.01.005)
Jobber, David – John Saunders (1989), The Prediction of Industrial Mail-survey Response
rates, Journal of the Operations Research Society, pp. 839-847. (DOI: 10.1057/jors.1989.152)
Jöreskog, Karl Gustav (1969), A General Approach to Confirmatory Maximum Likelihood
Factor Analysis, Psychometrika, Vol. 34, No. 2, pp. 183-202. (DOI: 10.1002/j.2333-8504.1967.tb00991.x)
Jöreskog, Karl Gustav – Dag Sörbom (1979), Advances in Factor Analysis and Structural
Equation Models, University Press of America, New York
Jusoh, Ruzita – John A. Parnell (2008), Competitive Strategy and Performance Measurement in the Malaysian context: An Exploratory Study, Management Decision, Vol. 46, No. 1, pp. 5-31. (DOI: http://dx.doi.org/10.1108/00251740810846716)
Kabadayi, Sertan – Nermin Eyuboglu – Gloria P. Thomas (2007), The Performance
Implications of Designing Multiple Channels to Fit with Strategy and Environment, Journal of Marketing, Vol. 71, No. 4, pp. 195-211. (DOI: http://dx.doi.org/10.1509/jmkg.71.4.195)
Kabanoff, Boris – Shane Brown (2008), Knowledge Structures of Prospectors, Analysers
and Defenders: Content, Structure, Stability and Performance, Strategic Management Journal, Vol. 29, No. 2, pp. 149-171. (DOI: 10.1002/smj.644)
Kaplan, David (2000), Structural Equation Modeling: Foundations and Extensions, Sage
Publications, Thousand Oaks, CA, USA. (DOI: http://dx.doi.org/10.1037/0012-1649.44.2.457)

218
Kaplan, Robert S. – David P. Norton (1996), The Balanced Scorecard, Harvard Business School Press, Boston, MA. (DOI: 10.1016/S0022-4359(97)90024-5)
Katz, Daniel – Robert L. Kahn (1966), The Social Psychology of Organisations, Wiley
and Sons, New York. (DOI: 10.1016/S0022-4359(97)90024-5) Kay, Mark J. (2007), Healthcare Marketing: What is Salient?, International Journal of
Pharmaceutical and Healthcare Marketing, Vol. 1, No. 3, pp. 247-263. (DOI: http://dx.doi.org/10.1108/17506120710818256)
Kean, Rita – LuAnn Gaskill – Larry Leistritz – Cynthia Jasper – Holly Bastow-Shoop,
Laura Jolly – Brenda Stirnquist (1998), Effects of Community Characteristics, Business Environment and Competitive Strategies on Rural Retail Business Performance, Journal of Small Business Management, Vol. 36, No. 2, pp. 87-106.
Kehoe, Timothy J. – Edward C. Prescott (2007), Great Depressions of the XX.th. Century,
Federal Reserve Bank of Minneapolis Kemelgor, Bruce H. – Rodney D’Souza – Greg Henley (2011), The Dynamics of
Entrepreneurial Entry and Firm Performance of First Career and Second Career Entrepreneurs as Mediated by Prior Knowledge, American Journal of Entrepreneurship, Vol. 4, No. 2, pp. 24-51.
Ketchen, David J. Jr. – James G. Combs – Craig J. Russell – Chris Shook – Michelle A.
Dean – Janet Runge – Franz T. Lohrke – Stefanie E. Naumann – Dawn Ebe Haptonstahl – Robert Baker – Brenden A. Beckstein – Charles Handler – Heather Honig – Stephen Lamoureux (1997), Organisational Configurations and Performance: A Meta-analysis, Academy of Management Journal, Vol. 40, No. 1, pp. 223-240. (DOI: 10.2307/257028)
Keynes, John Maynard (1936), The General Theory of Employment, Interest and Money,
MacMillan, London. (DOI: 10.1016/0167-2231(77)90002-1)
Khandwalla, Pardip N. (1972), Environment and its Impact on the Organisation, International Studies of Management & Organisation, Vol. 2, No. 3, pp. 297-313.
Klarmann, Martin (2009), Metodische Problemfelder der Erfolgsfaktorenforschung,
Springer Gabler, Wiesbaden. (DOI: 10.1007/s11621-009-0113-7) Klarmann, Martin (2011), Construct Measurement and Structural Equation Modeling.
Doctoral Seminar Handbook, Corvinus University of Budapest, 15/16 September, 2011. Kline, Rex B. (2010), Principles and Practice of Structural Equation Modelling, Guilford
Press, New York (DOI: 10.1080/10705511.2012.687667) Kline, Theresa J.B. – Lorne M. Sulsky – Sandra D. Rever-Moriyama (2000), Common
Method Variance and Specification Errors: A Practical Approach to Detection, The Journal of Psychology: Interdisciplinary and Applied, Vol. 134, No. 4, pp. 401-421. (DOI: 10.1080/00223980009598225)

219
Kondratieff, Nikolay D. (1925), The Major Economic Cycles, The Quarterly Journal of Economics, Vol. 39, No. 4. pp. 575-583.
Kornai János (1980), Kemény és puha költségvetési korlát, Gazdaság, XIX. Évf, 4. Szám,
5-19. old. Kornai János (1983), Bürokratikus és piaci koordináció, Közgazdasági Szemle, XXX.
Évf., 12. Szám, 1025-1038. old.
Kotha, Suresh – Anil Nair (1995), Strategy and Environment as Determinants of Performance: Evidence from the Japanese Machine Tool Industry, Strategic Management Journal, Vol. 16, No. 7, pp. 497-518. (DOI: 10.1002/smj.4250160702)
Krugman, Paul R. (1991), Geography and Trade, MIT Press, Boston, MA (DOI:
10.1007/978-1-4757-4062-2_3) Krugman, Paul R. – Maurice Obstfeld (2003), Nemzetközi gazdaságtan: Elmélet és
gazdaságpolitika, Panem, Budapest
Kuti Anetta (2009), A gyógyszerek árképzése, ártámogatása, Szakdolgozat, BCE, Budapest
Langley, Ann (1988), The Roles of Formal Strategic Planning, Long Range Planning, Vol.
21, No. 3, pp. 40-50. (DOI: 10.1016/0024-6301(88)90032-5)
Laugen, Bjorge Timenes – Harry Boer – Nuran Acur (2006), The New Product Development Improvement Motives and Practices of Miles and Snow’s Prospectors, Analysers and Defenders, Creativity and Innovation Management, Vol. 15, No. 1, pp. 85-95. (DOI: 10.1111/j.1467-8691.2006.00371.x)
Lawrence, Paul – Jay Lorsch (1967), Organisation and Environment, Division of
Research, Harvard Business School, Boston, MA Lengyel Ákos László (2014), Hogyan változott a hazai gyógyszeripar marketing
kommunikációja a kezdetektől napjainkig, Szakdolgozat, BCE, Budapest Lengyel Imre – Rechnitzer János (2004), Regionális gazdaságtan, Dialóg Campus Kiadó,
Budapest-Pécs Levinthal, Daniel A. (2011), A Behavioural Approach to Strategy – What’s the
Alternative?, Strategic Management Journal, Vol. 32, No. 13, pp. 1517-1523. (DOI: 10.1002/smj.963)
Lewis, Pam – Howard Thomas (1990), The Linkage Between Strategy, Strategic Groups
and Performance in the UK Grocery Industry, Strategic Management Journal, Vol. 11, No. 5, pp. 385-397. (DOI: 10.1002/smj.4250110505)
Lester, Donald D. – John A. Parnell – William Crandall – Michael L. Menefee (2008),
Organisational Life Cycle and Performance Among SMEs: Generic Strategies for High
220
and Low Performers, International Journal of Commerce and Management, Vol. 18, No. 4, pp. 313-330. (DOI: http://dx.doi.org/10.1108/10569210810921942)
Levy, Michael – Barton A. Weitz (2012), Retailing Management, International Edition
(8th ed.), McGraw-Hill, New York Li, Haiyang – Yan Zhang – Tsan-Sing Chan (2005), Entrepreneurial Strategy Making and
Performance in China’s New Technology Ventures: The Contingency Effect of Environments and Firm Competences, Journal of High Technology Managment Research, Vol. 16, No. 1, pp. 37-57. (DOI: 10.1016/j.hitech.2005.06.003)
Li, Hongbin – Lingsheng Meng – Qian Wang – Li-An Zhou (2008), Political Connections,
Financing and Firm Performance: Evidence from Chinese Private Firms, Journal of Development Economics, Vol. 87, No. 2, pp. 283-299. (DOI: 10.1016/j.jdeveco.2007.03.001)
Li, Joseph Chun-Sheng – John Henley – Jonathan Ansell – Tse-Ping Dong (2011),
Location-Specific Factors, Localisation Strategy and Firm Performance: A Case Study of Taiwanese Manufacturing MNE Subsidiaries Investing in China, Journal of Economic and Social Geography, Vol. 102, No. 4, pp. 426-440. (DOI: 10.1111/j.1467-9663.2010.00646.x)
Lin, Chinho – Hua Ling Tsai – Ju Chuan Wu (2014), Collaboration Strategy Decision-
Making Using the Miles and Snow Typology, Journal of Business Research, Vol. 67, No. No. 9, pp. 1979-1990. (DOI: 10.1016/j.jbusres.2013.10.013)
Lindblom, Charles E. (1959), The Science of Muddling Through, Public Administration
Review, Vol. 19, No. 2, pp. 79-88. (DOI: 10.1016/0167-2681(81)90012-3)
Lindell, Michael K. – David J. Whitney (2001), Accounting for Common Method Variance in Cross Sectional Designs, Journal of Applied Psychology, Vol. 86, No. 1, pp. 114-121.(DOI: http://dx.doi.org/10.1037/0021-9010.86.1.114)
Llewellyn, Sue – Emma Tappin (2003), Strategy in the Public Sector: Management in the
Wilderness, Journal of Management Studies, Vol. 40, No. 4, pp. 955-982. (DOI: 10.1111/1467-6486.00366)
Lopes, Humberto Elias Garcia – Thelmo Naves Moura – Caio César Giannini Oliveira
(2010), Strategic Profiles in Brazil: A Study of Postal Agent Franchisees from the Typology of Miles and Snow, Revista Brasileira de Gestao de Negócios, Vol. 12, No. 37, pp. 388-404.
Lowry, Paul Benjamin – James Gaskin (2014), Partial Least Squares (PLS) Structural
Equation Modeling (SEM) for Building and Testing Behavioural Causal Theory: When to Choose It and How to Use It, IEEE Transactions on Professional Communication, Vol. 57, No. 2, pp. 123-146. (DOI: 10.1109/TPC.2014.2312452)
Lukas, Bryan A. – J. Justin Tan – G. Thomas M. Hult (2001), Strategic Fit in Transitional
Economies, Journal of Management, Vol. 27, pp. 409-429. (DOI: 10.1177/014920630102700402)

221
Luo, Yadong (1997), Performance Implications of International Strategy: An Empirical
Study of Foreign-Invested Enterprises in China, Group and Organisation Management, Vol. 22, No. 1, pp. 87-116. (DOI: 10.1177/1059601197221007)
Luo, Yadong (2001), Determinants of Entry in an Emerging Economy: A Multilevel
Approach, Journal of Management Studies, Vol. 38, No. 3, pp. 443-472. (DOI: 10.1111/1467-6486.00244)
MacCallum, Robert C. – Michael W. Browne – Sugawara Hazuki M (1996), Power
Analysis and Determination of Sample Size for Covariance Structure Modeling, Psychological Methods, Vol. 1, No. 2, pp. 130–149. (DOI: http://dx.doi.org/10.1037/1082-989X.1.2.130)
Malhotra, Naresh K. – S.S. Kim – A. Patil (2006), Common Method Variance in IS
Research: A Comparison of Alternative Approaches and a Reanalysis of Past Research, Management Science, Vol. 52, No. 12, pp. 1865–1883. (DOI: http://dx.doi.org/10.1287/mnsc.1060.0597)
Malhotra, Naresh K. – Simon Judit (2009), Marketingkutatás, Akadémiai Kiadó, Budapest
Malik, Ehsan Muhammad – Basharat Naeem (2011), Miles and Snow Typology: A
Critical Commentary, Interdisciplinary Journal of Contemporary Research in Business, Vol. 3, No. 4, pp. 805-812.
Mankiw, N. Gregory (2003), Makroökönómia, Osiris Kiadó, Budapest Mardia, K.V. (1970), Measures of Multivariate Skewness and Kurtosis with Applications,
Biometrika, Vol. 57, No. 3, pp. 519-530. (DOI: 10.1093/biomet/57.3.519)
Matanda, Margaret Jekanyika – Susan Freeman (2009), Effect of Perceived Environmental Uncertainty on Exporter-Importer Inter-organisational Relationships and Export Performance Improvement, International Business Review, Vol. 18, No. 1, pp. 89–107. (DOI: 10.1016/j.ibusrev.2008.12.004)
Matsuno, Ken – John T. Mentzer (2000), The Effects of Strategy Type on the Market
Orientation – Performance Relationship, Journal of Marketing, Vol. 64, No. 5, pp. 1-16. (DOI: http://dx.doi.org/10.1509/jmkg.64.4.1.18078)
Maxwell, A.E. (1970), Comparing the Classification of Subjects by Two Independent
Judges, The British Journal of Psychiatry, Vol. 116, No. 12, pp. 651-655. (DOI: 10.1192/bjp.116.535.651)
McArthur, Angeline W. – Paul C. Nystrom (1991), Environmental Dynamism,
Complexity and Munificence as Moderators of Strategy-Performance Relationships, Journal of Business Research, Vol. 23, No. 4, pp. 349-361. (DOI: 10.1016/0148-2963(91)90020-X)
222
McDaniel, Stephen W. – James W. Kolari (1987), Marketing Strategy Implications of the Miles and Snow Strategic Typology, Journal of Marketing, Vol. 51, No. 4, pp. 19-30. (DOI: http://dx.doi.org/10.2307/1251245)
McGahan, Anita M. – Michael E. Porter (1997), How Much Does Industry Matter,
Really?, Strategic Management Journal, Vol. 18, Summer Special Issue, pp. 15-30. (DOI: 10.1002/(SICI)1097-0266(199707)18:1+<15::AID-SMJ916>3.0.CO;2-1)
McGee, Jeffrey – Mark Peterson (2000), Toward the Development of Measures of
Distinctive Competencies Among Small Independent Retailers, Journal of Small Business Management, Vol. 38, No. 2, pp. 19-33.
McKee, Daryl O. – P. Rajan Varadarajan – William M. Pride (1989), Strategic
Adaptability and Firm Performance: A Market-Contingent Perspective, Journal of Marketing, Vol. 53, No. 3, pp. 21-35. (DOI: http://dx.doi.org/10.2307/1251340)
McNemar, Quinn (1947), Note on the Sampling Error of the Difference between
Correlated Proportions or Percentages, Psychometrika, Vol. 12, No. 2, pp. 153-157. (DOI: 10.1007/BF02295996)
Meade, James E. (1952) External Economies and Diseconomies in a Competitive
Situation, The Economic Journal, Vol. 62, No. 245, pp. 54-67.
Meier, Kenneth J. – Laurence O’Toole Jr. – George A. Boyne – Richard M. Walker – Rhys Andrews (2007), Alignment and Results: Testing the Interaction Effects of Strategy, Structure and Environment from Miles and Snow, Public Management Research Conference Proceedings, Tucson, AZ, USA, 25 October 2007 (DOI: 10.1177/0095399710362717)
Melia, Monica – Maria Colurcio – Angela Carida – Tiziana Russo Spena (2010), Value
Co-Creation and Experience in Drugs Distribution: The Coop Health Corner, Proceedings of the 39th. EMAC Conference, 1-4. June 2010, Copenhagen
Menguc Bulent – Seigyoung Auh (2008), The Asymmetric Moderating Role of Market
Orientation on the Ambidexterity-Firm Performance Relationship for Prospectors and Defenders, Industrial Marketing Management, Vol. 37, No. 4, pp. 455-470. (DOI: 10.1016/j.indmarman.2007.05.002)
Meyer, Alan D. (1982), Adapting to Environmental Jolts, Administrative Science
Quarterly, Vol. 27, No. 4, pp. 515-537. (DOI:10.1007/s11206-005-1899-y) Magyar Gyógyszerészi Kamara (2014), Javaslatok a gyógyszertári marketingajánláshoz –
I. rész, Gyógyszerészi Hírlap, XXV. Évf., 2. Szám, 9-12. old.
Mihályi Péter (2006), Egészségügy: A halogatott reform, Budapest
Mihályi Péter (2008), Miért beteg a magyar gazdaság?, HVG Kiadó, Budapest

223
Miles, Raymond E. – Charles C. Snow (1978), Organisational Strategy, Structure and Process, McGraw Hill Book Company, New York (DOI: 10.5465/AMR.1978.4305755)
Miles, Raymond E. – Charles C. Snow – Jeffrey Pfeffer (1974), Organisation-
Environment: Concept and Issues, Industrial Relations, Vol. 13, No. 3, pp. 244-264.
Miles, Raymond E. – Charles C. Snow (1984), Designing Strategic Human Resources Systems, Organisational Dynamics, Vol. 13, No. 1, pp. 36-52. (DOI: 10.1016/0090-2616(84)90030-5)
Miles, Raymond E. – Charles C. Snow (1994), Fit, Failure and the Hall of Fame: How
Companies Succed or Fail, Free Press, New York. (DOI: 10.1016/j.jom.2006.05.002)
Miles, Raymond E. – Charles C. Snow – Alan D. Meyer – Henry J. Coleman, Jr. (1978), Organisational Strategy, Structure and Process, Academy of Management Review, Vol. 3, No. 3, pp. 546-562. (DOI: 10.5465/AMR.1978.4305755)
Miller, Danny (1988), Relating Porter´s Business Strategies to Environment and Structure:
Analysis and Performance Implications, Academy of Management Journal, Vol. 31, No. 2, pp. 280-309. (DOI: 10.2307/256549)
Miller, Danny (1989), Matching Strategies and Strategy Making: Process, Content and
Performance, Human Relations, Vol. 42, No. 3, pp. 241-260. (DOI: 10.1177/001872678904200303)
Miller, Danny – Peter H. Friesen (1983), Strategy-making and Environment: The Third
Link, Strategic Management Journal, Vol. 4, No. 3, pp. 221-235. (DOI: 10.1002/smj.4250040304)
Miller, Danny – Peter H. Friesen (1986), Porter’s Generic Strategies and Performance: An
Empirical Examination with American Data, Organisation Studies, Vol. 7, No. 1, pp. 37-55. (DOI: 10.1177/017084068600700103)
Miller, Kent D. (1993), Industry and Country Effects on Managers’ Perceptions of
Environmental Uncertainties, Journal of International Business Studies, Vol. 24, No. 4, pp. 693-714. (DOI: 10.1057/palgrave.jibs.8490251)
Milliken, Frances J. (1987), Three Types of Perceived Uncertainty about the Environment:
State, Effect and Response Uncertainty, The Academy of Management Review, Vol. 12, No. 1, pp. 133-143. (DOI: 10.5465/AMR.1987.4306502)
Minai, Mohd Sobri – Esuh Ossai-Igwe Lucky (2011), The Moderating Effect of Location
on Small Firm Performance: Empirical Evidence, International Journal of Business and Management, Vol. 6, No. 10, pp. 178-192. (DOI: 10.5539/ijbm.v6n10p178)
Mintzberg, Henry (1973), Strategy Making in Three Modes, California Management
Review, Vol. 16, No. 2, pp. 44-53. (DOI: 10.1006/mare.1999.0121)

224
Mintzberg, Henry (1978), Patterns in Strategy Formation, Management Science, Vol. 24, No. 9, pp. 934-948. (DOI: http://dx.doi.org/10.1287/mnsc.24.9.934)
Mintzberg, Henry (1979), Structuring of the Organisations, Prentice Hall, Englewood
Cliffs, NJ. (DOI: 10.1016/0361-3682(85)90005-4)
Mintzberg, Henry – Alexandra McHugh (1985), Strategy Formation in an Adhocracy, Administrative Science Quarterly, Vol. 30 Iss. 2, pp. 160-197. (DOI: 10.1016/S0740-8188(99)00006-7)
Mintzberg, Henry – J. Waters (1985), Of Strategies, Deliberate and Emergent, Strategic
Management Journal, Vol. 6, No. 6, pp. 257-272. (DOI: 10.1002/smj.4250060306) Mintzberg, Henry (1994), The Rise and Fall of Strategic Planning – Reconceiving the
Roles for Planning, Plans and Planners, The Free Press, New York
Mintzberg, Henry – Bruce Ahlstrand – Joseph Lampel (2005), Stratégiai szafari, HVG Kiadó, Budapest
Mitev Ariel – Sajtos László (2007), SPSS kutatási és adatelemzési kézikönyv, Alinea
Kiadó, Budapest
Mitev Ariel – Bauer András (2008a), Marketing a gyógyszertárban I. rész: A személyes eladás. Gyógyszerészet, LI. Évf., 4. Szám, 204-208. old.
Mitev Ariel – Bauer András (2008b), Marketing a gyógyszertárban II. rész: Betegtípusok
és szükségletek. Gyógyszerészet, LI. Évf., 5. Szám, 281-285. old.
Mitev Ariel – Bauer András (2008c), Marketing a gyógyszertárban III. rész: Marketingkutatás a gyógyszertárban. Gyógyszerészet, LI. Évf., 9. Szám, 535-540.
Moore, Marguerite (2005), Towards a Confirmatory Model of Retail Strategy Types: An
Empirical Test of Miles and Snow, Journal of Business Research, Vol. 58, No. 5, pp. 696-704. (DOI: 10.1016/j.jbusres.2003.09.004)
Morgan, Neil – Anna Kaleka – Constantine Katsiekas (2004), Antecedents of Export
Venture Performance: a Theoretical Model and Empirical Assessment, Journal of Marketing, Vol. 68, No. 1, pp. 90-108. (DOI: http://dx.doi.org/10.1509/jmkg.68.1.90.24028)
Morrison, Allen J. – Kendall Roth (1992), A Taxonomy of Business-Level Strategies in
Global Industries. Strategic Management Journal, Vol. 13, No. 6, pp. 399-417. (DOI: 10.1002/smj.4250130602)
Nandakumar, M.K. – Abby Ghobadian – Nicholas O’Reagan (2010), Business-Level
Strategy and Performance: The Moderating Effects of Environment and Structure, Management Decision, Vol. 48, No. 6, pp. 907-939. (DOI: http://dx.doi.org/10.1108/00251741011053460)

225
Namiki, Nobuaki (1999), Miles and Snow’s Typology of Strategy, Perceived Environmental Uncertainty and Organisational Performance, Akron Business and Economic Review, Vol. 20, No. 2, pp. 72-88.
Narayanan, A. (2012), A Review of Eight Software Packages for Structural Equation
Modeling, The American Statistician, Vol. 66, No. 2, pp. 129-138. (DOI: 10.1080/00031305.2012.708641)
Narver, John C. – Stanley F. Slater (1990), The Effect of a Market Orientation on Business
Profitability, Journal of Marketing, Vol. 54, No. 4, pp. 20-35. (DOI: http://dx.doi.org/10.2307/1251757)
Nemes Nagy József (2009), Terek, helyek, régiók, Akadémiai Kiadó, Budapest
Némethné, Gál Andrea (2010), A kis- és középvállalatok versenyképessége: Egy
lehetséges elemzési keretrendszer, Közgazdasági Szemle, Vol. 57, No. 2, pp.181-193. Neumann-Bódi Edit (2012), Vevőértékelés egyéni és szervezeti vásárlók esetében: Az
ajánlással szerzett ügyfelek jellemzői és hatásuk a vevőértékre szervezetközi viszonylatban, Ph.D. értekezés, BCE, Budapest
Newkirk, Henry E. – Lederer, Albert L. (2006), The Effectiveness of Strategic Information
Systems Planning under Environmental Uncertainty, Information & Management, Vol. 43, No. 4, pp. 481–501. (DOI: 10.1016/j.im.2005.12.001)
Nickols, Fred (2010), Strategy – Definitions and Meanings, Working Paper of Distance
Consulting, Strategic Planning and Management Services at Educational Testing Service
Nunally, Jum C. (1978), Psychometric Theory, McGraw-Hill, New York (DOI: 10.1016/0148-2963(95)00159-X)
Ohmae, Kenichi (1982), The Mind of the Strategist, McGraw-Hill, New York. (DOI:
10.1016/0024-6301(89)90128-3)
Olson, Eric M. – Stanley F. Slater – G. Thomas M. Hult (2005), The Performance Implications of Fit Among Business Strategy, Marketing Organisation Structure, and Strategic Behaviour, Journal of Marketing, Vol. 69, No. 3, pp. 49-65. (DOI: http://dx.doi.org/10.1509/jmkg.69.3.49.66362)
Olson, Shirley F. – Helen M. Currie (1992), Female Entrepreneurs: Personal Value
Systems and Business Strategies in a Male Dominated Industry, Journal of Small Business Management, Vol. 30, No. 1, pp. 49-56.
Oosthuizen, H. (1997), An Evaluation of the Relevance of the Miles and Snow Strategic
Typology under Present-Day Conditions of Major Environmental Uncertainty: The Emperor’s New Clothes or a Paradigm Shift?, South African Journal of Business Management, Vol. 28, No. 2, pp. 63-73.

226
O’Toole, Lawrence Jr. (2000), Research on Policy Implementation: Assessment and Prospects, Journal of Public Administration Research and Theory, Vol. 10, No. 2, pp. 263-288.
Parnell, John A. – Peter Wright (1993), Generic Strategy and Performance: an Empirical
Test of the Miles and Snow Typology, British Journal of Management, Vol. 4, No. 1, pp. 29-36. (DOI: 10.1111/j.1467-8551.1993.tb00159.x)
Parnell, John. A – Donald L. Lester – Michael L. Menefee (2000), Strategy as a Response
to Organisational Uncertainty: An Alternative Perspective, Management Decision, Vol. 38, No. 8, pp. 520-530. (DOI: http://dx.doi.org/10.1108/00251740010352811)
Parnell, John A. – Donald L. Lester – Zhang Long – Mehmet Ali Köseoglu (2012), How
Environmental Uncertainty Affects the Link Between Business Strategy and Performance in SMSs: Evidence from China, Turkey and the USA, Management Decision, Vol. 50, No. 4, pp. 546-568. (DOI: http://dx.doi.org/10.1108/00251741211220129)
Köseoglu, Mehmet Ali – Cafer Topaloglu – Parnell, John A. – Donald L. Lester (2013),
Linkages among Business Strategy, Uncertainty and Performance in the Hospitality Industry: Evidence from an Emerging Economy, International Journal of Hospitality Management, Vol. 34, No. 9, pp. 81-91. (DOI: 10.1016/j.ijhm.2013.03.001)
Panagopoulos, Nikolaos G. – George J. Avlonitis (2007), Performance implications of
sales strategy: The Moderating Effects of Leadership and Environment, International Journal of Research in Marketing, Vol. 27, No. 1, pp. 46-57. (DOI: 10.1016/j.ijresmar.2009.11.001)
Parasuraman, A – Leonard L. Berry – Valerie A. Zeithaml (1991), Refinement and
Reassessment of the SERVQUAL Scale, Journal of Retailing, Vol. 67, No. 4, pp. 420-450. (DOI: 10.1016/0022-4359(94)90005-1)
Pelham, Alfred M. (1999), Influence of Environment, Strategy, and Market Orientation on
Performance in Small Manufacturing Firms, Journal of Business Research, Vol. 45, No. , pp. 33-46. (DOI: 10.1016/S0148-2963(98)00026-5)
Peng, M. W. – J. Tan – T.W. Tong (2004), Ownership Types and Strategic Groups in
Emerging Economies, The Journal of Management Studies Vol. 41, No. pp. 1105-1129. (DOI: 10.1111/j.1467-6486.2004.00468.x)
Pertusa-Ortega, Eva M. – José F. Molina-Azorín - Claver-Cortés, Enrique Claver-Cortez
(2008), Competitive Strategies and Firm Performance: A Comparative Analysis of Pure, Hybrid and ‘Stuck-in-The-Middle’ Strategies in Spanish Firms. British Journal of Management, Vol. 20, No. 4, pp. 508-523. (DOI: 10.1111/j.1467-8551.2008.00597.x)
Peston, Maurice H. (1972), Public Goods and the Public Sector, MacMillan, London Peter, Paul J. (1979), Reliability: A Review of Psychometric Basics and Recent Marketing
Practices, Journal of Marketing Research, Vol. 16, No. 1, pp. 6-17. (DOI: 10.2307/3150868)

227
Peter, Paul J. (1981), Construct Validity: A Review of Basic Issues and Marketing
Practices, Journal of Marketing Research, Vol. 18, No. 2, pp. 133-145. (DOI: 10.2307/3150948)
Pierce, John A. – D. Keith Robbins – Richard B. Robinson, Jr. (1987), The Impact of
Grand Strategy and Planning Formality on Financial Performance, Strategic Management Journal, Vol. 8, No. 2, pp. 125-134. (DOI: 10.1002/smj.4250080204)
Pillittere-Dugan, Donna – David P. Nau – Kimberly McDonough – Zakiya Pierre (2009),
Development and Testing of Performance Measures for Pharmacy Services, Journal of the American Pharmacists Association, Vol. 49, No. 2, pp. 212-219. (DOI: 10.1331/JAPhA.2009.09012)
Pine, Joseph B. II. – James H. Gilmore (1999), The Experience Economy, Harvard
Business School Press, Boston
Pinto, José Castro – José Dias Curto (2007), The Organisatonal Configuration Concept as a Contribution to the Explanation: The Case of the Pharmaceutical Industry in Portugal, European Management Journal, Vol. 25, No. 1, pp. 60-78. (DOI: 10.1016/j.emj.2006.11.004)
Pittino, Daniel – Francesca Visintin (2009), Innovation and Strategic Types of Family
SMEs: A Test and Extension of Miles and Snow’s Configurational Model, Journal of Enterprising Culture, Vol. 17, No. 3, pp. 257-295. (DOI: 10.1142/S0218495809000382)
Pleshko, Larry (2008), Strategic Orientation, Organisational Structure and the Associated
Effects of Performance in Industrial Firms, Academy of Strategic Management Journal, Vol. 7, No. 1, pp. 95-110.
Pleshko, Larry P. – Peter A. Stanwick – Richard A. Heiens (1995), Market Leadership
profiles of the Miles and Snow’s Typology Groups, Academy of Management Journal, Vol. 38. No. 4, pp. 134-141.
Podsakoff, P. M. – D. W. Organ (1986), Self-reports in Organisational Research: Problems
and Prospects, Journal of Management, Vol. 12, No. 4, pp. 531-544. (DOI: 10.1177/014920638601200408)
Podsakoff, P. M. – S. B. MacKenzie – J. Y. Lee – N. P. Podsakoff (2003), Common
Method Biases in Behavioural Research: A Critical Review of the Literature and Recommended Remedies. Journal of Applied Psychology, Vol. 88, No. 5, pp. 879-903. (DOI: http://dx.doi.org/10.1037/0021-9010.88.5.879)
Pollitt, Christopher – Geert Bouckaert (2004), Public Management Reform, Oxford
University Press, Oxford (DOI: 10.1787/16812336)
Porter, Michael E. (1979), The Structure within Industries and Companies’ Performance, The Review of Economics and Statistics, Vol. 61, No. 2, pp. 214-227. (DOI: 10.1016/0148-2963(94)00065-M)

228
Porter, Michael E. (1980), Competitive Strategy, The Free Press, New York
Porter, Michael E. (1985), Competitive Advantage, The Free Press, New York Porter, Michael E. (1996a), What is Strategy?, Harvard Business Review, Vol. 74, No. 6,
pp. 61-78. (DOI: 10.1016/j.hrmr.2005.11.003) Porter, Theodore M. (1996b), Trust in Numbers: The Pursuit of Objectivity in Science and
Public Life, Princeton University Press, Princeton, New Jersey, USA. (DOI: 10.1002/(SICI)1520-6696(199607)32:3<241::AID-JHBS6>3.0.CO;2-X)
Poszmik Erzsébet – Barta Gyöngyi (1995), A gyógyszerkereskedelem privatizációja, Tér
és Társadalom, IX. Évf., 1-2. Szám, 127-140. old. Powell, Thomas C. (2011), Neurostrategy, Strategic Management Journal, Vol. 32, No.
13, pp. 1484-1499. (DOI: 10.1002/smj.969) Powell, Thomas C. – Dan Lovallo – Craig R. Fox (2011), Behavioural Strategy, Strategic
Management Journal, Vol. 32, No. 13, pp. 1369-1386. (DOI: 10.1002/smj.968) Prahalad C.K. – Venkatram Ramaswamy (2004), The Future of Competition, Creating
Unique with Customer, Harvard Business School Press, Boston. (DOI: 10.1177/1470593106066795)
Premkumar G. – Margaret Roberts (1999), Adoption of New Information Technologies in
Rural Small Businesses, Omega, Vol. 27, No. 4, pp. 467-484. (DOI: 10.1016/S0305-0483(98)00071-1)
Prescott, John E. (1986), Environments as Moderators of the Relationship Between
Strategy and Performance, Academy of Management Journal, Vol. 29, No. 2, pp. 329-346. (DOI: 10.2307/256191)
Priem, Richard L. – Leonard G. Love – Margaret Schaffer (2002), Executives’ Perceptions
of Uncertainty Sources: A Numerical Taxonomy and Underlying Dimensions, Journal of Management, Vol. 28, No. 6, pp. 725-746. (DOI: 10.1177/014920630202800602)
Quinn, James Brian (1980), Strategies for Change: Logical Incrementalism, Irwin,
Homewood, IL, USA. (DOI: 10.1016/0024-6301(87)90069-0) Rajagopalan, Nadini (1997), Strategic Orientations, Incentive Plan Adoptions, and Firm
Performance: Evidence from Electric Utility Firms, Strategic Management Journal, Vol. 18, No. 10, pp. 761-786. (DOI: 10.1002/(SICI)1097-0266(199711)18:10<761::AID-SMJ906>3.0.CO; 2-2)
Ramanujam, Vasudevam – Venkatraman N. (1986), Measurement of Business
Performance in Strategy Research: A Comparison of Approaches, Academy of Management Review, Vol. 11, No. 4, pp. 801-814. (DOI: 10.5465/AMR.1986.4283976)

229
Ramos-Rodriguez, Antonio-Rafael – José Ruiz Navarro (2004), Changes in the Intellectual Structure of Strategic Management Research: A Bibliometric Study of the Strategic Management Journal from 1980 to 2000, Strategic Management Journal, Vol. 25, No. 10, pp. 981-1004. (DOI: 10.1002/smj.397)
Ray, Sougata (2004), Environment-Strategy-Performance Linkages: A Study of Indian
Firms during Economic Liberalisation, Vikalpa, Vol. 29, No. 2, pp. 9-23. Raykov, Tenko (1998), Coefficient Alpha and Composite Reliability with Interrelated,
Nonhomogenious Items, Applied Psychological Measurement, Vol. 22, No. 4, pp. 375-385. (DOI: 10.1177/014662169802200407)
Rechnitzer János – Smahó Melinda (2005), A humán erőforrások regionális sajátosságai
az átmenetben, MTA KTI, Budapest Reinartz, Werner J. – Michael Haenlein – Jörg Henseler (2009), An Empirical Comparison
of the Efficacy of Covariance-Based and Variance-Based SEM, International Journal of Research in Marketing, Vol. 26, No. 4, pp. 332-344. (DOI: 10.1016/j.ijresmar.2009.08.001)
Rencher, Alvin C. (1995), Methods of Multivariate Analysis, Wiley-Interscience, London
Richardson, Hattie A. – Marcia J. Simmering – Michael C. Sturman (2009), A Tale of
Three Perspectives: Examining Post Hoc Statistical Techniques for Detection and Corrections of Common Method Variance, Organisational Research Methods, Vol. 12, No. 4, pp. 762-800. (DOI: 10.1177/1094428109332834)
Roberts, Brian – Robert J. Stimson (1998), Multi-sectoral Qualitative Analysis: A Tool for
Assessing the Competitiveness of Regions and Formulating Strategies for economic Development, Annual, Regional Science, Vol. 32, No. 4, pp. 469-494. (DOI: 10.1007/s001680050084)
Roberts, Melanie B. – Matthew R. Keith (2002), Implementing a Performance Evaluation
System in a Correctional Managed Care Pharmacy, American Journal of Health-System Pharmacists, Vol. 59, No. 5, pp. 1097-1104.
Robinson, William T. – Claes Fornell – Mary V. Sullivan (1992), Are Market Pioneers
Intrinsically Stronger than Later Entrants?, Strategic Management Journal, Vol. 13, No. 4, pp. 609-624. (DOI: 10.1002/smj.4250130804)
Ronda-Pupo, Guillermo Armando – Luis Angel Guerras-Martín (2012), Dynamics of the
Evolution of the Strategy Concept 1962-2008: A Co-Word Analysis, Strategic Management Journal, Vol. 33, No. 2, pp. 162-188. (DOI: 10.1002/smj.948)
Rossiter, John R. (2002), The C-OAR-SE Procedure for Scale Development in Marketing,
International Journal of Research in Marketing, Vol. 19, No. 4, pp. 305-335. (DOI: 10.1016/S0167-8116(02)00097-6)

230
Ruekert, Robert W. – Orville C. Walker Jr. (1987), Interactions between Marketing and R&D Departments in Implementing Different Business Strategies, Strategic Management Journal, Vol. 8, No. 3, pp. 233-248. (DOI: 10.1002/smj.4250080303)
Ruekert, Robert W. – Orville C. Walker Jr. – Kenneth J. Roering (1985), The Organisation
of Marketing Activities: A Contingency Theory of Structure and Performance, Journal of Marketing, Vol. 49, No. 1, pp. 13-25. (DOI: 10.2307/1251172)
Rugman, Alan M. (1981), Inside the Multinationals: The Economics of Internal Markets,
Columbia University Press, New York Rugman, Alan M. – Alain Verbeke (2004), A Perspective on Regional and Global
Strategies of Multinational Enterprises, Journal of International Business Studies, Vol. 35, No. 1, pp. 3-18. (DOI: 10.1057/palgrave.jibs.8400073)
Rumelt, Richard P. (1972), Strategy, Structure and Economic Performance, Division of
Research, Graduate School of Business Administration, Harvard University, Boston. (DOI: 10.1016/0167-2681(94)90094-9)
Rumelt, Richard P. (1991), How Much Does Industry Matter?, Strategic Management
Journal, Vol. 12, No. 2, pp. 167-185. (DOI: 10.1002/smj.4250120302) Russell, Robert D. – Craig J. Russell (1992), An Examination of The Effects of
Organisational Norms, Organisational Structure and Environmental Uncertainty on Entrepreneurial Strategy, Journal of Management, Vol. 18, No. 1, pp. 639-657. (DOI: 10.1177/014920639201800403)
Russo, Michael V. – Paul A. Fouts (1997), A Resource-based Perspective on Corporate
Environmental Performance and Profitability, Academy of Management Journal, Vol. 40, No. 3, pp. 534-559. (DOI: 10.2307/257052)
Saal, Frank E. – Ronald G. Downey – Mary Anne Lahey (1980), Rating the Ratings:
Assessing the Psychometric Quality of Rating Data, Psychological Bulletin, Vol. 88, No. 2, pp. 413-428. (DOI: http://dx.doi.org/10.1037/0033-2909.88.2.413)
Saini, Parwesh – Sharad Visht (2014), Pharmacy Education: TQM, International Journal
of Pharmacy and Life Sciences, Vol. 5, No. 4, pp. 3440-3451. Sakarya, Orcun A. (2010), Managing Innovative Product Strategy: Impacts of Marketing
Efforts and Location in Turkey, Journal of Academic Research in Economics, Vol. 2, No. 3, pp. 334-347.
Samuelson, Paul A. (1954), The Pure Theory of Public Expenditure, The Review of
Economics and Statistics, Vol. 36, No. 4, pp. 387-389. (DOI: 10.1016/0047-2727(82)90059-7)
Sajtos László (2004), A vállalati marketingteljesítmény értékelésének többdimenziós
megközelítése és alkalmazás a Magyarországon működő vállalatok körében, Ph.D. értekezés, BCE, Budapest

231
Schenk, Ursula-Wiesenfeld (1994), Technology Strategies and the Miles and Snow
Typology: a Study of the Biotechnology Industries, Research and Development Management, Vol. 24, No.1, pp. 57-64. (DOI: 10.1111/j.1467-9310.1994.tb00847.x)
Schmalensee, Richard (1985), Do Markets Differ Much?, American Economic Review,
Vol. 75, No. 3, pp. 341-351. (DOI: 10.1016/S0167-7187(87)80001-2) Schoonhoven, Claudia Bird (1981), Problems with the Contingency Theory, Testing
Assumptions Hidden within the Language of Contingency Theory, Administrative Science Quarterly, Vol. 26, No. 3, pp. 349-377.
Schumacker, Randall E. – Richard G. Lomax (2010), A Beginner's Guide to Structural
Equation Modeling, Lawrence Erlbaum Associates, Mahwah. (DOI: 10.1080/10705511.2011.607726)
Schumpeter, Joseph Alois (1939), Business Cycles, McGraw-Hill, New York. (DOI:
http://dx.doi.org/10.1017/S0034670500001170)
Schwenk, C. R. (1988), The Essence of Strategic Decision Making, Lexington Books, Lexington, MA, USA (DOI: 10.1111/j.1467-6486.1989.tb00723.x)
Segev, Eli (1987), Strategy, Strategy Making, and Performance in a Business Game,
Management Science, Vol. 33, No. 2, pp. 258-269. (DOI: 10.1002/smj.4250080606)
Segev, Eli (1989), A Systematic Comparative Analysis and Synthesis of two Business-Level Strategic Typologies, Strategic Management Journal, Vol. 10, No. 10, pp. 487-505. (DOI: 10.1002/smj.4250100507)
Sharma, Subhash – Richard M. Durand – Oded Gud Arie (1981), Identification and
Analysis of Moderator Variables, Journal of Marketing Research, Vol. 18, No. 3, pp. 291-300. (DOI: 10.2307/3150970)
Sharma, Sanjay – Harrie Vredenburg (1998), Proactive Corporate Environmental Strategy
and the Development of Competitively Valuable Organisational Capabilities, Strategic Management Journal, Vol. 19, No. 8, pp. 729-753. (DOI: 10.1002/(SICI)1097-0266(199808)19:8<729::AID-SMJ967>3.0.CO;2-4)
Sharma, Sanjay (2000), Managerial Interpretations and Organisational Context as
Predictors of Corporate Choice of Environmental Strategy, Academy of Management Journal, Vol. 43, No. 4, pp. 681-697. (DOI: 10.2307/1556361)
Sharma, Sanjay – J. Alberto Aragón-Correa (2003), A Contingent Resource-Based View
of Proactive Corporate Environmental Strategy, Academy of Management Review, Vol. 28, No. 1, pp. 71-88. (DOI: 10.5465/AMR.2003.8925233)
Shimizu, Nubumasa – Akiko Tamura (2012), Connecting Capital Budgeting Practice with
the Miles and Snow Strategic Type: A Novel Managerial Accounting Approach, Global

232
Conference on Business and Finance Proceedings, Vol. 7, No. 1, pp. 45-56. (DOI: 10.1007/978-1-4899-7138-8_28)
Shoham, Aviv – Felicitas Evangelista – Gerald Albaum (2002), Strategic Firm Type and
Export Performance, International Marketing Review, Vol. 19, No. 3, pp. 236-258. (DOI: http://dx.doi.org/10.1108/02651330210430686)
Shook, Christopher L. – David J. Ketchen Jr. – G. Thomas M. Hult – K. Michele Kacmar
(2004), An Assessment of the Use of Structural Equation Modelling in Strategic Management Research, Strategic Management Journal, Vol. 25, No. 4, pp. 397-404. (DOI: 10.1002/smj.385)
Short, Jeremy C. – David J. Ketchen – Timothy B. Palmer – G. Thomas M. Hult (2007),
Firm, Strategic Group, and Industry Influences on Performance, Strategic Management Journal, Vol. 28, No. 2, pp. 147-167. (DOI: 10.1002/smj.574)
Shortell, Stephen M. – Edward J. Zajac (1990), Perceptual and Archival Measures of
Miles and Snow’s Strategic Types: A Comprehensive Assessment of Reliability and Validity, Academy of Management Journal, Vol. 33, No. 4, pp. 817-832. (DOI: 10.2307/256292)
Sijtsma, Klaas (2009), On the Use, On the Misuse and the Very Limited Usefulness of
Cronbach’s Alpha, Psychometrika, Vol. 74, No. 1, pp. 107-120. (DOI: 10.1007/s11336-008-9101-0)
Sim, A.B. – H.Y. Teoh (1997), Relationships between Business Strategy, Environment and
Controls: A three country study, Journal of Applied Business Research, Vol. 13, No. 4, pp. 57-73. (DOI: 10.1016/j.sbspro.2013.04.013)
Slater, Stanley F. (1989), The Influence of Managerial Style on Business Unit
Performance, Journal of Management, Vol. 15, No. 3, pp. 441-455. (DOI: 10.1177/014920638901500307)
Slater, Stanley F. – John C. Narver (1993), Product-market Strategy and Performance: An
Analysis of the Miles and Snow Strategy Types, European Journal of Marketing, Vol. 27, No. 10, pp. 33-51. (DOI: http://dx.doi.org/10.1108/03090569310045870)
Slater, Stanley F. – John C. Narver (1994), Does Competitive Environment Moderate the
Market Orientation-Performance Relationship?, Journal of Marketing, Vol. 58, No. 1, pp. 46-55. (DOI: http://dx.doi.org/10.2307/1252250)
Slater, Stanley F. – Eric M. Olson (2000), Strategy Type and performance: The Influence
of Sales Force Management, Strategic Management Journal, Vol. 21, No. 8, pp. 813-829. (DOI: 10.1002/1097-0266(200008)21:8<813::AID-SMJ122>3.0.CO;2-G)
Slater, Stanley F. – Eric M. Olson (2001), Marketing’s Contribution to the Implementation
of Business Strategy: an Empirical Analysis, Strategic Management Journal, Vol. 22, No. 11, pp. 1055-1067. (DOI: 10.1002/smj.198)
233
Slater, Stanley F. – Eric M. Olson – Thomas M. Hult (2006), Research Notes and Commentaries: The Moderating Role of Strategic Orientation on the Strategy Formation Capability – Performance Relationship, Strategic Management Journal, Vol. 27, No. 12, pp. 1221-1231. (DOI: 10.1002/smj.569)
Smart, Caroline – Ilan Vertinsky (1984), Strategy and the Environment: A Study of
Corporate Responses to Crisis, Strategic Management Journal, Vol. 5, No. 3, pp. 199-213. (DOI: 10.1002/smj.4250050302)
Smeltzer, Larry R. – Gail L. Fann – V. Neal Nikolaisen (1988), Environmental Practices in
Small Business, Journal of Small Business Management, Vol. 26, No. 3, pp. 55-62.
Smith, Ken G. – James P. Guthrie – Ming Jer Chen (1989), Strategy, Size and Performance, Organisation Studies, Vol. 10, No. 1, pp. 63-81. (DOI: 10.1177/017084068901000104)
Smith, Valdemar – Anni Lene Broberg – Jesper Overgaard (2002), Does Location Matter
for Firms’ R&D Behaviour? Empirical Evidence for Danish Firms, Regional Studies, Vol. 36, No. 8, pp. 825-832. (DOI: 10.1080/0034340022000012270)
Snow, Charles S. - Donald C. Hambrick (1980), Measuring Organisational Strategies:
Some Theoretical and Methodological Problems, Academy of Management Review, Vol. 5, No. 4, pp. 527-538. (DOI: 10.5465/AMR.1980.4288955)
Snow, Charles S. – Lawrence G. Hrebiniak (1980), Strategy, Distinctive Competence, and
Organisational Performance, Administrative Science Quarterly, Vol. 25, No. 2, pp. 317-336. (DOI: 10.1016/0022-4359(93)90008-7)
Sohajda Attila (2013), Tájékoztató a Patikaalapról, Gyógyszerészi Hírlap, XXIV. Évf., 6.
Szám, 9-12. old.
Solow, Robert M. (1956), A Contribution to the Theory of Economic Growth, The Quarterly Journal of Economics, Vol. 70, No. 1, pp. 65-94.
Song, Michael C. – Anthony Di Benedetto – Robert W. Nason (2007), Capabilities and
Financial Performance: The Moderating Effect of Strategic Type, Journal of the Academy of Marketing Science, Vol. 35, No. 1, pp. 18-34. (DOI: 10.1007/s11747-006-0005-1)
Song, Michale X. – Mitzi M. Montoya-Weiss (2001), The Effect of Perceived
Technological Uncertainty on Japanese New Product Development, Academy of Management Journal, Vol. 44, No. 1, pp. 61-80. (DOI: 10.2307/3069337)
Souder, William E. – J. Daniel Sherman – Rachel Davies-Cooper (1998), Environmental
Uncertainty, Organisational Integration, and New Product Development Effectiveness: A Test of Contingency Theory, Journal of Product Innovation Management, Vol. 15, No. 6, pp. 520-533. (DOI: 10.1111/1540-5885.1560520)

234
Spector, William D. – Thomes M. Seldon – Joel W. Cohen (1998), The Impact of Ownership Type on Nursing Home Outcomes, Health Economics, Vol. 7, No. 7, pp. 639-653. (DOI: 10.1002/(SICI)1099-1050(1998110)7:7<639::AID-HEC373>3.0.CO;2-0)
Spector, Paul E. (2006), Method Variance in Organisational Research: Truth or Urban
Legend?, Organisational Research Methods, Vol. 9, No. 2, pp. 221-232. (DOI: 10.1177/1094428105284955)
Spillan, John E. – Parnell, John A. (2006), Marketing Resources and Firm Performance
among SMEs, European Management Journal, Vol. 24, No. 2-3, pp. 236-245. (DOI: 10.1016/j.emj.2006.03.013)
Srnivasan, Mahesh – Debmalya Mukherjee – Ajai S. Gaur (2011), Buyer-Supplier
Partnership Quality and Supply Chain Performance: Moderating Role of Risks and Environmental Uncertainty, European Management Journal, Vol. 29, No. 4, pp. 260-271. (DOI: 10.1016/j.emj.2011.02.004)
Srivastava, Rajendra K. – Tasadduq A. Shervani – Liam Fahey (1999), Marketing,
Business Processes, and Shareholder Value: An Organisationally Embedded View of Marketing Activities and the Discipline of Marketing, Journal of Marketing, Vol. 63, Special Issue, pp. 168-179. (DOI: http://dx.doi.org/10.2307/1252110)
Starbuck, William H. (1976), Organisations and Their Environments In. Dunnette, Marvin
D. (Ed.), Handbook of Industrial Psychology, Rand McNally, Chicago, IL, USA. (DOI: 10.1016/0148-2963(91)90020-X)
Starbuck, William H. – Francis J. Milliken (1988), Executives’ Perceptual Filter: What
They Notice and How They Make Sense, The executive Effect: Concepts and Methods for Studying Top Managers, Vol. 35, No. 1, pp. 1-65.
Stalk, George – Philip Evans – Lawrence E. Schulman (1992), Competing on Capabilities:
The New Rules of Corporate Strategy, Harvard Business Review, Vol. 71, No. 2, pp. 57-69.
Stearns, Timothy M. – Nancy M. Carter – Paul D. Reynolds – Mary L. Williams (1995),
New Firm Survival: Industry, Strategy and Location, Journal of Small Business Venturing, Vol. 10, No. 1, pp. 23-42. (DOI: 10.1016/0883-9026(94)00016-N)
Steenkamp, J.B. – H. Baumgartner (1998), Assessing Measurement Invariance in Cross-
National Consumer Research, Journal of Consumer Research, Vol. 25, No. 1, pp. 78-90. (DOI: 10.1086/209528)
Steiger, James H. (1990), Structural Model Evaluation and Modification: An Interval
Estimation Approach, Multivariate Behavioural Research, Vol. 25, No. 2, pp. 173-180. (DOI: 10.1207/s15327906mbr2502_4)
Steiner, George A. (1979), Strategic Planning, The Free Press, New York

235
Stevens, John M. – Robert P. McGowan (1983), Managerial Strategies in Municipal Government Organisations, Academy of Management Journal, Vol. 26, No. 3, pp. 527-534. (DOI: 10.2307/256264)
Stiglitz, Joseph E. (2010), Freefall: America, Free Markets and the Sinking of the World
Economy, W.W. Norton and Company, New York Sun, Tao – Guohua Wu (2004), Consumption Patterns of Chinese Urban and Rural
Consumers, Journal of Consumer Marketing, Vol. 21, No. 4-5, pp. 245-253. (DOI: http://dx.doi.org/10.1108/07363760410542156)
Sureshchandar, G.S. – Rajendran Chandrashekharan – R.N. Anantharaman (2002),
Determinants of Customer-Perceived Service Quality: A Confirmatory Factor Analysis Approach, Journal of Services Marketing, Vol. 16, No. 1, pp. 9-34. (DOI: http://dx.doi.org/10.1108/08876040210419398)
Swamidass, Paul M. – William T. Newell (1987), Manufacturing Strategy, Environmental
Uncertainty and Performance: A Path AnalyticModel, Management Science, Vol. 33, No. 4, pp. 509-524. (DOI: http://dx.doi.org/10.1287/mnsc.33.4.509)
Szabó Ferenc (2009), Stratégiai dilemmák a gyógyszerpiacon, Corvinus School of
Management, MBA diplomamunka Szepesi Anita (2012), Széll Kálmán felülírta Semmelweist, Gyógyszerészi Hírlap, XXIII.
Évf., 2. Szám, 17. old.
Szeinbach, Sheryl L. – Jeff Allen (1998), Barriers to Change in Regulated Channel Environments: Pharmacist’s Prescribing, Journal of Retailing, Vol. 74, No. 4, pp. 569-589. (DOI: 10.1016/S0022-4359(99)80108-0)
Székely Andrea (2009), A gyógyszerkereskedelem biztonságát érintő kérdések,
Szakdolgozat, BCE, Budapest
Talpová, Zaková Sylvia (2012), Strategies of Multinational and Domestic Companies in the Czech Republic, Doctoral Dissertation, Masaryk University, Brno
Tan, Justin J. – Robert Litschert (1994), Environment-Strategy Relationship and its
Performance Implications: An Empirical Study of Chinese Electronics Industry. Strategic Management Journal, Vol. 15, No. 1, pp. 1-20. (DOI: 10.1002/smj.4250150102)
Tan, Justin J. (2002), The Impact of Ownership Type on Environment-Strategy Linkage
and Performance: Evidence from Transitional Economy, Journal of Management Studies, Vol 39, No. 3, pp.333-354. (DOI: 10.1111/1467-6486.00295)
Tan, Justin J. – David Tan (2005), Environment-Strategy Co-Evolution and Co-
Alignment: A Staged Model of Chinese SOEs Under Transition, Strategic Management Journal, Vol. 26, pp. 141-157. (DOI: 10.1002/smj.437)
Tari Ernő (1995), Adalékok a vállalati stratégia elméletének és gyakorlatának korai
fejlődéstörténetéhez, Vezetéstudomány, XXVI. Évf., 12. Szám, 14-22. old.

236
Tayaouva, Gulzhanat (2011), The Impact of International Entrepreneurial Orientation on
Strategic Adaptation, Procedia Social and Behavioural Sciences, Vol. 24, pp. 571-578. (DOI: 10.1016/j.sbspro.2011.09.078)
Taylor, Kevin – Geoffrey Harding (2001), Pharmacy Practice, Taylor and Francis, New
York Temme, D. – L. Hildebrant (2006), Formative Measurement Models in Covariance
Structure Analysis: Specification and Identification Model, SFB 649 “Economic Risk” Discussion Paper, Humboldt University, Berlin.
The New Webster’s Dictionary (1993), Lexicon Publications, Danbury, CT, USA. (DOI:
10.5465/AMR.1996.9605060)
Thomas, Anisya S. – Robert J. Litschert – Kannan Ramaswamy (1991), The Performance Impact of Strategy-Manager Coalignment: an Emprical Examination, Strategic Management Journal, Vol. 12, No. 7, pp. 509-522. (DOI: 10.1002/smj.4250120704)
Thomas, Anisya S. – Kannan Ramaswamy (1996), Matching Managers to Strategy:
Further Tests of the Miles and Snow Typology, British Journal of Management, Vol. 7, No. 3, pp. 247-261. (DOI: 10.1111/j.1467-8551.1996.tb00118.x)
Thompson, Arthur – A.I. Strickland – J.E. Gamble (2008), Crafting and Executing
Strategy: The Quest for Competitive Advantage – Concept and Cases, Irwin – McGraw-Hill, Boston
Thompson, B. (2004), Exploratory and Confirmatory Factor Analysis: Understanding
Concepts and Applications, American Psychological Association, Washington DC (DOI: http://dx.doi.org/10.1037/10694-000)
Tourangeau, Roger – Lance J. Rips – Kenneth Rasinski (2000), The Psychology of Survey
Response, Cambridge University Press, Cambridge. (DOI: doi: 10.1093/poq/nfn063)
Tsai, Ming-Tien – Yen-Chih, Huang (2008), Exploratory Learning and New Product Performance: The Moderating Role of Cognitive Skills and Environmental Uncertainty, Journal of High Technology Management Research, Vol. 19, No. 2, pp. 83–93. (DOI: 10.1016/j.hitech.2008.10.001)
Turley, L. W. – Ronald E. Milliman (2000), Atmospheric Effects on Shopping Behaviour:
A Review of the Experimental Evidence, Journal of Business Research, Vol. 49, No. 2, pp. 193-211. (DOI: 10.1016/S0148-2963(99)00010-7)
Tversky, Amos – Daniel Kahneman (1979), Prospect Theory: An Analysis of Decision
under Risk, Econometrica, Vol. 47, No. 2, pp. 263-291. Van de Ven, Andrew (1976), A Framework for Organisation Assessment, Academy of
Management Review, Vol. 1, No. 1, pp. 64-78. (DOI: 10.5465/AMR.1976.4408765)
237
Van de Ven, Andrew (2007), Engaged Scholarship: A Giude for Organisational and Social Research, Oxford University Press, Oxford, (DOI: 10.1080/15228053.2012.10845707)
Varian, Hal R. (2004), Mikroökonómia középfokon, KJK Kerszöv, Budapest
Vecsenyi János – Robert Kovach (1996), Vállalatok túlélése és halála Közép- és Kelet-
Európában, Vezetéstudomány, XXVI. Évf. 11. Szám, 5-12. old. Velayudham, Sanal Kumar (2007), Rural Marketing: Targeting the Non-urban Consumer,
Response Books, New Delhi
Veliyath, Rajaram – Stephen M. Shortell (1993), Strategic Orientation, Strategic Planning System, Characteristics and Performance, Journal of Management Studies, Vol. 3, No. 3, pp. 360-381. (DOI: 10.1111/j.1467-6486.1993.tb00309.x)
Venkatraman, N. (1989), The Concept of Fit in Strategy Research: Toward Verbal and
Statistical Correspondance, Academy of Management Review, Vol. 14, No. 3, pp. 423-444. (DOI: 10.5465/AMR.1989.4279078)
Venkatraman, N. – John E. Prescott (1990), Environment-Strategy Coalignment: An
Empirical Test of its Performance Implications, Strategic Management Journal, Vol. 11, No. 1, pp. 1-23. (DOI: 10.1002/smj.4250110102)
Verdu, Antonio J. – Ignacio Tamayo – Antonia Ruiz-Moreno (2012), The Moderating Effect of Environmental Uncertainty on the Relationship between Real Options and Technological Innovation in High-Tech Firms, Technovation, Vol. 32, pp. No. 9-10. 579–590. (DOI: 10.1016/j.technovation.2012.06.001)
Vinzi, Esposito Vincenzo. – Wynne W. Chin – Jörg Henseler – Huiwen Wang (2010),
Handbook of Partial Least Squares: Concepts, Methods and Applications, Springer, Heidelberg-Berlin
Vorhies, Douglas W. – Neil A. Morgan (2003), A Configuration Theory Assessment of
Marketing Organisation Fit with Business Strategy and Its Relationship with Marketing Performance, Journal of Marketing, Vol. 67, No. 1, pp. 100-115. (DOI: http://dx.doi.org/10.1509/jmkg.67.1.100.18588)
Vörös József (1995), A fejlesztési stratégia jelentősége, Marketing és Menedzsment,
XXIX. Évf., 4. Szám, 9-12. old.
Waldman, David A. – Gabriel G. Ramirez – Robert J. House – Phanish Puranam (2001), Does Leadership Matter? CEO Leadership Attributes and Profitability under Conditions of Perceived Environmental Uncertainty, The Academy of Management Journal, Vol. 44, No. 1, pp. 134-143. (DOI: 10.2307/3069341)
Walker, Orville C, Jr. – Robert W. Ruekert (1987), Marketing’s Role in the
Implementation of Business Strategies: A Critical Review and Conceptual Framework, Journal of Marketing, Vol. 51, No. 3, pp. 15-33. (DOI: http://dx.doi.org/10.2307/1251645)

238
Walker, Orville C. Jr. – Harper W. Boyd Jr. – John Mullins – Larréché, Jean-Claude (2003), Marketing Strategy: Planning and Implementation, Irwin – McGraw-Hill, Homewood, IL, USA
Wallerstein, Immanuel (1983), Historical Capitalism, Verso, London Walsh, Kieron (1994), Marketing and Public Sector Management, European Journal of
Marketing, Vol. 28, No. 3, pp. 63-71. (DOI: http://dx.doi.org/10.1108/03090569410057308)
Wang, Cheng-Hua – Kuan-Yu Chen – Shiu-Chun Chen (2012), Total Quality
Management, Market Orientation and Hotel Performance: The Moderating Effects of External Environmental Factors, International Journal of Hospitality Management, Vol. 31, No. 1, pp. 119–129. (DOI: 10.1016/j.ijhm.2011.03.013)
Ward, Peter T. – Rebecca Duray – G. Keong Leong – Chee Chuong Sum (1995), Business
Environment, Operations Strategy and Performance: An Empirical Study of Singapore Manufacturers, Journal of Operations Management, Vol. 13, No. 3, pp. 99-115. (DOI: 10.1016/0272-6963(95)00021-J)
Weber, Max (1947), The Theory of Social and Economic Organisation, Oxford University
Press, New York. (DOI :10.1016/0305-750X(93)90113-N) Weiber, Rolf – Daniel Mühlhaus (2010), Strukturgleichungs-modellierung, Springer,
Heidelberg-Berlin
Wernerfelt, Birger (1984), A Resource-Based View of the Firm, Strategic Management Journal, Vol. 5, No. 2, pp. 171-180. (DOI: 10.1002/smj.4250050207)
White III, George O. – Thomas A. Hemphill – Janice R.W. Joplin – Laurence A. Marsh
(2014), Wholly Owned Foreign Subsidiary Relation-Based Strategies in Volatile Environments, International Business Review, Vol. 23, No. 1, pp. 303–312. (DOI: 10.1016/j.ibusrev.2013.05.006)
Williams, Larry J. – Barbara K. Brown (1994), Method Variance in Organisational
Behaviour and Human Resources Research: Effects on Correlations, Path Coefficients, and Hypothesis Testing, Organisational Behaviour and Human Decision Processes, Vol. 57, No. 2, pp. 185-209. (DOI: 10.1006/obhd.1994.1011)
Williams, Larry J. – Nathan Hartman – Flavia Cavazotte (2010), Method Variance and
Marker Variables: A Review and Comprehensive CFA Marker Technique, Organisational Research Methods, Vol. 13, No. 4, pp. (DOI: 10.1177/1094428110366036)
Willink, Engelbert Tjeenk (2009), Beyond Transactional Management: Transformational
Lessons for Pharmaceutical Sales and Marketing Managers, Journal of Medical Marketing, Vol. 9, No. 2, pp. 119-125. (DOI: 10.1057/jmm.2009.3)
239
Wolinsky, Asher (1983), Retail Trade Concentration Due to Consumers Imperfect Information, The Bell Journal of Economics, Vol. 14, No. 1, pp. 275-282. (DOI: 10.1016/0166-0462(88)90005-1)
Woodside, Arch G. – Daniel P. Sullivan – Randolph J. Trappey (1999), Assessing
Relationships among Strategic Types, Distinctive Marketing Competences and Organisational Performance, Journal of Business Research, Vol. 45, No. 2, pp. 135-146. (DOI: 10.1016/S0148-2963(97)00232-4)
Yang, Z – X. Sun – J.W. Hardin (2010), A Note on the Tests for Clustered Matched-Pair
Binary Data, Biometrical Journal, Vol. 52, No. 5, pp. 638-652. (DOI: 10.1002/bimj.201000035)
Yeung, Kwong – Peter K. C. Lee – Andy C. L. Yeung – T.C.E. Cheng (2013), Supplier
Partnership and Cost Performance: The Moderating Roles of Specific Investments and Environmental Uncertainty, International Journal of Production Economics, Vol. 144, No. 2, pp. 546–559. (DOI: 10.1016/j.ijpe.2013.04.008)
Yip, George S. – Johnny K. Johansson – Johan Roos (1997), Effects of Nationality on
Global Strategy, Management International Review, Vol. 37, No. 4, pp. 365-385.
Zahra, Shaker A. – John A. Pierce II. (1990), Research Evidence On The Miles-Snow typology, Journal of Management, Vol. 16, No. 4, pp. 751-767. (DOI: 10.1177/014920639001600407)
Zahra, Shaker A. – Jeffrey G. Covin (1993), Business Strategy, Technology Policy and
Firm Performance, Strategic Management Journal, Vol. 14, No. 6, pp. 451-478. (DOI: 10.1002/smj.4250140605)
Zahra, Shaker A. (1996), Technology Strategy and Financial Performance: Examining the
Moderating Role of the Firm's Competitive Environment, Journal of Business Venturing, Vol. 11, No. 3, pp. 189-219. (DOI: 10.1016/0883-9026(96)00001-8)
Zahra, Shaker A. – William C. Bogner (1999), Technology Strategy and Software New
Ventures’ Performance: Exploring the Moderating Effect of the Competitive Environment, Journal of Business Venturing, Vol. 15, No. , pp. 135-173. (DOI: 10.1016/S0883-9026(98)00009-3)
Zalai Károly (2011), Újra Együtt!(?), Gyógyszerészi Hírlap, XXII. Évf., 4. Szám, 3. old. Zimmermann, Donald W. (1997), A Note on Interpretation of Paired Samples t Tests,
Journal of Educational and Behavioural Statistics, Vol. 22, No. 3, pp. 349-360. (DOI: 10.3102/10769986022003349)
Zinn, Jacqueline S. – William D. Spector – David L. Weimer – Dana B. Mukamel (2008),
Strategic Orientation and Nursing Home Response to Public Reporting of Quality Measures: An Application of the Miles and Snow Typology, Health Services Research, Vol. 43, No. 2, pp. 598-615. (DOI: 10.1111/j.1475-6773.2007.00781.x)

240
48. Tables Table II: Strategy-matrix: The breakdown of the concept of strategy
STRATEGY Process Content
Idea, Concept Formulation of intended
strategy (strategic planning, goals and objectives)
Intended strategy („ex ante” plans, goals and objectives, competitive tools,
positions to be achieved)
Act
Development of realised strategy (strategy
implementatation and execution, strategic-level
management)
Realised strategy („ex post”behavioural
pattern, structures, positions and business performance)
Source: Antal-Mokos, 1993 Table III: Research streams regarding content elements of strategy CONTENT ASPECTS OF
STRATEGY Individual factors Clusters of factors
Static conditions
Fitting a concrete corporate strategy to certain conditions (e.g. international expansion: restrictions of governmental authorities of target market’s
country pertaining to institutional modes of entry
Outlining the relationships between strategic groups and
clusters of numerous external as well as internal factors (e.g. the prevalence of Porter’s strategic orientations and their realised organisational configuration in
given industries)
Dynamic conditions
Concrete strategic responses given to changes in the
conditions of external and internal environments
(e.g. reactons of manufacturing companies in response to oil-
price boom)
Longitudinal tracking the development of strategic
orientations and clusters of factors and conditions
(e.g. strategic transitions in parallel to changes of industry
life-cycles) Source: Hortoványi et al., 2006
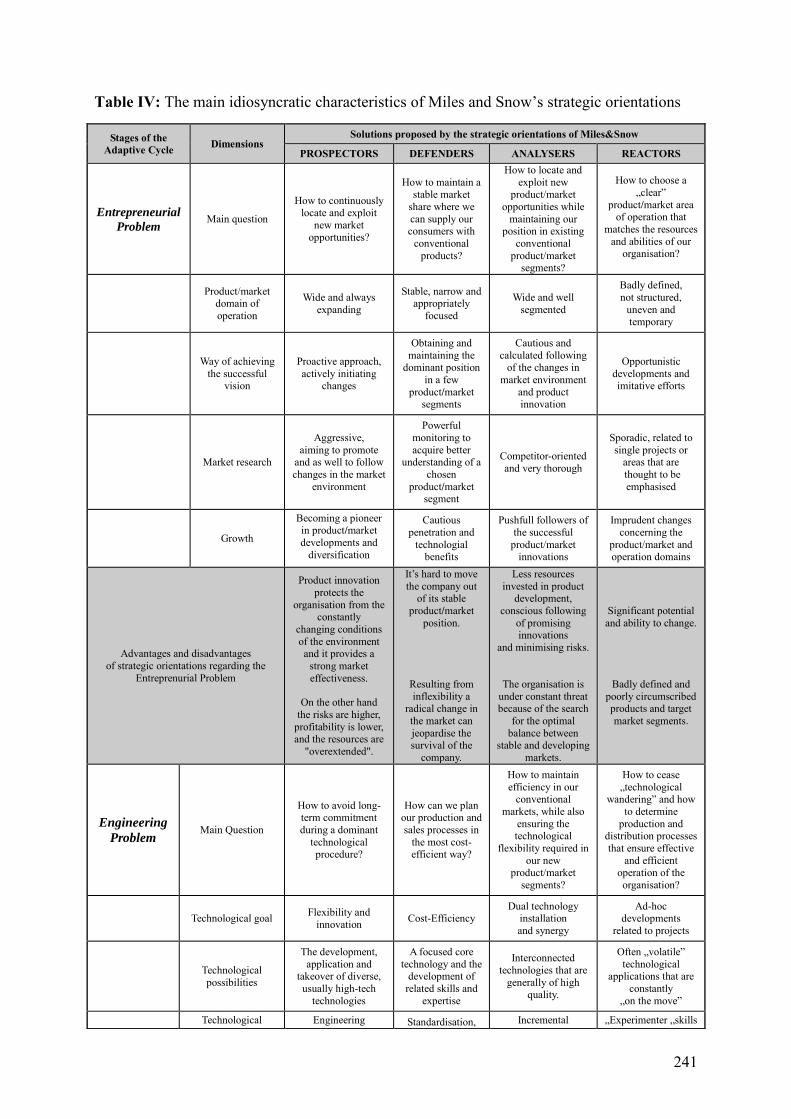
241
Table IV: The main idiosyncratic characteristics of Miles and Snow’s strategic orientations
Stages of the Adaptive Cycle Dimensions
Solutions proposed by the strategic orientations of Miles&Snow
PROSPECTORS DEFENDERS ANALYSERS REACTORS
Entrepreneurial
Problem Main question
How to continuously locate and exploit
new market opportunities?
How to maintain a stable market
share where we can supply our consumers with
conventional products?
How to locate and exploit new
product/market opportunities while
maintaining our position in existing
conventional product/market
segments?
How to choose a „clear”
product/market area of operation that
matches the resources and abilities of our
organisation?
Product/market
domain of operation
Wide and always expanding
Stable, narrow and appropriately
focused
Wide and well segmented
Badly defined, not structured,
uneven and temporary
Way of achieving
the successful vision
Proactive approach, actively initiating
changes
Obtaining and maintaining the
dominant position in a few
product/market segments
Cautious and calculated following
of the changes in market environment
and product innovation
Opportunistic developments and imitative efforts
Market research
Aggressive, aiming to promote
and as well to follow changes in the market
environment
Powerful monitoring to acquire better
understanding of a chosen
product/market segment
Competitor-oriented and very thorough
Sporadic, related to single projects or
areas that are thought to be emphasised
Growth
Becoming a pioneer in product/market developments and
diversification
Cautious penetration and
technologial benefits
Pushfull followers of the successful
product/market innovations
Imprudent changes concerning the
product/market and operation domains
Advantages and disadvantages of strategic orientations regarding the
Entreprenurial Problem
Product innovation protects the
organisation from the constantly
changing conditions of the environment and it provides a
strong market effectiveness.
On the other hand the risks are higher,
profitability is lower, and the resources are
"overextended".
It’s hard to move the company out
of its stable product/market
position.
Resulting from inflexibility a
radical change in the market can jeopardise the survival of the
company.
Less resources invested in product
development, conscious following
of promising innovations
and minimising risks.
The organisation is under constant threat because of the search
for the optimal balance between
stable and developing markets.
Significant potential and ability to change.
Badly defined and poorly circumscribed products and target market segments.
Engineering
Problem Main Question
How to avoid long-term commitment during a dominant
technological procedure?
How can we plan our production and sales processes in
the most cost-efficient way?
How to maintain efficiency in our
conventional markets, while also
ensuring the technological
flexibility required in our new
product/market segments?
How to cease „technological
wandering” and how to determine
production and distribution processes that ensure effective
and efficient operation of the organisation?
Technological goal Flexibility and innovation Cost-Efficiency
Dual technology installation and synergy
Ad-hoc developments
related to projects
Technological possibilities
The development, application and
takeover of diverse, usually high-tech
technologies
A focused core technology and the
development of related skills and
expertise
Interconnected technologies that are
generally of high quality.
Often „volatile” technological
applications that are constantly
„on the move”
Technological Engineering Standardisation, Incremental „Experimenter „skills

242
Source: Table made by the author based on Miles et al. (1978a, 1978b, 1984)
advantages personnel with diverse competencies
specialisation, process control
developments and synergy
Advantages and disadvantages of strategic orientations regarding the
Engineering Problem
Technological flexibility can ensure effective reaction to
market trends.
On the other hand diverse technologies are not able to yield maximum efficiency
in production and distribution.
Technological efficiency ensure
outstanding organisational profitability.
Although it boosts
efficiency, it requires serious investments in order to sustain technological „superiority"
on the long run.
A dual technological profile is able to serve the needs of both stable and variable markets.
However it will never be completely efficient or effective.
Significant flexibility due to low
commitment and low resource exposure.
Inappropriate, badly developed or adapted
technology with low efficiency.
Administrative
Problem Main Question
How to support and facilitate the
coordination of the diverse operations?
What methods can we use to maintain strict control over our organisational processes in order
to sustain maximum
efficiency in operation?
How to differentiate and operate the
organisation’s dual structure and its
processes in order to suit the criteria of
both our stable and dynamic markets?
How to create well defined
responsibilities and authorities in order to
have sufficient control over our
processes of operation?
Dominant coalition
and functional
background
Marketing and R&D Finance and production
management Strategy and planning
Opportunistic „mischievous” entrepreneurs
Planning characteristics
Goal and task oriented,
a project approach aimed at solving
problems and finding opportunities
From the inside out, mainly related
to the control of production and
distribution channels
Comprehensive, focusing on
incremental changes
Not coordinated and usually crisis related
Organisational structure
Product or market oriented, divisional
Functional, linear „authority”
Staff dominated, matrix oriented
Mixed: strong, formal authority
or Loose: less hierarchic
operating design
Control and performance evaluation
Based on market performance (sales,
market share)
Centralised and formal,
mainly based on financial and accounting indicators
Multiple methods: risk calculations, market results,
financial profitability liquidity etc.
Unclear or erroneous evaluation
procedures, avoiding problem
solving
Advantages and disadvantages of strategic orientations regarding the
Administrative Problem
The administrative system is ideal for
maintaining flexibility and
efficiency.
Although it can mismanage resources
and misuse capabilities.
The administrative system perfectly suits the needs to serve the stable product/market
segment.
However due to it's inflexibility the
system is incapable of
reallocating the appropriate
resources in order to respond to new
arising market opportunities.
The administrative system is suited to
balance stability and flexibility.
However if this balance is lost, it will be difficult to restore the equilibrium due
to the dual production and
distribution profiles.
The administrative structure can be
easily transformed.
Unclear roles and responsibilities,
Too high or unreasonably low
number of inspections,
Badly organized or not-at-all organized
administration
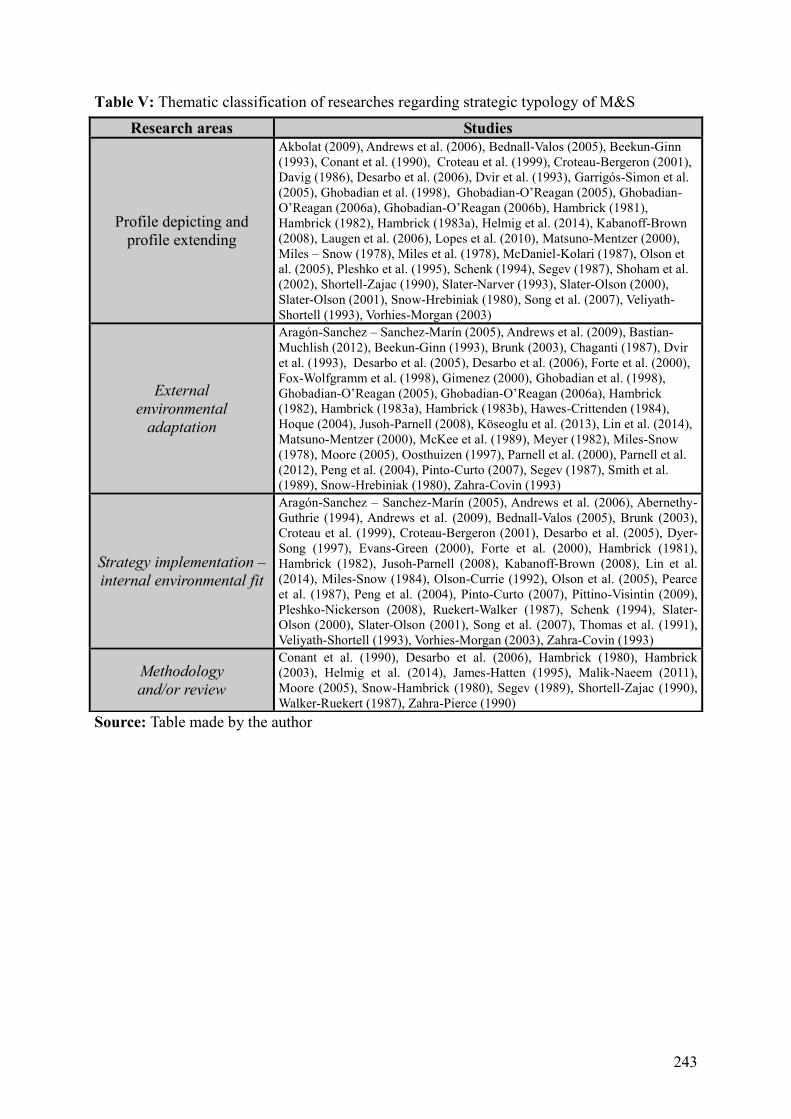
243
Table V: Thematic classification of researches regarding strategic typology of M&S
Source: Table made by the author
Research areas Studies
Profile depicting and profile extending
Akbolat (2009), Andrews et al. (2006), Bednall-Valos (2005), Beekun-Ginn (1993), Conant et al. (1990), Croteau et al. (1999), Croteau-Bergeron (2001), Davig (1986), Desarbo et al. (2006), Dvir et al. (1993), Garrigós-Simon et al. (2005), Ghobadian et al. (1998), Ghobadian-O’Reagan (2005), Ghobadian-O’Reagan (2006a), Ghobadian-O’Reagan (2006b), Hambrick (1981), Hambrick (1982), Hambrick (1983a), Helmig et al. (2014), Kabanoff-Brown (2008), Laugen et al. (2006), Lopes et al. (2010), Matsuno-Mentzer (2000), Miles – Snow (1978), Miles et al. (1978), McDaniel-Kolari (1987), Olson et al. (2005), Pleshko et al. (1995), Schenk (1994), Segev (1987), Shoham et al. (2002), Shortell-Zajac (1990), Slater-Narver (1993), Slater-Olson (2000), Slater-Olson (2001), Snow-Hrebiniak (1980), Song et al. (2007), Veliyath-Shortell (1993), Vorhies-Morgan (2003)
External environmental
adaptation
Aragón-Sanchez – Sanchez-Marín (2005), Andrews et al. (2009), Bastian-Muchlish (2012), Beekun-Ginn (1993), Brunk (2003), Chaganti (1987), Dvir et al. (1993), Desarbo et al. (2005), Desarbo et al. (2006), Forte et al. (2000), Fox-Wolfgramm et al. (1998), Gimenez (2000), Ghobadian et al. (1998), Ghobadian-O’Reagan (2005), Ghobadian-O’Reagan (2006a), Hambrick (1982), Hambrick (1983a), Hambrick (1983b), Hawes-Crittenden (1984), Hoque (2004), Jusoh-Parnell (2008), Köseoglu et al. (2013), Lin et al. (2014), Matsuno-Mentzer (2000), McKee et al. (1989), Meyer (1982), Miles-Snow (1978), Moore (2005), Oosthuizen (1997), Parnell et al. (2000), Parnell et al. (2012), Peng et al. (2004), Pinto-Curto (2007), Segev (1987), Smith et al. (1989), Snow-Hrebiniak (1980), Zahra-Covin (1993)
Strategy implementation – internal environmental fit
Aragón-Sanchez – Sanchez-Marín (2005), Andrews et al. (2006), Abernethy-Guthrie (1994), Andrews et al. (2009), Bednall-Valos (2005), Brunk (2003), Croteau et al. (1999), Croteau-Bergeron (2001), Desarbo et al. (2005), Dyer-Song (1997), Evans-Green (2000), Forte et al. (2000), Hambrick (1981), Hambrick (1982), Jusoh-Parnell (2008), Kabanoff-Brown (2008), Lin et al. (2014), Miles-Snow (1984), Olson-Currie (1992), Olson et al. (2005), Pearce et al. (1987), Peng et al. (2004), Pinto-Curto (2007), Pittino-Visintin (2009), Pleshko-Nickerson (2008), Ruekert-Walker (1987), Schenk (1994), Slater-Olson (2000), Slater-Olson (2001), Song et al. (2007), Thomas et al. (1991), Veliyath-Shortell (1993), Vorhies-Morgan (2003), Zahra-Covin (1993)
Methodology and/or review
Conant et al. (1990), Desarbo et al. (2006), Hambrick (1980), Hambrick (2003), Helmig et al. (2014), James-Hatten (1995), Malik-Naeem (2011), Moore (2005), Snow-Hambrick (1980), Segev (1989), Shortell-Zajac (1990), Walker-Ruekert (1987), Zahra-Pierce (1990)

244
Table VI: Business performance indicators applied in M&S strategic research Study Effectiveness Efficiency Adaptability Innovativity
Abernethy-Guthrie (1994)
Sales revenue and market share
Operating cash flow, profit, cost control and return on
investments
Government and public relations
Market development and
manpower development
Akbolat (2009) N/A Hospital bed occupancy rate and number of physicians per
hospital bed N/A N/A
Andrews et al. (2006)
Comprehensive Performance Assessment index developed for the evaluation of British public service providers, which is derived from the CSP (Core Service Performance) indicator produced from a number of service quality and financial
indicators
Aragón-Sanchez – Sanchez-Marín
(2005) N/A ROI and workforce
productivity
Knowledge and experience in the business unit, ability to produce quality products, capacity required for the
development of new products and processes, and
environmental responsibility
Knowledge and experience in the
business unit, ability to produce quality products,
and capacity required for the development of
new products and processes
Bastian-Muchlish (2012) N/A
Asking about profitability with 1. specific objective
indicators and 2. subjective evaluation of performance by
managers
N/A N/A
Chaganti (1987) N/A Return on Assets (ROA) N/A N/A Conant et al.
(1990) N/A Overall profitability and ROI N/A N/A
Croteau et al. (1999) Growth rate of sales revenue Overall profitability N/A N/A
Croteau-Bergeron (2001) Growth rate of sales revenue Overall profitability N/A N/A
Davig (1986) Percentage change in sales revenue
Percentage change in profit rates N/A N/A
Desarbo et al. (2005)
Relative market share, change in sales revenue (%) and sales revenue realised
compared to the set objectives
Net profit, ROA, ROI, ROIPEC (average rate of
return on invested capital in the past 3 fiscal years), development of ROI compared to the set
objectives and average margin
Average customer-retention rate, retention of key accounts N/A
Desarbo et al. (2006) N/A Overall profitability
and ROI N/A N/A
Dvir et al. (1993)
Number of Orders generated in the short run
Profitability and overall level of achievement of financial
goals
Creation of new business opportunities in the long run
Existence of scientific and technological capabilities
required for long-term prosperity
Dyer-Song (1997)
Aggregate subjective market performance compared to
main competitors as well as the satisfaction of the various
functional units with each other and their commitment
to each other
N/A N/A N/A
Evans-Green (2000) N/A
Return on Sales (ROS), Indebtedness Ratio,
Bank Debt/Total Debt, Equity/Debt Capital,
Total Equity
N/A N/A
Forte et al. (2000) N/A
Total net profit, operating profit, income per “sick” day, operating income to hospital beds ratio and
hospital bed occupancy rate
N/A N/A
Garrigós-Simon et al. (2005)
Growth rate of sales revenue, market share, market/book
value of shares and staisfaction of customers
employees and evaluation of
ROA, ROI and ROS Success in market introduction of new products N/A

245
competitive position
Gimenez (2000)
Sales trends (%) in past 5 years Change in the number of
employees in the past five years (%)
N/A N/A N/A
Ghobadian-O’Reagan (2005) N/A N/A
Market introduction of new products, modification of
existing products and adoption of new technologies
Development and introduction of new
technologies and number of patented
products
Ghobadian-O’Reagan (2006) Market share Overall financial
performance Evaluation of long- and short-
term performance
Subjective evaluation of
overall innovation performance
Hambrick (1981) Number of students enrolled in college, patients treated and insurance customers
N/A N/A N/A
Hambrick (1983a) Change in market share (%) ROI and CFOI N/A N/A
Hambrick (1983b)
Market share and achievement of objectives relating to market position
ROI N/A Quality and
technological modernity
Hawes-Crittenden
(1984)
Change in sales revenues (%)
Changes in margins and net profit (%) N/A N/A
Helmig et al. (2014)
Standard of patient care, quality of processes, overall
success, annual revenue, change (%) in annual
revenue
Overall financial performance and hospital bed
occupancy rate N/A N/A
Hoque (2004) Sales revenue, market share,
employee health and workplace safety
Operating cash flow, profit, cost control and return on
investments
Government and public relations
Market development,
manpower development and
R&D expenditures
James-Hatten (1995) N/A
Average financial leverage, average net interest margin,
ROA and ROE Number of defaulting loans N/A
Jusoh-Parnell (2008)
Product and service quality, reliability of delivery, market
share and growth rate of sales revenue
Productivity, cost control, operating profit, cash flow
and ROI N/A
Development of new products,
R&D expenditures and manpower development
Kabanoff-Brown (2008) N/A
ROA, ROE, share price/earnings per share
(EPS) N/A N/A
Lin et al. (2014) N/A
ROIC, ratio of costs allocated for production and operation to total sales (COGS), and
sales to marketing cost ratio
N/A R&D expenditures
Matsuno-Mentzer (2000)
Change in market share and sales revenue (%) ROI Share of sales of new products
in sales revenues (%) N/A
McKee et al. (1989) Change in market share (%) ROA and ROE N/A N/A
Meier et al. (2007)
Proportion of students having successfully passed Texas Assessment of Academic Skills and proportion of students admitted from
secondary schools to institutes of higher education
N/A N/A N/A
Meyer (1982) Revenue of hospital and number of patients Hospital bed occupancy rate
Number of dismissed employees (physicians and nurses) and introduction of
new services
N/A
Miles-Snow (1978a)
Overall corporate business performance Miles and Snow (1978a) Overall corporate business
performance Miles and Snow
(1978a) Miles et al.
(1978b) Overall corporate business
performance Miles at al. (1978b) Overall corporate business performance Miles at al. (1978b)
Olson et al. (2005)
Overall performance evaluation by managers: To what extent overall business performance of the company met the requirements and how it developed relative to main competitors and to what extent top management was satisfied with
that? Oosthuizen
(1997) Subjective evaluation of sales volume and market
Subjective evaluation of net profit, ROI and cash flow N/A N/A
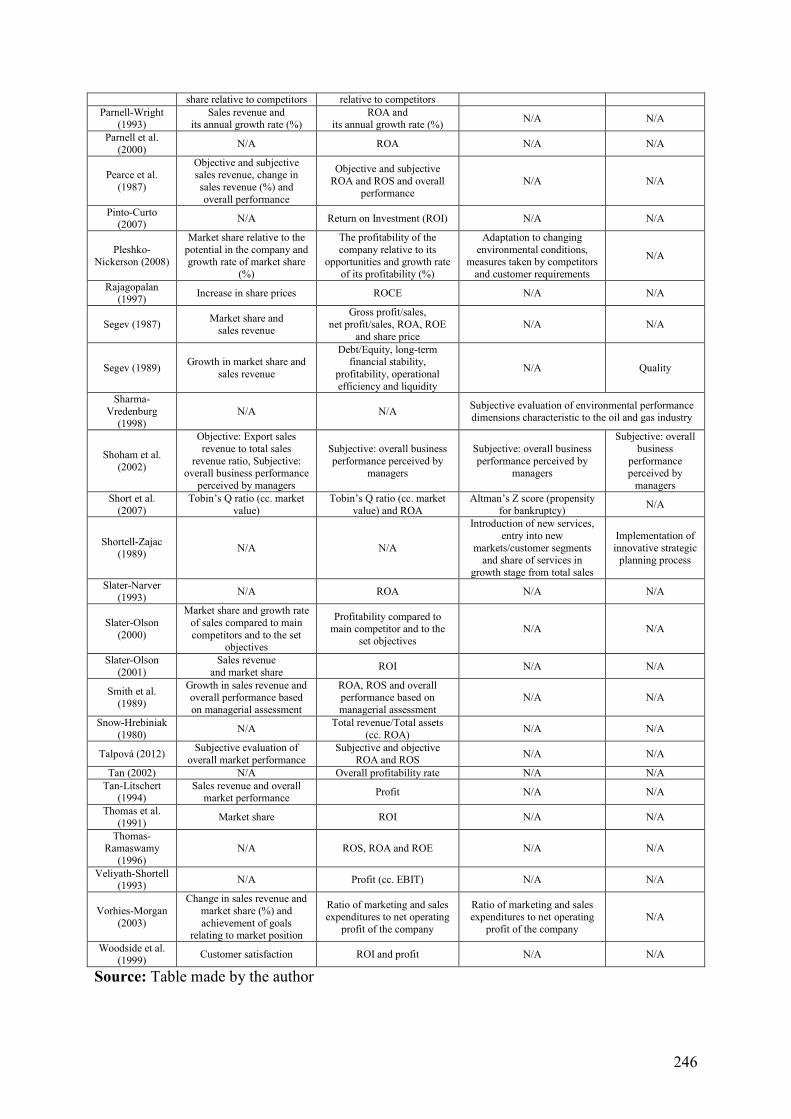
246
share relative to competitors relative to competitors Parnell-Wright
(1993) Sales revenue and
its annual growth rate (%) ROA and
its annual growth rate (%) N/A N/A
Parnell et al. (2000) N/A ROA N/A N/A
Pearce et al. (1987)
Objective and subjective sales revenue, change in sales revenue (%) and overall performance
Objective and subjective ROA and ROS and overall
performance N/A N/A
Pinto-Curto (2007) N/A Return on Investment (ROI) N/A N/A
Pleshko-Nickerson (2008)
Market share relative to the potential in the company and growth rate of market share
(%)
The profitability of the company relative to its
opportunities and growth rate of its profitability (%)
Adaptation to changing environmental conditions,
measures taken by competitors and customer requirements
N/A
Rajagopalan (1997) Increase in share prices ROCE N/A N/A
Segev (1987) Market share and sales revenue
Gross profit/sales, net profit/sales, ROA, ROE
and share price N/A N/A
Segev (1989) Growth in market share and sales revenue
Debt/Equity, long-term financial stability,
profitability, operational efficiency and liquidity
N/A Quality
Sharma-Vredenburg
(1998) N/A N/A Subjective evaluation of environmental performance
dimensions characteristic to the oil and gas industry
Shoham et al. (2002)
Objective: Export sales revenue to total sales
revenue ratio, Subjective: overall business performance
perceived by managers
Subjective: overall business performance perceived by
managers
Subjective: overall business performance perceived by
managers
Subjective: overall business
performance perceived by
managers Short et al.
(2007) Tobin’s Q ratio (cc. market
value) Tobin’s Q ratio (cc. market
value) and ROA Altman’s Z score (propensity
for bankruptcy) N/A
Shortell-Zajac (1989) N/A N/A
Introduction of new services, entry into new
markets/customer segments and share of services in
growth stage from total sales
Implementation of innovative strategic
planning process
Slater-Narver (1993) N/A ROA N/A N/A
Slater-Olson (2000)
Market share and growth rate of sales compared to main competitors and to the set
objectives
Profitability compared to main competitor and to the
set objectives N/A N/A
Slater-Olson (2001)
Sales revenue and market share ROI N/A N/A
Smith et al. (1989)
Growth in sales revenue and overall performance based on managerial assessment
ROA, ROS and overall performance based on managerial assessment
N/A N/A
Snow-Hrebiniak (1980) N/A Total revenue/Total assets
(cc. ROA) N/A N/A
Talpová (2012) Subjective evaluation of overall market performance
Subjective and objective ROA and ROS N/A N/A
Tan (2002) N/A Overall profitability rate N/A N/A Tan-Litschert
(1994) Sales revenue and overall
market performance Profit N/A N/A
Thomas et al. (1991) Market share ROI N/A N/A
Thomas-Ramaswamy
(1996) N/A ROS, ROA and ROE N/A N/A
Veliyath-Shortell (1993) N/A Profit (cc. EBIT) N/A N/A
Vorhies-Morgan (2003)
Change in sales revenue and market share (%) and achievement of goals
relating to market position
Ratio of marketing and sales expenditures to net operating
profit of the company
Ratio of marketing and sales expenditures to net operating
profit of the company N/A
Woodside et al. (1999) Customer satisfaction ROI and profit N/A N/A
Source: Table made by the author

247
VII. Table: The distribution of the M&S’s strategic orientations in the academic studies Study Sample size Prospectors Analysers Defenders Reactors
Abernethy-Guthrie (1994)
49 The exact
distribution is unknown
Not examined The exact distribution is unknown Not examined
Akbolat (2009) 157 38 (24,20%) 49 (31,21%) 49 (31,21%) 21 (13,38)
Andrews et al. (2006) 119
The exact distribution is unknown, but
they are significantly more than
Reactors and slightly less
than Defenders
Not examined
The exact distribution is unknown, but Defender strategic
orientation represents the relative majority, Prospectors follow them, while Reactors are the significant minority.
Andrews et al. (2009)
90 organizations’
237 representatives 62 organisations’
215 representatives
Not examined
The exact distribution is unknown, but Defender strategic
orientation represents the relative majority, Prospectors follow them, and Reactors are the significant minority.
Aragón-Sanchez – Sancez-Marín (2005)
Production: 735 Construction industry: 166 Services: 338
209 21 72
305 68 133
221 77 133
Not examined
Bastian-Muchlish
(2012) 86
The exact distribution is
unknown Not examined The exact distribution is
unknown Not examined
Brunk (2003) 2 1 (MAGlobal) 1 (Tech Data) Not examined Not examined
Bednall-Valos (2006) 241 The distribution of Prospectors, Analysers, Defenders and Reactors is not quantified in the study.
Conant et al. (1990) Two
different methods
148 141
30 (20%) 35 (25%)
61 (41%) 46 (33%)
48 (32%) 56 (39%)
9 (7%) 4 (3%)
Croteau et al. (1999) 301 The distribution of Prospectors, Analysers, Defenders and Reactors is unknown, yet the study only
investigates effects of characteristics of startegic orientations operationalised via multi-item scale
Croteau-Bergeron
(2001) 243
The distribution of Prospectors, Analysers, Defenders and Reactors is unknown because the study only investigates the effects of behavioural characteristics of startegic orientations operationalised via multi-item scale, but the sequence is known: The Analysers are the relative majority, Prospectors and the Defenders follow them, finally the minority of the Reactors can be noticed.
DeSarbo et al. (2005) 709 234 (33%) 220 (31%) 168 (24%) 87 (12%)
DeSarbo et al. (2006) 216 62 (29%) 79 (37%) 59 (27%) 16 (7%)
Di Benedetto-
Song (2003) 245 83 (34%) 76 (31%) 51 (21%) 35 (14%)
Dvir et al. (1993) 76 24 (32%) 32 (42%) 19 (25%) 1 (1%)
Dyer-Song (1997) 943 The distribution of Prospectors, Analysers, Defenders and Reactors is unknown.
Evans-Green (2000)
97 28 (29%) Not examined 24 (25%) 45 (47%)
Forte et al. (2000)
Before external shock: 235
After external shock: 226
17 (7%) 48 (21%)
63 (27%) 67 (30%)
50 (21%) 49 (21%)
105 (45%) 62 (28%)
Garrigós-Simon et al.
(2005) 194 39 (20%) 52 (27%) 85 (44%) 18 (9%)
Gimenez (2000)
108 42
24 11
48 13
16 6
20 12
Ghobadian-O’Reagan
(2005) 188 92 (49%) 87 (46%) 9 (5%) Not examined
Ghobadian-O’Reagan
(2006) 194 93 (47,4%) 86 (44,8%) 10 (5,2%) 6 (2,6%)
Hambrick (1981)
29 33 15
4 (14%) 3 (9%)
3 (20%)
No data
4 (14%) 3 (9%)
3 (20%) No data
Hambrick 165 75 (45%) Not examined 90 (55%) Not examined

248
(1982)
Hambrick (1983)
Growing/Not innovative. 84
Growing/innovative. 119
Mature/not innovative. 456
Mature /Innov. 191
25 (30%) 66 (55%) 31 (6%) 79 (41%)
Not examined 59 (70%) 53 (45%)
425 (94%) 112 (59%)
Not examined
Hawes-Crittenden
(1984) 182 43 (24%) Not examined 47 (26%)
35 (19%) + companies not distributing private label
brands: 125 (31%) Helmig et al. (2014) 178 Prospectors 5
Prosp/Anal: 20 Defenders:18, Analysers: 40
Defenders/Analysers: 37 Reactors: 27
Not able to decide: 26
Hoque (2004) 52
The exact distribution is unknown, but the sample is dominated by the behavioural aspects of Prospector
strategic orientation.
Not examined Not examined
James-Hatten (1995)
408 108 (26%) 143 (35%) 139 (34%) 18 (5%)
Jusoh-Parnell (2008)
120 23 (20%) 81 (67,5%) 5 (4,1%) Reactors: 1 (0,83%)
„not exactly determined”: 10 (8,3%)
Kabanoff-Brown (2008)
460 The distribution of the strategic orientations is unknown.
Köseoglu et al. (2013) 214 87 (40,6%) 26 (12,1%) 76 (35,6%) 25 (11,7%)
Laugen et al. (2006) 42 8 (19%) 27 (64%) 7 (17%) Nem vizsgálták
Lin et al. (2014) 35 The exact distribution of Prospectors, Analysers, Defenders and Reactors is unknown.
Lopes et al. (2010) 56 10 (17,9%) 25 (44,6%) 14 (25%) 7 (12,5%)
Matsuno-Menzter (2000)
364 133 (36%) 130 (35%) 77 (22%) 18 (5%) + 2% N.A.
McDaniel-Kolari (1987)
279 67 (24%) 155 (55%) 57 (21%) Not examined
McKee et al. (1989) 333 54 (16%) 87 (26%) 157 (47%) 31 (11%)
Meier et al. (2007) 500+
The exact distribution is
unknown Not examined The exact distribution is
unknown The exact distribution is
unknown
Meyer (1982) 3 1 (33%) 1 (33%) 1 (33%) 0
Miles et al. (1978) 4 1 (25%) 1 (25%) 1 (25%) 1 (25%)
Miles-Snow (1984) 3 1 (33%) 1 (33%) 1 (33%) Not examined
Moore (2005) 101 The distribution of Prospectors, Analysers, Defenders and Reactors is unknown.
Olson-Currie (1992)
40 8 (20%) 8 (20%) 16 (40%) 3 (8%), no data from 5 companies
Olson et al. (2005) 216 63 (29%) 45 (21%) 108 (50%) (Low-cost and
Differentiated all togheter) Not examined
Oosthuizen (1997) 211
High PEU: 36% Low PEU: 17%
high PEU: 33% low PEU: 39%
high PEU: 28% low PEU: 42%
high PEU: 3% low PEU: 2%
The absolute numbers of Prospectors, Analysers, Defenders and Reactors is unknown.
Parnell-Wright (1993)
104 38 (37%) 31 (30%) 16 (15%) 19 (18%)
Parnell et al. (2000) 137 28 (20%)
Analysers: 32 (23,4%)
„Balancers”:17 (12,4%)
26 (19%) 34 (25%)
Pinto-Curto (2007) 53 12 (23%) 19 (36%) 20 (37%) 2 (4%)
Pittino-Visintin (2009)
141 31 (22%) 35 (25%) 44 (31%) 31 (22%)

249
Pleshko- Nickerson
(2008) 133 35 (26%) 35 (26%) 39 (29%) 24 (18%)
Pleshko et al. (1995) 125 The distribution of the strategic orientations is unknown.
Rajagopalan (1997) 50 14 (28%) Analysers were
not found 20 (40%) 16 (32%)
Ruekert-Walker (1987)
3 1 (33%) 1 (33%) 1 (33%) Not examined
Sharma-Vredenburg
(1998) 7 2 (28,5%) Analysers were
not found Defenders were not found 5 (71,5%)
Shimizu-Tamura (2012)
99 16 (16%) 44 (45%) 21 (22%) 18 (18%)
Shoham et al. (2002) 171 73 (43%) 30 (17%) 58 (34%) 10 (6%)
Shortell-Zajac (1990)
447 407
95 (22%) 104 (27%)
321 (71%) 268 (65%)
31 (7%) 35 (8%) Not examined
Sim-Teoh (1997)
Malaysia: 52 and Singapore: 40 and
30 Australia: 44 and 33
Malaysia: 18 (34,6%) and 18
(41%) Singapore: 14 (35%) and 12
(40%) Australia: 29
(65,9%) and 26 (78,78%)
Malaysia: 18 (34,6%) and 17
(38,6%) Singapore: 15 (37,5%) and 8
(26,7%) AUS: not found
Malaysia: 16 (31%) and 9 (17,6%)
Singapore: 11 (27,5%) and 9 (30%)
Australia: 15 (34%) and 7 (21%)
Not examined
Slater-Narver (1993)
140 33 (23%) 56 (40%) 21 (15%) 30 (22%)
Slater-Olson (2000) 278 91 (33%) 41 (15%) 130 (47%) (Low-cost and
Differentiated togheter) 14 (5%)
Slater-Olson (2001) 208 52 (25%) 68 (33%) 88 (42%) (Low-cost and
Differentiated togheter) Not examined
Olson et al. (2005) 380 125 (33%) 93 (25%) 135 (35%) (Low-cost and
Differentiated togheter) 27 (7%)
Smith et al. (1989) 45 11 (25%) 19 (42%) 10 (22%) 5 (11%)
Snow – Hrebiniak
(1980)
High uncertainty: 165 Low uncertainty: 82
49 (30%) 26 (31%)
14 (8%) 13 (15%)
58 (35%) 22 (27%)
39 (23%) and 9 (4%) not ex. 15 (18%) and 6 (8%) not ex.
Song et al. (2007) 216 62 (29%) 79 (37%) 59 (27%) 16 (7%)
Talpová (2012) 118 19 (16,1%) 46 (39%) 45 (38,1%) 8 (6,8%)
Tan (2002) 56
Distribution of Prospectors, Analysers, Defenders is unknown, yet the correlations of the behavioural
characteristics of strategic orientations were examined separately.
Not examined
Tan-Litschert (1994)
Not known
Distribution of Prospectors, Analysers, Defenders is unknown, yet the correlations of the behavioural
characteristics of strategic orientations were examined separately.
Not examined
Tayaouva (2011) 114 61 (53,5%) 26 (22,8%) 27 (23,7%) Not examined
Thomas et al. (1991) 112 56 (50%) Not examined 56 (50%) Not examined
Thomas-Ramaswamy
(1996) 269 135 (50%) Not examined 134 (50%) Not examined
Veliyath – Shortell (1993)
139 104 (75%) Not examined 35 (25%) Not examined
Vorhies-Morgan (2003)
186 45 (24%) 64 (34%) 77 (42%) Not examined
Woodside et al. (1999) 93 21 (22,5%) 19 (20,4%) 31 (33%) Reactors: 15
„Ambiguous”: 7 Zinn et al.
(2008) 724 137 (19%) 239 (33%) 311 (43%) 48 (6,6%)
Source: Table made by the author

250
Table VIII: Industries and their environmental characteristics examined in M&S research Study Industry Industry-specific characteristics
Abernethy-Guthrie (1994)
2 big Australia-based multinational corporations operating 49 strategic business units in various industries: construction, car part manufacturing, tire manufacturing, steel-making,
clothing, health services, semiconductor and cable manufacturing, food processing and packaging
Rather heterogeneous environmental conditions, diverse industrial branches
Akbolat (2009) 165 public and private hospitals in Turkey Dinamically developing sector, the increase in demand exceeds
the expansion of capacities
Andrews et al. (2006)
152 organisational units of Wales local governments operating in varios sectors of public services
Changed environmental condition system: the state expects rational management and
transparent financial planning from local governments
Service industries characterised by heterogeneous environmental conditions:
education, management of public roads, waste management, law enforcement, culture, social
housing, social care
Andrews et al. (2009)
A total of 1245 senior representatives of 119 organisational units of English local governments providing public services
Changed environmental condition system: the state expects rational management and
transparent financial planning from local governments
Service industries characterised by heterogeneous environmental conditions:
education, management of public roads, waste management, law enforcement, culture, social
housing, social care
Aragón-Sanchez – Sanchez-Marín
(2005)
Spanish small and medium sized construction
and services companies
A sample consisting of the small and medium-sized companies of three broad industries that
can be described as having rather heterogeneous environmental conditions (production, service and construction).
No direct impact of explicit environmental conditions were examined.
Bastian-Muchlish (2012)
West Java and Banten provines’ (Indonesia) largest manufacturing corporations with 86 managers interviewed.
Turbulently changing political, market, natural, socio-cultural and international environments
Boyne-Walker (2004) Organisational units of public services companies of the USA
Changed system of environmental conditions: Managers demanded strategic planning from the federal government, and the performance
had to be systematically accounted for.
Brunk (2003) 1 Fortune TOP 100 (Tech Data) corporation and an emerging foreign trade company (MAGlobal)
The two companies have different fields of operations and face different environmental
conditions.
TechData: a global distributor of hardware, software and IT systems
MAGlobal: a start-up that deals with importing
of premium African products to the USA
Bourgeois (1980b)
12 production and service companies from the
Northwestern states of the USA.
12 industries that can be described by fairly different traits. They operate in different sectors
(production, service, high-tech). No examination of explicit variables were
made.
Chaganti (1987)
Small and middle-sized companies operating in Canada’s Saskachewan province, whose companies mainly produce wood
products, furniture, printing industry products, construction industry products and processed food products
Sectors and their products in different stages of industry and product life cycles
Conant et al. (1990) Health Maintenance Organisations An industry in the early growth stage
Croteau et al. (1999) CEOs of 301 Canadian corporations
Companies with rather heterogeneous environmental conditions which operate in
various industries
Croteau et al. (2001)
243 Canadian corporations with structures information systems and strategies, which have interests in at least 2 industries
Companies operating in rather heterogeneous environmental conditions, mainly in the
secondary and the financial services sector.
Davig (1986) 3 companies in industries exhibiting rather similar structures from
3 US states (clothing accessories, iron casting and iron product manufacturing)
Fragmented, mature industries that can be described as having very intense competition,
and consist of a large number of small and

251
medium-sized companies.
Desarbo et al. (2005)
Exceptionally wide, heterogeneous sample mainly consisting of American, Japanese and Chinese production companies –
medicines, consumer electronics, telecommunications devices, semiconductors, IT, machinery manufacturing
Uncertainties of the market and the competitive environments, and the various
industries of countries with different cultures.
Desarbo et al. (2006) A total of 216 SBUs of American corporations
Industrial sectors with rather heterogeneous environmental conditions: hardware and
software production, electronic equipments, household appliances, medicine,
telecommunications, industrial equipment, chemicals, air conditioners, vehicles
Di Benedetto-Song (2003)
245 Chinese manufacturing companies from the following industries: hardware, electronic devices and household appliances, medicine, machinery and industrial equipment, telecommunication,
transport, manufacture of air conditioning devices
Diverse branches with rather heterogeneous environmental conditions, but the turbulent nature of emerging markets is predominant.
Dvir et al. (1993) Computing and miscellaneous barches of electronics High-tech branches that can be described with dynamic growth, but unpredictable cyclicity
Dyer-Song (1997) American and Japanese companies producing mostly consumer electronics. Most of them are listed on the stock exchange
Companies listed on the stock exchange that are facing recession
Evans-Green (2000)
97 small and middle-sized businesses in Georgia stage (USA) Sectors: manufacturing, wholesale, food industry, recreation,
services
Industries that can be described as having rather heterogeneous environmental conditions, but all
companies in the study went bankrupt
Forte et al. (2000) Hospitals in Florida Facing a drastic environmental shock (New Medicare payment system)
Garrigós-Simon et al. (2005) 189 Spanish catering businesses Spanish tourism industry can be described as
having a balanced growth
Gimenez (2000)
Brazil: Small and medium-sized businesses from one developed southern, and one less developed northern
province (wood and furniture industry, supermarkets, clothing, food industry, tourism, metallurgy, metal processing, etc.)
Small and medium-sized firms of heterogeneous industries of one dynamically growing and one slower growing province.
Ghobadian et al. (1998) Regional electricity providers of England and Wales
With the lowering of the entry barriers and the loosening of the regulation mechanisms,
competitive intensity increased significantly.
O’Reagan-Ghobadian (2005)
194 British small and medium-sized companies from branches of industrial equipment and electronic appliance manufacturing
Industrial equipment: low growth, mild innovation, mature market
Electronic appliances: high growth, constant innovation, immature market
Ghobadian-O’Reagan (2006)
194 British small and medium-sized companies from branches of industrial equipment and electronic appliance manufacturing
Industrial equipment: low growth, mild innovation, mature market
Electronic appliances: high growth, constant innovation, immature market
Hambrick (1981) Colleges, hospitals, insurance companies 3 geographically limited industries that have
completely different characteristics Non-profit vs. For-profit environment
Hambrick (1982) Art colleges, volunteer hospitals (both for and non-profits), life insurance companies
3 geographically limited industries that have completely different characteristics
Non-profit vs. For-profit environment Low vs. High technological complexity
Hambrick (1983a) Based on the PIMS database that consists of mainly production and
manufacturing companies, organising the industrires into „mature/growing” and „innovative/less innovative” categories.
Growing industries vs Mature industries Innovative vs. Less innovative industries
Hambrick (1983b)
Mainly production and manufacturing companies based on the
PIMS database, which manufacture high value capital goods (train equipment, metal casting plants, power plant and electricity grid
equipment, turbines, etc.)
Two different types of mature industries: 1) slowly moving, high value, rarely purchased industrial equipments and companies in a stable
market position 2) markets that are undergoing technological
changes and changes in product differentiation, and firms whose positions are subject to change
Hawes-Crittenden (1984) Retail – USA supermarkets Significant market turbulence (the appearance
of generic, private label branded products)
Helmig et al. (2014)
178 German community and privately owned training and non-training hospitals
Complex environment that can be described as uncertain with strong government regulation
Hoque (2004) 52 companies from New-Zealand that employ at least 100 people Mostly manufacturing companies from sectors
that can be described as broad and having different degrees of uncertainty.
James-Hatten (1995) USA banking sector Deregulation and
increasing competitive intensity

252
Jusoh-Parnell (2008)
120 Malaysian production companies: manufacturing of electronic appliances, iron and steel-making, tire manufacturing, food
industry, medicine, household appliances, furniture production, clothing and fashion industry
Sectors having rather heterogeneous environmental conditions, diverse branches
where the common trait is that they have been recently deregulated and liberalised. The urge to innovate is strong, but resources are scarce.
Kabanoff-Brown (2008)
Very wide heterogeneous sample consisting of production and service companies from Australia that are listed on the stock exchange (FMCG, healthcare, industrial equipments, energy,
telecommunications, etc.)
Heterogeneous companies listed on the stock market, various industries with different
environmental characteristics. Apart from the effect of membership of the industrial and strategic cluster there is no
explicit environmental contingency examined.
Laugen et al. (2006)
55 Australian, Danish and Norvegian small and middle-sized companies from the following industries:
food, textile, paper-making and press, chemicals, plastic and metal-making, machine manufacturing, telecommunications, furniture
production, cars, manufacturing of industrial equipment, construction, electronics
Diverse sectors that have very heterogeneous environmental conditions
Lin et al. (2014) 35 semiconductor manufacturing companies from the USA
Due to the high intensity of competition on a global scale, this industry can be described as
one that has cooperation mechanisms between its local actors.
Lopes et al. (2010) 56 postal service companies that operate as a franchise in Minas Gerais province, Brazil.
Public service sector that went through strong institutional reform.
Matsuno-Mentzer (2000)
Heterogeneous sample containing companies of numerous production and manufacturing companies.
A heterogeneous sample consisting of a bunch of industries. Direct industry-influencing
factors cannot be pointed out.
McDaniel-Kolari (1987) US banking sector
Turbulent environmental changes in the financial sector: entry of new competitors,
changing needs of consumers, technological advances, deregulation, disappearance of the
interest rate ceilings
McKee et al. (1989)
Banking sector, the market of bank deposits High, moderate and low (negative) volatility
Meyer (1982) Hospitals in California The effects of a sudden, significant
environmental shock (physicians’ strike) on strategic adaptation.
Meier et al. (2007) More than 500 school districts and educational institutions in Texas (USA)
A sector that can be described as having significant institutional reforms and
environmental turbulence
Miles-Snow (1978a) Market of college textbook publishers Moderate volatility
Miles-Snow (1978b)
College textbook publishers, electronic equipments in the automobile industry, food processing, healthcare
Industries that can be described as having different characteristics and facing
heterogeneous environmental conditions. No explicitly examined factors can be
determined.
Miles-Snow (1984)
Lincoln Electric (electric welding equipment) HP (computer hardware)
Texas Instruments (computing, electronics) Canadian Pacific (railroad cargo)
Various industries, Turbulent vs. Stable industrial environment
Olson et al. (2005) Extremey broad heterogeneous sample containing production and service companies
No single industrial factor’s effect was explicitly examined.
Oosthuizen (1997) 211 South African companies from Western Cape province Firms operating in sectors that can be described as having severe environmental uncertainty.
Parnell-Wright (1993) USA, catalogue and mail order delivery companies Dynamically growing but rather volatile market
Parnell et al. (2000)
137 vegetable, fruit and spice, i.e. grocery wholesaler companies from the United States
A sector described as having relative stability and moderate environmental change
Pearce et al. (1987)
A sample containing various production companies from one of the eastern states of the USA
Strictly „demarkated” market in terms of geography, although no explicit industrial
characteristics have been examined.
Pinto-Curto (2007) Portugese medical industry
Diverse environmental characteristics that are specific to the industries of drugs,
pharmaceutical products and medicinal devices

253
(stability vs. dynamic changes and innovative environment)
Pittino-Visintin (2009)
141 family owned small and middle-sized companies from the northern part of Italy (Friuli, Venezia, Giulia)
Companies operating in various sectors that face recession and an increasing intensity in
competition
Pleshko et al. (1995) Financial services – The market of the Florida credit unions Strictly regulated,
geographically protected market
Pleshko-Nickerson (2008)
Food, textile, metal processing and machine manufacturing industryies of the USA
4 heterogeneous industries that can be described as having very different
environmental conditions
Rajagopalan (1997) 50 large electricity supplying companies (USA)
In companies that got under the control of professional and financial investors, a
managerial reward (bonus) system based on performance was introduced. This motivational system helped to increase the turbulence in the
internal environment.
Ruekert-Walker (1987)
The strategical business units (SBUs) of a Fortune Top 500 company that manufactures industrial equipment.
SBUs operating in dynamic and stable environments
Segev (1987) A computer game simulation of the washing powder and detergent industry
Artificial industrial environment, free of uncertainties (e.g. inflation, low crediting rates).
Stable growth, low volatility, high intensity competition
Segev (1989) 25 managers who took part in MBA couses, who now manage production and manufacturing companies
Companies that can be described as having a rather heterogeneous industrial environment
Sharma-Vredenburg
(1998)
19 middle and upper management personnel of 7 big Canadian oil and gas industry companies
A sector that is being more and more „threathened” by being held accountable for
environmental and social responsibility
Shimizu-Tamura (2012) 100 Japanese manufacturing companies
Sectors described by heterogeneous environmental characteristics and slight signs
for economic dowturn.
Shoham et al. (2002)
193 Australian production and service companies and businesses providing export services in the following sectors:
food, tobacco, textile, fashion, wood, furniture production, metallurgy, petrochemical companies, mining, paper and press industry, machine manufacturing companies, public transport
Very diverse and heterogeneous (e.g. in terms of turbulence)
industry sectors that can be described as having various levels of export orientation
Short et al. (2007)
Wide heterogeneous sample containing both production and service companies from the USA: chemical and pharmaceutical
industry, industrial equipment manufacturers, computer electronics, communications etc.
Wide sample consisting of mainly production companies operating
in heterogeneous industries
Shortell-Zajac (1989) Hospitals
Hospitals facing environmental turbulence (quickly growing, new service industries vs.
settling in traditional healthcare)
Sim-Teoh (1997) Australian, Malaysian and Singaporean companies Companies from various industries operating in
countries that can be described as having different environments and market economies
Slater-Narver (1993) Wood and furniture industry of the USA
140 SBUs of one corporation operating in markets with completely different conditions,
therefore no explicitly examined industry influencing variable can be specified
Slater-Olson (2000)
Heterogeneous sample consisting of production and manufacturing firms from 24 different industries
No actual comprehensive industry influencing factors can be specified
Slater-Olson (2001)
Extremely wide heterogeneous sample containing both production and service companies
The industries examined were not being influenced by major environmental factors
Smith et al. (1989) Companies manufacturing electronic appliances Well defined industry but nothing is known
about its characteristics, so no explicitly examined environmental variable in the study
Snow-Hrebiniak (1980)
Semiconductor manufacturing, aviation, transport, plastic-making and vehicle manufacturing companies
Low, moderate and high unpredictability, Regulation vs. Deregulation
Talpová (2012) 155 manufacturing companies and their subsidiaries operating in
the Czech Republic, which employ more than 50 people and companies run by Czech owners
Multinational companies: lower local knowledge, higher uncertainty
Czech companies: deep local knowledge, low uncertainty
Tan (2002) 201 top managers of
state-owned, community-owned Chinese companies and companies co-owned by foreigners
„Temporary, emerging” economy that can be described with high growth and severe
enrironmental turbulence. Tan-Litschert
(1994) Electronics companies from North China Industry that can be described with significant decline
Tayaouva (2011) 114 owners and upper management personnel of subsidiaries of Turkish companies, operating in Kazakzstan and Kyrgyzstan
Market environments that can be described with significant growth but severe volatility

254
Thomas et al. (1991) The market of consumer electronics manufacturers
Volatile environment: many new competitors, fast product obsolescence, loads of innovation,
market „niches” continuously „popping-up”
Thomas-Ramaswamy
(1996)
83 Fortune TOP 500 companies from the chemistry, oil and gas, and electronics industry
Companies of industries facing greatly varied environmental conditions, market structures, different degrees of competitive intensity and
product differentiation Veliyath-Shortell
(1993) USA hospitals (for-profit and non-profit) Secular vs. Religious Non-profit vs. For-profit
Vorhies-Morgan (2003) Freight delivery, cargo truck transportation
Industry that went through deregulation and is dynamically growing, and has an increasing
competitive intensity
Woodside et al. (1999)
Middle and top management of 119 Finnish companies. The main sectors: machinery manufacturing, export services, retail,
financial sector, distribution
Predictable environmental conditions, moderate, stable rate of growth
Zinn et al. (2008) 724 nursing homes from the United States
A branch that can be described as having an increasing competitive intensity due to the
systematic publication of charts comparing performace indicators.
Source: Table made by the author Table IX: The performance implications of M&S’s strategic orientations
Study Miles and Snow’s 1. assumption Miles and Snow’s 2. assumption
Abernethy-Guthrie (1994) Reactors and Analysers were not examined in the study
On the basis of a complex performance indicator derived from 12 effectiveness, profitability,
adaptability and innovativity indicators examined, Prospectors outperform Defenders
Akbolat (2009) Based on all dimensions, Reactors exhibit suboptimal performance compared to Prospectors, Analysers and
Defenders
Prospectors performed the best in revenues per hospital bed, Analysers in the management of medical
and other staff, while Defenders, in hospital bed occupancy rate
Andrews et al. (2006) The suboptimal performance of Reactors was confirmed
On the basis of the CPA (CSP) indicator, Prospectors outperform Defenders
Aragón-Sanchez – Sanchez Marín (2005) Reactors were not included in the study
Based on efficiency indicators, there is no significant difference between P, A and D, but in the case of
adaptatability and innovativity indicators, P outperform A and D, in this order, in all three sectors
Bastian-Muchlish (2012) Reactors were not included in the study Prospectors outperform Defenders in non-financial
performance indicators, but Defenders perform better in financial indicators
Bourgeois (1980a) P, A and D outperform Reactors
The most outstanding business performance is exhibited by Analysers, which are able to accumulate optimum ‘slack’ and thereby to successfully adapt to
the environmental circumstances
Chaganti (1987) Reactor companies are outperformed by companies following a viable strategy
Defenders cutting their production costs and working for local markets proved to be successful in industries
in a growth stage, while Prospectors engaged in differentiation proved to be successful in declining
industries
Conant et al. (1990) All three viable strategic orientations outperform Reactors
Although Prospectors have outstanding marketing abilities, their performance does not significantly
differ from that of Defenders and Analysers, thus the business performance of all three ‘stable’ strategic
orientations are nearly equal
Croteau et al. (1999) Viable strategic orientations outperform Reactors
On the basis of both the efficacy and efficiency indicators, Prospectors perform better than Analysers
and Defenders, between which no significant difference was found
Croteau-Bergeron (2001) Reactor companies were not significantly outperformed by Analysers and Prospectors
Prospector companies outperformed Analysers and Defenders on the basis of both the effectiveness and
efficiency indicators
Davig (1986) Reactor companies are outperformed in both effectiveness and efficiency by companies
following a viable strategic orientations
Prospector and Defender companies outperformed Analysers in the growth rate of both profit rates and
sales revenues, although this did not prove to be significant in respect of effectiveness
Desarbo et al. (2005) Reactors are consistently outperformed by others
Both Defenders, which have outstanding marketing capabilities, and Prospectors, which develop
consciously and responsibly, ouperfomed others based on both effectiveness and efficiency indicators
Desarbo et al. (2006) Reactors underperform both in profit and ROI compared to viable strategic orientations
Technological, marketing, market relations and IT capabilities contribute to the profitability of
Prospector, Analyser and Defender companies to a different extent, between which no significant
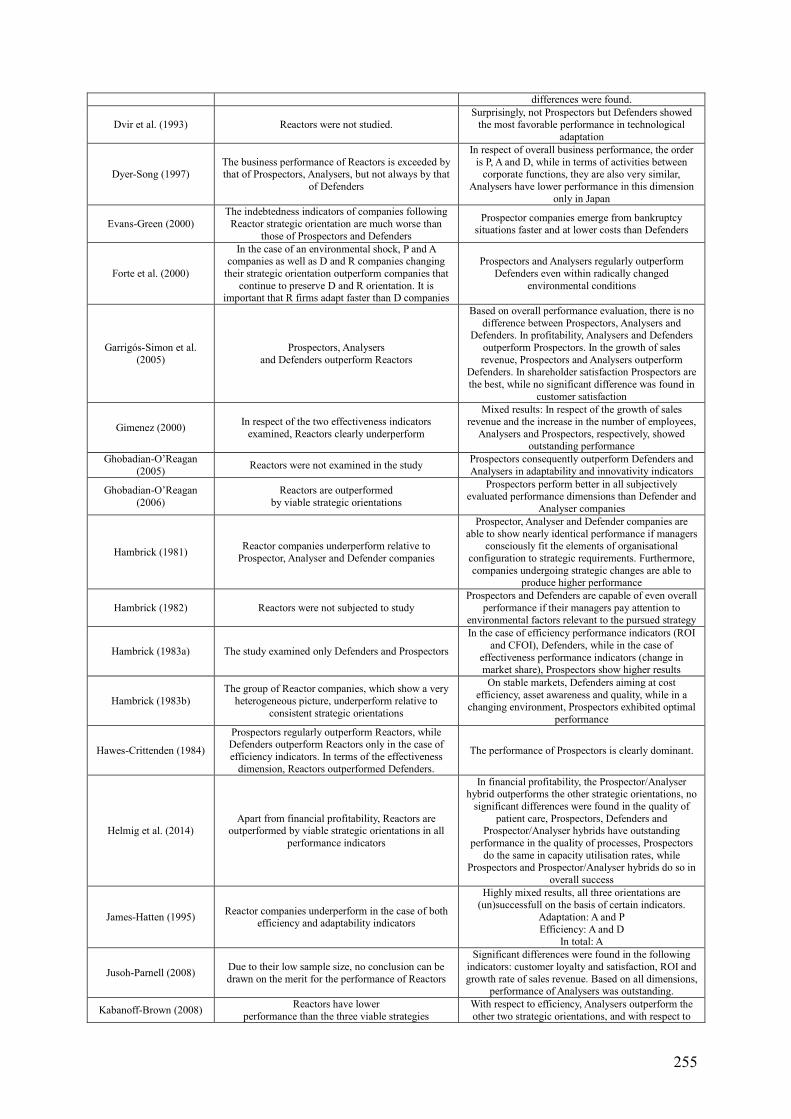
255
differences were found.
Dvir et al. (1993) Reactors were not studied. Surprisingly, not Prospectors but Defenders showed
the most favorable performance in technological adaptation
Dyer-Song (1997) The business performance of Reactors is exceeded by that of Prospectors, Analysers, but not always by that
of Defenders
In respect of overall business performance, the order is P, A and D, while in terms of activities between
corporate functions, they are also very similar, Analysers have lower performance in this dimension
only in Japan
Evans-Green (2000) The indebtedness indicators of companies following
Reactor strategic orientation are much worse than those of Prospectors and Defenders
Prospector companies emerge from bankruptcy situations faster and at lower costs than Defenders
Forte et al. (2000)
In the case of an environmental shock, P and A companies as well as D and R companies changing
their strategic orientation outperform companies that continue to preserve D and R orientation. It is
important that R firms adapt faster than D companies
Prospectors and Analysers regularly outperform Defenders even within radically changed
environmental conditions
Garrigós-Simon et al. (2005)
Prospectors, Analysers and Defenders outperform Reactors
Based on overall performance evaluation, there is no difference between Prospectors, Analysers and
Defenders. In profitability, Analysers and Defenders outperform Prospectors. In the growth of sales revenue, Prospectors and Analysers outperform
Defenders. In shareholder satisfaction Prospectors are the best, while no significant difference was found in
customer satisfaction
Gimenez (2000) In respect of the two effectiveness indicators examined, Reactors clearly underperform
Mixed results: In respect of the growth of sales revenue and the increase in the number of employees,
Analysers and Prospectors, respectively, showed outstanding performance
Ghobadian-O’Reagan (2005) Reactors were not examined in the study Prospectors consequently outperform Defenders and
Analysers in adaptability and innovativity indicators
Ghobadian-O’Reagan (2006)
Reactors are outperformed by viable strategic orientations
Prospectors perform better in all subjectively evaluated performance dimensions than Defender and
Analyser companies
Hambrick (1981) Reactor companies underperform relative to Prospector, Analyser and Defender companies
Prospector, Analyser and Defender companies are able to show nearly identical performance if managers
consciously fit the elements of organisational configuration to strategic requirements. Furthermore, companies undergoing strategic changes are able to
produce higher performance
Hambrick (1982) Reactors were not subjected to study Prospectors and Defenders are capable of even overall
performance if their managers pay attention to environmental factors relevant to the pursued strategy
Hambrick (1983a) The study examined only Defenders and Prospectors
In the case of efficiency performance indicators (ROI and CFOI), Defenders, while in the case of
effectiveness performance indicators (change in market share), Prospectors show higher results
Hambrick (1983b) The group of Reactor companies, which show a very
heterogeneous picture, underperform relative to consistent strategic orientations
On stable markets, Defenders aiming at cost efficiency, asset awareness and quality, while in a
changing environment, Prospectors exhibited optimal performance
Hawes-Crittenden (1984)
Prospectors regularly outperform Reactors, while Defenders outperform Reactors only in the case of efficiency indicators. In terms of the effectiveness
dimension, Reactors outperformed Defenders.
The performance of Prospectors is clearly dominant.
Helmig et al. (2014) Apart from financial profitability, Reactors are
outperformed by viable strategic orientations in all performance indicators
In financial profitability, the Prospector/Analyser hybrid outperforms the other strategic orientations, no
significant differences were found in the quality of patient care, Prospectors, Defenders and
Prospector/Analyser hybrids have outstanding performance in the quality of processes, Prospectors
do the same in capacity utilisation rates, while Prospectors and Prospector/Analyser hybrids do so in
overall success
James-Hatten (1995) Reactor companies underperform in the case of both efficiency and adaptability indicators
Highly mixed results, all three orientations are (un)successfull on the basis of certain indicators.
Adaptation: A and P Efficiency: A and D
In total: A
Jusoh-Parnell (2008) Due to their low sample size, no conclusion can be drawn on the merit for the performance of Reactors
Significant differences were found in the following indicators: customer loyalty and satisfaction, ROI and growth rate of sales revenue. Based on all dimensions,
performance of Analysers was outstanding.
Kabanoff-Brown (2008) Reactors have lower performance than the three viable strategies
With respect to efficiency, Analysers outperform the other two strategic orientations, and with respect to
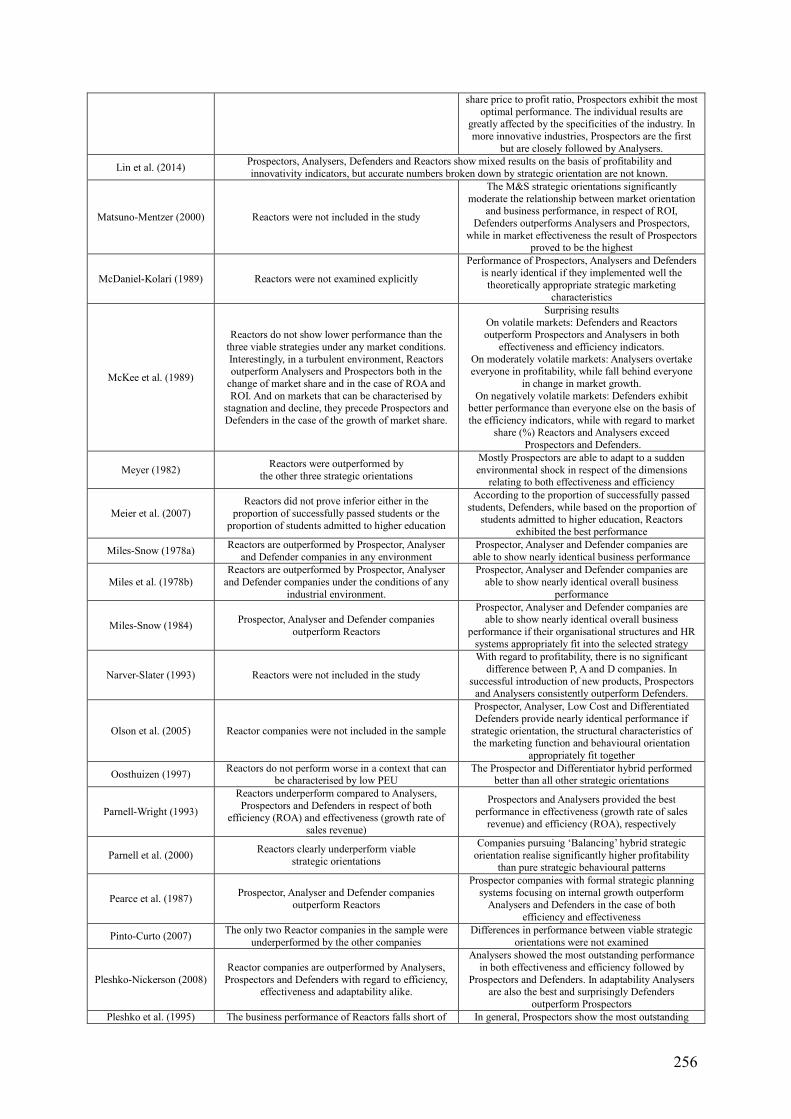
256
share price to profit ratio, Prospectors exhibit the most optimal performance. The individual results are
greatly affected by the specificities of the industry. In more innovative industries, Prospectors are the first
but are closely followed by Analysers.
Lin et al. (2014) Prospectors, Analysers, Defenders and Reactors show mixed results on the basis of profitability and innovativity indicators, but accurate numbers broken down by strategic orientation are not known.
Matsuno-Mentzer (2000) Reactors were not included in the study
The M&S strategic orientations significantly moderate the relationship between market orientation
and business performance, in respect of ROI, Defenders outperforms Analysers and Prospectors,
while in market effectiveness the result of Prospectors proved to be the highest
McDaniel-Kolari (1989) Reactors were not examined explicitly
Performance of Prospectors, Analysers and Defenders is nearly identical if they implemented well the
theoretically appropriate strategic marketing characteristics
McKee et al. (1989)
Reactors do not show lower performance than the three viable strategies under any market conditions. Interestingly, in a turbulent environment, Reactors outperform Analysers and Prospectors both in the
change of market share and in the case of ROA and ROI. And on markets that can be characterised by
stagnation and decline, they precede Prospectors and Defenders in the case of the growth of market share.
Surprising results On volatile markets: Defenders and Reactors outperform Prospectors and Analysers in both
effectiveness and efficiency indicators. On moderately volatile markets: Analysers overtake everyone in profitability, while fall behind everyone
in change in market growth. On negatively volatile markets: Defenders exhibit
better performance than everyone else on the basis of the efficiency indicators, while with regard to market
share (%) Reactors and Analysers exceed Prospectors and Defenders.
Meyer (1982) Reactors were outperformed by the other three strategic orientations
Mostly Prospectors are able to adapt to a sudden environmental shock in respect of the dimensions
relating to both effectiveness and efficiency
Meier et al. (2007) Reactors did not prove inferior either in the
proportion of successfully passed students or the proportion of students admitted to higher education
According to the proportion of successfully passed students, Defenders, while based on the proportion of
students admitted to higher education, Reactors exhibited the best performance
Miles-Snow (1978a) Reactors are outperformed by Prospector, Analyser and Defender companies in any environment
Prospector, Analyser and Defender companies are able to show nearly identical business performance
Miles et al. (1978b) Reactors are outperformed by Prospector, Analyser
and Defender companies under the conditions of any industrial environment.
Prospector, Analyser and Defender companies are able to show nearly identical overall business
performance
Miles-Snow (1984) Prospector, Analyser and Defender companies outperform Reactors
Prospector, Analyser and Defender companies are able to show nearly identical overall business
performance if their organisational structures and HR systems appropriately fit into the selected strategy
Narver-Slater (1993) Reactors were not included in the study
With regard to profitability, there is no significant difference between P, A and D companies. In
successful introduction of new products, Prospectors and Analysers consistently outperform Defenders.
Olson et al. (2005) Reactor companies were not included in the sample
Prospector, Analyser, Low Cost and Differentiated Defenders provide nearly identical performance if
strategic orientation, the structural characteristics of the marketing function and behavioural orientation
appropriately fit together
Oosthuizen (1997) Reactors do not perform worse in a context that can be characterised by low PEU
The Prospector and Differentiator hybrid performed better than all other strategic orientations
Parnell-Wright (1993)
Reactors underperform compared to Analysers, Prospectors and Defenders in respect of both
efficiency (ROA) and effectiveness (growth rate of sales revenue)
Prospectors and Analysers provided the best performance in effectiveness (growth rate of sales
revenue) and efficiency (ROA), respectively
Parnell et al. (2000) Reactors clearly underperform viable strategic orientations
Companies pursuing ‘Balancing’ hybrid strategic orientation realise significantly higher profitability
than pure strategic behavioural patterns
Pearce et al. (1987) Prospector, Analyser and Defender companies outperform Reactors
Prospector companies with formal strategic planning systems focusing on internal growth outperform
Analysers and Defenders in the case of both efficiency and effectiveness
Pinto-Curto (2007) The only two Reactor companies in the sample were underperformed by the other companies
Differences in performance between viable strategic orientations were not examined
Pleshko-Nickerson (2008) Reactor companies are outperformed by Analysers,
Prospectors and Defenders with regard to efficiency, effectiveness and adaptability alike.
Analysers showed the most outstanding performance in both effectiveness and efficiency followed by
Prospectors and Defenders. In adaptability Analysers are also the best and surprisingly Defenders
outperform Prospectors Pleshko et al. (1995) The business performance of Reactors falls short of In general, Prospectors show the most outstanding

257
the other strategic orientations performance even in the case of efficiency indicators, Analysers perform nearly at the same level on the
basis of one or two dimensions
Rajagopalan (1997) Reactors did not prove to be inferior even on the
basis of several performance indicators (e.g. market penetration and efficiency).
Defenders perform better in efficiency type indicators, while Prospectors do so in effectiveness.
Ruekert-Walker (1987) Reactors were not included in the study
Analysers and Defenders are more successful in the handling of conflicts than Prospectors, the highest
dissatisfaction between functions is found also among Prospectors
Segev (1987) The performance of Reactors do not result in
appropriate business performance even in the case of a strategic planning system that is applied if needed
In the case of most effectiveness and efficiency indicators, Defenders are outperformed by Analysers and Prospectors, which exhibit nearly identical results
Segev (1989) Reactors consistently underperform the three viable strategies
In the case of efficiency, Analysers and Defenders, while in the case of effectiveness, Analysers and Prospectors show outstanding performance. In
general, Analysers prove to be the most successful
Sharma-Vredenburg (1998) Reactor companies are outperformed by Prospectors
Environmental performance of Prospectors is outstanding, which also led to an increase in
competitiveness
Shoham et al. (2002) The business performance of Prospectors, Defenders, Analysers and Reactors was not compared explicitly, the
study examined what effect the various functional areas and market orientation have on export and overall business performance within certain strategic orientations
Shortell-Zajac (1989) Reactor companies were not involved in the study In adaptability and innovativity dimensions,
Prospectors clearly outperform Analysers and Defenders
Slater-Olson (2000) The business performance of Reactors falls short of
that of Prospector, Analyser, Low Cost and Differentiated Defender companies
Prospector, Analyser, Low Cost and Differentiated Defender companies achieve the same performance if
their sales management functions appropriately fit the strategic orientation to be followed.
Slater-Olson (2001) Reactors were not subjected to study
The four viable strategies provide equivalent performance if the business strategy (Prospector, Analyser, Low Cost Defender and Differentiating Defender) and the marketing strategy (Aggressive,
Mass, Minimising and Value) fit optimally
Smith et al. (1989) Prospector, Analyser and Defender companies outperform Reactors
Prospector, Analyser and Defender companies exhibit similar performance only if the size of the
organisation fits the strategic orientation. It is interesting that Prospectors and Defenders showed higher performance if they had a larger/smaller size
Snow-Hrebiniak (1980)
In competitive industries, the business performance of Prospectors, Analysers and Defenders surpasses
that of Reactors, but in a regulated environments, the opposite may also occur and Reactors are also able to
show outstanding performance
Analysers outperformed Prospectors and Defenders in the case of most industries examined: semiconductor
manufacturing companies, airlines and plastic and motor vehicle companies
Talpová (2012) Due to small sample size, Reactors were not included in the methods aimed at performance assessment
The rate of return on assets (ROA) of Analysers exceeded those of Prospectors and Defenders
Tan (2002) Reactors were not examined in the study
Defenders are the best performers among state- and community-owned companies, Prospectors in the case
of private companies, and Analysers in the case of joint ventures
Tan-Litschert (1994) Reactors were not included in the research Defenders are the best in overall performance and profit, while Prospectors in market share
Thomas et al. (1991) Reactors were not examined in the study.
Prospector and Defender companies show similar performance if the personal characteristics of their
senior executives appropriately fit the followed strategy. This finding is stronger for Prospectors
operating in dynamic environments.
Thomas-Ramaswamy (1996) Reactors were not examined in the study
Prospector and Defender companies show similar performance if the personal characteristics of their
senior executives appropriately fit the pursued strategy. This finding is stronger for Prospectors
operating in dynamic environments. Veliyath-Shortell (1993) Reactors were not examined Prospectors outdid Defenders also in profitability.
Vorhies-Morgan (2003) Reactors were not examined
Prospectors, Analysers and Defenders provide nearly identical performance in respect of both effectiveness
and efficiency if organisational characteristics of marketing function appropriately fit selected strategy
Woodside et al. (1999) Reactors were insignificantly outperformed in profits, ROI and customer satisfaction alike
Prospectors are the best performers in profit, ROI and customer satisfaction alike
Source: Table made by the author

Table X: Depicting the organisational profiles of top performing M&S’s SOs Dimension Prospectors Analyser Low-Cost
Defenders Differentiated
Defenders Product range Wide: mainly new
products Wide: conventional and
new products mixed Narrow: few,
traditional products Narrow: conventional
and new products mixed
Targeted and served customer segments
Many, constantly changing customer
segments
Many: both changing and stable segments
Few, wide, stable segments
Few, narrow, stable segments
Organisational structure Divisional Matrix Functional Functional/Divisional Organisational size Medium Large Large Small/medium Marketing strategy Aggressive marketing Mass marketing Marketing minimisation Value based marketing
Formalisation Informal Slightly informal Formal Informal Decision making Decentralised Decentralised Slightly centralised Decentralised
Tasks and employee competences
Generality and specialisation
Specialisation and generality Generality Specialization
Behavioural orientation Innovation and customer Customer, competitor and innovation
Internal (cost) and competitor
Customer, competitor and internal ( cost)
Conflict managing method Integrative Integrative Integrative/Compulsion Integrative
Promotion Differentiation-based Differentiation-based Price-based Differentiation-based
Ideal environment Technological and market turbulence
Moderate growth markets
Stable, moderate growth or stagnant markets
Moderate volatility or stagnant markets
Strategic Planning system
Formalised, considerable market research, enhanced
participation of senior managers and other organisational units
Formalised, considerable market research, enhanced
participation of senior managers and other organisational units
Formalised, less market research, low
participation of senior managers, high
participation of other organisational units
Informal, prominent market research,
enhanced participation of senior managers and
other organisational units
Sales strategy Relationship-based Relationship-based Transaction-based Relationship-based
Sales function Outsourcing or „indoors” „Indoors” Outsourcing „Indoors”
Supervision of sales function Moderate Moderate Low Mixed
Supervision methods of sales personnel „Output”-based „Output”-based „Output”-based Behaviour-based
Rewarding of sales personnel
Low base salary + high incentive bonus
Stabil base salary + bonus
Stable base salary + less bonus
High base salary + less bonus
Production
Mass customisation and prototypical character,
emphasis on effectiveness and product design
High volume, low cost, mass customisation and sometimes prototypical
manufacturing
High volume, low cost, emphasis on efficiency and standardisation of
processes
Low volume, medium or high cost, one to one
customisation, emphasis on quality
Basic HR approach Acquisition of human
resources and competences
Acquisition and allocation of human
resources and competences
Development and training of human
resources and competences
Development and training of human
resources and competences
HR recruitment and admission
Multiple at entry and in-house as well, based on
professional and psychological aspects
Mixed Non-recurring, based on filtering the inadequate
employees
Multiple at entry and in-house, based on
professional, psychological and relationship-based
aspects Corporate trainings Moderate Many or moderate Many Many
Career plan of employees Informal, moderate Formal, comprehensive Formal, comprehensive Formal, comprehensive
CEO age Younger Mixed Elder Mixed CEO education High High Lower High
Time spent at the company before elected
as CEO Less More Much Much
CEO tenure Less More Much Much CEO education,
professional qualifications
R+D, product development, marketing Production, marketing Production, finance and
accounting Marketing, HR
Vertical integration Seldom, rather backwards
Yes, both forward and backwards
Yes, both forward and backwards Yes, rather backwards
Horizontal integration Yes Yes Not typical Not typical Autonomy of
organizational units, divisions, SBUs
Large Medium Small Medium
Source: Table made by the author

259
Table XI: Classification and terms of specification variables TYPOLOGY OF
SPECIFICATION VARIABLES Correlates to dependent and/or
independent variables Not related to neither dependent
nor to independent variables
Interaction effect is not significant
Intervening, Exogenous
Antecedent, Suppressor or Independent variable
Homologiser Moderator
Significant interaction effect
Quasi Moderator
Pure Moderator
Source: Figure made by the author based on Sharma et al. (1981)

260
Table XII: Summary of the moderating effect of environmental factors influencing the relationship between strategy and performance
Study Independent variables (Strategy)
Dependent variables (Business
Performance)
Moderating variables (Environment) Results
Agbejule (2005) Accounting system used by
management (MAS) and strategy
Managerial performance
Perceived environmental uncertainty (PEU)
The moderator variable inhances the effect of the strategic orientation and MAS on the performance of the managers.
Badri et al. (2000) Operations strategy The company's overall business performance
(high / low)
Perceived environmental uncertainty (PEU)
The PEU has a direct impact on business performance; those companies are capable of higher performance, which adapt their
operational strategy to the environmental changes.
Bastian-Muchlish (2012)
Strategic orientation: Defender and Prospector
Financial/Non-financial perfomance
measures and organisational performance
Perceived environmental uncertainty (PEU) and competitive intensity
In case the extent of competition is high in the environment, the growth (Prospector) orientation can be the key to success, especially considering non financial indicators. The PEU,
characterized by the changing intensity of the competition on the market, moderates the positive relation between strategic orientation and organisational performance, as well as the
relation between strategy and the utilization and development of non financial metrics.
Bechor et al (2010)
Success factors of SISP (Strategic Information
Systems Planning): Planning and implementing strategy
Success of SISP: Effectiveness,
Efficiency
SISP environment (dynamism, business
strategy, importance of IT, heterogeneity), SISP
approach
Positive connection between the success factors and business performance. The connection between the independent and
dependent variables is greatly affected by the external environmental and organizational factors of the SISP
implementation.
Bisbe-Malagueno (2012)
Content elements of strategic orientations’ performance
measurement system: 1. Integration of goals
2. Involvement of senior managers
3. Cross-functional relationships
4. Exploration of causal relationships
5. Involvement of managers of different functional areas
5. Ongoing goals/action plans
Financial performance of the organisation
(ROA, ROS) Environmental dynamics
The moderating variable has a statistically evincible, but very slight negative effect on the dependent variable. However
amongst the majority of the dependent and independent variables, a significant relation can be shown.

261
Study Independent variables (Strategy)
Dependent variables (Business
Performance)
Moderating variables (Environment) Results
6. Multivariate indicators
Bourgeois (1985) Strategic consensus, number of goals/objectives
Net sales revenue, capital, return on investment, EPS
growth
Environmental uncertainty
The moderating variable has a direct positive effect on the dependent variables as well, besides it can be shown that the
intensity of the relationship between the strategic consensus and the performance indicators is facilitated by the degree of
environmental uncertainty.
Bstelier (2005)
Marketing and technological expertise, organization of the team involved in the project and process management in
the new product development strategy
Time efficiency (in case of new product
launch)
Perceived environmental uncertainty
The marketing expertise does not influence the dependent variables, as much as technological proficiency. One of the most influential factors is the composition of the project team. Process
organisation has a direct effect on time management. The moderating variable has a direct effect on the depending variable
(fe. in Australia it is very strong, while its effect is weaker in Canada), but it does not directly affect the relation of independent
and- dependent variables.
Chathoth-Olsen (2007)
Corporate strategy and capital structure
Performance of the company (ROE, ROA,
ROS, ROC)
Perceived environmental risk
The capital structure and the strategy of the company influence the development of the key performance indicators. The
management method of environmental impacts has an effect on the relationship of independent and dependent variables. The
macrobusinessal effects influence the capital structure.
Child (1972) HR and technological
strategy, organisational structure, scale of operation
Operational efficiency Complexity, diversity, lack of munificence
The environmental factors do not have a strong moderating effect on the relation between strategy and performance, as the previous
theoretical literature and empirical researches claimed.
Choe (2003) Strategic development of the information system ROS, ROA, PNP, PFP Perceived environmental
uncertainty (PEU)
The strategic application of the information system has a positive effect on the business performance of the company. PEU moderates the relation of the dependent and independent
variables, its negative effect is enhanced when the explanatory

262
Study Independent variables (Strategy)
Dependent variables (Business
Performance)
Moderating variables (Environment) Results
variable is chosen incorrectly.
Chong-Chong (1997)
Accounting strategy and system applied by the management (MAS)
SBU's overall business performance
Perceived environmental uncertainty (PEU)
The PEU operates as an independent (explanatory) and moderating variable, so it is an important determinant of the SBU
performance.
Davis-Walters (2004)
Aggressive, "Intermediate" (Moderate) and Passive
stretegic orientation
Composite indicator for business performance combining:
effectiveness, efficiency and
operational indicators
Operating environment described as: Hostile vs.
"munificent" (technological and
business) and market driven vs. bureaucratic
coordination mechanisms
The positive effect of strategic orientation on business performance can be characterized by the market coordination
mechanisms, which enhance in "generous" operating environment. Companies following the aggressive strategic
orientations however has an outstanding performance, regardless of the environmental conditions.
DeSarbo et al. (2005)
Hybrid strategic orientations combining Miles and Snow’s
behavioural patterns and their capabilities
Profitmargin, ROIPEC, ROI, ROA,
RMS, CUSRET, KEYCUSRET,
Revenue growth, profit margins, sales revenue and ROI relative to the objectives of the SBU
Environmental uncertainty
The match of strategic orientation and the capabilities of the company, and the strategic orientation and degree of
renvironmental uncertainty have significant effect on the development of the performance indicators.
Dröge-Calantone (1996)
Organisational structure and strategic orientation
(dominant/non-dominant) for new product development
Product development success
Environmental uncertainty: level of risk, presence of competitors
In case of less dominant competitors, the effect of strategy and structure on the product development success is more intense,
than in case of dominant competitors.
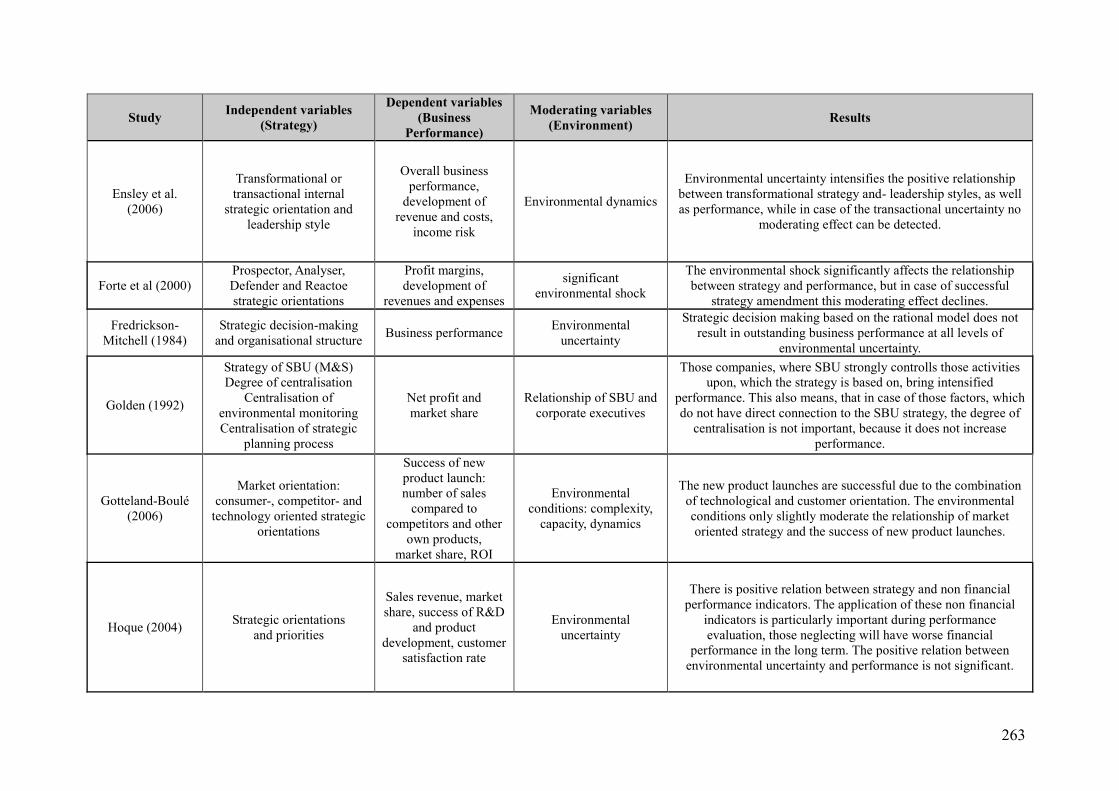
263
Study Independent variables (Strategy)
Dependent variables (Business
Performance)
Moderating variables (Environment) Results
Ensley et al. (2006)
Transformational or transactional internal
strategic orientation and leadership style
Overall business performance,
development of revenue and costs,
income risk
Environmental dynamics
Environmental uncertainty intensifies the positive relationship between transformational strategy and- leadership styles, as well as performance, while in case of the transactional uncertainty no
moderating effect can be detected.
Forte et al (2000) Prospector, Analyser, Defender and Reactoe strategic orientations
Profit margins, development of
revenues and expenses
significant environmental shock
The environmental shock significantly affects the relationship between strategy and performance, but in case of successful
strategy amendment this moderating effect declines.
Fredrickson-Mitchell (1984)
Strategic decision-making and organisational structure Business performance Environmental
uncertainty
Strategic decision making based on the rational model does not result in outstanding business performance at all levels of
environmental uncertainty.
Golden (1992)
Strategy of SBU (M&S) Degree of centralisation
Centralisation of environmental monitoring Centralisation of strategic
planning process
Net profit and market share
Relationship of SBU and corporate executives
Those companies, where SBU strongly controlls those activities upon, which the strategy is based on, bring intensified
performance. This also means, that in case of those factors, which do not have direct connection to the SBU strategy, the degree of
centralisation is not important, because it does not increase performance.
Gotteland-Boulé (2006)
Market orientation: consumer-, competitor- and
technology oriented strategic orientations
Success of new product launch: number of sales
compared to competitors and other
own products, market share, ROI
Environmental conditions: complexity,
capacity, dynamics
The new product launches are successful due to the combination of technological and customer orientation. The environmental conditions only slightly moderate the relationship of market oriented strategy and the success of new product launches.
Hoque (2004) Strategic orientations and priorities
Sales revenue, market share, success of R&D
and product development, customer
satisfaction rate
Environmental uncertainty
There is positive relation between strategy and non financial performance indicators. The application of these non financial
indicators is particularly important during performance evaluation, those neglecting will have worse financial
performance in the long term. The positive relation between environmental uncertainty and performance is not significant.
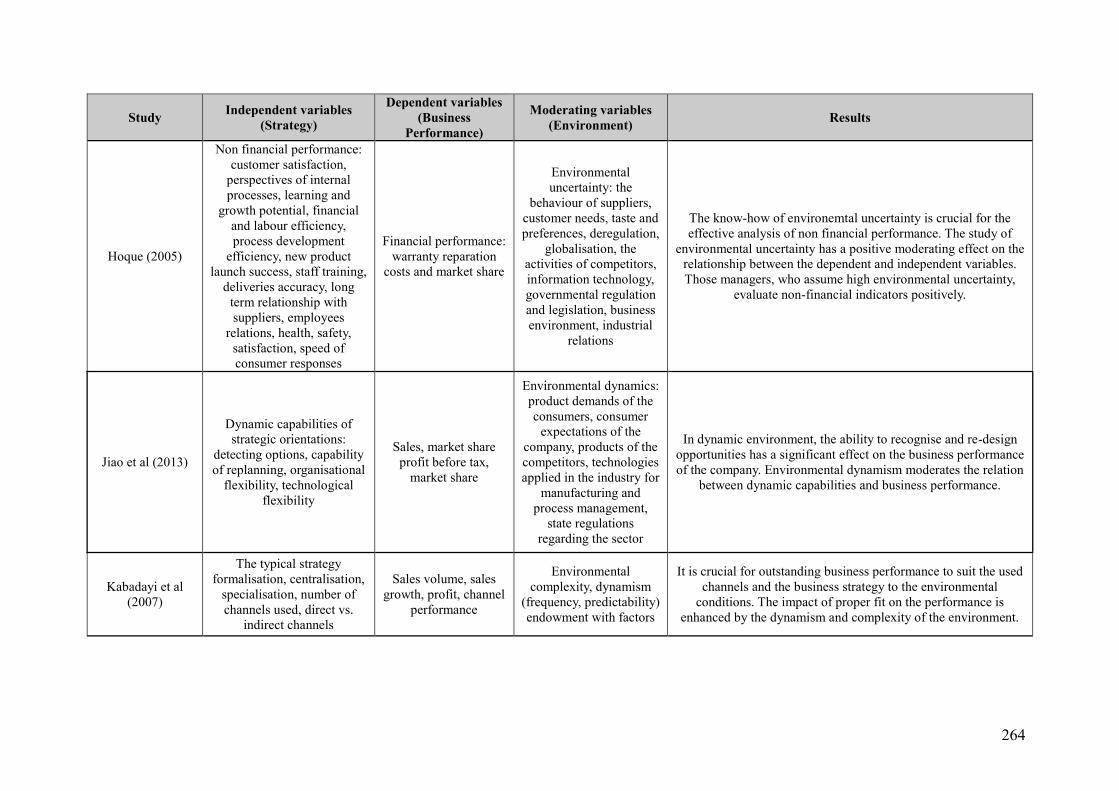
264
Study Independent variables (Strategy)
Dependent variables (Business
Performance)
Moderating variables (Environment) Results
Hoque (2005)
Non financial performance: customer satisfaction,
perspectives of internal processes, learning and
growth potential, financial and labour efficiency, process development
efficiency, new product launch success, staff training,
deliveries accuracy, long term relationship with suppliers, employees
relations, health, safety, satisfaction, speed of consumer responses
Financial performance: warranty reparation
costs and market share
Environmental uncertainty: the
behaviour of suppliers, customer needs, taste and preferences, deregulation,
globalisation, the activities of competitors, information technology, governmental regulation and legislation, business environment, industrial
relations
The know-how of environemtal uncertainty is crucial for the effective analysis of non financial performance. The study of
environmental uncertainty has a positive moderating effect on the relationship between the dependent and independent variables. Those managers, who assume high environmental uncertainty,
evaluate non-financial indicators positively.
Jiao et al (2013)
Dynamic capabilities of strategic orientations:
detecting options, capability of replanning, organisational
flexibility, technological flexibility
Sales, market share profit before tax,
market share
Environmental dynamics: product demands of the consumers, consumer
expectations of the company, products of the competitors, technologies applied in the industry for
manufacturing and process management,
state regulations regarding the sector
In dynamic environment, the ability to recognise and re-design opportunities has a significant effect on the business performance of the company. Environmental dynamism moderates the relation
between dynamic capabilities and business performance.
Kabadayi et al (2007)
The typical strategy formalisation, centralisation,
specialisation, number of channels used, direct vs.
indirect channels
Sales volume, sales growth, profit, channel
performance
Environmental complexity, dynamism
(frequency, predictability) endowment with factors
It is crucial for outstanding business performance to suit the used channels and the business strategy to the environmental
conditions. The impact of proper fit on the performance is enhanced by the dynamism and complexity of the environment.

265
Study Independent variables (Strategy)
Dependent variables (Business
Performance)
Moderating variables (Environment) Results
Kotha – Al-Nair (1995)
Strategic orientation characteristics: cost-
efficiency, capital expenditures and intensity, intensity of advertisement
and marketing
Profitability, growth (sales, employees,
distribution)
Environmental uncertainty:
interdependence, resource availability and
endowment, technological change, market concentration
Corporate strategy and the environment play a significant role in the profitability of the company. Only the environmental changes
contribute to the growth of the company, so in this case environmental uncertainty plays the role of a "so to say
moderating variable"
Köseoglu et al. (2013)
Strategic orientations of Miles and Snow and Michael Porter: Prospector, Analyser,
Defender, Reactor
Financial indicators: Sales revenue, profit,
ROA, ROE, ROS, market share, general business performance and positions achieved relative to competitors,
Non-financial indicators: satisfaction
of employees and consumers, employee
fluctuation, corporate image
Degree of market and technological turbulence, competitive intensity in
Turkish hospitality sector
The results are miscellaneous, however most experience proves the moderating effect of the environmental factors. In the Turkish
tourism industry those hotels following the best performing Defender/Cost-Leader and Prospector/Focusing strategy rather in
case of the detection of higher level of turbulance showed outstanding financial and non-financial results.
Li (2005)
Examination of corporate strategy along the following dimensions: company size,
age, capital structure, marketing and technological
competencies
ROI, ROS, ROA, profit, revenue, market share and increase of
operational efficiency, operational CF,
reputation
Intensity of competition, degree of price
competition, stage in the product life-curve,
growth of the sector, resource endowments of
the environment
The corporate strategy has positive effect on performance, in case the level of environmental uncertainty is high and the given
company has strong marketing competencies.
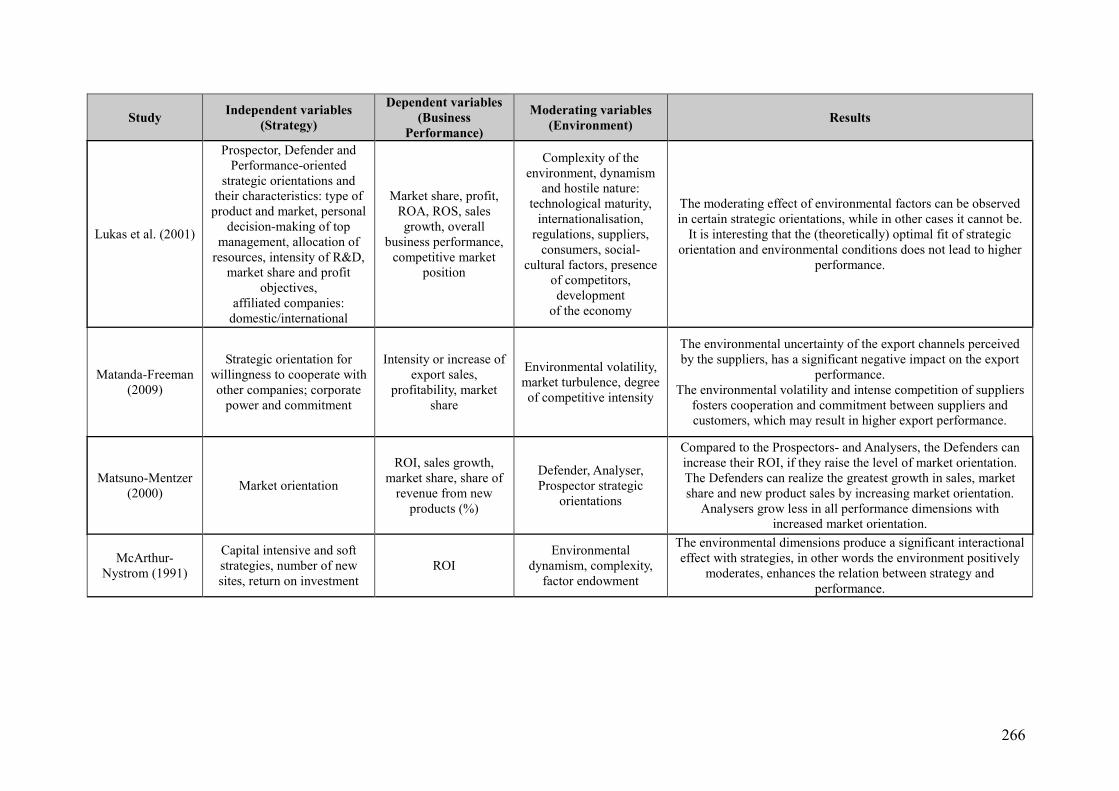
266
Study Independent variables (Strategy)
Dependent variables (Business
Performance)
Moderating variables (Environment) Results
Lukas et al. (2001)
Prospector, Defender and Performance-oriented
strategic orientations and their characteristics: type of
product and market, personal decision-making of top
management, allocation of resources, intensity of R&D,
market share and profit objectives,
affiliated companies: domestic/international
Market share, profit, ROA, ROS, sales growth, overall
business performance, competitive market
position
Complexity of the environment, dynamism
and hostile nature: technological maturity,
internationalisation, regulations, suppliers,
consumers, social-cultural factors, presence
of competitors, development
of the economy
The moderating effect of environmental factors can be observed in certain strategic orientations, while in other cases it cannot be.
It is interesting that the (theoretically) optimal fit of strategic orientation and environmental conditions does not lead to higher
performance.
Matanda-Freeman (2009)
Strategic orientation for willingness to cooperate with other companies; corporate
power and commitment
Intensity or increase of export sales,
profitability, market share
Environmental volatility, market turbulence, degree of competitive intensity
The environmental uncertainty of the export channels perceived by the suppliers, has a significant negative impact on the export
performance. The environmental volatility and intense competition of suppliers
fosters cooperation and commitment between suppliers and customers, which may result in higher export performance.
Matsuno-Mentzer (2000) Market orientation
ROI, sales growth, market share, share of
revenue from new products (%)
Defender, Analyser, Prospector strategic
orientations
Compared to the Prospectors- and Analysers, the Defenders can increase their ROI, if they raise the level of market orientation. The Defenders can realize the greatest growth in sales, market share and new product sales by increasing market orientation.
Analysers grow less in all performance dimensions with increased market orientation.
McArthur-Nystrom (1991)
Capital intensive and soft strategies, number of new sites, return on investment
ROI Environmental
dynamism, complexity, factor endowment
The environmental dimensions produce a significant interactional effect with strategies, in other words the environment positively
moderates, enhances the relation between strategy and performance.
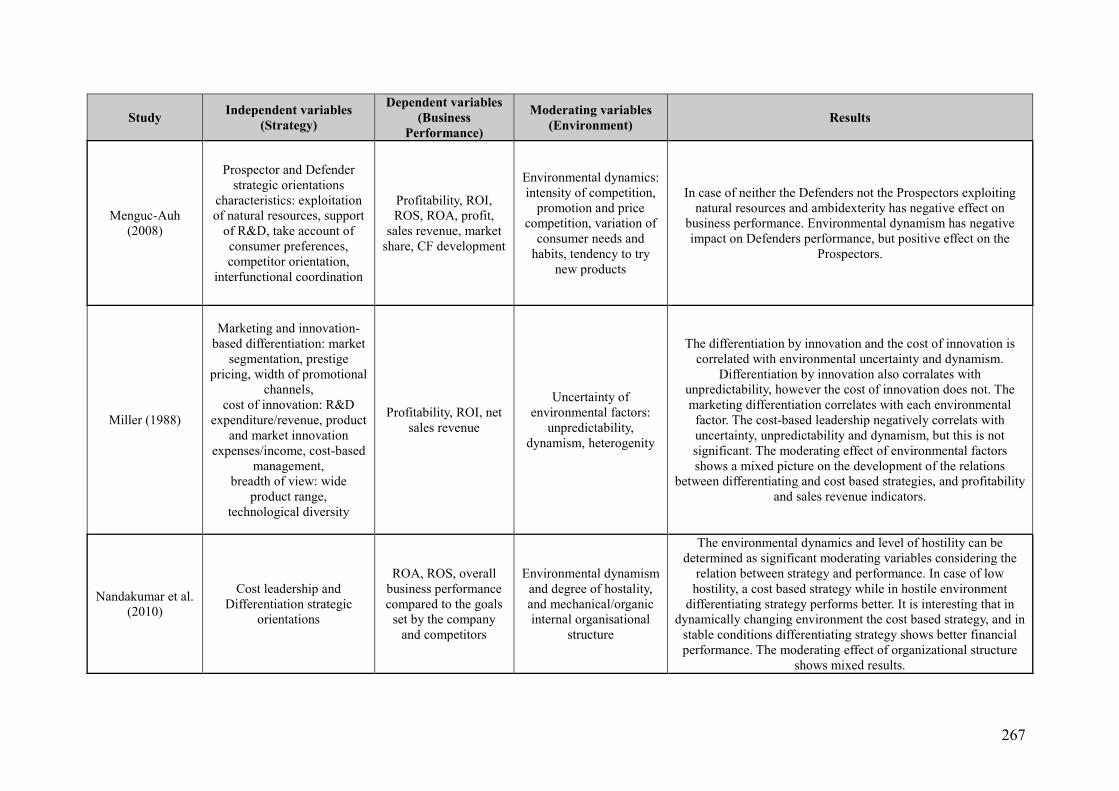
267
Study Independent variables (Strategy)
Dependent variables (Business
Performance)
Moderating variables (Environment) Results
Menguc-Auh (2008)
Prospector and Defender strategic orientations
characteristics: exploitation of natural resources, support
of R&D, take account of consumer preferences, competitor orientation,
interfunctional coordination
Profitability, ROI, ROS, ROA, profit,
sales revenue, market share, CF development
Environmental dynamics: intensity of competition,
promotion and price competition, variation of
consumer needs and habits, tendency to try
new products
In case of neither the Defenders not the Prospectors exploiting natural resources and ambidexterity has negative effect on
business performance. Environmental dynamism has negative impact on Defenders performance, but positive effect on the
Prospectors.
Miller (1988)
Marketing and innovation-based differentiation: market
segmentation, prestige pricing, width of promotional
channels, cost of innovation: R&D
expenditure/revenue, product and market innovation
expenses/income, cost-based management,
breadth of view: wide product range,
technological diversity
Profitability, ROI, net sales revenue
Uncertainty of environmental factors:
unpredictability, dynamism, heterogenity
The differentiation by innovation and the cost of innovation is correlated with environmental uncertainty and dynamism.
Differentiation by innovation also corralates with unpredictability, however the cost of innovation does not. The marketing differentiation correlates with each environmental
factor. The cost-based leadership negatively correlats with uncertainty, unpredictability and dynamism, but this is not significant. The moderating effect of environmental factors shows a mixed picture on the development of the relations
between differentiating and cost based strategies, and profitability and sales revenue indicators.
Nandakumar et al. (2010)
Cost leadership and Differentiation strategic
orientations
ROA, ROS, overall business performance compared to the goals
set by the company and competitors
Environmental dynamism and degree of hostality, and mechanical/organic internal organisational
structure
The environmental dynamics and level of hostility can be determined as significant moderating variables considering the
relation between strategy and performance. In case of low hostility, a cost based strategy while in hostile environment
differentiating strategy performs better. It is interesting that in dynamically changing environment the cost based strategy, and in
stable conditions differentiating strategy shows better financial performance. The moderating effect of organizational structure
shows mixed results.
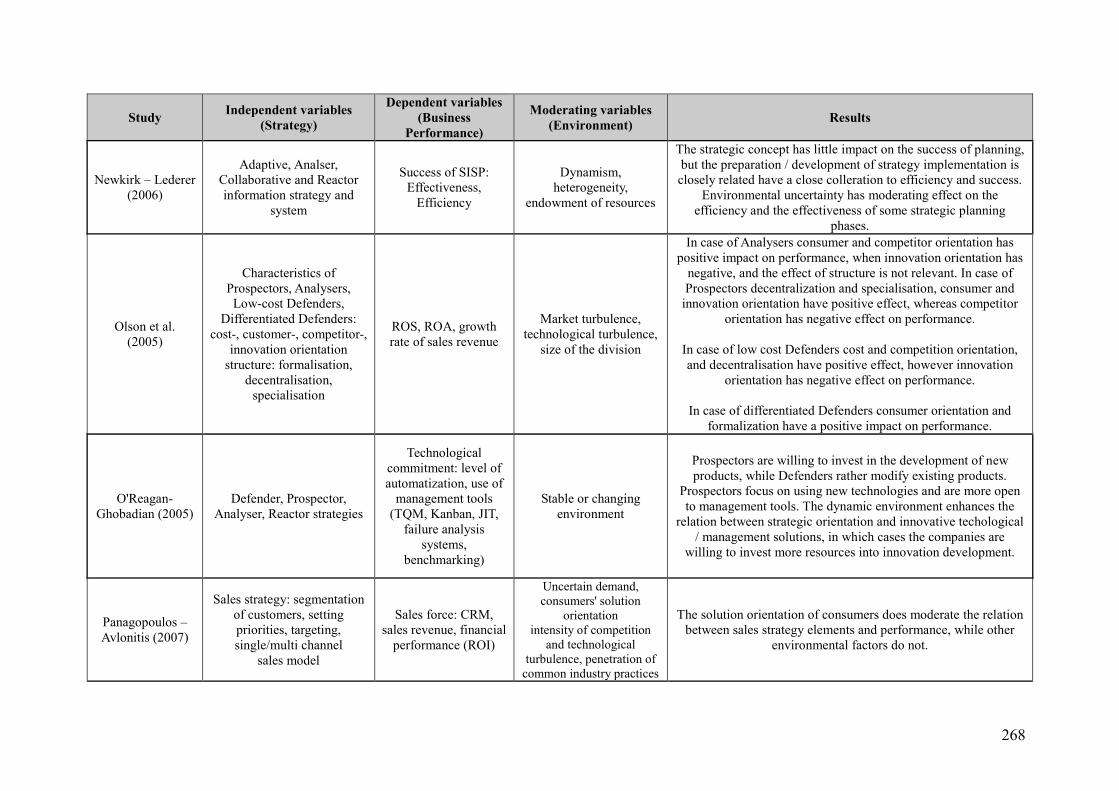
268
Study Independent variables (Strategy)
Dependent variables (Business
Performance)
Moderating variables (Environment) Results
Newkirk – Lederer (2006)
Adaptive, Analser, Collaborative and Reactor information strategy and
system
Success of SISP: Effectiveness,
Efficiency
Dynamism, heterogeneity,
endowment of resources
The strategic concept has little impact on the success of planning, but the preparation / development of strategy implementation is closely related have a close colleration to efficiency and success.
Environmental uncertainty has moderating effect on the efficiency and the effectiveness of some strategic planning
phases.
Olson et al. (2005)
Characteristics of Prospectors, Analysers, Low-cost Defenders,
Differentiated Defenders: cost-, customer-, competitor-,
innovation orientation structure: formalisation,
decentralisation, specialisation
ROS, ROA, growth rate of sales revenue
Market turbulence, technological turbulence,
size of the division
In case of Analysers consumer and competitor orientation has positive impact on performance, when innovation orientation has
negative, and the effect of structure is not relevant. In case of Prospectors decentralization and specialisation, consumer and
innovation orientation have positive effect, whereas competitor orientation has negative effect on performance.
In case of low cost Defenders cost and competition orientation, and decentralisation have positive effect, however innovation
orientation has negative effect on performance.
In case of differentiated Defenders consumer orientation and formalization have a positive impact on performance.
O'Reagan-Ghobadian (2005)
Defender, Prospector, Analyser, Reactor strategies
Technological commitment: level of automatization, use of
management tools (TQM, Kanban, JIT,
failure analysis systems,
benchmarking)
Stable or changing environment
Prospectors are willing to invest in the development of new products, while Defenders rather modify existing products.
Prospectors focus on using new technologies and are more open to management tools. The dynamic environment enhances the
relation between strategic orientation and innovative techological / management solutions, in which cases the companies are
willing to invest more resources into innovation development.
Panagopoulos – Avlonitis (2007)
Sales strategy: segmentation of customers, setting priorities, targeting, single/multi channel
sales model
Sales force: CRM, sales revenue, financial
performance (ROI)
Uncertain demand, consumers' solution
orientation intensity of competition
and technological turbulence, penetration of
common industry practices
The solution orientation of consumers does moderate the relation between sales strategy elements and performance, while other
environmental factors do not.

269
Study Independent variables (Strategy)
Dependent variables (Business
Performance)
Moderating variables (Environment) Results
Parnell et al. (2012)
Basic strategic orientations of Porter: Cost leadership,
Differentiation, Focusing and their combinations
Sales revenue, profit, ROA, ROE, ROS,
market share, general business performance and relative positions
achieved in comparison to main
competitors
Market and technological turbulence, degree of
competitive intensity + Chinese, American and
Turkish business contexts characterised by various
degress of the abovementioned
Miscellaneous Results: In different markets companies experiencing different levels of turbulance create different
strategic orientations, which cause performance divergences. In the United States and Turkey companies with outstanding
performance following „combined” strategic orientation rather prevail in uncertain environment; whereas in the Chinese market
the most successful companies prefer stable and contingent conditions. Most of the results confirm more the moderating
effect of the environmental factors.
Pelham (1999) Low-cost strategy, degree of market orientation, relative
level of sales
Marketing /sales efficiency,
growth/share, profitability, company
growth index
Market size, level of competition intensity and product differentiation,
consumer differentiation, technological turbulence,
environmental complexity, dynamism,
munificence
The intensity of the competition does not moderate the relation between market orientation and performance. SMEs have better
capabilities to adapt to the environmental conditions and changes. In case of small firms operating in bigger industries, have their own operational and environmental conditions, which heavily
impacts their performance.
Prescott (1986)
Asset-efficient, Cost-effective and
Differentiating strategy ROI
Investment intensity, capacity utilisation, labor
productivity, relative direct cost, production
cost/revenue, R&D expenses/revenue,
marketing expenditures/revenue.
relative product quality, relative market share
The characteristics of the market structure, as environmental moderator variables significantly influence the strength of the
stochastic relation between the strategy and the profitability, but do not change the shape of the relationship.
Slater-Narver (1994)
consumer oriented, competitor oriented and
balanced external orientation
sales volume, ROA, success of new product
introduction
market turbulence, technological turbulence,
market size, the supportive ability to of
competitive environment
Environmental factors do not have moderating power. Market orientation is particularly important for the companies. It is also
essential, to flexibly shift resources and to provide prompt responses to consumers needs and competitor activities.

270
Study Independent variables (Strategy)
Dependent variables (Business
Performance)
Moderating variables (Environment) Results
Song et al. (2001)
Cross-functional integration typical for strategy, level of technology and marketing
synergies and product-specific benefits
Technological salience, marketing
effectiveness, competitiveness, ROI
Technological uncertainty
Cross-functional integration has a strong impact on financial performance and technological perfection, when the perceived
technological uncertainty is high. In high technological uncertainty, cross-functional integration has a low effect on
marketing effectiveness and competitiveness. Technological synergy has weak effect on the technical perfection when
technological uncertainty is high, but its impact on the product-specific benefits is high. In case of high uncertainty marketing
synergy has weak effect on marketing effectiveness. The product-specific advantage has low impact on financial performance in
case of increased environmental uncertainty.
Souder et al. (2003)
R&D, typical for strategy and marketing integration
Effectiveness of new product developments
Environmental uncertainty
Marketing integration clearly enhances the effectiveness of the new product development, but at the same time the cost of the
NPD as well. In high environmental uncertainty deeper level of marketing integration leads to greater efficiency.
Spital-Bickford (1992)
Competitive strategy: product innovation,
differentiation in sales and service, production costs, width of product/market
Product and technological strategy: R&D/revenue, depth of technological
competencies, scope, key technological portfolio,
internal/external resources
Market share growth, annual sales volume,
ROS
Dynamics in production technology, competitive intensity, product and technology dynamics,
environmental munificence, level of
industry concentration
Companies can achieve outstanding results with high technological dynamism and continuous product innovation and
service differentiation. In low dynamic environment sales differentiation, and a broad portfoliostrategy is proven to be
effective.
Srnivasan et.al. (2011)
Quality of strategic partnership
Supply chain performance
Environmental uncertainty, demand and
supply risk
Supply-side risk does not have a significant moderating power on the quality of partnership and performance. There is a positive
relation between quality of the partnership and the performance when environmental uncertainty is higher. The impact of demand
uncertainty strengthens the relation of the two factors.
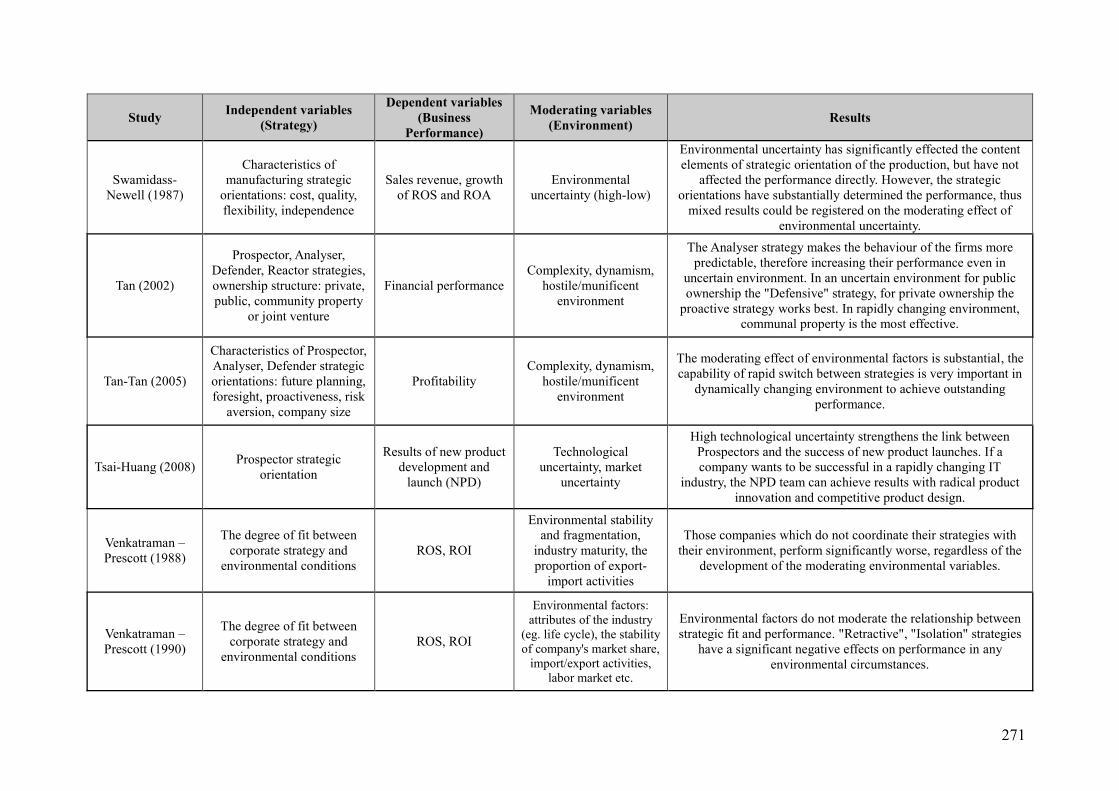
271
Study Independent variables (Strategy)
Dependent variables (Business
Performance)
Moderating variables (Environment) Results
Swamidass-Newell (1987)
Characteristics of manufacturing strategic
orientations: cost, quality, flexibility, independence
Sales revenue, growth of ROS and ROA
Environmental uncertainty (high-low)
Environmental uncertainty has significantly effected the content elements of strategic orientation of the production, but have not
affected the performance directly. However, the strategic orientations have substantially determined the performance, thus
mixed results could be registered on the moderating effect of environmental uncertainty.
Tan (2002)
Prospector, Analyser, Defender, Reactor strategies, ownership structure: private, public, community property
or joint venture
Financial performance Complexity, dynamism,
hostile/munificent environment
The Analyser strategy makes the behaviour of the firms more predictable, therefore increasing their performance even in
uncertain environment. In an uncertain environment for public ownership the "Defensive" strategy, for private ownership the
proactive strategy works best. In rapidly changing environment, communal property is the most effective.
Tan-Tan (2005)
Characteristics of Prospector, Analyser, Defender strategic orientations: future planning, foresight, proactiveness, risk
aversion, company size
Profitability Complexity, dynamism,
hostile/munificent environment
The moderating effect of environmental factors is substantial, the capability of rapid switch between strategies is very important in
dynamically changing environment to achieve outstanding performance.
Tsai-Huang (2008) Prospector strategic orientation
Results of new product development and
launch (NPD)
Technological uncertainty, market
uncertainty
High technological uncertainty strengthens the link between Prospectors and the success of new product launches. If a company wants to be successful in a rapidly changing IT
industry, the NPD team can achieve results with radical product innovation and competitive product design.
Venkatraman –Prescott (1988)
The degree of fit between corporate strategy and
environmental conditions ROS, ROI
Environmental stability and fragmentation,
industry maturity, the proportion of export-
import activities
Those companies which do not coordinate their strategies with their environment, perform significantly worse, regardless of the
development of the moderating environmental variables.
Venkatraman –Prescott (1990)
The degree of fit between corporate strategy and
environmental conditions ROS, ROI
Environmental factors: attributes of the industry
(eg. life cycle), the stability of company's market share,
import/export activities, labor market etc.
Environmental factors do not moderate the relationship between strategic fit and performance. "Retractive", "Isolation" strategies
have a significant negative effects on performance in any environmental circumstances.

272
Study Independent variables (Strategy)
Dependent variables (Business
Performance)
Moderating variables (Environment) Results
Verdu et al. (2012)
Strategic real options and their features: R&D intensity,
operative real options, company size
Degree and effectiveness of technological
innovation and
Environmental uncertainty, predictability of environmental changes
in the industry
The environmental uncertinty moderates the level of strategic options and the effectiveness of technological innovation. In case of high environmental uncertainty strategic options increase the flexibility, the adaptability and the innovational performance of
the company.
Waldman et al. (2001)
Transactional or charismatical leadership
strategy
Net profit margin, ROA
Environmental uncertainty
The moderating factor of environmental uncertainty was not significant for either the charismatic or the transactional
leadership model. Transactional leadership has not correlated with performance, but in case of the charismatic leadership
significant positive relation can be observed.
Wang et al. (2012)
TQM characteristics: customer focus, basis for cooperation, continuous development, employee satisfaction, knowledge,
process management, leadership. Market
Orientation: intelligence generation, common
interpretation, ability to organisational response
Sales and market share growth, decrease of cost of sales, ROI, customer loyalty,
satisfaction, return, assignment
Turbulence of the market and technology, degree of
competitive intensity
TQM and market orientation has a positive impact on the performance of hotels. The effect of low levels of environmental
factors (eg. Low turbulence, weak competition) is not as significant as the strong factors' (eg. Fierce competition, strong
turbulence) hence the moderating influence is proven.
White et al. (2013)
Relation based strategy of wholly owned foreign
subsidiaries: absorption, adaptation, integration and
reconfiguration, revitalisation. Using market
(customer orientation, product development, brand value etc.) and non-market instruments (eg. complying
with rules, sharing information, protection of
Net profit growth, sales figures, market
share, ROA
Changing environment: deficiencies of the justice
system, administrative arbitrage, political
instability, closeness of governmental and
business relationships
Coordinated application of market and non-market-based instruments clearly increases the profitability of foreign
subsidiaries, particularly if it is strategically integrated with the company's central decision-making mechanism. In less volatile, stable environment this positive effect can better prevail, so the
moderating effect can be observed.
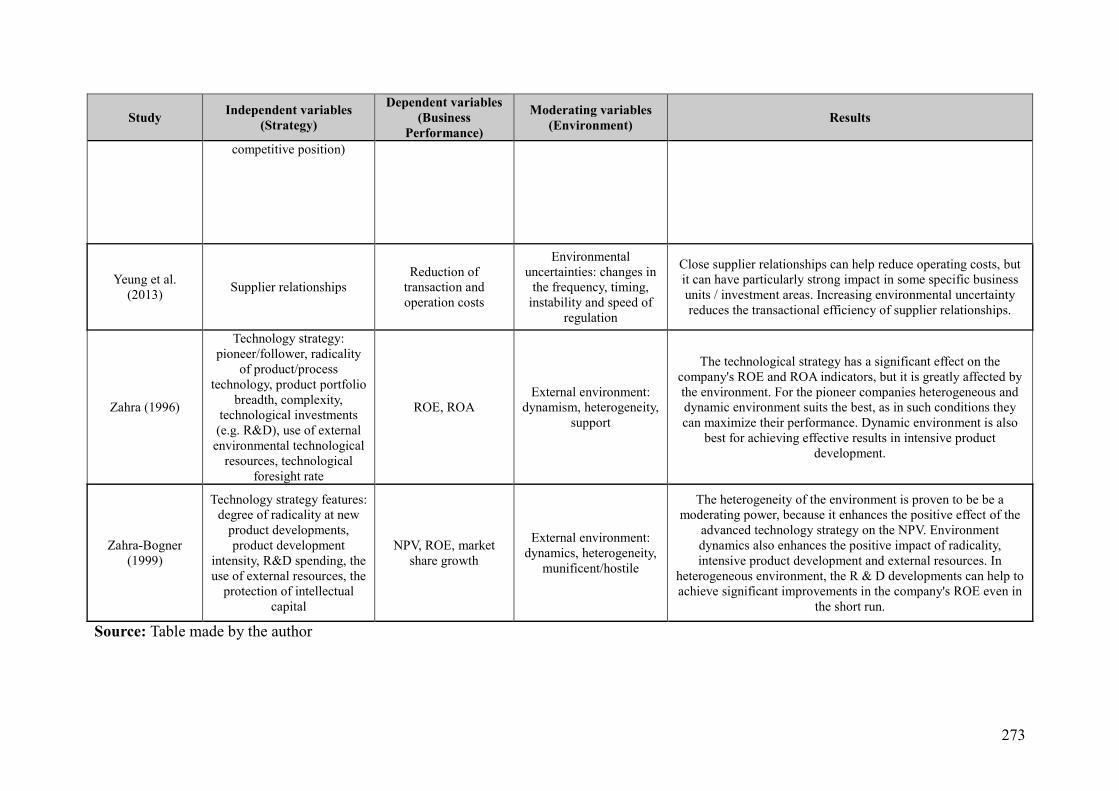
273
Study Independent variables (Strategy)
Dependent variables (Business
Performance)
Moderating variables (Environment) Results
competitive position)
Yeung et al. (2013) Supplier relationships
Reduction of transaction and operation costs
Environmental uncertainties: changes in
the frequency, timing, instability and speed of
regulation
Close supplier relationships can help reduce operating costs, but it can have particularly strong impact in some specific business units / investment areas. Increasing environmental uncertainty reduces the transactional efficiency of supplier relationships.
Zahra (1996)
Technology strategy: pioneer/follower, radicality
of product/process technology, product portfolio
breadth, complexity, technological investments (e.g. R&D), use of external
environmental technological resources, technological
foresight rate
ROE, ROA External environment:
dynamism, heterogeneity, support
The technological strategy has a significant effect on the company's ROE and ROA indicators, but it is greatly affected by the environment. For the pioneer companies heterogeneous and dynamic environment suits the best, as in such conditions they can maximize their performance. Dynamic environment is also
best for achieving effective results in intensive product development.
Zahra-Bogner (1999)
Technology strategy features: degree of radicality at new
product developments, product development
intensity, R&D spending, the use of external resources, the
protection of intellectual capital
NPV, ROE, market share growth
External environment: dynamics, heterogeneity,
munificent/hostile
The heterogeneity of the environment is proven to be be a moderating power, because it enhances the positive effect of the
advanced technology strategy on the NPV. Environment dynamics also enhances the positive impact of radicality, intensive product development and external resources. In
heterogeneous environment, the R & D developments can help to achieve significant improvements in the company's ROE even in
the short run.
Source: Table made by the author
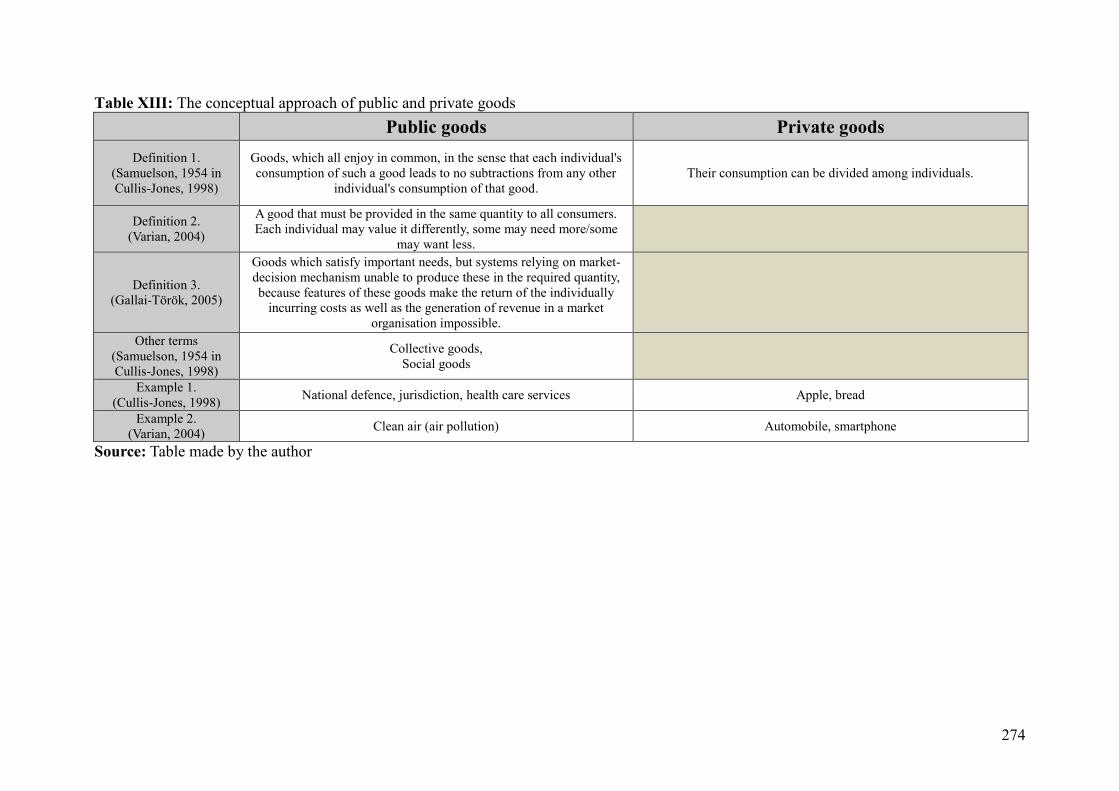
274
Table XIII: The conceptual approach of public and private goods
Public goods Private goods Definition 1.
(Samuelson, 1954 in Cullis-Jones, 1998)
Goods, which all enjoy in common, in the sense that each individual's consumption of such a good leads to no subtractions from any other
individual's consumption of that good. Their consumption can be divided among individuals.
Definition 2. (Varian, 2004)
A good that must be provided in the same quantity to all consumers. Each individual may value it differently, some may need more/some
may want less.
Definition 3. (Gallai-Török, 2005)
Goods which satisfy important needs, but systems relying on market-decision mechanism unable to produce these in the required quantity, because features of these goods make the return of the individually
incurring costs as well as the generation of revenue in a market organisation impossible.
Other terms (Samuelson, 1954 in Cullis-Jones, 1998)
Collective goods, Social goods
Example 1. (Cullis-Jones, 1998) National defence, jurisdiction, health care services Apple, bread
Example 2. (Varian, 2004) Clean air (air pollution) Automobile, smartphone
Source: Table made by the author
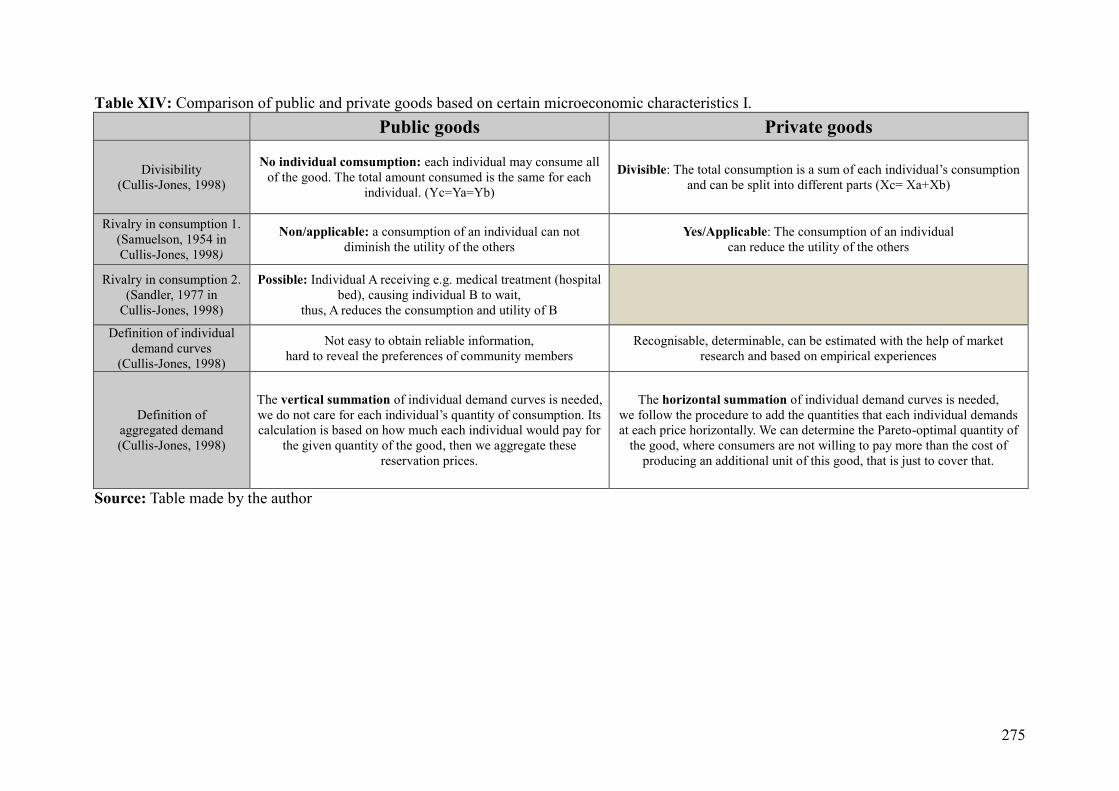
275
Table XIV: Comparison of public and private goods based on certain microeconomic characteristics I. Public goods Private goods
Divisibility (Cullis-Jones, 1998)
No individual comsumption: each individual may consume all of the good. The total amount consumed is the same for each
individual. (Yc=Ya=Yb)
Divisible: The total consumption is a sum of each individual’s consumption and can be split into different parts (Xc= Xa+Xb)
Rivalry in consumption 1. (Samuelson, 1954 in Cullis-Jones, 1998)
Non/applicable: a consumption of an individual can not diminish the utility of the others
Yes/Applicable: The consumption of an individual can reduce the utility of the others
Rivalry in consumption 2. (Sandler, 1977 in
Cullis-Jones, 1998)
Possible: Individual A receiving e.g. medical treatment (hospital bed), causing individual B to wait,
thus, A reduces the consumption and utility of B
Definition of individual demand curves
(Cullis-Jones, 1998)
Not easy to obtain reliable information, hard to reveal the preferences of community members
Recognisable, determinable, can be estimated with the help of market research and based on empirical experiences
Definition of aggregated demand (Cullis-Jones, 1998)
The vertical summation of individual demand curves is needed, we do not care for each individual’s quantity of consumption. Its calculation is based on how much each individual would pay for
the given quantity of the good, then we aggregate these reservation prices.
The horizontal summation of individual demand curves is needed, we follow the procedure to add the quantities that each individual demands at each price horizontally. We can determine the Pareto-optimal quantity of
the good, where consumers are not willing to pay more than the cost of producing an additional unit of this good, that is just to cover that.
Source: Table made by the author

276
Table XV: Comparison of public and private goods based on certain microeconomic characteristics II. Public goods Private goods
Excludability (Cullis-Jones, 1998)
Absent: Consumers cannot be excluded from the consumption benefits (only with expensive procedures), one individual cannot
exclude another individual from the consumption of the good. There is no such tool, by which anyone can restrict or prohibit the
consumption of given individuals.
Possible: The consumption of a good is possible only upon the payment of the said good’s price. Anyone can be excluded from the consumption, if (e.g. because of lack of financial resources) he/she is unable to possess the
property rights of the good.
Efficient production (Cullis-Jones, 1998)
Consumers have to pay different prices, although they consume the same amount.
The consumers pay the same price, and because of their income may vary they consume the good in different quantities.
Pricing 1. (Samuelson, 1954)
It has to be discriminating There is no any common price ratio, which applies to everyone,
because the individuals’ marginal rates of subtitution will differ in case of the efficiency conditions are fulfilled.
The price discrimination is an attribute of monopolies, meaning that the profit-maximising monopoly acts based on the marginal revenue
(MR=MC).
Pricing 2. (Pete Péter in Gallai-
Török, 2005)
Consumers cannot be excluded from consumption, so it is not possible to enforce payment of users like in market-based situations.
Often times it is not worthy to connect the payment to customers’ utilisation, because cost are loosely related (or not related at all) to
the number of consumers.
Source: Table made by the author

277
Table XVI: Comparison of public and private goods based on certain microeconomic characteristics III. Public goods Private goods
Taxanomy of goods 1. (Peston, 1972, Head, 1974)
Based on rivalrous consumption and excludability 1. Pure public goods: non-excludable and non-rivalrous in consumption
2. Pure private goods: rivalrous in consumption and excludable 3. Rivalrous but non-excludable:
Case of the bees (Meade, 1952): When gathering nectar the acquisition of blossoms are based on rivalry, but the access of bees is not deniable. 4. Non-rivalrous, but excludable:
Admission to theatre: Tickets are exclusion techniques, but individuals admitted can utilise services without subtracting benefit from others. Clubs (Buchanan, 1965): Their capacity is limited, membership may be denied, so consumers can be excluded from the benefits of goods.
Taxanomy of goods 2. (Buchanan, 1968)
Based on the divisibility of goods 1. Pure private goods: fully divisible between individuals
2. Pure public goods: fully indivisible, thus each member of the group may consume the same good (e.g. mosquito extermination) 3. Moderately divisible, shared between a small amount of people: e.g. fire extinguisher in the corridor
4. Moderately divisible, shared between a large group of people: e.g. vaccination – after someone gets it, he/she can provide additional protection to others
5. Indivisible, consumed by a lot of people: e.g. swimming pool, if used by few, and not congested
Revealing of preferencies in small groups
(Cullis-Jones, 1998)
Highly probable: Failure to reveal demand may lead to drastically reduced supply, but the uncover of not real preferences is plausible
Improbable: Strategic behaviour or declaration of demand will influence equilibrium prices, so there is a strong incentive to act strategically
Revealing of preferencies in large groups
(Cullis-Jones, 1998)
Not probable: The lack of preference revelation will have a weak impact on key elements of the system,
experiments to free ride are likely to occur
Highly probable: Strategic behaviour or declaration of demand will not influence equilibrium prices,
so there is a little incentive to fake preferences
Source: Table made by the author
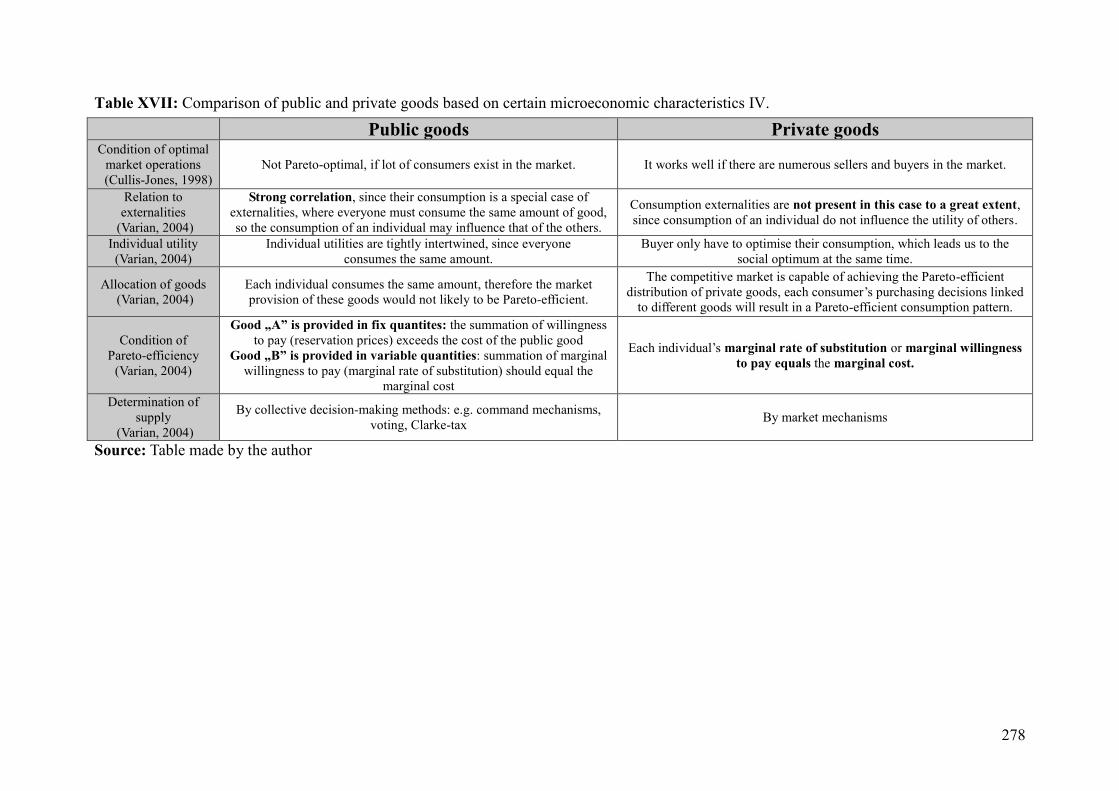
278
Table XVII: Comparison of public and private goods based on certain microeconomic characteristics IV.
Source: Table made by the author
Public goods Private goods Condition of optimal
market operations (Cullis-Jones, 1998)
Not Pareto-optimal, if lot of consumers exist in the market. It works well if there are numerous sellers and buyers in the market.
Relation to externalities
(Varian, 2004)
Strong correlation, since their consumption is a special case of externalities, where everyone must consume the same amount of good, so the consumption of an individual may influence that of the others.
Consumption externalities are not present in this case to a great extent, since consumption of an individual do not influence the utility of others.
Individual utility (Varian, 2004)
Individual utilities are tightly intertwined, since everyone consumes the same amount.
Buyer only have to optimise their consumption, which leads us to the social optimum at the same time.
Allocation of goods (Varian, 2004)
Each individual consumes the same amount, therefore the market provision of these goods would not likely to be Pareto-efficient.
The competitive market is capable of achieving the Pareto-efficient distribution of private goods, each consumer’s purchasing decisions linked
to different goods will result in a Pareto-efficient consumption pattern.
Condition of Pareto-efficiency
(Varian, 2004)
Good „A” is provided in fix quantites: the summation of willingness to pay (reservation prices) exceeds the cost of the public good
Good „B” is provided in variable quantities: summation of marginal willingness to pay (marginal rate of substitution) should equal the
marginal cost
Each individual’s marginal rate of substitution or marginal willingness to pay equals the marginal cost.
Determination of supply
(Varian, 2004)
By collective decision-making methods: e.g. command mechanisms, voting, Clarke-tax By market mechanisms

279
Table XIX: Comparison of the idealtypical characteristics of SMEs in the public, private and family-owned sectors
Source: Table made by the author
Characteristic Public Sector Family-owned SMEs Classical Private Sector Main objective Sustainment of positions’ status quo Keeping up the
family and taking care of heirs „Shareholder” value maximisation
Ideal market environment Monopol position and/or munificent public funding
Low competitive intensity and turbulence, stable and trust-based partner relations
Predicatbility of conditions and stakeholders’ behaviour
Environmental adaptation Determined by political, regulatory and civilian stakeholders
Determined by preferences of family-members and key customers
Develops according to customer needs and competitors’ behaviour
Transparency Unique mix of mandatorily transparent and non-transparent elements of operation Non-transparent Transparent
Media interest High Low Intermediate
Supervison/control of operation Political, professional and financial audits Family, professional control and taxation-checks Professional and financial audits
Product and service portfolio Stable Stable Changing Targeted and served customer segments „Citizens” „Trusted key partners” „Customers”
Degree of market orientation Low Intermediate High Organisational stucture and
departmentalisation Rigid and significant,
poor fit to strategic orientation Non-existant or rudimentary and
plastic, easily changeable Flexibly changeable according to strategy,
supports interfunctional cooperations Decision making Centralised Centralised Decentralised
Formalisation of processes Overregulated Unregulated Sufficiently regulated and flexible Risk-taking of top-managers Low Low High
Strategic planning Formal and centralised Informal and centralised Formal and decentralised Implementation and execution
Poor fit of functions, tasks and processes to strategic orientation
Functions, tasks and processes according to the needs of family members
Clear-cut functions, tasks and processes according to the strategic orientation
Feedback and correction Not present/not public because of intertia and loss of prestige
Depends on the personality of the manager and the relationship of family members Mandatory for owner accountabilty
Personality of top-manager Bureaucratic civil servant Professional entrepreneur Technocrat manager
Employee values Loyalty, diligence Loyalty, hard work, professionalism Performance, talent, Hard work, creativity
Primary focus of performance Obtaining resources necessary to the operation of organisation „Survival” „Profit maximisation”
Most important performance dimension Adaptability, effectiveness Effectiveness, adaptability, efficiency Efficiency, adaptability,
effectiveness, innovtivity Time horizon of
performance measurement Associated to political cycles Long term Short or long term depending on the type of investor
Profit/Loss management Not so profitable, not making too much loss „Break even” „Loss is bad and should be avoided”

280
Table: XX: General English and Hungarian descriptions operationalising M&S’s SOs
Source: Table made by the author based on Slater et al. (2005)
(A) Prospector strategic orientation (A) Kutató stratégiai orientáció This business unit typically operates within a broad product-market domain that undergoes periodic redefinition. The business unit values being “first in” in new product and market areas even if not all these efforts prove to be highly profitable. This organisation responds rapidly to early signals concerning areas of opportunity, and these responses often lead to a new round of competitive actions. However, this business unit may not maintain market strength in all areas it enters.
Vállalkozásunk jellemzően olyan széles termék-piaci szegmensben működik, amely rendszeres változásokon és módosításokon megy keresztül. Vállalkozásunk kiemelt értékként kezeli, amennyiben az elsők között vezethet be egy új terméket/szolgáltatást vagy vehet részt egy új fogyasztói szegmens kiszolgálásában, még akkor is, ha ezek az erőfeszítések nem bizonyulnak feltétlenül rövidtávon a leginkább jövedelmező alternatívának. Szervezetünk gyorsan reagál az üzleti környezet korai jelzéseire, igyekszik minden lehetőséget kihasználni, és intézkedéseivel befolyásolni a piaci verseny alakulását. Azonban cégünk nem mindig képes erős pozíciót és fenntartható versenyelőny-forrást szerezni azokon a piacokon, amelyekre belépett.
(B) Defender strategic orientation (B) Védekező stratégiai orientáció This business unit attempts to locate and maintain a secure niche in a relatively stable product or service area. The business unit tends to offer a more limited range of products or services than competitors, and it tries to protect its domain by offering higher quality, superior service, lower prices, and so forth. Often, this business unit is not at the forefront of developments in the industry. It tends to ignore industry changes that have no direct influence on current areas of operation and concentrates instead on doing the best job possible in a limited area.
Vállalkozásunk egy stabil fogyasztói szegmens hagyományos termékekkel és szolgáltatásokkal történő megbízható kiszolgálására törekszik. Cégünk a versenytársakhoz képest szűkebb termék és szolgáltatásportfolióval dolgozik és jelenlegi piacait, valamint versenyképességét minőségi termékekkel, magas kiszolgálási színvonallal, költséghatékony működéssel és alacsony árakkal igyekszik fenntartani. Cégünk sem az új termékek és szolgáltatások bevezetésében, sem pedig új vevői szegmentumok kiszolgálásban nem kíván vezető szerepet játszani. Gyakran figyelmen kívül hagyjuk azokat az iparági környezeti változásokat, amelyek nem gyakorolnak közvetlen hatást üzletünkre. Vállalkozásunk új termék-piaci szegmensek felkutatása helyett jelenlegi termék-piaci körének a lehető legalacsonyabb költséggel történő működtetésére koncentrál.
(C) Analyser strategic orientation (C) Elemző stratégiai orientáció This business unit attempts to maintain a stable, limited line of products or services while moving quickly to follow a carefully selected set of the more promising new developments in the industry. This organisation is seldom “first in” with new products and services. However, by carefully monitoring the actions of major competitors in areas compatible with its stable product-market base, this business unit can frequently be “second in” with a more cost-efficient product or service.
Vállalkozásunk igyekszik fenntartani egy stabil, kevésbé széleskörű termékekből és szolgáltatásokból álló kínálatot, ugyanakkor körültekintő mérlegeléssel törekszik az iparág ígéretes termék-piaci innovációinak és legújabb fejlesztéseinek átvételére is. Cégünk ritkán jelenik meg az elsők között, amikor új termékek és szolgáltatások piaci bevezetéséről esik szó. Azonban, gondosan figyelemmel követi legfőbb versenytársai lépéseit, különös tekintettel azokra a termékekre és szolgáltatásokra, amelyek összeegyeztethetők jelenlegi kínálatával. Vállalkozásunk az új termékek piacán legtöbbször a második hullámban, a követők között jelenik meg, akik gyakran költséghatékonyabb termékeket/szolgáltatásokat kínálnak a különböző vevői szegmentumok számára.
(D) Reactor strategic orientation (D) Reagáló stratégiai orientáció Our business do not appear to have a consistent product-market orientation. We primarily act to respond to competitive or other market pressures in the short term.
Vállalkozásunk az állandóan változó környezeti feltételekhez igazítja stratégiai magatartását, amely megnyilvánul mind az általunk kínált termékek és szolgáltatások gyakran változó szélességében, mélységében, valamint vevőkörünk gyakori fluktuációjában is. Ritkán vállalunk üzleti kockázatokat, a termék-piaci orientációnkat tekintve alapvetően visszahúzódóak vagyunk és a versenytársak, továbbá egyéb piaci szereplők (gyártók, nagykereskedők, szabályozó hatóságok) nyomására igyekszünk rövidtávon megfelelő döntéseket hozni. Ritkán vezetünk be elsőként új termékeket és szolgáltatásokat, legtöbbször a piaci innovációk késői elfogadói vagyunk.
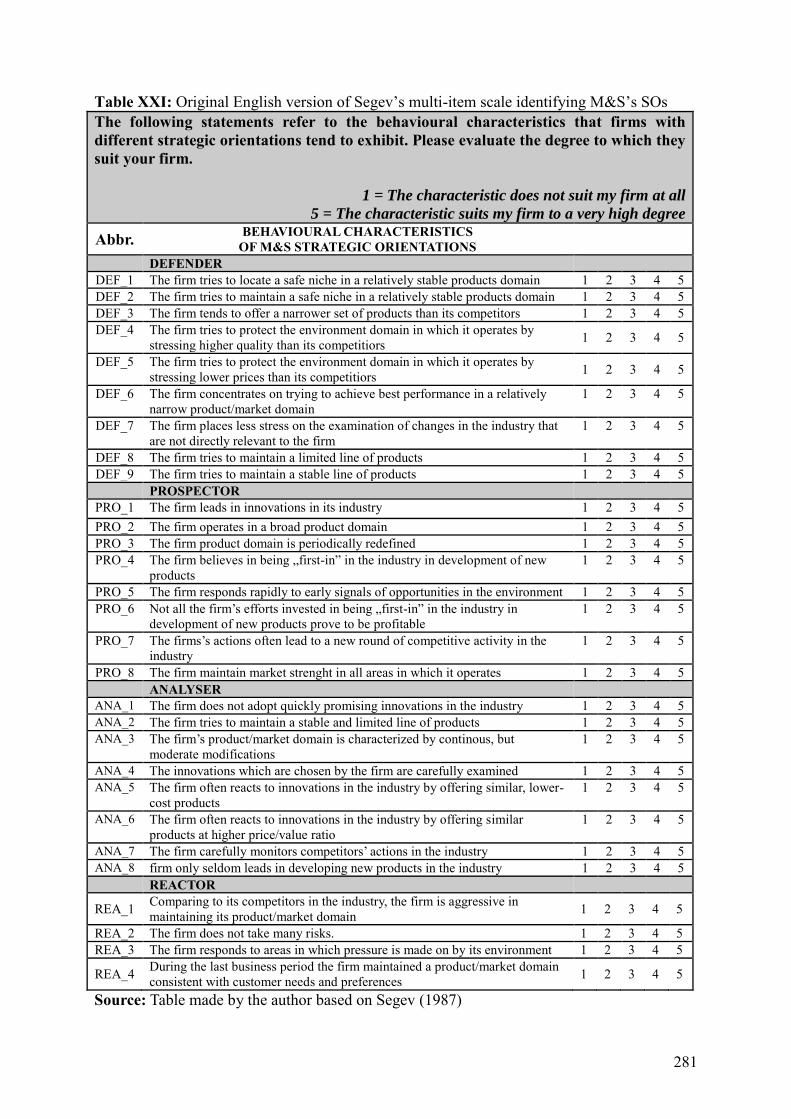
281
Table XXI: Original English version of Segev’s multi-item scale identifying M&S’s SOs The following statements refer to the behavioural characteristics that firms with different strategic orientations tend to exhibit. Please evaluate the degree to which they suit your firm.
1 = The characteristic does not suit my firm at all
5 = The characteristic suits my firm to a very high degree
Abbr. BEHAVIOURAL CHARACTERISTICS OF M&S STRATEGIC ORIENTATIONS
DEFENDER DEF_1 The firm tries to locate a safe niche in a relatively stable products domain 1 2 3 4 5 DEF_2 The firm tries to maintain a safe niche in a relatively stable products domain 1 2 3 4 5 DEF_3 The firm tends to offer a narrower set of products than its competitors 1 2 3 4 5 DEF_4 The firm tries to protect the environment domain in which it operates by
stressing higher quality than its competitiors 1 2 3 4 5
DEF_5 The firm tries to protect the environment domain in which it operates by stressing lower prices than its competitiors 1 2 3 4 5
DEF_6 The firm concentrates on trying to achieve best performance in a relatively narrow product/market domain
1 2 3 4 5
DEF_7 The firm places less stress on the examination of changes in the industry that are not directly relevant to the firm
1 2 3 4 5
DEF_8 The firm tries to maintain a limited line of products 1 2 3 4 5 DEF_9 The firm tries to maintain a stable line of products 1 2 3 4 5
PROSPECTOR PRO_1 The firm leads in innovations in its industry 1 2 3 4 5 PRO_2 The firm operates in a broad product domain 1 2 3 4 5 PRO_3 The firm product domain is periodically redefined 1 2 3 4 5 PRO_4 The firm believes in being „first-in” in the industry in development of new
products 1 2 3 4 5
PRO_5 The firm responds rapidly to early signals of opportunities in the environment 1 2 3 4 5 PRO_6 Not all the firm’s efforts invested in being „first-in” in the industry in
development of new products prove to be profitable 1 2 3 4 5
PRO_7 The firms’s actions often lead to a new round of competitive activity in the industry
1 2 3 4 5
PRO_8 The firm maintain market strenght in all areas in which it operates 1 2 3 4 5 ANALYSER
ANA_1 The firm does not adopt quickly promising innovations in the industry 1 2 3 4 5 ANA_2 The firm tries to maintain a stable and limited line of products 1 2 3 4 5 ANA_3 The firm’s product/market domain is characterized by continous, but
moderate modifications 1 2 3 4 5
ANA_4 The innovations which are chosen by the firm are carefully examined 1 2 3 4 5 ANA_5 The firm often reacts to innovations in the industry by offering similar, lower-
cost products 1 2 3 4 5
ANA_6 The firm often reacts to innovations in the industry by offering similar products at higher price/value ratio
1 2 3 4 5
ANA_7 The firm carefully monitors competitors’ actions in the industry 1 2 3 4 5 ANA_8 firm only seldom leads in developing new products in the industry 1 2 3 4 5
REACTOR
REA_1 Comparing to its competitors in the industry, the firm is aggressive in maintaining its product/market domain 1 2 3 4 5
REA_2 The firm does not take many risks. 1 2 3 4 5 REA_3 The firm responds to areas in which pressure is made on by its environment 1 2 3 4 5
REA_4 During the last business period the firm maintained a product/market domain consistent with customer needs and preferences 1 2 3 4 5
Source: Table made by the author based on Segev (1987)

282
Table XXII: Supplementing the formal and content elements of Segev’s multi-item scale (1987) identifying M&S’s SOs with items deriving from Conant et al. scale (1990) Scales Wording of statements
Conant In comparison to other companies, the services which we provide to our members are best characterised as services which are more innovative, continually changing and broader in nature throughout the organisation and marketplace. (Prospector)
Segev
The composition, breadth and depth of the product and service portfolio offered by our pharmacy undergo periodic changes. (PRO_3) We believe that being first to introduce new pharmaceutical products, services and new business applications on the market grants serious competitive advantage in this industry. (PRO_4)
Conant In contrast to other companies, my organisation has an image in the marketplace as a company, which has a reputation for being innovative and creative. (Prospector)
Segev Our pharmacy can be considered amongst the most innovative enterprises in the sector when it comes to the introduction of new products and pharmaceutical services, and the implementation of business applications supporting better patient care. (PRO_1)
Conant The amount of time my firm spends on monitoring changes and trends in the marketplace can be best described as minimal: We really do not spend much time monitoring the marketplace. (Defender)
Segev Our pharmacy pays special attention only to changes in market and regulatory environments directly influencing its operation. (DEF_7)
Conant In comparison to other companies, the increases or losses in demand which we have experienced are due most probably to: Our practice of concentrating on more fully developing those markets which we currently serve. (Defender)
Segev The main focus of our pharmacy is to take advantage of the exploitation of opportunities in existing clients by providing them a relatively limited range of products and services. (DEF_6)
Conant One of the most important goals in this company in comparison to other firms, is our dedication and commitment to making sure that we guard against critical threats by taking whatever action is necessary. (Reactor)
Segev Our pharmacy often acts upon the direct pressures of the market and regulatory environments. (REA_3)
Conant The one thing that protects my organisation from other companies is that we: Are able to carefully analyse emerging trends and adopt only those which have proven potential. (Analyser)
Segev Our pharmacy carefully examines, which new products and pharmaceutical services worth to introduce on the market. (ANA_4)
Conant More so than other companies, our management staff tends to concentrate on analysing opportunities in the marketplace and selecting only those opportunities with proven potential, while protecting a secure financial position. (Analyser)
Segev
Our pharmacy is in no rush to introduce new and promising pharmaceutical products and services and to implement up-to-date business applications. (ANA_1) Compared to its competitors our pharmacy simultaneously tries to maintain a narrower but stable product and pharmaceutical service domain while being open to introduce certain novelties on the market. (ANA_2) Our pharmacy is seldom among the first to introduce new pharmacological products, services and business applications to the market. (ANA_8)
Conant In contrast to many other companies, my organisation prepares for future by identifying trends and opportunities in the marketplace which can result in a creation of service offerings or programs which are new to the industry or which reach new markets. (Prospector)
Segev Our pharmacy can be considered amongst the most innovative enterprises in the sector when it comes to the introduction of new products and pharmaceutical services, and the implementation of business applications supporting better patient care. (PRO_1)
Conant In contrast to many other companies, my organisation prepares for future by identifying those problems which, if solved, will maintain and then improve our current service offerings and market position. (Defender)
Segev Our pharmacy attempts to keep and enhance its market position by placing more emphasis on providing higher quality services to patients than its competitors. (DEF_4)
Source: Table made by the author

283
Table XXIII: Problematic items of Segev scale identified during the „card matching tasks” Code Wording of the scale items Classification Reasoning
REA_1 Our pharmacy insists on keeping its current product and service portfolio, and to serving its conventional patient
segments
DEF, REA, ANA
Typical behavioural pattern of most
pharmacies with the exception of Prospectors
REA_2 Our pharmacy seldom takes business risks REA, DEF, ANA
It can be typical to every pharmacy with the
exception of expanding and/or financially strong
ones
REA_3 Our pharmacy often acts upon the direct pressures of the market and regulatory environments
DEF, ANA REA
It absolutely suits to all pharmacies pursuing
rather retractive strategic orientations
REA_4 In recent years our pharmacy has been attempting to
adapt its product and service portfolio to the ever changing needs and preferences of our patients
PRO, ANA
Financially stable or pharmacists operating
their business in an irresponsible way can afford to „experiment”
ANA_5 Compared to its competitors our pharmacy frequently
offers products and services newly launched in the drug retail supply system at a lower price
PRO By facing the word
„new” they immediately associated to Prospectors
ANA_6 Compared to our competitors our pharmacy offers
novelties with higher quality patient care and accompanied by more additional services
DEF It is necessary to retain
conventional loyal patient segments
PRO_6 It is not uncommon that efforts made by our pharmacy to introduce new products and pharmaceutical services
turn out to be unsuccessful and unprofitable
P, A, D, R
It can suit to all pharmacies following any kind of M&S’s strategic
orientations
PRO_7 Actions taken by our pharmacy often influence the
degree of competitive intensity among other pharmacies around us
None of them
Pharmacies are not influential enough to do so, it is not even found among the goals of a pharmacy, moreover
competitive intensity is difficult to interpret in
certain contexts
PRO_8 Our pharmacy has competitive advantage in all product and service domains that it offers None of them
It is not typical to any strategic orientations
pursued by pharmacies
DEF_7 Our pharmacy pays special attention only to changes in market and regulatory environments directly influencing
its operation Any of them
Pharmacists are exhausted and
„overloaded”, thus they can not pay attention to
other environmental factors
Source: Table made by the author

284
Table XXIV: The Segev scale identifying M&S’s SOs – final version applied in the survey The following statements refer to the strategic behaviour of your pharmacy. The statements below affect the basic aspects of pharmacy management, e.g. product and service portfolio, market introduction of new products, served patient segments, applied competitive tools, etc. Services refer to all examinations, consultations, and additional activities (home delivery, measurement by a medical equipment) offered in a pharmacy that do not directly connect to the dispensing of drugs or other goods sold in a pharmacy. All services provided within the institutional framework of pharmaceutical care belong here, as well. Please evaluate on a five-point scale to what extent the following statements are suit the general business practice of your pharmacy. (1 = It does not suit our pharmacy at all, 5 = It totally suits our pharmacy) STRATEGY „A” Our pharmacy strives to locate a stable market niche by providing conventional pharmaceutical products and services its usual patient segments. (DEF_1) Our pharmacy tries to maintain a product and service portfolio, that does not need to be modified frequently. (DEF_2) Compared to competitors our pharmacy offers a narrower range of products and services. (DEF_3) Our pharmacy attempts to keep and enhance its market position by placing more emphasis on providing higher quality services to patients than its competitors. (DEF_4) To maintain and enhance its market position our pharmacy keeps prices lower compared to its competitors. (DEF_5) The main focus of our pharmacy is to take advantage of the exploitation of opportunities in existing clients by providing them a relatively limited range of products and services. (DEF_6) Our pharmacy pays special attention only to changes in market and regulatory environments directly influencing its operation. (DEF_7) Compared to its competitors our pharmacy aims to offer and maintain a narrower range of services of pharmacist’s care. (DEF_8) Our pharmacy strives to provide its patients a stable product and service portfolio that does not undergo frequent modifications. (DEF_9) STRATEGY „B” Our pharmacy can be considered amongst the most innovative enterprises in the sector when it comes to the introduction of new products and pharmaceutical services, and the implementation of business applications supporting better patient care. (PRO_1) Compared to our competitors our pharmacy offers a wider variety of pharmaceutical products and services. (PRO_2) The composition, breadth and depth of the product and service portfolio offered by our pharmacy undergo periodic changes. (PRO_3) We believe that being first to introduce new pharmaceutical products, services and new business applications on the market grants serious competitive advantage in this industry. (PRO_4) Our pharmacy reacts quickly to early signals of business opportunities discovered in the changes of market and regulatory environments. (PRO_5)
1 2 3 4 5
1 2 3 4 5
1 2 3 4 5
1 2 3 4 5
1 2 3 4 5
1 2 3 4 5
1 2 3 4 5
1 2 3 4 5
1 2 3 4 5
1 2 3 4 5
1 2 3 4 5
1 2 3 4 5
1 2 3 4 5
1 2 3 4 5

285
It is not uncommon that efforts made by our pharmacy to introduce new products and pharmaceutical services turn out to be unsuccessful and unprofitable. (PRO_6). Actions taken by our pharmacy often influence the degree of competitive intensity among other pharmacies around us. (PRO_7) Our pharmacy has competitive advantage in all product and service domains that it offers. (PRO_8) STRATEGY „C” Our pharmacy is in no rush to introduce new and promising pharmaceutical products and services and to implement up-to-date business applications. (ANA_1) Compared to its competitors our pharmacy simultaneously tries to maintain a narrower but stable product and pharmaceutical service domain while being open to introduce certain novelties on the market. (ANA_2) The products and services offered by our pharmacy are characterised by continuous but moderate changes. (ANA_3) Our pharmacy carefully examines, which new products and pharmaceutical services worth to introduce on the market. (ANA_4) Compared to its competitors our pharmacy frequently offers products and services newly launched in the drug retail supply system at a lower price. (ANA_5) Compared to our competitors our pharmacy offers novelties with higher quality patient care and accompanied by more additional services. (ANA_6) Our pharmacy keeps a close eye on and carefully monitors actions taken by competitor pharmacies. (ANA_7) Our pharmacy is seldom among the first to introduce new pharmacological products, services and business applications to the market. (ANA_8) STRATEGY „D” Our pharmacy insists on keeping its current product and service portfolio, and to serving its conventional patient segments. (REA_1) Our pharmacy seldom takes business risks. (REA_2) Our pharmacy often acts upon the direct pressures of the market and regulatory environments. (REA_3) In recent years our pharmacy has been attempting to adapt its product and service portfolio to the ever changing needs and preferences of our patients. (REA_4)
1 2 3 4 5
1 2 3 4 5
1 2 3 4 5
1 2 3 4 5
1 2 3 4 5
1 2 3 4 5
1 2 3 4 5
1 2 3 4 5
1 2 3 4 5
1 2 3 4 5
1 2 3 4 5
1 2 3 4 5
1 2 3 4 5
1 2 3 4 5
1 2 3 4 5
Source: Table made by the author

286
Table XXV: Wording of descriptions featured in self-typing paragraph method applied for identifying SOs of M&S
Source: Table made by the author
(A) Prospector strategic orientation Compared to its competitors our pharmacy offers a wide range of products and services that undergoes frequent changes. Our enterprise attends to numerous patient segments, while continuously pursuing the identification and proactive influence of latent customer needs. We consider it as a priority value when our pharmacy is among the first to introduce new products or pharmaceutical services. We are proud of being able to address new patient segments or to implement modern business applications or technological innovations before others. We don not mind if in the short run these efforts are not profitable. Our pharmacy is quick to react to the early signals of business, pharmaceutical and regulatory environments, and tries to take advantage of all opportunities and influence market competition to its own benefit. However, our pharmacy is not always capable of taking a stable position and a sustainable competitive advantage in all product/service categories and consumer segments it operates in. (B) Defender strategic orientation The aim of our pharmacy is to provide reliable service by selling conventional products and pharmaceutical services to its existing patient segments characterised by less diverse needs and preferences. It is our top priority to keep operating expenses at a low level. Compared to our competitors our pharmacy offers a narrower product and service portfolio. The high quality patient service, cost efficient operation and lower prices help in maintaining our competitive advantage and market share. We often disregard changes occuring in the external environment that have no direct influence on our day-to-day operation. The aim of our pharmacy is neither to be among the first to introduce new products, pharmaceutical services and to implement new business applications, nor to take a leading role in addressing and serving new patient segments. Instead, the aim is to successfully take advantage of the opportunities provided by the existing products/services and exploit the potential inherent in our current patient segments. (C) Analyser strategic orientation Our pharmacy simultaneously tries to keep a stable supply of less varied products and pharmaceutical services free of changes, while after careful consideration it attempts to take in promising innovations of the industry. Our pharmacy is seldom among the first when talking about the introduction of new products or pharmaceutical services to the market, the implementation of modern business applications, or when addressing underserved patient segments. We carefully monitor the actions taken by our competitors, and we thoroughly think over the compatibility of new lines of products, services and business applications before taking the chance of introducing any of them to the market. Our pharmacy is usually in the second wave, among the followers when it comes to the introduction of new products and services, usually offering higher quality or less expensive alternatives that fit better with the patient needs and preferences. (D) Reactor strategic orientation Our pharmacy adjusts its management practices to the ever changing market conditions. This reflects in the often changing variety and depth of the products and pharmaceutical services offered by us, as well as the frequently changing composition of our patient segments. As far as our business philosophy is concerned we are retractable, trying to make appropriate short term decisions based on the influence of patients, competitors and other market players (producers, wholesalers, advocacies, regulatory authorities and physicians). We try to follow the constantly changing needs and preferences of our patient segments. Our main goal is to have enough revenue to cover the incurring costs. Our pharmacy has a risk-aversive attitude, we seldom introduce new products and services, more often we are accepting market innovations at a later phase.

287
Table XXVI: Operationalisating the construct of PEU via the industry-specific adaptation of multi-item scale developed by M&S (1978) The following statements refer to the environmental conditions of pharmacy management. We are interested in your evaluation pertaining to the degree you perceive either predictable or unpredictable the environment of pharmacy operation. We kindly ask you to indicate to what extent you regard environmental factors and behavioural aspects of key stakeholders featured below as either predictable or unpredictable. Value 1 of the 5 point Likert-scale stands for „completely unpredictable”, while value 5 indicates „completely predictable”
ENVIRONMENTAL STAKEHOLDERS/FACTORS Unpredictable Predictable
WHOLESALERS (PEU_WHS) Prices and price changes of wholesalers (PEU_WHS_1) 1 2 3 4 5 Shipping and delivery routine of wholesalers (PEU_WHS_2) 1 2 3 4 5 Payment terms and conditions of wholesalers (PEU_WHS_3) 1 2 3 4 5 Additional services of wholesalers (PEU_WHS_4) 1 2 3 4 5 Discounts provided by wholesalers and their degree (PEU_WHS_5) 1 2 3 4 5 PRODUCERS (PEU_PROD) Pricing routines of producers and their rate of change (PEU_PROD_1) 1 2 3 4 5 Quality of the goods of the producers (PEU_PROD_2) 1 2 3 4 5 Other parameters of producers’ products (e.g. packaging, packing, dosage, branding, flavor etc.) (PEU_PROD_3)
1 2 3 4 5
Market entry of producers’ products (PEU_PROD_4) 1 2 3 4 5 Additional services of producers (PEU_PROD_5) 1 2 3 4 5 PATIENTS (PEU_PAT) Demand of patients for current products and services (PEU_PAT_1) 1 2 3 4 5 Demand of patients for new, future products and services (PEU_PAT_2) 1 2 3 4 5 Preference of patients towards generic substitute products (PEU_PAT_3) 1 2 3 4 5 Purchasing patterns of patients (e.g. timing, frequency, price sensitivity etc.) (PEU_PAT_4)
1 2 3 4 5
Patients’ tastes and preferences regarding products and services (PEU_PAT_5)
1 2 3 4 5
Expectations of patients concerning the service-encounter in a pharmacy (PEU_PAT_6)
1 2 3 4 5
COMPETITOR PHARMACIES (PEU_COMP) Pricing routines and price changes of competitor pharmacies (PEU_COMP_1)
1 2 3 4 5
Composition of product and service portfolio of competitor pharmacies (PEU_COMP_2)
1 2 3 4 5
Quality of products and services offered by competitor pharmacies (PEU_COMP_3)
1 2 3 4 5
Quality of patient-serving at competitor pharmacies (PEU_COMP_4) 1 2 3 4 5 Launch of new products and services of competitor pharmacies to the market (PEU_COMP_5)
1 2 3 4 5
Content and intensity of competitor pharmacies’ marketing activity (PEU_COMP_6)
1 2 3 4 5
Timing and content of promotions, sales, discounts offered by competitor pharmacies (PEU_COMP_7)
1 2 3 4 5
REGULATORY AUTHORITIES (Ministry, NHIFH, NPHMOS etc.) (PEU_REG) Changes concerning prices, realisable profit margins, bands and limits of subsidies etc. (PEU_REG_1)
1 2 3 4 5
Changes concerning the composition of drugs subsidised by the state and the degree of these subsidies (PEU_REG_2)
1 2 3 4 5
Changes concerning specifications of quality standards of products and services (PEU_REG_3)
1 2 3 4 5
Changes of law regulations regarding the professional aspects of 1 2 3 4 5

288
pharmacy personnel’s employment (PEU_REG_4) Changes in regulation of pharmacies’ marketing activities (PEU_REG_5)
1 2 3 4 5
Changes in fundamental issues of pharmacy operations (ownership structure, corporate law form, constraints of foundation, cooperations machanisms etc.) (PEU_REG_6)
1 2 3 4 5
Changes concerning sales channels of drugs (PEU_REG_7) 1 2 3 4 5 Changes concerning the width and depth of products and services available in pharmacies (PEU_REG_8)
1 2 3 4 5
Changes concerning the education and training of pharmacists and (professional) assistants (PEU_REG_9)
1 2 3 4 5
HUNGARIAN CHAMBER OF PHARMACISTS (PEU_MGYK) Ethical norms and regulations defined by the chamber of pharmacists (PEU_MGYK_1)
1 2 3 4 5
Content elements of lobby activity of the Chamber towards the government (PEU_MGYK_2)
1 2 3 4 5
Effectiveness of lobby activity of the Hungarian Chamber of Pharmacists towards the government (PEU_MGYK_3)
1 2 3 4 5
Professional standpoints and recommendations of the Chamber (PEU_MGYK_4)
1 2 3 4 5
Standpoints and recommendations of the Hungarian Chamber of Pharmacists regarding pharmacy management (PEU_MGYK_5)
1 2 3 4 5
FINANCIAL CONDITIONS (PEU_FIN) Short term possibilities of borrowing (e.g. for current assets) (PEU_FIN_1)
1 2 3 4 5
Long term possibilities of borrowing (e.g. for development) (PEU_FIN_2)
1 2 3 4 5
Evolution of interest rate on loans (PEU_FIN_3) 1 2 3 4 5 Fluctuation of exchange rates (PEU_FIN_4) 1 2 3 4 5 Formation of payment conditions and deadlines (PEU_FIN_5) 1 2 3 4 5 Cost of hiring pharmacy employees (PEU_FIN_6) 1 2 3 4 5 Fluctuation of real-estate rental prices (PEU_FIN_7) 1 2 3 4 5 Evolution of utility costs (PEU_FIN_8) 1 2 3 4 5 Source: Table made by the author

289
Table XXIX: Regional distribution of sample and respondents Number of
pharmacies (N)
Distribution in the
country (%)
Distribution in the sample
frame (%)
Number of answers (n)
Respondents’ proportion to sample size (%)
Response rate by region (%)
Budapest 424 17,7 43,2 38 18,3 8,9 Pest 261 10,9 26,6 111 53,6 42,5 Baranya 99 4,1 10 20 9,6 20,2 BAZ 153 6,4 15,6 28 13,5 18,3 Vas 46 1,9 4,6 12 5,8 26 Sample frame 983 41 Others 1408 59 Total 2391 100 100 207 100 Source: Table made by the author Table XXX: Description of the sample by main socio-demographic characteristics Is the pharmacy owned only by pharmacists? Distribution (%) (n) Only pharmacists 46,8 97 Not only pharmacists 50,2 103 No response 3 7 Do the owners of the pharmacy come from family members and/or friends? Distribution (%) (n) Family/Friends 72,4 150 Non-family/friends 23,2 48 No response 4,4 9 Are there any wholesalers among the owners of the pharmacy? Distribution (%) (n) Yes 1,5 2 No 95,1 197 No response 4,4 8 Are there any profession-related investors (e.g. physician) among the owners of the pharmacy? Distribution (%) (n)
Yes 5,9 13 No 90,6 186 No response 3,4 8 Are there any financial investors among the owners of the pharmacy? Distribution (%) (n) Yes 14,3 30 No 82,8 171 No response 2,9 6 Does the pharmacy operate as a member of a pharmacy chain? Distribution (%) (n) Yes 8,4 18 No 88,7 182 No response 2,9 7 Do the owners have shares in other pharmacies as well? Distribution (%) (n) Yes 10,6 22 No 84,6 175 No response 4,8 10 Is the pharmacy associated with any strategic cooperation led by a wholesaler? (e.g. Gyöngypatika, Szimpatika) Distribution (%) (n)
Yes 49,3 102 No 47,8 98 No response 2,9 7 Does the pharmacy take part in any kind of procurement association? Distribution (%) (n) Yes 26,6 55 No 69,5 144 No response 3,9 8 What is the corporate law form of the pharmacy? Distribution (%) (n) Private company 6,4 13 Limited partnership 63,5 131 Limited liability company (Ltd.) 26,6 55

290
Joint stock company 1 2 No response 2,5 6 The past of the pharmacy: Distribution (%) (n) Pharmacy with no predecessor in title 42,4 88 Privatised pharmacy 40,9 84 Pharmacy had more than one owners 13,3 28 No response 3,4 7 Where does the pharmacy operate? Distribution (%) (n) Capital (Budapest) 18,4 38 City with more than 50000 residents 10,6 22 Town with number of residents between 10000-50000 residents 27,5 57 Township with number of residents between 5000-10000 18,4 38 Settlement with less than 5000 residents 25,1 52 No response 100 207 Source: Table made by the author Table XXXI: Compliance with the application criteria of SEM: Number of observations
APPLICATION CRITERIA
MULTI-ITEM SCALES Perceived environmental
uncertainty (Miles-Snow, 1978)
Strategic orientations of M&S (Segev, 1987)
Number of observations 207 207 Number of latent constructs 7 4 Number of indicator variables 45 29 Number of error terms 45 29 Number of estimated parameters 97 62
n/q>5 (Bentler-Chou, 1987) 207/97=2.13 No compliance with criteria 207/62=3.33 No compliance
with criteria
n-q>50 (Bagozzi, 1981) 207-97=110 Compliance with criteria 207-62=145 Compliance
with criteria
n>200 (Hair et al., 2010) 207 Compliance with criteria 207 Compliance
with criteria Source: Table made by the author Table XXXII: Multivariate techniques used to test our research questions and hypotheses Question/
Hypothesis Applied mathemathical-statistical methodologies
Q1 Self-typing paragraphs and objective indicators method, exploratory (EFA) and confirmatory factor analyses (CFA) of the multi-item Segev scale
Q2 Exploratory factor analysis (EFA), confirmatory factor analysis (CFA), ANOVA, post-hoc paired comparisons by Tukey-, Scheffe- and Bonferroni-tests
Q3 Crosstabs, McNemar-tests Q4 Paired sampled t-tests Q5 Crosstabs, correlations, ANOVA, structural equation modeling (SEM) Q6 Crosstabs, correlations, ANOVA Q7 Crosstabs, correlations, ANOVA, SEM H1 ANOVA, hierarchical interaction and multigroup moderated regression, SEM H2 ANOVA, hierarchical interaction and multigroup moderated regression, SEM H3 Hierarchical interaction and multigroup moderated regressions, multigroup and interaction moderation (SEM) H4 Hierarchical interaction and multigroup moderated regressions, multigroup and interaction moderations (SEM) H5 Hierarchical interaction and multigroup moderated regressions, multigroup and interaction moderations (SEM) H6 Hierarchical interaction and multigroup moderated regressions, multigroup and interaction moderations (SEM) H7 Moderated moderation (SEM) H8 Moderated moderation (SEM)
H9 Moderated moderation (SEM) by integrating control variables pertaining to socio-demographic factors and characteristics of the site of pharmacies
Source: Table made by the author

291
Table XXXIII: 3 and 4 factor structure solutions as resulting from EFA of Segev scale
Source: Table made by the author
Original 4 factor solution (strategic orientations) 3 factor solution (strategic orientations) 1. factor 2. factor 3. factor 4. factor 1. factor 2. factor 3. factor
Items Factor loadings Items Factor
loadings Items Factor loadings Items Factor
loadings Items Factor loadings Items Factor
loadings Items Factor loadings
PRO_1 0,911 ANA_3 0,902 DEF_9 0,847 DEF_8 0,859 PRO_1 0,922 DEF_6 0,814 ANA_3 0,929 PRO_5 0,886 ANA_2 0,874 DEF_1 0,838 DEF_3 0,821 PRO_5 0,890 DEF_2 0,810 ANA_4 0,897 PRO_2 0,875 ANA_5 0,864 DEF_2 0,821 DEF_7 0,685 PRO_2 0,887 DEF_9 0,806 ANA_2 0,897 PRO_3 0,839 ANA_4 0,823 DEF_4 0,791 DEF_6 0,681 PRO_4 0,837 DEF_8 0,798 ANA_5 0,844 PRO_4 0,831 ANA_1 0,804 REA_1 0,766 PRO_3 0,824 DEF_1 0,791 ANA_1 0,723 PRO_8 0,804 ANA_8 0,787 REA_3 0,651 PRO_8 0,803 DEF_7 0,768 ANA_8 0,707 PRO_7 0,799 DEF_5 0,789 REA_2 0,545 PRO_7 0,781 DEF_3 0,765 DEF_5 0,680 PRO_6 0,639 ANA_7 0,615 REA_4 0,625 DEF_4 0,699 ANA_6 0,658 REA_4 0,620 ANA_6 0,535 PRO_6 0,621 REA_1 0,688 ANA_7 0,618
REA_2 0,651 REA_3 0,647
Extraction method: Principal Component Analysis (PCA) Extraction method: Principal Component Analysis (PCA) Rotation: Varimax Rotation: Varimax
Variance explained by factor
18,06% 15,25% 13,60% 9,55% Variance explained by factor
18,08% 16,92% 16,66%
Total variance
explained 56,47
Total variance
explained 51,68%

292
Table XXXIV: 5 and 2 factor structure solutions resulting from EFA of Segev scale 5 factor solution (strategic orientations) 2 factor solution (strategic orientations)
1. factor 2. factor 3. factor 4. factor 5. factor 1. factor 2. factor
Items Factor loadings Items Factor
loadings Items Factor loadings Items Factor
loadings Items Factor loadings Items Factor
loadings Items Factor loadings
PRO_1 0,912 ANA_3 0,895 DEF_9 0,873 DEF_8 0,883 None of the statements had the
biggest F. Weight in this case (!)
PRO_2 0,854 ANA_4 0,862 PRO_5 0,890 ANA_5 0,892 DEF_1 0,866 DEF_3 0,834 PRO_1 0,815 ANA_3 0,853 PRO_2 0,879 ANA_2 0,862 REA_1 0,864 DEF_7 0,800 PRO_5 0,808 ANA_2 0,803 PRO_4 0,835 ANA_4 0,841 DEF_2 0,730 DEF_6 0,786 PRO_4 0,770 ANA_5 0,741 PRO_3 0,835 ANA_1 0,761 REA_2 0,645 DEF_3 -0,737 DEF_4 0,718 PRO_8 0,797 DEF_5 0,745 DEF_4 0,642 PRO_3 0,735 DEF_5 0,684 PRO_7 0,775 ANA_8 0,744 REA_3 0,593 PRO_8 0,735 ANA_6 0,682 PRO_6 0,692 ANA_7 0,651 DEF_1 -0,708 ANA_1 0,669 REA_4 0,668 ANA_6 0,581 REA_2 -0,703 ANA_7 0,647
DEF_8 -0,689 ANA_8 0,628 PRO_7 0,674 REA_3 0,535 DEF_9 -0,667 REA_1 -0,645 REA_4 0,630 DEF_6 -0,584 DEF_2 -0,544 DEF_7 -0,538 PRO_6 0,451
Extraction method: Principal Component Analysis (PCA) Extraction method: Principal Component Analysis (PCA) Rotation: Varimax Rotation: Varimax
Variance explained by factor
17,80% 15,54% 12,28% 10,51% 5,034% Variance explained by factor
23,35% 18,74%
Total variance
explained 61,18%
Total variance
explained 42,095%
Source: Table made by the author
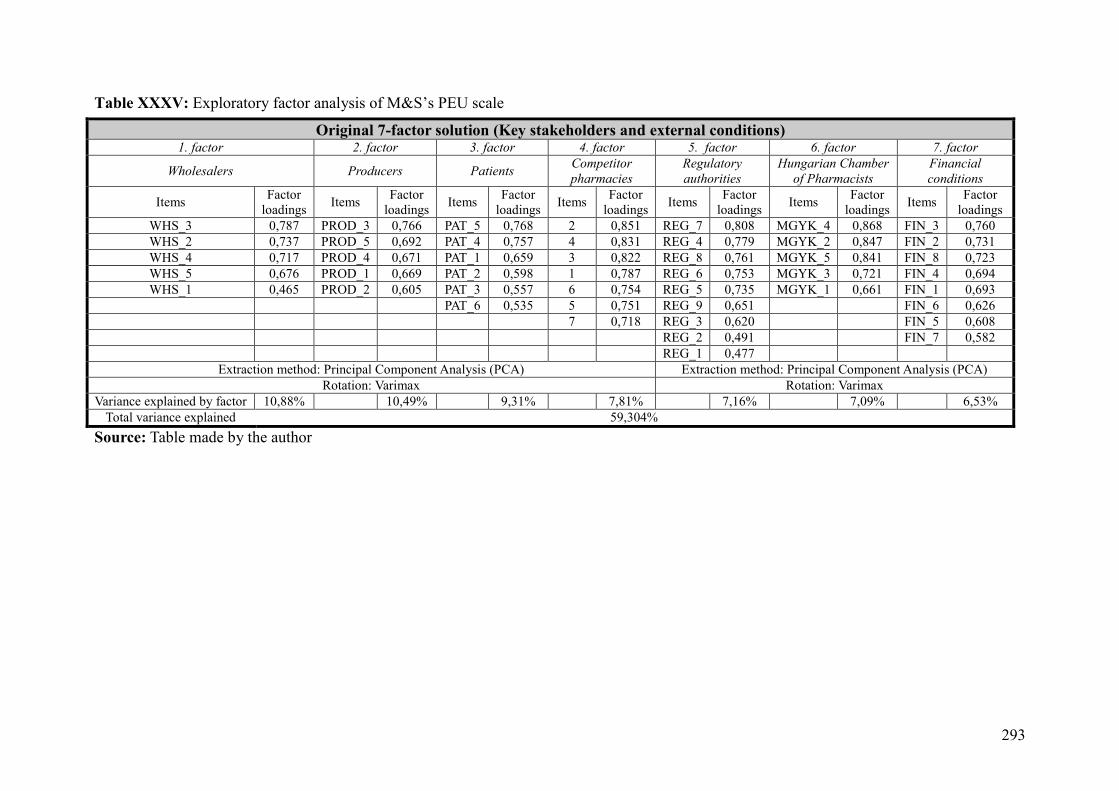
293
Table XXXV: Exploratory factor analysis of M&S’s PEU scale
Source: Table made by the author
Original 7-factor solution (Key stakeholders and external conditions) 1. factor 2. factor 3. factor 4. factor 5. factor 6. factor 7. factor
Wholesalers Producers Patients Competitor pharmacies
Regulatory authorities
Hungarian Chamber of Pharmacists
Financial conditions
Items Factor loadings Items Factor
loadings Items Factor loadings Items Factor
loadings Items Factor loadings Items Factor
loadings Items Factor loadings
WHS_3 0,787 PROD_3 0,766 PAT_5 0,768 2 0,851 REG_7 0,808 MGYK_4 0,868 FIN_3 0,760 WHS_2 0,737 PROD_5 0,692 PAT_4 0,757 4 0,831 REG_4 0,779 MGYK_2 0,847 FIN_2 0,731 WHS_4 0,717 PROD_4 0,671 PAT_1 0,659 3 0,822 REG_8 0,761 MGYK_5 0,841 FIN_8 0,723 WHS_5 0,676 PROD_1 0,669 PAT_2 0,598 1 0,787 REG_6 0,753 MGYK_3 0,721 FIN_4 0,694 WHS_1 0,465 PROD_2 0,605 PAT_3 0,557 6 0,754 REG_5 0,735 MGYK_1 0,661 FIN_1 0,693
PAT_6 0,535 5 0,751 REG_9 0,651 FIN_6 0,626 7 0,718 REG_3 0,620 FIN_5 0,608 REG_2 0,491 FIN_7 0,582 REG_1 0,477
Extraction method: Principal Component Analysis (PCA) Extraction method: Principal Component Analysis (PCA) Rotation: Varimax Rotation: Varimax
Variance explained by factor 10,88% 10,49% 9,31% 7,81% 7,16% 7,09% 6,53% Total variance explained 59,304%

294
Table XXXVI: Fit indices of confirmatory factor analysis of Segev scale CFA: STRATEGIC ORIENTATIONS OF MILES&SNOW (SEGEV, 1987)
Fit indices Threshold value for acceptance Empirical value Evaluation 3 factor 4 factor
CMIN/d.f. <2 (Byrne, 1989)
<3 (Bentler-Bonett, 1980) <5 (Marsch-Hocevar, 1985)
1,968 3,161 Criteria met
RMSEA <0,06 (Hu-Bentler, 1999) <0,07 (Hair et al., 2010)
<0,08 (MacCallum, 1996) 0,069 0,102 Criteria met
CFI >0,9 (Homburg-Baumgartner, 1996) 0,903 0,723 Criteria met NFI >0,9 (Homburg-Baumgartner, 1996) 0,896 0,705 Criteria met TLI >0,9 (Homburg-Baumgartner, 1996) 0,901 0,717 Criteria met GFI >0,9 (Homburg-Baumgartner, 1996) 0,891 0,693 Criteria met
Source: Table made by the author Table XXXVII: Fit indices of confirmatory factor analysis of PEU scale
CFA: PERCEIVED ENVIRONMENTAL UNCERTAINTY (Miles-Snow, 1978) Fit indices Threshold values for acceptance Empirical value Evaluation
CMIN/d.f. <2 (Byrne, 1989) <3 (Bentler-Bonett, 1980) 1,495 Criteria met
RMSEA <0,06 (Hu-Bentler, 1999) <0,07 (Hair et al., 2010) 0,05 Criteria met
CFI >0,9 (Homburg-Baumgartner, 1996) 0,925 Criteria met NFI >0,9 (Homburg-Baumgartner, 1996) 0,918 Criteria met TLI >0,9 (Homburg-Baumgartner, 1996) 0,921 Criteria met GFI >0,9 (Homburg-Baumgartner, 1996) 0,904 Criteria met
Source: Table made by the author

295
Table XXXVIII: Confirmatory factor structure of SOs relevant in the Hungarian public retail drug supply based on Segev’s (1987) scale Factor Scale items Factor
loadings Textual wording of scale items 1.
fact
or:
Pros
pect
or
stra
tegi
c or
ient
atio
n PRO_1 0,930 Our pharmacy can be considered amongst the most innovative enterprises in the sector when it comes to the introduction of new products
and pharmaceutical services, and the implementation of business applications supporting better patient care PRO_2 0,927 Compared to our competitors our pharmacy offers a wider variety of pharmaceutical products and services PRO_5 0,881 Our pharmacy reacts quickly to early signals of business opportunities discovered in the changes of market and regulatory environments
PRO_4 0,850 We believe that being first to introduce new pharmaceutical products, services and new business applications on the market grants serious competitive advantage in this industry
PRO_3 0,719 The composition, breadth and depth of the product and service portfolio offered by our pharmacy undergo periodic changes. PRO_8 0,753 Our pharmacy has competitive advantage in all product and service domains that it offers PRO_7 0,683 Actions taken by our pharmacy often influence the degree of competitive intensity among other pharmacies around us
REA_4 0,661 In recent years our pharmacy has been attempting to adapt its product and service portfolio to the ever changing needs and preferences of our patients
PRO_6 0,544 It is not uncommon that efforts made by our pharmacy to introduce new products and pharmaceutical services turn out to be unsuccessful and unprofitable
2. fa
ctor
: D
efen
der/
Rea
ctor
st
rate
gic
orie
ntat
ion
DEF_1 0,905 Our pharmacy strives to locate a stable market niche by providing conventional pharmaceutical products and services its usual patient segments DEF_9 0,885 Our pharmacy strives to provide its patients a stable product and service portfolio that does not undergo frequent modifications
DEF_6 0,776 The main focus of our pharmacy is to take advantage of the exploitation of opportunities in existing clients by providing them a relatively limited range of products and services
DEF_2 0,775 Our pharmacy tries to maintain a product and service portfolio, that does not need to be modified frequently DEF_7 0,739 Our pharmacy pays special attention only to changes in market and regulatory environments directly influencing its operation. DEF_8 0,671 Compared to its competitors our pharmacy aims to offer and maintain a narrower range of services of pharmacist’s care DEF_3 0,670 Compared to competitors our pharmacy offers a narrower range of products and services
DEF_4 0,666 Our pharmacy attempts to keep and enhance its market position by placing more emphasis on providing higher quality services to patients than its competitors
REA_1 0,645 Our pharmacy insists on keeping its current product and service portfolio, and to serving its conventional patient segments. REA_2 0,616 Our pharmacy seldom takes business risks REA_3 0,562 Our pharmacy often acts upon the direct pressures of the market and regulatory environments
3. fa
ctor
:
Ana
lyse
r
stra
tegi
c or
ient
atio
n ANA_3 0,932 The products and services offered by our pharmacy are characterised by continuous but moderate changes ANA_4 0,883 Our pharmacy carefully examines, which new products and pharmaceutical services worth to introduce on the market
ANA_2 0,857 Compared to its competitors our pharmacy simultaneously tries to maintain a narrower but stable product and pharmaceutical service domain while being open to introduce certain novelties on the market
ANA_5 0,780 Compared to its competitors our pharmacy frequently offers products and services newly launched in the drug retail supply system at a lower price
ANA_1 0,662 Our pharmacy is in no rush to introduce new and promising pharmaceutical products and services and to implement up-to-date business applications ANA_8 0,635 Our pharmacy is seldom among the first to introduce new pharmacological products, services and business applications to the market DEF_5 0,660 To maintain and enhance its market position our pharmacy keeps prices lower compared to its competitors ANA_6 0,640 Compared to our competitors our pharmacy offers novelties with higher quality patient care and accompanied by more additional services ANA_7 0,638 Our pharmacy keeps a close eye on and carefully monitors actions taken by competitor pharmacies
Source: Table made by the author

296
Table XXXIX: Confirmatory factor structure of PEU scale in HPRDS I.
Factor Scale items Factor loadings Textual wording of the scale items
WHOLESALERS
PEU_WHS_1 0,574 Prices and price changes of wholesalers PEU_WHS_2 0,761 Shipping and delivery routine of wholesalers PEU_WHS_3 0,819 Payment terms and conditions of wholesalers PEU_WHS_4 0,818 Additional services of wholesalers PEU_WHS_5 0,775 Discounts provided by wholesalers and their degree
PRODUCERS
PEU_PROD_1 0,666 Pricing routines of producers and their rate of change PEU_PROD_2 0,720 Quality of the goods of the producers
PEU_PROD_3 0,810 Other parameters of producers’ products (e.g. packaging, packing, dosage, branding, flavor etc.)
PEU_PROD_4 0,837 Market entry of producers’ products PEU_PROD_5 0,807 Additional services of producers
PATIENTS
PEU_PAT_1 0,763 Demand of patients for current products and services PEU_PAT_2 0,667 Demand of patients for new, future products and services PEU_PAT_3 0,695 Preference of patients towards generic substitute products PEU_PAT_4 0,896 Purchasing patterns of patients (e.g. timing, frequency, price sensitivity etc.) PEU_PAT_5 0,840 Patients’ tastes and preferences regarding products and services PEU_PAT_6 0,587 Expectations of patients concerning the service-encounter in a pharmacy
COMPETITOR PHARMACIES
PEU_COMP_1 0,907 Pricing routines and price changes of competitor pharmacies PEU_COMP_2 0,956 Composition of product and service portfolio of competitor pharmacies PEU_COMP_3 0,916 Quality of products and services offered by competitor pharmacies PEU_COMP_4 0,918 Quality of patient-serving at competitor pharmacies PEU_COMP_5 0,826 Launch of new products and services of competitor pharmacies to the market PEU_COMP_6 0,832 Content and intensity of competitor pharmacies’ marketing activity PEU_COMP_7 0,819 Timing and content of promotions, sales, discounts offered by competitor pharmacies
Source: Table made by the author

297
Table XL: Confirmatory factor structure of PEU scale in HPRDS II.
Factor Scale items Factor loadings Textual wording of scale items
REGULATORY AUTHORITIES
PEU_REG_1 0,671 Changes concerning prices, realisable profit margins, bands and limits of subsidies etc. PEU_REG_2 0,684 Changes concerning the composition of drugs subsidised by the state and the degree of these subsidies PEU_REG_3 0,713 Changes concerning specifications of quality standards of products and services PEU_REG_4 0,867 Changes of law regulations regarding the professional aspects of pharmacy personnel’s employment PEU_REG_5 0,850 Changes in regulation of pharmacies’ marketing activities
PEU_REG_6 0,861 Changes in fundamental issues of pharmacy operations (ownership structure, corporate law form, constraints of foundation, cooperations machanisms etc)
PEU_REG_7 0,850 Changes concerning sales channels of drugs PEU_REG_8 0,823 Changes concerning the width and depth of products and services available in pharmacies PEU_REG_9 0,660 Changes concerning the education and training of pharmacists and (professional) assistants
HUNGARIAN CHAMBER OF
PHARMACISTS
PEU_MGYK_1 0,734 Ethical norms and regulations defined by the chamber of pharmacists PEU_MGYK_2 0,912 Content elements of lobby activity of the Chamber towards the government PEU_MGYK_3 0,790 Effectiveness of lobby activity of the Hungarian Chamber of Pharmacists towards the government PEU_MGYK_4 0,906 Professional standpoints and recommendations of the Chamber PEU_MGYK_5 0,964 Standpoints and recommendations of the Hungarian Chamber of Pharmacists regarding pharmacy management
FINANCIAL CONDITIONS
PEU_FIN_1 0,795 Short term possibilities of borrowing (e.g. for current assets) PEU_FIN_2 0,837 Long term possibilities of borrowing (e.g. for development) PEU_FIN_3 0,863 Evolution of interest rate on loans PEU_FIN_4 0,764 Fluctuation of exchange rates PEU_FIN_5 0,722 Formation of payment conditions and deadlines PEU_FIN_6 0,705 Cost of hiring pharmacy employees PEU_FIN_7 0,659 Fluctuation of real-estate rental prices PEU_FIN_8 0,731 Evolution of utility costs
Source: Table made by the author
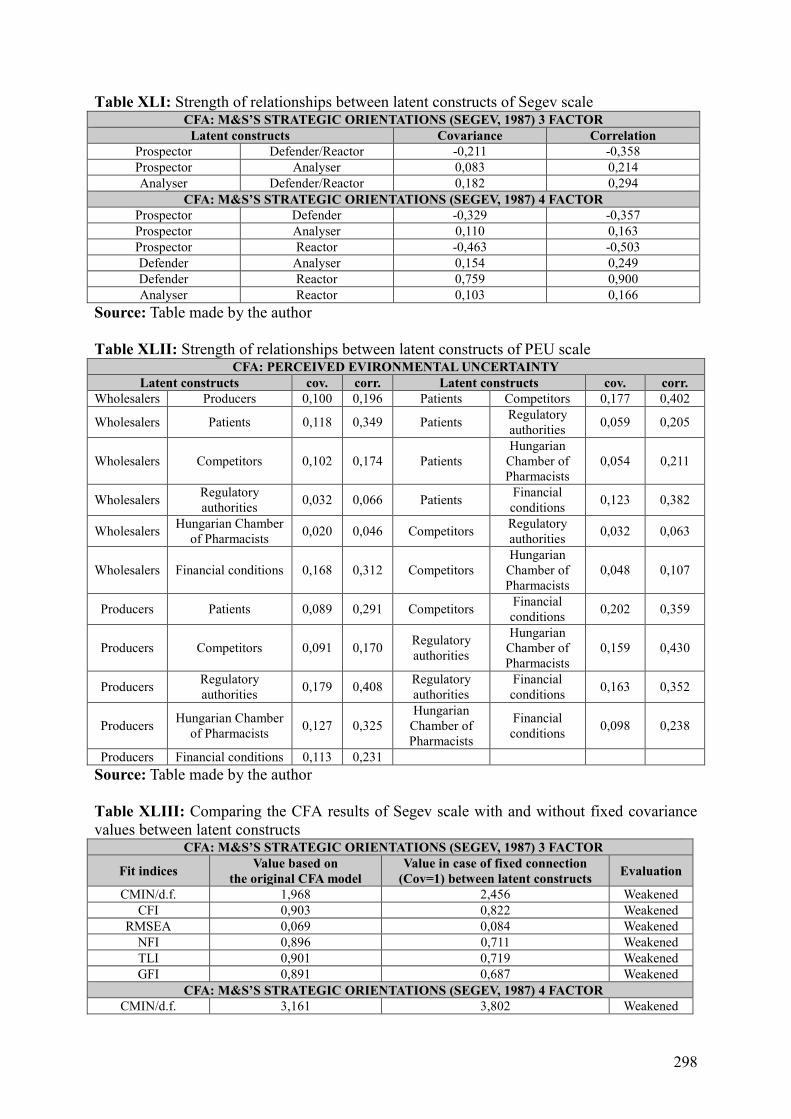
298
Table XLI: Strength of relationships between latent constructs of Segev scale CFA: M&S’S STRATEGIC ORIENTATIONS (SEGEV, 1987) 3 FACTOR Latent constructs Covariance Correlation
Prospector Defender/Reactor -0,211 -0,358 Prospector Analyser 0,083 0,214 Analyser Defender/Reactor 0,182 0,294
CFA: M&S’S STRATEGIC ORIENTATIONS (SEGEV, 1987) 4 FACTOR Prospector Defender -0,329 -0,357 Prospector Analyser 0,110 0,163 Prospector Reactor -0,463 -0,503 Defender Analyser 0,154 0,249 Defender Reactor 0,759 0,900 Analyser Reactor 0,103 0,166
Source: Table made by the author Table XLII: Strength of relationships between latent constructs of PEU scale
CFA: PERCEIVED EVIRONMENTAL UNCERTAINTY Latent constructs cov. corr. Latent constructs cov. corr.
Wholesalers Producers 0,100 0,196 Patients Competitors 0,177 0,402
Wholesalers Patients 0,118 0,349 Patients Regulatory authorities 0,059 0,205
Wholesalers Competitors 0,102 0,174 Patients Hungarian
Chamber of Pharmacists
0,054 0,211
Wholesalers Regulatory authorities 0,032 0,066 Patients Financial
conditions 0,123 0,382
Wholesalers Hungarian Chamber of Pharmacists 0,020 0,046 Competitors Regulatory
authorities 0,032 0,063
Wholesalers Financial conditions 0,168 0,312 Competitors Hungarian
Chamber of Pharmacists
0,048 0,107
Producers Patients 0,089 0,291 Competitors Financial conditions 0,202 0,359
Producers Competitors 0,091 0,170 Regulatory authorities
Hungarian Chamber of Pharmacists
0,159 0,430
Producers Regulatory authorities 0,179 0,408 Regulatory
authorities Financial conditions 0,163 0,352
Producers Hungarian Chamber of Pharmacists 0,127 0,325
Hungarian Chamber of Pharmacists
Financial conditions 0,098 0,238
Producers Financial conditions 0,113 0,231 Source: Table made by the author Table XLIII: Comparing the CFA results of Segev scale with and without fixed covariance values between latent constructs CFA: M&S’S STRATEGIC ORIENTATIONS (SEGEV, 1987) 3 FACTOR
Fit indices Value based on the original CFA model
Value in case of fixed connection (Cov=1) between latent constructs Evaluation
CMIN/d.f. 1,968 2,456 Weakened CFI 0,903 0,822 Weakened
RMSEA 0,069 0,084 Weakened NFI 0,896 0,711 Weakened TLI 0,901 0,719 Weakened GFI 0,891 0,687 Weakened
CFA: M&S’S STRATEGIC ORIENTATIONS (SEGEV, 1987) 4 FACTOR CMIN/d.f. 3,161 3,802 Weakened
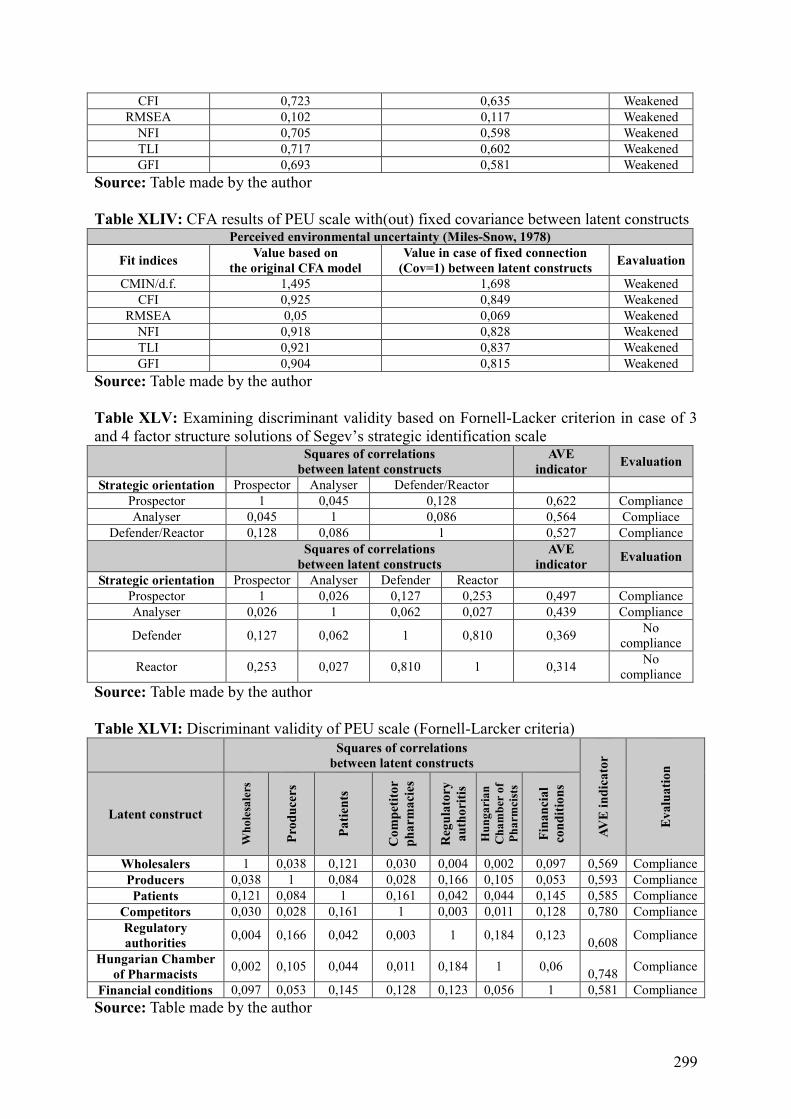
299
CFI 0,723 0,635 Weakened RMSEA 0,102 0,117 Weakened
NFI 0,705 0,598 Weakened TLI 0,717 0,602 Weakened GFI 0,693 0,581 Weakened
Source: Table made by the author Table XLIV: CFA results of PEU scale with(out) fixed covariance between latent constructs
Perceived environmental uncertainty (Miles-Snow, 1978)
Fit indices Value based on the original CFA model
Value in case of fixed connection (Cov=1) between latent constructs Eavaluation
CMIN/d.f. 1,495 1,698 Weakened CFI 0,925 0,849 Weakened
RMSEA 0,05 0,069 Weakened NFI 0,918 0,828 Weakened TLI 0,921 0,837 Weakened GFI 0,904 0,815 Weakened
Source: Table made by the author Table XLV: Examining discriminant validity based on Fornell-Lacker criterion in case of 3 and 4 factor structure solutions of Segev’s strategic identification scale
Squares of correlations between latent constructs
AVE indicator Evaluation
Strategic orientation Prospector Analyser Defender/Reactor Prospector 1 0,045 0,128 0,622 Compliance Analyser 0,045 1 0,086 0,564 Compliace
Defender/Reactor 0,128 0,086 1 0,527 Compliance
Squares of correlations between latent constructs
AVE indicator Evaluation
Strategic orientation Prospector Analyser Defender Reactor Prospector 1 0,026 0,127 0,253 0,497 Compliance Analyser 0,026 1 0,062 0,027 0,439 Compliance
Defender 0,127 0,062 1 0,810 0,369 No compliance
Reactor 0,253 0,027 0,810 1 0,314 No compliance
Source: Table made by the author Table XLVI: Discriminant validity of PEU scale (Fornell-Larcker criteria)
Squares of correlations between latent constructs
AVE
indi
cato
r
Eva
luat
ion
Latent construct
Who
lesa
lers
Prod
ucer
s
Patie
nts
Com
petit
orph
arm
acie
s
Reg
ulat
ory
auth
oriti
s
Hun
gari
an
Cha
mbe
r of
Ph
arm
cist
s
Fina
ncia
l co
nditi
ons
Wholesalers 1 0,038 0,121 0,030 0,004 0,002 0,097 0,569 Compliance Producers 0,038 1 0,084 0,028 0,166 0,105 0,053 0,593 Compliance Patients 0,121 0,084 1 0,161 0,042 0,044 0,145 0,585 Compliance
Competitors 0,030 0,028 0,161 1 0,003 0,011 0,128 0,780 Compliance Regulatory authorities 0,004 0,166 0,042 0,003 1 0,184 0,123 0,608 Compliance
Hungarian Chamber of Pharmacists 0,002 0,105 0,044 0,011 0,184 1 0,06 0,748 Compliance
Financial conditions 0,097 0,053 0,145 0,128 0,123 0,056 1 0,581 Compliance Source: Table made by the author

300
Table XLVII: Evaluation of discriminant validity of measurement instruments Form of analysis method of discriminant analysis Segev (4) Segev (3) PEU
Exploratory factor analysis Not valid Valid Valid Confirmatory factor analysis Not valid Valid Valid Reliability of indicators Not valid Valid Valid Covariance between latent constructs Not valid Valid Valid Comparison of CFA models (original vs. latents’ cov=1) Valid Valid Valid Fornell-Larcker criteria + cross-loadings validity Not valid Valid Valid Source : Table made by the author
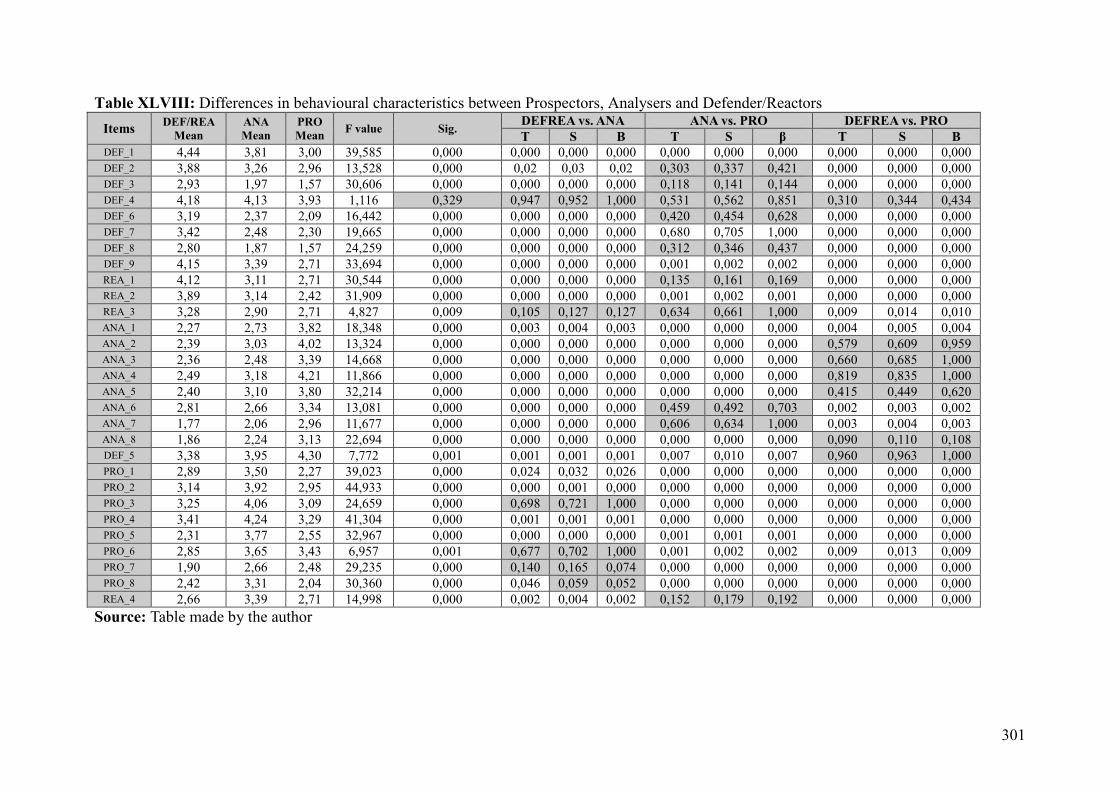
301
Table XLVIII: Differences in behavioural characteristics between Prospectors, Analysers and Defender/Reactors Items DEF/REA
Mean ANA Mean
PRO Mean F value Sig. DEFREA vs. ANA ANA vs. PRO DEFREA vs. PRO
T S Β T S β T S B DEF_1 4,44 3,81 3,00 39,585 0,000 0,000 0,000 0,000 0,000 0,000 0,000 0,000 0,000 0,000 DEF_2 3,88 3,26 2,96 13,528 0,000 0,02 0,03 0,02 0,303 0,337 0,421 0,000 0,000 0,000 DEF_3 2,93 1,97 1,57 30,606 0,000 0,000 0,000 0,000 0,118 0,141 0,144 0,000 0,000 0,000 DEF_4 4,18 4,13 3,93 1,116 0,329 0,947 0,952 1,000 0,531 0,562 0,851 0,310 0,344 0,434 DEF_6 3,19 2,37 2,09 16,442 0,000 0,000 0,000 0,000 0,420 0,454 0,628 0,000 0,000 0,000 DEF_7 3,42 2,48 2,30 19,665 0,000 0,000 0,000 0,000 0,680 0,705 1,000 0,000 0,000 0,000 DEF_8 2,80 1,87 1,57 24,259 0,000 0,000 0,000 0,000 0,312 0,346 0,437 0,000 0,000 0,000 DEF_9 4,15 3,39 2,71 33,694 0,000 0,000 0,000 0,000 0,001 0,002 0,002 0,000 0,000 0,000 REA_1 4,12 3,11 2,71 30,544 0,000 0,000 0,000 0,000 0,135 0,161 0,169 0,000 0,000 0,000 REA_2 3,89 3,14 2,42 31,909 0,000 0,000 0,000 0,000 0,001 0,002 0,001 0,000 0,000 0,000 REA_3 3,28 2,90 2,71 4,827 0,009 0,105 0,127 0,127 0,634 0,661 1,000 0,009 0,014 0,010 ANA_1 2,27 2,73 3,82 18,348 0,000 0,003 0,004 0,003 0,000 0,000 0,000 0,004 0,005 0,004 ANA_2 2,39 3,03 4,02 13,324 0,000 0,000 0,000 0,000 0,000 0,000 0,000 0,579 0,609 0,959 ANA_3 2,36 2,48 3,39 14,668 0,000 0,000 0,000 0,000 0,000 0,000 0,000 0,660 0,685 1,000 ANA_4 2,49 3,18 4,21 11,866 0,000 0,000 0,000 0,000 0,000 0,000 0,000 0,819 0,835 1,000 ANA_5 2,40 3,10 3,80 32,214 0,000 0,000 0,000 0,000 0,000 0,000 0,000 0,415 0,449 0,620 ANA_6 2,81 2,66 3,34 13,081 0,000 0,000 0,000 0,000 0,459 0,492 0,703 0,002 0,003 0,002 ANA_7 1,77 2,06 2,96 11,677 0,000 0,000 0,000 0,000 0,606 0,634 1,000 0,003 0,004 0,003 ANA_8 1,86 2,24 3,13 22,694 0,000 0,000 0,000 0,000 0,000 0,000 0,000 0,090 0,110 0,108 DEF_5 3,38 3,95 4,30 7,772 0,001 0,001 0,001 0,001 0,007 0,010 0,007 0,960 0,963 1,000 PRO_1 2,89 3,50 2,27 39,023 0,000 0,024 0,032 0,026 0,000 0,000 0,000 0,000 0,000 0,000 PRO_2 3,14 3,92 2,95 44,933 0,000 0,000 0,001 0,000 0,000 0,000 0,000 0,000 0,000 0,000 PRO_3 3,25 4,06 3,09 24,659 0,000 0,698 0,721 1,000 0,000 0,000 0,000 0,000 0,000 0,000 PRO_4 3,41 4,24 3,29 41,304 0,000 0,001 0,001 0,001 0,000 0,000 0,000 0,000 0,000 0,000 PRO_5 2,31 3,77 2,55 32,967 0,000 0,000 0,000 0,000 0,001 0,001 0,001 0,000 0,000 0,000 PRO_6 2,85 3,65 3,43 6,957 0,001 0,677 0,702 1,000 0,001 0,002 0,002 0,009 0,013 0,009 PRO_7 1,90 2,66 2,48 29,235 0,000 0,140 0,165 0,074 0,000 0,000 0,000 0,000 0,000 0,000 PRO_8 2,42 3,31 2,04 30,360 0,000 0,046 0,059 0,052 0,000 0,000 0,000 0,000 0,000 0,000 REA_4 2,66 3,39 2,71 14,998 0,000 0,002 0,004 0,002 0,152 0,179 0,192 0,000 0,000 0,000
Source: Table made by the author

302
Table XLIX: AVE indicators of constructs of multi-item Segev and PEU scales Scale Latent construct Value of Average
Variance Extracted (AVE) Pe
rcei
ved
envi
ronm
enta
l un
cert
aint
y Wholesalers 0,569 Producers 0,593 Patients 0,585
Competitor pharmacies 0,780 Regulatory authorities 0,608
Hungarian Chamber of Pharmacists 0,748 Financial conditions 0,581
Sege
v (4
)
Prospector 0,497 Ananlyser 0,439 Defender 0,369 Reactor 0,314
Sege
v (3
) Prosector 0,622 Analyser 0,564
Defender/Reactor 0,527
Source: Table made by the author

303
Table L: Correlation matrix of the behavioural characteristics of Defender/Reactor SO
Abbr. Behavioural characteristics described
DE
F_1
DE
F_2
DE
F_3
DE
F_4
DE
F_6
DE
F_7
DE
F_8
DE
F_9
RE
A_1
RE
A_2
RE
A_3
DEF_1 Our pharmacy strives to locate a stable market niche by providing conventional pharmaceutical products and services its usual patient segments.
Corr. 1
Sig.
DEF_2 Our pharmacy tries to maintain a product and service portfolio, that does not need to be modified frequently.
Corr. 0,600 1 Sig. 0,000
DEF_3 Compared to competitors our pharmacy offers a narrower range of products and services.
Corr. 0,359 0,372 1 Sig. 0,000 0,000
DEF_4 Our pharmacy attempts to keep and enhance its market position by placing more emphasis on providing higher quality services to patients than its competitors.
Corr. 0,448 0,420 0,435 1
Sig. 0,000 0,000 0,001
DEF_6
The main focus of our pharmacy is to take advantage of the exploitation of opportunities in existing clients by providing them a relatively limited range of products and services.
Corr. 0,438 0,461 0,504 0,293 1
Sig. 0,000 0,000 0,000 0,000
DEF_7 Our pharmacy pays special attention only to changes in market and regulatory environments directly influencing its operation.
Corr. 0,366 0,360 0,384 0,344 0,597 1
Sig. 0,000 0,000 0,000 0,000 0,000
DEF_8 Compared to its competitors our pharmacy aims to offer and maintain a narrower range of services of pharmacist’s care.
Corr. 0,348 0,353 0,697 0,306 0,573 0,506 1
Sig. 0,000 0,000 0,000 0,003 0,000 0,000
DEF_9 Our pharmacy strives to provide its patients a stable product and service portfolio that does not undergo frequent modifications.
Corr. 0,698 0,521 0,378 0,491 0,375 0,349 0,362 1
Sig. 0,000 0,000 0,000 0,000 0,000 0,000 0,000
REA_1 Our pharmacy insists on keeping its current product and service portfolio, and to serving its conventional patient segments.
Corr. 0,303 0,343 0,285 0,343 0,289 0,220 0,283 0,488 1
Sig. 0,000 0,000 0,000 0,000 0,000 0,000 0,000 0,000
REA_2 Our pharmacy seldom takes business risks. Corr. 0,311 0,214 0,237 0,293 0,331 0,289 0,334 0,359 0,564 1 Sig. 0,000 0,002 0,000 0,000 0,000 0,000 0,000 0,000 0,000
REA_3 Our pharmacy often acts upon the direct pressures of the market and regulatory environments.
Corr. 0,248 0,254 0,202 0,384 0,286 0,355 0,212 0,361 0,471 0,480 1 Sig. 0,000 0,000 0,002 0,000 0,000 0,000 0,002 0,000 0,000 0,000
Source: Table made by author

304
Table LI: The degree of prevalence of Defender and Reactor characteristics in case of pharmacies classified as Defender/Reactors Serial no.
of pharmacy
DEF_AVG REA_AVG DEF VS. REA
Serial no. of
pharmacy DEF_AVG REA_AVG DEF VS. REA
2. 3,50 3,83 REA 85. 3,63 4,50 REA 4. 3,38 4,50 REA 86. 3,75 3,83 REA 7. 3,75 4,17 REA 88. 3,25 4,67 REA 8. 2,63 4,17 REA 89. 4,38 5,00 REA 11. 4,13 4,50 REA 90. 3,13 2,50 DEF 12. 4,00 4,67 REA 100. 3,75 5,00 REA 18. 4,13 5,00 REA 103. 3,50 4,17 REA 20. 4,00 4,17 REA 104. 3,50 3,83 REA 22. 3,75 4,17 REA 107. 2,75 4,50 REA 24. 3,13 4,83 REA 110. 3,00 4,17 REA 26. 3,50 4,17 REA 114. 3,63 4,50 REA 27. 3,00 3,83 REA 117. 2,75 3,83 REA 28. 3,25 3,17 DEF 120. 3,75 4,17 REA 29. 4,50 4,50 DEF=REA 121. 3,00 4,17 REA 31. 3,38 3,83 REA 127. 1,00 1,50 REA 32. 3,38 2,83 DEF 130. 3,75 5,00 REA 33. 3,13 3,17 REA 131. 3,13 3,50 REA 34. 3,63 4,17 REA 132. 4,00 4,50 REA 42. 4,63 4,17 DEF 133. 4,25 3,50 DEF 43. 2,88 3,83 REA 135. 3,13 4,50 REA 45. 4,75 4,67 DEF 140.. 3,50 4,17 REA 47. 4,38 4,17 DEF 141. 3,00 4,50 REA 48. 3,25 4,17 REA 143. 4,00 4,17 REA 50. 4,50 4,83 REA 148. 3,75 4,50 REA 51. 4,25 4,50 REA 149. 3,25 3,50 REA 52. 3,25 3,50 REA 154. 4,63 3,83 REA 53. 3,75 3,17 DEF 155. 3,25 4,50 REA 54. 4,13 4,83 REA 160. 3,25 4,50 REA 55. 4,63 4,83 REA 162.. 3,38 4,17 REA 56. 3,88 2,83 DEF 169. 3,75 4,17 REA 57. 3,13 4,67 REA 170. 3,75 4,17 REA 58. 4,88 4,50 DEF 172. 3,25 4,50 REA 61. 3,13 4,17 REA 180. 3,50 3,83 REA 62. 3,88 4,17 REA 182. 4,00 4,50 REA 63. 3,13 4,17 REA 183. 3,88 2,83 DEF 70. 2,88 4,17 REA 186. 2,38 3,17 REA 71. 3,88 4,50 REA 189. 3,25 4,83 REA 72. 3,25 4,50 REA 194. 3,88 4,17 REA 73. 3,38 3,83 REA 195. 2,25 4,50 REA 75. 3,13 4,50 REA 197. 3,50 4,17 REA 77. 3,25 3,83 REA 198. 5,00 5,00 DEF=REA 79. 2,75 2,83 REA 202. 5,00 5,00 DEF=REA 80. 4,13 5,00 REA 205. 5,00 5,00 DEF=REA 82. 3,13 4,17 REA 207. 5,00 5,00 DEF=REA
83. 3,25 4,5 REA Final result
REA= 89/74 DEF=89/10 DEF=REA=
89/5 Source: Table made by the author
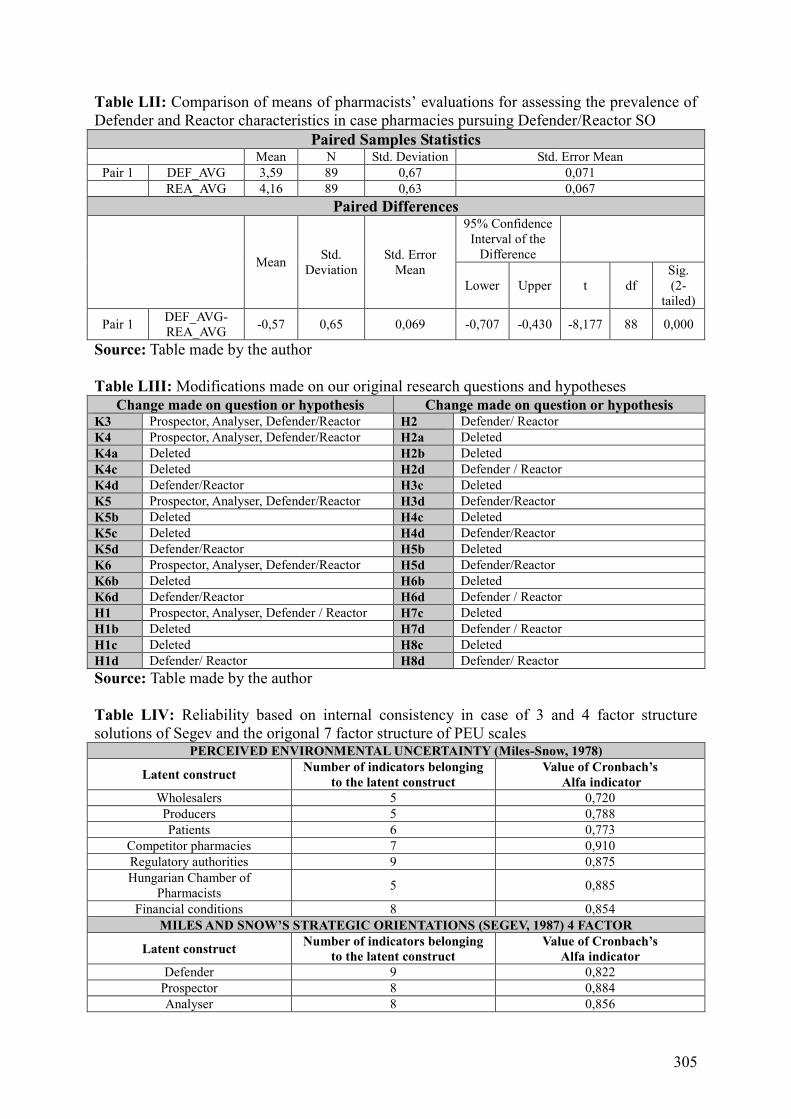
305
Table LII: Comparison of means of pharmacists’ evaluations for assessing the prevalence of Defender and Reactor characteristics in case pharmacies pursuing Defender/Reactor SO
Paired Samples Statistics Mean N Std. Deviation Std. Error Mean
Pair 1 DEF_AVG 3,59 89 0,67 0,071 REA_AVG 4,16 89 0,63 0,067
Paired Differences
Mean Std. Deviation
Std. Error Mean
95% Confidence Interval of the
Difference
Lower Upper t df Sig. (2-
tailed)
Pair 1 DEF_AVG-REA_AVG -0,57 0,65 0,069 -0,707 -0,430 -8,177 88 0,000
Source: Table made by the author Table LIII: Modifications made on our original research questions and hypotheses
Change made on question or hypothesis Change made on question or hypothesis K3 Prospector, Analyser, Defender/Reactor H2 Defender/ Reactor K4 Prospector, Analyser, Defender/Reactor H2a Deleted K4a Deleted H2b Deleted K4c Deleted H2d Defender / Reactor K4d Defender/Reactor H3c Deleted K5 Prospector, Analyser, Defender/Reactor H3d Defender/Reactor K5b Deleted H4c Deleted K5c Deleted H4d Defender/Reactor K5d Defender/Reactor H5b Deleted K6 Prospector, Analyser, Defender/Reactor H5d Defender/Reactor K6b Deleted H6b Deleted K6d Defender/Reactor H6d Defender / Reactor H1 Prospector, Analyser, Defender / Reactor H7c Deleted H1b Deleted H7d Defender / Reactor H1c Deleted H8c Deleted H1d Defender/ Reactor H8d Defender/ Reactor Source: Table made by the author Table LIV: Reliability based on internal consistency in case of 3 and 4 factor structure solutions of Segev and the origonal 7 factor structure of PEU scales
PERCEIVED ENVIRONMENTAL UNCERTAINTY (Miles-Snow, 1978)
Latent construct Number of indicators belonging to the latent construct
Value of Cronbach’s Alfa indicator
Wholesalers 5 0,720 Producers 5 0,788 Patients 6 0,773
Competitor pharmacies 7 0,910 Regulatory authorities 9 0,875 Hungarian Chamber of
Pharmacists 5 0,885
Financial conditions 8 0,854 MILES AND SNOW’S STRATEGIC ORIENTATIONS (SEGEV, 1987) 4 FACTOR
Latent construct Number of indicators belonging to the latent construct
Value of Cronbach’s Alfa indicator
Defender 9 0,822 Prospector 8 0,884 Analyser 8 0,856

306
Reactor 4 0,653 MILES AND SNOW’S STRATEGIC ORIENTATIONS (SEGEV, 1987) 3 FACTOR Prospector 9 0,887 Analyser 9 0,865
Defender/Reactor 11 0,875 Source: Table made by the author Table LV: The Composite Reliability indicator of multi-item Segev and PEU scales
Scale Latent construct Value of Composite Reliability
Perceived environmental uncertainty
Wholesalers 0,787 Producers 0,802 Patients 0,824
Competitor pharmacies 0,917 Regulatory authorities 0,884 Hungarian Chamber of
Pharmacists 0,890 Financial conditions 0,861
M&S strategic orientations, Segev (3)
Defender/Reactor 0,923 Prospector 0,935 Analyser 0,919
M&S strategic orientations, Segev (4)
Prospector 0,884 Analyser 0,858 Defender 0,828 Reactor 0,486
Source: Table made by the author Table LVI: Harman’s single factor method for testing CMV
Multi-item scale Explained degree of variance (%) Evaluation
Perceived environmental uncertainty 19,369-21,11 CMV irrelevant M&S strategic orientations, Segev (3) 21,1-23,398 CMV irrelevant M&S strategic orientations, Segev (4) 18,06-19,45 CMV irrelevant
Source: Table made by the author Table LVII: Common single latent factor analysis for testing CMV
Multi-item scale Regression weight and its square between CSLF and manifest variables Evaluation
Perceived environmental uncertainty 0,337 és 0,1135, that is 11,35%<25% CMV irrelevant M&S strategic orientations, Segev (3) 0,33 és 0,1089, that is 10,89%<25% CMV irrelevant M&S strategic orientations, Segev (4) 0,44 és 0,1936, That is 19,36 <25% CMV irrelevant
Source: Table made by the author Table LVIII: Testing the problem of CMV with „marker” variable method in Segev scale by the integration of latent constructs of PEU scale „Marker” variable Regression weight and its square
between CSLF and manifest variables CSLF
„Threshold value” Evaluation
PEU_WHS 0,19 és 0,0361, that is 3,61% 0,33 CMV irrelevant PEU_PROD 0,22 és 0,0484, that is 4,84% 0,33 CMV irrelevant PEU_PAT 0,23 és 0,0529, that is 5,29% 0,33 CMV irrelevant
PEU_COMP 0,31 és 0,0961, that is 9,61% 0,33 CMV irrelevant PEU_REG 0,26 és 0,0676, that is 6,76% 0,33 CMV irrelevant
PEU_MGYK 0,28 és 0,0784, that is 7,84% 0,33 CMV irrelevant PEU_FIN 0,26 és 0,0676, that is 6,76% 0,33 CMV irrelevant
Source: Table made by the author

307
Table LIX: Testing of CMV with „marker” variable method in PEU scale by the inclusion of latent constructs of Segev scale „Marker” variable Regression weight and its square
between CSLF and manifest variables CSLF
„Threshold value” Evaluation
DEFENDER 0,34 és 0,1156, that is 11,56% 0,337 CMV minimal PROSPECTOR 0,38 és 0,1444, that is 14,44% 0,337 CMV minimal
ANALYSER 0,39 és 0,1521, that is 15,21% 0,337 CMV minimal REACTOR 0,34 és 0,1156, that is 11,56% 0,337 CMV minimal DEF_REA 0,35 és 0,1225, that is 12,25% 0,337 CMV minimal
PROSPECTOR 0,37 és 0,1369, that is 13,69% 0,337 CMV minimal ANALYSER 0,38 és 0,1444, that is 14,44% 0,337 CMV minimal
Source: Table made by the author Table LX: Summary of quantitative tests applied for testing CMV
Method Perceived environmental uncertainty Miles and Snow’s strategic orientations, Segev (3)
Harman’s Single factor method CMV not relevant CMV not relevant
Common single latent factor analysis CMV not relevant CMV not relevant
Marker variable method CMV minimal CMV not relevant Source: Table made by the author Table LXI: Significance of differences between evaluations of pharmacists regarding variables integrated in non-response bias tests, early and late respondents by county
Statistics Budapest Baranya BAZ Pest Vas Other AVG_PRO F value 0,09 0,06 1,056 1,198 0,00 0,048
Sig. 0,776 0,939 0,311 0,277 1,00 0,832
AVG_ANA F value 0,622 0,520 0,051 0,035 0,411 0,932 Sig. 0,435 0,480 0,822 0,853 0,536 0,359
AVG_DEF F value 0,019 0,026 1,674 0,958 0,003 0,822 Sig. 0,892 0,873 0,204 0,331 0,960 0,388
AVG_REA F value 0,470 0,040 1,255 0,741 0,008 0,752 Sig. 0,830 0,949 0,270 0,392 0,930 0,408
AVG_PEU_WHS F value 7,275 0,875 0,015 1,518 0,000 1,689 Sig. 0,011 0,363 0,903 0,221 1,000 0,226
AVG_PEU_PROD F value 2,190 0,287 0,515 0,630 0,000 0,069 Sig. 0,148 0,599 0,478 0,480 1,000 0,798
AVG_PEU_PAT F value 7,014 0,042 0,689 0,056 0,046 0,210 Sig. 0,012 0,841 0,412 0,814 0,834 0,658
AVG_PEU_COMP F value 4,050 0,005 1,011 0,286 0,633 0,026 Sig. 0,052 0,946 0,322 0,594 0,445 0,874
AVG_PEU_REG F value 5,034 0,170 2,039 0,213 0,050 1,035 Sig. 0,031 0,686 0,162 0,645 0,827 0,336
AVG_PEU_MGYK F value 2,198 3,367 0,449 1,667 0,226 0,745 Sig. 0,147 0,084 0,507 0,200 0,645 0,711
AVG_PEU_FIN F value 2,438 2,013 0,361 0,284 1,276 1,908 Sig. 0,127 0,174 0,552 0,596 0,285 0,211
AVG_PEU F value 1,304 0,000 0,022 0,134 0,007 1,198 Sig. 0,261 1,000 0,883 0,715 0,937 0,302
PEU_HIGH_LOW χ2 value 0,273 0,014 0,021 0,315 0,343 0,782 Sig. 0,601 0,906 0,886 0,575 0,558 0,376
SALES F value 0,021 2,226 2,097 0,002 0,233 0,118 Sig. 0,885 0,156 0,157 0,963 0,641 0,741
NET PROFIT F value 0,450 0,568 3,348 2,101 0,017 0,055 Sig. 0,509 0,467 0,077 0,152 0,902 0,821
TOTAL AREA OF SPACE
F value 0,520 3,03 0,253 0,206 0,559 13,378 Sig. 0,476 0,589 0,618 0,651 0,476 0,06
AREA OF OFFICINA F value 0,352 1,82 0,156 2,156 0,061 1,754 Sig. 0,558 0,675 0,696 0,146 0,812 0,222
EMPLOYEES F value 0,107 1,425 0,006 5,631 0,024 1,149 Sig. 0,746 0,249 0,940 0,02 0,880 0,315
OWN_STRUCT χ2 value 2,030 0,006 1,247 0,106 3,086 0,244 Sig. 0,154 0,937 0,264 0,745 0,079 0,621

308
OWN_COOP χ2 value 0,001 0,014 3,325 0,508 1,333 0,052 Sig. 0,982 0,906 0,068 0,476 0,248 0,819
RELA_COOP χ2 value 1,449 2,898 0,026 0,658 0,343 2,213 Sig. 0,229 0,089 0,873 0,417 0,558 0,137
Source: Table made by the author Table LXII: Sample distribution of SOs identified by self-typing paragraph method and Segev multi-item scale exhibiting 4 factors (strategic orientations)
STRATEGIC ORIENTATIONS
FREQUENCY (n) AND DISTRIBUTION (%)
MEASUREMENT INSTRUMENTS Self-typing
paragraphs (4) Segev
multi-item scale (4)
Prospector N 48 40 (%) 23,2 19,3
Analyser N 69 42 (%) 33,3 20,3
Defender N 80 45 (%) 38,6 21,7
Reactor N 10 80 (%) 4,8 38,6
IN TOTAL N 207 207 (%) 100 100
Source: Table made by the author Table LXIII: Sample distribution of SOs identified by self-typing paragraph method and multi-item Segev scale exhibiting 3 factors (strategic orientations)
STRATEGIC ORIENTATION
FREQUENCY (n) AND DISTRIBUTION (%)
MEASUREMENT TOOLS Self-typing
paragraphs (3) Segev
multi-item scale (3)
Prospector N 48 55 (%) 23,1 26,6
Analyser N 69 63 (%) 33,3 30,4
Defender/Reactor N 90 89 (%) 43,4 43
IN TOTAL N 207 207 (%) 100 100
Source: Table made by the author Table LXIV: The degree of internal identity in the case of self-typing paragraph methods providing 3 and 4 SOs and Segev scale exhibiting 3 and 4 factor structure solutions
MATCH FREQUENCY (n) AND DISTRIBUTION (%)
MEASUREMENT INSTRUMENTS Self-typing
paragraphs (3 and 4) Segev multi-item
scale (3 and 4)
Yes N 197 165 (%) 96,5 79,7
No N 10 42 (%) 3,5 20,3
IN TOTAL N 207 207 (%) 100 100
Source: Table made by the author

309
Table LXV: The degree of external (between measurement instruments) identity of SOs identified by self-typing parargraph method and multi-item Segev scale
MATCH FREQUENCY (n) AND DISTRIBUTION (%)
MEASUREMENT TOOLS Self-typing
paragraphs (4) and multi-item scale of
Segev (4)
Self-typing paragraphs (3)
and multi-item scale of Segev (3)
Yes N 81 129 (%) 39,1 62,3
No N 126 78 (%) 60,9 37,7
IN TOTAL N 207 207 (%) 100 100
Source: Table made by the author Table LXVI: The degree of identity between classification results of original self-typing paragraphs and multi-item Segev scale operationalising 4 strategic orientations of M&S
Segev (4) Defender Self-type (4) Defender Segev (4) Prospector
Self-type (4) Prospector 0 1 0 1
0 97 65 0 128 39 1 29 16 1 32 8
Segev (4) Analyser Self-type (4) Defender Segev (4) Reactor Self-type (4) Reactor 0 1 0 1
0 108 56 0 119 8 1 30 13 1 78 2
Source: Table made by the author Table LXVII: Comparing the classification results of identification methods applied for operationalising strategic orientations relevant in HPRDS
Segev (3) Defender/Reactor
Self-type (3) Defender/Reactor Segev (3)
Prospector
Self-type (3) Prospector Segev (3)
Analyser
Self-type (3) Analyser
0 1 0 1 0 1 0 94 24 0 136 15 0 107 38 1 22 67 1 24 32 1 31 31
Source: Table made by the author Table LXVIII: Convergence in the classification results of measurement instruments Measurement tool and strategic orientation Mean McNemar χ2 Sig.
1 Self-type (4) Defender 0,3913 13,032 0,000 Segev (4) Defender 0,2174
2 Self-type (4) Prospector 0,2271 0,522 0,476 Segev (4) Prospector 0,1932
3 Self-type (4) Analyser 0,3333 7,267 0,007 Segev (4) Analyser 0,2077
4 Self-type (4) Reactor 0,0483 55,360 0,000 Segev (4) Reactor 0,3865
1 Self-type (3) Defender/Reactor 0,4396 0,22 0,883 Segev (3) Defender / Reactor 0,4300
2 Self-type (3) Prospector 0,2271 1,641 0,200 Segev (3) Prospector 0,2705
3 Self-type (3) Analyser 0,3333 0,522 0,470 Segev (3) Analyser 0,2995 Source: Table made by the author

310
Table LXIX: Comparing the distribution of SOs identified by original measurement tools Measurement tool and strategic orientation Mean T value Sig.
1 Self-type (4) Defender 0,3913 8,676 0,000 Self-type (4) Reactor 0,0483
2 Self-type (4) Prospector 0,2271 5,200 0,000 Self-type (4) Reactor 0,0483
3 Self-type (4) Analyser 0,3333 7,464 0,000 Self-type (4) Reactor 0,0483
4 Self-type (4) Analyser 0,3333 2,059 0,041 Self-type (4) Prospector 0,2271
5 Self-type (4) Analyser 0,3333 -0,980 0,328 Self-type (4) Defender 0,3913
6 Self-type (4) Defender 0,3913 -3,066 0,002 Self-type (4) Prospector 0,2271
1 Segev (4) Defender 0,2174 -3,200 0,002 Segev (4) Reactor 0,3865
2 Segev (4) Prospector 0,1932 -3,766 0,000 Segev (4) Reactor 0,3865
3 Segev (4) Analyser 0,2077 3,421 0,001 Segev (4) Reactor 0,3865
4 Segev (4) Analyser 0,2077 -0,329 0,743 Segev (4) Prospector 0,1932
5 Segev (4) Analyser 0,2077 0,215 0,830 Segev (4) Defender 0,2174
6 Segev (4) Defender 0,2174 0,541 0,589 Segev (4) Prospector 0,1932 Source: Table made by the author Table LXX: Comparing the distribution of relevant SOs observable in HPRDS Measurement tool and strategic orientation Mean T value Sig.
1 Self-type (3) Defender/Reactor 0,4396 3,870 0,000 Self-type (3) Prospector 0,2271
2 Self-type (3) Defender/Reactor 0,4396 1,748 0,082 Self-type (3) Analyser 0,3333
3 Self-type (3) Prospector 0,2271 -2,059 0,041 Self-type (3) Analyser 0,3333
1 Segev (3) Defender/Reactor 0,4300 2,785 0,006 Segev (3) Analyser 0,2705
2 Segev (3) Defender/Reactor 0,4300 2,218 0,028 Segev (3) Analyser 0,2995
3 Segev (3) Prospector 0,2705 -0,551 0,582 Segev (3) Analyser 0,2995 Source: Table made by the author Table LXXI: Correlation between SOs, degree of PEU, GL and BP indicators
Correlation DEF_REA_AVG
PRO_ AVG
ANA_ AVG PEU_AVG
URBAN_ RURAL SALES NET
PROFIT
DEF_REA_AVG Corr. 1 -0,330 0,166 0,070 0,189** -0,344 -0,103 Sig. 0,000 0,017 0,318 0,007 0,000 0,139
PRO_AVG Corr. -0,330 1 0,183 0,103 -0,142* 0,374 0,126 Sig. 0,000 0,008 0,142 0,043 0,000 0,069
ANA_AVG Corr. 0,166 0,183 1 0,259** -0,030 -0,060 0,017 Sig. 0,017 0,008 0,000 0,671 0,393 0,813
PEU_AVG Corr. 0,070 0,103 0,259** 1 0,137 0,062 0,099 Sig. 0,318 0,142 0,000 0,050 0,371 0,157

311
URBAN_RURAL Corr. 0,189** -0,142* -0,030 0,137 1 -0,345** -0,148* Sig. 0,007 0,043 0,671 0,050 0,000 0,035
SALES Corr. -0,344 0,374 -0,060 0,062 -0,345** 1 0,604 Sig. 0,000 0,000 0,393 0,371 0,000 0,000
NET PROFIT Corr. -0,103 0,126 0,017 0,099 -0,148* 0,604 1 Sig. 0,139 0,069 0,813 0,157 0,035 0,000 Source: Table made by the author Table LXXII: Associations between SOs and perceived environmental uncertainty
HIGHLOWPEU * CLASSIFICATIONSEGEV Cross-tabs evaluation CLASSIFICATIONSEGEV
Total DEF_REA PRO ANA
HIGH PEU
Count 48 31 22 101
Expected Count 43,1 27,5 30,4 101,0
% within HIGHLOWPEU 47,5% 30,7% 21,8% 100,0%
% within CLASSIFICATIONSEGEV 54,5% 55,4% 35,5% 49,0%
% of Total 23,3% 15,0% 10,7% 49,0%
Residual 4,9 3,5 -8,4
Std. Residual ,7 ,7 -1,5
Adjusted Residual 1,4 1,1 -2,6
LOW PEU
Count 40 25 40 105
Expected Count 44,9 28,5 31,6 105,0
% within HIGHLOWPEU 38,1% 23,8% 38,1% 100,0%
% within CLASSIFICATIONSEGEV 45,5% 44,6% 64,5% 51,0%
% of Total 19,4% 12,1% 19,4% 51,0%
Residual -4,9 -3,5 8,4
Std. Residual -,7 -,7 1,5
Adjusted Residual -1,4 -1,1 2,6
TOTAL
Count 88 56 62 206
Expected Count 88,0 56,0 62,0 206,0
% within HIGHLOWPEU 42,7% 27,2% 30,1% 100,0%
% within CLASSIFICATIONSEGEV 100,0% 100,0% 100,0% 100,0%
% of Total 42,7% 27,2% 30,1% 100,0%
Chi-Square Tests Value Df Asymp. Sig. (2-sided)
Pearson Chi-Square 6,521a 2 ,038
Likelihood Ratio 6,597 2 ,037
Linear-by-Linear Association 4,767 1 ,029
N of Valid Cases 206
a. 0 cells (0,0%) have expected count less than 5. The minimum expected count is 27,46. Source: Table made by the author

312
Table LXXIII: Differences in PEU between pharmacies pursuing Prospector, Analyser and Defender/Reactor strategic orientations
Source: Table made by the author Table LXXIV: Paired differences between strategic orientations in terms of PEU
Source: Table made by the author
DESCRIPTIVES
PEU_AVG
N Mean Std. Deviation Std. Error 95% Confidence Interval for Mean
Minimum Maximum Lower Bound Upper Bound
D/R 88 2,85691414 ,448391849 ,047798732 2,76190899 2,95191930 1,644667 3,888889
P 55 2,85361616 ,441639471 ,059550654 2,73422429 2,97300803 2,000222 3,911778
A 62 3,07274910 ,434948071 ,055238460 2,96229298 3,18320523 2,089333 3,978222
Total 205 2,92130623 ,451593477 ,031540657 2,85911875 2,98349371 1,644667 3,978222
ANOVA
PEU_AVG
Sum of squares Degrees of freedom Mean Square F Value Sig.
Between Groups 2,039 2 1,019
5,205 0,006 Within Groups 39,564 202 0,196
Total 41,603 204
(I) CLASSIFICATIONSEGEV (J) CLASSIFICATIONSEGEV Mean Difference (I-J) Std. Error Sig.
Tukey HSD
Defender/Reactor Prospector ,003297980 ,076071329 ,999
Analyser -,215834963* ,073381083 ,010
Prospector Defender/Reactor -,003297980 ,076071329 ,999
Analyser -,219132942* ,081976885 ,022
Analyser Defender/Reactor ,215834963* ,073381083 ,010
Prospector ,219132942* ,081976885 ,022
Scheffe
Defender/Reactor Prospector ,003297980 ,076071329 ,999
Analyser -,215834963* ,073381083 ,014
Prospector Defender/Reactor -,003297980 ,076071329 ,999
Analyser -,219132942* ,081976885 ,030
Analyser Defender/Reactor ,215834963* ,073381083 ,014
Prospector ,219132942* ,081976885 ,030
Bonferroni
Defender/Reactor Prospector ,003297980 ,076071329 1,000
Analyser -,215834963* ,073381083 ,011
Prospector Defender/Reactor -,003297980 ,076071329 1,000
Analyser -,219132942* ,081976885 ,024
Analyser Defender/Reactor ,215834963* ,073381083 ,011
Prospector ,219132942* ,081976885 ,024

313
Table LXXV: Effect of M&S’s SOs on the degree of PEU Independent variable Dependent variable β Sig.
Prospector PEU 0,136 0,146 Analyser PEU 0,403 0,001
Defender/Reactor PEU 0,054 0,548 Source: Table made by the author Table LXXVI: Differences between pharmacies characterised by low and high PEU with regard to the prevalence of M&S’s SOs
DESCRIPTIVES
N Mean Std.
Deviation Std. Error
95% Confidence Interval for Mean Min. Max.
Lower Bound Upper Bound
AVG_DEF_REA
HIGH 102 3,099822 ,7166162 ,0735233 2,982247 3,274212 1,0000 5,0000
LOW 105 3,167100 ,6861927 ,0676126 3,036235 3,304453 1,0909 5,0000
Total 207 3,133948 ,6994851 ,0497102 3,052105 3,248170 1,0000 5,0000
AVG_PRO
HIGH 102 2,805011 ,7953924 ,0816055 2,616918 2,940977 1,0000 5,0000
LOW 105 2,931217 ,7146077 ,0704124 2,822581 3,101906 1,0000 5,0000
Total 207 2,869028 ,7580938 ,0538754 2,768052 2,980545 1,0000 5,0000
AVG_ANA
HIGH 102 2,879085 ,7108031 ,0729269 2,858711 3,148307 1,0000 4,3333
LOW 105 3,125926 ,7564560 ,0745358 3,017207 3,312890 1,1111 4,8889
Total 207 3,004294 ,7374991 ,0524118 2,984182 3,190902 1,0000 4,8889
ANOVA Sum of Squares Df Mean Square F Sig.
DEF_REA
Between Groups ,234 1 ,234
,361 ,548 Within Groups 132,903 205 ,648
Total 133,137 206
PRO
Between Groups 0,824 1 ,824
1,209 ,273 Within Groups 139,773 205 ,682
Total 140,597 206
ANA
Between Groups 3,152 1 3,152
4,763 ,059 Within Groups 135,683 205 ,664
Total 138,836 206
Source: Table made by the author

314
Table LXXVIII: The potential moderating effect of PEU by pharmacists in the relationship between M&S’s SOs and sales of pharmacies
PERCEIVED ENVIRONMENTAL UNCERTAINTY AND SALES β T value Sig.
1.
MO
DE
L
Main effects
Constant 4,854 0,000 Prospector 0,222 2,790 0,006 Analyser -0,018 -0,222 0,825 Defender/Reactor -0,295 -4,094 0,000 Perceived environmental uncertainty (PEU) 0,070 0,982 0,327
2. M
OD
EL Main effects
Constant 4,656 0,000 Prospector 0,240 2,984 0,003 Analyser -0,039 -0,485 0,628 Defender/Reactor -0,273 -3,696 0,000 PEU 0,081 1,112 0,268
Interaction effects Prospector*PEU -0,074 -0,859 0,392 Analyser*PEU 0,059 0,679 0,498 Defender/Reactor*PEU -0,099 -1,371 0,172
3. M
OD
EL
Main effects
Constant 2,037 0,000 Prospector 0,140 2,010 0,046 Analyser -0,034 -0,491 0,624 Defender/Reactor -0,132 -2,043 0,043 PEU 0,068 1,110 0,269
Interaction effects Prospector*PEU -0,106 -1,454 0,148 Analyser*PEU 0,012 0,165 0,869 Defender/Reactor*PEU -0,076 -1,261 0,209
Pharmacy „socio-demographic”
control variables
Urban/Rural -0,139 -2,096 0,038 Ownership structure 0,044 0,698 0,486 Equity based cooperation -0,030 -0,512 0,610 Relationship based cooperation 0,031 0,497 0,620 Total area of space of pharmacy 0,110 1,445 0,150 Total area of officina -0,061 -0,810 0,419 Number of employees 0,472 6,546 0,000
4. M
OD
EL
Main effects
Constant 1,811 0,072 Prospector 0,132 1,787 0,049 Analyser -0,054 -0,743 0,458 Defender/Reactor -0,149 -2,241 0,026 PEU 0,075 1,203 0,231
Interaction effects Prospector*PEU -0,096 -1,294 0,197 Analyser*PEU 0,016 0,211 0,833 Defender/Reactor*PEU -0,077 -1,244 0,215
Pharmacy „socio-demographic”
control variables
Urban/Rural -0,113 -1,490 0,138 Ownership structure 0,052 0,782 0,435 Equity based cooperation -0,039 -0,643 0,521 Relationship based cooperation 0,031 0,489 0,624 Total area of space of pharmacy 0,081 1,031 0,304 Total area of officina -0,055 -0,720 0,472 Number of employees 0,461 6,158 0,000
Control variables regarding locational and site attributes
There is a hospital, physician’s office or nursing home in the vicinity of our pharmacy 0,090 1,457 0,147
There are shopping malls, hypermarkets, or other kinds of retailers (e.g. shops) in the vicinity of our pharmacy -0,044 -0,676 0,500
There is a drugstore or gas-station close to our pharmacy 0,015 0,220 0,826 There are many competitor pharmacies in our vicinity 0,045 0,624 0,534 Our pharmacy operates in a shopping-mall or hypermarket -0,024 -0,372 0,710
A significant number of people passes by our pharmacy 0,020 0,317 0,751 Source: Table made by the author

315
Table LXXIX: Explanatory power of hierarchical moderated regression models exploring the potential moderating effect of PEU in the relationship of SO and pharmacies’ sales
Source: Table made by the author Table LXXX: Potential moderating effect of PEU in the relationship of SO and sales
Degree of perceived environmental
uncertainty Strategic orientation β T value Sig.
High
Constant 3,292 0,001 Defender/Reactor -0,165 -1,652 0,102 Prospector 0,375 3,764 0,000 Analyser -0,171 -1,948 0,074
Low
Constant 3,451 0,001 Defender/Reactor -0,304 -3,213 0,002 Prospector 0,265 2,773 0,007 Analyser -0,001 -0,007 0,994
Source: Table made by the author Table LXXXI: Potential moderating effect of PEU in the relationship of SO and sales
Model summary (sales) Change statistics
PEU Model R R2 Adjusted R Square
Std. Error of the
Estimate
R2
Change F
Change Df1 Df2 Sig. F Change
High 1 0,494 0,244 0,221 120,72753 0,244 10,569 3 98 0,000 Low 2 0,439 0,193 0,169 141,18627 0,193 8,028 3 101 0,000
Source: Table made by the author
MODEL SUMMARY (SALES) Change statistics
Model R R2 Adjusted R Square
Std. Error of the Estimate
R2 Change
F Change Df1 Df2 Sig. R2
Change 1 0,406 0,165 0,146 134,01889 0,165 8,677 4 176 0,000 2 0,419 0,176 0,142 134,27935 0,011 0,773 3 173 0,511 3 0,683 0,467 0,422 110,25534 0,291 12,944 7 166 0,000 4 0,693 0,480 0,415 110,90558 0,013 0,677 6 160 0,669

316
Table LXXXII: Potential moderating effect of PEU in the relationship of SO and NP
Source: Table made by the author
PERCEIVED ENVIRONMENTAL UNCERTAINTY AND NET PROFIT β T value Sig.
1.
MO
DE
L
Main effects
Constant 0,508 0,612 Prospector 0,088 1,030 0,304 Analyser -0,084 -0,987 0,325 Defender/Reactor -0,104 -1,348 0,179 Perceived environmental uncertainty (PEU) 0,122 1,598 0,112
2. M
OD
EL Main effects
Constant 0,640 0,523 Prospector 0,081 0,939 0,349 Analyser -0,077 -0,885 0,378 Defender/Reactor -0,100 -1,246 0,208 Perceived environmental uncertainty (PEU) -0,103 1,314 0,191
Interaction effects
Prospector*PEU -0,075 -0,801 0,424 Analyser*PEU 0,071 0,753 0,452 Defender/Reactor*PEU 0,066 0,845 0,399
3. M
OD
EL
Main effects
Constant 0,078 0,938 Prospector 0,001 0,016 0,987 Analyser -0,073 -0,841 0,401 Defender/Reactor -0,047 -0,588 0,557 Perceived environmental uncertainty 0,111 1,446 0,150
Interaction effects
Prospector*PEU -0,091 -1,000 0,319 Analyser*PEU 0,046 0,499 0,619 Defender/Reactor*PEU 0,066 0,881 0,379
Pharmacy „socio-
demographic” control variables
Urban/Rural -0,108 -1,303 0,194 Ownership structure 0,016 0,201 0,841 Equity based cooperation -0,055 -0,743 0,458 Relationship based cooperation 0,025 0,329 0,743 Total area of space of pharmacy 0,210 2,215 0,028 Total area of space of officina 0,005 0,051 0,960 Number of employees 0,163 1,812 0,072
4. M
OD
EL
Main effects
Constant -0,250 0,803 Prospector -0,048 -0,526 0,600 Analyser -0,065 -0,724 0,470 Defender/Reactor -0,045 -0,547 0,585 Perceived environmental uncertainty 0,097 1,255 0,211
Interaction effects
Prospector*PEU -0,094 -1,026 0,307 Analyser*PEU 0,076 0,828 0,409 Defender/Reactor*PEU 0,085 1,117 0,266
Pharmacy „socio-
demographic” control variables
Urban/Rural -0,095 -1,014 0,312 Ownership structure -0,007 -0,091 0,927 Equity based cooperation -0,068 -0,917 0,360 Relationship based cooperation 0,046 0,600 0,549 Total area of space of pharmacy 0,231 2,396 0,018 Total area of officina 0,005 0,051 0,959 Number of employees 0,151 1,639 0,103
Control variables regarding
locational and site attributes
There is a hospital, physician’s office or nursing home in the vicinity of our pharmacy 0,113 1,482 0,140
There are shopping malls, hypermarkets, or other kinds of retailers (e.g. shops) in the vicinity of our pharmacy 0,153 1,904 0,059
There is a drugstore or gas-station close to our pharmacy -0,104 -1,254 0,212 There are many competitor pharmacies in our vicinity 0,002 0,019 0,985 Our pharmacy operates in a shopping-mall or hypermarket 0,088 1,091 0,277
A significant number of people passes by our pharmacy 0,017 0,216 0,830

317
Table LXXXIII: Explanatory power of regression models exploring the potential moderating effect of PEU in the relationship between SO and NP
MODEL SUMMARY (NET PROFIT) Change statistics
Model R R2 Adjusted R Square
Std. Error of the Estimate R2 Change F Change Df1 Df2 Sig. R2
Change 1 0,193 0,037 0,015 14,237262 0,037 1,703 4 176 0,151 2 0,217 0,047 0,009 14,286593 0,010 0,596 3 173 0,619 3 0,411 0,169 0,099 13,619526 0,122 3,480 7 166 0,002 4 0,456 0,208 0,109 13,540520 0,039 1,324 6 160 0,249
Source: Table made by the author Table LXXXIV: Potential moderating effect of PEU in the relationship of SO and NP
Degree of perceived environmental
uncertainty Strategic orientation β T value Sig.
High
Constant 2,366 0,020 Defender/Reactor -0,207 -2,022 0,066 Prospector 0,158 1,468 0,145 Analyser -0,123 -1,269 0,207
Low
Constant 0,035 0,972 Defender/Reactor 0,009 0,082 0,935 Prospector 0,036 0,340 0,734 Analyser 0,086 0,809 0,420
Source: Table made by the author Table LXXXV: Potential moderating effect of PEU in the relationship of SO and net profit
Model summary (sales) Change statistics
PEU Model R R2 Adjusted R Square
Std. Error of the
Estimate
R2
Change F
Change Df1 Df2 Sig. F Change
High 1 0,346 0,120 0,093 9,529565 0,120 4,435 3 98 0,006 Low 2 0,102 0,010 -0,019 16,916081 0,010 0,357 3 101 0,784
Source: Table made by the author

318
Table LXXXVI: Potential moderating effect of GL in the relationship of SO and sales GEOGRAPHICAL LOCATION AND SALES β T value Sig.
1. M
OD
EL
Main effects
Constant 27593 0,000 Defender/Reactor -0,253 -3,647 0,000 Prospector 0,209 2,762 0,006 Analyser -0,025 -0,330 0,742 Geographical loaction (Urban/Rural) -0,278 -4,144 0,000
2. M
OD
EL Main effects
Constant 26839 0,000 Defender/Reactor -0,264 -3,746 0,000 Prospector 0,212 2,774 0,006 Analyser -0,019 -0,255 0,799 Geographical loaction (Urban/Rural) -0,271 -3,922 0,000
Interaction effects Defender/Reactor*Geographical location -0,016 -0,236 0,814 Prosector* Geographical location -0,039 -0,504 0,615 Analyser* Geographical location -0,050 -0,652 0,515
3. M
OD
EL
Main effects
Constant 1,313 0,191 Defender/Reactor -0,161 -2,542 0,012 Prospector 0,122 1,776 0,048 Analyser 0,007 0,103 0,918 Geographical loaction (Urban/Rural) -0,111 -1,692 0,092
Interaction effects Defender/Reactor*Geographical location -0,005 -0,078 0,938 Prosector* Geographical location -0,092 -1,354 0,178 Analyer* Geographical location -0,048 -0,701 0,484
Pharmacy „socio-demographic”
Control variables
Ownership structure 0,048 0,764 0,446 Equity based cooperation -0,001 -0,010 0,992 Relationship based cooperation 0,050 0,809 0,420 Total area of space of pharmacy 0,131 1,699 0,091 Total area of officina -0,071 -0,942 0,348 Number of employees 0,476 6,820 0,000
4. M
OD
EL
Main effects
Constant 0,605 0,546 Defender/Reactor -0,173 -2,677 0,008 Prospector 0,111 1,522 0,130 Analyser -0,008 -0,110 0,912 Geographical location (Urban/Rural) -0,077 -1,024 0,307
Interaction effects Defender/Reactor*Geographical location 0,016 0,232 0,817 Prospector* Geographical location -0,085 -1,224 0,223 Analyser* Geographical location -0,035 -0,505 0,614
Pharmacy „socio-demographic”
Control variables
Ownership structure 0,051 0,773 0,441 Equity based cooperation -0,016 -0,258 0,797 Relationship based cooperation 0,050 0,786 0,433 Total area of space of pharmacy 0,108 1,356 0,177 Total area of officina -0,075 -0,969 0,334 Number of employees 0,469 6,433 0,000
Control variables regarding locational and site attributes
There is a hospital, physician’s office or nursing home in the vicinity of our pharmacy 0,087 1,401 0,163
There are shopping malls, hypermarkets, or other kinds of retailers (e.g. shops) in the vicinity of our pharmacy -0,033 -0,491 0,624
There is a drugstore or gas-station close to our pharmacy 0,012 0,186 0,853 There are many competitor pharmacies in our vicinity 0,065 0,908 0,365 Our pharmacy operates in a shopping-mall or hypermarket -0,011 -0,168 0,867
A significant number of people passes by our pharmacy 0,017 0,270 0,788 Source: Table made by the author

319
Table LXXXVII: Explanatory power of regression models exploring the potential moderating effect of GL in the relationship between SO and NP
MODEL SUMMARY (Sales) Change statistics
Model R R2 Adjusted R Square
Std. Error of the Estimate R2 Change F Change Df1 Df2 Sig. R2
Change 1 0,485 0,235 0,217 128,27242 0,235 13,503 4 176 0,000 2 0,490 0,241 0,210 128,89497 0,006 0,435 3 173 0,728 3 0,681 0,463 0,422 110,27906 0,223 11,556 6 167 0,000 4 0,690 0,476 0,414 111,02523 0,012 0,627 6 161 0,708
Source: Table made by the author Table LXXXVIII: Moderating effect of GL in the relationship between SO and sales
Geographical location Strategic orientation β T value Sig.
Urban
Constant 21,836 0,000 Defender/Reactor -0,160 -1,567 0,120 Prospector 0,276 2,958 0,004 Analyser -0,028 -0,289 0,773
Rural
Constant 23,428 0,000 Defender/Reactor -0,332 -3,526 0,001 Prospector 0,396 4,046 0,000 Analyser -0,290 -3,117 0,002
Source: Table made by the author Table LXXIX: Explanatory power of regression models demonstrating the potential moderating effect of GL in the relationship between SO and sales
Model summary (sales) Change statistics
Urban/ Rural Model R R2 Adjusted
R Square
Std. Error of the
Estimate
R2
Change F
Change Df1 Df2 Sig. F Change
Urban 1 0,362 0,131 0,108 148,25948 0,131 5,719 3 114 0,001 Rural 2 0,583 0,340 0,316 89,27101 0,340 14,577 3 85 0,000
Source: Table made by the author

320
Table XC: Potential moderating effect of GL in the relationship between SO and NP GEOGRAPHICAL LOCATION AND NET PROFIT β T value Sig.
1.
MO
DE
L
Main effects
Constant 8,516 0,000 Defender/Reactor -0,078 -1,004 0,317 Prospector 0,090 1,064 0,289 Analyser -0,073 -0,864 0,389 Geographical location (Urban/Rural) -0,148 -1,976 0,059
2. M
OD
EL Main effects
Constant 8,505 0,000 Defender/Reactor -0,086 -1,094 0,275 Prospector 0,085 0,993 0,322 Analyser -0,080 -0,939 0,349 Geographical location (Urban/Rural) -0,139 -1,802 0,073
Interaction effects
Defender/Reactor*Geographical location -0,093 -1,187 0,237 Prospector*Geographical location 0,010 0,113 0,910 Analyser*Geographical location -0,019 -0,225 0,822
3. M
OD
EL
Main effects
Constant -0,218 0,828 Defender/Reactor -0,056 -0,705 0,482 Prospector 0,011 0,132 0,895 Analyser -0,058 -0,685 0,494 Geographical location (Urban/Rural) -0,083 -1,004 0,317
Interaction effects Defender/Reactor*Geographical location -0,087 -1,111 0,268 Prospector*Geographical location -0,056 -0,651 0,516 Analyser*Geographical location 0,014 0,165 0,869
Pharmacy „socio-demographic”
Control variables
Ownership structure 0,017 0,221 0,826 Equity based cooperation -0,045 -0,581 0,562 Relationship based cooperation 0,030 0,385 0,701 Total area of space of pharmacy 0,224 2,309 0,022 Total area of officina -0,005 -0,055 0,956 Number of employees 0,170 1,930 0,050
4. M
OD
EL
Main effects
Constant -0,976 0,331 Defender/Reactor -0,047 -0,587 0,558 Prospector -0,024 -0,260 0,795 Analyser -0,055 -0,628 0,531 Geographical location (Urban/Rural) -0,088 -0,938 0,349
Interaction effects Defender/Reactor*Geographical location -0,074 -0,889 0,375 Prospector* Geographical location -0,048 -0,552 0,582 Analyser* Geographical location 0,015 0,180 0,857
Pharmacy „socio-demographic”
Control variables
Ownership structure -0,004 -0,044 0,965 Equity based cooperation -0,061 -0,782 0,435 Relationship based cooperation 0,051 0,654 0,514 Total area of space of pharmacy -0,248 2,507 0,013 Total area of officina -0,005 -0,054 0,957 Number of employees 0,162 1,784 0,076
Control variables regarding locational and site attributes
There is a hospital, physician’s office or nursing home in the vicinity of our pharmacy
0,107 1,379 0,170
There are shopping malls, hypermarkets, or other kinds of retailers (e.g. shops) in the vicinity of our pharmacy
0,127 1,528 0,128
There is a drugstore or gas-station close to our pharmacy -0,106 -1,270 0,206 There are many competitor pharmacies in our vicinity -0,025 -0,284 0,777 Our pharmacy operates in a shopping-mall or hypermarket
0,100 1,206 0,230
A significant number of people passes by our pharmacy 0,011 0,131 0,896 Source: Table made by the author Table XCI: Explanatory power of regression models demonstrating the potential moderating effect of GL in the relationship between SO and NP
MODEL SUMMARY (Net Profit) Change statistics
Model R R2 Adjusted R Square
Std. Error of the Estimate R2 Change F Change Df1 Df2 Sig. R2
Change 1 0,211 0,044 0,023 14,183663 0,044 2,049 4 176 0,090 2 0,232 0,054 0,016 14,235542 0,009 0,573 3 173 0,633 3 0,389 0,151 0,085 13,723275 0,097 3,193 6 167 0,002

321
4 0,431 0,186 0,090 13,687650 0,035 1,145 6 161 0,339 Source: Table made by the author Table XCII: Moderating effect of geographical location between SO and NP
Geographical location Strategic orientation β T value Sig.
Urban
Constant 6,399 0,000 Defender/Reactor 0,028 0,254 0,800 Prospector 0,056 0,564 0,574 Analyser 0,028 0,263 0,793
Rural
Constant 8,228 0,000 Defender/Reactor -0,308 -2,958 0,004 Prospector 0,199 1,832 0,051 Analyser -0,190 -1,768 0,081
Source: Table made by the author Table XCIII: Moderating effect of GL in the relationship between SO and NP
Model summary (net profit) Change statistics
Urban/ Rural Model R R2 Adjusted
R Square
Std. Error of the
Estimate
R2
Change F
Change Df1 Df2 Sig. F Change
Urban 1 0,068 0,005 -0,022 16,853475 0,005 0,178 3 114 0,911 Rural 2 0,393 0,155 0,124 7,562201 0,155 5,005 3 82 0,003
Forrás: Table made by the author Table XCIV: The correlation between socio-demographic characteristics, locational and site attributes of the pharmacies and the BP indicators (sales and net profit)
Items Sales Net Profit
There is a hospital, doctor’s office or nursing home in the vicinity of our pharmacy 0,203** 0,142*
There are shopping malls, hypermarkets, or other kinds of retailers (e.g. shops) in the vicinity of our pharmacy 0,088 0,146*
There is a drugstore or gas-station close to our pharmacy 0,252** 0,102 There are many competitor pharmacies in our vicinity 0,250** 0,096 Our pharmacy operates in a shopping-mall or hypermarket 0,048 0,091 A significant number of people passes by our pharmacy 0,256** 0,151* Does the pharmacy operate in an urban or rural area? -0,340** -0,143* Ownership structure: Only pharmacists/family members/friends VS. not only pharmacists/family members/friends 0,158* 0,064
Does the pharmacy take part in any kind of equity based cooperation (e.g. chain)? 0,019 -0,033 Does the pharmacy take part in any kind of strategic alliance and/or procurement association? 0,187** 0,115
Total area of space of the pharmacy? 0,287** 0,293** Total area of the officina? 0,228** 0,191** How many employees does the pharmacy have in total? 0,611** 0,274** Note: *: significant, if p value is less than 0,05 and **: significant, if p is less than 0,01 Source: Table made by the author Table XCV: The relationship between strategic orientations and sales of pharmacies
STRUCTURAL EQUATION MODELING Independent variable Dependent variable β Sig.
Prospector Sales 0,327 0,000 Analyser Sales -0,073 0,322
Defender/Reactor Sales -0,224 0,008 Source: Table made by the author
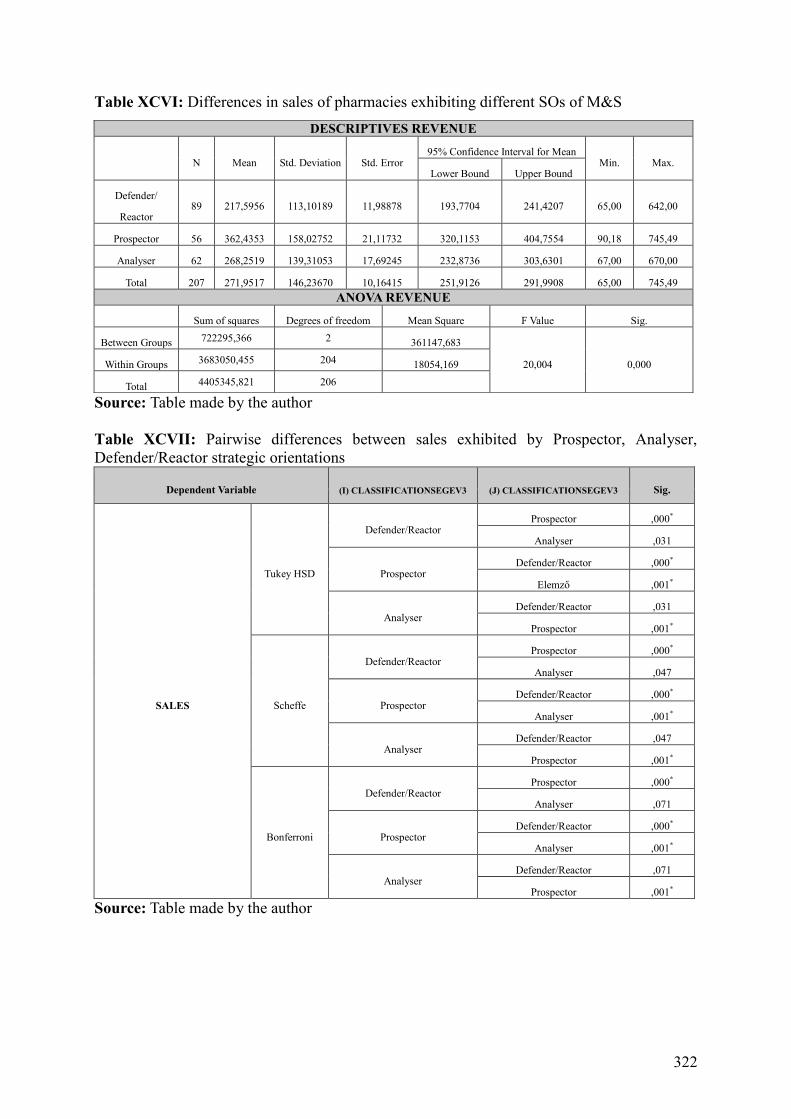
322
Table XCVI: Differences in sales of pharmacies exhibiting different SOs of M&S
Source: Table made by the author Table XCVII: Pairwise differences between sales exhibited by Prospector, Analyser, Defender/Reactor strategic orientations
Dependent Variable (I) CLASSIFICATIONSEGEV3 (J) CLASSIFICATIONSEGEV3 Sig.
SALES
Tukey HSD
Defender/Reactor Prospector ,000*
Analyser ,031
Prospector Defender/Reactor ,000*
Elemző ,001*
Analyser Defender/Reactor ,031
Prospector ,001*
Scheffe
Defender/Reactor Prospector ,000*
Analyser ,047
Prospector Defender/Reactor ,000*
Analyser ,001*
Analyser Defender/Reactor ,047
Prospector ,001*
Bonferroni
Defender/Reactor Prospector ,000*
Analyser ,071
Prospector Defender/Reactor ,000*
Analyser ,001*
Analyser Defender/Reactor ,071
Prospector ,001* Source: Table made by the author
DESCRIPTIVES REVENUE
N Mean Std. Deviation Std. Error 95% Confidence Interval for Mean
Min. Max. Lower Bound Upper Bound
Defender/
Reactor 89 217,5956 113,10189 11,98878 193,7704 241,4207 65,00 642,00
Prospector 56 362,4353 158,02752 21,11732 320,1153 404,7554 90,18 745,49
Analyser 62 268,2519 139,31053 17,69245 232,8736 303,6301 67,00 670,00
Total 207 271,9517 146,23670 10,16415 251,9126 291,9908 65,00 745,49 ANOVA REVENUE
Sum of squares Degrees of freedom Mean Square F Value Sig.
Between Groups 722295,366 2 361147,683
20,004 0,000 Within Groups 3683050,455 204 18054,169
Total 4405345,821 206

323
Table XCVIII: The relationship between SOs and net profit of pharmacies STRUCTURAL EQUATION MODELING
Independent variables Dependent variable β Sig. Prospector Net profit 0,108 0,210 Analyser Net profit 0,020 0,806
Defender/Reactor Net profit -0,080 0,361 Source: Table made by the author Table XCIX: Differences in NP of pharmacies following different SOs of M&S
Source: Table made by the author Table C: Pairwise differences in NP realised by Prospectors, Analysers, Defender/Reactors
Dependent Variable (I) CLASSIFICATIONSEGEV3 (J) CLASSIFICATIONSEGEV3 Sig.
NET PROFIT
Tukey HSD
Defender/Reactor Prospector ,127 Analyser ,743
Prospector Defender/Reactor ,127
Analyser ,486
Analyser Defender/Reactor ,743
Prospector ,486
Scheffe
Defender/Reactor Prospector ,151 Analyser ,764
Prospector Defender/Reactor ,151
Analyser ,519
Analyser Defender/Reactor ,764
Prospector ,519
Bonferroni
Defender/Reactor Prospector ,157 Analyser 1,000
Prospector Defender/Reactor ,157
Analyser ,758
Analyser Defender/Reactor 1,000
Prospector 0,758 Source: Table made by the author
DESCRIPTIVES (NET PROFIT)
N Mean Std. Deviation Std. Error 95% Confidence Interval for Mean
Min. Max. Lower Bound Upper Bound
Defender/
Reactor 89 6,75708 15,595219 1,653090 3,47191 10,04225 -9,500 135,000
Prospector 56 11,34147 11,721860 1,566399 8,20234 14,48060 -5,943 40,000
Analyser 62 8,43076 12,604785 1,600809 5,22974 11,63178 -11,639 70,000
Total 207 8,49860 13,825224 ,960919 6,60410 10,39310 -11,639 135,000
ANOVA NET PROFIT
Sum of squares Degrees of freedom Mean Square F Value Sig.
Between Groups 722,799 2 361,399
1,907 0,151 Within Groups 38651,383 204 189,468
Total 39374,182 206

324
Table CI: The moderating effect of PEU in the relationship between SO and sales MULTIGROUP MODERATION High perceived
environmental uncertainty Low perceived
environmental uncertainty Indeoendent
Variable Dependent Variable β Sig. β Sig.
Prospector Sales 0,401 0,000 0,248 0,033 Defender/Reactor Sales -0,147 0,199 -0,334 0,009
Analyser Sales -0,174 0,088 0,021 0,850 Source: Table made by the author Table CII: Moderating effect of PEU in the relationship of SO and pharmacies’ SAL
INTERACTION MODERATION Independent variable Dependent variable β Sig.
Prospector Sales 0,342 0,000 (PEU) * Prospector Sales -0,057 0,448 Defender/Reactor Sales -0,257 0,000
PEU * Defender/Reactor Sales -0,162 0,027 Analyser Sales -0,073 0,306
PEU * Analyser Sales 0,095 0,167 PEU Sales 0,068 0,289
Source: Table made by the author Table CIII: Moderating effect of PEU in the relationship between SO and NP
MULTIGROUP MODERATION High perceived environmental
uncertainty
Low perceived environmental
uncertainty Independent
variable Dependent variable β Sig. β Sig.
Prospector Net profit 0,153 0,201 0,056 0,630 Defender/Reactor Net profit -0,241 0,059 0,0012 0,918
Analyser Net profit -0,114 0,282 0,085 0,482 Source: Table made by the author Table CIV: Moderating effect of PEU in the relationship between SO and pharmacies’ NP
INTERACTION MODERATION Independent variable Dependent variable β Sig.
Prospector Net profit (NP) 0,094 0,260 PEU * Prospector NP -0,034 0,684 Defender/Reactor NP -0,074 0,378
PEU * Defender/Reactor NP 0,045 0,589 Analyser NP 0,003 0,966
PEU * Analyser NP 0,060 0,442 PEU NP 0,083 0,252
Source: Table made by the author Table CV: Moderating effect of GL in the relationship of SO and pharmacies’ SAL
INTERACTION MODERATION Independent variable Dependent variable β Sig.
Prospector Sales 0,321 0,000 Prospector * Geographical location
(Urban/Rural) Sales -0,024 0,727
Defender/Reactor Sales -0,206 0,005 Defender/Reactor *
Geographical location (Urban/Rural) Sales -0,053 0,456
Analyser Sales -0,108 0,107 Analyser * Geographical location Sales -0,077 0,244
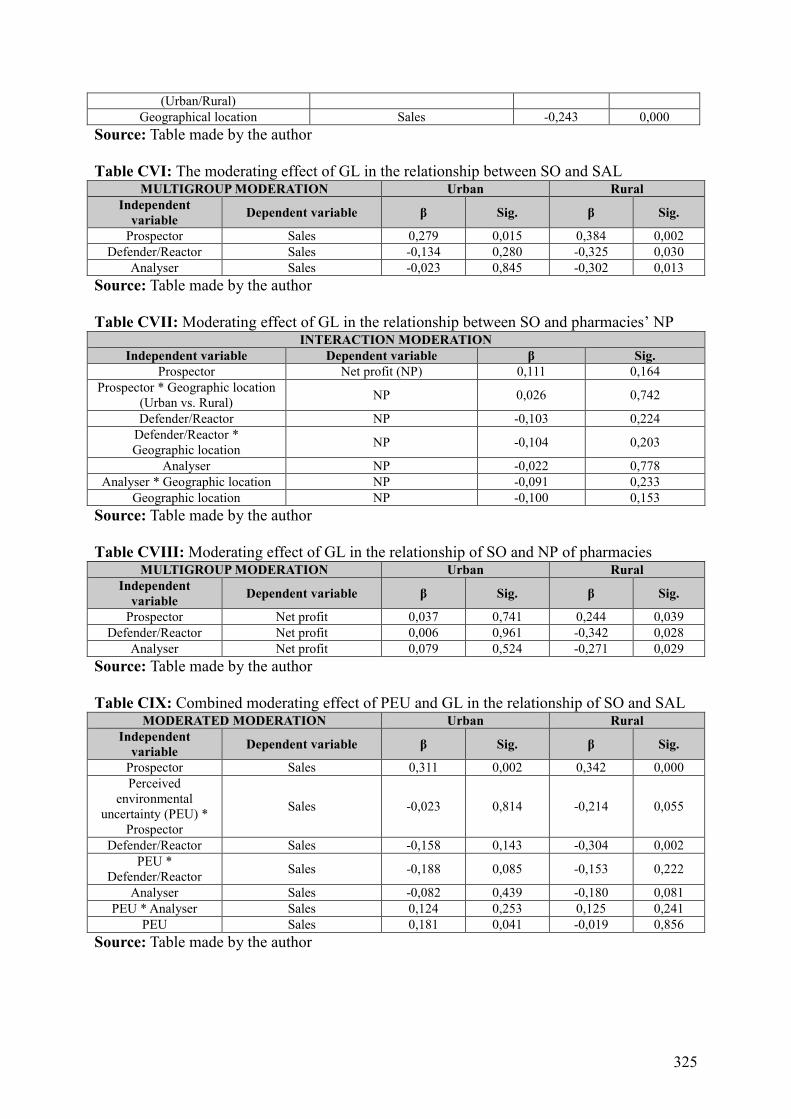
325
(Urban/Rural) Geographical location Sales -0,243 0,000
Source: Table made by the author Table CVI: The moderating effect of GL in the relationship between SO and SAL
MULTIGROUP MODERATION Urban Rural Independent
variable Dependent variable β Sig. β Sig.
Prospector Sales 0,279 0,015 0,384 0,002 Defender/Reactor Sales -0,134 0,280 -0,325 0,030
Analyser Sales -0,023 0,845 -0,302 0,013 Source: Table made by the author Table CVII: Moderating effect of GL in the relationship between SO and pharmacies’ NP
INTERACTION MODERATION Independent variable Dependent variable β Sig.
Prospector Net profit (NP) 0,111 0,164 Prospector * Geographic location
(Urban vs. Rural) NP 0,026 0,742
Defender/Reactor NP -0,103 0,224 Defender/Reactor * Geographic location NP -0,104 0,203
Analyser NP -0,022 0,778 Analyser * Geographic location NP -0,091 0,233
Geographic location NP -0,100 0,153 Source: Table made by the author Table CVIII: Moderating effect of GL in the relationship of SO and NP of pharmacies
MULTIGROUP MODERATION Urban Rural Independent
variable Dependent variable β Sig. β Sig.
Prospector Net profit 0,037 0,741 0,244 0,039 Defender/Reactor Net profit 0,006 0,961 -0,342 0,028
Analyser Net profit 0,079 0,524 -0,271 0,029 Source: Table made by the author Table CIX: Combined moderating effect of PEU and GL in the relationship of SO and SAL
MODERATED MODERATION Urban Rural Independent
variable Dependent variable β Sig. β Sig.
Prospector Sales 0,311 0,002 0,342 0,000 Perceived
environmental uncertainty (PEU) *
Prospector
Sales -0,023 0,814 -0,214 0,055
Defender/Reactor Sales -0,158 0,143 -0,304 0,002 PEU *
Defender/Reactor Sales -0,188 0,085 -0,153 0,222
Analyser Sales -0,082 0,439 -0,180 0,081 PEU * Analyser Sales 0,124 0,253 0,125 0,241
PEU Sales 0,181 0,041 -0,019 0,856 Source: Table made by the author

326
Table CX: Combined moderating effect of PEU and GL in the relationship of SO and NP MODERATED MODERATION Urban Rural
Independent variable Dependent variable β Sig. β Sig. Prospector Net profit (NP) 0,020 0,857 0,174 0,100
PEU * Prospector NP 0,017 0,876 -0,260 0,024 Defender/Reactor NP 0,004 0,974 -0,298 0,003
PEU * Defender/Reactor NP 0,131 0,277 0,069 0,592 Analyser NP 0,007 0,955 -0,166 0,12
PEU * Analyser NP -0,017 0,884 0,193 0,078 PEU NP 0,228 0,019 -0,164 0,137
Source: Table made by the author Table CXI: Combined moderating effect of PEU and GL in the relationship between SO and SAL by controling for relevant, industry-specific variables
MODERATED MODERATION Urban Rural Independet variable Dependent variable β Sig. β Sig.
Prospector Sales 0,262 0,010 0,204 0,049 PEU * Prospector Sales -0,030 0,761 -0,205 0,052 Defender/Reactor Sales -0,219 0,043 -0,232 0,017
PEU * Defender/Reactor Sales -0,196 0,073 -0,101 0,391 Analyser Sales -0,089 0,389 -0,130 0,089
PEU * Analyser Sales 0,080 0,450 0,162 0,080 PEU Sales 0,163 0,061 -0,045 0,667
TELEPHELYMEDICAL Sales 0,124 0,157 0,040 0,685 TELEPHELYDROG_BENZ Sales 0,045 0,598 0,096 0,366
TELEPHELYCOMP Sales 0,016 0,864 0,044 0,644 TELEPHELYSTREETWALK Sales 0,027 0,765 0,200 0,041
TULAJSZERKEZET Sales 0,046 0,592 -0,031 0,720 RELATIONSHIPCOOPERATION Sales 0,111 0,196 0,071 0,452
TELJESALAPTERÜLET Sales 0,213 0,018 0,149 0,112 Source: Table made by the author Table CXII: Combined moderating effect of PEU and GL in the relationship between SO and NP by integrating the relevant, industry-specific control variables
MODERATED MODERATION Urban Rural Indpendent variable Dependent veraible β Sig. β Sig.
Prospector Net profit (NP) -0,066 0,561 0,051 0,631 Perceived environmental
uncertainty (PEU) * Prospector
NP -0,023 0,826 -0,274 0,009
Defender/Reactor NP -0,045 0,696 -0,276 0,005 PEU * Defender/Reactor NP 0,156 0,182 0,074 0,532
Analyser NP 0,037 0,743 -0,157 0,121 PEU * Analyser NP -0,006 0,959 0,230 0,022
PEU NP 0,197 0,035 -0,132 0,200 TELJESALAPTERÜLET NP 0,222 0,023 0,322 0,000
TELEPHELYSTREETWALK NP -0,019 0,845 0,171 0,070 TELEPHELYSHOPPING NP 0,194 0,042 -0,029 0,762 TELEPHELYMEDICAL NP 0,112 0,233 -0,056 0,558
Source: Table made by the author

327
Table CXXI: Correlation between behavioural attributes of M&S’s SOs and BP indicators Strategic behavioural characteristics Sales Net profit
Def
ende
r/R
eact
or
Our pharmacy strives to locate a stable market niche by providing conventional pharmaceutical products and services its usual patient segments. -0,301** -0,089
Our pharmacy tries to maintain a product and service portfolio, that does not need to be modified frequently. -0,162* -0,071
Compared to competitors our pharmacy offers a narrower range of products and services. -0,287** -0,022
Our pharmacy attempts to keep and enhance its market position by placing more emphasis on providing higher quality services to patients than its competitors. -0,05 0,008
The main focus of our pharmacy is to take advantage of the exploitation of opportunities in existing clients by providing them a relatively limited range of products and services.
-0,267** -0,103
Our pharmacy pays special attention only to changes in market and regulatory environments directly influencing its operation. -0,183** 0,004
Compared to its competitors our pharmacy aims to offer and maintain a narrower range of services of pharmacist’s care. -0,299** -0,141*
Our pharmacy strives to provide its patients a stable product and service portfolio that does not undergo frequent modifications. -0,285** -0,103
Our pharmacy insists on keeping its current product and service portfolio, and to serving its conventional patient segments. -0,248** -0,143*
Our pharmacy seldom takes business risks. -0,267** -0,054 Our pharmacy often acts upon the direct pressures of the market and regulatory environments. -0,149* -0,028
Pros
pect
or
Our pharmacy can be considered amongst the most innovative enterprises in the sector when it comes to the introduction of new products and pharmaceutical services, and the implementation of business applications supporting better patient care.
0,345** 0,113
Compared to our competitors our pharmacy offers a wider variety of pharmaceutical products and services. 0,339** 0,090
The composition, breadth and depth of the product and service portfolio offered by our pharmacy undergo periodic changes. 0,244** 0,101
We believe that being first to introduce new pharmaceutical products, services and new business applications on the market grants serious competitive advantage in this industry.
0,224** 0,054
Our pharmacy reacts quickly to early signals of business opportunities discovered in the changes of market and regulatory environments 0,298** 0,165
It is not uncommon that efforts made by our pharmacy to introduce new products and pharmaceutical services turn out to be unsuccessful and unprofitable. 0,154* -0,037
Actions taken by our pharmacy often influence the degree of competitive intensity among other pharmacies around us. 0,350** 0,167*
Our pharmacy has competitive advantage in all product and service domains that it offers. 0,361** 0,208** In recent years our pharmacy has been attempting to adapt its product and service portfolio to the ever changing needs and preferences of our patients. 0,129 -0,027
Ana
lyse
r
Our pharmacy is in no rush to introduce new and promising pharmaceutical products and services and to implement up-to-date business applications. -0,181* -0,146*
Compared to its competitors our pharmacy simultaneously tries to maintain a narrower but stable product and pharmaceutical service domain while being open to introduce certain novelties on the market.
-0,070 -0,020
The products and services offered by our pharmacy are characterised by continuous but moderate changes. -0,047 0,043
Our pharmacy carefully examines, which new products and pharmaceutical services worth to introduce on the market. -0,053 0,025
Compared to its competitors our pharmacy frequently offers products and services newly launched in the drug retail supply system at a lower price. 0,001 -0,011
Compared to our competitors our pharmacy offers novelties with higher quality patient care and accompanied by more additional services. 0,071 0,131
Our pharmacy keeps a close eye on and carefully monitors actions taken by competitor pharmacies. 0,071 0,071
Our pharmacy is seldom among the first to introduce new pharmacological products, services and business applications to the market. -0,145* -0,024
To maintain and enhance its market position our pharmacy keeps prices lower compared to its competitors. -0,001 0,056
Source: Table made by the author Note: *: significant if p value is less than 0,05 and **: significant if p is less than 0,01

328
Table CXXII: Effect of M&S’s SOs’ behavioural characteristics on sales of pharmacies Strategic behavioural characteristic β Sig.
Constant 0,000 Our pharmacy strives to locate a stable market niche by providing conventional pharmaceutical products and services its usual patient segments. -0,106 0,333
Our pharmacy tries to maintain a product and service portfolio, that does not need to be modified frequently. 0,084 0,353
Compared to competitors our pharmacy offers a narrower range of products and services. -0,068 0,505 Our pharmacy attempts to keep and enhance its market position by placing more emphasis on providing higher quality services to patients than its competitors 0,214 0,019
The main focus of our pharmacy is to take advantage of the exploitation of opportunities in existing clients by providing them a relatively limited range of products and services. -0,139 0,126
Our pharmacy pays special attention only to changes in market and regulatory environments directly influencing its operation. 0,004 0,962
Compared to its competitors our pharmacy aims to offer and maintain a narrower range of services of pharmacist’s care. -0,140 0,180
Our pharmacy strives to provide its patients a stable product and service portfolio that does not undergo frequent modifications. -0,069 0,510
Our pharmacy insists on keeping its current product and service portfolio, and to serving its conventional patient segments -0,065 0,477
Our pharmacy seldom takes business risks. 0,064 0,494 Our pharmacy often acts upon the direct pressures of the market and regulatory environments. -0,042 0,602
Our pharmacy can be considered amongst the most innovative enterprises in the sector when it comes to the introduction of new products and pharmaceutical services, and the implementation of business applications supporting better patient care.
0,230 0,054
Compared to our competitors our pharmacy offers a wider variety of pharmaceutical products and services. -0,067 0,566
The composition, breadth and depth of the product and service portfolio offered by our pharmacy undergo periodic changes. -0,035 0,703
We believe that being first to introduce new pharmaceutical products, services and new business applications on the market grants serious competitive advantage in this industry. -0,064 0,516
Our pharmacy reacts quickly to early signals of business opportunities discovered in the changes of market and regulatory environments. 0,095 0,353
It is not uncommon that efforts made by our pharmacy to introduce new products and pharmaceutical services turn out to be unsuccessful and unprofitable -0,013 0,869
Actions taken by our pharmacy often influence the degree of competitive intensity among other pharmacies around us 0,185 0,040
Our pharmacy has competitive advantage in all product and service domains that it offers. 0,179 0,060 In recent years our pharmacy has been attempting to adapt its product and service portfolio to the ever changing needs and preferences of our patients. -0,083 0,328
Our pharmacy is in no rush to introduce new and promising pharmaceutical products and services and to implement up-to-date business applications. -0,121 0,170
Compared to its competitors our pharmacy simultaneously tries to maintain a narrower but stable product and pharmaceutical service domain while being open to introduce certain novelties on the market.
-0,023 0,817
The products and services offered by our pharmacy are characterised by continuous but moderate changes. 0,089 0,437
Our pharmacy carefully examines, which new products and pharmaceutical services worth to introduce on the market. -0,004 0,973
Compared to its competitors our pharmacy frequently offers products and services newly launched in the drug retail supply system at a lower price. 0,074 0,452
Compared to our competitors our pharmacy offers novelties with higher quality customer care and accompanied by more additional services. -0,183 0,054
Our pharmacy keeps a close eye on and carefully monitors actions taken by competitor pharmacies. -0,089 0,301
Our pharmacy is seldom among the first to introduce new pharmacological products, services and business applications to the market. 0,013 0,882
To maintain and enhance its market position our pharmacy keeps prices lower compared to its competitors. -0,016 0,854
Source: Table made by the author

329
Table CXXIII: Effect of M&S’s SOs’ behavioural characteristics on NP of pharmacies Strategic behavioural characteristics β Sig.
Constant 0,545 Our pharmacy strives to locate a stable market niche by providing conventional pharmaceutical products and services its usual patient segments. -0,002 0,988
Our pharmacy tries to maintain a product and service portfolio, that does not need to be modified frequently. -0,002 0,982
Compared to competitors our pharmacy offers a narrower range of products and services. 0,210 0,055 Our pharmacy attempts to keep and enhance its market position by placing more emphasis on providing higher quality services to patients than its competitors 0,053 0,585
The main focus of our pharmacy is to take advantage of the exploitation of opportunities in existing clients by providing them a relatively limited range of products and services. -0,122 0,211
Our pharmacy pays special attention only to changes in market and regulatory environments directly influencing its operation. 0,056 0,550
Compared to its competitors our pharmacy aims to offer and maintain a narrower range of services of pharmacist’s care. -0,256 0,024
Our pharmacy strives to provide its patients a stable product and service portfolio that does not undergo frequent modifications. -0,026 0,814
Our pharmacy insists on keeping its current product and service portfolio, and to serving its conventional patient segments -0,138 0,162
Our pharmacy seldom takes business risks. 0,172 0,089 Our pharmacy often acts upon the direct pressures of the market and regulatory environments. 0,027 0,758
Our pharmacy can be considered amongst the most innovative enterprises in the sector when it comes to the introduction of new products and pharmaceutical services, and the implementation of business applications supporting better patient care.
0,157 0,219
Compared to our competitors our pharmacy offers a wider variety of pharmaceutical products and services. -0,215 0,089
The composition, breadth and depth of the product and service portfolio offered by our pharmacy undergo periodic changes. 0,054 0,585
We believe that being first to introduce new pharmaceutical products, services and new business applications on the market grants serious competitive advantage in this industry. -0,109 0,309
Our pharmacy reacts quickly to early signals of business opportunities discovered in the changes of market and regulatory environments. 0,171 0,121
It is not uncommon that efforts made by our pharmacy to introduce new products and pharmaceutical services turn out to be unsuccessful and unprofitable -0,159 0,062
Actions taken by our pharmacy often influence the degree of competitive intensity among other pharmacies around us 0,080 0,404
Our pharmacy has competitive advantage in all product and service domains that it offers. 0,266 0,010 In recent years our pharmacy has been attempting to adapt its product and service portfolio to the ever changing needs and preferences of our patients. -0,129 0,159
Our pharmacy is in no rush to introduce new and promising pharmaceutical products and services and to implement up-to-date business applications. -0,205 0,032
Compared to its competitors our pharmacy simultaneously tries to maintain a narrower but stable product and pharmaceutical service domain while being open to introduce certain novelties on the market.
-0,026 0,807
The products and services offered by our pharmacy are characterised by continuous but moderate changes. 0,157 0,204
Our pharmacy carefully examines, which new products and pharmaceutical services worth to introduce on the market. 0,083 0,468
Compared to its competitors our pharmacy frequently offers products and services newly launched in the drug retail supply system at a lower price. -0,060 0,572
Compared to our competitors our pharmacy offers novelties with higher quality customer care and accompanied by more additional services. 0,010 0,922
Our pharmacy keeps a close eye on and carefully monitors actions taken by competitor pharmacies. -0,072 0,435
Our pharmacy is seldom among the first to introduce new pharmacological products, services and business applications to the market. 0,079 0,386
To maintain and enhance its market position our pharmacy keeps prices lower compared to its competitors. 0,070 0,461
Source: Table made by the author

330
49. Figures Figure II: The interrelation of environment and strategy – theoretical integration
Source: Figure made by the author based on Bourgeois (1980a) Figure III: The assumed business performance exhibited by M&S’s SOs
Source: Figure made by the author based on Miles-Snow (1978), Miles et al., (1978) articles
Task (e.g. competitors,
suppliers, customers, regulators, organisation)
General (social, political,
demographic, economic, environmental, legal etc.
trends)
Primary
(selection of product/market
domain)
Secondary (selection of
competitive tools)
ENVIRONMENT STRATEGY
„Domain definition”
„Domain navigation”
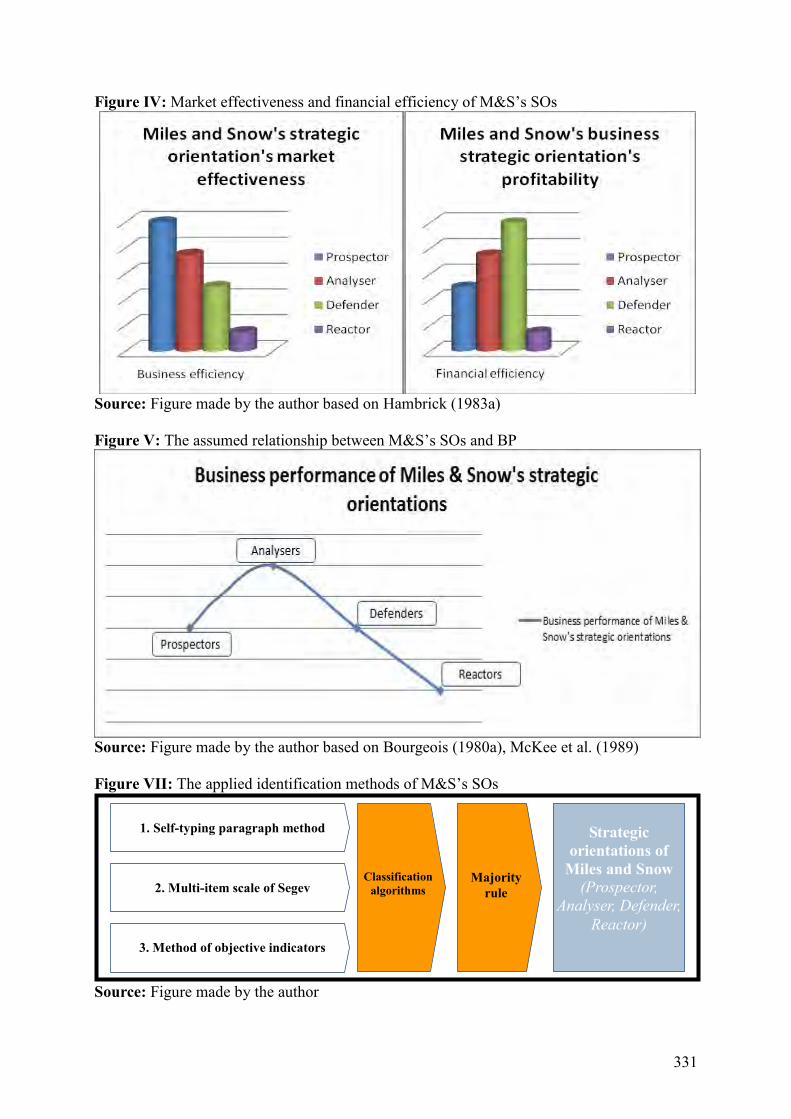
331
Figure IV: Market effectiveness and financial efficiency of M&S’s SOs
Source: Figure made by the author based on Hambrick (1983a) Figure V: The assumed relationship between M&S’s SOs and BP
Source: Figure made by the author based on Bourgeois (1980a), McKee et al. (1989) Figure VII: The applied identification methods of M&S’s SOs
Source: Figure made by the author
1. Self-typing paragraph method
2. Multi-item scale of Segev
3. Method of objective indicators
Strategic
orientations of Miles and Snow
(Prospector, Analyser, Defender,
Reactor)
Classification
algorithms
Majority rule
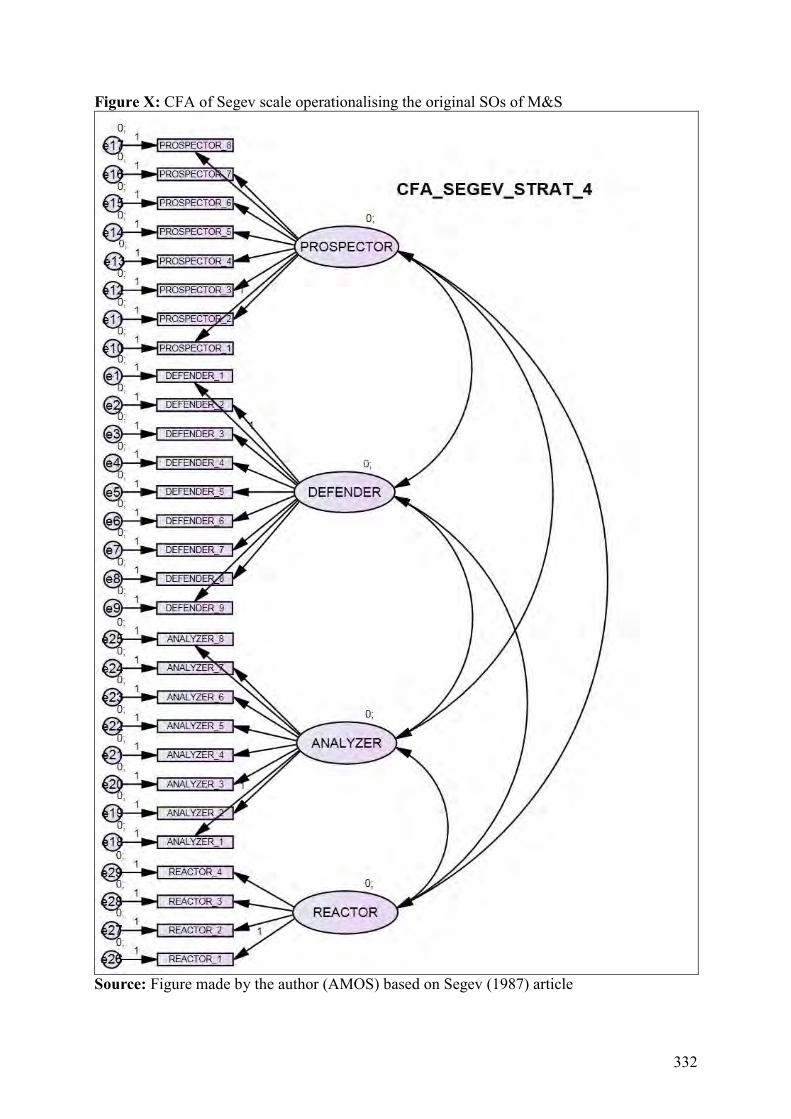
332
Figure X: CFA of Segev scale operationalising the original SOs of M&S
Source: Figure made by the author (AMOS) based on Segev (1987) article

333
Figure XI: The confirmatory factor analysis (CFA) of Segev scale operationalising the industry specific SOs of M&S relevant in HPRDS
Source: Figure made by the author (SEM) based on Segev (1987) article

334
Figure XII: The conformatory factor analysis (CFA) of M&S’s PEU scale
Source: Figure made by the author (AMOS) based on Miles and Snow (1978)

335
Figure XIII: The common single latent factor analysis of M&S’s PEU scale
Source: Figure made by the author (AMOS) based on Miles and Snow (1978)

336
Figure XIV: The common single latent factor analysis of the Segev scale operationalising the original 4 SOs of M&S
Source: Figure made by the author (AMOS) based on Segev (1987)

337
Figure XV: The common single latent factor analysis of the Segev scale operationalising M&S’s SOs by the application of the industry-specific 3 factors solution
Source: Figure made by the author (AMOS) based on Segev (1987)
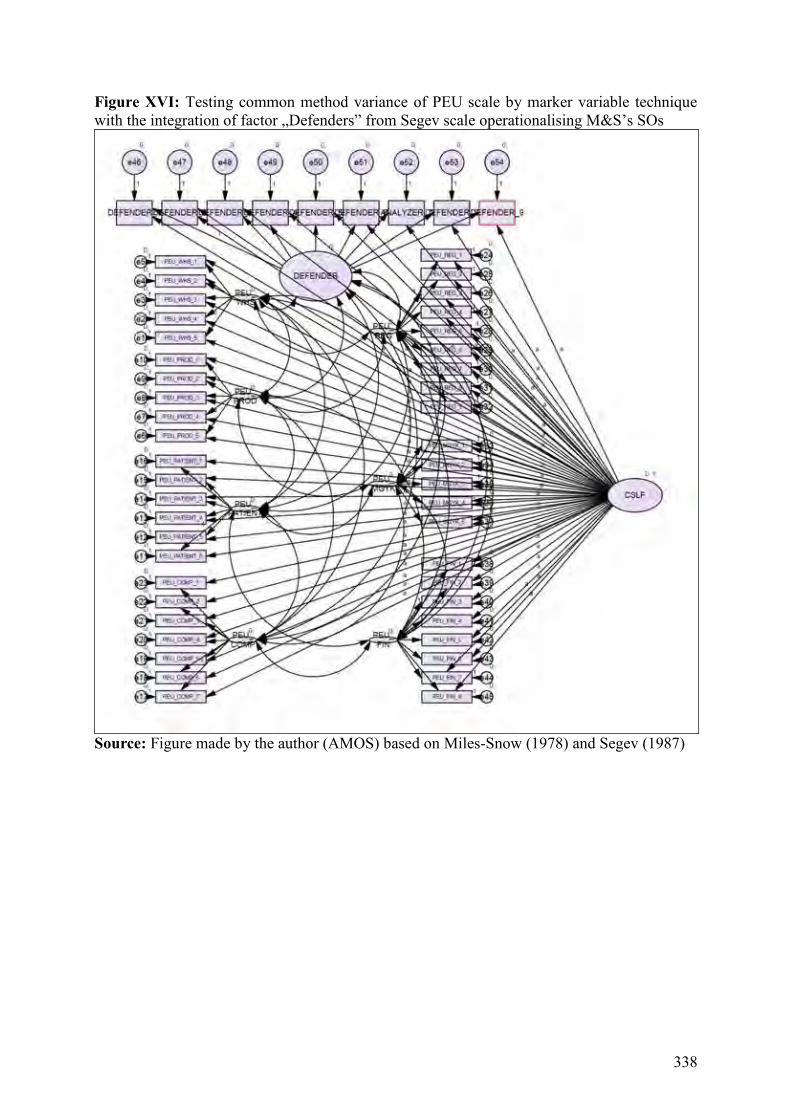
338
Figure XVI: Testing common method variance of PEU scale by marker variable technique with the integration of factor „Defenders” from Segev scale operationalising M&S’s SOs
Source: Figure made by the author (AMOS) based on Miles-Snow (1978) and Segev (1987)

339
Figure XVII: Testing common method variance of Segev scale by marker variable technique with the integration of factor („Regulatory authorities”) from M&S’s PEU scale
Source: Figure made by the author (AMOS) based on Miles-Snow (1978) and Segev (1987)

340
Figure XVIII: The effect of M&S’s SOs on PEU
Source: Figure made by the author (AMOS)
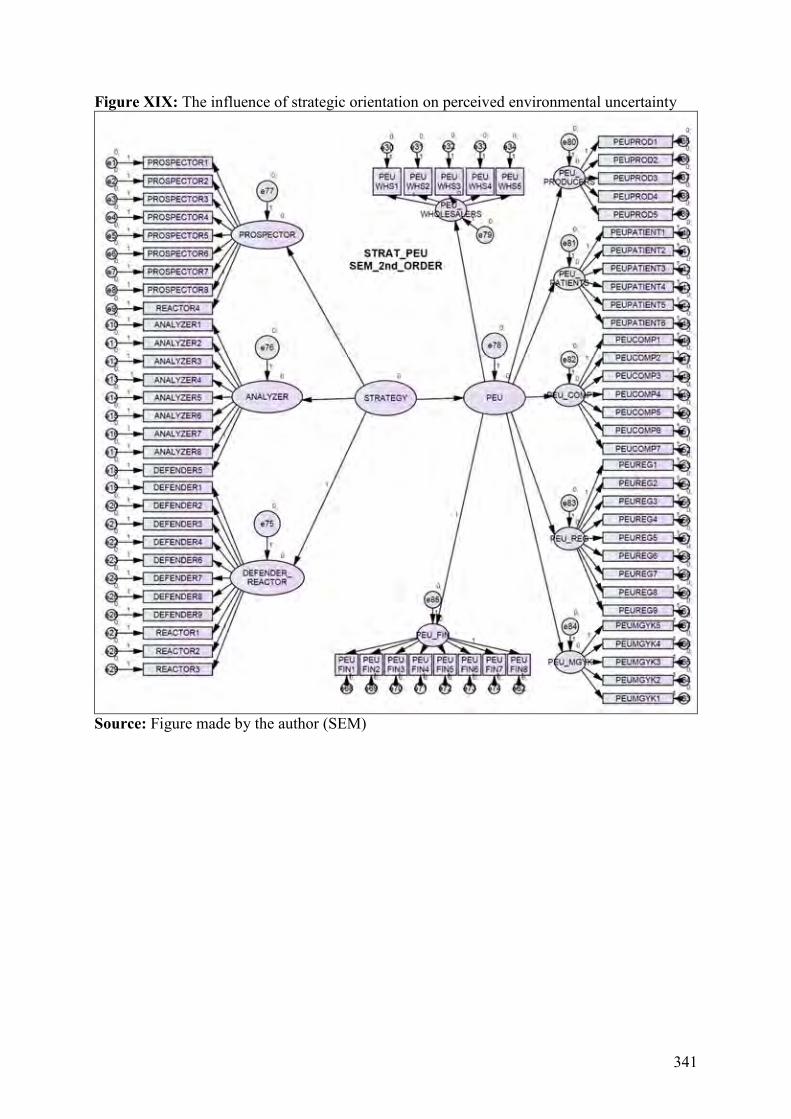
341
Figure XIX: The influence of strategic orientation on perceived environmental uncertainty
Source: Figure made by the author (SEM)
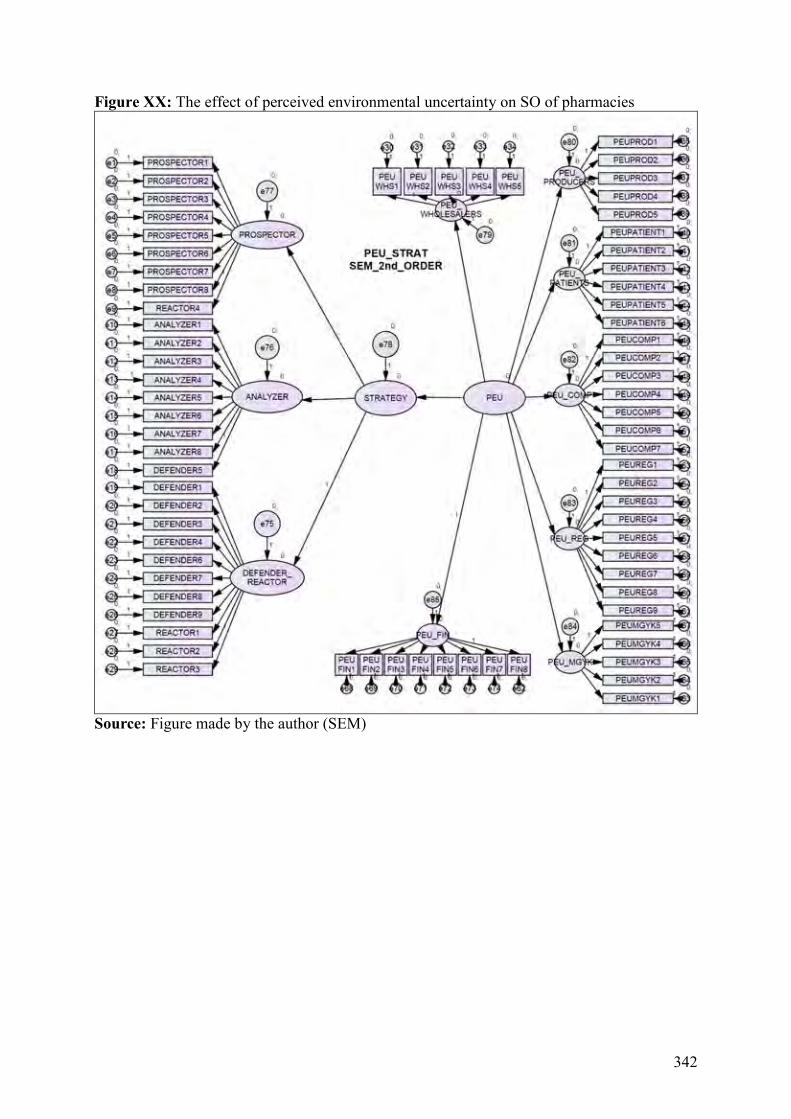
342
Figure XX: The effect of perceived environmental uncertainty on SO of pharmacies
Source: Figure made by the author (SEM)

343
Figure XXI: The effect of M&S’s SOs on the sales of pharmacies
Source: Figure made by the author (AMOS)
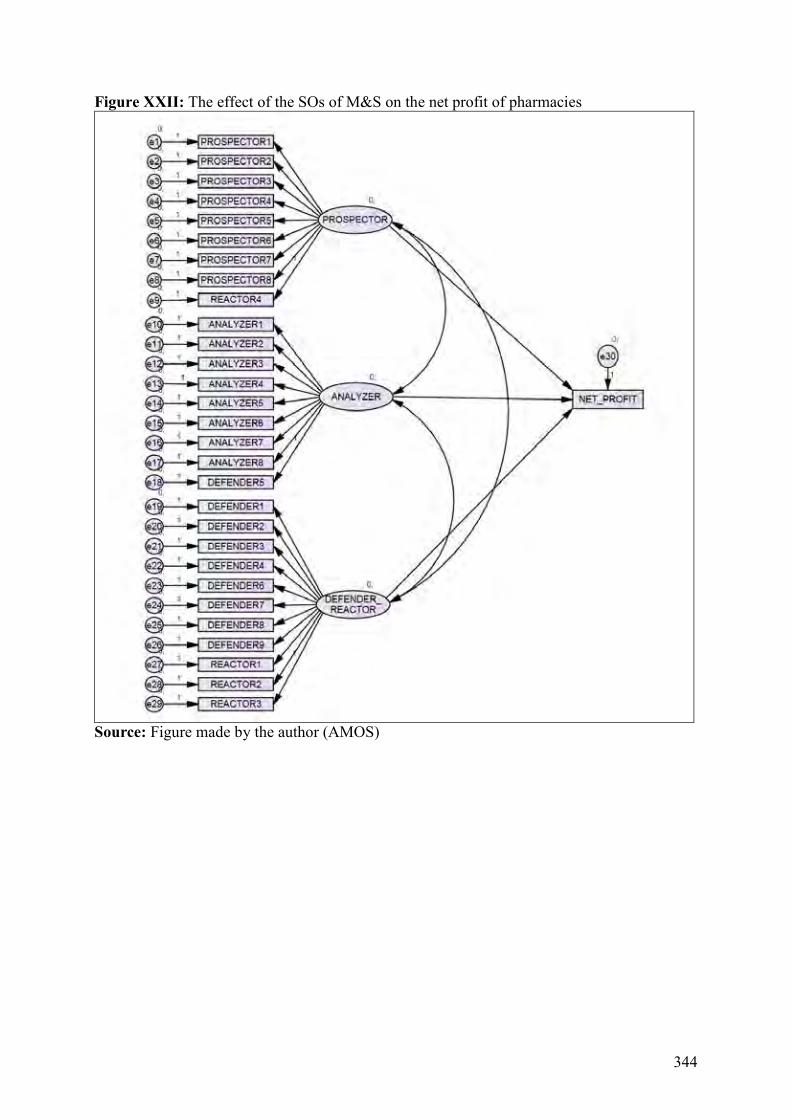
344
Figure XXII: The effect of the SOs of M&S on the net profit of pharmacies
Source: Figure made by the author (AMOS)

345
Figure XXIII: Revealing the moderation effect of PEU by multigroup moderation (sales)
Source: Figure made by the author (AMOS)

346
Figure XXIV.: Revealing the moderation effect of PEU by interaction moderation (sales)
Source: Figure made by the author (SEM)

347
Figure XXV: Revealing the moderation effect of PEU by multigroup moderation (NP)
Source: Figure made by the author (AMOS)

348
Figure XXVI: Revealing the moderation effect of PEU by interaction moderation (NP)
Source: Figure made by the author (AMOS)

349
Figure XXVII: The moderating effect of GL by interaction moderation (sales)
Source: Figure made by the author (AMOS)

350
Figure XXVIII: The moderating effect of GL by multigroup moderation (sales)
Source: Figure made by the author (AMOS)

351
Figure XXIX: The moderating effect of GL by interaction moderation (net profit)
Source: Figure made by the author (SEM)

352
Figure XXX: The moderating effect of GL by multigroup moderation (net profit)
Source: Figure made by the author (AMOS)

353
Figure XXXI: The combined moderating effect of GL and PEU in the relationship of M&S’s strategic orientations and sales
Source: Figure made by the author (AMOS)
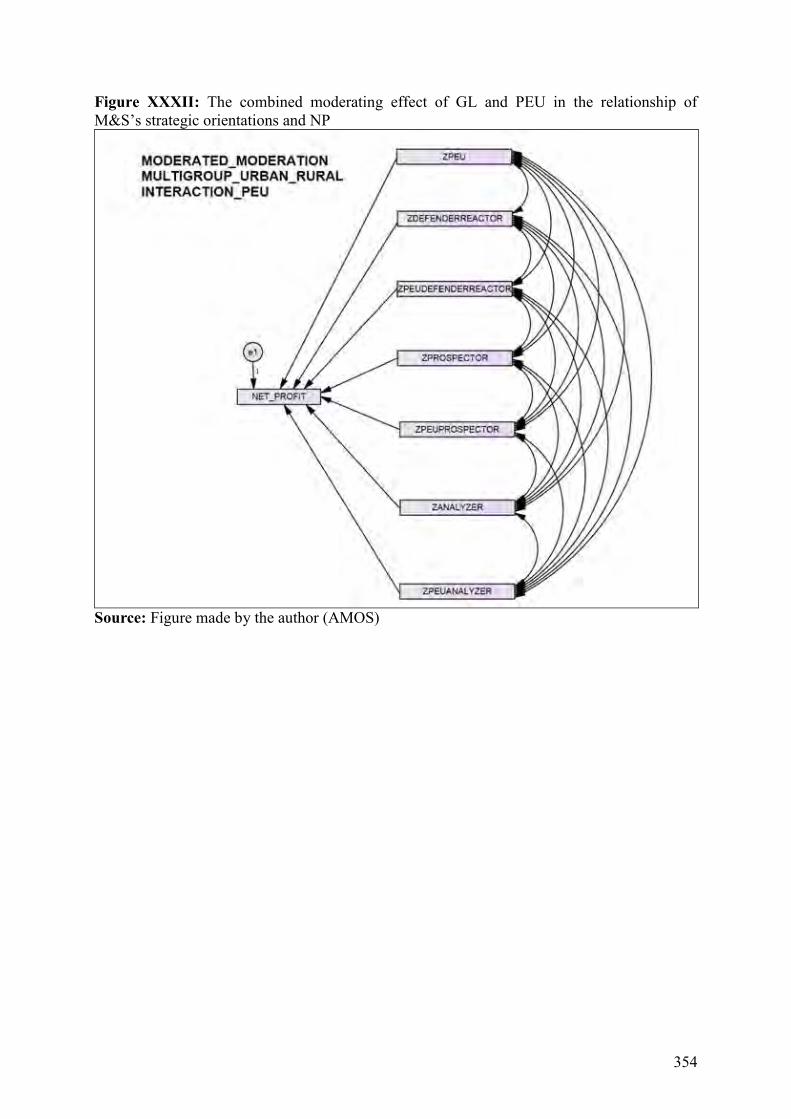
354
Figure XXXII: The combined moderating effect of GL and PEU in the relationship of M&S’s strategic orientations and NP
Source: Figure made by the author (AMOS)
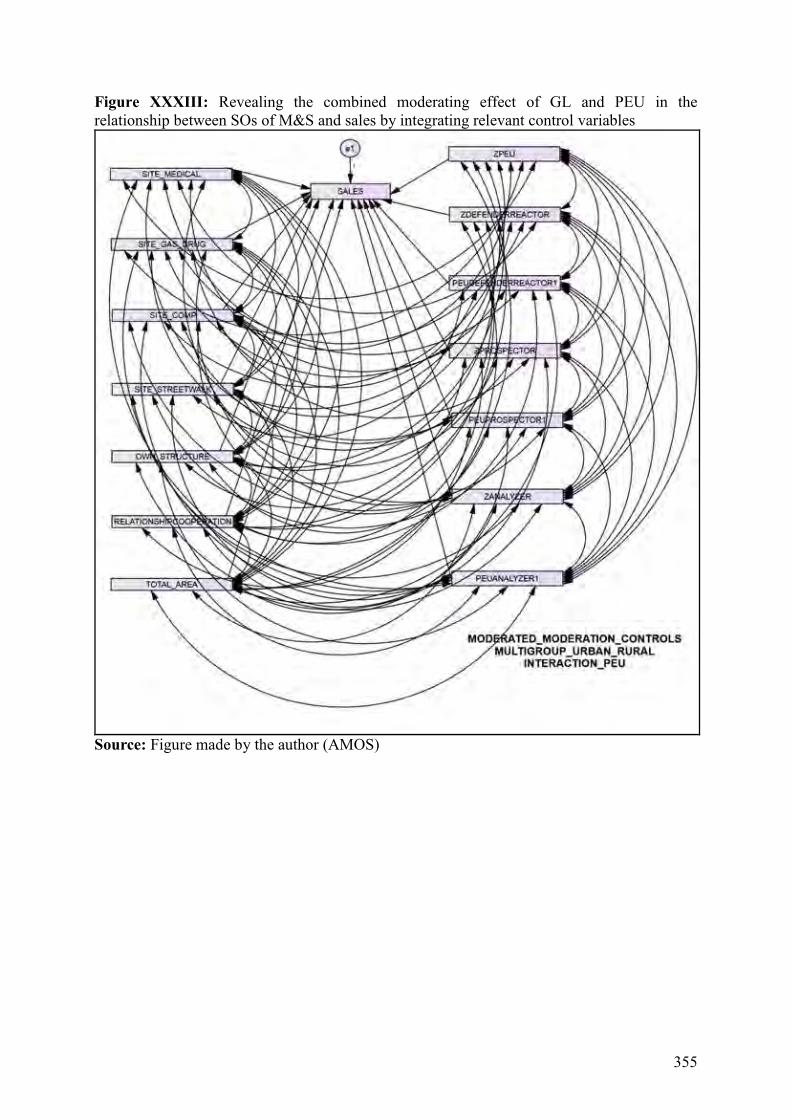
355
Figure XXXIII: Revealing the combined moderating effect of GL and PEU in the relationship between SOs of M&S and sales by integrating relevant control variables
Source: Figure made by the author (AMOS)

356
Figure XXXIV: Revealing the combined moderating effect of GL and PEU in the relationship between SOs of M&S and net profit by integrating relevant control variables
Source: Figure made by the author (AMOS)

357
50. Publications of the author in the topic of the doctoral dissertation Articles published in Hungarian language journals
1. Csepeti Ádám (2014a), A gyógyszertárak gazdálkodásáról – I. rész, Gyógyszerészi
Hírlap, XXV. Évf., 1. Szám, 16-19. old.
2. Csepeti Ádám (2014b), A gyógyszertárak gazdálkodásáról – II. rész, Gyógyszerészi Hírlap, XXV. Évf., 2. Szám, 12-16. old.
3. Csepeti Ádám (2012), A Miles és Snow-féle stratégiai tipológia
teljesítményvonatkozásai, Marketing és Menedzsment, XLVI. Évf., 3. Szám, 3-21. old.
4. Csepeti Ádám (2011), A Miles és Snow-féle stratégiai tipológia teljesítményvonatkozásai, Gazdaság és Társadalom, Különszám, 2011. Március, 140-168. old.
5. Csepeti Ádám (2010), A Miles és Snow-féle stratégiai tipológia kutatási kérdései,
Vezetéstudomány, XLI. Évf., 11. Szám, November, 15-30 old. Articles and presentations published in international conferences
1. Strategic Behaviour in the Hungarian Pharmacy Market – Testing the Applicability of the Miles and Snow Strategic Typology in Regulated Industrial Environment, European Marketing Academy (EMAC), Regional Conference, Belgrade, 2012
2. Strategic Orientation and Performance Implications in the Hungarian drug retail
sector, European Institute for Advanced Studies in Management, EDEN Doctoral Seminar on Dissertation Writing, ISM University, Vilnius, 2011
3. Research Approaches of the Miles and Snow strategic typology, 6th. International
Conference of Young Researchers, University of Szent István, Gödöllő, 2010 Articles and presentations published in Hungarian conferences
1. Stratégiai magatartás a magyarországi gyógyszertárpiacon, Magyar Marketing Szövetség, Marketing Oktatók Klubja 17. országos konferenciája, Pécsi Tudomány Egyetem, Közgazdaságtudományi Kar, Pécs, 2011
2. A Miles és Snow-féle stratégiai tipológia kutatási kérdései, Marketing Oktatók Klubja
16. országos konferenciája, Budapesti Kommunikációs és Üzleti Főiskola, Budapest, 2010
3. A Miles és Snow-féle stratégiai alkalmazkodási tipológia teljesítményvonatkozásai,
Hitel, Világ, Stádium Konferencia, Nyugat-Magyarországi Egyetem, Közgazdaságtudományi Kar, Sopron, 2010