AD-A234 858 - apps.dtic.mil · field cotiveipeitce il fihe tire,'t onj electron teitifetai li'...
24
AD-A234 858 . r DOCUMENTATION PAGE: ForAppoved la. REi-ON SECURIily CLA 61HCArI IN lb I.7,lIIL7lVL MAIRKIN6S .1a. S umiry CLA 51FICAiION A1.11HOiilY J Di TMUfUION/AVAILAIIlY Or iLUPOill Approved for public release; Distribution . 1 1). UkCLA',, fitCA rUN, UUWN(-,i,\INc SILOULE unl.imnited 4I lt iMINU lQiWlANi/AHlON IH1.11T NUM1.HMS) '3 MONIIUIIINQ QMUANIZATION tit-TioT NUMULkW.) PL-TR-91-2066 a~ . NAM E OF PE FO M IN G O RGANI. .ATIO N b OFFICE SYM O L 7a. NAM E OF M N I O N G U G N"D Phillips Lab, Geophysics (If ilpplicabh) Directorate I LIS (iy tti - h( AOURii.S (City. St~ate, 1i'1J IW'COde) 1b. AL)URLS' Ct rw, ~i .E LECT E Hatiscom AF11 Massachusetts 017-11-5000AP 10 91 It~t NAME OF l UNQING /iaO(.N1.O~iNG 1 , OFfICL SYMIuUL 9j PI<CfL~kIEMNr INsmrumE 1IICAi 0 MIlL N ORCANIZATION I (if aipplicable) r~ lk. AD01MV; (Cafy, 5ldtV.,J#dli /If'COUdt) 10 Stu JICI. U FUNUING NUNiIRS 'l-IJiAM PlUilj. I I SK. 'Na.N1r iNI11 rLErMf NT NO, NO NO ACCSSION NO. 61102 F 2310 G9 03 it. ri lEE (In~cludue Us.curit ClidUifcarorlJ The ElectrodynamfiC, Thermal, and Energetic Character of Intense Sun-Aligned Arcs in the Polar Cln, C.E Vjlladares*, ll.C. Carlson, Jr. I~a. tYPEL Of itI('Ut0 1 jb Il~I t.~ LJLIEL) Idl. A)I 0 ul.'Oiif (Year, Month, V.Iy) 1lS. PAU: COUNI Reprint IRO _____ 1 1991 April 2 I 22 lb.SU'FEMNFAIYNOAION *Lfstitute for Space Research,Boston College, Newton Center,MA- Reprinted from Journal of Geophysical Research, Vol. 96, No. A2, pages 1379-1400, Februairy 1, 1991 I/. ~ ~ ~ ~ ~ ~ ~ ~ ~ 1W Cuf it I(e TOl41jit SREFI.' (ar Y 'Ina Alkntly by hloti nurnbel) fit LU GioUi' lujclo ltu-lint"ri41 rf~~y tmics, Thermal balance 2- 19 ASIAC oii reverie' it necesity and idcntifY block nlumbeitr) The ekectrolyriiiitic, thermial, aindenergetic ch.,acitertir sile c'in-atigned arcs in thc potar catpcan be moaitittingiiiy diaimitod by til inicoltie cat Ir rauiiar provyided it .%uitidil obsierviiip sclii ik a %~~~~leed. Wec report ttcrv such mteiIsurctileniti or two imeIow', Stitil~ignedt arcs. The two itrc% %e~tc itltlugllled till Iwo diflereit illt.4 tif-tchruiry 21, anld Mat ch 1. 190) U%itlg the Siuidre Stromurjurd tattar IN It iIlId-Itt10tlt dil~r.,It%tiC. Rcett Ic gN0tltt!III e 11 l I iC 10idit %tiscait .1a(irl-r 10 1 Ii lit 10 k ni) 1.illi, 0.aittde ph tiiTsi.R~'~V ~t~~iFti 1 ; Ottt crtli rC',, tvtlttll::ure%. iaiid tn-rs,-ve'hciti,ian rojected ~ ~nc ii mp% of dierivt-d electric fields, t'Cd'rsct ii n I taill cootlitt Cii L . il, ht izhont tt anl 1 CII ld.igned currenti, joule lirating titiv, toiit t'tiytig fl tux. W1* ci,.nfittn, rr I he fir~t time with couintw tiu lile area tn1,ps, that tilt tire.% have Ithe anh ~tiited simtple fire cI ltiirtyntlih q . Ttiml is, tfile Vis. i anid etltlinced iolnization sie~niurvs oi* the an: rcde pititt LIecd by incoin litl' iII tic lectrons 11111% Ci ! fi r lei ti oilillt C1i ire it 1tonl the ceetric field cotiveipeitce il fihe tire,'t onj electron teitifetai li' vntumtevittienit ( s'.WiU K) tire lbund tu e xpectedt with th 4110C shee iontizing iitivle tlrecitiittlio aliwn to dik tIletell tihe 10. DISTRIIITtION/AVAILAII11Y OF At) I ACT 2,AIIIALt SECUITY CI.ASIATION 0 UNCLA~riiltou NLMPED K-1 SAME AS RPT, 3 C COUS tS Uclassified 11ai NAIME t. i Il_. NOIIDA II ONE (tnludi Area Iv~J'L 1fiCE SYMIJUL lI.C. Cairnort) .177-2-2 6 1 00l'ofrI 141/J, JUN 116 I'rotoul IiLitiafit ilk uet'i. %~1m1 C ! tASir.IlTIO VrT~l CG BEST AVAILABLE COPY
Transcript of AD-A234 858 - apps.dtic.mil · field cotiveipeitce il fihe tire,'t onj electron teitifetai li'...

AD-A234 858 .
r DOCUMENTATION PAGE: ForAppoved
la. REi-ON SECURIily CLA 61HCArI IN lb I.7,lIIL7lVL MAIRKIN6S
.1a. S umiry CLA 51FICAiION A1.11HOiilY J Di TMUfUION/AVAILAIIlY Or iLUPOillApproved for public release; Distribution
.11). UkCLA',, fitCA rUN, UUWN(-,i,\INc SILOULE unl.imnited
4I lt iMINU lQiWlANi/AHlON IH1.11T NUM1.HMS) '3 MONIIUIIINQ QMUANIZATION tit-TioT NUMULkW.)
PL-TR-91-2066
a~ . NAM E OF PE FO M IN G O RGANI. .ATIO N b OFFICE SYM O L 7a. NAM E OF M N I O N G U G N"DPhillips Lab, Geophysics (If ilpplicabh)
Directorate I LIS (iy tti -h( AOURii.S (City. St~ate, 1i'1J IW'COde) 1b. AL)URLS' Ct rw, ~i .E LECT EHatiscom AF11
Massachusetts 017-11-5000AP 10 91
It~t NAME OF l UNQING /iaO(.N1.O~iNG 1 , OFfICL SYMIuUL 9j PI<CfL~kIEMNr INsmrumE 1IICAi 0 MIlL NORCANIZATION I (if aipplicable) r~
lk. AD01MV; (Cafy, 5ldtV.,J#dli /If'COUdt) 10 Stu JICI. U FUNUING NUNiIRS'l-IJiAM PlUilj. I I SK. 'Na.N1r iNI11rLErMf NT NO, NO NO ACCSSION NO.
61102 F 2310 G9 03it. ri lEE (In~cludue Us.curit ClidUifcarorlJThe ElectrodynamfiC, Thermal, and Energetic Character of Intense Sun-Aligned Arcs inthe Polar Cln,
C.E Vjlladares*, ll.C. Carlson, Jr.I~a. tYPEL Of itI('Ut0 1 jb Il~I t.~ LJLIEL) Idl. A)I 0 ul.'Oiif (Year, Month, V.Iy) 1lS. PAU: COUNIReprint IRO _____ 1 1991 April 2 I 22
lb.SU'FEMNFAIYNOAION *Lfstitute for Space Research,Boston College, Newton Center,MA-Reprinted from Journal of Geophysical Research, Vol. 96, No. A2, pages 1379-1400,Februairy 1, 1991I/. ~ ~ ~ ~ ~ ~ ~ ~ ~ 1W Cuf it I(e TOl41jit SREFI.' (ar Y 'Ina Alkntly by hloti nurnbel)
fit LU GioUi' lujclo ltu-lint"ri41 rf~~y tmics, Thermal balance 2-
19 ASIAC oii reverie' it necesity and idcntifY block nlumbeitr)
The ekectrolyriiiitic, thermial, aindenergetic ch.,acitertir sile c'in-atigned arcs in thc potar catpcanbe moaitittingiiiy diaimitod by til inicoltie cat Ir rauiiar provyided it .%uitidil obsierviiip sclii ik
a %~~~~leed. Wec report ttcrv such mteiIsurctileniti or two imeIow', Stitil~ignedt arcs. The two itrc% %e~tcitltlugllled till Iwo diflereit illt.4 tif-tchruiry 21, anld Mat ch 1. 190) U%itlg the Siuidre Stromurjurd tattar
IN It iIlId-Itt10tlt dil~r.,It%tiC. Rcett Ic gN0tltt!III e 11 l I iC 10idit %tiscait .1a(irl-r 10 1 Ii lit 10 k ni)1.illi, 0.aittde ph tiiTsi.R~'~V ~t~~iFti 1 ; Ottt crtli rC',, tvtlttll::ure%. iaiid
tn-rs,-ve'hciti,ian rojected ~ ~nc ii mp% of dierivt-d electric fields, t'Cd'rsct ii n I taillcoot litt Cii L . il, ht izhont tt anl 1 CII ld.igned currenti, joule lirating titiv, toiitt'tiytig fl tux. W1* ci,.nfittn, rr I he fir~t time with couintw tiu lile area tn1,ps, that tilt tire.% haveIthe anh ~tiited simtple fire cI ltiirtyntlih q . Ttiml is, tfile Vis. i anid etltlinced iolnization sie~niurvs oi*the an: rcde pititt LIecd by incoin litl' iII tic lectrons 11111% Ci ! fi r lei ti oilillt C1i ire it 1tonl the ceetricfield cotiveipeitce il fihe tire,'t onj electron teitifetai li' vntumtevittienit ( s'.WiU K) tire lbund tue xpectedt with th 4110C shee iontizing iitivle tlrecitiittlio aliwn to dik tIletell tihe
10. DISTRIIITtION/AVAILAII11Y OF At) I ACT 2,AIIIALt SECUITY CI.ASIATION0 UNCLA~riiltou NLMPED K-1 SAME AS RPT, 3 C COUS tS Uclassified
11ai NAIME t. i Il_. NOIIDA II ONE (tnludi Area Iv~J'L 1fiCE SYMIJULlI.C. Cairnort) .177-2-2 6 100l'ofrI 141/J, JUN 116 I'rotoul IiLitiafit ilk uet'i. %~1m1 C ! tASir.IlTIO VrT~l CG
BESTAVAILABLE COPY

Cont of Block 19:
~inosanwait. plasmna flow of orcier I km 'i - a cross oi der ILK) kill, cot respondl to peak elccron densitic-iof ohltel I U c II I , douwn to altituide'.i i low .s 120 t,. IIand npV. id crrrcrtt of or der I jsA i it -. 'I ficsdOtta iii so lead to jrrmpo)r alit imp! Led! ons for tile pr it' pola cap arcs. 1 he IIIY h-ye IoUit y( diii 15111 ward flow oil tilie dawnit ed (ge 0 (itth arc Iihjijk like !oCaio)1 of' S1101 I-f~ ersi IC lt J 00 (Chk:iir driven by (fowrrwir (oynting, flux. '(heit is aI citi! of stirrhA cnliiniccd ton tiilineatILI(wel iahove t he C leciron tillinpiclature) .%lng the (righ -veloc ity Ckd}!e oitl MiC, L4udIItt 1iv elY COIAIrIleabr ir y tolln ' iii.. ll ii c atinig ls tile sirunyj CIeCtl t% field trgs IC jOhs tfri t'0i1 tirle t ;JCU a s ~. 'I Ik1C)d%itlui111 IW ilt M110aifrslicti: of the nc( eiCioririiicj. r~. u'Ci! CXCCLedS lit(.inel p l.e
enry ~p0%Ied~ by tbCiei I1g Cener ic C)OI' fl~r~ritux. I !kt hcatlkrlig is 1t %sIibt.IrIIai! Nouie of hc~klInto lit! rnrlir thrnrrOsphere. As ertirriaic by Ireat lilt il thons, liv.ti Inst by lihe ion" t ti lre ncutris',or ei-)rgy iai labI el i I It Ire Poy I( It aI erie I gtCI cIe I It, I I, I (I u. se c I*. Ie I P CI'., -I aire de-posi tedlIli 0hAMIr ie- Of orde IOU kilt 1o1 good I,.1 2nWrS 01' MI hour in tlneSe- a~c%: tis' conrtriutes ILI res(IIolvtile pr ollmca 01f tire 'its rip polartre iis ophe re heat( source. I-illy I iarc~tsoi cihy silt p et~Cse ( C-c oniitc nI acue , ti anrd errrnpr etn.k i vrcCU10 01'f SUI tror f a!e inftense Sun-ailigned acs I
lilser(ti rrrUdrrrg the elk:LirudyiiuiiIiC, filet 111,1!. AM[ rl c Ir-ic char :rtcr.
Accesiori For
NTIS CRA&M
nh d
Z'igzal. loontains 001i~r
ffl ~~~f Or3 Will b L 1m "auk ~~

PL-TR-91-2066
JOURNAL OF GEOPHYSICAL RESEARCH. VOL. 96. NO. A2. PAGES 1379-1400. FEBRUARY I. 1991
The Electrodynamic, Thermal, and Energetic Characterof Intense Sun-Aligned Arcs in the Polar Cap
C. E. VALLADARES
Instiine.for Space Research. Boston College, Newton Center, Massa('hu.setts
H. C. CARLSON, JR.
Geophysics Laboratory, Hanscon Air Force Base. Massachusetts
The electrodynamic. thermal, and energetic character of stable Sun-aligned arcs in the polar cap canbe meaningfully diagnosed by an incoherent scatter radar, provided a suitable observing scheme isselected. We report here such measurements of two intense Sun-aligned arcs. The two arcs werediagnosed on two different nights (February 26 and March I, 1987) using the Sondre Stromfiord radaras a stand-alone diagnostic. Repeatable patterns are found in mesoscale area (order 103 km by 103 ki)maps of altitude profiles for observed electron and ion gas number densities, temperatures, andlint-of-;igb, velncives -,- ,--jTed mesoscale area maps of derived electric fields, Pedersen and Hallconductivities (Ne, T,, Ti, V. E. 1. , YH), horizontal and field-aligned currents, joule heating rate, andPoynting flux. We confirm, for the first time with continuous mesoscale area maps. that the arcs havethe anticipated simple arc electrodynamics. That is, the visual and enhanced ionization signatures -fthe arc are produced by incoming energetic electrons carrying the outgoing current from the ciectricfield convergence in the arc. Strong electron temperature enhancements C>2000 K) are found asexpected within the sheets of ionizing particle precipitation. Dawn to dusk decreases in theantisunward plasma flow of order I km s- 1 across order 100 km, correspond to peak electron densitiesof order 10' cm- 3 down to altitudes as low as 120 km. and upward currents of order I A±A m -2 .Thesedata also lead to important implications for the physics of polar cap arcs. The high-velocity(artisunward flow on the dawnside) edge of the arc marks the location of strong persistent Jouleheating driven by downward Poynting flux. There is a channel of strongly enhanced ion temperature(well above the electron temperature) along the high-velocity edge of the arc, quantitatixly accountedfor by ion frictional heating as the strong electric field drags the ions through the neutral gas. Thedeposition rate into the atmosphere of the net electromagnetic energy well exceeds the net particleenergy deposited by the ionizing energetic electron flux. This heating is a substantial source of heatinto the polar thermosphere. As estimated by heat into the ions, heat lost by the ions to the neutrals.or energy available from the Poynting and energetic particle flux. several ergs cm -2 s -I are depositedin channels of order 100 km for good fractions of an hour in these arcs: this contributes to resolvingthe problem of the missing polar thermosphere heat source. Finally, a reasonably simple yetself-consistent, accurate, and comprehensive representation of stable intense Sun-aligned arcs ispresented, including the electrodynamic. thermal, and energetic character.
I. INTRODUCTION polar arcs are usually produced by soft (<I keV) electronsand to characterize the different types, locations and shapes
Morphological studies of intense polar cap aurora began of intense polar cap auroras.during the International Geophysical Year (IGY). Measure- Statistical and case studies of auroras and particle precip-ments performed during this year at Antartica [Weill. 1958; itation in the polar cap indicated that intense polar capDenholtim and Bond, 19611 and at Resolute Bay, Canada auroras preferentially occur in the morning sector IGussen-[Davis. 19601 found intense polar cap arcs oriented in the hoven, 1982]. The average energy of intense electron precip-Sun-Earth direction. Later. a scanning photometer on board itation in the polar cap was found to be between 50 and 300ISIS 2 [Berkey et al.. 1976: Istnail et al.. 19771 and all-sky eV [Hardy, 19841. Burke et al. (1982] inferred that intensecameras in Greenland [Lassen and Danilsen, 1919] re- polar .-ap arc.i are the cptical signature of upward; Birktcandvealed that the occurrence of intense polar arcs throughout currents associated with corresponding velocity gradients.the polar cap correlates well with northward interplanetary The DE I spacecraft provided images of intense Sun-magnetic field (IMF). aligned arcs extending across the polar cap. The transpolar
New initiatives to observe the intense Sun-Earth aligned auroras together with the auroral oval resembled the Greekarcs involved airborne observatories [Romtick and Brown, letter theta [Frank et al.. 1982. 19861. The salient features of1971 : Eather and Akasfui. 19691 and also particle and optical this striking auroral pattern are the presence of precipitatingemission detectors on Defense Meteorological Satellite Pro- ions accompanying the energetic electrons (>1 keV), itsgram 'DMSP) satellites [Aleng and Akasol'it. 1976: Akas.qii. location in a region of sunward convection, and the possible19761. The new instrumentation served to indicate that the exiscace aI* four cells of plasma convection. Burke et al.
119791 have also presented data suggesting four convectingCopyright 1991 by the American Geophysical Union. cells. A valuable description of the convection for different
Paper number ,0JA0I76i. values of the three components of the IMF has been pre-014X-0227 91V9(A-0l7t5tt.() sented by R'ifl and Run h 119851. Their analysis implies a

1380 VALLADARES AND CARLSON: POLAR ARC ELECTRODYNAMICS/ENERGETICS
four-cell convection pattern for strong northward IMF and a measurement statistics on derived parameters. The arc ofthree-cell convection for smaller positive values of B:. February 26 was transpolar as observed by the DMSP/F6
There is a general consensus that some of the intense polar satellite [Niciejewski et al., 19891. This stable arc had ancap Sun-aligned (S-A) arcs are formed in a region of closed electron density above l05 cm - 3 in the E region. On Marchfield lines [Akasofu et al.. 1984: Frank et al., 1986] with I, 1987 we observed three polar cap arcs. Two of them wereprecipitating electrons having the characteristics of plasma Sun-aligned and the other hook-shaped. The two Sun-sheet or plasma sheet boundary layer electrons [Pei erson aligned arcs were initially separated by 80 km with peakand Shelley, 1984; Obara etal., 1988]. Kan and Burke [1985] densities located at substantially different altitudes. Theyhave argued that the less intense polar arcs possibly occur on subsequently merged into a single broad arc. We discuss theopen field lines. Other high-latitude arcs may well corre- properties of Sun-aligned arcs for these two nights to dem-spond to a poleward widened auroral oval [Meng, 1981; onstrate repeatability of some basic characteristics.Murphree et al., 1982]. Data presented by Huang et al. In section 2 we identify a data-taking mode designed for[1987] collected by ISEE I during excursions in the magne- such studies, and present Sun-aligned arc parameters di-totail suggest filaments of plasma sheet plasma extend into rectly observable by this technique. In section 3 -1e eAtendthe lobes. Even though the filaments have been observed for analysis of the I SR data to present important derived param-any orientation of B:, their presence reflects the discrete eters. In section 4 we discuss the implications of thesenature of the plasma source and suggests a causal link measurements, develop their interpretation, and identifybetween the IMF and the formation of the polar cap arcs. their significance to understanding of the electrodynamics,
With the advent of intensified imaging photometers, much thermal character, and energetics of the arcs. Finally. inmore common weak stable Sun-aligned arcs were found in section 5 we summarize the main conclusions from thisthe polar cap [Weber and Buchau, 19811. The Sondrestrom st~idy.incoherent scatter radar was also used to study the morphol-ogy of these weak S-A arcs. Carlson et al. [1984] determined 2. DATA-OBSERVING MODE AND DIRECTsheared (antisunward to sunward reversal) flow which wascoincident with bottomside F region density enhancementsand with optical emissions, both produced by the precipitat- The Sondre Stromfjord incoherent scatter radaring particles. The plasma velocity gradients coincided with a (66.987'N. 50.949'W. 74' Invariant Latitvde). is situated 103simple arc electrodynamics interpretation. Robinson et a,. mikLs (160 km) inland from the west coast of Greenland. Its[1987] obtained the field-aligned currents for a Sun-aligned location at a very high magnetic latitude makes this stationarc observed near local midnight and merging into the capable of probing the nighttime polar cap and examining theauroral oval. Their measurements implied an upward current dynamics of polar Sun-aligned arcs [Carlson et al.. 1984:on the western edge of the arc and a downward current on Robinson et al., 1987: Mende et al.. 1988].the eastern side. Mende et al. [1988] have also presented While it is difficult, if not impossible. to recognize Sun-measurements from Sondrestrom. Their observations of aligned arcs with conventional ISR observing modes iH themultiple polar cap arcs showed a preferential antisunward absence of coincident optical imaging data, it is possible toflow within the arcs. design a radar mode that can unambiguously recognize
Carlson et al. [1988] have presented convection patterns them. We describe the design here, illustrated in Figure I.representing northward B. conditions which were obtained The design is based on what we know of their morphologyby combining the optical emissions associated with S-A arcs from optical imagery. The essence of the design is simple.and the one-dimensional velocity measurements of DE 2. One wants to map the electron density profile and velocityThese quantitatively confirm electron impact production of field over an area, with the area large compared to the arc.the arc, and local simple electrodynamics for the arc. Weber and with time resolution short compared to the time for theet al. [19891 used data from a rocket that traversed a polar arc to pass through the ISR field of view. Signal to noisecap arc to model the circuit parameters of the arc. They also considerations determine look elevation and area of cover-showed enhanced electron temperature variation across the age. and limit azimuth scan rates and cycle time resolution.arc. Variability in the motion and lifetime of S-A arcs IWeber
The purpose of this paper is to examine more comprehen- et al., 19891 also imposes some restrictions. For this reasonsive diagnostics and analysis of the electrodynamics, the we implemented the azimuthal sweeps (AZ) at two differentenergy, and the thermal properties of a few Sun-aligned arcs speeds. One AZ scan was performed at a rapid scanningwhic!, w:."," torated in the polar cap. The data are more velocity, with the purpose of obtaining a snapshot of'thecomprehensive by virtue of time continuous measurement, electron density inside fast moving arcs. Two slow AZ scansover a wide spatial area, of a significantly more complete s,: -wept 900 in 2 min. probing slower moving arcs and provid-of geophysical parameters. The arcs to be described in this ing the line o) sight (LOS) . _loc;,y and the number densitywork were probed with the Sondrestrom radar on the with smaller error bars. Good horizontal transarc spatialevenings of February 26 and March 1, 1987. The common resolution was also achieved (15 km at 150 km of altitudesignature J these arcs consists in that they were produced when pointed across the arc. and ul!imalelv !irnited to th,-by electrons with energies larger than Ike v, as dedu cd 2._-kni radar beam width smeared over the integration timefrom the altitude of significant E region ionization. Although when pointed along the arc). These measurements werewe diagnosed over 30 stable Sun-aligned arcs, using all-sky complemented with an elevation (EL) scan (perpendicular toimaging photometers (ASIPs) and/or the incoherent scatter the anticipated arc direction) that gives the dependence ofradar tISR) during this campaign, here we will concentrate the geophysical parameters on altitude and distance acrosson only two of these arcs. The arcs we concentrate on are the arc. The scan sequence (show'n in the bottom panel ofthe two most intense, for optimum signal to noise ratio or Figure 11 was slow AZ-fast A/-slow AZ-EL. I-or the data

VALLADARFS AND CARLSON: POLAR ARC ELECTRODYNAMICs/ENERGETICS 1381
87/02/26 z.z4or. - z.5o4 SONDRESTROM( I I I
I KM/S
400
3200-
r
10D0
3 1S600 600 400 3Do 20 100 a
SCAN DISTANCE tKM)
4 5 Fig. 2a. Number density contours and line of sight (LOS)1 velocity measured by the Sondrestrom radar on February 26, 1987
and during the time interval from 0224 to 0226. The azimuth waskept fixed at 231V and the elevation varied from 250 to 60*. The initialdensity contour corresponds to 0.4 x 105 cm - 3.and consecutivecontours increase linearly in steps of 0.4 x l05 cm - 3 . The LOS
2 velocity was scaled in order to represent a velocity equal to 1 kms-I as a segment 100 km long. The dashed line vectors indicate LOS
Fig. 1. Schematic representation of the volume scanned by the velocities directed toward the radar, and the double line vectorsSondrestrom radar during the EL and AZ sweeps of February 26, characterize plasma motion away from the radar.1987. The bottom panel shows the sequence followed by theantenna. The initial azimuth was selected in order to align node 3with the Sun-Earth direction.
presented here, one complete cycle was performed in 8 min 4to87/02/26 z.zr,zs - 2,2,z4 SONORESTROMand 40 s. Figures 2a-2h present the data corresponding to ' sI I
two consecutive cycles of this antenna pattern. I KM/S
We will also show data from two other observing modes.One. tailored to a specific need, looked directly up themagnetic fieid line so as to give true instantaneous altitudeprofiles within a Sun-aligned arc. Such time continuous bjobservations during the full passage of an overhead arc thusallow detailed diagnosis of the properties of a transverse wsection of an arc. These observations are presented in Plates 0
ia and lb.The third data set presented here. Figures 4a-4c, for 'D
March 1, 1987, again shows electron number density and v
LOS velocity. The antenna pattern consisted of a full 160' ,dicular to each other. By chance, a Sun-aligned arc is clearly 0m
apparent 150 to 200 km duskward (and westward) of the ISRon the Figure 4a scan, although the 20-min time resolution of ,this stand:,,.2 -,ndrcstrom observing mode is too slow to /track or in general unambiguously recognize an arc. The - 00 -200 0 200 ,0Pqondrestrom ISR is able to make i pioper idtgjgiiti .lgi of" EST - WEST CSTPNE Lv"'"
polar cap arcs based upon (1) the ability of the radar to Fig. 2h. Plasma parameters corresponding to the AZ scan ofmeasure the number density and the LOS velocity while 0226-0228. The constant elevation was 35' and the azimuth changeddoing rapid scans, and (2) .he well-known distribution of from 231 ° to 141'. The measured velocity and density have beendensity gradients and velocity shears within the arcs [Carl- projected to a horizontal plane using the same scaling factorsson et al., 19841. Moreover. F region polar cap arcs exhibit employed in Figure 2a. Geographic north is at the top and west is on
the left side of the plot. The arrow at the top central part indicatesenhanced densities below 200 km. Recall that chemical that during the experiment the direction of the Sun was 7' west oflifetimes are so shoit below 200 km that strong N, enhance- geographic north.

1 382 VAt [ADARES AND CARLSON: Pol.AR ARc EL[C TRODYNANIICS/ENER(GFTiC-S
87/02/26 z2s830 - 230c30 SONDRESTROM 87/02/26 Z:3249 - 2;34:47 SODRESTROM
S~ 1KM/S
200-
k 400-
0 'Q00
0
200 ~200e
Ztoo-
-4001I-400 -200 0 2oo 400) p. 500 400 300 200 100 0
EAST -WEST DISTAlNCE 1KM SCAN DISTANCE 1KM)
Fig. 2c. Plasma density for February 20. 1987 and time intervalbetween 0228 and 0230. The antenna scanned 180' in 2 min using .~Fig. 2e. Similar to Figure 2a, but for the time interval 0232-0234.fixed elevation of 350. The scan started at an azimuth of 141' andended ait 32I.The measured LOS velocity is not shown in this plot.
velocities; they have different patterns and lengths accordingto the sign and magnitude of the LOS velocity. At 150 km of
ments identify local production of ionization. We have used altitude the density and velocity statistical uncertaintiesthe density and LOS velocity mapping capabilities provided were about 5% and < 100 m s -respectively.
by the AZ scans to properly determine the occurrence ofarcs. 2. 1. Fc/,rtarv 26, 198'7 Scans
The densities plotted in Figures 2-4 and Plate I are on alinear scale. The initial value and the interval between Data from this day show a stable Sun-aligned polar arc
consecutive levels are both equal to 0.4 x 105 cm- 3. The that stayed in the radar hield of view for 40 min. This arcarrows, superimposed to the N, contours represent the LOS penetrated to the E layer (N,. was enhanced at altitudes as
low as 120 kin). and was detected near local midnight. Itssouthernmost region was observed to be merged to the
87/0/26 Z,3:3-72-3-3- SONRESROM poleward edge of the auroral oval during the early part of the87/2/2 230 1 - I.23 OOETO
I KM/S 837/02/26 2,35:07 - 2,37,07 SONGRESTROM
2M - I KM/S
U ~ j
0-0 200-
0
C) -200
0 4
~I -200, U00
-400 I.400 -213 0 200 400
EAST -WEST FIISTflNCE (KM) -
Vig. 2(/ t op vie"s of the density and the L.OS velocitx. both 40 -__----------400 -2100 0 200 400Oprojecteil to ai hori/ontail plane. The scan time is f'rom 0(23(1 tp ito EAST -WEST DtISTANCE IKM 1((212. [bis Plot corresponds to the northern quadrant. Thec levationis 1 and the scan stairts at 121 of'a/inmh and continues until 211 , Fig. 2j. Simiit~ to Figure 2b'. but coviesponding to the timteI fit sk'almne fdclor is the samne ;is in pre% ious, i.ures. betwe. en ((235 and 017.

VALLADARES AND CARLSON: POLAR ARC El E("TRODYNAMl(S/ENFRGI'S 1383
87/02/26 z-37,2 - 2,39,13 SUNFIRESTROM 87/02/26 2,3919 - 2z41,19 SONDRESTROM400 4030 - - r
S S/ M/
2(M 200-
L) U fZ 4Z
0 10- V- ",
5~ 0 -b '*X\ 0
I- .7I 4..
o o2 2I .
~-200- _ 200- 50 0
-o 400t -40iI-40 -zo 0 200 40( -40 -200 0 2W 400
EAST - WEST DISTANCE tKM) EAST - WEST DISTANCE IKM)
Fig. 2g. Similar to Figure 2c. but for time 0237. Fig. 2h. Similar to Figure 2d. but for time 0239.
arc transit. At the time of the experiment the background the previous EL scan, indicate a general antisunward motiondensity in the polar cap F region was 0.2 x 105 cm-3 ,a value and a shear inside the arc. Outside in the duskside there i, awell below the lowest density contour level of Figure 2. The small sunward flow; conversely the dawnside region has aPedersen conductivity peak values corresponding to each large antisunward flow. We will come back to this point inscan are presented in Table I, which also includes the section 3, where we include the Earth corotation velocityaltitude, distance along the dawn-dusk meridian, and dis- and compute the direction of the plasma flow in the Earth-placement velocity of both maxima. The geomagnetic KP Sun frame of reference.index was I + and the solar flux (Sa) 73.9. Figure 2c shows the same S-A arc during the fast AZ. 180'
The data of Figure 2a were obtained between 0224 and scan of 0228. The two quasi-ellipsoids that are observed0226 UT when the S-A arc, as defined by scans of Figures represent the intersection of the arc and the cone generated2b-2d. was located to the west of the radar station. The by the azimuthal motion of the antenna (see Figure ). Thebeam scanned through most of the arc, and also probed a north and south cross sections of the arc have a maximumduskward region beyond the arc (left side). In this region density of 1.6 and 0.8 x 105 cm - respectively. The anglebeyond the duskward and equatorward edge of the arc the between geographic north and the arc alignment was equal toLOS velocity was directed away from the Sun and radar (the -23.5'. The LOS velocity, in spite of bing measured, is notsmall electron density in this region precludes measurement presented here because of its poor statistical accuracy andof a precise magnitude of the velocity). Within the arc, at F its coarse spatial resolution following from the rapid radarregion altitudes (see range gates 2 and 3 placed at 160 and 210 scan.km of altitude). the LOS velocities (looking transverse to the Figure 2d shows the slow AZ scan that starts at 0230. Thearc) were less than 100 m s - That the density contours LOS velocity measured in the F region (second range gate)trace to lower altitudes in the dawn (right) side of the arc shows smaller values as the counterclockwise AZ scansuggests harder precipitation there, progresses. At -90' azimuth it changes from a toward
Figure 2b presents the data gathered with the slow AZ orientation to a direction away from the radar. The LOSscan of 0226. Here, the Sun-aligned arc is identified by the velocity corresponding to the E region (first gate) shows ahigh N, structure seen in the lower south to southwest part similar characteristic, with the reversal occurring earlier inof the plot, with an orientation much more cleamly seen in the scan. The statistical error of the LOS velocity measure-Figures 2d. 2f, 2g, and 2h. The southern extreme of the arc ment is 20 m s 1 for gate I and about 50 m s 1 for gate 2. Inshows (in Figures 2h, 2c, and perhaps 2) a dawnside spite of the latter being a sizable error when the magnitude of(eastward) extension with an electron density (about >0.5 x the velocity is small, the velocity reversal can be visualized105 cm -) larger than the background N, at altitudes about following the trend of the velocity values. At the end of the200 km. This segment, not Sun-aligned. but more auroral scan (southwest), gates I and 2 exhibit LOS velocitiesoval-aligned, is probably associated with the connection of oriented away from the radar and with a value of order 100the Sun-aligned arc to the poleward edge of the auroiail oval. m s 1. The density contours indicated that the arc wvasThe northern extreme of the Sun-aligned arc N, contours oriented -30' away from the north.mapped here in Figure 2h. all clearly pointing sunward, is The second partial EL scan, in Figure 2e. measured thedetermined by the simple geometry of the arc intersect with complete cross section of the arc, and also probed thethe conical radar scan. daxnside region outside the arc (right side). The region of
Still in Figure 2h. gates 2 and 3. ,et at the same heights of maximum density \kas found displaced 84 km to ard mag-

1384 VALLADARES AND CARLSON: POLAR ARC ELECTRODYNAMICS/ENERGETICS
TABLE I. Motion of the S-A Arc Along the Dawn-Dusk Meridian
MaximumPedersen Dawn-Dusk Time. Distance
Type of Conductivity. Time, Altitude, Displacement. Difference.* Difference.* Velociiy. DawnScan x 104 mho/m UT km km s km to Dusk.t m s
EL 1.96 0225:26 129.9 107.6AZ 1.86 0226:45 125.3 152.6 79 45.0 569(469)AZ 2.43 0229:50 120.7 151.1 185 -1.5 -8 (-108)AZ 1.95 0231:37 131.1 171.9 107 20.8 194 (94)EL 2.20 0233:19 121.2 170.2 102 -1.7 -16 (-116)AZ 3.60 0235:07 125.2 175.3 108 5.1 47 (-53)AZ 2.89 0238:12 128.5 187.3 185 12.0 65 (-35)AZ 2.84 0240:59 128.5 188.6 167 1.3 8 1-92)
*Differences are relative to the preceding scan.tLeft-hand number Earth corotating frame, right-hand number Earth-Sun frame.
netic west from its previous location 9 min earlier (a dawn to can also be explained by changes in the relative location ofdusk virtual velocity by the N,, contours of about 150 m s - ). the arc with respect to the radar. The small LOS velocity ofThe LOS plasma velocity within (and nominally transverse Figure 2d at -90' azimuth is interpreted as a near perpen-to) the arc was about 150 m s in the F region and 300 m s dicularity between the flow dnd the sight direction. Thefor the E region, a factor of 3 increase with respect to the differences in the peak density observed on consecutive AZvelocities of Figure 2a. The F region LOS velocities in the scans or during two sectional cuts of the same arc (Figure 2c)dawnside of the Sun-aligned arc (right side of the plot) are the are due to variations in the distance between the radar andreverse of on the duskside. with a value equal to 100 m s- 1 . the S-A arc. E region velocities collected during the AZ
For altitudes below 150 km in the (production-recombina- scans can be used to reassure that the null LOS velocity istion) chemical equilibrium region of the N,, profile (exami- due to a near perpendicularity of the flow and the sightnation of the slope of, for example, the 0.4-0.8 X 105 cm- ' direction. The velocity in the E layer, being smaller andN, contours of Figures 2a and 2e and Plate I) we find the rotated clockwise with respect to the F region flow, will givetiuskside slope entering tie arc shallower than the dawnside a null LOS velocity at a different look angle, as in Figure 2d.slope leaving the arc. This suggests a gradual hardening of Figure 3 shows the density contours of Figures 2d and 2fthe precipitating electron flux across the arc from the leading superimposed to the 01 (6300 A) emissions (hatched region)edge to the trailing dawnside, where the greatest depth of recorded simultaneously by the GL all-sky imaging photom-penetration occurs. There is a relatively sharp cutoff of eter. Both radar and optical data sets have been transformedionizing electron flux on the (trailing) dawnside of the arc. and scaled to a common coordinate system that depictsWe cannot claim here a statistically significant sample (three geographic latitude and longitude. The red line optical auroraout of the three cases of 0224, 0233, 0210 on February 26, was assumed to originate at 200 km of altitude. The emission1987, and consistency for the fourth case of Figure 4c at produced by impact excitation shows a bright, discrete. and0340, March I, 1987). isolated feature located westward of the radar station. The
The difference in character (bifurcated versus continuous) number density contours measured by the ISR mostly over-between the Ne contours of Figures 2c and 2g is due to the lap the hatched region, except for a small part to the south.geometry of the ISR conical scan intersecting the slab of arc This region may correspond to the oval F layer. Figure 3ionization. This may be appreciated by visualizing a verti- confirms genuinely and unambiguously that the radar, incally elevated slab or small horizontal cylinder, either pierc- fact. diagnosed an arc which was Sun-alignLd and locallying the (55' vertex angle) vertical conical surface and passing produced.through near its axis, or grazing (and encompassing a portionof) the conical surface to one side. Thus the intersection of a 2 'bruarv 26, 1987 Dwellsconical scan with Sun-aligned cylindrical forms will dependon the distance of the axis of the horizontal cylinder from the Plates Ia and I h show observations of the same stable andvertical axis of the cone, and will look very much like energetic arc as in Figure 2. obtained between 0204 and 0222Figures 2d. 2f, 2g, and 2h. The intersection of a conical scan as the arc passed overhead the antenna parked in thewith a horizontally stratified ionosphere is a set of concentric direction up B. the magnetic field. An integration time of Icircle N, contours. Figures 2b and 2c show Sun-aligned arc min was selected in order to provide temperature error barscontours merging to the southwest with some horizontally smaller than 10% at a 200-km altitude. The arc motion acrossstratified ionospheric plasma. The core ionization in Figure 2 the radar beam cannot be assumed constant. However from(;>0.8 x 105 cm 3) is continuous. Sun-aligned, and quite Figures 2a-2h (see Table I) we know that the Sun-alignedstable in density, size, and height (e.g.. Figures 2a and 2e), arc moved westward (toward dusk) at order of 100 m s ' inand separates F region plasma flowing away from the Sun on the Earth corotating frame. As a result of this motion, theits dawnside from plasma flowing much more slowly and duskside of the arc appears earlier (lefthand side) in Plates I atoward the Sun on its duskside (the plasma is predominantly and lb. Color-coded vertical profiles of T, and 7',,'Ti areantisunward within this arc). superimposed on the density contours in Plates la and lb.
Several characteristics of the measured LOS velocity and respectively. In the center of the arc the ion temperature isthe number density associated with the arc of February 26 500 K in the E layer and about 700 K at F regi,,m heights. 1,

VALIADARLS AND CARLSON: POlAR ARC EF ECTRODYNAMI('s/EN.RGI T|(S 1385
60 45 30
75-FEB. 26, 198702:30:40 UT
,70
I- S"700z
0Ih KZ.. 6
I-
_j
4 +S
Cr.o 60- 65
/ 60
60--
I 4-
60 45
GEOGRAPHIC LONGITUDE (WEST)
Fig. 3. Schematic representation of the atroral luminosity observed by the GL!AS|P on February 26. 1987. Thenumber density measured by the Sondres.trom ISR is superimposed as a thick line contour. The two contour levelscorrespond to 0.4 and 1.2 x W~ cm 3 . Both 6300 A intensities and radar N,. have been transformed to geographiccoordinates. They are both colocated and aligned in the same direction (about 24 west of north).
sharply, increases in the dlawnside of the arc reaching 1300 K Sondrestrom field of view while the radar performed aand exceeding T, at both E and F layers. The electron 20-rain sequence of AZ-EL-EL scans. (At this time the Kp,temperature has a different pattern, with T, enhancements of and the solar flux indices were 2-+ and 72.8 respectively).500 K colocated with regions of higher bottomnside electron Figure 4a shows the number density, and the LOS velocity-densities (more intense precipitation), This behavior is re- measured with the fu~ll circular AZ scan of 0324 with thefleted in Plate lb. where the T,/T i ratio is observed to antenna at a fixed elevation of 45 . Most of the patchydecrease from > 1.5 to 0.8 near the dawn edge boundary. The features to the east and south of the station are radarS-A arc. defined by the 0.8 x 10⁵ contour drifted across the intersections of the polar cap F region. The elongated traceradar beam in 10 rin. If we take the average westward speed located 35 km %estward of the radar is the cear signature ofto be of order 100 m s - in the Earth frame, which implies a a S-A arc. We have already noted that any significantwidth of about 60 km for the S-A arc. we get reasonable ionization enhancement near 150 km is due to ongoingagreement with the 0.8 x 10' contours of Figure 2. The inztoadwl aeatnatipc-xie piamaximum density was 1.9 x 10' cm - at 130 km of altitude. einzaions, Thus v e austedant sompigact-ecte otial
The width of the arc and the number density are both emissions Thsi enaemsts appomtng abou ktheas oa
consistent with the view that the arc properties are rather elecntrn nd enhrnemes oximtsely-ong ast ofe
stable over the time period covered by Figure 2 and Plate I1 enrhr n oteneteeo hseogtdtae[overhalfan hur).These have electron density, electron temperature. and(overhalfan hur).elec trodynamic s consistent w ith Sun-aligned arc signatures
(piercing rather than graiing the conical radar scan). How-2.3. March 1 1987 ever. the ISR alone cannot ambiguouslN identify that they
To demonstrate that the conclusions to be reached from are connected by .continuous Stun-aligned enhanced electronthe February 26 data do not represent a unique circum- density contours, and thus they will not be discussed furtherstance. we present data for another Sun-aligned arc of in this paper.comparable intensitN,, observed three nights later. On this A pair ofF L scans (Figures 4b and 4c) cut this arc sN stem,night it system formed b} two Sun-aligned arcs, traversed the |-epectivel, in its northw-est and southwest region',, 8 and 14

1386 VALLADARES AND CARLSON: POLAR AR EI.ECTRODYNA.MICS/ENERGETICS
87/02/26 2:04SC - 2:21:50 SON RESiR0MI I I I
500- / TI tK
1730
• 400 -
l~300
96E,-- !
200
10C 200
05 10 is 20 25 30
TIME - (MIN)
Plate la. Color-coded representation of the ion temperature as a function of altitude and time (,,r February 26.1987. time interval from 0204 to 0221. The N, contours, measured si:nultaneousl, .... superimposed. The antenna waspointing parallel to the local B lines (EL = 80'. AZ = 141'). Each indi,,idual profile is the result of I-min niegration time.Density contours start at 0.2 t1 cm '.
min after it was mapped by the AZ scan. An ionization have been processed independently using different also-feature to the northeast is seen at 0343 on the EL scan at 5I rithms ( ctions 3.1 and 3.2) which were tailored respec-azimuth. This (soft ionizing flux) feature is not a stable tively for each of these two types of scans. The results ofSun-aligned arc, as it does not extend into the southeast these independent calculations provide mutually consistentradar scan. [his will be discussed later. values of the geophysical parameters, lending further confi-
The right side of Figure 4b (southern distances) shows the dence to the analysis procedures and results.LOS velocity at 160 km of altitude (gate 2) varying asexpected if the velocity is constant and the variation is 3.1. Anlvsis of Elevation Scan.vproduced only by changes in the radar look angles. Adifferent behavior is observed in the northern part (left side) At F altitudes the plasma drifts in the E x B directi )n. In
of the plot, where the LOS velocities increase abruptly and the E layer the large ion-neutral collision frequency prevents
then start decreasing at - 100 km of distance, The region of the ions from moving perpendicular to E. Breke et al. [1973,
larger LOS velocity coincides with the dawnward edge of the 19741 used the relation between winds, drifts and electric
arc. fields to obtliin the E region neutral winds. They employedion velocity vectors measured at two dit-lont altitudes bL,connected by the same field line.
3. DATA AN~stYSIS A different approach was exercised by l)oupnik el al.This section presents the analysis of the data correspond- 119771 and de la Beaujardiere el al. 1 19771 in which simulta-
ing to February 26 and March I, 1987. Here, we describe the neous LOS velocities measured from the E and F layers andmethod that was used to calculite the velocity vector, the the radar-deduced wind velocity were used to determine twoHall and Pedersen conducti\'ities, the electric field, the components of the velority vector the third componenthori/ontal and the field-aligned currents, the vertical com- (parallel to B) was assumed to he null.ponent of the Poynting flux and ihe ion-neutral differential Nevertheless. the ion motion along B is seldom zero.temperature. The data acquired during the EI, and AZ scans Mechanisms such as adiabatic expan.ins, parallel electric

V 1I -,I) SRI S V\'.)(R1 I) Pot \K AR( :1 it( I ROMIN \"t11 s F."t R(.I Ri
87/02/'26 2:04:5.0 -2:21:50 SONEJRESTROM
50 - 00 TE.'TI RATI
S400
- 1.0
100-
0 5 10 15 20 25S 30TIME - (MIN)
Plate lb). Similat to Plate ta, hut zhL color-coded diagramn represents the tem~perat(Ure rato 11 1 T Ihe time is thesame a', in the pre\ iouS fitUire.
fields or the ,mall component of the neutral xkind along B. all 87/03/ 01 32z358 - 3:3103 SONFDRESIROMdrive ion motions, alongt magnetic lines,. jpntr ct (1l. 119761 300 T T_ T
detected vertical neutral \%inds, in the auroral zone, less than '-or of the order ot'80 m s I'rhritc l 195 bevd< ~ S -
\,allies of I5 m s Iassociated %k ith aulroral arcs.. Here xk e zoo/4 A1
measure the magnitude of the ionic motion in the direction V 'parallel to BI by pointing the antenna along -on Febhruary 26. L} (1987 bctscen 0204 and 0222. before the sequence of El aind] ") )AZ. canS, and during the o. erhead transit of the arc. I5 \as LnCIfGUnd equal to 25 7 M is 1. In general at nonzero V ~Ilintroduce an error equal to t x tan ElIA Consequently the I
nutll 1,assumption fitils %% hen the radar is directed near the 'Up B position. "
[he s.elocity vectors ssecre derns d using the algorithm L
described at App.7ndi\ A. [his method has some of the ~ rAcharactei istics ot the one emnploy ed bx 1 oin/.c l I9'7 1.w tith the main differc . cc that t he input data INcrc collcted bf -70
El. scans instlead of dweclls. Appendi\ A also includesa .descript ion of' the pulse conP.,urat ion that %t as used. and atlist of the different constraints .% hich cut tail the captbil it\ of t ~- -19- .200 MO 104) 1 A)t s-
the radar to mea .uie the ionospheriL p1a.ratfeters. ii z aT Wf 1P 'i i KN M I
Concuirrently .kith the radar, a Fabrs -Perot interfewometcrrecorded the intensity and tho D~oppler \. locit\ of ()1 Bii0) V 1: 4a Niiirihei1 kdeisIt id I ITS \Cloitsco islit
A)U :missions. at the' zenith and four cardtna;l points 0. Mtch 1. 19x thetime fIerSC InIC1 I, hCIseCn 11I kn' ui ',l I II"
Mermi ~ther. personal contin ic~malion. ttNIO. fit: ictitril tICd it -!' I tic 1 11iiti o ~I I s~i ' 1h le ilk I t II 111C~'~~ \ C l Iii i
'a. md paitterl nicaistirett on I ebntiars 26. l98- ist i.nhe plil

1388 VALLADARES AND CARLSON: POLAR ARC ELECTRODYNAMICs/ENERGETICS
87/03/01 3;3,47- 3,36,46 SONORESTROM PZ = 1.oGoo
I II I IS
400CS00-4O94. 00 --
I
-61)0 -60 -400) -301) -20D -101)0 a 0 to k' 300) 400) Soo
SCAN DISTANCE (KM)
Fig. 4b. Elevation scan performed in the plane of the magnetic meridian between 031I and 01336. Magnetic north isat the left side of the plot. Only arc A wsas probed by the radar during this scan.
described by Niciejewski et at. [19891. They showed that the and Hall conductivities plotted as a function of westwarddirection of the wind was southerly during the zenithal distance from the radar. Both Hall and Pedersen conductiv-transit of the arc. ities were calculated using the radar-measured number den-
For all the data presented here. we have performed a sity. the Schunk and Walker 11970] expression of the ion-comp!ete ve!locity vector analysis. including actual measured neutral collision fr-quency. and the Baniks and Kockarrsneutral winds, and a three-dimensional magnetic field model. 11973) expression of the electron-neuiral collision frequency.The results of the velocity analysis for the two EL scans of The neutral densities are from the MSIS-86 model [iedin.Figure 2 are displayed in Figures 5c and 6c. Here we present 19871.the resolved vectors and their error bars (dashed line). Figure 5 corresponds to the EL sLan of 0224. During thisGeographic north is at the top of the panel and the arrow in time the Pedersen conductivity peaked at a horizontal dis-the upper part points toward the Sun location. The top tance of 105 km away from the radar, the Hall conductivitypanels of these figures show the height-integrated Pedersen at 95 km. The three vectors farthest to the west have very
87/03/01 3.37;t6 3:4Z,14 SONDRESTROM Z 1.0
I KM/S
Soo
400
300
I-.--, N,
1 I I I I I I
-600 -600 -400 -300 -200 -100 0 100 2C300 40 StY)
SCAN DISTANCE (KM)
Fig, 4c. Same as Figure 4b. but for the elevation scan in a plane perpendicular to the magnetic meridian. The crosssecions of both arcs arc displayed at - 9i and 150k. The polar t ip F region is on the right side of the plot at altitudeof 300 km.

Peders.en COnldueti'itv %%ts" locakted ait l7 kml grOUnd rangew 61 fron the s.tatlion aind the H]all eond act iv it x peak at at ho rizou-
j 2;3 ' tal di'.tanec of1 155 kml. Similar to 1-igLre 5. the %,clocit\uj 2 ho %, at '.tad% anti'.unward fw.Bes.ide,,. the legion oI*5 b velocit gradients. I', 42Mtended in the daimn'.ide of' the arc
0 2rahnzaxau f44m' and then. '.liuht l\ decrea'.ing-u X 0 ,hen the Peders.ncondeti COII iti, return'. to it,'h ackgroUnd
Ic'. l of (.2" mihO'. Our re'.ult'. agree with t ho'e of RobimmiocI if/. 119871 and .A1cudc ct al. 1 19881.
F he unch;inging charaicteri'.tic of' both Peder'.en anid HallcondUCtivitie'. during txmo I S'cans. separated by, 8 mmi
0 artCic'. In lav~or of' thi'. S-A arc being .ci-\ ',table '.'.ith noLU
> appreciable \ariation of' it'. s.ource and dI namnic'. Bas.ed on>. the '.teadine'.' of thk' arc, \\e proceeded to merge the data~ of'
o 1 vm/s Figtures. 5 and 6 and f'orm the three Lipper paniel'. of' [icure 7.Li ~I'hi'. ne'.' S.et of\ velocit'. vector'. and condiitie'. \;is a'. '.e
400 200 0 t0 compute the height-integratted aLnd tield-aligned cur-rent'.
SCAN DISTANCE (km) f'1ollong the e~pre'.'.on'. gr':en h% BrcAW ct al. 119741 and/ca lcilojirdfierc cI (it. 1 1977.
I IL! t imirit dei- idijxi.] hull the &OLtl Ck)[ rC~ph)lllt!Ili Ilt I I . _1lt of10224 ()1 1 chliin' 26i. 19X- 1il lej 2,w: Ii) J /,E . . x B 11- ! . x B
ttlehtIllelir t'1~ 'l th lte~ rI -aciac jilli ItISU xxBB I I~ClIt'k ll e 11:AI-'I Ile")it 11 li / C'iiil 111I I I ki'. e' rihtd In the Bc\l tIhe ,iit 'I it lilt i icl ot IiLuIc ;fe point'.. Ini geeiprphii.I j(2&i.LIW IIIIIIL. . Ill IhC d11Iterli II the Sill)
i hre ~j and / are thle cuI--rret perpendictilar and parallel toIt. lp anid !/ are the hecight-integrated 1Peder'.en and Hall
liiree Iinccirritlic' mid ire icii lcir't 'f.tttril \%c.ighting. condujCtivitie'.)n) I he irunt rill. I he e loiert ic' ilxrto ihe atrc hat\e .mall The geophN'.ical parameter'. and their error bar'. '.hoin in
er-ror bar'. hbeca ix of r le Imtic N\ llic'c '.ector'. 'ho%' at [igtures. 7(/-7v,'xcre all calculated in at coor miate '.\S'ten for%CIA rii .1 en! a1 it III .tn'.'.ird Ilii'.. filie matgnituide of' the xi hich the , a'.i' ill perpendiclakr to thle arc alignnment andcloert'. \ a: es trami Ic,, 11h.11 I(M)) ru S I at thle Center- of the directed to0\% alrd dam n. ']he , Yams. i, parallel tot the arc and
arlc up it) 9M))) rS I fin t:.c limlit'. of- tile 1:1 -'cari. Fhe region point'. ,.unward I poleward). The orientation of' the arc ii a'.
if* liilQ ret cindlict1 il r e' COInICI %\' i firlie '.1mal It- 10 ri ms determlined From the AZ S.can-, di'.played it, Figures. 2b-2h. Itchar ire'. [lie '.hatlp dccl liec of fihe conductitie'. in the %i, a'.found that the angle betw\een the airc 'iinnienit and
tlaimrixide )rrcht ide I l thec ix parr all LI Ireto our limited geographic north i,, equal to -- 24 5.The direction of' the1.1 ,~ itt.ih idl nor priibce the /I region 11 di'.ti~Ce'. Close S.un ik -7 ,ecst of north.toiftle ridir. Figure 7d s.how, ' the component of' thle electric field
I litr .'ivlic 6. Nlt fl cliicit'\ clr'. frot rile anal'.I '. f, per"pendicular to the arc P ' component of the e locitil alongI curel 2. 1 021~2, \t tlr l ite the rcion of' ma'.imuni the arc). 1, is Ic'.' than I2 mV\ n 1 in the Lhtr'kwaril edize of'
the ar-c. It reacliex it'. minimtrm valtie of' 5.4 m V fit1 in thereCitll01 of tia\imltrrnl crntLttCti'.ity . Then, it graduall in-
crcitse'. in the dam n'.,idkc until it pre'.ent' a peak i.aZlue of- 72mill Vit i) 4 kni eaxi ii .rd fvrm the cenrter- of' the arc. -,.
u w 6 ploitd in Figuire 7 c. ha', at diffecrent behavifor. It remain'.uJ- 4 con'.tint and belokk 6 myN III ecept forl at region Id~'iiiat 73
a. 2 ki f'rom lie ccriter) in thre c \t rern dim'' ii'm ard enLI oft lie arc.
z 41 b k% here L, incra'.c'. it) 28 nV Ini< ~2 'Bioth comrpornent'. of* the heicht-rnicrated hori/ontal curr-
I j p rent'. arc plotted in Figure'. 7/ md 7 (ri'' r. oni-Si Cponent) i'. proportional ito k, it i'. directed toy ard dui'k and
E ha'.i allrimrn valti of' 0.096 A rn J,. thle componentailorng the .iligiimerri. pre'.ntii'. mo diflerent region'.. Mmvin-
0 ~ard f'romi the center of' the are the a'. erage current i,, 11.158
A ni D Irr'kvi ard. I, i'. belovi the unceriit Ic'. l of (1.0)18
Conxidering that the EK field anid thle cclndlrCti'.itic'. dot notB . s.,, ~~~. ar\ illorg the are a liuzmn Ii.c enl h\
400 200 0 /; L !..~If (3)
'SCAN D'STANCE 1km) I I' ,IH
iL l ilr . I - :_. I'iI fill [fit, II -Il 4) 1 2 111 eii I he parallel cuirrenit i'.'oeiaitcr \\f.ith the aie of" February,26. 19141 ia'.it calculatelld firllov ing I Filte nlunlc iisl e di'.-

1390 VALl ADARES AND CARI SON: POI ,,iR ARc F1E rcrRODYNAMIj('sEF NR(FTi(S
,. atives were obtained by fitting a second-order polynomial to9 W W four consecutive values of E, and E, In Figure 7h, down-
4 0 ward currents arc plotted as positive number-. The seconda 2 and fourth term:i of the right side of (3) produce very small4 b contributions toj , and can be neglected. In the duskside. the
z ,- 2 - parallel current is less than I AA m 2. In the region of0 maximum conductivity.j;i is directed upward with an aver-
S C age value equal to I /.A m 2 Between 156 and 140 kmji
Idecreases to a level near zero. This decrease is due to a large(-2 .tA m ') current originated by a negative gradient of the
0 Pedersen conductivity, first term in the right-hand side of(3).U. .The temperature enhancements of the ion gas observed on
the dawnside of the arc are colocated with regions of largeplasma flow. This fact led us to calculate the frictionalheating due to the ions being dragged through the neutral gas
> I km/s by an electric field. Fedder and Banks 19721 have indicated
1oo that ion temperature effects can be described by the ion- 5 d energy equation. In the steady state T, depends on the vectorLa 5 difference between ion and neutral velocities [Baron andI 0 - Wand. 19831. Hene:. if ions transfer momentum to the
-50 -U neutrals sufficiently rapidly that the neutral particles ap-proach the ion velocity, only modest T, enhancements will
a e occur. Following the derivation of Baron and Wand 11983)
for momentum transfer, we found that for the number0 density of the S-A arcs analyzed here the time constant is
W -o several hours, so for large ion velocities, large T, enhance-
_j ments and heating rates should occur. We have used theZ radar ion velocity of Figure 7c and the neutral velocity fromN 50 the FPI to calculate the ion-neutral differential temperature0 0\ shown in Figure 7i. Our calculations show that between the
-: -L0o dusk and the center part of the arc the differential tempera-ture is less than 100 K. Substantial 7, enhancements occur
_g on the dawn edge. up to 1600 K here. This is simply becauseZ 0this is where the largest ion velocities occur. while the
N Vneutral particles do not have time to experience significanto u E -50 - acceleration.
0 Poynting's theorem state, that the rate of energy flow per4h
C- unit area is equal to E x 611. Here. we present the calcula-W tion of the vertical component of the Poynting flux (P.)
0 C which was computed using the electric field and the horizon-,-, tal current obtained solely from radar measurements. Fol-
-4_ lowing Ampere's law and the current continuity equation (2)
I (L Iand assuming that (I) only the field-aligned current sheetsW - contribute to 811. and 12) the magnitude of the total down-
4j ooward .j current is equal to the magnitude of the upward Iz 500- (they are considered to be closed by horizontal Pedersen0 currents), the P. is nonzero within the arc and given by
, , 4 - - J)) (4)
Z) 4 0-~j~
z., -' where (./,) is the average value of the horizontal currentC- * measured at the dawn and dusk boundaries of the S-A arc.a. h z
-8__ _ Figure 7/ displays the values of P_ calculated according to400 200 0 this simple algebraic relation. Negative vales refer to a
SCAN OISTANCE (kmt dow nward energy flux. The region of more intense precipi-tation has a small Poynting flux. - I erg cm ' s 1. However.
Fig. 7. Gcophysical parameters which were derived using the P_ is maximum, about 5 erg cm - s 1 further east of the arc.conductivilie and velocity vectors of both FL. Scans of F-ehriia-y 26.1987 IFigures 2a and 2v0: 1a) Pedersen condcliit IN) Hall on the dawk nsidc and coincident with the region of maximum
conductivity : (r) velocity vectors: (ai) A component of the E field and E-i, field. Consistency with these findings can also be claimedthe statistical error inherent to the measurement: 1c) Same as F igure from less direct calculations ( E. J. Weber. private commu-7d for v component: (f) omponent of the height-integrated nicalion. 19891 which lead t) similar findings of a downwardhorizontal current; g) v component of the height-integrated hori- Poynling flux on the dawnside of a Sun-aligned arc diag-/ontal current. I) tield-aligned current density. I) ion-neutraldifferential temperature compuled from the measured ion and neu- nosed by a rocket flight I , ta.. 1 19s9i. Te time ,pantral velocity: and (/I vertical component of the Poynting lux. for that segment of rocket data. however, was short com-

V\I I \I)\RIS N ) ( ,RI SON: I'm \ . ( \i I I ( I RO|)'N N'\MI( , LNI R(,UrI( S 1391
pared to an Alfven bounce period, so temporal variation acannot be excluded from those data. vshereas the ISR data IL W 6here show steady conditions. > a
The arc cross sections of Figure 2 were also used to 7 X " 2
determine the motion of the S-A arc. The enhanced electron z 4density profiles measured by the radar were transformed to 0 - 2Pedersen conductivity profiles. The maximum (r,, value 0corresponding to each scan is tabulated in Table 1. The tnumbers *n parentheses in the last column refer to the arc -motion along a dawn-dusk meridian in it frame fixed with theSun-Earth frame of reference (positive numbers represent 0 .
duskward velocities). The arc velocities shovv some scatter. -However. the general trend is it duskvsard motion of 460 ms before 0227 LIT followed by a dawnward drift of 60 m
Figure 8 presents the derived gcoph,ical parameters for >
the EL scans of March I. 1987. This figure has the same - d0format of Figures 5. 6. and 7. Howv~er. when the statistical W 50uncertainty of the ,elocitv ,"as large or the antenna was 0pointing close to the tip B position the parameters were 5 0deleted from the plot. -
Figure 8 show,\s the deried parameters for the EL scanthat was performed along the magnetic east-\est. Both _" 50 ,Pedersen and Hall conducit ities present two peaks corre- 2 Osponding to both arcs of Figure 4f. The background conduc- ). E -
tisity was 0.3 mhos. Both arcs \\ere located at regions oflarge velocity gradient,, where V • E 0 0. Hos ever. one of <them (arc B, see Figure 4(- had a sunward flow, and the other z E 100had an antisunward conscction. Figure 8. as well ais Figure i" o 07. shows the anticorrelation between the magnitude of E and X D <the conductivities. This means that it near-zero E field occurs 0 ,-when the densities are the largest. The ) component of E is -Jonly -4 mV m in the center and dassnside of arc A. The z tOOE, component varies from a peak value of -90 mV m 'in o 2 L o ZT ,Ithe dawn edge of arc A to - 120 mV m 1 in the duskboundary of B. J, is proportional to E, with a maximum 0value near 0.1 Am . J, reaches values up to 0.075 Am "The field-aligned current is upward (2 1A m -in the regionh
Th il-lgedcreti par 2A z1 i h ein2 E 2 M
of arc A:j, is downward in the duskside of arc B. reversingW 00to the highest upward value of this plot (4 .A m i at the
center of arc B. The ion-neutral differential temperature of 4Figure 8i and the Poynting flux of Figure 8i show enhanced .. f ____ __
values at the boundaries of arcs A and B. a 1500- U
W 1000 4
3.2. Analvjsis of Azimuthal S( an.s _ 500
Figure 9 presents the velocities which were obtained V ,_ a _
following the method outlined in Appendix B. We used data .X '8from the four partial AZ scans of Figures 2h, 2/. 21. and 2h. Z V 0 -This figure is in geographic coordinates, where the light 0 -4.traces refer to antisunward convection and the heavy traces - zindicate sunward flow. The vectors corresponding to each -200 0 zooscan were shifted along the dawn-dusk meridian in order to SCAN DISTANCE Nkn) 0
compensate for any displacement of the S-A arc whichoccurred between the scans. We also averaged the velocity Fig. 8. Same a o Figure 7, except that it correspond to time 0337vectors when two or more vectors were located within -20km from each other.
The vector velocities of Figure 9 reproduce (verify) manyof the characteristics that were obtained from the analysis of with a peak value near 1200 m s (2) The region of velocitythe EL scan data. Furthermore, they present additional gradients with negative divergence has a width of about 175features which were not resolved by the limited coverage of km measured along the dawn-dusk meridian. (3) Antisun-the EL scan. The common features are as follows: (I) There ward velocity decreases beyond the dawn edge of the arc. (4)is the large antisunward velocity in the dawnside of the arc There is a high degree of consistency during consecutive

1392 VALLADARES AND CARl SON: Pot AR ARC ELECTRODYNAMICS/ENERGETICS
400 - ------ _-- from ions to neutrals can be approximated as dUIdt=Ikm/s T.,) -iNnp,(T i - ,), where N,,(N,) and T,,(Ti) are the neutral
(ion) density and temperature, and Gi,, is the ion energy loss20 -- -rate. N, and T,, were calculated using the MSIS-86 thermo-
E2oo0 -spheric model and an exospheric temperature equal to 850. K. The upper and lower traces correspond to the energy
S•"transferred to N, particles (the major neutral constituent atE region altitudes) from N4 and 04' ions.
A. Figures 10a-10c show a prominent maximum occurring at0D-' 0211 UT. The coincidence of elevated temperature and
enhanced 1p indicates the intrinsic relationship between1 / 1 these parameters. The second peak in T, may be produced
z -200 by the decrease in the electron cooling rate due to smaller
~~ values of N,. Figures l~d-l0g present a well-defined peak at,-5 0220. In spite of the fact that some of these curves are not
A completely independent (the circulation of some of them
-400 -200 0 200 -400 includes common input parameters), the similarity in theirA00-200 0 STANCE 400 shapes and location of their maxima suggests a direct rela-EAST-WEST OISTANCE kN)tin tion.
Fig. 9. Velocity vectors obtained from the four slow AZ scans A more quantitative view of the T, and T" enhancementsof February 26. 1987. A I km s - I vector is represented as a segment associated with the center and dawnside of the February 26100 km in length. The inclination of the vector indicates the direction arc is presented in Figure 11. The four profiles, labeled E orof the flow. I. were obtained during the overhead transit of the arc. when
the antenna was pointing antiparallel to B. The dashed lines
antenna cycles. The new signatures are as follows: (1) Theduskside of the arc presents a strong sunward flow, with apeak value of 500 m s . (2) The region of sheared flow 10
a-follows the arc alignment in the area covered by the scan 66(about 700 km). (3) The antisunward flow in the dawnside 4
shows that beyond the first-order constancy of plasma flow 2 Aparallel to the arc, there is a gentle second-order variation 0
along the alignment of the arc. The magnitude of the vectors 3decreases from 1200 m s in the poleward part of the scan E 2to 900 m s - in the equatorward region. (4) The northern part -R2shows only a gradient but not a reversal. (5) Near the center 2500of the plot the sunward flow shows a rotational reversal 2000which suggests the limit of the sunward motion. (6) Furtherduskward from the region of sunward convection, the flow, is 500
again antisunward. There is a sharp shea- with positive oo -5divergence. (7) The width of the sunward flowing region is of _ X -4order 1(M km. z J E
>. U.-2a . --
3.3. Analvsis ogData Collecled Willi 1SOC 0the Antenna Directed Up B 1000o e
Derived parameters of the data collected during the dwells 500of February 26. 1987 are shown in Figure 10. together withthe Poynting flux and Joule heating rate from the EL scans. 5
S-4Figures l0a. 10b. 10(. and 10t correspond respectively to z 3the Pedersen conductivity calculated from the number den- 2 -,2sity obtained from the overhead transient of the arc. the X
energy deposition from precipitating electrons. Q,,. which 5 0was computed following the method outlined by WidAwar vi at 4- -
al. J 19751. the electron temperature measured at 250 km and i,.-Wz< E 2
the ion temperature from 110 km of altitude. Figure IOd. z< I
reproduced from Figure 7]. displays the Poynting flux. The " 0-
horizontal scale was changed using a constant arc motion ,, 02:02 02:17 02:32
180 m S 1. Figure l0f shows the Joule heating rate. which TIME (UT)
was calculated according to the relation: .111 - Vig. I0. Directly measured and derived parameters of the Sun-
YtIE , U x 8) 2. Figure lOm presents the height-integraled aligned arc of IFebruary 26. 1987: ta) height-integrated Pedersenconducti, ily: (h) energy deposition from precipitating elecirons: (I
ion cooling rate due to collisions with the neutrals. Beili 1,. at 251 km altitude, (,[ Poi nting flux. (0 T, at 110 km. (() Jouleand Keickdrt.v (19731 showed that the energy transfer rate heating rate. and ft energy transferred from ions it) neutrals.

V I I \iD RIS .AND C RI5ON: Po AR AR( 1i I ( I R0)D N \il ' FNI R(,i 1 [(, 3191
-T]to nominal temporal anl geomtcric: properties of Sun-alignedat ..,.
The two arc,, stadied here are relativelN intense Sun-0 -aligned arcs. lhis optimizes the statistical error bars on the
300 j Ft parameters derived from the ISR data. One of the two arcshas been reported else\ here ,Vici'jewski et 0/.. 19891. with
" detailed analysis of its optical. ion production-loss rates, andu 200 ionizing flux properties. Observed in the UV by Polar Bear.D and the visible from DMSP and ground-based imagers with
¢,5 time continuity, this is a well-documented example of a< I strong Sun-aligned arc. We show in Figure 3 that the position
ioo - of its optical signature is colocated w, ith the ISR signature. A/2 second Sun-aligned arc is presented primarily to demon-
strate that the key findings here are repeatable.The observations reported here apply directly to Sun-
0 3aligned arcs bright enough to be readily seen by conventional0 1000 2000 3000Tn,Ti ,Te (*K) all-sky cameras or visible and UV satellite images. The
findings thus apply to stable Sun-aligned arcs as reportedFig. II. Electron and ion temperatures measured during the up prior to the 1980s, which are found in the polar cap of the
B position. Dashed lines correspond to )211 UT and the thick solid order of 5% of the time. The physical processes that weline to measurements at 0220 UT. The thin trace represents the demonstrate are important in these arcs are. however.neutral temperature calculated using the MSIS-86 model, candidates for applying to a much broader class of arcs. The
degree to which they represent the character of the muchmore common weaker Sun-aligned arcs [ Weber and Buchau.are the electron (El and ion (Il temperature profiles inea- 1981: Carlson v' tit.. 19881, found a third to a half of the time
sured between 0211 and 0212 and when the region of higher in the polar cap. is the subject of a separate study now indensity was being probed. The thick continuous traces arethe T,, and T, profiles measured at 0220 and near thedawnward edge of the arc. The T, curve corresponding tothe center of the Sun-aligned arc shows an enhancement of 4.1. ISR Observing Mode>1000 K in the F region. Notice that this profile increases We have presented and illustrated an ISR mode which, welinearly at altitudes above 150 km. The T, curve measured in maintain, can in general identify and diagnose Sun-alignedthe dawnside was enhanced by 700 K in the E and lower F arcs in the polar cap. Based on nominal properties ofregions. Sun-aligned arcs found with image-intensified all-sky pho-
tometers, the mode maps mesoscale (order 103 x 103 kin)3.4. Thermal Ana/h.si.s of the 1March /. 1987 areas with adequate time resolution to track the passage ofElevation Scan arcs.
The isodensity contours on Figure 4c are reproduced in Arc identification is based on a two-step rationale. ThePlate 2. Superimposed on the N, traces are two color-coded ISR signature of the Sun-aligned arc is a Sun-aligned sheet orcontours coiresponding to the ion (blue) and electron (red) cylinder of persistent enhanced ionization below 200 km (attemperatures. The electron isothermal contour of 1000 K 'F, region" or "'photochemical" altitudes). For ionizationpenetrates to lower altitudes near the regions of enhanced to persist much below 200 km. it must represent the presencenumber density. The ion temperature is enhanced in the of ongoing ionization, because its chemical lifetime is sodawnside of the arc labeled A. reaching at Value of'2(K8) K it short. However. a region of stable or persistent production150 km. The duskside of arc B is also a region of high T, of Sun-aligned ionization must by the same token also be avalues. This plot agrees and extends the observations shown region of stable or persistent Sun-aligned production ofin Figures 10 and II. T, and 1i, are both enhanced but in (electron impact excited) optical emissions. Thus w\ hendifferent regions which do not necessarily colocate. T is looking at contours of greater than l(W electrons cni nearenhanced at the dawn or dusk (or both) sides of the Sun- 150 ki. with chemical lifetime oforderofa minute. and with
aligned arc. persistence over I) min. one cannot help but also expect to
Figure 12 has the same formal as Figure I0. The curves scc enhanced airglo\ wsithin the field-aligned projection ofshown in the seven panels , were calculated based on the - these contours. One example of this is shown in Figure 3.scan data of March I. 1987. They correspond to arc A of
Figure 4c. In spite of the large variability in the parameters 4.2. )ir'( I/ 0h./ervdc I'Orancwtetrdisplayed in this figure. the trend is the same: Regions ofenhanced T, are located near the center of the arc. and 1, Ihe directly observed paramters are electron density.enhancements are situated at the arc boundaries, electron and ion temperature. and plasma line-of-sight ve-
locities. "he electron densities show persistent Sun-alignedridges of enhancemctlls. ('ontours of constant electron den-
4. llist 5t1)Nlo sitv are Sun-aligned over niesoscale distances of 5(10--lOt)We have cxtensivcl analyzed two Sun-aligned arcs diag- kin for altitudes bct\%ccn IM 0 and 200 ki. Electron temper-
nosed by the incoherent scatter radar. E xcepting unusual atures are enhanced along magnetic field lines aboxc thesecircumstances, this require, an ISR observing mode tailored cnianced i idgt , of ionization. consistent \\ ith the cxpecta-

1394 VA..DR AND) CA.RLSON: POLAR ANC ELHA jmj)YNA.MI~s,ENiLR(aTi (s
I I I I
CE -C
(f)
z zU) 0
0 C -
-4-
CO
IL-m0m0
00N0
I I I I00 C)0 00Co 0 0 0
Co LI) (Y
(VLO)3 fl~l

%' I MA)-RI s -Ni) ('RI sON: P01 %R AR( Ei 1 ( I Rf)I)YNA\I( s IFs R(;t I I( s 910
10 mated the steady state currents within the arc from the0plasma density and velocity data. The Birkeland currents-6 were calculated by two independent means. First 'he elec-
2 tron density contours of a cross section of the arc (found to0 6 match the density contours several hundred kilometers
_- b 5 upstream and downstream and on earlier and later measure-
M3 ments) were used to estimate the steady state productionZ. rate of the arc. and hence the upward current above the arc
o2500 0 carried by the estimated incident energetic electron flux. In
-2000 - the second method the horizontal electric field gradient0oo across the arc was derived from the plasma velocity gradient
1ooo across the arc. This electric field, applied to the ionospherico 5-6 conductivity (derived from observed electron density pro-
files an tnadmdlatmosphere). led to derveSE -3 Pedersen and Hall currents. Based on arc symmetry up-
Z -2 stream and downstream. transarc gradients in calculatedC' 2000 Pedersen currents were then used to derive (from the hori-
1500o- zontal divergence of currents across the arc) the variation of
l000 110 Birkeland currents across the arc. The upward Birkeland"- ' 500- Currents derived from these two different approaches were
comparable, and both peaked near the center of the arc at0 ' 0
about I uA m 2 Because downward Birkeland currents6 (presumably carried by upgoing thermal electrons) can be
0 4 derived only where electron densities are large enough to2 give a useful ISR signal. complete current mapping cannot
6 - ---- - o be done. However. this approach gave a rather comprehen-4., ,sive estimate of the ionospheric current system in and near
Si- 3- the stable Sun-aligned arcs observed, an estimate that shouldextrapolate well to such arcs in general. This is summarized
o -- in Figure 14.400 200 0 We have performed three Iindependent calculations of theDISTANCE tkin} energy into the Sun-aligned arc by nonparticle heating.
Fig. 12. Parameters derived from the left-hand half of the ElI. While this nonparticle energy input is distributed across thescan ot 0337 UT on March I. 1987. Figures 12t-t2.Q display the same full arc, it is strongest into the dawn edge. The threegeoph sical quantitics as in Figure tO. The stalistical uncertaintiCsof T, and 1, arc 250 K and 50) K respectively, calculations are motivated by recognition that energy exter-
nal to the ionosphere (ultimately mechanical energy in thesolar wind) is carried down into the ionosphere along mag-
tion of heating by a (sheet) flux of incident energetic clcc- netic field lines as electromagnetic energy or Poynting flux.trons. This is dissipated as frictional heating of the ions draggedOn the dawnside of the Sun-aligned arc. there is a channel through the neutral atmosphere. or Joule heating. Heat.
of high ion temperature. exceeding that of the electron gas. initially deposited mostly in the ion gas, is rapidly passedThis channel of ion heating is where the antisunward plasma onto the neutral gas.flow is still near its maximum value. As one moves, dawn to The first calculation follows the rationale of a FE x 8Bdusk, into the arc, the ion temperature falls to equilibrium Poynfing lux calculation. We note that the Sun-aligned arcwith the neutral particle gas. and only the electron gas has Pnng fux calculon We no that ahesSin-alignd archanges much more slowvly along than across its axis. and issignificantly enhanced temperature. These data confirm. very stable over times large compared to an Alfven bouncerefine, and extend the ion temperature enhancement finding period. Neglecting the spatial and time derivatives then, weand semiquantitative interpretation by ('r/asn clii. i 1984J. take a cross section transverse to the arc, and slice it into aAntisunward velocity gradients aire both coaligned with the series of adjacent differential elements. We look at the
Sun-aligned contours of enhanced (below 200 km altitude) electric field diffrrntial (daln to dusk reduction) and Ped-
electron density. That is. where the antisunward plasma flow ere c rent differential acro s eeme n (th e tvrlcn Current difeersial across each element dkhe electric
velocity decreases in going from dawn toward dusk, ioniza- field is in this measured neutral wind rest frame. [he currenttion is enhanced: when the dawn-to-dusk plasma velocity is then crossed against the electric field strength to derive thegradient ha, the opposite sense (increases dawn to dusk) or first estimate of energy, plotted in Figures 7j. 1Oi. and 1 2d.is constant, there is no enhanced ioni/ation below 2(t) kim and labeled Poynting flux. Relative to an idealized measure-These confirm a simple arc elcctrodynamics interpretation ment of' Poynting flux this calculation has its shortcomings.(convergent electric fields produce converging Pedersen Yet we feel it is useful, parly to underscore the real energycurrents v hose continuity is maintained across the arc by source, and partly because of the good quantitative agree-incident energetic electrons. ment betwreen the ergs cm 2 s 1found from this calculation
and from the following t\\o.43. )vrircd i-l Partiniir. (he second calculalion is bascd on the addilional measure-
The derived parameters arc horizontal and Hirkeland mcnt of the ion gas temperature. (;i\ en the mcasured valuecurrents. E field. and Poynting and particle flu\. We esti- of*the plasma velocity and (tlie neutral atmospheric velocity.

1196 VA I-ADARS AND CARI SON: POl .R ARt El I ( rROI)YNAMR S NI R(,I 11(S
we can calculate the rate at which heat should be going into flux deposit energy to the neutral atmosphere near and abovethe ion gas. duL to the relative motion ot the ions through the 120 km ofseveral ergs cm - s I over the Sun-aligned arc ofneutral gas. This leads to the second estimate of energy flow, width of order 100 ki. This compares to about 0.5 erg cm -
and is verified by the good agreement between the calculated s 1 for at global mean thermospheric EUV heating rate. Partsand the actually observed ion temperature. of the arc experienced 10 times this reference average, and
The third calculation deals with the heat loss from the ion the average across the arc was three or four times thisgas. to the neutrals. It is based on the measured ion gas reference. Given that the arc is of order 100 km %% ide andtemperature and the neutral gas temperature. Because of the persists for a few hours, it is at significant local heat source.cooling rate cross section dependence on ion composition. It is not a negligible heat source even when averaged over itswhich we do not measure, we show two values for the motion across the dark polar cap (of order 10"; to tens of'extremes of 100'i NO* versus 100- 0,' . Within this percent of the global mean EUV and thus comparable to arelatively large uncertainty, this third energy estimate agrees presently missing polar thermospheric heating componentwith the first two (with better agreement for the more likely [e.g.. ('ah'Ao and ('row'/cy. 19891.) While the February 26dominant ion). arc discussed is unustially intense, the polar cap under
We then applied an approximate energy balance calcula- northward IMF conditions typically has several stable Sun-tion to these data. It was reasoned not only that was it logical aligned arcs of a tenth or more of this visual (particleto expect a magnetospheric energy source to drive the precipitation) intensity over a 2000 km or less polar caphigh-speed ionospheric plasma flow through thermospheric width. \Nith temporal persistence of order an hour or more.frictional-drag "loading." but that this energy dissipation Estimates based on measured particle precipitation energyshould ultimately end up mostly in the neutral atmosphere liux alone under these conditions may underestimate thebelow the enhanced ionospheric densities in the arc. It was thermospheric heating rate due to stable Sun-aligned arcs bypossible to estimate this latter quantity in two ways: ( I) from a factor of 3 or more.the steady state rate of heat going into the ion gas: and (2) Note that for the March I Sun-aligned arc the particlefrom the steady state rate of heat lost from the ion gas. The precipitation energy (Figure 12) is about a sixth that for thelormer is derived f'rom the conversion of ordered ion gas February 26 case (Figure t) although both arcs have com-energy due to coherent motion under the action of the parable incident Poynting flux.driving electric field, to disordered energy (heat) as the ions Here we have stressed taking advantage of the stability ofsuffer randomizing collisions with neutral particles. This is the arc, in time and in space along its axial (Earth-Sun)proportional to the square of the difference bet\een the ion dimension, to optimally diagnose its character. Ultimately,and the neutral gas bulk velocity [Subhhe and ('handra, temporal and spatial variations must occur and become large19711. The latter is derived from the observed difference enough to be of interest during one series of arc observa-between the neutral atmospheric and ion gas temperatures. tions. During the 40 nin observation of the February 26,Uncertainty in the ion composition leads to greater uncer- 1987 arc. it drifted from overhead (0212 UT) to 100 km we'dtainty in this latter estimate than in the former. However. (0225) to 180 kn %s st (0234). A composite image ofthe arcboth of these methods give at value for the energy deposition was constructed from the many conical and planar crossrate into the neutral atmosphere of a few ergs cm - s , sections of the arc to estimate departures from idealizedcomparable to the Poynting flux into this region. These three constancy along its axial length. This analysis indicates aindependent calculations thus lead to a simple but reassur- velocity gradient along the arc axis, with penetration ofingly self-consistent interpretation of the data. sunward drifting plasma only part way into the polar cap.
It is important to note a critical step in the above argument The t\o-dimensional cross section (Figure 9) suggests floxbefore proceeding. We note that T, can be derived in two from ss here the arc connects to the auroral oval, partial entrycomplementary independent ways. one (theoretically) from into the polar cap. and then clockwise rotational flow back tomeasured ion and neutral particle velocities, the other di- antistnvard, exiting again from the polar cap. Farther intorectly from the radar-observcd spectra. Our calculations of the polar cap there is slowing of antisunward plasma flow.the differential temperature based on the ion and neutral but not a reversal to sun\s ard. This is sketched schematicallyvelocities show good agreement with the observed 1', en- in Figure 13. (This is very reminiscent of the interpretation ofhancements (see Plate la and Figure 7i). The Fabry-Perot some )E data by Ibottan ct al. 119851 under similaralso measured enhanced neutral temperatures. possibly co- conditions.)located with the region of larger ion iemperatures (R. Nicie- It is clear from Figure 13 that the net velocity differencejewski. personal communication. 1989). The observed ion from the da\nsidc to the duskside ofthe arc is greater in theheating can be explained solely on the basis of a quantitative velocity reversal region than the merely velocity reductionanalysis of the large observed plasma flow V relative to the region. Thus it is apparent from examination of this figureobserved neutral atmospheric rest frame U. Since all three of that the Pcdersen current divergence, and balancing Birke-these parameters are observed, not modeled. \%ce are thus land currents, lead to extra energetic particle input w,\ithinable to determine, not merely assume that these ion ten- the tongtte of sun\ard moving plasma, relative to that in theperatures are explained solely on the basis of this heating region of simply a velocity gradient deeper in the polar cap.mechanism (within small statistical uncertainty). It is this Furthermore. %%hilc Hall currents along the da\ it edge ofanuse of the directly observed 1,. V, and I that alloss itis to arc of constant properties along its axial length siniplyjustify calculating the rate of heat flowing into the thermo- continue into the polar cap. those in the region of partialsphere on the basis of t ,leady ,late ion thermal balance penetration of 'sunward low\ penetrate only partiall\ into theargument. polar cap and then must rotate \est\\ aid near theit region of
We then point out that the magnitude of this heating rate is ma ximtum pole\\a rd penetration. Ilhese effects can combinealso of significance. The Poynting Ilux and energetic particle to producc the "bright spot" or extra particle precipitation
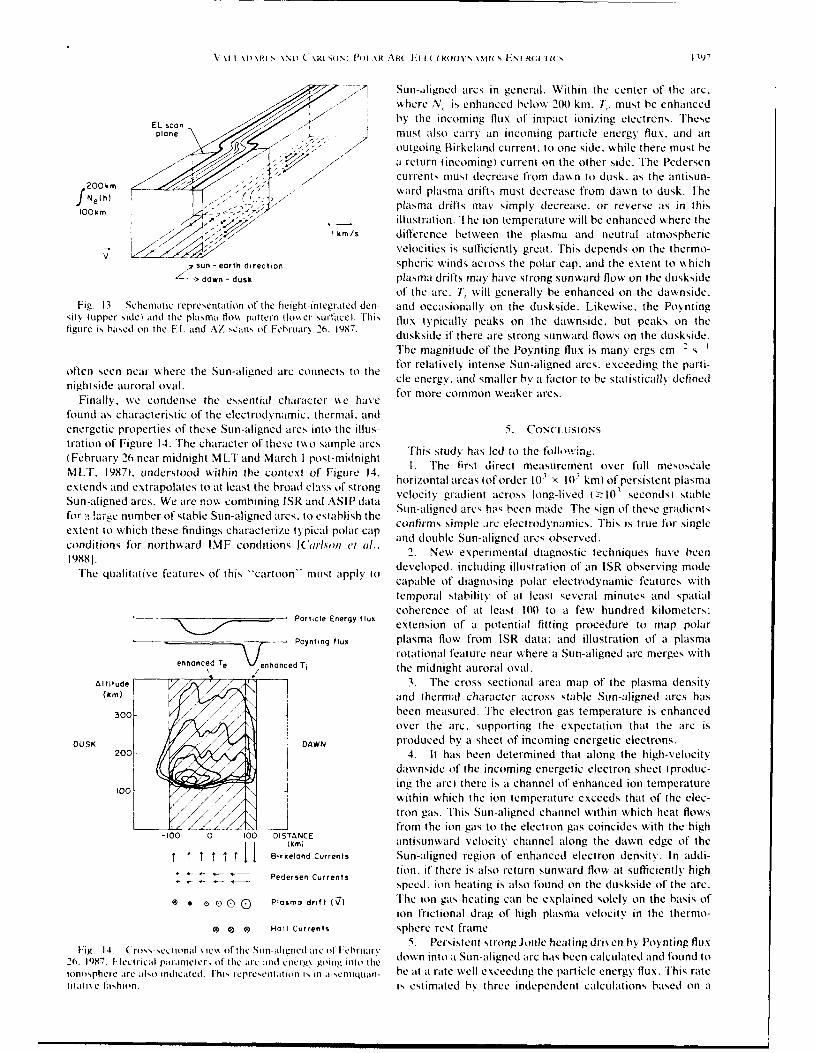
V \ I )\RI,,\\[) ( S o P I R AR ( (AMO:1 1 MOMI)SN .\ I s NI R( I II( S 1397
7 /-" Sun-aligncd arcs in general. Within the center of the arc.where N,, is enhanced below 200 km. T,. must be enhanced
EL nby the incoming flux of impact ionizing electrons. Thesepla must also carry an incoming particle energy flux, and an
outgoing Birkeland current, to one side. while there must bea return (incoming) current on the other side. The Pedersencurrents must decrease from dawn to dusk. as the antisun-200km "
N, (h) (.ward plasma drifts must decrease from dawn to dusk. The0ekm .plasma drifts may simply decrease. or reverse as in this
illustration. The ion temperature will be enhanced where theI km/S difference between the plasma and neutral atmospheric
velocities is sufficiently great. This depends on the thermo-sun - earth direction spheric winds across the polar cap, and the extent to which
down - dusk plasma drifts may have strong sunward flow on the dusksideof the arc. , will generally be enhanced on the dawnside.
Fig. 13. Schematic representation of the height-integrated den- and occasionally on the duskside. Likewise. the Poyntingsit (upper side) and the plasma tlom. pattern flo\Ner surfacel. This flux typically peaks on the dawnside, but peaks on thefigure is based on the F[_ and AZ scans of Feb'luary 26. 1987. duskside if there are strong sunward flows on the duskside.
The magnitude of the Poynting flux is many ergs cm -" s Itfor relatively intense Sun-aligned arcs. exceeding the parti-
oftnseennerhei arc c s tot e energy, and smaller by a factor to be statistically definednightside auroral oval. frmr omnwae rs
Finally, we condense the essential character we have for more common weaker arcs.
found as characteristic of the electrodynamic. thermal, andenergetic properties of these Sun-aligned arcs into the illus- 5. CoNct-usiostration of Figure 14. The character of these two sample arcs This study has led to the folho'ing.(Februarv 26 near midnight MLT and March I post-midnight I h st dt teasurement.1. The first Irct measurement over full mesoscaleMLT. 1987). understood within the context of Figure 14, horizontal areas (of order 10' × 10 km) of persistent plasmaextends and extrapolates to at least the broad class of strong velocity gradient across long-lived (" 103 seconds) stableSun-aligned arcs. We are now combining ISR and ASIP datafor a !arge number of stable Sun-aligned arcs. to establish the Sun-aligned arcs hiis been made. The sign of thee gradients
confirms simple ire electrodynamics. This is true for singleextent to which these findings characterize typical polar cap and siple u-a le d aso s .
conditions for northward IMF conditions arlon and double Sun-aligned arcs observed.
1988" 2. New experimental diagnostic techniques have beenThe qualitative features of this *'cartoon" must apply to developed, including illustration of an ISR observing mode
capable of diagnosing polar electrodynamic features with
temporal stability of at least several minutes and spatialcoherence of at least 100 to a few hundred kilometers:
Particle Energy flux extension of at potential fitting procedure to map polar
Poynting flux plasma flow from ISR data: and illustration of a plasmarotational feature near where a Sun-aligned arc merges with
enhanced Te enhanced Ti the midnight auroral oval.
Altitude / 3. The cross sectional area map of the plasma density(km) and thermal character across stable Sun-aligned arcs has
300 / been measured. Trhe electron gas temperature is enhancedover the arc, supporting the expectation that the arc is
DUSK DAWN produced by a sheet of incoming energetic electrons.200 I 4. It hats been determined that along the high-velocity
dawnside of the incoming energetic electron sheet Iproduc-
ing the arc) there is at channel of enhanced ion temperaturewithin which the ion temperature exceeds that of the elec-tron gas. This Sun-aligned channel within which heat flowsfrom the ion gas to the electron gas coincides with the high-100 0 100 DISTANCE
(k0 DI antisunward velocity channel along the dawn edge of theT T T T T T I I Borkeland Currents Sun-aligned region of enhanced electron density. In addi-
Pedersen Currents tion. if there is also return sunw ard flow at sufficiently highspeed. ion heating is also found on the duskside of the arc.
® 0 o 0 ) Plasma drift (V) The ion gas heating can be explained solely on the basis ofion frictional drag of high plasma velocity in the thermo-
® Hall Currents sphere rest frame.5. Persistent strong Joule heating driven by Poynting flux
2h. 1997 (lectrical parameter', of the ar ant et-ig o into the down into a Sun-aligned arc hats been calculated and found toionosphere are also indicated Ish, rcpresenlalIon IS Ill a seniqlan- be at a rate well exceeding the particle energy flux. This ratetitali5e fashion, is estimated by three independent calculations based on a
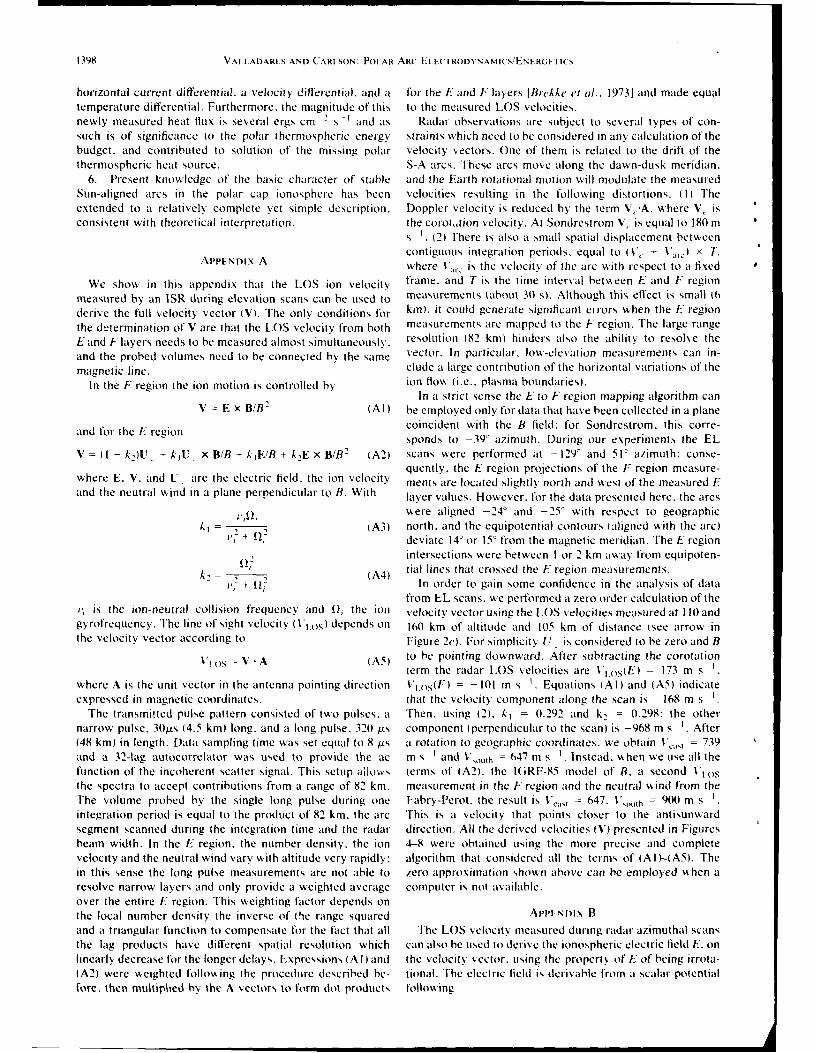
1398 VALIADARES AND CARISON: POLAR AR( I"lfE(TRODYNAtMICs/ENLRGFTI(S
horizontal current differential. a velocity differential, and a for the E and F layers JBreAke i n.. 1973 and made equaltemperature differential. Furthermore, the magnitude of this to the measured LOS velocities.newly measured heat flux is several ergs cm s s and as Radar observations are subject to several types of con-such is of significance to the polar thermospheric energy straints which need to be considered in any calculation of thebudget, and contributed to solution of the missing polar velocity vectors. One of them is related to the drift of thethermospheric heat source. S-A arcs. 'Ihese arcs move along the dawn-dusk meridian.
6. Present knowledge of the basic character of stable and the Earth rotational motion will modulate the measuredSun-aligned arcs in the polar cap ionosphere has been velocities resulting in the following distortions. ( 1) Theextended to a relatively complete yet simple description. Doppler velocity is reduced by the term V,-A. where V, isconsistent with theoretical interpretation. the corotltion velocity. At Sondrestrom V,. is equal to 180 m
s 1. (2) There is also a small spatial displacement between
contiguous integration periods, equal to (V, - V,, x 1".APPENDIX A where V',, is the velocity of the arc with respect to a fixed
We show in this appendix that the LOS ion velocity frame, and T is the time interval between E and F regionmeasured by an ISR during elevation scans can be used to measurements (about 30 s). Although this effect is small (6derive the full velocity vector (V). The only conditions for kin). it could generate significant errors when the E regionthe determination of V are that the LOS velocity from both measurements are mapped to the F region. The large rangeE and F layers needs to be measured almost simultaneously. resolution (82 kin) hinders also the ability to resolve theand the probed volumes need to be connected by the same vector. In particular. loss-elevation measurements can in-
magnetic line. clude a large contribution of the horizontal variations of theIn the F region the ion motion is controlled by ion flow (i.e., plasma boundaries).
In a strict sense the E to F region mapping algorithm canV = E x B/B- (Al) be employed only for data that have been collected in a plane
and for the E region coincident with the B field: for Sondrestrom. this corre-sponds to -39' azimuth. During our experiments the EL
V (I - k,)U IkU x B/B + kE/B+ AE x B/B2 (A2) scans were performed at -129o and 5V azimuth: conse-quently. the E region projections of the F region measure-
where E. V. and U. are the electric field, the ion velocity ments are located slightly north and west of the measured Eand the neutral wind in a plane perpendicular to B. With layer values. However. for the data presented here. the arcs
were aligned -24' and -25' with respect to geographic(A3) north, and the equipotential contours -aligned with the arc)
', - !,-deviate 14' or 150 from the magnetic meridian. The E region
intersections were between I or 2 km iiway from equipoten-I I (A4) tial lines that crossed the E region measurements.
,, ._A In order to gain some confidence in the analysis of datafrom EL scans, we performed a zero order calculation of the
v,, is the ion-neutral collision frequency and 11, the ion velocity vector using the LOS velocities measured at I 10andgyrofrequency. The line of sight velocity (VI)) depends on 160 km of altitude and 105 km of distance (see arrow inthe velocity vector according to Figure 2e). For simplicity U is considered to be zero and B
V -A (A5) to be pointing downward. After subtracting the corotationterm the radar LOS velocities are V1_s(LE) = 173 m s .
where A is the unit vector in the antenna pointing direction Vjt)s(F) = -101 m s . Equations (Al) and (A5) indicateexpressed in magnetic coordinates, that the velocity component along the scan is - 168 m s -
The transmitted pulse pattern consisted of two pulses. a Then. using (2). k, = 0.292 and k, = 0.298: the othernarrow pulse. 30is (4.5 kin) long. and a long pulse. 320 )Is component (perpendicular to the scan) is -968 m s 1. After(48 kin) in length. Data sampling time was set equal to 8 ps a rotation to geographic coordinates, we obtain V,,,, = 739and a 32-lag autocorrelator was used to provide the ac m s I and V",outh = 647 m s 1. Instead. when we use all thefunction of the incoherent scatter signal. This setup allowvs terms of (A2). the IGRF-85 model of B. a second Vt-osthe spectra to accept contributions from a range of 82 km. measurement in the F region and the neutral wind from theThe volume probed by the single long pulse during one Fabry-Perot. the result is V,,, - 647. Vouth = 9(X) m s-integration period is equal to the product of 82 km. the arc This is a velocity that points closer to the antisunwardsegment scanned during the integration time and the radar direction. All the derived velocities (V) presented in Figuresbeam width. In the E region. the number density, the ion 4-8 were obtained using the more precise and completevelocity and the neutral wind vary with altitude very rapidly: algorithm that considered all the terms of (Al)-AS). Thein this sense the long pulse measurements are not able to zero approximation shown above can be employed when aresolve narrow layers and only provide a weighted average computer is not available.over the entire E region. This weighting factor depends onthe local number density the inverse of the range squared APPt:Nt)tx Band a triangular function to compensate for the fact that all The LOS velocity measured during radar azimuthal scansthe lag products have different spatial resolution which can also be used to derive the ionospheric electric field E. onlinearly decrease for the longer delays. Expressions (A) and the velocity vector, using the property of E of being irrota-(A2) were weighted following the procedure described be- tional. The electric field is derivable from a scalar potentialfore. then multiplied by the A vectors to form dot products following

VAL I ,DAR1 S -ND CARL SON: PoI AR AR( El I ( TROD N,,\tI s EstIR0a FI S 1399
E- -V (BI) a correlation between Sun-aligned rcs and the interplanetarymagnetic field direction, Geop/v.. Re.s. Letm. 3. 145. 1976.
where V is the electrostatic potential that varies as a tunction Brekke. A.. J. R. Doupnik. and P. M. Banks. A preliminar studyof the neutral " ind in the auroral E region, J. Gteophy.s. Re.s.. 78.
of latitude and longitude. Now, if the scan is performed at a 8235. 1973.low elevation, then V can be represented by V(r. a), where r Brekke. A.. J. R. Doupnik, and P. M. Banks. Incoherent scatteris range and a the azimuth. measurements of E region conductivities and currents in the
An incoherent backscatter radar measures the radial corn- auroral zon,:, J. Geophy. RC., 79, 3773. 1974.
ponent of the ion velocity at several distances along the line Burke. W. J., M. C. Kelley. R. C. Sagalyn. and M. Smidd . andS. T. Lai. Polar cap electric field structures with a northward
of sight. At high latitudes this radial drift is closely related to interplanetary magnetic field. Geophivx. Re.s. Lett.. 6. 21. 1979.the azimuthal component of E. Consequently. V could be Burke, W. J.. M. S. Gussenhoven. M. C. Kelley. D. A. Hardy. anddetermined by integrating the azimuthal component of ( BI) F. J. Rich. Electric and magnetic field characteristics of discreteand using a know initial value of the potential. V(r. a,). At arcs in the polar cap. J. Geoph.l. Res.. 87. 2431. 1982.the Millstone Hill radar, the boundary potential can be Carlson. H. C.. Jr.. and G. Crowley. The equinox transition study:
assumed to be null at the southernmost part of the scan [Holt An overview,.. Geophy.%. Res., 94. 16.861, 1989.Carlson. H. C.. V. B. Wickwar. E. J. Weber. J. Buchau. J. G.
Ct at., 19841. However, no similar statement can be used to Moore. and W. Whiting. Plasma characteristics of polar capreduce data from Sondrestrom. F-layer arcs, Geophy'N.%. Res. Lett., 1/. 895. 1984.
Another method that has been used to resolve the magni- Carlson. H. C.. R. A. Heelis. E. J. Weber. and J. R. Sharber.tude and the direction of the ion flow is the beam swinging Coherent mesoscale convection patterns during northward inter-technique. Here, the LOS velocity from several adjacent planetary magnetic field. J. Geoptt. Re.%.. 93. 14.501. 1988.Davis. T. N., The morphology of the polar aurora. J. Geoph..azimuthal sectors are least squared fitted to extract the three Res., 05. 3497. 19601).components of the velocity [Ihaglor-s and Belhnke, 1974]. de la Beaujardiere. 0.. R. R. Vondrak. and M. J. Baron. RadarThis method has been employed at Arecibo. where the more observations of electric fields and currents associated with auroraluniform ionosphere of this mid-latitude station grants confi- arcs. J. Geophy.x. Rex.. 82. 5051. 1977.
dence for the application of this type of analysis. Denholm. J. V.. and F. R. Bond. Orientation of polar auroras. .4St.J. P/tv._. 14, 193. 1961.
Although 1 (r, a,) could be calculated from the velocity Doupnik. J. R.. A. Brekke. and P. M. Banks. Incoherent scattervectors of section 3. I. we instead computed the boundary radar observations during three sudden commencements and a Pcpotential using the data from the same azimuthal scan. We 5 event on August 4. 1972. J. Geoptivs. Rex.. 82. 499. 1977.employed the LOS velocity of three adjacent integration Eather. R. H., and S.-I. Akasofu. Characteristics of polar cap
periods and the condition of negligible ion motion along B auroras. J. Geoptys. Re., 74. 4794. 1969.Fedder. 1. A.. and P. M. Banks. Convection electric fields and polar
(less than or of order 25 m s Ias measured) to obtain thermospheric winds. J. Geophv.s. Re... 77. 2328. 1972.space-averaged velocity vectors. Then, the initial boundary Frank. L.. A.. I. D. Craven. 3. L. Burch. and J. D. Winningham.potential was calculated for every integration period and Polar views of the Earth's aurora with Dynamic Explorer, Geo-served as the initial condition for the more precise value of V phys. Res. Leit.. 9, 10)01. 1982.
which wats obtained by integrating (13). The boundary Frank. L. A.. et al., The theta aurora. .1. (eophv.. Re... 91. 3177.1986.
potential as calculated in this way smooths rapid spatial Gussenhoven. M. S.. Extremely high latitude auroras. J. Geophv.s.variations of the velocity but will be less affected by statis- Re._. 87. 241)1. 1982.tical errors. This scheme was adopted to avoid cumulative Hagfors. T.. and R. A. Behnke. Measurement of the three-
errors produced by random fluctuations in V.()S which dimen,,ional plasma velocities at the Arecibo Observatory. Radios Sei.. 9. 89, 1974.
sometimes are of the same order of magnitude is the Hardy. I). A., Intense fluxes oflow-energy electrons at geomagneticmeasured velocity. latitudes above 85' . J. Geoph.s'. Re,.. 89. 3883. 1984.
Hedin. A. E-.. MSIS-86 thermospheric model. J. Geophv.. Re... 92.4649, 1987.
A(Orowled,ment.s. We would like to acknowledge S. Basi and Hoffman. R. A.. R. A. Heelis. and J. S. Prasad. A Sun-aligned arcSu. Bas for critical readings of the manuscript. R. Niciejewski and observed by DMSP and AE-C. J. (oplhvs. Re.%.. 90. 9697. 1985.J. Meriwether for useful conversations concerning the FPI data, E. Holt. J. M.. R. H. Wand. and J. V. Evans. Millstone Hill measure-Weber for providing the ASIP image data, and J. Kelly for making ments on 26 February 1979 during the solar eclipse and formationthe radar data available for this study. This research was supported of a midday / -region trough. J. Atmo.. Trr. 1Ph.v., 46. 251. 1984.in part by Air Force Office of Scientific Research Linder task 2310G9. Huang. C. Y.. t. A. Frank. W. K. Peterson. 1. J. Williams. W.The work at Boston College %kas supported by Geophysics Labora- Lennartsson. 1). G. Mitchell. R. C. Flphic, and C. T. Russell.tory FI9628-90-K-0007. We thank the t)anish Commission for Filamentary structures in the magnetotail lobes. J. (;,ophv.k.Scientific Research in Greenland for permission to conduct these Re,.. 92. 2349. 1987.experiments. Ismail. S. 1 I). 1. Wallis. and L. .. Cogger. Characteristics of polar
The Editor thanks two referees for their assistance on this paper. cap Sun-aligned arcs. .1. (;eophy.. Res.. 82. 4741. 1977.Kan. .. R.. and W. .. Burke, A theoretical model of polar cap
auroral arcs, J. Geopvs. Re.%.. 90, 4171. 1985.Ri1FRN( ES ILassen. K.. and C. Danielsen, Quiet time pattern of auroral arcs for
different directions of the interplanetary magnetic field in the Y-ZAkasofui. S.-I.. Recent progress in studies of I)MSP auroral photo- plane. J. (;c,,h., . Re.. 83. 5277. 1978.
graphs. Spi(c St i. Re.._ /9. 169. 1976. Mende. S. i.. J. H. I)oolittle. R. M. Robinson. R. R. Vondrak. andAkasofu. s.-I. R. Williams. and M. Roederer. Effects of the F. J. Rich. Plasma drifts associated , ith a system of Sun-aligned
passage of an IMF discontinuity on the polar cap geometry and arcs in the polar cap. J. (i,,phv .. Rex.., 93. 256. 14988.the formation of a polar cap arc. Plane;,t.,pou S i.. 32. 119. 1984. Meng. C.-I. The auroral electron precipitation during estremel,
Banks. P. M.. and Gi. Kockarts. Aerosonv: Port B. Academic. San quiet geomagnetic condition,,. J. (;eophtvx. R(..%.. 86, 46(17. 1981.Diego. Calif.. 1973. Meng. C-I.. and S.A. Akasofu. The relation between the polar cap
Baron, M. ... and R. H. Wand, I- region ion tempcratulrc enhance- auroral arc and the auroral oval arc. J. (h vspt . Re,%.. 8/, 4(1)4.ments resulting from Joule heating. . Gcophvs. Rv .. 88. 4114. 1976.198". Murphree... S.. C. 1). Anger. and I.. I.. (ogger. the intanlaneous
Berkey. T., I.. I.. (ogger. S. Is mail. and Y. Kamide. Evidence for relationship betveen polar cap and oval auroras at times of

14W0 VALLADARES A,4) CARL SON: POILAR AR( F( rI ROM NA111K s/ENI Wit-. I CS
northward interplanetais magne-lic field. C'an. J. P/tv..... 60. 349. Spence,. .- W.. R. F. Theis, L. E. Wharton. and Gi. R. Carignan.1982. LoL, I vertical motion, and kinetic temperature from AF-C as
Niciejewski. R. I. et al.. Coordinated satellite and g.-e.,.nd-based evidenc:e for auroral-induceu -avity waves.,~p/x Re... Lett..measurements of the energy characteristics of at Sun-aligned arc 3, 313. 1976.over Sondre Stromfijord. J. Geopli.s. Re.. 94. 17,201. 1989. StUbbe. P.. a;-d S. Chandra. Ionospheric " arming by neutral %&inds.
Obara. T.. NM. Kitavama. 1'. Mukai. N. Kava. J. S Murphree. and Planet. Spa( e Sci.. /9. 71., 1971.L. L.. Cogger. Simultaneous obsersations of Sun-aligned polar Weber. E. . ad J. Buchao. Polar cap F-laver auroras. (h'eopl..cap arcs in both hemisphere,, b,, FXOS-C and Viking. Geo...'. Re.%. Lett_ 8. 12S. 1981.Re,%. Lctl.. I15 . 713, 1988. Weber. E. J., et a!.. Rocket mcasUrements wvithin . polar cap arc:
Peteherych. S.. G. G. Shepherd, and J. K. Wailker. Observations of' Plasma, particle and electric circuit paramete. N. J. Gioph%... Re.%..vertical E region neutral winds in the intense ulroral arcs. PlIanet. 94. 6692. 1989.Spate Sui.. .3, 869. 1985. Wv' G.. Aspect,, de l'auro, e obsers'ee a la base lDamont-d'Urille
Peterson. W. K.. and E. Ci. Shellev. Origin of' the plasma in a en Terre Adelie, C. R. A. adS, i. 240. 2925, 1958.cross-polar cap auroral feature (theta aurora), J. (h'.phv... Re,.%., Wickwar V. B.. Ni. J1. Baron, and R. 1). Sears. Auroral energy89. 6729. 1984. inpit from energetic electrons and Joule heating at Cniatanika. J.
Reiff. P. H.. and J. L. Burch. IMIF B,-dependent 0, ysidc plasma (ieophv.. Rexs.. 8(0. 4364. 197S.flow and Birkeland currents in the daN side magnetosphere. 2. Aglobal model for northward and southwNard IMF. 1.(e/.. H. C. (Carlson. Jr.. Geophysics Laboratory. Hain'coni Air Forcv.Rex.. 90. 1595. 1985. Base. MA 01731.
Robinson. R. M., R. R. Vondrak. and E. Frii'-Christenscnt. lono- C. E. Valladares. Institute for Space Research. Boston College.spheric currents associated wsith at Sun-aligned arc connected to Ne..ton Center. MA 02159.the auroral oval. Geop/es. Re.... Lett., /4. 656. 1987.
Romick. G. J., and N. B. Bros';n. Midday aurorid observations inthe oval, cusp region and polar cap. J. Geoplexs. Rc.... 76. 84201.1971. tReceised t),a.ber 27. 1989:
Schunk. R. W.. and J C. G. Walker. Thermal diffusion in the V-. revised August 6. 19901:region of the ionosphere. Planet. Spate Sr i.. IN. 535. '970. ac.cepted August 6. . il.)