AD-A222 938 SOLUBILITY CHARACTERISTICS OF A … · AD-A222 938 SOLUBILITY ... lity concept to a...
33
FILE COPY MTL TR 90-28 AD AD-A222 938 SOLUBILITY CHARACTERISTICS OF A METHACRYLATE COPOLYMER MARIE K. POTTS POLYMER RESEARCH BRANCH May 1990 Approved for public release; distribution unlimited. fLECTE 9JUK19 ,J LAWTQn CMMIA U.S. ARMY MATERIALS TECHNOLOGY LABORATORY mum" "KoAu LPMTOM Watertown, Massachusetts 02172-0001 *O 06 18 294
Transcript of AD-A222 938 SOLUBILITY CHARACTERISTICS OF A … · AD-A222 938 SOLUBILITY ... lity concept to a...

FILE COPY
MTL TR 90-28 AD
AD-A222 938
SOLUBILITY CHARACTERISTICS OFA METHACRYLATE COPOLYMER
MARIE K. POTTSPOLYMER RESEARCH BRANCH
May 1990
Approved for public release; distribution unlimited. fLECTE
9JUK19 ,J
LAWTQn CMMIA U.S. ARMY MATERIALS TECHNOLOGY LABORATORYmum" "KoAu LPMTOM Watertown, Massachusetts 02172-0001
*O 06 18 294
The fnirriqi in this report are not to be construed as an officialDeparum.nt of the Army position, unless so designated by otherjuthorw;2d documents.
Mentio, of any trade names or manufacturers in this reportshall iot be construed as advertising nor as an officialindorsement or approvai of iuch products or companies bythe U, ited Statei Government.
OIsPQv:IT)ON INSTFUjCTIONS
Coltrriv II.F't ' ' 1' a o q. *l 1
UNCLASSIFIED
SECURITY CLASSIFICATION OF THIS PAGE (Whwn Da Eamed)
REAlO INS I RUCl1-iNSREPORT DOCUMENTATION PAGE BEFORE COMPLETING FORM
1 REPORT NUMBER 2. GOVT ACCESSION NO. 3. RECIPIENT"S CATALOG NUMBER
MTL TR 90-28
4. TITE (and sbw) 5. TYPE OF REPORT & PERIOD COVERED
SOLUBILITY CHARACTERISTICS OF A METHACRYLATE Final Report
COPOLYMER . PERFORMING AOG. REPORT NUMBER
7. AUTHOR() & CONTRACT OR GRANT NUMER4)
Marie K. Potts
9. PERFORMING ORI3ANIZATION NAME AND ADDRESS 10. PROGRAM ELEMENT, PROJECT, TASK
AREA & WORK UNIT NUMBERS
U.S. Army Materials Technology LaboratoryWatertown, Massachusetts 02172-0001 D/A Project: FI8BF8J2FIAW
SLCMT-EMP AMCMS Code: 6111027A00111. CONTROLLING OFFICE NAME AND ADDRESS 12. REPORT DATE
U.S. Army Laboratory Command May 19902800 Powder Mill Road 13. NUMBER OF PAGES
Adelphi, Maryland 20783-1145 2814. MONITORING AGENCY NAME & ADORESS (/difftf pntfmm Co &ng Office) 15. SECURITY CLASS. (ot II& ,pon)
Unclassified
I&L DECLASSIFICATON/DtOWNGRADINGSCHEDULE
18. DISTRIBUTION STATEMENT (fdui, Rqkw)
Approved for public release; distribution unlimited.
17. DISTRIBUTION STATEMENT (of sh abmcs eear in Block 20. sf diffem tfrm Repon )
18. SUPPLEMENTARY NOTES
Solubility Solubility mapsCopolymers Solubility parametersMethacrylates Solubility phase diagrams ,.jj ") ;
20 ABSTRACT (ConUa an 0i ,w, if necemy and ilendfy by block reindber)
(SEE REVERSE SIDE)
FORM EDITIO OFt NV 5 I~S SOET
DD ,JAN3 1473 DON NUNCLASSIFIED
SECURITY CLASSIFICATION OF THIS PAGE (11,.n Ii- X .m,,
UNCLASSIFIEDSECURITY CLAASIFICATION OF THIS PAGE (7w., Daa Emete4l
Block No. 20
ABSTRACT
Solubility maps in several solubility coordinate systems have been constructed todetermine regions of solubility for a methacrylate copolymer. The general methodologyfollowed was that of ASTM D 3132 Test Method for Solubility Range of Resins andPolymers. Over 90 individual solvents and solvent mixtures were tested as solvents forthe copolymer in the concentration range 5% - 7.5% w/v. A database on the solubilitycharacteristics of common solvents was created to store and utilize the information.Solvent maps were formulated using the solubility parameter-hydrogen bond index-dipolemoment system, the Hansen solubility parameter system, and the Teas fractional cohesionparameter system. Each system is primarily empirical in nature, but has varying degreesof theoretical justification.
UNCLASSIFIEDSECURITY CLASSIFICATION OF THIS PAGE (In,,, Dat ,
CONTENTS
Page
INTRODUCTION.......................................................1
EXPERIMENTAL
Materials.........................................................3Procedure........................................................3
RESULTS AND DISCUSSION
Database.........................................................4Solubility Phase Diagrams 5............................................5Calculation of Solubility Parameters . .................................... 11
CO NCLUSIO NS ....................................................... 12
ACKNOWLEDGEMENTS ................................................ 13
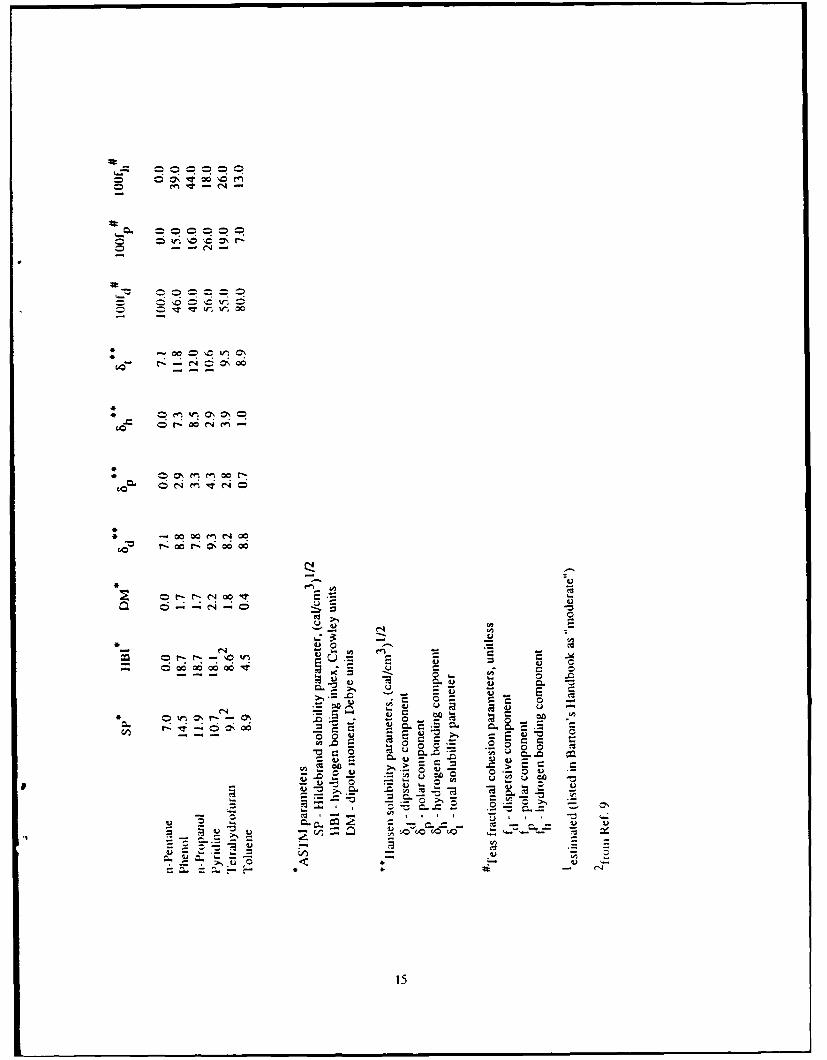
APPENDIX A. SOLUBILITY PARAMETERS FOR COMMONSOLVENTS (FROM REFERENCE 3) ...................................... 14
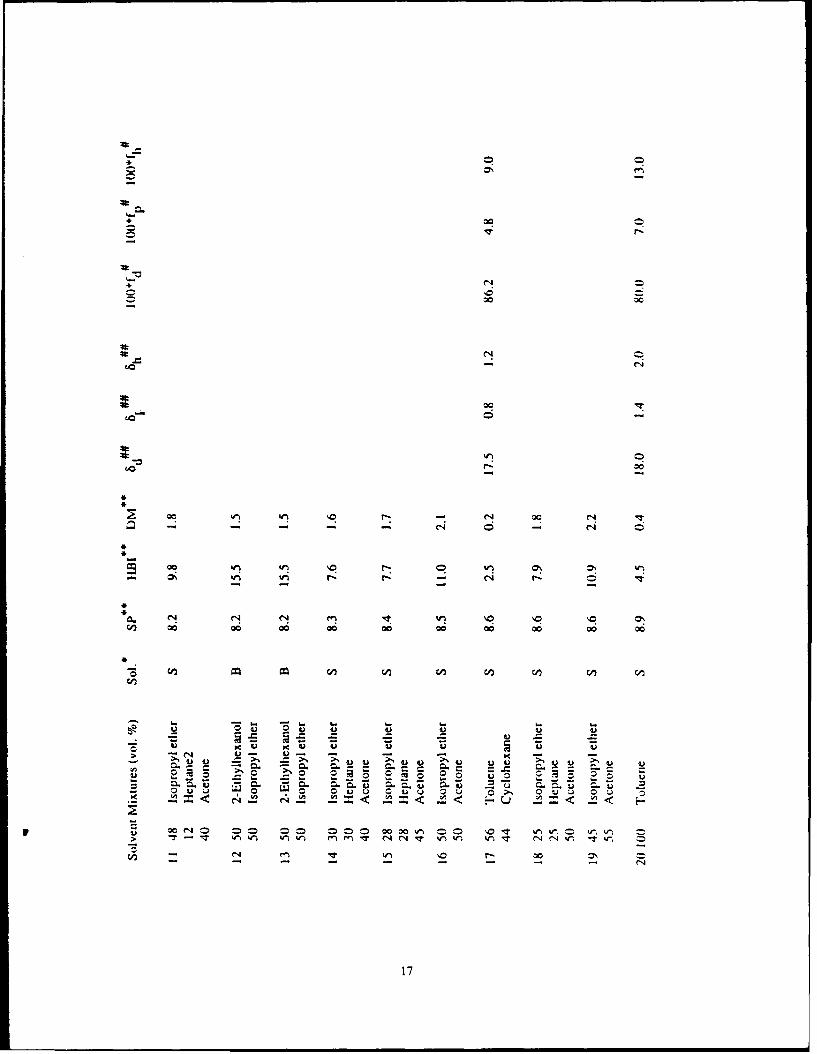
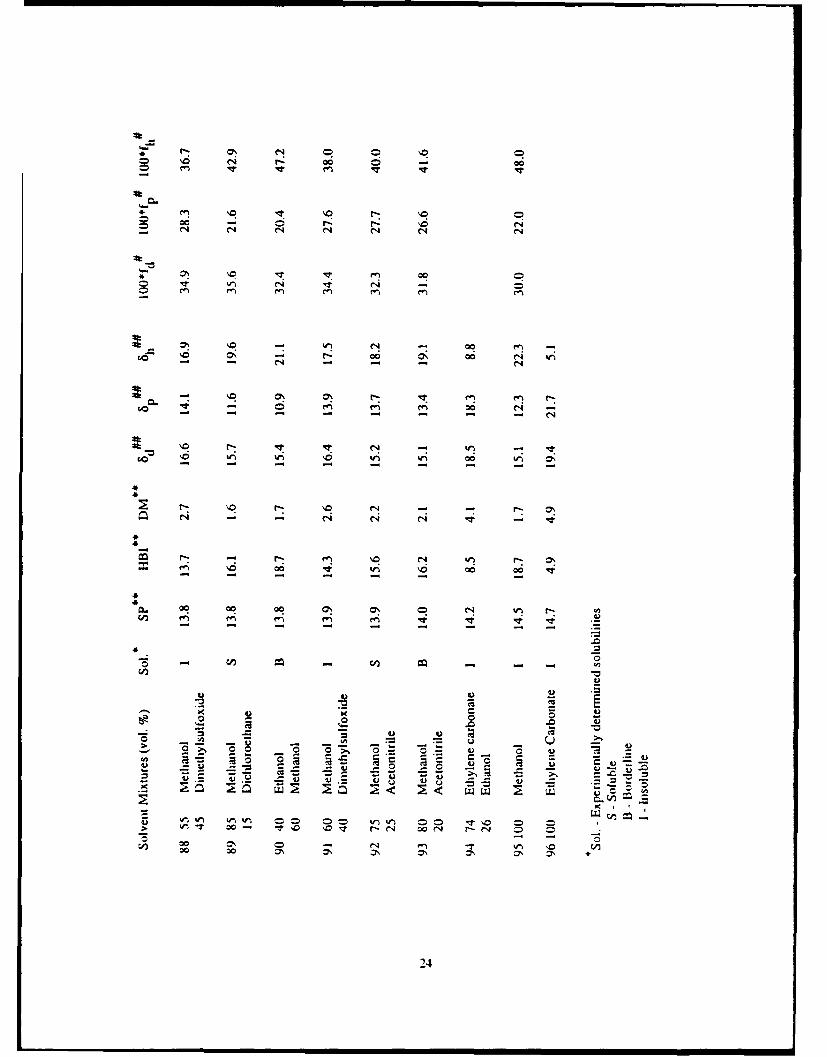
APPENDIX B. EXPERIMENTALLY DETERMINED COPOLYMER SOLUBILITIES ......... 16
Acoesston For
NTTIS GRA&I
DTIC TAB EUnannounced 51Justiticht lo
By-Distribution/
Avellabllt, y Codes69
Dist~
A e
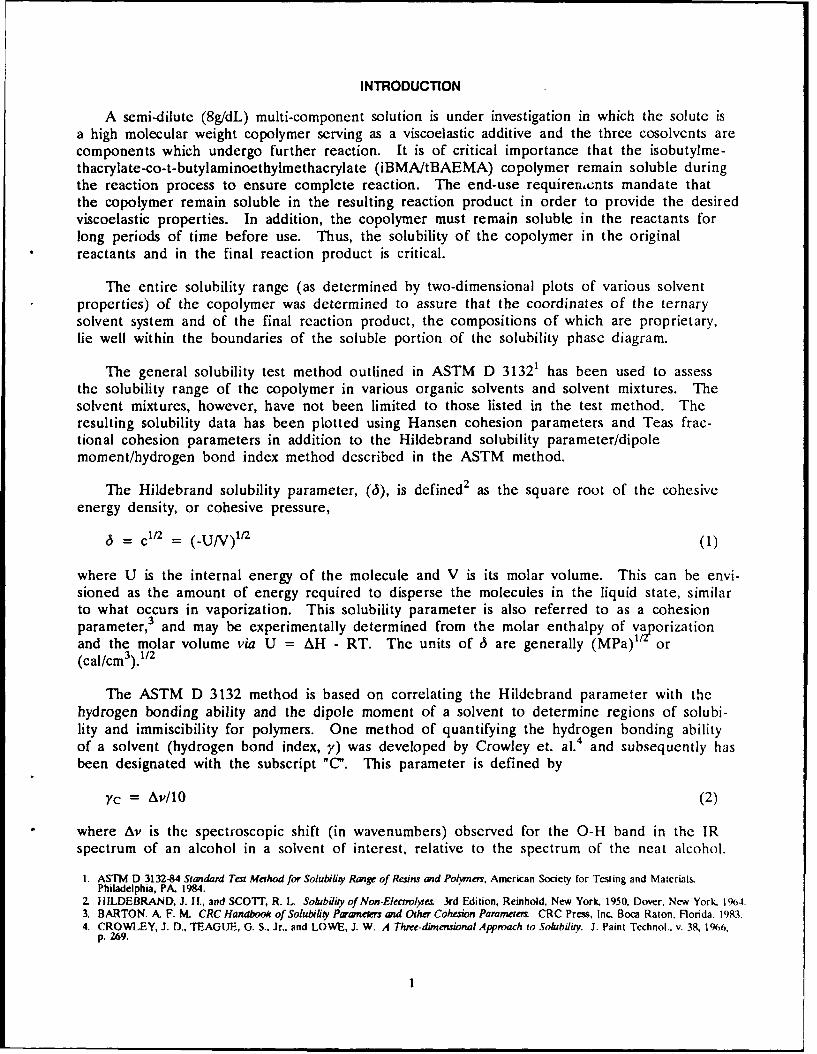
INTRODUCTION
A semi-dilute (8g/dL) multi-component solution is under investigation in which the solute isa high molecular weight copolymer serving as a viscoelastic additive and the three cosolvents arecomponents which undergo further reaction. It is of critical importance that the isobutylme-thacrylate-co-t-butylaminoethylmethacrylate (iBMA/tBAEMA) copolymer remain soluble duringthe reaction process to ensure complete reaction. The end-use requirements mandate thatthe copolymer remain soluble in the resulting reaction product in order to provide the desiredviscoelastic properties. In addition, the copolymer must remain soluble in the reactants forlong periods of time before use. Thus, the solubility of the copolymer in the originalreactants and in the final reaction product is critical.
The entire solubility range (as determined by two-dimensional plots of various solventproperties) of the copolymer was determined to assure that the coordinates of the ternarysolvent system and of the final reaction product, the compositions of which are proprietary,lie well within the boundaries of the soluble portion of the solubility phase diagram.
The general solubility test method outlined in ASTM D 31321 has been used to assessthe solubility range of the copolymer in various organic solvents and solvent mixtures. Thesolvent mixtures, however, have not been limited to those listed in the test method. Theresulting solubility data has been plotted using Hansen cohesion parameters and Teas frac-tional cohesion parameters in addition to the Hildebrand solubility parameter/dipolemoment/hydrogen bond index method described in the ASTM method.
The Hildebrand solubility parameter, (6), is defined 2 as the square root of the cohesiveenergy density, or cohesive pressure,
6 = ci = (-UIV) I (1)
where U is the internal energy of the molecule and V is its molar volume. This can be envi-sioned as the amount of energy required to disperse the molecules in the liquid state, similarto what occurs in vaporization. This solubility parameter is also referred to as a cohesionparameter,3 and may be experimentally determined from the molar enthalpy of vaporizationand the molar volume via U = AH - RT. The units of 6 are generally (MPa)1 or(cal/cm 3).1/ 2
The ASTM D 3132 method is based on correlating the Hildebrand parameter with thehydrogen bonding ability and the dipole moment of a solvent to determine regions of solubi-lity and immiscibility for polymers. One method of quantifying the hydrogen bonding abilityof a solvent (hydrogen bond index, y) was developed by Crowley et. al. 4 and subsequently hasbeen designated with the subscript "C". This parameter is defined by
7c = Av/10 (2)
where Av is the spectroscopic shift (in wavenumbers) observed for the 0-H band in the IRspectrum of an alcohol in a solvent of interest, relative to the spectrum of the neat alcohol.
1. ASTM D 3132-84 Standard Test Method for Solubility Range of Resins and Polymers, American Society for Testing and Materials.Philadelphia, PA. 1984.
2 HILDEBRAND, J. 11., and SCOTT, R. L. Solubility of Non-Electrolyte 3rd Edition, Reinhold, New York. 1950, Dover, New York. 1%4.3. BARTON A F. M. CRC Handbook of Solubifity Paraneters and Other Cohesion Parameters CRC Press, Inc, Boca Raton, Forida, 1983.4. CROWLEY, J. D., TEAGUE, G. S., Jr., and LOWE, J. W. A Three.dimensionalApproach to Solubility. J. Paint Technol., v. 38, 1906,
p. 269.
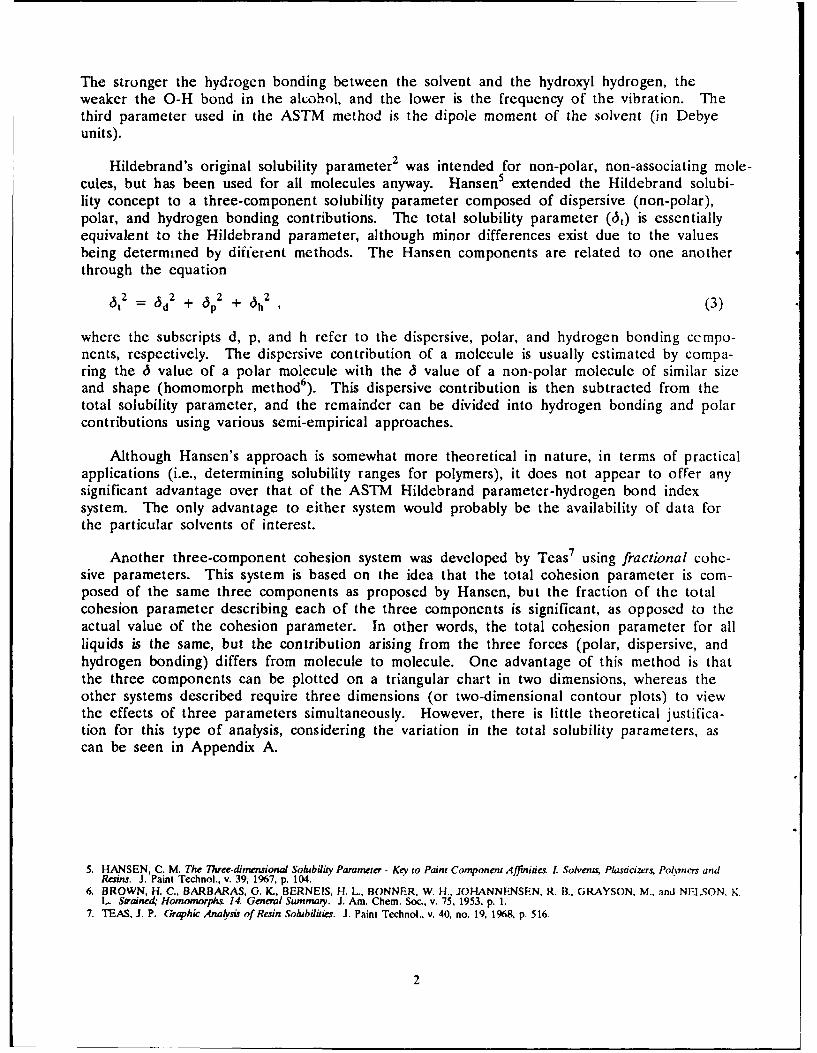
The stronger the hydrogen bonding between the solvent and the hydroxyl hydrogen, theweaker the O-H bond in the alcohol, and the lower is the frequency of the vibration. Thethird parameter used in the ASTM method is the dipole moment of the solvent (in Debyeunits).
Hildebrand's original solubility parameter 2 was intended for non-polar, non-associating mole-cules, but has been used for all molecules anyway. Hansen5 extended the Hildebrand solubi-lity concept to a three-component solubility parameter composed of dispersive (non-polar),polar, and hydrogen bonding contributions. The total solubility parameter (6 t) is essentiallyequivalent to the Hildebrand parameter, although minor differences exist due to the valuesbeing determined by difierent methods. The Hansen components are related to one anotherthrough the equation
6t 2 = 1d 2 + 6 p2 + 6h2 (3)
where the subscripts d, p, and h refer to the dispersive, polar, and hydrogen bonding cempo-nents, respectively. The dispersive contribution of a molecule is usually estimated by compa-ring the 6 value of a polar molecule with the 6 value of a non-polar molecule of similar sizeand shape (homomorph method6). This dispersive contribution is then subtracted from thetotal solubility parameter, and the remainder can be divided into hydrogen bonding and polarcontributions using various semi-empirical approaches.
Although Hansen's approach is somewhat more theoretical in nature, in terms of practicalapplications (i.e., determining solubility ranges for polymers), it does not appear to offer anysignificant advantage over that of the ASTM Hildebrand parameter-hydrogen bond indexsystem. The only advantage to either system would probably be the availability of data forthe particular solvents of interest.
Another three-component cohesion system was developed by Teas 7 using fractional cohe-sive parameters. This system is based on the idea that the total cohesion parameter is com-posed of the same three components as proposed by Hansen, but the fraction of the totalcohesion parameter describing each of the three components is significant, as opposed to theactual value of the cohesion parameter. In other words, the total cohesion parameter for allliquids is the same, but the contribution arising from the three forces (polar, dispersive, andhydrogen bonding) differs from molecule to molecule. One advantage of this method is thatthe three components can be plotted on a triangular chart in two dimensions, whereas theother systems described require three dimensions (or two-dimensional contour plots) to viewthe effects of three parameters simultaneously. However, there is little theoretical justifica-tion for this type of analysis, considering the variation in the total solubility parameters, ascan be seen in Appendix A.
5. HANSEN, C. M. The Three-dimnensional Solubility Parameter - Key to Paint Component Affinities. L. Solvents, Plasticizers, Polncs andResins. J. Paint Technol., v. 39, 1967, p. 104.
6. BROWN, H. C., BARBARAS, G. K., BERNEIS, H. L, BONNER, W. H JOHANNENSEN, R. B., GRAYSON. M., and NELSON. K.L Soraine4 Hornornorph& 14. General Sumnmary. J. Am. Chem. Soc., v. 75, 1953, p. 1.
7. TEAS, J. P. Graphic AnaAsis of Resin Solubiliies. J. Paint Technol., v. 40, no. 19, 1968, p. 516.
2
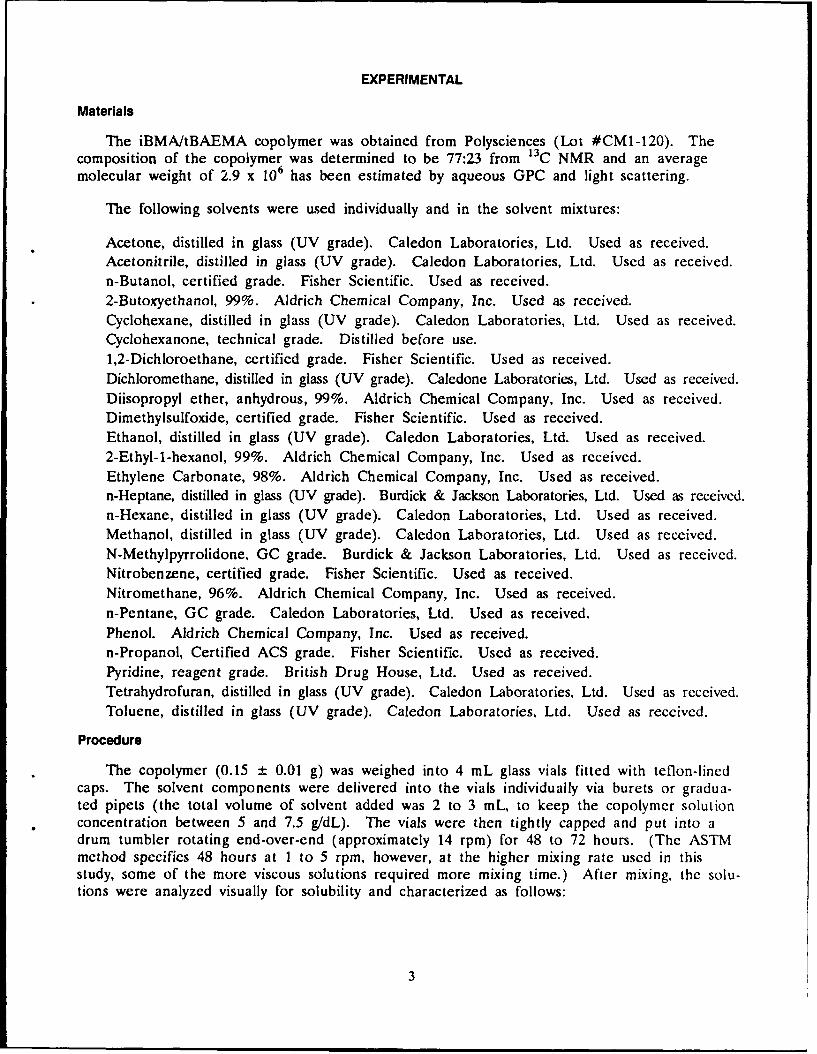
EXPERIMENTAL
Materials
The iBMA/tBAEMA copolymer was obtained from Polysciences (Lot #CM1-120). Thecomposition of the copolymer was determined to be 77:23 from 13C NMR and an averagemolecular weight of 2.9 x 10⁶ has been estimated by aqueous GPC and light scattering.
The following solvents were used individually and in the solvent mixtures:
Acetone, distilled in glass (UV grade). Caledon Laboratories, Ltd. Used as received.Acetonitrile, distilled in glass (UV grade). Caledon Laboratories, Ltd. Used as received.n-Butanol, certified grade. Fisher Scientific. Used as received.2-Butoxyethanol, 99%. Aldrich Chemical Company, Inc. Used as received.Cyclohexane, distilled in glass (UV grade). Caledon Laboratories, Ltd. Used as received.Cyclohexanone, technical grade. Distilled before use.1,2-Dichloroethane, certified grade. Fisher Scientific. Used as received.Dichloromethane, distilled in glass (UV grade). Caledone Laboratories, Ltd. Used as received.Diisopropyl ether, anhydrous, 99%. Aldrich Chemical Company, Inc. Used as received.Dimethylsulfoxide, certified grade. Fisher Scientific. Used as received.Ethanol, distilled in glass (UV grade). Caledon Laboratories, Ltd. Used as received.2-Ethyl-l-hexanol, 99%. Aldrich Chemical Company, Inc. Used as received.Ethylene Carbonate, 98%. Aldrich Chemical Company, Inc. Used as received.n-Heptane, distilled in glass (UV grade). Burdick & Jackson Laboratories, Ltd. Used as received.n-Hexane, distilled in glass (UV grade). Caledon Laboratories, Ltd. Used as received.Methanol, distilled in glass (UV grade). Caledon Laboratories, Ltd. Used as received.N-Methylpyrrolidone, GC grade. Burdick & Jackson Laboratories, Ltd. Used as received.Nitrobenzene, certified grade. Fisher Scientific. Used as received.Nitromethane, 96%. Aldrich Chemical Company, Inc. Used as received.n-Pentane, GC grade. Caledon Laboratories, Ltd. Used as received.Phenol. Aldrich Chemical Company, Inc. Used as received.n-Propanol, Certified ACS grade. Fisher Scientific. Used as received.Pyridine, reagent grade. British Drug House, Ltd. Used as received.Tetrahydrofuran, distilled in glass (UV grade). Caledon Laboratories, Ltd. Used as received.Toluene, distilled in glass (UV grade). Caledon Laboratories, Ltd. Used as received.
Procedure
The copolymer (0.15 t 0.01 g) was weighed into 4 mL glass vials fitted with teflon-linedcaps. The solvent components were delivered into the vials individually via burets or gradua-ted pipets (the total volume of solvent added was 2 to 3 mL, to keep the copolymer solutionconcentration between 5 and 7.5 g/dL). The vials were then tightly capped and put into adrum tumbler rotating end-over-end (approximately 14 rpm) for 48 to 72 hours. (The ASTMmethod specifies 48 hours at I to 5 rpm, however, at the higher mixing rate used in thisstudy, some of the more viscous solutions required more mixing time.) After mixing, the solu-tions were analyzed visually for solubility and characterized as follows:
3
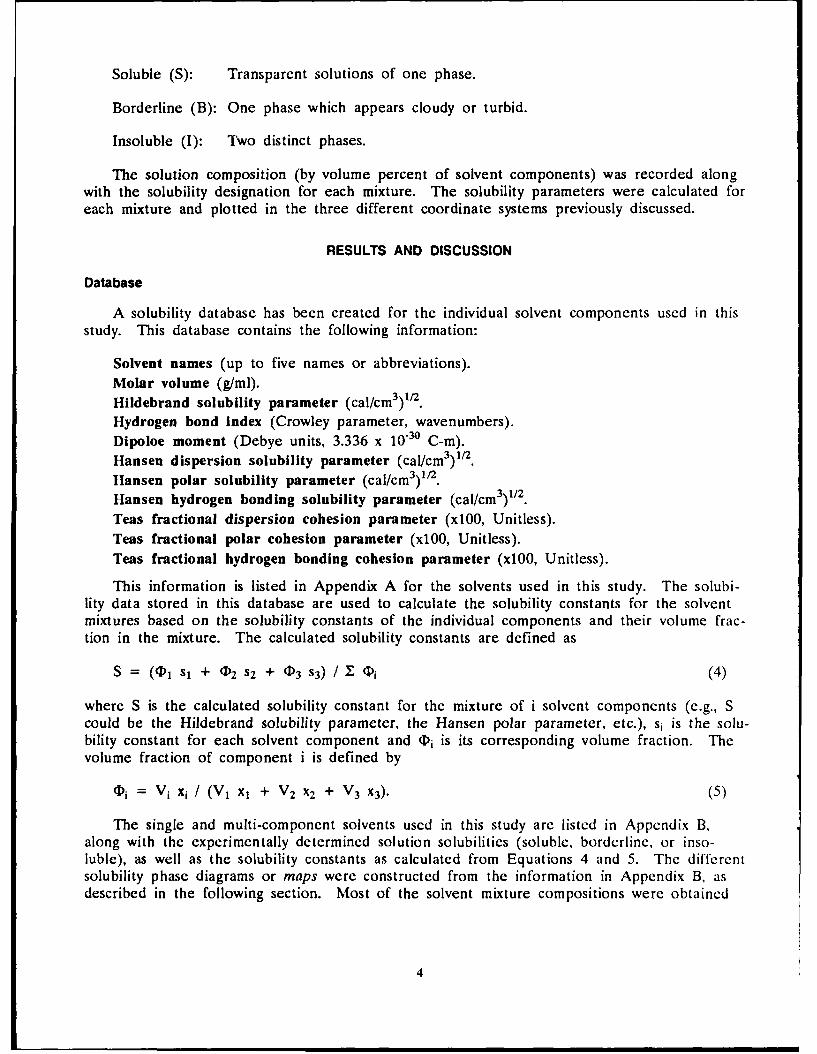
Soluble (S): Transparent solutions of one phase.
Borderline (B): One phase which appears cloudy or turbid.
Insoluble (I): Two distinct phases.
The solution composition (by volume percent of solvent components) was recorded alongwith the solubility designation for each mixture. The solubility parameters were calculated foreach mixture and plotted in the three different coordinate systems previously discussed.
RESULTS AND DISCUSSION
Database
A solubility database has been created for the individual solvent components used in thisstudy. This database contains the following information:
Solvent names (up to five names or abbreviations).Molar volume (g/ml).Hildebrand solubility parameter (cal/cm 3) 1/2.
Hydrogen bond index (Crowley parameter, wavenumbers).Dipoloe moment (Debye units, 3.336 x 10.30 C-m).Hansen dispersion solubility parameter (cal/cm 3) 1/2 .
Hansen polar solubility parameter (cal/cm 3 )'t 2 .Hansen hydrogen bonding solubility parameter (cal/cm 3)1 /2.Teas fractional dispersion cohesion parameter (xl00, Unitless).Teas fractional polar cohesion parameter (xl00, Unitless).Teas fractional hydrogen bonding cohesion parameter (xl00, Unitless).
This information is listed in Appendix A for the solvents used in this study. The solubi-lity data stored in this database are used to calculate the solubility constants for the solventmixtures based on the solubility constants of the individual components and their volume frac-tion in the mixture. The calculated solubility constants are defined as
S = (4), SI + I)2 S2 + 0D3 S3) / I (P i (4)
where S is the calculated solubility constant for the mixture of i solvent components (e.g., Scould be the Hildebrand solubility parameter, the Hansen polar parameter, etc.), si is the solu-bility constant for each solvent component and Di is its corresponding volume fraction. Thevolume fraction of component i is defined by
(Di = Vi Xi / (VI X1 + V2 x2 + V 3 x3). (5)
The single and multi-component solvents used in this study are listed in Appendix B,along with the experimentally determined solution solubilities (soluble, borderline, or inso-luble), as well as the solubility constants as calculated from Equations 4 and 5. The differcntsolubility phase diagrams or maps were constructed from the information in Appendix B, asdescribed in the following section. Most of the solvent mixture compositions were obtained
4

from a previous solubility studys on a similar polymer, poly(methylmethacrylate-co-isobutyla-crylate-co-ethylacrylate), and others were designed to fill in the undefined areas in the diagram.
Solubility Phase Diagrams
Figures 1 through 7 show two-dimensional plots of the various solubility parameters indi-cating general areas of solubility and insolubility. Figure 1, in which the hydrogen bond indexis plotted against the Hildebrand parameter, is the most common type of solubility map. Theparticular solvents and solvent mixtures in this study were chosen such that a closed solubilityregion would be determined on this type of plot (i.e., when areas on the plot were unde-fined, solvent mixtures with the appropriate coordinates were tested). Because the coordi-nates were chosen for a particular solubility system, the solubility regions on the other mapsare not as clearly defined. Figures 2 and 3 show the dipole moment versus the Hildebrandsolubility parameter and the hydrogen bond index, respectively. Figures 4 through 6 show thevarious Hansen solubility parameters (dispersion, hydrogen bonding, and polar) plotted in twodimensions.
20.0 Hydrogen bond index* Soluble ... . oO BorderLine 0
16.0 * Insoluble ,,
12.0 * "
8.0• ... • *
o] * .
4.0
0.0 , j
5.0 6.0 7.0 8.0 9.0 10.0 11.0 12.0 13.0 14.0 16.0 16.0
Hildebrand solubility parameter
Figure 1. Plot of hydrogen bond index versus Hildebrand solubility parameter.
8. SItUELY, W J., and SCOT, L. G. The Polwner Solubili.v Phase Diagram for the Methiltmethacr law Copolwner .,crvloid K125...ICSI-TM-80008, 1980.
5

Dipole Moment (Debye)6.06 Soluble
O02 Borderline6.0 *
Insoluble
4.0**
2.0
1.0
0.0 'E36.0 6. 0 8.0 9.0 10.0 11.0 12.0 13.0 14.0 15.0 16.0
Hildebrand solubility parameter
Figure 2. Plot of dipole moment versus Hildebrand solubility parameter.
Dipole Moment (Debye)7.0
Soluble
6.0 0 BorderlineInsoluble
5.0*
4.0 - *
3.0 *
2.0 e:. .
1.0 C
0.06-0.0 2.0 4.0 6.0 8.0 10.0 12.0 14.0 16.0 18.0 20.0
Hydrogen bond indexFigure 3. Plot of dipole moment versus hydrogen bond index.

Hansen polar parameter25.0 2 Soluble
o Borderine
20.0 * Insoluble
16.0-
10.0-
5.0- : * • •
0.0[
14.0 16.0 16.0 17.0 18.0 19.0 20.0
Hansen dispersion parameter
Figure 4. Plot of Hansen polar parameter versus dispersion parameter.
250Hansen hydrogen bonding parameter. Soluble
[] Borderline
20-0- Insoluble0.0.
* S
0.0 0'
14.0 15.0 1.0 17.0 18.0 19.0 20.0
Hansen dispersion parameter
Figure 4;. Plot of Hansen hydrogen bonding parameter versus dispersion parameter.
Hansn hyroge bodingpara ete

Hansen hydrogen bonding parameter25.0" SolubleO Borderline "
20.0- Insoluble
6 .
15.00
10.0 . . " "• 1
5.0 * • [] * ** *
0 .0 I I I I I I i I I I
0.0 2.0 4.0 6.0 8.0 10.0 12.0 14.0 16.0 18.0 20.0 22.0 24.0
Hansen polar parameter
Figure 6. Plot of Hansen hydrogen bonding parameter versus polar parameter.
Three-dimensional solubility maps are probably the most appropriate way to analyze asolubility region, although they are difficult to construct. By adding a third dimension to Figure 1(the dipole moment), Figures 1 through 3 could be combined for a single map. The same typeof analysis could be applied to the Hansen cohesion system with Figures 4 through 6. Altcrna-tively, contour plots can be drawn on two-dimensional maps. This requires more planning inselecting the solvent mixtures, however, noting that the third dimension values must be at certainfixed values. Neither three-dimensional nor contour plots have been constructed for this study.
Figure 7 shows the Teas three fractional cohesion parameters plotted on a triangular chart intwo dimensions, as explained in the Introduction. This type of analysis appears to be almostthree-dimensional in nature, but since the three-fractional parameters sum to unity, only two arcactually independent variables (e.g., fh = I - fd - fp). The presence of the third variable, how-ever, changes the values of the other two and, thus, it has some influence on the plot. Thepoints on a triangular plot such as this are determined by constructing lines of constant solubilityfor each axis by drawing lines at equal increments along the axis parallel to the adjoining axis, asshown in Figure 8. The intersection of these iso lines for each axis represents the point ofinterest. The point corresponding to ethyl ether with the coordinates (fe, fp, and 'h) equal to(0.64, 0.13, and 0.23) is indicated in Figure 8 by a circle.

0 1
.2 .8
.2 .8
.i Soluble .7
.4 Borderline .6h * Insoluble fp
.5
8 8 \
U .2SE . US .
0 .1 .2 .3 .4 .5 .6 .7 .8 .9 1fd
Figure 7. Plot of Teas fractional cohesion parameters on triangular plot.
0
.2 .8.
.3 .7
f .4 8 P.
.. 4
.7 .
.8 2
0 .1 .2 .3 .4 .5 .6 .7 .8 .9
fd
Figure 8. Plot of Teas tractional cohesion contours.
9

The experimental points in Figure 7 appear to cluster in the lower right hand corner of the plot, corre-sponding to a high dispersive content and little polar or hydrogen bonding contribution, and, indeed, this isto be expected for most liquids. A solubility border is roughly indicated by the line extending from (0.3,0.2, and 0.5) to (0.4, 0.5, and 0.1). The borders along the other two axes are not as clearly defincd.
Figure 9 shows the general solubility region, as depicted in Figure 1, along with the previouslydetermined9 duPont solubility map for poly(isobutytimethacrylate). The area of overlap for the twosolubility regions is large, presumably because the isobutylmethacrylate component is in large excess(75%) in the copolymer. The two components of the copolymer are both methacrylate esters, dif-fering only in their alkyl groups and one of the alkyl groups contains an amino group. Despite thesimilarities in the solubility maps, there is an area characterized by a high solubility parameter andintermediate to high hydrogen bonding, in which only the copolymer is soluble. Solvents whosecoordinates lie in this region are dimethylformamide, N,N-dimethylacetamide and N-methylpyrrolidonc.
According to the duPont 9 map, poly(iBMA) would not be soluble in these solvents; however, it isknown* that poly(iBMA) is soluble in both DMF and N-methylpyrrolidone. The reason for this dis-crepancy can probably be attributed to the three-dimensional nature of the solubility diagram. Thethird parameter of interest with regard to the solubility map is the dipole moment. The duPont sol-ubility map 9 for the iBMA polymer was determined for solvents of low to intermediate dipolemoment. Apparently, the solubility of poly(iBMA) is enhanced at higher values of the dipolemoment. This can be envisioned as larger contours at increasing dipole moment values. Inother words, poly(iBMA) is probably not soluble in liquids which have the same solubilityparameter and hydrogen bond index as DMF, but a smaller dipole moment.
Hydrogen bond index20.0
16.0 -
//
/
12.0-
8.0-
4.0-
0 .0 1 --1- . ...." '
5.0 6.0 7.0 8.0 9.0 10.0 11.0 12.0 13.0 14.0 16.0 16.0
Hildebrand solubility parameter
Figure 9. Plot of solubility contours for copolymer (-) and iBMA (....).
HONG, S. |1. and SlIUELY, W. J. U.S. Army Chemical Reaserch, Development. and Engineenng Center. Aberdcen Proving Ground,MD. Private Communication.
9. duPont de Nemours, E. 1. and Company. Sohent Formulatuing Mapsfiw Eh,acite Acrlic Resins. lulktin PA-12-174, ,.\- 3. Wilmington,DE, 1974.
10

Both the iBMA homopolymer and the iBMA/tBAEMA copolymer are soluble in mostalcohols, which typically have high hydrogen bond indices and intermediate solubility parame-ters (e.g., n-propanol, with a solubility parameter of 11.9 and a hydrogen bonding index of18.7). However, only the copolymer is soluble in ethanol, which has the same hydrogen bondindex but a higher solubility parameter (12.7). Methanol, on the other hand, which has thesame hydrogen bonding ability but an even higher solubility parameter of 14.5, is not asolvent for either the copolymer or the poly(iBMA). Even though the alcohols have similarstructure, apparently the increasing cohesion as the size of the n-alkyl groups decreases,changes the solubility properties significantly.
Calculation of Solubility Parameters
Since polymers usuilly cannot be volatilized without decomposing, solubility parameterscannot generally be calculated from heats of vaporization. Group contribution methods havebeen developed to calculate solubility parameters of polymers and have workcd quite well.Using the values of Hoy, 10 the solubility parameters of the two homopolymers poly(iBMA)and poly(tBAEMA) can be calculated by the following equation
d= d Z G / M (6)
where d is the density of the polymer, G is the group molar contribution for each functionalgroup in the polymer repeat unit, and M is the molecular weight of the repeat unit.
Figure 10 shows the repeat units of the copolymer and the group molar contributions foreach functional group. Assuming that the densities of the two homopolymers and the copo-lymer are the same (estimated to be 1.1 g/mL), the calculated solubility parameters for thepolymers are as follows:
poly(iBMA): 8.9
poly(tBAEMA): 9.2
poly(iBMA-co-tBAEMA), 75/25: 9.0
As is apparent from Figure 9 the copolymer has a slightly larger solubility parameter thanthe isobutylmethacrylate polymer, probably due to a higher solubility parameter for thetBAEMA component. This is confirmed by the above calculations. These calculations areprobably not too accurate, but the general trends can be seen. Indeed, if the tBAEMAhomopolymer and the copolymer have higher densities than the iBMA polymer, then the differ-ences between the calculated solubility parameters of the iBMA homopolymer and the copoly-mer would be even greater.
10. HOY, K. L J. Paint Technology, V. 42, 1970, p. 76.
11

iBMA, M = 142.20 g/mol tBAEMA, M = 185.27 g/mol
CH 3 CH 3
I CHCHI-CC
0
CH 2 H/CH2~H 2C
CH NH/\ /CH 3 CH 3 H3 C-C -CH 3
CH3
IBMA Group Contributions, G tBAEMA
3 -CH 3 (147.3) 42 -CH2 - (131.5) 31 >C< (32.03) 21 -COO- (326.58) 11 -CH<c (180.03) 00 -NH- (180.03) 1
1149.50 1554.37
Figure 10. Repeat unit structures for copolymer and groupmolar contributions to solubility parameter.
CONCLUSIONS
The solubility map for poly(iBMA-co-tBAEMA) of composition 77:23 has been determinedfor the coordinates of Hildebrand solubility parameter and hydrogen bond index. In addition,portions of the solubility regions have been determined in the Hansen solubility parametersystem, as well as in the Teas fractional cohesion parameter system. The range of solventsfor this copolymer is significantly greater than that of the homopolymer iBMA which is theco-monomer in greater abundance. The amino group in the tBAEMA unit apparentlyenhances the solubility of the copolymer in solvents of high solubility parameter and hydrocnbonding ability in which a simple alkylmethacrylate, such as poly(iBMA), is insoluble.
Solubility maps, or phase diagrams, can bc used successfully to determine areas of solubi-lity for polymers in selected solvents and solvent mixtures. The determination ol an exact
12

borderline for solubility/insolubility is not feasible using this method and, obviously, any sol-vent chosen for solution studies based on location on a solubility map should be checked forsolubility individually. A general solubility region, however, can be constructed to serve as aguideline for solvent selection, and this should be particularly helpful in the selection ofcosolvents in which one or more of the solvents individually is not a solvent. The methodused in this study to detect solubility of a polymer solution (visual inspection) is only an indi-cation of macroscopic solubility and is not necessarily an indication of solubility on the mole-cular level; i.e., polymer solutions can form microgel, which is transparent and would not bedetected visually. A more sophisticated test for solubility (such as light transmission) wouldproduce a more reliable test method.
A disadvantage of the solubility test method as applied in this study is the time-consu-ming, tedious nature of the work. On the other hand, the individual tasks are simple to do,and this makes this type of study an excellent choice for automation/robotics. The processesof weighing out a powder, titrating small volumes of liquid, and using some type of sensor totest for solubility are all tasks well suited for a laboratory robotics system. Possibilities forsolubility sensors include machine vision, measuring light transmission to determine transpa-rency, and sampling the solution to monitor concentration.
Future work in our laboratory may be directed toward automating this procedure.
ACKNOWLEDGEMENTS
The author wishes to acknowledge the U.S. Army Chemical Research Development andEngineering Center for financial support of this project and, in particular, Seok H. Hong andWendel J. Shuely for technical assistance.
The author also wishes to thank Mr. Andrew Sullivan for assistance in polymer solutionpreparation.
13

LUI
LU
LL
LA. .
a,=0 ) \0 7, 0 l t M -0 r- -,a
z
u')
z0
0
U. wO'w roooc 4 r m0 N V- 0 *-t- nm -T0 0r-
0.w
m O 0-00 0 000lu-
5 - -4-c--
C')
41
00
00
R 000"00
- r-0 - \00 0
W- 0r 0%.r- -,
o 00
u -o 0040 0
liZro.00
'15

LU
0
9 9 No
w 00 00 mr0
C0 a9
00o I, 00Q
w !2u4u
o - 0 0 0 -~ ell-
41
* 0 r- 0
00 W)
(14 003 v vl
- 00
- - - -- 0 17

0- -C - 06 ~- ~ ~ C (N -C4e ( N
00 0 00 ej 0 ~ ' ei 0
V)(N-
06 2 06 e
00-r
PC 00
> 00 0 0Z m -- W) fno 1V)o fn 00 r- 0 f- 0- f- 0U
rO NN (14 C N r- -4

*~ 06 02 0200 6 20
-C C'414
0 r- 06 00 - r- '
00 qe r- 02WIr- r- - 0 6 00 e ;
0 - 00 0 1 u 1 O 0 00
41
- ~ ~ ~ ~ r CL.~(4I 0 N 0
10.
>m 04) W) -r r )'Tt
0 0 00W-cn. .0 'IT 4
19.) 4) 4

00
* 'C 00 0 M
5 - 00n~ eq wl'7 -
* '702 0 ~ ' ~fn~14 vi00 t ~ '
'7 en' '
* 02 0 00 'C ON
C6 - ' '
~~00r- C14 31 000 ~qr 1
00 -- n n
4I
42

00
r- 00-
- -cc
0~v vi0r-~0% 0 06
r- r- 0-
0 0 00 f- NU, C,6 tri 06%
t ~
5 CZ u
0%) 00 N~ r M m fn f4 '-

00 N e
r- 'C 00
u U
0%J <'eJ - 0
> 0 0' fn 00I 'T.C) %r I IT~ -t1
00 V 0% 0
\4
2 r -0 022

en 00 rq n 4t
ON
een
0- r- oi f. f
0%~r r 0 '00
> -0u -0 'o 0
-j -j 7 w 7
00 - wl W-, 'T0ITW 00 w l
i-s 00 -t 0
r - 0 0 0' 0 0 *
23 -
v0 en -
Nl 00
0 0C
-- en C4 N N
06 00 0
OR NN0n ene
cn - 0
31 IL- 000N f
- 000 0
42

t
4E
*uuh
.U
bo 00
0- - 0
- (A
c 5 U u AU
L:
4 25
DISTRIBUTION LIST
No. ofCopies To
I Office of the Under Secretary of Defense for Research and Engineering,The Pentagon, Washington, DC 20301
Commander, U.S. Army Laboratory Command, 2800 Powder Mill Road, Adelphi,MD 20783-1145
1 ATTN: AMSLC-IM-TLI AMSLC-CT
Commander, Defense Technical Information Center, Cameron Station, Building 5,5010 DuKe Street, Alexandria, VA 22304-6145
2 ATTN: DTIC-FDAC
1 Metals and Ceramics Information Center, Battelle Columbus Laboratories,505 King Avenue, Columbus, OH 43201
Commander, Army Research Office, P.O. Box 12211, Research Triangle Park,NC 27709-2211
1 ATTN: Information Processing Office
Commander, U.S. Army Materiel Command, 5001 Eisenhower Avenue,Alexandria, VA 22333
1 ATTN: AMCLO
Commander, U.S. Army Materiel Systems Analysis Activity,Aberdeen Proving Ground, MD 21005
1 ATTN: AMXSY-MP, H. Cohen
Commander, U.S. Army Missile Command, Redstone Scientific Information Center,Redstone Arsenal, AL 35898-5241
1 ATTN: AMSMI-RD-CS-R/Doc1 AMSMI-RLM
Commander, U.S. Army Armament, Munitions and Chemical Command, Dover, NJ 078012 ATTN: Technical Library1 AMDAR-LCA, Mr. Harry E. Pebly, Jr., PLASTEC, Director
Commander, U.S. Army Natick Research, Development and Engineering Center,Natick, MA 01760
1 ATTN: Technical Library
Commander, U.S. Army Satellite Communications Agency, Fort Monmouth, NJ 077031 ATTN: Technical Document Center
Commander, U.S. Army Tank-Automotive Command, Warren, MI 48397-50001 ATTN: AMSTA-ZSK2 AMSTA-TSL, Technical Library
Commander, White Sands Missile Range, NM 880021 ATTN: STEWS-WS-VT
President, Airborne, Electronics and Special Warfare Board, Fort Bragg,NC 28307
1 ATTN: Library
Director, U.S. Army Ballistic Research Laboratory, Aberdeen Proving Ground,MD 21005
1 ATTN: SLCBR-TSB-S (STINFO)
Commander, Dugway Proving Ground, Dugway, UT 840221 ATTN: Technical Library, Technical Information Division
Commander, Harry Diamond Laboratories, 2800 Powder Mill Road, Adelphi, MD 207S31 ATTN: Technical Information Office
Director, Benet Weapons Laboratory, LCWSL, USA AMCCOM, Watervliet, NY 121:R91 ATTN: AMSMC-LCB-TLI AMSMC-LCB-RI AMSMC-LCB-RMI AMSMC-LCB-RP
Commander, U.S. Army Foreign SLience did TVt0Lhu( lqy uLIlt ', -,'0 /th Street. N.E.,
Charlottesviile, VA 22901-53963 ATTN: AIFRTC, Applied Technologies Branc h. Gertld S hterIqer
No. ofCopies To
Commander, U.S. Army Aeromedical Research Unit, P.O. Box 577, Fort Rucker,AL 36360
1 ATTN: Technical Library
Commander, U.S. Army Aviation Systems Command, Aviation Research and TechnologyActivity, Aviation Applied Technology Directorate, Fort Eustis, VA 23604-5577
1 ATTN: SAVDL-E-MOS
U.S. Army Aviation Training Library, Fort Rucker, AL 363601 ATTN: Building 5906-5907
Commander, U.S. Army Agency for Aviation Safety, Fort Rucker, AL 363621 ATTN: Technical Library
Commander, USACDC Air Defense Agency, Fort Bliss, TX 79916I ATTN: Technical Library
Commander, U.S. Army Engineer School, Fort Belvoir, VA 220601 ATTN: Library
Commander, U.S. Army Engineer Waterways Experiment Station, P. 0. Box 631,Vicksburg, MS 39180
1 ATTN: Research Center Library
Commandant, U.S. Army Quartermaster School, Fort Lee, VA 238011 ATTN: Quartermaster School Library
Naval Research Laboratory, Washington, DC 203751 ATTN: Code 58302 Dr. G. R. Yoder - Code 6384
Chief of Naval Research, Arlington, VA 222171 ATTN: Code 471
1 Edward J. Morrissey, WRDC/MLTE, Wright-Patterson Air Force, Base, OH 45433-6523
Commander, U.S. Air Force Wright Research & Development Center,Wright-Patterson Air Force Base, OH 45433-6523
1 ATTN: WRDC/MLCi WRDC/MLLP, M. Forney, Jr.I WRDC/MLBC, Mr. Stanley Schulman
National Aeronautics and Space Administration, Marshall Space Flight Center,Huntsville, AL 35812
1 ATTN: R. J. Schwinghammer, EHO1, Dir, M&P Lab1 Mr. W. A. Wilson, EH41, Bldg. 4612
U.S. Department of Commerce, National Institute of Standards and Technology,
Gaithersburg, MD 208991 ATTN: Stephen M. Hsu, Chief, Ceramics Division, Institute for Materials
Science and Engineering
I Committee on Marine Structures, Marine Board, National Research Council,2101 Constitution Ave., N.W., Washington, DC 20418
1 Librarian, Materials Sciences Corporation, Guynedd Plaza 11, Bethlehem
Pike, Spring House, PA 19477
1 The Charles Stark Draper Laboratory, 68 Albany Street, Cambridge, MA 02139
Wyman-Gordon Company, Worcester, MA 01601
1 ATTN: Technical Library
Lockheed-Georgia Company, 86 South Cobb Drive, Marietta, GA 30063
i ATTN: Materials and Processes Engineering Dept. 71-11, Zone 54
General Dynamics, Convair Aerospace Division, P.O. Box 748, Fort Worth, TX '6101I ATTN: Mfg. Engineering Technical Library
I Mechanical Properties Data Center, Belfor liof, rc., 13917 4. Bay Shore L1rlve.Traverse City, MI 49684
Director, U.S. Army Materials Technology Laboratory, Watertow, MA 1217,-0001
2 ATTN: SLCMT-TMLI Author
z a z . *I
I 0 I 0I MS(~ M
9 . 0ii CDC)0i ~~w - 2 at~~
I 0 E .
Oz 1 0, 3
C%1~ k018~~
-~= m = -I ~.01. Efo'!E A
2 0 C. _ .0 L.
D Ot. '. -S 0= I~
~'0' 00
alI III-- +, -E O
0. 0) c - ~0 O.2t0 1EC '*0~~., - S
I _
c 9 = &- 8 Go 04
2. CY 1 2 2<8.
O @ 'E' O
a Z 45-
-0 92 0. E 0-22. Xma~ s - 0 &
a. CLo _5 cI6 3j!W
:3 , - .2' C00a c--------------------------


![SOLUBILITY AND SOLUBILITY PRODUCT - Instruct · SOLUBILITY AND SOLUBILITY PRODUCT [MH 5; 16.1 & 16.2] • In this section we are going to consider the solubility of ionic solids in](https://static.fdocuments.us/doc/165x107/5ae1efb27f8b9a90138bbc8f/solubility-and-solubility-product-instruct-and-solubility-product-mh-5-161.jpg)