AD-A1Z 938 NAVAL POSTGRADUATE SCHOOL MONTEREY CA FIG AN ORGANIZATIONAL BEHAVIOR … · AD-A1Z 938...
224
AD-A1Z 938 NAVAL POSTGRADUATE SCHOOL MONTEREY CA FIG 5/9 AN ORGANIZATIONAL BEHAVIOR VIEW OF DEPARTMENT OF THE ARMY (0A) -ETC(U) DEC 81 M J GRISWOLD. K .J KEHOE UNCLASSIFIED N 13ffffffffffff
Transcript of AD-A1Z 938 NAVAL POSTGRADUATE SCHOOL MONTEREY CA FIG AN ORGANIZATIONAL BEHAVIOR … · AD-A1Z 938...

AD-A1Z 938 NAVAL POSTGRADUATE SCHOOL MONTEREY CA FIG 5/9AN ORGANIZATIONAL BEHAVIOR VIEW OF DEPARTMENT OF THE ARMY (0A) -ETC(U)DEC 81 M J GRISWOLD. K .J KEHOE
UNCLASSIFIED N
13ffffffffffff

111111.52
flj OCO Hi.25 O I t" f W 1.6
NAVAL POSTGRADUATE SCHOOL
*Monterey, California
I
THESISAN ORGANIZATIONAL BEHAVIOR VIEW OF
DEPARTMENT OF THE ARMY (DA) COMPTROLLERSHIP
by
Myron J. Griswoldand
Kevin J. Kehoe
December 1981
o-Advisors: K. Euske,.. R. Bobulinsk:
L*J Approved for public release; distribution unlimited.._J
L- DTICCa SELECTE.
1 APR1 1982 82 ,. 014'
SB
UNCLASS IFIEDSSCUMTY CLASSIFICATIOft OF T141S PAOS (01bo ole BataeJ________________
RZAD WSTRUCTrflNSREORT DOCUMENTAT10W PAGE 337033 COMPLEThNG FORM1. RE.R NUNO.7 OV ACCESSION "63 1. "ICIPIERTIS CATALOG3 Muimm
4. TITLE (and SuIo) S. TYPC OF REPORT G PeaIOO COVERED0
Master's thesis;An Organizational Behavior View of December 1981Department of the Army (DA) Al mawmmn OG REPORT Muma"
Comptrol lership_____________1. AUT1N01114 A.- CONTRACT ON GRANRT milmagoi(al
Myron J. GriswoldKevin J. Kehoe
6. PRFORING0111NIZTIONNAM ANDADDESS 10.PROGRAM ELEMENT. PRojECT. T ASKS. PRPOMIN ORNIRTIONN~5AN.ACOESSAREA 6 WORK UNIT MumeERS
Naval Postgraduate SchoolMonterey, California 93940
11. CONTROLLING OFFICE NAME AND0 ADDRESS it. REPORT DATE
Naval Postgraduate School December 1981Monterey, California 93940 13. 2u"16aiPAE
IT. NowE TONING A3ENCV WAMg a ACOS(if diffaig. hum ComflMo Ofice.) 1S. SECURITY CLASS. too Mile ,.w)
Unclassified
1CI. OOL
IS. OUST RIOUTIONS SATEMT W obo~e Raom)pApproved for public release; distribution unlimited.
17. DIST RI OUTION STATEMENT (of* 06 AbW8 0040141 IN BOO*& 20. it *ihm -01# mo Reave)
IS. SPEETA OE
It. PlEy WORDS (Cdon*mu so ,eogeo1010t os eso9 AE tmRVf A ek subb m w)
Department of the Army (DA) ComptrollershipComptroller Education
0 mtrolerTraining
20. A~gfrRACT (CepapRUW op form" sop HI fte.oes.m o Id"00r p 16 numer)
The purpose of the thesis is twofold: First, identify andrank in order of importance the specific Organizational behaviordeficiencies of junior level Department of the Army (DA) comp-trollers and develop an addendum to a proposed practical comp-) trollership course (PCC) in order to alleviate the deficiencies.Second, test the validity of the Pledger (1980) comptrollershipmodel for use within the DA. The Pledger comptrollership model isdesigned to aid comptrollers in analvgina f-hair ^Vr
DO I A )1473 toIomoorNOIov 6 sSOSSOLET2 UNCLASSIFIEDSEtCUoTyv CLASSIFICATION or Tig PAGE X&Im Data show")

UNCLASSIFIEDas* aft" 6VC A14110Ci or viols 0440040t o,* s ee"o,.,
0 - ABSTRACT (CONTINUED)
in terms of technology and structure, leadership, and decision-making. Based on the analytical results the comptrollerscould then take appropriate courses of action. Data obtainedfrom a questionnaire sent to DA comptrollers verified theexistence of deficiencies in eight major organizationalbehavior areas and the validity of the Pledger comptrollershipmodel. Based on the data analysis the authors recommendthat the DA should adopt and institute the 24-hour proposedPCC addendum and adopt the Pledger comptrollership model foruse within the comptrollership community to facilitate thejob orientation process.
I t CodesAyI I" rd u
D" 43 2 NCLA--.F. na,. .........
S14 2-4)14-6801 hgeg'e@ ti

Approved for public release; distribution unlimited.4I.An Organizational Behavior View of
Department of the Army (DA) Comptrollership
by
Myron J. GriswoldCaptain, United States Army
B.S., United States Military Academy, 1973
and
Kevin J. KehoeCaptain, United States Army
B.S., Syracuse University, 1975
Submitted in partial fulfillment of therequirements for the degree of
MASTER OF SCIENCE IN MANAGEMENT
from the
NAVAL POSTGRADUATE SCHOOL
December 1981
A
Authors:
Approved by: ____________________
-- Co-Thesis Advisor
Chaif n, epartme f Administrative ciences
Dean o Information an Policy Sclences
3

ABSTRACT
The purpose of the thesis is twofold: First, identify
and rank in order of importance the specific organizational
behavior deficiencies of junior level Department of the Army
(DA) comptrollers and develop an addendum to a proposed
practical comptrollership course (PCC) in order to alleviate
the deficiencies. Second, test the validity of the Pledger
(1980) comptrollership model for use within the DA. The
Pledger comptrollership model is designed to aid comptrollers
in analyzing their organizations in terms of technology and
structure, leadership, and decision-making. Based on the
analytical results the comptrollers could then take appropri-
ate courses of action. Data obtained from a questionnaire
sent to DA comptrollers verified the existence of deficiencies
in eight major organizational behavior areas and the validity
of the Pledger comptrollership model. Based on the data analy-
sis the authors recommend that the DA should adopt and insti-
tute the 24 hour proposed PCC addendum and adopt the Pledger
comptrollership model for use within the comptrollership
community to facilitate the jbb orientation process.
4

TABLE OF CONTENTS
I. INTRODUCTION------------------------------------------ 14
A. BACKGROUND/PROBLEM DEFINITION-------------------- 14
B. OBJECTIVE----------------------------------------- 17
C. METHOD AND SCOPE---------------------------------- 17
D. THESIS CHAPTER SUMMARY--------------------------- 19
I. THE JOB PREPARATION OF JUNIOR LEVEL COMPTROLLERSAND THE PLEDGER COMPTROLLERSHIP MODEL--------------- 21
A. INTRODUCTION-------------------------------------- 21
B. OVERVIEW OF DA COMPTROLLER COMMUNITY-----------
C. REVIEW OF TUJLLY AND BATISTE'S RESEARCH----------28
1. Purpose, Scope, Methodology,Analysis, and Findings---------------------- 28
2. Critique of Findings------------------------ 33
D. REVIEW OF PLEDGER'S RESEARCH-------------------- 34
1. The Pledger Comptrollership model---------- 34
a. General--------------------------------- 34
b. Technology/Structure Characteristics - 36
(1) Definition of Technology 3and Structure----------------------3
(2) Thompson, Woodward, Perrowand Rousseau----------------------- 38
(3) Burns and Stalker------------------ 45
(4) Summary---------------------------- 49
c. Leadership Component-------------------- 50
(1) Choosing a Leadership Style so
(2) Leadership Styles Available --- 52
d. Decision-Making Situations /Methods -- 54
5

2. Method, Analysis, and Findings ------ 58
3. Critique of Findings----------------------- 5
E. SUMMAY----------------------------------------- 60
II.RESEARCH METHOD------------------------------------- 63
A. INTRODUCTION------------------------------------ 63
B. THE QUESTIONNAIRE------------------------------- 64
1. Purpose------------------------------------- 64
2. Design-------------------------------------- 64
a. Background Questions-------------------- 67
b. The Pledger Comptrollership Model 6Questions-------------------------------6
(1) Technology and StructureQuestions-------------------------- 67
(2) Leadership Questions---------------70
(3) Decision-Making Questions-------- 7
(4) Comptroller Problems and AdviceQuestions-------------------------- 76
c. Job Preparation of Junior LevelComptroller Questions------------------- 77
3. Summary------------------------------------- 78
C. DATA ANALYSIS PLAN------------------------------ 79
1. Pledger Comptrollership Model---------------79
a. Analysis of Technology andStructure Data-------------------------- 79
(1) Hypothesis 1----------------------- 79
(2) Hypotheses 2,3, and 4--------------81
b. Analysis of Leadership Data------------ 87
(1) Hypotheses 5 and 6------------------87
(2) Hypotheses 7 and 8------------------88
6
c. Analysis of Decision-Making Data,
Hypothesis 9---------------------------- 89
2. Job Preparation of Junior LevelComptrollers-------------------------------- 95
3. Summary------------------------------------- 95
D. DATA PREPARATION-------------------------------- 96
1. General------------------------------------- 96
2. The Sample---------------------------------- 96
3. Summary of Descriptive Statistics---------- 99
E. SUMMARY----------------------------------------- 109
IV. RESULTS OF DATA ANALYSIS--------------------------- 111
A. INTRODUCTION------------------------------------ 111
B. THE PLEDGER COMPTROLLERSHIP MODEL--------------- 111
1. Results of Technology and StructureData Analysis------------------------------ 111
a. Hypothesis 1--------------------------- 111
b. Hypotheses 2,3, and 4------------------ 115
2. Results of Leadership Data Analysis--------- 127
a. Hypotheses 5 and 6--------------------- 127
b. Hypothesis 7--------------------------- 130
c. Hypothesis 8--------------------------- 130
3. Results of Decision-Making DataAnalysis, Hypothesis 9--------------------- 132
C. JOB PREPARATION OF JUNIOR LEVEL COMPTROLLERS -139
1. organizational Behavior Deficiencies-----139
2. Recommendations---------------------------- 141
D. SUMMARY----------------------------------------- 141
V. RESULTS, DISCUSSION AND CONCLUSIONS----------------- 146
A. INTRODUCTION------------------------------------ 146
7

B. THESIS OBJECTIVES ---------------------------- 146
C. REVIEW OF THE PLEDGER COMPTROLLERSHIP MODEL -- 146
D. DISCUSSION OF DATA ANALYSIS RESULTS ---------- 147
1. The Pledger Comptrollership Model -------- 147
a. Technology and Structure Data -------- 147
b. Leadership Data ---------------------- 149
c. Decision-Making Data ----------------- 151
2. Job Preparation of Junior LevelComptrollers ----------------------------- 152
E. CONCLUSIONS/RECOMMENDATIONS ------------------ 154
1. The Pledger Comptrollership Model -------- 154
2. Job Preparation of Junior Level DAComptrollers ----------------------------- 155
F. LIMITATIONS OF AUTHORS'RESEARCH ANDRECOMMENDATIONS FOR FUTURE STUDY ------------- 155
1. The Pledger Comptrollership Model -------- 155
2. Job Preparation of Junior LevelComptrollers ------------------------------ 158
G. SUMMARY -------------------------------------- 159
APPENDIX A: COMPTROLLER RESPONSIBILITIES -------------- 160
APPENDIX B: LEADERSHIP STYLES AVAILABLE --------------- 163
APPENDIX C: DECISION-MAKING PROPOSITIONS -------------- 165
APPENDIX D: QUESTIONNAIRE ----------------------------- 167
APPENDIX E: TECHNOLOGY VS. STRUCTURE RELATIONSHIPS 174
APPENDIX F: ADVICE TO NEW COMPTROLLER/DCSRM INFIRST 100 DAYS OF ASSIGNMENT -------------- 196
APPENDIX G: PROPOSED USAREUR PECULIAR COURSE FOR DAJUNIOR LEVEL COMPTROLLERS ----------------- 203
APPENDIX H: INTERVIEWS -------------------------------- 204
8

APPENDIX I: TULLY AND BATISTE'S PROPOSED PRACTICALCOM4PTROLLERSHIP COURSE (PCC)----------------206
APPENDIX J: ADDENDUM TO TULLY AND BATISTE'S PROPOSEDPRACTICAL COMPTROLLERSHIP COURSE (PCC) ---- 208
BIBLIOGRAPHY---------------------------------------------- 211
INITIAL DISTRIBUTION LIST--------------------------------- 215
9

LIST OF FIGURES
II-1 COA Goals -------------------------------------- 23
11-2 Comptroller Functions -------------------------- 24
11-3 Flow of Comptroller Functions ------------------ 26
11-4 Configuration of a DA Comptroller Organization - 27
11-5 Deficiencies of Junior Level Comptrollers ------ 31
11-6 The Pledger Comptrollership Model -------------- 35
11-7 Summary of Thompson's Research Findings on theRelationships Between Technology and Structure - 40
11-8 Summary of Woodward's Research Findings on theOrganizational Structures of Successful Firms -- 41
11-9 Perrow's Classification of Types ofTechnologies ----------------------------------- 43
II-10 Summary of Perrow's Research Findings on theRelationships Between Technology and Structure - 44
II-11 Rousseau's Matrix of Technology/StructureRelationships ---------------------------------- 46
11-12 Definitions of Rousseau's Technology Variables 47
11-13 Definitions of Rousseau's Structure Variables -- 48
11-14 Continuum of Leadership Behavior --------------- 53
11-15 Hermann's Decision-Making Situations Cube ------ 55
I
10
&

LIST OF TABLES
III-1 Key to Comptroller Questionnaire --------------- 65
111-2 Summary of Questions Selected from Fleishman'sLeadership Opinion Questionnaire --------------- 72
111-3 Summary of Relationships Between Decision-Making Techniques and Associated Decision-Making Methods --------------------------------- 75
111-4 Summary of Subsamples and Their AbbreviatedDesignations ----------------------------------- 82
111-5 Summary of Variables and Background ComptrollerInformation Used in Testing Hypotheses 2Through 4 -------------------------------------- 84
111-6 Procedural Steps for Determining RelationshipsBetween A Particular Decision-Making Methodand Its Predicted and Actual Utilization ------- 90
111-7 Summary of Data Analysis Plan ------------------ 97
111-8 Number and Percentage of ComptrollerRespondents from the Different DA MACOMs ------- 100
111-9 Summary of Descriptive Statistics for theBackground Questions (Ql-QI0) ------------------ 101
III-10 Summary of Descriptive Statistics for thePledger Comptrollership Model (Qll-Q37) -------- 104
III-11 Summary of Descriptive Statistics for theJob Preparation of Junior Level Comptrolle.Questions (Q40-Q42) ---------------------------- 108
IV-i Summary of Systematic Relationships BetweenTechnology and Structure Variables ------------- 112
IV-2 Summary of Variable Means and BackgroundComptroller Information Used in Test..ngHypotheses 2 Through 4 ------------------------- 116
IV-3 Comptroller Problems and Advice to NewComptrollers ----------------------------------- 123
IV-4 Summary of Leadership Data Pertaining toHypotheses 5 and 6 ----------------------------- 128
11

IV-5 Summary of Leadership Data Pertaining toHypothesis 7 ----------------------------------- 131
IV-6 Summary of Leadership Data Pertaining toHypothesis 8 -----------------------------------
IV-7 Summary of Decisicn-Making Data Pertainingto Hypothesis 9 --------------------------- 137
IV-8 Organizational Behavior Deficiencies ofJunior Level Comptrollers ---------------------- 140
IV-9 Recommendations of DA Comptrollers RegardingImprovement of the Training and/or Performanceof Junior Level DA Comptrollers ---------------- 142
12

ACKNOWLEDGMENTS
First, the authors wish to acknowledge, with sincere
appreciation, the cooperation and assistance of the 136
Department of the Army (DA) comptrollers who took the time
to complete and return the authors' questionnaire.
Next, the authors wish to acknowledge, with sincere
appreciation the outstanding work of Mrs. Deborah E. Griswold
who spent innumerable hours typing, proofreading and retyping
the smooth draft of this thesis.
Finally, we owe a debt of gratitude to Assistant Professors
Robert A. Bobulinski and K.J. Euske who advised us in this
research effort.
13

I. INTRODUCTION
A. BACKGROUND/PROBLEM DEFINITION
Lynn (1974) and Pledger (1980) contend that military
comptrollers have to develop both the necessary technical
and human skills required of managers. The human skills
fall into such areas as leadership, personnel relations and
communication. The technical skills fall into such tradi-
tional areas as budgeting, accounting and payroll.
The Department of the Army (DA) places emphasis on comp-
trollership personnel developing their technical skills in
these traditional areas. This is evident upon examination
of the makeup of the primary practical comptrollership course
(PCC) taught to DA fiscal students. The Military Comptroller-
ship Course (MCC), taught at the DA's Institute for Adminis-
tration (USAIA) at Fort Benjamin Harrison, Indiana, devotes
the entire 180 hours of instruction to technical subject areas
(USAIA, 1979]. The authors recognize the importance of master-
ing these vital traditional skill areas, but feel strongly that
DA financial managers must also possess a sound understanding
of the human or organizational behavior aspects of comptroller-
ship in order to perform their jobs effectively.
A thesis by DA Captains Robert B. Tully and John R. Batiste,
entitled The Development of the Junior Level Army Financial
Manager, contends there is a need for improving the technical
skills of the junior level DA comptroller to better meet the
14
requirements of their initial financial management assign-
ments. Junior level DA financial managers are those military
off icers serving their first tour in the comptrollership
specialty field. Tully and Batiste devised a PCC to help
eliminate the major technical shortcomings identified in their
research [Tully and Batiste, 19801. As in Tully and Batiste's
(1980) research, the terms junior level DA financial manager
and junior level DA comptroller will be used interchangeably
in this thesis.
it is evident from examination of Tully and Batiste's
empirical data that, in addition to technical shortcomings,
serious organizational behavior deficiencies also exist.
Specifically, the comptrollers responding to Tully and Batiste's
questionnaire indicated that leadership, personnel relations,
staff procedures, and the ability to speak and write effec-
tively are areas in which a significant number of junior level
comptrollers experience difficulty.
The presence of the non-technical deficiencies identified
by Tully and Batiste within DA comptroller organizations indi-
cated to the authors of this thesis that a need exi.sts for
improving the human skills of the junior level DA financial
manager. Therefore, the authors focused one part of their
research effort on verifying and correcting the identified
organizational behavior deficiencies manifested by junior
level DA comptrollers.
If a sound understanding of the organizational behavior
aspects of comptrollership is important for the junior level
15

Army financial managers, it is even more important for DA
comptrollers since they have greater managerial responsibili-
ties. A thesis by Departent of the Navy (USN) Lieutenant
James E. Pledger, entitled An organizational Analysis Model
For Navy Field-Level Comptrollership, presents a model that
incorporates some of the important organizational behavior
aspects of comptrollership and provides a basis for the second
part of the authors' research. Pledger's model is designed to
be used by United States Department of Navy comptrollers dur-
ing their initial months on the job to help ease the transition
process. The Pledger comptrollership model is designed to
aid comptrollers as they analyze their organizations in terms
of technology and structure, leadership, and decision making.
Based on the analytical results the comptrollers could then
take appropriate courses of action.
The need for a DA related "comptrollership model" such as
the one discussed above is particularly great for DA comptrol-
lers because of the DA's Officer Personnel Management System
(OPMS) and assignment policies. Many DA officers rotate into
two or three year comptroller tours after serving a previous
assignment in a totally unrelated primary specialty such as
Armor or infantry [HQ, DA, 1977]. If the Pledger comptroller-[
ship model could be validated within the DA, it could be used
to facilitate the transition process for comptrollers during
their initial months in the new assignment. Therefore, the
authors focused the second part of their research effort on
validating the Pledger comptrollership model for use within
the DA.
16

B. OBJECTIVE
The first objective of this thesis is to identify and
rank in order of importance the specific organizational be-
havior deficiencies of junior level DA financial managers and
develop an addendum to Tully and Batiste's proposed PCC.
The purpose of the addendum is to alleviate the main organi-
zational behavior deficiencies exhibited by junior level DA
comptrollers.
The seconu major objective is to test the validity of
the Pledger comptrollership model for use within the DA. It
is the authors' contention that the model, if validated and
then used by the DA, will facilitate the crucial transition
period of the "first one hundred days" (Bobulinski, 1979] in
a new comptroller's assignment.
C. METHOD AND SCOPE
A questionnaire was developed and sent to comptrollers
from a large representative sample of DA commands in the
continential United States (CONUS) and United States Army
Europe (USAREUR).
The first part of the questionnaire was designed to gather
data for testing the validity of the Pledger comptrollership
model. The authors expanded on and refined Pledger's research
by analyzing subsamples of the data such as military officer
comptrollers, civilian comptrollers, military officer comp-
trollers with a finance or comptroller primary specialty, and
military officer comptrollers with a non-finance or non-comp-
troller primary specialty. Other subsamples included
17

comptrollers from different DA MACOMs such as USAREUR, Material
Development and Readiness Command (DARCOM), Forces Command
(FORSCOM), Training and Doctrine Command (TRADOC) and the
National Guard Bureau (NGB).
The analysis was conducted using the Statistical Package
for the Social Sciences (SPSS). Bivariate correlations were
performed between the technological and structural variables
existing in comptroller organizations. The authors also ad-
hered to Pledger's recommendation to perform partial correla-
tion analysis in order to identify separate effects of all
technology variables on the structure variables.
The comptrollers' general comments concerning problem
areas encountered and advice to the new comptroller were re-
viewed through content analysis.
The leadership segment of the questionnaire was structured
to indicate what types of leadership styels comptrollers em-
ploy. The responses to the leadership questions were struc-
tured to provide a self-report of the degree to which DA
comptrollers perform both the socio-emotional and task-related
leadership functions.
The questions relating to decision-making provided the
data for a table that summarizes the relationship between a
particular decision-making method and its predicted and actual
utilization.
The last part of the questionnaire was designed to obtain
the comptroller's comments on and recommendations for minimizing
any organizational behavior deficiencies that junior level DA
18

financial managers exhibit during their first tour in the
comptrollership specialty field. The authors categorized
and evaluated the responses from all the comptrollers and
developed an addendum to Tully and Batiste's proposed PCC.
The addendum contains relevant organizational behavior infor-
mation and material that will better prepare the new officer
for duties within the DA comptrollership field.
D. THESIS CHAPTER SUMMARY
Chapter II presents a brief overview of the DA comptroller
community. It also includes a summary of Tully and Batiste's
and Pledger's research and findings. The summary of Pledger's
research includes a review of the literature associated with
the components of the Pledger comptrollership model. The
chapter provides a critique of their findings and states how
this study attempts to augment the theory, method and analysi.s
of the two previous theses.
Chapter III discusses the research methods used in identi-
fying the specific organizational behavior deficiencies of
the junior level DA comptroller and testing the Pledger comp-
trollership model. This includes a detailed description of
the questionnaire, data analysis plan and data preparation
process. The chapter also includes three tables that sum-
marize the responses to the questionnaires relating to back-
ground information, the Pledger comptrollership model and the
job preparation of junior level comptrollers.
Chapter IV presents the results of the data analysis.
19

Chapter V presents a discussion of the results pertain-
ing to the Pledger comptrollership model and the job prepara-
tion of junior level comptrollers. The chapter presents the
conclusions and recommendations of this thesis. The chapter
also includes a discussion of the limitations of this research
and a presentation of recommendations for future study.
The addendum to Tully and Batiste's proposed PCC is pre-
sented as a separate appendix.
20

II. THE JOB PREPARATION OF JUNIOR LEVEL COMPTROLLERSAND THE PLEDGER COMPTROLLERSHIP MODEL
A. INTRODUCTION
In this chapter a brief overview of the Department of
the Army (DA) comptroller cozmunity is presented. The over-
view includes a description of the origin, responsibilities,
functions and organization of the DA comptroller community.
Next, Tully and Batiste's and Pledter's research and findings
are summarized. The summary of Pledger's research includes a
review of the relevant literature associated with the various
components of his "comptrollership model." Tully and Batiste's
and Pledger's findings are critiquedand how this study at-
temptes to augment the theory, method and analysis of the two
previous theses is discussed.
B. OVERVIEW OF DA COMPTROLLER COMMUNITY
Title IV of the National Security Act of 1947 directed the
Comptroller of the Department of Defense (DOD) to establish
those policies and procedures relating to budgeting, account-
ing, reporting auditing, expenditure and collection of funds
ttSAIPRM, 19801. In response to this law, the Office of the
Army Comptroller was established by DA Circular Number 2, dated
2 January 1948. The purpose was to improve the utilization of
modern management techniques in the administration of the DA
and to employ accounting procedures more effectively in con-
trolling both operations and costs. Congressional approval
21

of Public Law 216 in August 1949 gave a firm statutory basis
for the responsibilities of comptrollers in DOD and in each of
the three uniformed services [HQ, DA, 1976].
Among the lessons learned from World War II was the need
for modern management techniques to promote the efficient and
effective use of resources. It was recognized that military
expenditures would continue to consume a large proportion of
the national income.
As a result, the financial management community was to be-
come a functional organization, ultimately impacting upon
every command, installation and activity within the DA (Tully
and Batiste, 1980]. Under the present organization the Comp-
troller of the Army (COA) is responsible concurrently to the
Assistant Secretary of the Army (Installations, Logistics and
Financial Management) and the Army Chief of Staff. The COA
has general staff responsibility for independent review and
analysis of DA programs, and analysis of major DA commands.
Other general staff responsibilities include accounting, fis-
cal auditing, the budgetary process, statistical reporting,
development of the DA Resource Management System (RMS), and
independent analysis of DA organization, functions and proce-
dures [USAIA, 1978]. As of April 1976, the COA had ten goals
for the effective functioning of the DA Comptroller commi':ity.
A listing of the COA's goals is presented in Figure II-1. A
summary of integrated comptroller functions, appropriate for
all Army comptroller organizations, is outlined in Figure 11-2.
The performance of these integrated comptroller functions
22t

Goal 1. Improvement in the Development, Defense andExecution of the Budget.
Goal 2. Improvement of the Financial Management of theArmy Customer Order Program.
Goal 3. Development and Maintenance of an Effective andEfficient Independent Cost Analysis Program.
Goal 4. Development and Maintenance of Pay and DisbursingSystems that are Efficient and Responsive to theNeeds of the Individual and the Army.
Goal 5. Maintenance of the Finance and Accounting Center asthe Focal Point for all Accounting and FinancialOperations.
Goal 6. Improvement of the Effectiveness of AutomatedFinancial Management Information Systems.
Goal 7. Monitor Effective Career Management Programs forCivilian and Military Personnel at All Levels.
Goal 8. Encourage the Maintenance of a Balanced TrainingProgram.
Goal 9. Emphasize the Use of Practical Management Procedures.
Goal 10. Foster the Integration and Understanding of Comptroller
Functions Throughout the Army.
Source: HQ, Department of the Army, DA PAX 37-4, ArmComptroller Handbook; p. V-XIV, April 1976.
Figure I1-1. COA Goals
23

4
Figure - C TRAINING COST
REVIEWNTANALYS24COMPTROLLER
PRACTICES &ANALY S IS
i FINANCE
ACCOUNT ING
Source: HQ, Department of the Army, DA PAM 37-4, ArmyComptroller Handbook; p. xv, April 1976.
Figure 11-2. Comptroller Functions
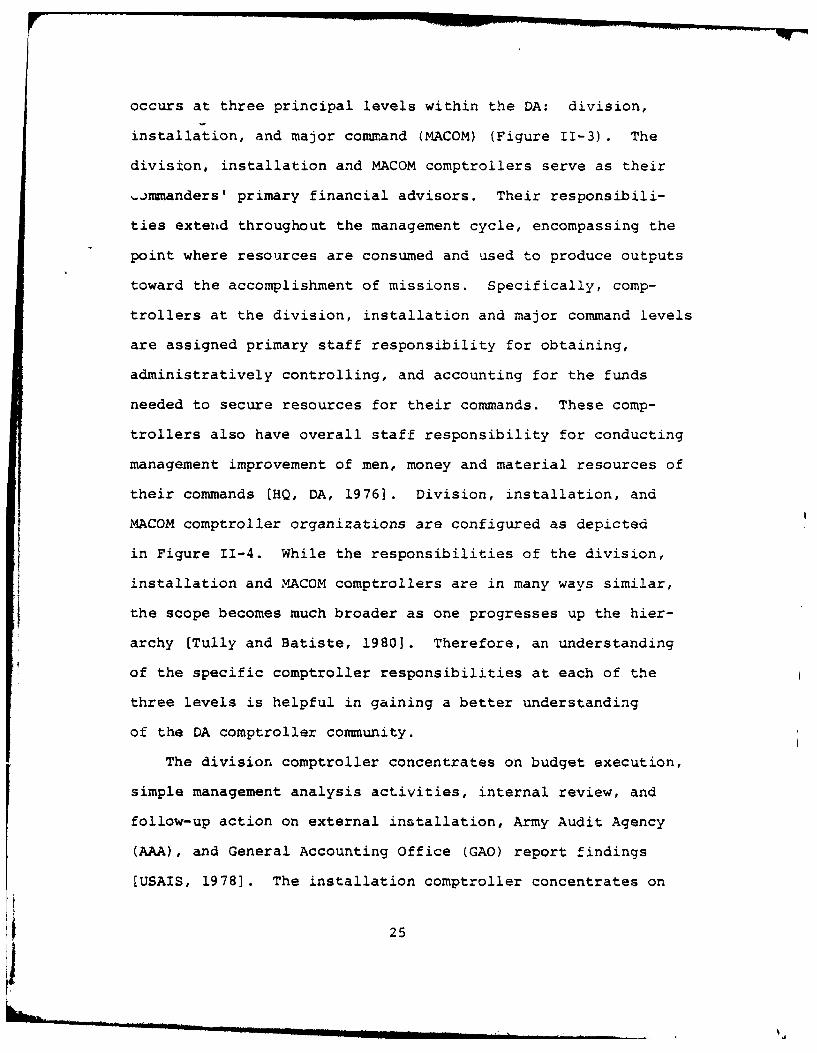
occurs at three principal levels within the DA: division,
installation, and major command (MACOM) (Figure 11-3) . The
division, installation and MACOM comptrollers serve as their
,immanders' primary financial advisors. Their responsibili-
ties extend throughout the management cycle, encompassing the
point where resources are consumed and used to produce outputs
toward the accomplishment of missions. Specifically, comp-
trollers at the division, installation and major command levels
are assigned primary staff responsibility for obtaining,
administratively controlling, and accounting for the funds
needed to secure resources for their commands. These comp-
trollers also have overall staff responsibility for conducting
management improvement of men, money and material resources of
their commands [HQ, DA, 1976]. Division, installation, and
MACOM comptroller organizations are configured as depicted
in Figure 11-4. While the responsibilities of the division,
installation and MACOM comptrollers are in many ways similar,
the scope becomes much broader as one progresses up the hier-
archy [Tully and Batiste, 19801. Therefore, an understanding
of the specific comptroller responsibilities at each of the
three levels is helpful in gaining a better understanding
of the DA comptroller community.
The division comptroller concentrates on budget execution,
simple management analysis activities, internal review, and
follow-up action on external installation, Army Audit Agency
(AA.A), and General Accounting Office (GAO) report findings
[LSAIS, 1978]. The installation comptroller concentrates on
25

Organization Example
1Major Command--------------------U.S. Army Forces Command
Installation 2---------------------Fort Carson, Colorado
Major-------------------4th Infantry Division
Activity 4-------------------------Division Battalions
1. Major Commands are those commands that report directly
to and are funded by the Department of the Army.
2. An Installation is a group of facilities located in the
same vicinity which support particular functions, re-
porting to a specific Major Command.
3. A Major Activity is one of the principle functions at an
installation; a composite of activities.
4. An Activity is a military unit or organization perform-
ing an assigned mission or function.
* An Army division, consisting of nine line batt&. -.as anQ.
three or more support battalions, dependent upon mission
and/or classification, could be considered a Major Activity
or Activity depending upon the circumstances and staffing
at a particular Installation.
Source: U.S. Army War College, Army Command and Management,pp. 17-1--17-2, September 1978.
Figure 11-3. Flow of Comptroller Functions
26

"Installation "Cst CarptrollerAccountant" Analyst" or
*Resource DeputyManager Ccaptroller
Budget Division Management Internal Review Finance &"Budget Chief" Division Division Accounting I
"Managenent Chief" "Internal Review DivisionOfficer" "Finance &
AccountingOfficer"
Force Develop-n ent Division"Force Develop,-
nmnt Chief"
*DA commands have either a comptroller or a resource manager.Both individuals have the same fundamental responsibilities,although a resource manager organization will have a forcedevelopment division. The force development division hasprimary responsibility for all force/manpower management issues.For purposes of this thesis the authors will use the termcomptroller to refer to both DA comptrollers and DA resourcemanagers.
The above configuration is based on the hierarchical form oforganization. An organization that has a hierarchical formconsists of a vertical dimension of differentiated levels ofauthority and responsibility and a horizontal dimension ofdifferentiated units such as departments or divisions [Ullrichand Wieland, 1980]. The above configuration was derived frominformation contained in DA PAM 37-4, Army Comptroller Handbookdated April 1976, andfrm the work of Tully and Batiste (1980).
Figure 11-4. Configuration of a DA Comptroller
Organization
27

budgeting, accounting, management analysis, internal review
and statistical reporting. Additionally, the installation
comptroller's office prepares and issues directives and pro-
cedures essential for the preparation of budget estimates and
studies [USAIA, 19781. The MACOM comptroller concentrates
on the same basic duties and responsibilities that are found
at the installation level. Additionally, the MACOM comptroller
must be concerned with the establishment and maintenance of
favorable informal relationships between the MACOM office, DA,
and subordinate installation comptroller offices. A more de-
tailed discussion of these comptroller responsibilities are
outlined in Appendix A.
C. REVIEW OF TULLY AND BATISTE'S RESEARCH
This section of Chapter II is a review of Tully and Batiste's
thesis research and findings. The section provides a critique
of the findings and states how this study attempts to augment
their methodology and analysis.
1. Purpose, Scope, Methodology, Analysis and Findings
Informal conversations with past and present DA finan-
cial managers indicated to Tully and Batiste that many junior
officers entering their first comptrollership assignment are
unprepared for their duties because they are unfamiliar with
the DA financial management system and its workings. Tully
and Batiste then conducted a research effort within the DA
comptroller community to determine whether the apparent need
for improving the skills of the junior DA comptroller existed.
28

Their research effort revealed the existence of such a need.
They then attempted to identify and rank in order of impor-
tance the specific shortcomings of the junior level DA comp-
troller. Tully and Batiste's final step was to determine
a course of action for correcting the identified shortcomings
(Tully and Batiste, 1980).
Tully and Batiste began their research effort by des-
cribing the DA financial management system. The description
highlights and analyzes the specific military accounting,
programming and budgeting functions performed by junion level
DA comptrollers.
Tully and Batiste then attempted to determine if any
shortcomings in financial management skills existed among
junior level DA comptrollers. This was accomplished by con-
ducting a survey of comptroller personnel and a study of Army
Audit Agency (AAA) reports on comptroller activities [Tully
and Batiste, 1980). Tully and Batiste's survey of a sample of
DA junior level financial managers was conducted via a mailed
questionnaire. The questionnaire was designed to gather data
from DA junior level financial managers concerning their degree
of job preparation. one of the questionnaire's eight questions
was directed to the junior level financial manager's comptroller.
The comptrollers were asked to coumment on the areas their
subordinates could have been better prepared to handle, and
what subject material should be emphasized in a course pre-
paring DA financial managers for initial assignments in comp-
trollership (Tully and Batiste, 1980].
29

Two hundred fifteen questionnaires were sent to 49 DA
commands in CONUS and USAREUR, identified by Tully and Batiste
as being likely to have junior level comptroller positions.
One hundred sixty six and 49 questionnaires were sent to junior
level financial managers and comptrollers respectively. Replies
were received from 43 commands, 99 junior level financial
managers, and 44 comptrollers [Tully and Batiste, 1980].
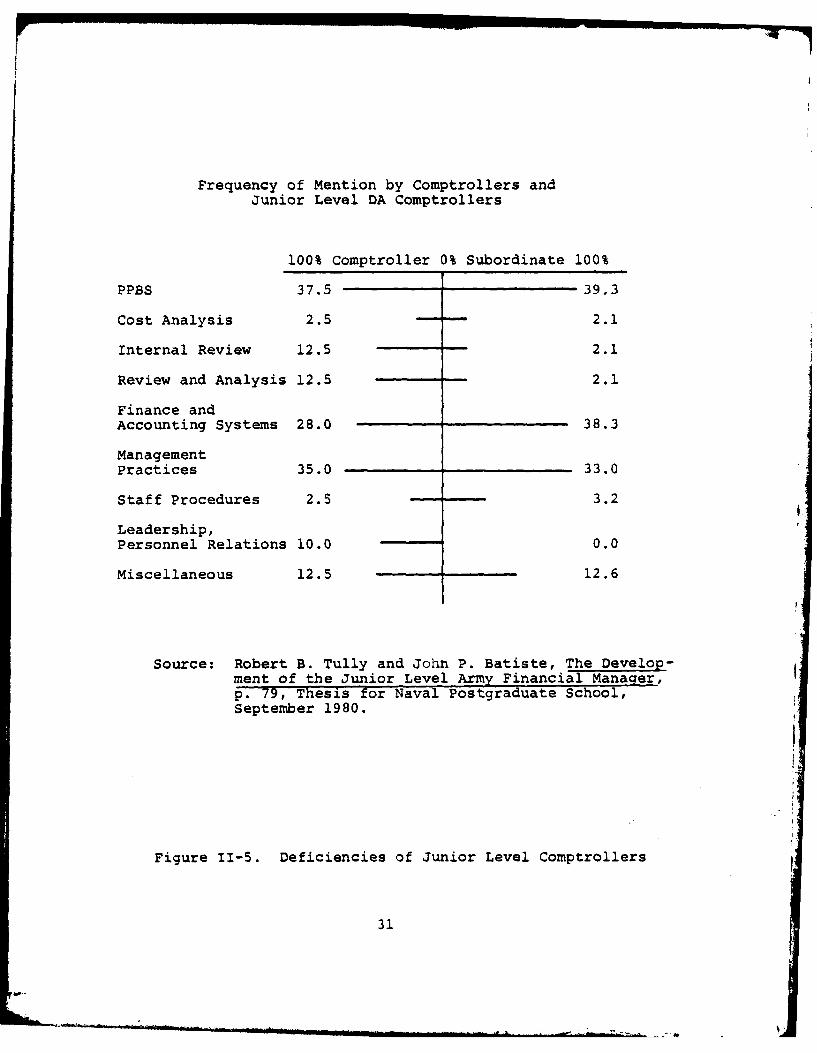
The analysis of raw data gathered from the question-
naire revealed that 76.5% of all respondents felt junior level
financial managers could have been better prepared to assume
their duties. Further analysis revealed that lack of prepared-
ness fell into eight major subject areas. The major areas and
their respective frequencies of mention by both the comptrollers
and junior level financial managers are shown in Figure 11-5
[Tully and Batiste, 1980].
As is shown in Figure 11-5 a significant number of
comptrollers and junior level financial managers made comments
about deficiencies in such organizational behavior areas as
staff procedures, leadership and personnel relations. Ina-
bility to speak and write effectively and lack of common sense
were some of the deficiencies categorized within the miscellane-
ous area [Tully and Batiste, 1980].
Tully and Batiste's efforts directed at determining
the degree of need for improvement in the job preparation of
junior level comptrollers were concentrated in their survey
questionnaire. The results of the questionnaire indicated
30
Frequency of Mention by Comptrollers andJunior Level DA Comptrollers
100% Comptroller 0% Subordinate 100%
PPBS 37.5 39.3
Cost Analysis 2.5 2.1
Internal Review 12.5 2.1
Review and Analysis 12.5 2.1
Finance andAccounting Systems 28.0 38.3
ManagementPractices 35.0 33.0
Staff Procedures 2.S 3.2
Leadership,Personnel Relations 10.0 0.0
Miscellaneous 12.5 12.6
Source: Robert B. Tully and John P. Batiste, The Develop--ment of the Junior Level Army Financial Manager,p. 79, Thesis for Naval Postgraduate School,September 1980.
Figure 11-5. Deficiencies of Junior Level Comptrollers
31

that such a need exists. AAA report findings were reviewed
to either substantiate or refute this need for job prepara-
tion improvement [Tully and Batiste, 1980]. The audit reports
contained findings that Tully and Batiste associated with
each of the six major comptroller functions outlined in
Figure 11-2. Tully and Batiste could not use the AAA report
findings to quantitatively support data from their survey
questionnaires relating to the degree of need for job prepara-
tion improvement. However, the fact that the AAA reports con-
tained findings of technical deficiencies within comptroller
organizations formed part of the basis for their beliE that
a need for improvement existed [Tully and Batiste, 19801.
Tully and Batiste developed a PCC to help alleviate
the major technical shortcomings identified in their research.
This 95 hour course %as designed to prepare junior level DA
financial managers for comptrollership duties in the three
major functional areas of budgeting, military accounting, and
management practices. The subject areas and related instruc-
tional hours for the proposed PCC are presented in Appendix I
[Tully and Batiste, 19801.
Additionally, Tully and Batiste devised a comptroller
intern program through which newly assigned junior level finan-
cial managers would be cycled at the earliest possible oppor-
tunity. This intern program would allow jljnior level comp-
trollers to work for 30 to 60 days in each of the various
divisions (e.g., budget, internal review, management analysis
32
and finance/accounting divisions) within the comptroller
organization. This would allow the new financial managers
to gain valuable job experience in performing the most
important technical comptroller functions [Tully and Batiste,
1980].
2. Critique of Findings
Tully and Batiste's analysis of both questionnaires
and AAA reports provided a means of determining the need for
the job preparation improvement of junior level comptrollers.
This need for improvement was evident in the two major areas
of technical and organizational behavior skills. Tully and
Batiste then focused their efforts on alleviating the specific
technical shortcomings identified in the questionnaires and
AAA reports. However, they chose not to address the organi-
zational behavior deficiencies identified in the question-
naires and outlined in Figure 11-5.
The author's research attempts to augment the work ofI Tully and Batiste by verifying and proposing a means to cor-
rect the identified organizational behavior deficiencies mani-
fested by junior level DA financial managers. This was done
by sending a questionnaire to all levels of DA comptrollers
in order to obtain their comments on and recommendations for
improving these identified organizational behavior deficien-
cies. The questionnaire is structured in a manner that per-
mits comptrollers to also comment on organizational behavior
deficiencies not previously identified by Tully and Batiste.
33

D. REVIEW OF PLEDGER'S RESEARCH
1. The Pledger Comptrollership Model
a. General
As stated in the Introduction, one objective of
this thesis is to test the validity of the Pledger comptroller-
ship model for use within the DA. The model, if validated
within and then used by the DA, would facilitate the critical
transition period of the "first one hundred days" [Bobulinski,
19791 in a new comptroller's assignment. Having pre-
sented an overview of the DA comptroller community and a re-
view of Tully and Batiste's research, it is appropriate now
to briefly review Pledger's comptrollership model. The model
is not intended to be all encompassing, rather it brings to-
gether several organizational/structural aspects of military
comptrollership into a framework to be used by comptrollers
in facilitating the transition period of their new assignments.
Pledger derived the model from a combination of organizational
behavior theories which will be individually reviewed [Pledger,
1980].
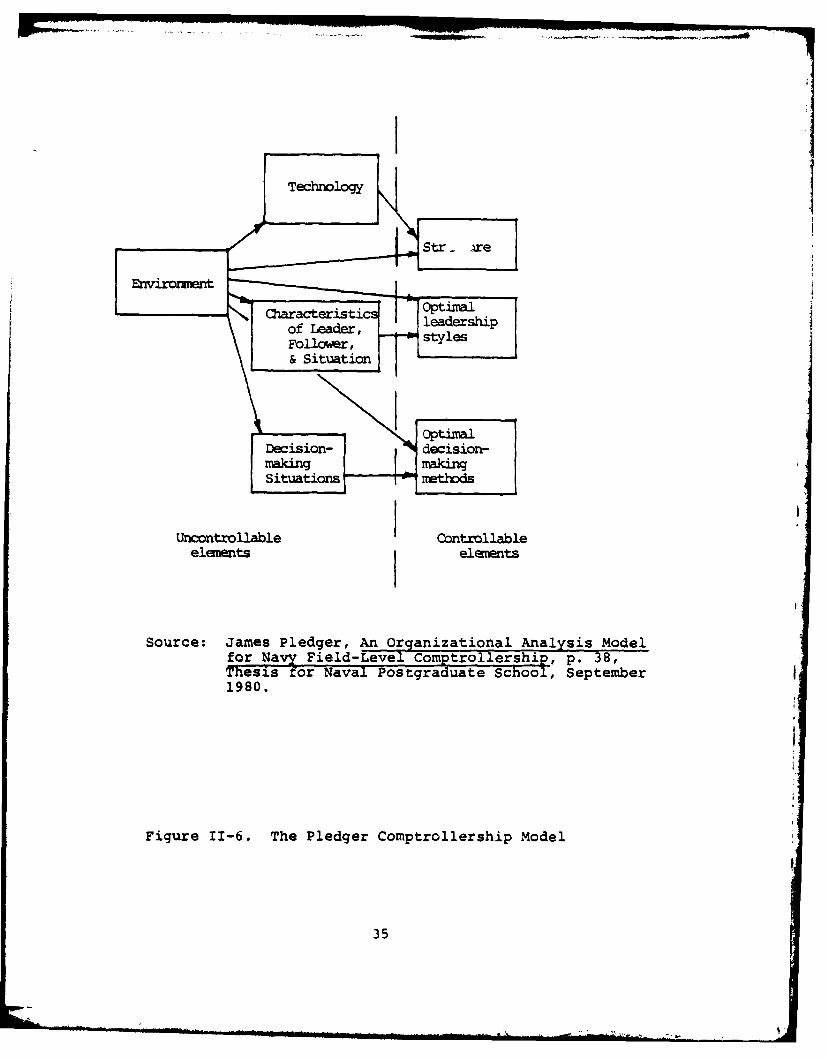
Technology/structure, leadership, decision-making and
the environment are the primary components of the comptroller-
ship model. Figure 11-6 illustrates the Pledger comptroller-
ship model. Pledger states that optimal structural
characteristics of the organization (such as a span of control
or coordination) can be determined with the model from a study
of the organization's technological and environmental charac-
teristics. optimal leadership styles can be selected by
UhirncntrolbeCnto al
Source JaharPlederstAn Orgnptinal ayi oefor LaFed-eve leadptoershi ,p 8
Thesis~or Nval PstauaescolSetbr
Figur 11-6 TheolederCmtolrsi oe
& Sitat35
examining the individual characteristics of the leader, the
followers, and the situations. Appropriate decision-making
methods are associated with different decision-making situa-
tions. The overall operating environment is considered to
have both direct and indirect effects on the other components
of the model [Pledger, 19801.
What follows is a more detailed description of the
components of the model. The effects of the operating environ-
ment are considered simultaneously with each of the other
three components of the Pledger comptrollership model. In
the short term the elements to the left of the vertical dotted
line in Figure 11-6 are considered to be uncontrollable. The
elements to the right of the vertical dotted line are con-
sidered in the model to be controllable by the comptroller in
the short-term in most situations [Pledger, 1980).
b. Technology/Structure Characteristics
The purpose of this section is to first define the
technology and structure of comptrollership to provide a found-
ation for the analysis of the technology/structure relation-
ship. Next the work of several organization theorists will
be briefly reviewed to identify the technological and environ-
mental factors of organizations which contribute to optimum
structural design and to introduce several propositions for
testing during the analysis phase of this thesis.
(1) Definition of Technology and Structure.
Technology is generally defined as the application of knowledge
36

to perform work. Perrow (1966) defines technology as "...the
actions that an individual performs upon an object, with or
without the aid of tools or mechanical devices, in order to
make some change in that object." Rousseau (1979) states
that technology has three major phases: input, conversion,
and output. Inputs to comptrollership include people, equip-
ment, modern management techniques and the basic theories
of budgeting and accounting. Buffers exist to control flow
and qualify on the input side [Pledger, 1980]. The trained
military officers and civilians working in DA comptroller
organizations are an example of an input buffer. Conversion
is a process that adds value to the inputs in some desired
way for some purpose [Rousseau, 1979]. This process is evi-
denced within the DA comptroller community by the practices
of budgeting, accounting, internal review, cost analysis, and
reporting for purposes of providing the command with the best
possible financial management advice. Providing a service to
management in the form of financial management information is
the output of comptrollership [Pledger, 1980]. The financial
management information can be budget information, accounting
services, internal reviews or cost analysis reports. Output
buffers control the flow and quality of the outputs. Output
buffering is evident in stockpiling of materials and contin-
gency funding within comptroller organizations [Pledger, 1980].
organizational structure may be defined as
the network of relationships that exist among various posi-
tions and position holders. Formal structure is a pattern
37

of relationships that has been consciously planned and imple-
mented. Formal structure is defined to include the formal
hierarchy of authority, as well as rules, formal procedures,
and other planned attempts to regulate behavior. Key execu-
tives typically decide on basic patterns of structure that,
in their opinion, will be most appropriate in achieving com-
pany goals (Dessler, 1980]. The DA operates under a formalized
structure where relationships among various positions are
carefully contrived and deliberately planned. However, unpre-
scribed or informal structures usually develop as a means of
circumventing the formal structure in order to expediate work-
related actions (Pledger, 19801.
J. Thompson, J. Woodward and C. Perrow are
organizational theorists who contend that the technology of
an organization determines its optimum structure. D. Rousseau
contends that some specific correlations are useful in pre-
dicting the appropriate structure for an organization. Other
theorists such as T. Burns and G.M. Stalker argue that an
organization's structure is a function of its overall operating
environment. The findings of the above named individuals will
be briefly mentioned in the following two sections in order
to identify the technological and environmental factors within
organizations which contribute to optimum structural design.
(2) Thompson, Woodward, Perrow, and Rousseau.
Thompson contends that both strategy and structure are affected
by the kind of technology employed (Ullrich and Wieland, 1980].
Thompson distinguishes three major classes of technological
38

processes: the long-linked technolcry, the mediating tech-
nology, and the intensive technology [Ullrich and Wieland,
19801. Each of these technologies require a certain type of
interdependence among the parts of the organization. The
class of technology and its associated type of interdependence
determines the optimum way of achieving coordination and con-
trol within the organization. Figure 11-7 summarizes the
relationships between the class of technology, type of inter-
dependence, and optimum method of achieving coordination and
control.
Woodward's studies in the 1950's of 100 Bri-
tish business firms identified the existence of specific
relationships between technology and certain aspects of organi-
zational structure such as span of control and line-staff
arrangements. The firms were categorized into three major
groups according to the complexity of their technology as
follows: a) unit and small batch production, such as custom
built cars; b) large-batch and mass production, such as mass
produced cars, and c) long run process production of the same
product, such as chemicals LDessler, 1980; Ullrich and Wieland,
1980].
As outlined in Figure 11-8, these three tech-
nologies are associated with certain aspects of organizational
structure. The large batch/mass production firms are formally
organized, iave wide spans of control and exhibit line-staff
separation. The other two types of firms are informally
39

Class of Type of Methd of Coor-Technology Examples Interdependence dination & Control
Long-linked Assembly Serial Interde- PlansConverts raw line 2endencematerials into The successfulfinished output performance of
by performing step B is depend-a series of op- ent on the suc-erations in a cessful performancefixed sequence. of step A, but not
vice versa
Mediating Banks Pooled Interde- StandardizedLinks together Postal Service pendence procedures andclients who Telephone Each part renders ruleswish to engage Utilities a discrete con-in specific Insurance tribution to thetransactions, Industry whole and eachbut who other- is supported bywise prefer to the wholeremain unin-volved withone another.
Intensive Hospitals Reciprocal Inter- Mutual AdjustmentThe use of an Research Labs denence or feedbackintensive tech- Certain Engi- The output of eachnology is deter- neering Firms part become inputsmined by the for the othernature of the partsproblem andthe variety ofproblemsencountered,which can'tbe predictedaccurately.
This summary of the relationships between technology andstructure was derived from the research of Ullrich andWieland (1980) and Thompson (1967).
Figure 11-7. Summary of Thompson's Research Findings onthe Relationships Between Technology andStructure
40

Technological Unit and Small- Large-Batch and ProcessCharacteristics Batch Production Mass Production Production
Lower Levels Informally Organized by Organzied byorganized narrow formal process; technologi-spans of control wide spans cal task
demands &narrowspans ofcontrol
Higher Levles Informally Organized by Informallyorganized; no administrative organized;distinction prcesses with no distinc-between line lire-staff tion betweenand staff separation line and
staff
General charac- Few levels; More "organiza- Many levels;teristics narrow spans of tional con- less "organi-
control; low sciousness"; zational"organizational uore clearly conscious-consciousness"; defined posi- ness"; highno clear chain tions; clear ratio ofof command; low chain of command admin toratio of admin- nonadministrative to personnelnonadministrativepersonnel
Source: Gary Dessler, Organizational Theory: IntegratingStructure and Behavior, (Englewood Cliffs, NewJersey: Prentice-Hall, Inc., 1980), p. 72.
Figure 11-8. Summary of Woodward's Research Findingson the Organizational Structure ofSuccessful Firms
41
organized, have narrow spans of control and exhibit no dis-
tinction between line and staff.
The authors adopted Pledger's contention that
comptrollership exhibits technological similarities (i.e.,
fairly standardized products, fairly predictable production
steps, some unpredictability and product variations) to
Woodward's "large batch/mass production" type firms and will
therefore exhibit correspondingly similar structural relation-
ships (i.e., formalized structure, administratively organized
with line-staff separation, clearly defined positions, clear
chain of command) [Dessler, 1980; Pledger, 1980].
C. Perrow extends the analysis of technology/
structure further by categorizing the technologies of organi-
zations along two dimensions as follows: "1) the extent to
which logical, analyzable search procedures can be used in
problem solving (along a dimension running from well-defined
to ill-defined pr-blems), and 2) task variability (along a
dimension ranging from variety in the task to routineness)"
[Ullrich and Wieland, 1980, p. 901.
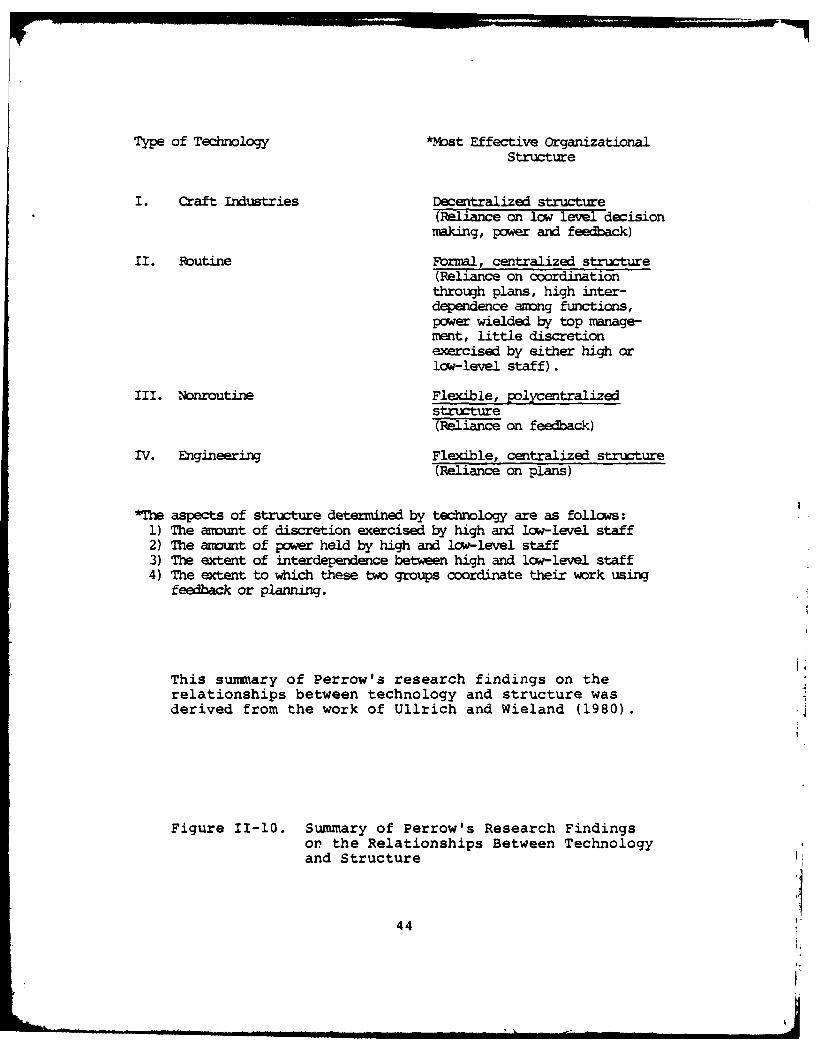
Perrow's use of the two dimensions makes it
possible to distinguish four different types of technology,
as shown in Figure 11-9. Perrow contends that the type of
technology of the organization will determine the most appro-
priate organizational structure, as shown in Figure II-10.
The authors adopted Pledger's hypothesis that
the technology of comptrollership in the DA is of Perrow's
42

Problem variability
Problem Low variability High variabilitydefinition and few exception- and many exceptions
Ill-structured I. Craft industries III. Nonroutine(unanalyzable (specialty glass) (aerospace)search)
Well-structured II. Routine IV. Engineering(analyzable (steel mills) (heavysearch) machinery)
Source: Robert A. Ullrich and George F. Wieland,Organization Theory and Design (Homewood,Illinois: Richard D. Irwin, Inc., 1980),p. 91.
Figure 11-9. Perrow's Classification of Typesof Technologies
43
Type of Technology *Mst Effective OrganizationalStructure
I. Craft Industries Decentralized structure(Reliane on low level decisionmaking, power and feedback)
II. Routine Formal, centralized structure(Reliance on coordinationthrough plans, high inter-dependence among functions,power wielded by top manage-ment, little discretionexercised by either high orlow-level staff).
III. Nonroutine Flexible, polycentralizedstructure(Reliance on feedback)
IV. Engineering Flexible, centralized structure(Reliance on plans)
*The aspects of structure determined by technology are as follows:1) The amount of discretion exercised by high and low-level staff2) The amount of power held by high and low-level staff3) The extent of interdependence between high and low-level staff4) The extent to which these two groups coordinate their work using
feedback or planning.
This suimmary of Perrow's research findings on therelationships between technology and structure wasderived from the work of Ullrich and Wieland (1980).
Figure II-10. Summary of Perrow's Research Findingson the Relationships Between Technologyand Structure I'
44

Routine type (well structured/low variability and few excep-
tions) and displays corresponding structural characteristics
(centralized with power held by comptroller, high interde-
pendence and high coordination required among functions within
the organization) [Ulirich and Wieland, 1980; Pledger, 1980].
Figure II-11 is Rousseau's matrix which is
her summary of the research literature dealing with the
technology/structure relationships that exist within organi-
zations. The matrix indicates first order correlations (or
lack or correlations) between the technological and structural
characteristics among private organizations studied. The
horizontally listed technological characteristics are con-
sidered to be independent variables fixed by the state of
technology under consideration. The vertically listed struc-
tural characteristics are dependent variables which are unique
to particular organizations [Rousseau, 1980; Pledger, 19801.
The terms technology and structure characteristics and tech-
nology and structure variables will be used interchangeably
in this thesis. The definitions of Rousseau's technology
and structure variables are listed in Figures 11-12 and 11-13
respectively.
The authors adopted Pledger's hypothesis that
systematic relationships (i.e., correlations) between the
technological and structural variables of comptrollership
can be detected [Pledger, 1980].
(3) Burns and Stalker. Burns and Stalker contend
that an organization's structure is a function of its overall

TECHOLOGY
-4I
Span of Control + -
Levels in Hierarchy 0 0 ? ? 0 0 0
Centralization + + + + +
Formalization + + + ? + + +
VerticalCcauunication - - - ? - +
Interdependence ? + ? + ? ?
Coordination - - - + - 0
Specialization + + + ? + - + +
Key: + - Positive relationship- - Negative relationship0 - No relationship? - Irwitent resultsI
Blank - No research (un -own)
Source: James Pledger, An Organizational Analysis ModelFor Many Field-Level Comptrollership, p. 49,Thesisfor Naval Postgraduate School, September 1980.
Figure II- . Rousseau's Matrix of Technoloy/StructureRelationships
46
Spec.. i lizat o ,,. . ... ... .... + +.- ii .. . .. +_mnm .. .- iiiiii+ 4_.. , -. .

1. Standardization pertains to materials, funds or informa-tion which flow into the organization.
2. Predictability pertains to materials, funds or informationwhich flow into the organization.
3. Routineness deals with the degree to which events arerepeated.
4. Complexity deals with the degree of sophistication ofthe actual steps necessary to complete the operation.
5. Automation is determined by the degree to which theconversion process is manual or machine operated(e.g., computerized).
6. Use of discretion is a measure of how much the lowermembers of the organization are allowed to make decisionswith regard to the day to day operation of the conversionprocess.
7. Quality control refers to the degree to which the outputor product of the organization is checked for accuracyor correctness.
8. Performance evaluation is a form of feedback to supervisorymanagement concerning the performance of supervisedpersonnel output.
The variables above are descriptive of various character-istics of the three phases of technology previously discussed:input, conversion process, and output.
The definitions of the technology variables were derivedfrom the research of Pledger (1980).
Figure 11-12. Definitions of Rousseau's TechnologyVariables
47

1. Span of Control is the number of personnel supervised bya single supervisor at a particular level in theorganization.
2. Levels in the hierarchy is a measure of the number ofmanagerial levels, illustrative of the length of thechain of command.
3. Centralization is a measure of where decisions are made.Organizati-ons in which decisions are made (and controlheld) at the top are considered to be highly centralized.organizations in which decisions are made at the lowerlevels are considered to be more decentralized.
4. Formalization is indicative of how much importance theorganizationplaces, on rules, regulations, and standardizedprocedures.
5. Vertical communication refers to freedom of informationflow up and down the chain of command.
6. Interdependence is the degree to which different functionswithin the organization are dependent upon one another.
7. Coordination is a measure of how much coordination isrequired among different functions within the organiza-tion in order for the conversion process to functionsmoothly.
8. Specialization refers to the degree of specializationwhich is required or exists among the organizationalfunctions.
The definitions of the structure variables were derivedfrom the research of Pledger (1980).
Figure 11-13. Definitions ot Rousseau's StructureVariables
48
operating environment (i.e., the technology and market struc-
ture of the particular organization). They found that firms
operating in a stable environment (i.e., little or no change
in technology and market structure) exhibit a mechanistic
system of management. A mechanistic system is characterized
by a reliance on formal rules and regulations, knowledge
located and decisions made at the top of the organization,
narrow spans of control, vertical communications and loyalty
to superiors. Firms that operate in a dynamic environment
(i.e., changing technology and market structure) will tend
to adopt an organic system of management, characterized by
less reliance on formal rules and regulations, knowledge located
at all levels within the organization, wider spans of control,
lateral communications and loyalty to tasks rather than
superiors [Dessler, 1980; Dalton, Lawrence and Lorsch, 1970).
The authors adopted Pledger's hypothesis that
comptroller organizations operate in basically stable environ-
ments and exhibit mechanistic systems of management [Pledger,
1980].
(4) Summary. This section first defined the
technology and structure of comptrollership. Next, the sec-
tion provided a review of various theories relating how tech-
nology and the environment affect organizational structure.
Thompson, Woodward and Perrow revealed how structure can be
determined by technology, while Burns and Stalker examined the
environmental effects on structure within organizations. Four
hypotheses derived by Pledger from the various theories were
49

presented and will be tested during the analysis phase of
this thesis.
c. Leadership Component
In this next section of the chapter the authors
review the Pledger comptrollership model's leadership com-
ponent. Within the model optimal leadership styels can be
selected from an examination of the individual characteristics
of the leader, the followers, and the situation. The authors
augment Pledger's research by examining in more detail the
individual characteristics of the leader. The examination
focuses on the distinction between task oriented and socio-
emotional oriented leaders. Two hypotheses are introduced
that deal with these types of leaders. The section is
broken down into two segments as followst (a) choosing a
leadership style and (b) leadership styles available.
(1) Choosing a Leadership Style. Robert
Tannenbaum and Warren H. Schmidt identify three factors of
particular importance to a manager or leader in selecting an
optimal leadership style. These factors are the individual
characteristics of the leader, the followers, and the situation.
The individual characteristics of the leader
that Tannamand Schmidt deem important are as follows:
Mange'svalue system. (This relates to the manager'sbelefsconernng ow uchinfluence subordinates
should have in decisions affecting them.)
Manager's confidence in subordinates.
Manager's feelings of security in an uncertain situation.(Some managers have a greater need than others forpredictability and stability in their environment.)
50

• Manager's leadership inclinations. (Regardless of thesituation, many managers feel more comfortable as eithera task oriented or socio-emotional oriented leader.)[Tannenbaum and Schmidt, 1973]
The literature reveals that this last charac-
teristic has been the subject of a great deal of research
over the past 30 years [Barrow, 19771. Kaplan (1979) states
that during this period of time, a number of leadership studies
identified two critical dimensions of leader behavior. The
first dimension is composed of democratic, permissive, follower
oriented, participative, and considerate patterns of behavior
which appear to relate to the leader's socio-emotional orien-
tation. The second dimension consists of autocratic, restric-
tive, socially distant, directive, and structured patterns of
behavior which appear to relate to the leader's"task orienta-
tion [Kaplan, 19791. J.D. Senger suggests that these task
and socio-emotional orientations are related to two important
personality variables: the need for achievement and the need
for affiliation [Senger, 19711. Although early researchers
believed that task and socio-emotional patterns of behavior
were mutually exclusive, more contemporary research has shown
that the leader can be high or low in both dimensions (Hersey
and Blanchard, 1972].
Based upon the findings of the literature re-
viewed it is hypothesized that DA comptrollers 1) perform both
the socio-emotional and task related leadership functions
within their organizations and 2) will be higher in the socio-
emotional dimension than the task related dimension.
51

The second factor to consider when choosing
a leadership style is the individual characteristics of sub-
ordinates. These characteristics include the subordinates
expectations, values and abilities. "Effective managers will
be able to detect these characteristics and in turn determine
what type of behavior on their part will draw out the optimal
subordinate behavior" [Pledger, 1980, p. 591.
In addition to the forces existing in managers
and subordinates, certain situational characteristics will
also affect the manager's leadership style. These situational
characteristics include the type of organization, the group's
effectiveness, and the problem itself [Tannenbaum and Schmidt,
1973].
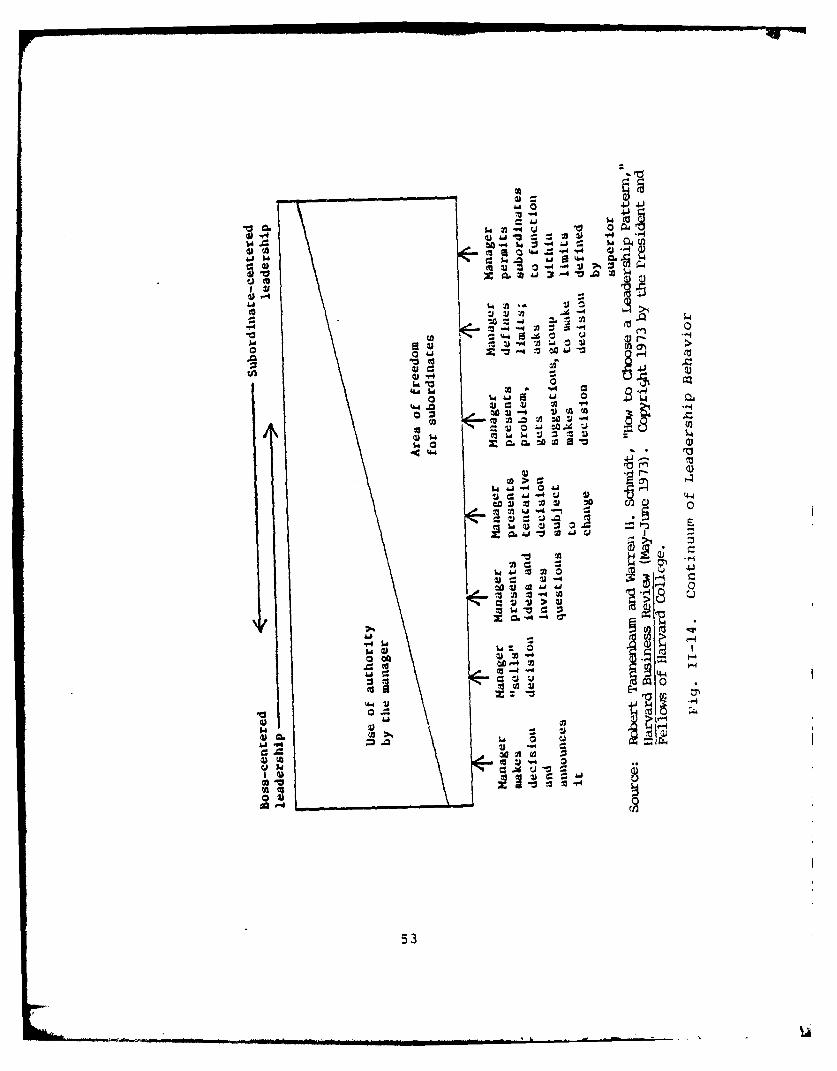
(2) Leadership Styles Available. The continuum
of leadership behavior by Tannenbaum and Schmidt is presented
in Figure 11-14. Each of the seven leadership styles depicted
i.s a measure of the degree of authority used by the manager
versus the amount of freedom given to subordinates in the
decision-making process. Managers who utilize the styles on
the extreme left of the continuum retain maximum authority.
Conversely, managers who utilize the styles on the extreme
right of the continuum are permitting their subordinates to
exercise maximum possible freedom in decision-making [Tannen-
baum and Schmidt, 1973]. A description of the leadership
styles is presented in Appendix B.%
Goodhartt (1979) suggests that a comptroller
must be a manager, both internally and externally, but he
52
-. Aj '.4 .
C -Y. 0 ~~-
di 41
0
0 0
00o to
m. 0U31)
2 00
tj~ -jE
.3 V
go
53~

must also be a servant to his superiors, peers and subordinates.
In order to accomplish both these requirements a comptroller
must not overact in either role and become a dictator or a
slave. Instead, he must function on a continuum between
these two extremes. However, the comptroller's position on
this *.ontinuum is not static but is constantly shifting as
the situation and pressures change [Goodhartt, 1979, p. 9].
Based on the research of Goodhartt (1979)
the authors hypothesize that, on the continuum of leadership
behavior depicted in Figure 11-14, DA comptrollers will uti-
lize a wide range (i.e., 5 to 7 styles) of leadership styles
in carrying out their responsibilities and will strike a
relative balance between managerial authority and subordinate
freedom by utilizing over 50% of the time the middle three
leadership styles depicted along the continuum.
d. Decision-Making Situations/Methods
This section reviews the decision-making component
of the Pledger comptrollership model. The model reveals that
appropriate decision-making methods are associated with dif-
ferent decision-making situations.
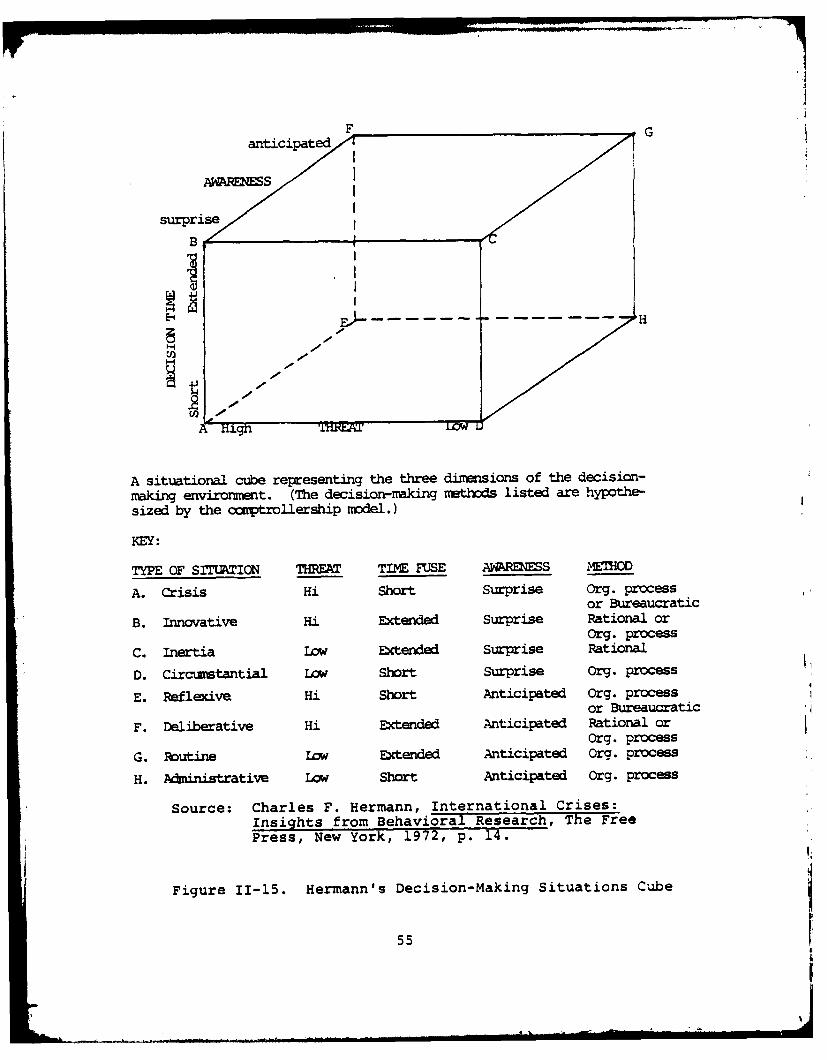
Charles F. Hermann (1972) has designed a cube,
Figure 11-15, which depicts eight possible decision-making
situations. These decision-making situations are characterized
along three dimensions: the levels of threat to the organi-
zation or the comptroller, the extent of the time fuze in
which to react, and the amount of prior awareness that the
54
F G
B
IIE - H
A situational cube representing the three dimnsions of the decision-making environment. (The decision-making nethods listed are hypothe-sized by the cawptrollership model.)
KEY:
TYPE OF SITUAWTION THPEM TIM4 FUSE AARNES NETHOD
A. Crisis Hi Short Surprise Org. processor Bureaucratic
B. Innovative Hi Extended surprise Rational orOrg. process
C. inertia Low Extended surprise Rational
D. Circumstantial L0W Short Surprise Org. process
E. Reflexive Hi Short Anticipated Org. processor Bureaucratic
F. Deliberative Hi Extended Anticipated Rational or
Org. processG. Routine LOW Extended Anticipated Org. process
H. Aministrative LoW Short Anticipated Org.- process
Source: Charles F. Hermann, International Crises:Insights from Behavioral Research, The FreePress, New York, 1972, p. 14.
Figure 11-15. Hermanns Decision-Making Situations Cube
55

decision must be made [Hermann, 1972]. The Pledger comptroller-
ship model depicts these different decision-making situa-
tions as requiring comptrollers to adopt different decision-
making methods [Pledger, 1980].
Allison (1971) has described three decision-making
methods that Pledger (1980) contends can be used for the dif-
ferent decision situations depicted by Hermann in his cube.
The decision methods are the rational method, the organiza-
tional processes method and the bureaucratic politics method
[Allison, 19711.
The rational decision-making method is character-
ized by a unitary decision-maker, the establishment of objec-
tives, the development and ranking of alternatives and the
selection of the best available alternative [Fincke, 1981].
The organizational processes method is character-
ized by problem factoring, satisficing, uncertainty avoidance,
and standard operating procedures (SOPs). Problem factoring
refers to dividing the problem up into manageable parts which
are acted upon by different groups in an independent manner.
Satisficing occurs when decision-makers adopt the first accepta-
ble alternative, rather than searching for and choosing the
best alternative. Organizations avoid uncertainty by develop-
ing both procedures that provide short-run feedback and imple-
menting change in an incremental manner. The purpose of SOPs
is to avoid mistakes by relying on certain repetitive actions
which have proved successful in the past [Allison, 1971;
Pledger, 1980].
56

Bureaucratic politics is best described by bar-
gaining along regularized channels among players positioned
hierarchically within an organization. Responsible players
use their power to fight for what they feel is right. Final
decisions are the result of compromise. The bureaucratic
politics method is based on the decision-maker's power and
personal ambitions. These ambitions sometimes affect the
solutions to a particular problem. "For example, rather than
arriving at a rational solution to a problem and letting the
analysis sell itself, the decision-maker might attempt to sell
a solution which is designed to benefit his or her career
rather than the good of the organization" [Pledger, 1980,
p. 731.
Pledger then discussed which decision-making
methods would most likely be utilized in each of the decision-
making situations depicted in Figure 11-15. These methods
and situations are summarized as follows:
APPROPRIATE METHOD DECISION-MAKING SITUATION
1. Rational Innovative, Inertia,Deliberative
2. Organizational Circumstantial, Routine,Processes Crisis, Reflexive, Adminis-
trative (Possibly Innovative,Deliverative)
3. Bureaucratic Politics Possibly Crisis, Reflexive
Pledger based the associations on 16 propositions which indi-
cate actions resulting from the three dimensions of threat,
time fuze and awareness [Pledger, 19801. These propositions
are listed in Appendix C.
57

The authors adopted and tested Pledger's hypothe-
sis that comptrollers used mixed decision-making methods as
decision-making situations change.
2. Method, Analysis and Findings
This section provides a review of Pledger's research
methodology, analysis and findings.
Pledger used a questionnaire to obtain data pertain-
ing to the technology/structure and decision-making components
of his "comptrollership model." The questions were not pre-
tested or validated. Questionnaires were sent to a random
sample of 68 USN field comptrollers located in the continental
United States. Replies were received from 59 comptrollers
(Pledger, 19801.
In the analysis of the raw datd gathered from the
questionnaire, Pledger examined three aspects of the comptrol-
lership model:
1. Data were analyzed to find correlations between tech-nological and structural variables. The variablesused in the comptroller questionnaire were thosederived by Rousseau.
2. Data were analyzed to determine relationship betweendecision-making situations encountered by comptrollersand what types of decision-making methods are most oftenutilized.
3. Content analysis was conducted of the comptrollers'general comments concerning problems encountered duringthe initial stages of an assignment and advice to thenew comptroller. [Pledger, 1980]
Pledger's analysis revealed that correlations do exist
between the technological and structural variables of USN
field comptrollership. The data from the questionnaires also
58

supported Pledger's two other hypotheses relating to tech-
nology/structure. These hypotheses were outlined previously
in this chapter and are based on the research of Woodward
and Perrow.
Analysis of the data also supported the hypothesis
that USN field comptrollers used mixed decision-making methods
as decision-making situations change.
"A content analysis of the comptroller's general com-
ments revealed the concern of Navy field comptrollers for the
organizational behavior aspects of their jobs; especially
technology/structure and leadership aspects" (Pledger, 1980,
p. 120]. The comments also substantiated the hypothesis that
USN field comptroller organizations operate in basically
stable environments and exhibit mechanistic systems of manage-
ment. Pledger also concluded from these comments that comp-
troller training in the USN is inadequate with respect to the
development of necessary organizational behavior skills.
3. Critique of Findings
This section of the chapter presents a critique of
Pledger's findings and a statement on how this thesis attempts
to augment his methodology and analysis.
Pledger's successful testing of his "comptrollership
model" was an important first step in attempting to improve
the organizational behavior awareness of comptrollers during
their initial months on the job. As a result comptrollers
can shorten their start up process within the organization
59
through use of the Pledger comptrollership model. Pledger's
work represents a starting point for further research and
offers a framework which can be refined and expanded [Pledger,
19801. Refinements are possible in certain aspects of the
data collection and analysis techniques utilized by Pledger.
Additionally, there was no testing of the model's leadership
component.
This thesis augments the work of Pledger by attempting
to improve the questionnaire so that the potential for bias isre-
duced in the resulting data. The authors also analyzed sub-
samples of the data such as military officer and civilian
comptrollers. Partial correlation analysis was performed in
order to identify separate effects of all technological varia-
bles on the structural variables.
The authors also gathered information on the type of
leadership styles employed by DA comptrollers. This repre-
sents an initial testing of certain elements within the Pledger
comptrollership model's leadership component.
E. SUMMARY
This chapter described the origin, responsibilities, func-
tions and organization of the DA comptroller community. In
order to understand the organizational behavior aspects of
the comptroller community, familiarity with the comptroller
responsibilities at different command levels within the DA
is essential. Therefore, the specific responsibilities of the
DA division, installation and MACOM comptrollers are outlined
in the chapter and presented in detail in Appendix A.
60

The chapter included a summary of Tully and Batiste's and
Pledger's research and findings. Tully and Batiste identified
a definite need for the job preparation improvement of junior
level comptrollers in the two areas of technical and organi-
zational behavior skills. They made recommendations to
alleviate the technical shortcomings, but did not address the
organizational behavior deficiencies manifested by junior level
comptrollers. The summary of Pledger's research included a
review of the literature associated with the various components
of the comptrollership model. Pledger states that optimal
structural characteristics of the organization can be deter-
mined with the model from a study of the organization's
technological and environmental characteristics. Optimal
leadership styles can be selected with the model from an
examination of individual characteristics of the leader, the
followers, and the situation. Appropriate decision-making
methods are associated with different decision-making situa-
tions. Pledger derived the model from a combination of organi-
zational behavior theories developed by Thompson, Woodward,
Perrow, Rousseau, Burns and Stalker, Tannenbaum and Schmidt,
Hermann and Allison. The model is illustrated in Figure
11-6.
This chapter presented several hypotheses which are tested
and results presented in Chapter IV. Four of these hypothe-
ses relate directly to technology/structure within DA comp-
troller organizations, and are based on the research of
61

Rousseau, Woodward, Perrow, Burns and Stalker. The next four
hypotheses deal with the leadership functions and styles of
USA comptrollers. Finally, the authors adopted Pledger's
hypothesis that comptrollers use mixed decision-making methods
as decision-making situations change. The hypotheses are:
1. Systematic relationships (i.e., correlations) betweenthe technological and structural variables of DAcomptrollership can be detected.
2. DA comptrollership exhibits technological similarities(i.e., fairly standardized products, fairly predictableproduction steps, some unpredictability and productvariations) to Woodward's "large batch/mass production"type firms and will therefore exhibit correspondinglysimilar structural relationships (i.e., formalizedstructure, administratively organized with line-staffseparation, clearly defined positions, clear chain ofcommand).
3. The technology of comptrollership in the DA is ofPerrow's Routine type (well structured/low variabilityand few exceptions) and displays corresponding struc-tural characteristics (centralized power held by comp-troller, high interdependence and high coordinationrequired among functions within the organization).
4. DA comptroller organizations operate in basicallystable environments and exhibit mechanistic systemsof management.
5. DA comptrollers perform both the socio-emotional andtask related leadership functions within theirorganizations.
6. DA comptrollers will be higher in the socio-emotionaldimension than the task related dimension.
7. On Tannenbaum and Schmidt's continuum of leadershipbehavior, DA comptrollers will utilize a wide range(i.e., 5-7 styles) of leadership styles in carryingout their responsibilities.
8. DA comptrollers will strike a relative balance betweenmanagerial authority and subordinate freedom by utiliz-ing over 50% of the time the middle three leadershipstyles depicted along Tannenbaum and Schmidt's continuumof leadership behavior.
9. DA comptrollers used mixed decision-making methodsas decision-making situations change.

-y i • -k - .. . ..
III. RESEARCH METHOD
A. INTRODUCTION
In this chapter the authors present the research methods
used in identifying and ranking in order of importance the
specific organizational behavior deficiencies of junior level
Department of the Army (DA) comptrollers and testing the
Pledger comptrollership model. The chapter begins with a
detailed description of the questionnaire sent to DA comp-
trollers to gather needed data identified in Chapter II.
This description focuses on the purpose, design and pre-
testing of the comptroller questionnaire. The chapter
continues with a detailed description of the data analysis
plan. This description concentrates on how the data relating
to the Pledger comptrollership model were analyzed to test
hypotheses 1 through 9. The description also concentrates on
how the comptrollers' comments on the organizational behavior
deficiencies exhibited by junior level DA comptrollers were
categorized and ranked in order of importance. Next, the
authors identify the sample selected to receive the question-
naire. Also those comptrollers who responded to the question-
naire are identified. The chapter concludes with a presentation
of three tables that summarize the responses to the questions
relating to background information, the Pledger comptroller-
ship model and the job preparation of junior level comptrollers.
63

B. THE QUESTIONNAIRE '1. Purpose
A questionnaire was developed by the authors and sent
to comptrollers from a large representative sample of 246
DA commands in the Continental United States (CONUS) and
United States Army Europe (USAREUR) [Appendix D3. The ques-
tionnaire was pre-tested at Fort Ord, California and the
Defense Language Institute (DLI), Presidio of Monterey, Cali-
fornia. The pre-test respondents were the comptrollers of
these two commands. As a result of the pre-testing, modifi-
cations were made to certain questions measuring the technology
and structure characteristics existing within DA comptroller
organizati.ons. These modifications are discussed in the next
section of this chapter. In addition to background data on
the command and the comptroller, the first part of the question-
naire is designed to gather data for testing the validity of
the Pledger comptrollership model. The last part of the
questionnaire is designed to obtain the comptroller's comments
on and recommendations for minimizing any organizational be-
havior deficiencies that junior level DA financial managers
exhibit during their first tour in the comptrollership
specialty field.
2. Design
Table III-i summarizes the characteristic or attri-
bute of the comptroller organization, comptroller or Junior
level financial manager being measured by each question of
the questionnaire.
64

TABLE III-1
KEY TO COMPTROLLER QUESTIONNAIRE
Characteristic/Attribute Question Nunter*Military or civilian comptroller, rank or GS rating 1
*Primary and secondary job specialties of militarycomptrollers 2
*Job specialty code of civilian conptrollers (numberand nomenclature) 3
*Cptroller experience level 4
*Thzrer of previous tours of duty for military officercomptrollers within the comptrollership specialty area -- 5
*Last tour of duty for military officer comptrollerswithin the comptrollership specialty area 6
*Length of comptroller's current assignment 7
*CmIptroller education (degree, major, institution) 8
*Size of the caummand 9
*Size of the canptroller organization 10
*Comptroller span of control (structure) 11
*Hierarchical levels within comptroller organization(structure) 12
*Level of coumand centralization 13 & 14
*Level of centralization within ccmptrollerorganization (structure) 15
*Formalization of omnptroller organization (structure) 16
*Level of vertical (upward) conmunication in caprollerorganization (structure) 17
*Interdepedence of functions within the captrollerorganization (structure) - 18
*Coordination within the comptroller organization (structure) - 19
*Specialization of functions within the comptrollerorganization (structure) ...... ....- 20
*Routineness of conversion process (technology) 21
*Standardization of inputs (technology) 22
*Predictability of inputs (technology) 23
*Camplexity of conversion process (technology) 24
*Autamtion of conversion process (technology) 25
*Discretion within conversion process (technology) 26
*Output quality control (technology) 27
65

TABLE III-1 (Continued)
*Performance evaluation (technology) 28
*Socio-emtional leadership function (leadership) 29-31
*Task related leadership function (leadership) 32-34
*Tannenbaum and Schmidt's seven different leadershipstyles (leadership) 35
*Decision-making situations (decision-making) 36
*Decision-making methods (decision-making) 37
*Carptroller problem areas (subjective) 38
*Coptrollers' advice (subjective) 39
*Number of military officers serving their firsttour in the ccmptrollership specialty (Jobpreparation of DA junior level camptrollers) 40
*Duty position of military officers serving their firsttour in the cumptrollership specialty (Job preparationof junior level DA comptrollers) 41
*Identification of specific organizational behaviordeficiencies of junior level DA camptrollers. (Jobpreparation of junior level DA ccaptrollers) 42
In utilizing the above information, refer to Appendix D
Questions 11,12,15-28 relate to the technology/structure componentof the Pledger ccaptrollership model
Questions 29-35 relate to the leadership coirponent of the Pledgercomptrollership model
Questions 36 and 37 relate to the decision-making camponent of thePledger comptrollership model
Questions 38 and 39 are subjective in nature but relate to allcomponents of the Pledger carptrollership model (i.e.,environment, technology/structure, leadership, decision-making)
Questions 40-42 relate to the job preparation of junior level DAcamiptrollers.
66
a. Background Questions
Questions 1-10 of the questionnaire which measure
background information on the command and the comptroller are
based on a nominal level of measurement. With this level of
measurement each of the values being assigned to the various
background data is a distinct category, and the value itself
serves merely as a label or name for the category [Nie, et al.,
1975]. No ordering among categories is implicit with this
level of measurement [Pledger, 1980]. The purpose of the
background questions was to permit the breakdown of data by
subsamples such as military comptrollers, civilian comptrollers,
military officer comptrollers with a finance or comptroller
primary specialty, and military officer comptrollers with a
non-finance or non-comptroller primary specialty. Other sub-
samples included comptrollers from different DA Major Commands
(MACOMS) such as USAREUR, Material Development and ReadinessN
Command (DARCOM), Forces Command (FORSCOM), Training and Doc-
trine Command (TRADOC), and the National Guard Bureau (NGB).
The authors have no reason to believe that responses
to the background questions would be biased since the infor-
mation obtained is public and available from other sources.
b. The Pledger Comptrollership Model Questions
(1) Technology and Structure Questions. Questions
11-13 which measure structural characteristics of the comp-
troller organizations are based on a nominal level of measure-
ment. The purpose of questions 11 and 12 was to determine the
span of control and levels in the hierarchy for DA comptroller
67

organizations. The purpose of question 13 was to determine
the comptroller's immediate supervisor within the command
(e.g., commander, executive officer (XO), chief of staff).
The authors have no reason to believe that responses to ques-
tions 11-13 would be biased since the information obtained is
public and available from other sources.
Questions 14-28 which measure technological
and structural characteristics of the comptroller organiza-
tions are based on an interval level of measurement (5 point
Likert scale). With this level of measurement, categories
are not only rank-ordered with respect to some measured char-
acteristic, but the distances between the categories are de-
fined relative to an arbitrary zero point in terms of fixed
and equal units [Nie et al., 1975]. Questions 14-28 were
taken from the questionnaire Pledger sent to United States
Naiy (USN) field level comptroller organizations for the
initial. testing of his comptrollership model. Pledger based
the content of the questions on the Rousseau (1980) matrix
which summarizes the relationships between technology and
structure characteristics that exist within organizations (refer
to Figure II-11). The authors made modifications to these
technology and structure questions after pre-testing the
questionnaire. Questions 14-28 were modified in order to
increase the validity of information obtained from the responses.
These questions were modified by eliminating the interval
scale midpoint labels used in the questionnaire Pledger sent
68
i lI. . ... .. .. . .. .... ... . . -.. .. • % • ... , ii] l

to USN field level comptroller organizations. The purpose of
labeling only the two interval scale end points for each ques-
tion was to reduce the possibility of response bias. Response
bias is possible if the midpoint label does not match the mid-
point line since the authors would not know whether the comp-
trollers were responding in terms of the label or line [Weitzman,
1981]. Another modification consisted of grouping together
all the questions dealing with functions (i.e., Q18-Q21),
inputs (i.e., Q22-Q23) and operations (i.e., Q24-Q25). The
purpose of grouping these similarly worded questions together
was to improve the readability of the questionnaire.
The purpose of the technology and structure
questions was to determine the relationships between tech-
nology and structure characteristics existing within DA comp-
troller organizations. It is possible that bias could result
in the responses to these questions for the following reasons:
(a) Social desirability response bias. Social desirability is
a response bias defined as individuals answering according to
the norms they belive society condones [DA Research Institute
for the Behavioral and Social Sciences, 1976]. Social desira-
bility could encourage some of the DA comptrollers to answer
certain questions in a manner which they think the questions
should be answered, e.g., "rules strictly followed always,"
in order to show themselves in a better light [Pledger, 19801.
Social desirability response bias is likely with questions 15-
17 and 26-28, since these questions tend to provide the
69

opportunity for comptrollers to show themselves as effective
managers. Social desirability response bias is less likely
with questions 14, 18-24 since these questions tend not to
provide the opportunity for comptrollers to show themselves
in a better light as effective managers. An attempt was made
to reduce this type of bias by informing the comptrollers via
a questionnaire cover letter that their responses would, with
the exception of the authors, remain anonymous. (b) Inter-
pretation of word definitions response bias. Interpretation
of word definitions is a response bias defined as individuals
interpreting the same word within a question differently.
For example, two DA comptrollers could interpret the word
"specialized" differently in question #20. This type of
bias is likely with questions 15 and 18-26, since these ques-
tions tend to contain at least one word that comptrollers
could interpret differently such as important, dependent and
specialized. This type of bias is less likely with questions
14, 16, 27-28 since these questions tend not to contain words
that at face value are as likely to be given different inter-
pretations by comptrollers.
(2) Leadership Questions. Questions 29-34 which
measure the socio-emotional and task related dimensions of
leadership behavior for DA comptrollers are based on an inter-
val level of measurement (5 point Likert scale). The questions
were taken from Fleishman's (1957) Leadership Opinion Ques-
tionnaire (LOQ), a 40 question, self administering leadership
inventory. Twenty of the LOQ's questions are consolidated
70 1*
* I

into a scoring key called "consideration" which measures the
respondent's degree of socio-emotional leadership orientation,
while the remaining 20 questions are consolidated into a
scoring key called "initiating structure" which measures the
respondent's degree of task related leadership orientation.
Questions 29-31 were taken from the "con-
sideration" key. The authors selected these three questions
because they have a high correlation with respect to the
consideration key and a low correlation with respect to the
"initiating structure" key (refer to Table 111-2).
Questions 32-34 were taken from the "initiat-
ing structure" key. The authors selected these three questions
because they have a high correlation with respect to the
"initiating structure" key and a low correlation with respect4
to the "consideration" key (refer to Table 111-2).
The purpose of these leadership questions was
to determine the degree to which DA comptrollers perform both
the socio-emotional and task related leadership functions within
their organizations. Social desirability response bias is
possible w.ith these questions since they tend to provide the
opportunity for comptrollers to show themselves in the best
light possible as effective and emphathic managers. Question
35 which measures the types of leadership styles that DA comp-
trollers utilize is based on an ordinal level of measurement.
With this level of measurement, it is possible to rank-order
all of the categories according to some criterion (Nie, and
others, 1975). Questiun 35 was derived from Tannenbaum and
71

TABLE 111-2
SUMMARY OF QUESTIONS SELECTED FROM FLEISHMAN'SLEADERSHIP OPINION QUESTIONNAIRE (LOW)
Correlation
Question Question Consider- InitiatingNumber ation Structure
*CONSIDERATION KEY
29 Are you willing to make .78 .09changes?
30 Do you put suggestions .87 .11that are made by peoplein your work group intooperation?
31 Do you treat all people .66 .28in your work group asyour equal?
**INITIATING STRUCTURE KEY
32 Do you see to it that -.17 .87people in your work groupare working up to theircapabilities?
33 Do you ask that your sub- .25 .72ordinates follow to theletter standard routineshanded down to you?
34 Do you emphasize to your .10 .68subordinates the meetingof deadlines?
"fConsideration"l key measures the respondent's degree ofsocio-emotional leadership orientation.
""ISnitiating structure" key measures the respondent'sdegree of task related leadership orientation.
This summnary of questions selected from the LOQ was derivedfrom the search of Fleishman (1957).
72
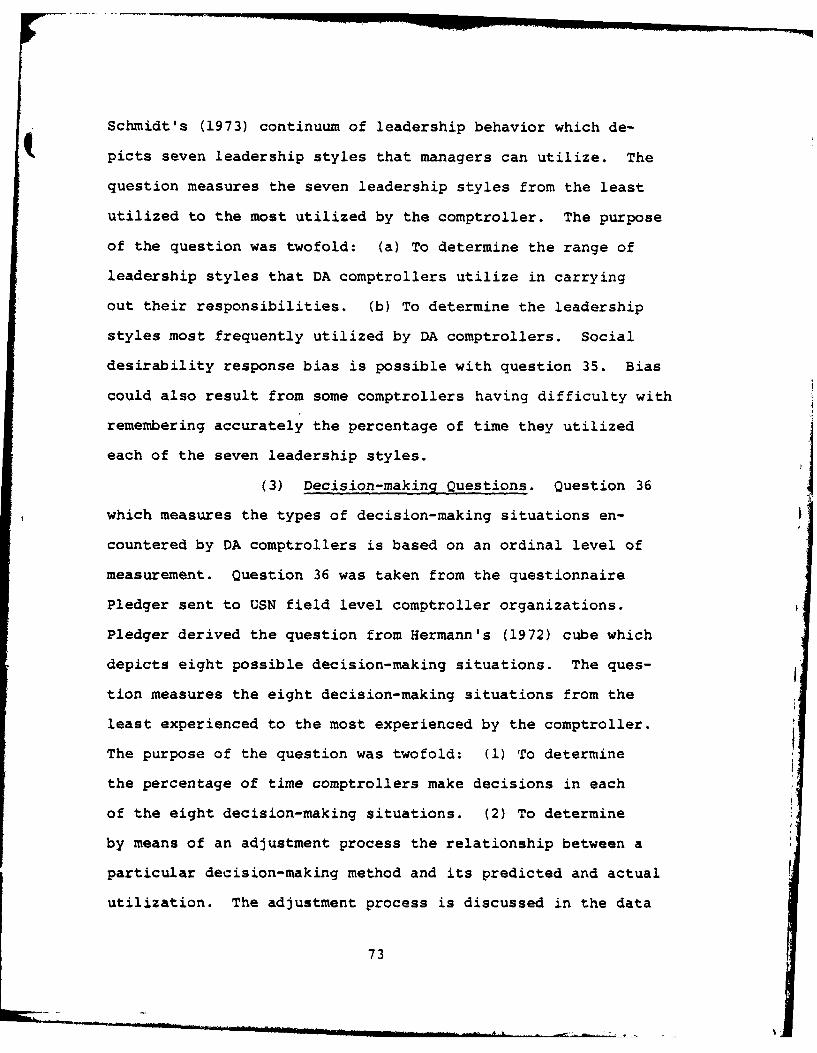
Schmidt's (1973) continuum of leadership behavior which de-
picts seven leadership styles that managers can utilize. The
question measures the seven leadership styles from the least
utilized to the most utilized by the comptroller. The purpose
of the question was twofold: (a) To determine the range of
leadership styles that DA comptrollers utilize in carrying
out their responsibilities. (b) To determine the leadership
styles most frequently utilized by DA comptrollers. Social
desirability response bias is possible with question 35. Bias
could also result from some comptrollers having difficulty with
remembering accurately the percentage of time they utilized
each of the seven leadership styles.
(3) Decision-making Questions. Question 36
which measures the types of decision-making situations en-
countered by DA comptrollers is based on an ordinal level of
measurement. Question 36 was taken from the questionnaire
Pledger sent to USN field level comptroller organizations.
Pledger derived the question from Hermann's (1972) cube which
depicts eight possible decision-making situations. The ques-
tion measures the eight decision-making situations from the
least experienced to the most experienced by the comptroller.
The purpose of the question was twofold: (1) To determine
the percentage of time comptrollers make decisions in each
of the eight decision-making situations. (2) To determine
by means of an adjustment process the relationship between a
particular decision-making method and its predicted and actual
utilization. The adjustment process is discussed in the data
73

analysis plan section of this chapter. Bias could result
from comptrollers interpreting a particular situation differ-
ently. For example, two comptrollers could interprete a
reflexive decision-making situation differently depending on
their familiarity with and understanding of this particular
type of situation. Bias could aslo result from some comp-
trollers having difficulty with remembering accurately the
percentage of time they encountered each of the eight decision-
making situations.
Question 37 which measures the types of deci-
sion-making methods utilized by DA comptrollers is based on
a nominal level of measurement. Question 37 was taken from
the questionnaire Pledger sent to USN field level comptroller
organizations. Pledger derived the question from Allison's
(1971) three types of decision-making methods (i.e., rational,
organizational processes, and bureaucratic politics). The
comptrollers were asked to select six or more choices from
the list of 13 words/phrases (i.e., decision-making techniques)
which pertain to the method(s) they use in making decisions.
Five of the techniques pertain to the rational decision-making
method. Five of the techniques pertain to the organizational
process decision-making method. Three of the techniques per-
tain to the bureaucratic politics decision-making method.
Refer to Table 111-3. The purpose of question 37 was to de-
termine by means of an adjustment process the percentage of
time comptrollers utilize each of the three decision-making
methods in carrying out their responsibilities. The adjustment
74

TABLE 111-3
SUMMARY OF RELATIONSHIPS BETWEEN DECISION-MAKING TECHNIQUES AND ASSOCIATED DECISION-MAKING METHODS
Decision-Making Techniques Assr iated Decision-M.. ng Method
1. Unitary decision maker Ratioual
2. Follow SOP/regulations Organizational Process
3. Personal interests Bureaucratic Politics
4. Prefer incremental change to Organizational Processcurrent policy rather thanradical change if possible
5. State the objective Rational
6. Develop alternatives Rational
7. Sell the decision to the Bureaucratic Politicscomptroller
8. Divide problem into factors Organization Processto be divided among sub-units in the organization
9. Analyze each alterantive (e.g., Rationaleconomic analysis, cost/beneZit,etc.)
10. Effect of decision on my own Breaucratic Politicscareer
11. Usually pick first acceptable Organizational Processalternative
12. List assumptions concerning Rationalalteratives
13. Pick alternative which provides Organizational Processfeedback
The above decision-making techniques are listed in question 37.As indicated 5 techniques pertain to the rational decision-making method. Five techniques pertain to the organizationalprocess method. Three techniques pertain to the bureaucraticpolitics method.
This summary of relationships between decision-making tech-niques and associated decision-making methods was derivedfrom the research of Pledger (1980).
75

process is discussed in the data analysis plan section of
this chapter. Social desirability response bias is possible
with this question due to the choices listed. For example,
it is possible that comptrollers would not admit to consider-
ing their careers or selecting the first acceptable alterna-
tive above all else in making a decision.
(4) Comptroller Problems and Advice Questions.
Question 38 is an open-ended question which documents the
problem areas being encountered by DA comptrollers during
their "first one hundred days" in a new assignment. Question
39 is an open-ended question which documents the advice DA
comptrollers have for the new or future comptroller during
the "first one hundred days" in a new assignment. Both ques-
tions were from the questionnaire Pledger sent to USN field
level comptroller organizations. The purpose of the questions
was twofold: (a) To provide data that could be used to pro-
vide advice to the new or future comptroller pertaining to
their "first one hundred days" in a new assignment. (b) To
provide data so that hypothesis 4 which relates to the tech-
nology and structure within comptroller organizations, could
be tested. Response bias is unlikely with questions 38 and
39 due to their open-ended structure. The open-ended struc-
ture of the questions permits comptrollers to respond in their
own words without restrictions. Additionally, the inclusion
of the words "if any" and "any" within questions 38 and 39
respectively permits comptrollers to respond negatively if
they had no problems or advice.
76L the,

c. Job Preparation of Junior Level ComptrollerQuestions
Questions 40 and 41 which measure background
information on the junior level comptrollers are hsed on a
nominal level of measurement. The purpose of question 40
was to determine the percentage of junior level comptrollers
from the different DA MACOMs such as USAREAJR, DARCOM, FORSCOM,
TRADOC and the NGB. The purpose of question 4. was t4ofold:
(1) To identify the duty positions of junior 1.' el comptrollers.
(2) To identify if junior level comptrollers are in supervisory
and non-supervisory duty positions. The authors have no reason
to believe that responses to these two background questions
will be biased since the information obtained is public and
available from other sources.
Question 42 is a combination open-ended and check-
list question which documents the organizational behavior
deficiencies of junior level comptrollers. The purpose of
the question was twofold: (1) To identify in rank order of
importance the specific organizational behavior deficiencies
of junior level DA comptrollers. (2) To document the comp-
trollers' recommendations regarding improvement of the train-
ing and/or performance of junior level comptrollers. This
documentation provided the authors with information useful in
developing the addendum to Tully and Batiste's proposed PCC.
The purpose of the addendum is to alleviate the main organiza-
tional behavior deficiencies exhibited by junior level DA
comptrollers. Response bias is unlikely with question 42 due
to its open-ended check list type structure.
77

The check list of organizational behavior areas
ref erenced in question 42 serves merely as a guide and/or
reminder to the comptroller respondents. The check list
items are those organizational behavior deficiencies that
Tully and Batiste identified in their thesis. Item 7 on the
check list allows comptrollers to comment on other areas of
concern relating to the job preparation of junior level finan-
cial managers. Many of the comptrollers used this item to
mention technical training as a serious deficiency in the job
preparation of junior level comptrollers. The technical
training deficiency is discussed in the data analysis plan
section of this chapter, and again in Chapters IV and V.
Additionally the inclusion of the word "any" within question
42 permits comptrollers to respond negatively if junior level
comptrollers within their organizations do not exhibit job
preparation deficiencies.
3. Summary
To summarize, this section first defined the purpose
of the questionnaire which was to gather data for testing the
validity of the Pledger comptrollership model and to obtain
information from DA comptrollers concerning their comments on
and recommendations for minimizing any organizational behavior
deficiencies exhibited by junior level financial managers.
Next, the authors discussed questionnaire design by identify-
ing the level of measurement, purpose, and response bias
associated with each set of questions. The authors also dis-
cussed the modifications that were made to the technology and
78

structure questions (i.e., Qll-A28) as a result of pre-testing
the questionnaire.
C. DATA ANALYSIS PLAN
1. The Pledger Comptrollership Model
a. Analysis of Technology/Structure Data
(1) Hypothesis 1.
Hypothesis 1: Systematic relationships (i.e., correla-tions) between the technological and structural variablesof DA comptrollership can be detected.
This hypothesis was tested by performing
bivariate and partial correlation analysis between the tech-
nology and structure variables existing in the DA comptroller
organization. The variables used are based on the Rousseau
(1980) matrix and are listed in Figures 11-12 and 11-13 respec-
tively. Bivariate correlation is a form of analysis of two
variables from which a single number results which is descrip-
tive of the relationship between the variables. This single
number is referred to as the Pearson product moment correla-
tion coefficient, symbolized by "r". The magnitude of the
absolute value of Pearson's "r" is indicative of the amount
of change in one variable which is indicated by change in the
other variable [Nie et al., 1975]. The graph of data points
based on two variables, where one variable defines the horizon-
tal axis is known as a scattergram [Nie et al., 1975].
Pearson's "r" is a measure of the goodness of a fit of a
straight line to the data points of a scattergram. A value
for "r" of +1 or -1 indicates a perfect fit of a straight line
to the data points of a scattergram. The sign indicates
79

whether the relationship is direct ()or inverse (-.For
example a positive "r" indicates that variable X and variable
Y tend to increase or decrease together. A negative "r"
indicates that as variable X becomes larger, variable Y tends
to become smaller. A value for "r" of 0 indicates no linear
relationship between the two variables. The value of Pear-
son's "r" therefore indicates the strength and direction of
the linear relationship between two variables and is completely
devoid of any cause or effect implication [Nie et al., 19751!.
Partial correlation is a form of analysis
that provides a single measure of association describing the
relationship between two variables while adjusting for the
effects of one or more additional variables. Partial corre-
lation can be used to locate spurious correlations. A spurious
correlation is defined as a relationship between two variables,
Xand Y, in which X1 Is correlation with Y is solely the re-
suit of Y varying along with some other variable, X2,1 which
is the true predictor of Y. In this case, when the effects
of X2are controlled (i.e., held constant), Y no longer varies
with X1
Partial correlation can also be used to lo-
cate relationships between variables where none appear to exist.
Situations sometimes exist where theory or intuitive judgment
suggests that there should be a relationship between two varia-
bles, but the data do not indicate any relationship. A possi-
ble reason for this type of situation occurring is that some
other variable or variables are hiding or suppressing the
so

relationship. For example, a variable X1 1 exhibits no posi-
tive relationship to Y because X1has a strong negative rela-
tionship to X2which in turn is positively related to Y.
Therefore, X 1 is positively related to Y when the effects of
Xare held constant LNie et al., 1975].
In performing bivariate and partial correla-
tion analysis of the technology/structure data the authors
followed the steps outlined below.
1. Performed bivariate correlation between the technologyand structure variables. This resulted in a Pearson"r" and significance level "p" for each pair of tech-nology and structure variables.
2. Performed 7th order partial correlation between thetechnology and structure variables in order to identifyseparate effects of all technology variables on thestructure variables. This resulted in a Pearson "r"and significance level "p" for each pair of technologyand structure variables.
3. Identified those pairs of technology and structurevariables that tend to support hypothesis 1.
The technology/structure relationships were
analyzed on an overall basis and by subsamples. The 10 sub-
samples and their abbreviated designations are outlined
in Table 111-4.
(2) Hypotheses 2, 3, and 4.
Evoothesis 2: DA comptrollership exhibits technologicalsimilarities (i.e., fairly standardized products, fairlypredictable production steps, some unpredictability andproduct variations) to Woodward's "large batch/massproduction" type firms and will therefore exhibit corres-pondingly similar structural relationships (i.e., for-malized structure, administratively organized with line-staff separation, clearly defined positions, clearchain of command).
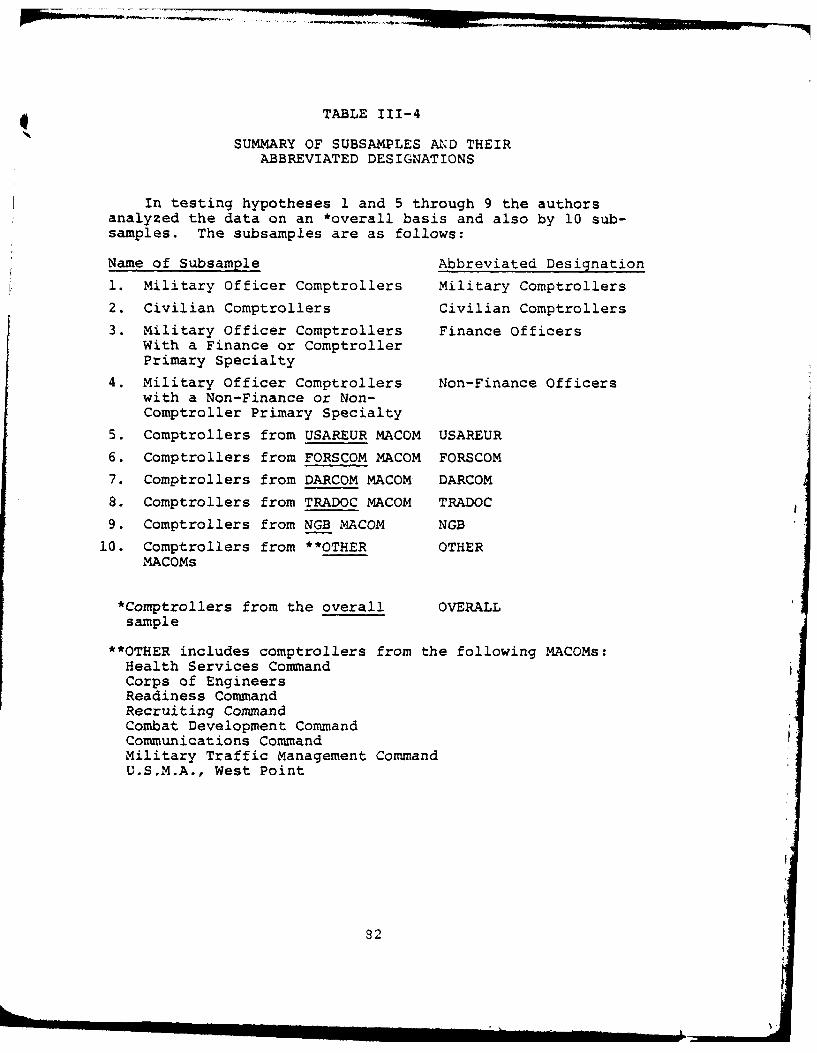
TABLE 111-4
SUMMARY OF SUBSAMPLES AND THEIRABBREVIATED DESIGNATIONS
In testing hypotheses 1 and 5 through 9 the authorsanalyzed the data on an *overall basis and also by 10 sub-samples. The subsamples are as follows:
Name of Subsample Abbreviated Designation
1. Military Officer Comptrollers Military Comptrollers
2. Civilian Comptrollers Civilian Comptrollers
3. Military Officer Comptrollers Finance OfficersWith a Finance or ComptrollerPrimary Specialty
4. Military Officer Comptrollers Non-Finance Officerswith a Non-Finance or Non-Comptroller Primary Specialty
5. Comptrollers from USAREUR MACOM USAREUR
6. Comptrollers from FORSCOM MACOM FORSCOM
7. Comptrollers from DARCOM MACOM DARCOM
8. Comptrollers from TRADOC MACOM TRADOC
9. Comptrollers from NGB MACOM NGB
10. Comptrollers from **OTHER OTHERMACOMs
*Comptrollers from the overall OVERALLsample
**OTHER includes comptrollers from the following MACOMs:Health Services CommandCorps of EngineersReadiness CommandRecruiting CommandCombat Development CommandCommunications CommandMilitary Traffic Management CommandU.S.M.A., West Point
32

Hypothesis 3: The technology of comptrollership in theDA is of Perrow's Routine type (well structured/low varia-bility and few exceptions) and displays correspondingstructural characteristics (centralized power held bycomptroller, high interdependence and high coordinationrequired among functions within the organization).
Hypothesis 4: DA comptroller organizations operate inbasically stable environments and exhibit mechanisticsystems of management.
In testing hypothesis 2 the authors followed
the steps outlined below.
1. Based on the research of Pledger (1980) the authorsselected certain variables which measure the techno-logical and structural similari1-i,--z of DA comptrollerorganizations to Woodward's ".Large batch/mass produc-tion" type firms. These variables are outlined in
Table 111-5.
2. The means of the selected technology variables wereexamined to determine whether they support the hypothe-sis. Based on the research of Pledger (1980) a mid-range (i.e., 2.5-3.5) value for the means of thesetechnology variables would tend to support the hypothe-sis. Based on the research of Pledger (1980) a low(i.e., less than 2.5) or high (i.e., greater than 3.5)value for the means of these technology variables wouldtend not to support the hypothesi~s. For example,based on Pledger's (1980) research the authors selectedroutineness of conversion to measure whether DA comp-troller organizations employ fairly predictable produc-tion steps. A mean of 2.5-3.5 for this variable wouldtend to indicate that DA comptroller organizations doemploy fairly predictable production steps. Conversely,a mean of 1.0-2.0 or 4.0-5.0 for routineness of conver-sion would tend to indicate that DA comptrollers organi-zations do not employ fairly predictable productionsteps. Conducted a comparison of the sample mean withthe hypothesized population mean (i.e., 2.5-3.5) usinga t-test at the 95% confidence interval.
3. The means of the selected structure variables wereexamined to determine whether they support the hypothe-sis. Based on Pledger's (1980) research a low (i.e.,less than 2.5) value for the means of these structurevariables would tend to support the hypothesis. Basedon Pledger's (1980) research a midrange (i.e., 2.5-3.5)or high (i.e., greater than 3.5) value for the means ofthese structure variables would tend not to support thehypothesis. Conducted a comparison of the sample mean withthe hypothesized population mean (i.e., less than 2.5)using a t-test at the 95% confidence interval.

TABLE 111-5
SUMMARY OF VARIABLES AND BACKGROUND COMPTROLLER INFORMATIONUSED IN TESTING HYPOTHESES 2 THROUGH 4
Hypothesis 2:
Appropriate Variable or Back-ground Information Used in
Technological Similarities Measurement and Support Respectively
1. Fairly Standardized Standardization of Inputs *(TV);Products Figure 11-2, Comptroller Functions
2. Fairly Predictable Routineness of Conversion (TV) andProduction Steps Automation of Conversion (TV)
3. Some Unpredictability Input Predictability (TV) andRoutineness of Conversion (TV)
4. Product Variations Appendix A*(BI)
Structural Similarities
1. Formalized Structure Formalization of ComptrollerOrganization *(SV) and **Sub-ordinates Follow StandardRoutines
2. Administratively Figure 11-4, Configuration of aOrganized DA Comptroller Organization (BI)
3. Clearly Defined Specialization of Functions (SV)Positions
4. Clear Chain of Command Figure 11-4
Hypothesis 3:
Technology
1. Well Structured ***Summation of the Means for 6Technology Variable3
2. Low Variability and Routineness of Conversion andFew Exceptions Input Predictability (TV)
Structure
1. Centralized Power Held Centralization of Comptrollerby Comptroller Organization (SV)
2. High Interdependence Interdependence Among FunctionsAmong Functions (SV)
84

TABLE 111-5 (CONTINUED)
Appropriate Variables or Back-ground Information Used inMeasurement and Support Respectively
3. High Coordination Coordination Among Functions (SV)Among Functions
Hypothesis 4:
Stable Environment
1. Little or no Change in Standardization of Inputs (TV);Technology Input Predictability (TV);
Routineness of Conversion (TV)
2. Little or no Change Figure 11-3, Flow of Comptrollerin Market Structure Functions (BI)
Mechanistic System ofManagement
1. Reliance on Formal Formalization of ComptrollerRules and Regulations Organization (SV)
2. Decisions Made at the Centralization of ComptrollerTop of the Organization Organization (SV)
3. Narrow Spans of Span of Control (SV)Control
4. Vertical Vertical Communications (SV)Communications
*(TV)--Technology Variable(BI)--Comptroller Background Information(SV)--Structure Variable
**The authors used one question from the leadership section ofthe questionnaire to provide support for hypothesis 2.
***The 6 technology variables are routineness of conversion,standardization of inputs, predictability of inputs,automation of conversion, output quality control, andperformance evaluation.
85

4. The authors also used background information from ChapterII pertaining to the integrated DA comptroller functionsand the configuration of DA comptroller organizations toprovide support for this hypothesis. This hickground comp-troller information is outlined in Table 11L-5.
In testing hypothesis 3 the authors followed the
steps outlined below.
1. Based on the research of Pledger (1980) the authors select-ed certain variables to measure whether the technology inthe DA is of Perrow's Routine type and is associated witha formal centralized type of structure. These technologyand structure variables are outlined in Figure 111-5.
2. The means of the selected technology variables were exam-ined to determine whether they support hypothesis 3. Basedon Pledger's (1980) research a low (i.e., less than 2.5)value for the means of these variables would tend to sup-port the hypothesis. A midrange (i.e., 2.5-5.0) or highvalue for the means of these variables would tend not tosupport the hypothesis. Conducted a comparison of thesample mean with the hypothesized population mean (i.e.,less than 2.5) using a t-test at the 95% confidence interval.
In testing hypothesis 4 the authors followed theA
steps outlined below.
1. Based on the research of Pledger (1980) the authors selectedcertain variables to measure whether DA comptroller organi-zations operate in stable environments and exhibit mechan-istic systems of management. These technology and struc-ture variables are outlined in Figure 111-5.
2. The means of the selected technology variables were examinedto determine whether they support hypothesis 4. Based onPledger's (1980) research a low (i.e., less than 2.5) ormid-range (i.e., 2.5-3.5) value for the means of the tech-nology variables would tend to support the hypothesis. Ahigh (i.e., greater than 3.5) value for the means of thetechnology variables would tend not to support the hypothe-sis. Conducted a comparison of the sample mean with thehypothesized population mean (i.e., 1.0-3.5) using a t-test at the 95% confidence interval.
3. The means of the sele';-ted structure variables were examinedjto determine whether they support hypothesis 4. Based onPledger's (1980) researcha low (i.e., less than 2.5) valuefor the means of the structure variables would tend to sup-port the hypothesis. A midrange (i.e., 2.5-3.5) or high(i.e., greater than 3.5) would tend not to support thehypothesis. Conducted a comparison of the sample mean withthe hypothesized population mean (i.e., less than 2.5)using a t-test at the 95% confidence interval.

4. The authors also used background information from Chap-ter II pertaining to the performance of comptrollerfunctions at the division, installation, and MACOMlevels of command to provide support for this hypothe-sis. This background information is outlined in Table11I-5.
5. Content analysis was conducted of the comptrollers'general comments concerning problems experienced andadvice to the new comptroller in order to provide furthersupport for hypothesis 4. The authors identified anddocumented the most frequently mentioned problems andstatements of advice.
The technology/structure data relating to
hypotheses 2, 3, and 4 were analyzed on an overall sample
basis only (i.e., the data relating to these 3 hypotheses were
not anlayzed by subsamples).
b. Analysis of Leadership Data
(1) Hypotheses 5 and 6
Hypothesis 5: DA comptrollers perform both the socio-emotional and task related leadership functions withintheir organizations.
Hypothesis 6: DA comptrollers will be higher in thesocio-emotional dimension than the task related dimension.
Hypothesis 5 was tested by combining the
means of the responses to questions 29-31 and 32-34 which
measure the degree to which DA comptrollers perform the
socio-emotional and task related leadership functions respec-
tively. The means for the two sets of questions (i.e., Q29-31
and Q32-34) can vary between 0 and 12. A mean of 0 for each
set of questions would i.ndicate the highest degree of socio-
emotional and task related leadership orientation. A mean of
12 for each set of questions would indicate the lowest degree
of socio-emotional and task related leadership orientation.
Based on this information the means for the two sets of
97

questions were examined to determine whether they support the
hypothesis. A low (i.e., less than 4) or midrange (i.e., 4.0-
8.0) value for these two means would tend to support the
hypothesis. A high (i.e., greater than 8.0) value for either
one of these two means would tend not to support the hypothesis.
The authors conducted a comparison of each sample mean with
the hypothesized population mean (i.e., 0 < 3F< 8.0) using a
t-test at the 95% confidence interval.
Hypothesis 6 was tested by conducting a com-
parison of the sample means using a t-test. The purpose of
conducting the t-test was to compare the socio-emotional and
task related leadership function means at the 95% confidence
interval in order to determine whether the two means are
significantly different.
(2) Hypotheses 7 and 8
Hypothesis 7: On Tannenbaum and Schmidt's continuum ofleadership behavior, DA comptrollers will utilize a widerange (i.e., 5-7 styles) of leadership styles in carryingout their responsibilities.
Hypothesis 8: DA comptrollers will strike a relativebalance between managerial authority and subordinate free-dom by utilizing over 50% of time the middle three leader-ship styles depicted along Tannenbaum and Schmidt'scontinuum of leadership behavior.
In testing hypothesis 7 the authors followed
the steps outlined below.
1. Determined mean for the number of leadership stylescomptrollers utilize in carrying out theirresponsibilities.
2. Conducted a comparison of the sample mean with thehypothesized population mean (i.e., greater than orequal to 5) using the t-test at the 95% confidenceinterval.

In testing hypothesis 8 the authors followed
the steps outlined below.
1. Combined the percentage of utilization means for themiddle three leadership styles depicted along Tannen-baum and Schmidt's continuum of leadership behavior.
2. Conducted a comparison of the combined sample mean withthe hypothesized population mean (i.e., greater thanor equal to 50%) using the t-test at the 95% confidenceinterval.
The leadership data were anlayzed on an
overall basis and by subsamples.
c. Analysis of Decision-Making Data--Hypothesis 9
Hypothesis 9: DA comptrollers use mixed decision-makingmethods as decision-making situations change.
This hypothesis was tested by determining the
relationship between a particular decision-making method
(i.e., rational, organizational processes, and bureau-
cratic politics) and its predicted and actual utilization.
In determining these three relationships the authors followed
the steps outlined in Table 111-6. A summary of these steps
is as follows:
PREDICTED UTILIZATION
i. Calculated the means for the percentage of timecomptrullers make decisions in each of the eightdecision-making situations.
2. Combined the means for the first group of situations(i.e., innovative, inertia, deliberative) since theyare associated with the rational method. Combined themeans for the second group of situations (i.e., circum-stantial, routine, crisis, reflexive, administrative,possible innovative, possibly deliberative) since theyare associated with the organizational processes method.Combined the means for the third group of situations(i.e., possibly crisis, possibly reflexive) since theyare associated with the bureaucratic politics method.The combined means represent the raw percentage ofpredicted utilization for the three decision-making methods.i 89

TABLE 111-6
PROCEDURAL STEPS FOR DETERMINING RELATIONSHIP BETWEENA PARTICULAR DECISION-MAKING METHOD AND ITS
PREDICTED AND ACTUAL UTILIZATION
A. Predicted Utilization
1. As discussed in Section D.l.b of Chapter 11, Pledger (1980)hypothesized that certain decision-making methods would mostlikely be utilized in each of the eight decision-making situa-tions. These methods and situations are summarized as follows:
APPROPRIATE METHOD DECISION-MAKING SITUATIONI
a. Rational Innovative, Inertia,Deliberative
b. organizational Processes Circumstantial, Routine,Crisis, Reflexive, Admin-istrative (Possible Inno-vative, Deliberative)
c. Bureaucratic Politics Possibly Crisis, Reflexive
Pledger based the associations on 16 propositions which indi-cate actions resulting from three dimensions of threat, timefuze and awareness. These propositions are listed in Appen-dix C.
2. Calculated the means for the percentage of time comptrollersmake decisions in each of the eight decision-making situations.
3. Combined the means for the first group of situations (i.e.,innovative, inertia, deliberative) since they are asso..iatedwith the rational method. Combined the means for the secondand third group of situations in the same manner since theyare associated with the organizational processes and bureau-cratic politics method respectively. The combined meansrepresent the raw percentages of predicted utilization forthe three decision-making methods.
4. Used adjustment process to compensate for some of thedecision-making situations being associated with more thanone decision-making method. Adjustment process had two steps.First, the raw percentages of predicted utilization were addedin order to calculate a total raw percentage. Second, eachof the three raw percentages were divided by the total rawpercentage in order to calculate the adjusted percentage ofpredicted utilization. The following is an example of theauthors' implementation of steps 1 through 4 listed above.The data is for example purposes only.
90

TABLE 111-6 (CONTINUED)
SITUATION PERCENT OFPREDICTED UTILIZATION
Raw Adjusted
A. Innovative, Inertia, Delibera-tive* 40% 25%
B. Circumstantial, Routine, Crisis,Reflexive, Administrative (Pos-sibly Innovative, Delibera-tive) ** 90% 56%
C. (Possibly Crisis, Reflexive)*** 30% 19%
*Associated with rational method"*Associated with organizational process method
***Associated with bureaucratic politics method
5. Combined the means for the three groups of situationsexcluding those situations that are possibly associated withthe organizational processes and bureaucratic politics method.Those situations that are possibly associated with the organi-zational processes method are innovative and deliverative.Those situations that are possibly associated with the bureau-cratic politics method are crisis and reflexive. No adjustmentprocess is necessary. The following is an example of theauthors' implementation of this step.
SITUATION PERCENT OFPREDICTED UTILIZATION
A. Innovative, Inertia, De-liberative 40%
B. Circumstantial, Routine, Crisis,Reflexive, Administrative 60%
C. None 0%
6. The end result of steps 1 through 5 is the establishmentof an interval for the mean percentage of predicted utiliza-tion. (Refer to example below)
DECISION-MAKING METHOD PREDICTED UTILIZATION
a. Rational 25-40%
b. organizational Processes 60-90%
c. Bureaucratic Politics 0-19%
91

TABLE 111-6 (CONTINUED)
B. Actual Utilization
1. As discussed in Section B.2.b1(3) and Table 111-3 of thischapter the different decision-making techniques listed inquestion 37 are associated with certain decision-making methods.Techniques 1, 5, 6, 9, and 12 are associated with the rationalmethod. Techniques 2, 4, 8, 11, and 13 are associated withthe organizational processes method. Techniques 3, 7, and 10are associated with the bureaucratic politics method.
2. Determined the percentage of selection for the techniquesassociated with the rational method; for the techniquesassociated with the organizational processes method; for thetechniques associated with the bureaucratic politics method.This conversion of question 37 responses from a binary (i.e.,yes/no) basis to a percentage of selection basis takes intoaccount, the unequal number of techniques associated with eachof the three methods. These selection percentages representthe raw percentage of actual utilization for the three methods.
3. Used adjustment process to calculate the percentage ofactual utilization for the three methods. Adjustment proc-ess was twofold: First, the raw percentages of actual utili-zation were added in order to calculate a total raw percentage.Next, each of the three raw percentages were divided by thetotal raw percentage in order to calculate the adjusted per-centage of actual utilization. The following is an exampleof the authors' implementation of steps 1 through 3 listedabove. The data is for example purposes only.
TECHNIQUES (Refer to Table PERCENT OF111-3) ACTUAL UTILIZATION
Paw**** Adjusted
a. 1,5,6,9,12 78% 60%
b. 2,4,8,11,13 42% 32%
C. 3,7,10 10% 8%
****Comptrollers selected 78% of all the available decision-making techniques associated with the rational decision-makingmethod, 42% of all available techniques associated withthe organizational processes method, and 10% of all the avail-able techniques associated with the bureaucratic politicsmethod.
C. T-Test
Conducted a comparison of the mean percentage of actual uti-lization with the mean percentage of predicted utilizationusing the t-test at the 95% confidence interval. These
92

( TABLE 111-6 (CONTINUED)
comparisons were conducted for each of the three decision-making methods. The purpose of conducting the t-test was todetermine whether a significant difference existed betweenthe actual utilization mean and the predicted utilization mean(i.e., that comptrollers use mixed decision-making methods asdecision-making situations change). For a significant dif-ference to exist, the actual utilization mean cannot fallwithin the interval established for the predicted utilizationmean.
ii
93

3. Adjusted the raw percentage of predicted utilizationinto a final percentage of predicted utilization.This adjustment process was necessary to compensatefor some of the decision-making situations being asso-ciated with more than one decision-making method.
4. Combined the means for the three groups of situationsexcluding those situations that are possibly associatedwith the organizational processes and bureaucratic poli-tics method. Calculated a percentage of predictedutilization. In this case no adjustment process wasnecessary.
5. The end result of steps 1 through 4 above is the estab-listment of an interval for the mean percentage of pre-dicted utilization (e.g., rational decision-makingmethod--its predicted utilization is 25-40%).
ACTUAL UTILIZATION
1. Determined the percentage of selection for decision-makingtechnigues associated with the rational method; forthe techniques associated with the organizationalprocess method; for the techniques associated with thebureaucratic politics method. This conversion ofquesticn 37 responses from a binary (i.e., yes/no)basis to a percentage of selection basis takes intoaccount, the unequal number of techniques associatedwith each of the three methods. These selection per-centages represent the raw percentage of actual utili-zation for the three decision-making methods.
2. Used adjustment process to convert the raw percentageof actual utilization into a final percentage of actualutilization. This was done for each of thle threedecision-making methods.
T-TEST
1. Conducted a comparison of the mean percentage of actualutilization with the mean percentage of predictedutilization using the t-test at the 95% confidenceinterval. These comparisons were conducted for eachof the three decision-making methods.
2. The purpose of conducting the t-test was to determinewhether a statistically significant difference existedbetween the actual utilization mean and the predictedutilization mean (i.e., that comptrollers utilize mixeddecision-making methods as decision-making situationschange) . For a significant difference to exist, theactual utilization mean cannot fall within the intervalestablished for the prediction utilization mean.
94

2. Job Preparation of Junior Level Comptrollers
The comptrollers' comments on the organizational be-
havior deficiencies exhibited by junior level comptrollers
were categorized and ranked in order of importance. The
ranking process consisted of documenting the frequency with
which comptrollers mentioned the various deficiencies.
Specifically, the authors determined the number of comptrollers
mentioning a particular deficiency. Additionally, the authors
determined the number of comptrollers mentioning a particular
deficiency as both a percentage of those who replied co the
question and as a percentage of those who returned
questionnaires.
The comptrol'ers' recommendations regarding improve-
ment of the training and/or performance of junior level
comptrollers were documented and evaluated in order to pro-
vide the authors with information useful in developing the
addendum to Tully and Batiste's proposed PCC. Specifically,
the recommendations listed are the comptrollers' verbatim
responses to the second part of question 42. The second part
of question 42 reads as follows: "What are your recommenda-
tions for improving the training and/or performance of junior
comptrollers?"
3. Summary
This section contained a detailed description of the
data analysis plan. The first part of the description focused
on how the data relating to the Pledger comptrollership model
were analyzed to test hypotheses 1 through 9. The second
95

AD-AII 938 NAVAL POSTGRADUATE SCHOOL MONTEREY CA F/6 5/9AN ORGANIZATIONAL. BEHAVIOR VIEW OF DEPARTM4ENT OF THE ARMY (DA) -ETC(U)DEC 81 M J GRISWOLD, K J KEHOE
UNCLASSIFIED NL23 fflfflfllfllflfflfIIIIIIIIIIIIII~fIIIIIIIIIIIIIIffllfllfEEEEEEEEIIEEEEIIIIIIIIIIIIIIEIIIIIIIIIIIIIIfflffl.
H~IJjj 1.8
MI(NOOV lW 0 ll0 Ii l 11AW

part of the description focused on how the comptrollers' com-
ments on the organizational behavior deficiencies exhibited
by junior level comptrollers were ranked in order of impor-
tance. A summary of how the nine hypotheses were tested
and how the ranking process was conducted is outlined in
Table 111-7.
D). DATA PREPARATION
1. General
The purpose of this section is to first identify the
sample selected to receive the questionnaire. Next, those
comptrollers responding to the questionnaire are identified.
Finally, three tables are presented that summarize the responses
to the questions relating to background information, the
Pledger comptrollership model and the job preparation of
junior level comptrollers. The descriptive statistics pre-
sented in the three tables are based on data from the over-
all sample (i.e., the 136 comptrollers who returned questionnaires).
2. The Sample
The primary criterion selection was ensuring that
comptrollers from a large representative sample of DA com-
mands in CONUS and USAREUR received the questionnaire. This
criterion was used since the great majority of DA soldiers
and comptroller organizations are located in CONUS and USAREUR.
The "Autovon Directory for DA Financial Management Personnel",
published in the January 1981 edition of the DA All Points
Bulletin was used to identify the 246 CONUS and USAREUR
96

TABLE 111-7
SUMMARY OF DATA ANALAYSIS PLAN4
The following is a summary of how hypotheses 1 through9 were tested and how the comptrollers' comments on theorganizational behavior deficiencies exhibited by juniorlevel comptrollers were ranked in order of importance.
A. The Pledger Comptrollership Model
Hypothesis Data Analysis Plan
1. 1 Performed bivariate and partial correla-tion analysis between the technologyand structure variables existing in DAcomptroller organizations.
2. 2,3, and Based on the research of Pledger (1980)4 the authors selected certain variables
to measure the technology and structurecharacteristics of DA comptroller organi-zations. The means of these selectedtechnology and structure variables wereexamined to determine whether they supportthe hypotheses. The examination consistedof comparing the sample means with thehypothesized population means using a t-test at the 95% confidence interval. Alsoused certain DA background comptrollerinformation from Chapter II to providesupport for these hypotheses. The varia-bles and background information are out-lined in Table 111-5. Finally, contentanalysis was conducted of the comptrollers'general comments concerning problems ex-perienced and advice to the new comptrollerin order to provide further support forhypothesis 4.
3. 5 Combined and then examined the means of theresponses to questions 29-31 and 32-34which measure the degree to which DA comp-trollers perform the socio-emotional andtask related leadership functions respec-tively. Conducted a comparison of eachsample mean with the hypothesized populationmean (i.e., 0-8.0) using a t-test at the95% confidence interval.
4. 6 Conducted a comparison of the sample meansusing a t-test at the 95% confidenceinterval.
97

TABLE 111-7 (CONTINUED)
Hypothesis Data Analysis Plan
5. 7 Determined mean for the number of leader-ship styles comptrollers utilize incarrying out their responsibilities.Conducted a comparison of the samplemean with the hypothesized populationmean using a t-test at the 95% confi-dence interval.
6. 8 Combined the percentage of utilizationmeans for the middle three leadershipstyles depicted along Tannenbaum andSchmidt's continuum of leadership be-havior. Conducted a comparison of thecombined sample mean with the hypothe-sized population mean using a t-test atthe 95% confidence interval.
7. 9 Determined the relationship between aparticular decision-making method (i.e.,rational, organizational processes, andbureaucratic politics) and its predictedand actual utilization. (Refer to Table111-6.)
B. Job Preparation of Junior Level Comptrollers
Comptroller Commentsand Recommendations Data Analysis Plan
1. Comptroller comments Comments categorized rankin ,on the organizational in order of importance. Thebehavior deficiencies ranking process consisted ofexhibited by junior documenting the frequency withlevel comptrollers. which comptrollers mentioned the
various deficiencies.
2. Comptroller re- 7r,.-.)trollers1 recommendationscommendations for mini- rding improvement of themizing the organization- i ing and/or performance ofal behavior deficiencies jun~or level comptrollers wereexhibited by junior documented and evaluated in orderlevel comptrollers. to provide the authors with in-
formation useful in developingthe addendum to Tully and Batiste'sproposed PCC.
98

comptroller organizations that were mailed questionnaires.
All CONUS and USARELA comptroller organizations listed in
the "Autovon Directory for DA Financial Management Personnel"
were sent questionnaires. According to [Becker, 19811 this
list represents at least 90-95% of the entire population of
CONUS and USAREUR comptroller organizations. Comptrollers
were informed via a questionnaire cover letter that only the
authors would review the questionnaire and guarantee the
anonymity of all respondents. A total of 136 questionnaires
were received and compiled. The number and percentage of
comptroller respondents from the different DA MACOMS is out-
lined in Table 111-8. Of the comptrollers returning ques-
tionnaires, 60.3% were military and 39.7% civilian (question
1). First tour comptrollers comprised 64% of the respondents,
with the remaining 35.3% serving in follow-on comptroller
tours (question 4). one comptroller (0.7%) did not answer
question 4). The average experience on the job was 28.8
months (question 7). The average comptroller organization
consisted of 109 personnel with a standard deviation of 127
personnel (question 10). The large standard deviation indi-
cates a lack of homogeneity of size.
3. Summary of Descriptive Statistics
The descriptive statistics for the background questi.ons
are outlined in Table 111-9.
The descriptive statistics for the Pledger comtroller-
ship model questions are outlined in Table 111-10. Comp-
trollers utilized the middle leadership style (i.e., style D)
99

TABLE 111-8
NUMBER AND PERCENTAGE OF COMPTROLLER RESPONDENTS
FROM THE DIFFERNET DA MACOMS
MACOM of Respondents Number Percent
i. USAEUR 9 6.6%
2. FORSCOM 28 20.6%
3. DARCOM 29 21.3%
4. TRADOC 19 14.0%
5. Health Services command 7 5.1%
6. Corps of Engineers 6 4.4%
7. NGB 18 13.2%
8. others* 20 14.7%
* Readiness Command
Recruiting Command
Combat Developments Command
Conmunications Command
Military Traffic Management command
U.S.M.A., West Point
100

TABLE 111-9
SUMMARY OF DESCRIPTIVE STATISTICS FOR THEBACKGROUND QUESTIONS (Ql-Q10)
Major Commands of RespondentsPercent of
Number Respondents
USAREUR 9 6.6%FORSCOM 28 20.6%DARCOM 29 21.3%TRADOC 19 14.0%HEALTH SERVICES COMMAND 7 5.1%CORPS OF ENGINEERS 6 4.4%NATIONAL GUARD 18 13.2%OTHERS 20 14.7%
1A. Category of Respondents
Number Percent
Military 82 60.3%Civilian 54 39.7%
136 100.0%
lB. Military Rank or CivilianGrade of Respondents
Number Percent
Captain 2 1.5%Major 6 4.4%Lt. Colonel 35 25.7%Colonel 35 25.7%Brig. General 4 2.9%GS 12 19 14.0%GS 13 11 8.1%GS 14 15 11.0%GS 15 8 5.9%
2A. Primary Specialty of Military Officer Comptrollers
Number Percent
Finance/Comptroller 30 36.6%Non-Finance/Comptroller 52 63.4%
2B. Secondary Specialty of Military Officer Comptrollers VNumber Percent
Comptroller (45) 61 77.2%Non-Comptroller 18 22.8%
101

TABLE 111-9 (CONTINUED)
3. Specialty of Civilian Comptrollers
Number Percent
55 Financial Manager 1 1.9%341 Administrative officer 1 1.9%345 Program Analyst 1 1.9%501 Resource Management! 3 5.7%
Financial officer505 Financial Manager 40 75.5%510 Accounting Officer 2 3.8%610 Financial Manager 5 9.4%
4. Respondents Serving First Tour as Comptrollers
Number Percent
First Tour 87 64.0%Not First Tour 48 35.3%Missing 1 0.7%
5. Previous Tours in Comptroller Field For Military OfficersI
Number Percent
None 15 18.5%One Tour 25 30.9%Two Tours 16 19.8%Three Tours 11 8.1%Four or More Tours 14 17.2%
6. Military Officers Who Served As Comptroller in Last Tour
Number Percent
Affirmative 41 50%Negative 41 50%
7. Length In Current Assignment In Months
Mean STD DEV Range
29.8 31.04 1-180
8A. Level of Education
Number Percent
Doctorate 2 1.5%Masters 81 59.6%Bachelors 40 29.4%Other 10 7.4%Missing 3 2.2%
102

TABLE 111-9 (CONTINUED)
8B. Degree Area
Number Percent
Financial 89 65.4%INon-Financial 42 30.9%Missing 5 3.7%
8C. Comptrollers Receiving Advanced Degree From Syracuse
Number Percent
Syracuse Gradu~ate 24 17.6%Other 109 80.1%
Missing 322
9. Size of CommandINumber Percent0 to 5000 64 47.1%5000 to 10000 24 17.6%10000 to 15000 15 11.0%15000 to 20000 9 6.6%Greater than 20000 20 14.7%missing 4 2.9%
10. Number of Perso'nnel in Comptroller organization
Mean STD DEV Range
109.47 127.30 5-740
103

TABLE III-10
SUMMARY OF DESCRIPTIVE STATISTICS FOR THEPLEDGER COMPTROLLERSHIP MODEL QUESTIONS (Qll-Q37)
Summary of Technology and Structure Questions (Ql1-Q28)
13. Level to Which the Comptroller Reports
Number Percent
Commander 57 41.9%Chief of Staff 49 36.0%Executive Officer 25 18.4%Other 5 3.7%
Mean STD DEV Range# ofActual Responses
11. Span of Control 5.86 2.60 1-1512. Levels of Hierarchy In 3.02 1.24 1-8
Comp Org*14. Levels of Command 3.46 .96 1-5
Centralization15. Level of Comp Org 3.57 1.09 1-5
Centralization16. Formalization of Comp Org 2.03 0.56 1-417. Level of Vertical 1.53 0.63 1-3
Communications18. Interdependence Within 2.42 1.02 1-5
Comp Org19. Coordination Within 1.52 0.80 1-4
Comp Org20. Specialization Within 1.87 0.71 1-4
Comp Org21. Routineness of Conversion 3.07 0.79 1-5
Process22. Standardization of 2.71 0.83 1-5
Inputs23. Predictability of Inputs 2.60 0.78 1-424. Complexity of Conver- 1.93 0.74 1-4
sion Process25. Automation of Conver- 3.10 1.02 1-5
sion Process26. Discretion in Conver- 2.46 1.05 1-5
sion Process27. Output Quality Control 1.61 0.75 1-428. Performance Evaluation 1.81 0.81 1-4* Comp Org is an abbreviation for comptroller organization.
# The numbers in this column represent the range of actualresponses from the comptrollers. For questions 14-28 therange of possible responses was 1-5. For questions 29-34the range of possible responses was 0-4. For question 35the range of possible responses was 0-100 for each ieadershipstyle. For question 36 the range of possible responses was0-100 for each decision-making situation.
104

TABLE III-10 (CONTINUED)
Summary of Leadership Questions (Q29-Q35)
Socio-Emotional Leadership Functions
Mean STD DEV Range# ofActual Responses
29. Willingness to Change 0.82 0.71 0-430. Willingness to Use 1.08 0.46 0-4
Suggestions31. Equality of Treatment 1.08 0.95 0-4
Task Related Leadership Functions
32. Personnel Working to 0.98 0.67 0-4Capacity
33. Subordinates Follow 1.64 0.99 0-4Standard Routines
34. Subordinates Meet 0.40 0.67 0-4Deadlines
35. Leadership Styles
A. Manager Makes Decision 7.62 8.32 0-50B. Manager Sells Decision 6.65 8.46 0-80C. Manager Presents Ideas/ 12.36 10.61 0-80
Gets QuestionsD. Manager Presents Tenta- 6.08 6.00 0-40
tive Decision Subjectto Change
E. Manager Presents Problem/ 29.36 22.45 0-99Gets Suggestions MakesDecision
F. Group Makes Decision 8.05 9.83 0-80G. Subordinates Function 30.13 23.57 0-90
Within Prescribed Limits
Summary of Decision Making Questions (Q36 & Q37)
36. Decision Making Situations
A. Crisis Situation 15.36 15.78 0-95B. Innovative Situation 12.15 9.29 0-50C. Inertial Situation 5.43 5.50 0-40D. Circumstantial Situation 7.23 6.02 0-40E. Reflexive Situation 11.09 7.48 0-40F. Deliberative Situation 18.98 15.67 0-93G. Routine Situation 18.54 16.45 0-80H. Administrative Situation 11.43 8.11 0-40
105

TABLE III-10 (Continued)
37. Decision making Methods
Numiber of Comp- Percent oftrollers Utilizing Sample
A. Unitary Decision maker 26 19.1%B. Follow SOP/Regulations 101 74.3%C. Personal Interests 17 12.5D. Incremental Change 81 59.6%
vs. Radical ChangeE. State the Objective 123 90.4%F. Develop Alternatives 131 96.3%G. Sell Decision to 25 18.4%
CommanderH. Factoring of the Problem 47 34.6%
I. Analysis of the 129 94.6%AlternativesI
J. Effect of Decision on 5 3.7%
CareerK. Pick First Acceptable 5 3.7%
AlternativeL. Assumptions Concerning 96 70.6%
AlternativesM. Pick an Alternative With 67 49.3%
Feedback
106

depicted along Tannenbaum and Schmidt's continuum of leader-
ship behavior only 6% of the time (question 35) . This small
percentage of utilization was not expected by the authors
but could have resulted from the word "tentative" causing a
certain amount of social desirability response bias. Spe-
cifically, comptrollers might have assigned a low utilization
percentage to leadership style D because the word tentative
invokes certain negative connotations such as lack of
decisiveness.
The descriptive statistics for the job preparation
of junior level comptroller questions are outlined in Table
III-11. The duty areas and supervisory status of 133 junior
level DA comptrollers are listed under question 41. The 133
represents a short fall of 43 from the total of 176 junior
level comptrollers (question 40) . The reason for this short
fall was a data collection limitation associated with the de-
sign of question 41. Specifically, design of question 41
allowed comptrollers to list the duty positic~ns and super-
visory status of only six junior level comptrollers within
their organizations. This limited the data collection effort
with respect to the question, since 4 of the comptroller
respondents had seven or more junior level comptrollers within
their organizations. Despite this limitation the resulting
data is appropriate for the identification of general trends
with respect to the duty positions and supervisory status of
junior level comptrollers.
107

TABLE III-11
SUMMARY OF DESCRIPTIVE STATISTICS FOR THE JOBPREPARATION OF JUNIOR LEVEL COMPTROLLER QUESTIONS (Q40-Q42)
40. Officers Serving First Tour in Comptrollership Specialty(i.e., Junior Levrel DA Comptrollers)
Total Number Percent
overall 176 100%USAREUR 23 13%FORSCOM 56 32%DARCOM 16 9%TRADOC 34 19%NGB 17 10%others 30 30%
41. Duty Areas and Supervisory Responsibilities of JuniorLevel DA Comptrollers
Number Percent Super- Percentvisory
Comptroller/Deputy 22 16.4% 16 72.8%Program/Budget 52 39.1% 23 44.2%Internal Review 12 9.0% 8 66.6%Management Analysis 19 14.3% 12 63.2%Finance and Accounting 25 18.8% 17 68%Force Development 3 2.3% 3 100%
42. Organizational Behavior Deficiencies of Junior Level DAComptrollers
Frequency of Mention
Affirmative *Percent Percent
A. Staff Procedures 32 40.5% 23.5%B. Leadership 14 17.7% 10.3%C. Personnel Relations 28 35.4% 20.6%D. Management Practices 16 20.3% 11.8%E. Oral and Written 34 43.0% 25.0%
CommunicationF. Common Sense 22 27.8% 16.2%G. Civilian Personnel 18 22.8% 13.2%
ManagementH. Human Behavior and OE** 5 6.2% 3.7%I. Technical Training 17 21.5% 12.5%J. No Additional Training 1 1.3% 0.7%
Required
*Indicates Percent of Individuals Who Replied to Question**Organizational Effectiveness
108
E. SUMMARY
This chapter began with a detailed description of the
questionnaire sent to DA comptrollers. The questionnaire
was designed to gather data for testing the validity of the
Pledger comptrollership model and for obtaining comptrollers'
comments on and recommendations for minimizing any organiza-
tional behavior deficiencies exhibited by junior level
financial managers. The level of measurement, purpose, and
response bias associated with each set of questions was
discussed.
The chapter continued with a detailed description of the
data analysis plan. The first part of the description focused
on how the data relating to the Pledger comnptrollership model
were analyzed to test hypotheses I through 9. The second
part of the description focused on how the comptrollers'
comments on the organizational behavior deficiencies exhibited
by junior level comptrollers were ranked in order of importance.
A summary of how -he nine hypotheses were tested and how the
ranking process was conducted is outlined in Table 111-7.
The preparation of the raw data obtained from the question-
naire was conducted using the SPSS.
Next, the sample selection of 246 CONUS, and USAREUR comp-
troller organizations to receive the questionnaire was described.
A total of 246 questionnaires were mailed, and 136 question-
naires (55% of the sample) were received and compiled.
The chapter concluded with the presentation of Tables
111-9, 111-10, and III-11 which summarize responses to the4
109
questions relating to background information, the Pledger
comptrollership model and the job preparation of junior level
comptrollers respectively.
110
U
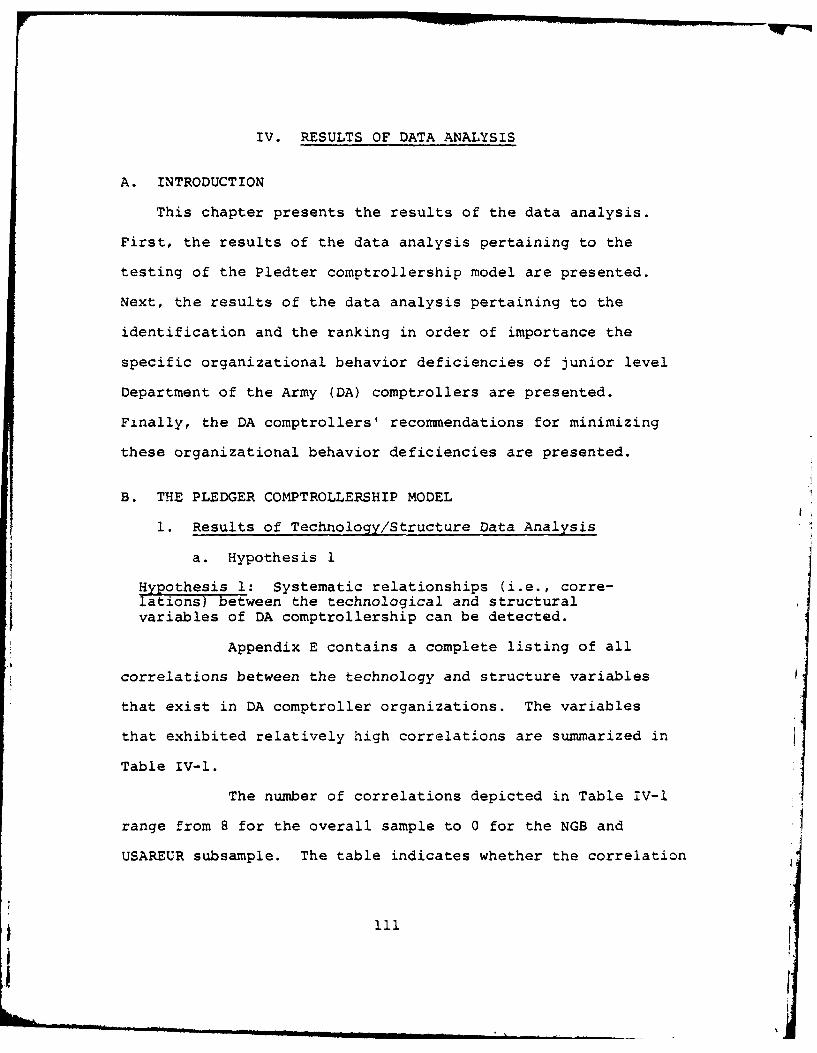
IV. RESULTS OF DATA ANALYSIS
A. INTRODUCTION
This chapter presents the results of the data analysis.
First, the results of the data analysis pertaining to the
testing of the Pledter comptrollership model are presented.
Next, the results of the data analysis pertaining to the
identification and the ranking in order of importance the
specific organizational behavior deficiencies of junior level
Department of the Army (DA) comptrollers are presented.
Finally, the DA comptrollers' reconmmendations for minimizing
these organizational behavior deficiencies are presented.
B. THE PLEDGER COMPTROLLERSHIP MODEL
1. Results of Technology/Structure Data Analysis
a. Hypothesis 1
Hypothesis 1: Systematic relationships (i.e., corre-lations) between the technological and structuralvariables of DA comptrollership can be detected.
Appendix E contains a complete listing of all
correlations between the technology and structure variables
that exist in DA comptroller organizations. The variables
that exhibited relatively high correlations are summarized in
Table IV-l.
The number of correlations depicted in Table IV-l
range from 8 for the overall sample toO0 for the NGB and
USAREUR subsample. The table indicates whether the correlation
ill

TABLE IV-I
SUMMARY OF SYSTEMATIC RELATIONSHIPSBETWEEN TECHNOLOGY AND STRUCTURE VARIABLES
A. OVERALL
Technology Structure Correlation
Routineness of Conversion Hierarchical Levels DIR
Automation of Conversion Interdependence DIR
Output Quality Control Formalization DIR
Coordination DIR
Specialization DIR
Performance Evaluation Formalization DIR
Vertical Communications DIR
Discretion in Conversion Centralization INV
B. MILITARY COMPTROLLERS
Technology Structure Correlation
Automation of Conversion Interdependence DIR
Output Quality Control Specialization DIR
Formalization DIR
Input Predictability Specialization DIR
C. CIVILIAN COMPTROLLERS
Technology Structure Correlation
Routineness of Conversion Hierarchical Levels DIR
Automation of Conversion Span of Control DIR
Output Quality Control Interdependence DIR
Coordination DIR
Performance Evaluation Vertical Communications DIR
Formalization DIR
112

TABLE IV-l (CONTINUED)
D. FINANCE OFFICERS
Technology Structure Correlation
Automation of Conversion Interdependence DIR
Performance Evaluation Formalization DIR
E. NON-FINANCE OFFICERS
Technology Structure Correlation
Input Predictability Specialization DIR
F. USAREUR
Unable to Perform Partial Correlations
G. FORSCOM
Technology Structure Correlation
Automation of Conversion Interdependence DIR
Discretion in Conversion Centralization INV
Specialization DIR
H. DARCOM
Technology Structure Correlation
Automation of Conversion Span of Control DIR
Output Quality Control Coordination DIR
Performance Evaluation Span of Control DIR
I. TRADOC
Technology Structure Correlation
Output Quality Control Hierarchical Levels DIR
Performance Evaluation Hierarchical Levels INV
J. NGB
No Strong Correlations
113
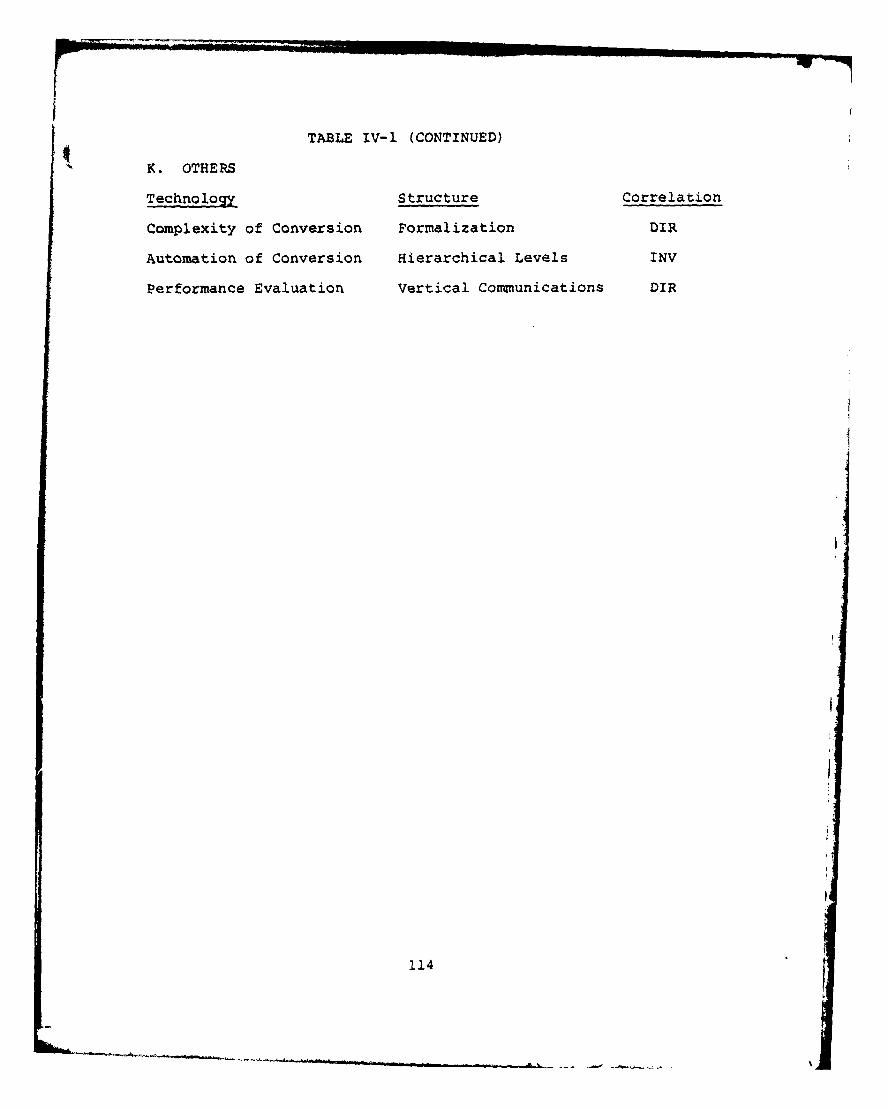
TABLE IV-i (CONTINUED)
K. OTHERS
Technology Structure Correlation
Complexity of Conversion Formalization DIR
Automation of Conversion Hierarchical Levels INV
Performance Evaluation Vertical Communications DIR
114
between each pair of variables is direct or inverse. For
example, Table IV-l indicates that for the non-finance sub-
sample there is a direct correlation between input predicta-
bility and specialization (i.e., as predictability of inputs
increased, the specialization of functions also increased).
The correlations depicted in Table IV-1 provide support for
Hypothesis 1, since the data exhibit systematic relationships
between the technology and structure variables existing within
DA comptroller organizations.
b. Hypotheses 2, 3, and 4
Hypothesis 2: DA comptrollership exhibits technologicalsimilarities (i.e., fairly standardized products, fairlypredictable production steps, some unpredictability andproduct variations) to Woodward's "large batch/mass produc-tion" type firms and will therefore exhibit correspondinglysimilar structural relationships (i.e., formalized struc-ture, administratively organized, clearly defined positions,clear chain of command).
Table IV-2 contains a listing of the means for
the variables which measure the technological and structural
similarities of DA comptroller organizations to Woodward's
"large batch/mass production" type firms. Confidence inter-
vals developed for the means of standardization of inputs
(2.713), routineness of conversion (3.074), automation of
conversion (3.096) and predictability of inputs (2.596) using
a t-test conducted at the 95% confidence level contained the
hypothesized mean (i.e., 2.5-3.5). Confidence intervals de-
veloped for the means of formalization of comptroller organi-
zation (2.029) , subordinates follow standard routines (1.640)
and specialization of functions (1.868) using a t-test conducted
115

TABLE IV-2
SUMMARY OF VARIABLE MEANS AND BACKGROUND COMPTROLLERINFORMATION USED IN TESTING HYPOTHESES 2 THROUGH 4
Hypothesis 2:
Technological Similarities Variable Means and BackgroundComptroller Information UsedIn Measurement and SupportRespectively
1. Fairly Standardized Standardization of InputsProducts M = 2.713 SD = .834
Figure 11-2
2. Fairly Predictable Routineness of ConversionProducticn',-,s M = 3.074 SD = .785
Automation of ConversionM = 3.096 SD = 1.017
3. Some Un±:>, -tability Input PredictabilityM = 2.596 SD = .783
Routineness of ConversionM = 3.074 SD = .785
4. Prcduct Variations Appendix A
Structural Similarities
1. Formalized Structure Formalization of Comp OrgM = 2.029 SD = .557Subordinates Follow StandardRoutinesM = 1.640 SD = .986
2. Administratively Organized Figure 11-4with Line-Staff Separation
3. Clearly Defined Positions Specialization of FunctionsM = 1.868 SD = .708
4. Clear Chain of Command Figure 11-4
M = MeanSD = Standard Deviation
116

TABLE IV-2 (CONTINUED)
Hypothesis 3:
Technolog Variable means and BackgroundComptroller Information UsedIn Measurement and SupportRespectively
1. Well Structured Summation of the Means for 6Technology VariablesM = 2.480 SD = .830
2. Low Variability and Routineness of ConversionFew Exceptions *M = 3.074 SD = .785
Input PredictabilityM = 2.596 SD = .783
Structure
1. Centralized Power Held Centralization of Comp OrgBy Comptroller **M = 3.574 SD = 1.086
2. High Interdependence Interdependence Among FunctionsAmong Functions M = 2.419 SD = 1.015
3. High Coordination Among Coordination Among FunctionsFunctions M = 1.522 SD = .798
Hypothesi.s 4:
Stable Environment
1. Little or no Change in Standardization of InputsTechnology M = 2.713 SD = .834
Input PredictabilityM =3.596 SD = .783
Routineness of ConversionM = 3.074 SD = .785
2. Little or no Change in Figure 11-3Market Structure
*Confidence intervals developed for these means did notcontain the hypothesized population mean (i.e., 1.0-3.5)
**Confidence intervals developed for these means did notcontain the hypothesized population mean (i.e., lessthan 2.5)
117[

TABLE IV-2 (CONTINUED)
Mechanistic System of Management
1. Reliance on Formal Rules Formalization of Comp Organd Regulations M = 2.029 SD =.557
2. Decision Made at the Top Centralization of Comp Orgof the organization **M = 3.574 SD =1.086
3. Narrow Spans of Control Span of Control*M= 5.859 SD =2.601
4. Vertical Communications Vertical CommunicationsM = 1.530 SD = 0.630
"*Confidence intervals developed for these means did notcontain the hypothesized population mean (i.e., lessthan 2.5)
118
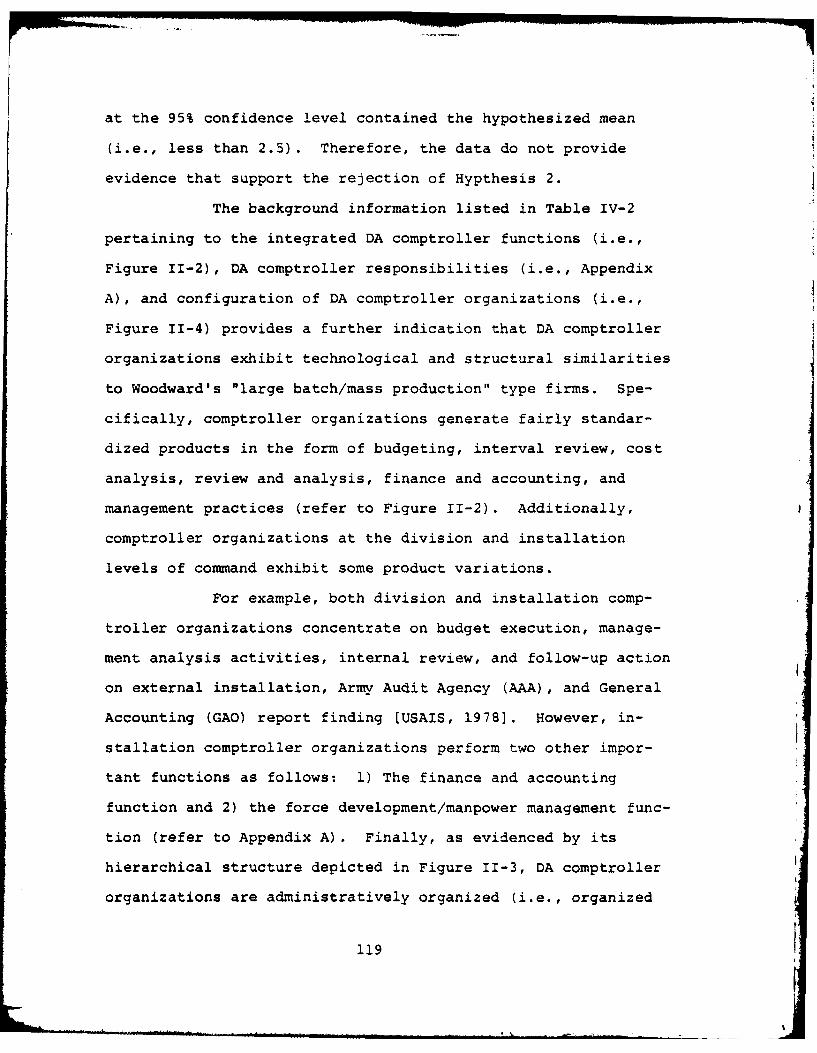
at the 95% confidence level contained the hypothesized mean
(i.e., less than 2.5). Therefore, the data do not provide
evidence that support the rejection of Hypthesis 2.
The background information listed in Table IV-2
pertaining to the integrated DA comptroller functions (i.e.,
Figure 11-2), DA comptroller responsibilities (i.e., Appendix
A), and configuration of DA comptroller organizations (i.e.,
Figure 11-4) provides a further indication that DA comptroller
organizations exhibit technological and structural similarities
to Woodward's "large batch/mass production" type firms. Spe-
cifically, comptroller organizations generate fairly standar-
dized products in the form of budgeting, interval review, cost
analysis, review and analysis, finance and accounting, and
management practices (refer to Figure 11-2). Additionally,
comptroller organizations at the division and installation
levels of command exhibit some product variations.
For example, both division and installation comp-
troller organizations concentrate on budget execution, manage-
ment analysis activities, internal review, and follow-up action
on external installation, Army Audit Agency (AAA), and General
Accounting (GAO) report finding EUSAIS, 19781. However, in-
stallation comptroller organizations perform two other impor-
tant functions as follows: 1) The finance and accounting
function and 2) the force development/manpower management func-
tion (refer to Appendix A). Finally, as evidenced by its
hierarchical structure depicted in Figure 11-3, DA comptroller
organizations are administratively organized (i.e., organized
119

by divisions that perform a specialized function such as bud-
geting or internal review) and have a clear chain of command
(i.e., division chiefs, who report directly to the comptroller).
Hypothesis 3: The technology of comptrollership in theDA is of Perrow's Routine type (well structured/lowvariability and few exceptionsi and displays correspond-ing structural characteristics (centralized power heldby comptroller, high interdependence and high coordina-tion required among functions within the organization).
Table IV-2 contains a listing of the means for
the variables which measure whether the technology in the DA
is of Perrow's Routine type and is associated with a formal
centralized type of structure. Confidence intervals developed
for the combined mean of the six technology variables (2.480)A
and for the mean of predictability of inputs (2.596) using a
t-test conducted at the 95% confidence level contained the
hypothesized mean (i.e., less than 2.5). A confidence inter-
val developed for the mean of routineness of conversion (3.074)
using a t-test conducted at the 95% confidence level did not
contain the hypothesized mean (i.e., less than 2.5). Confi-
dence intervals developed for the means of interdependence
among functions (2.419) and coordination among functions
(1.522) using a t-test conducted at the 95% confidence level
contained the hypothesized mean (i.e., less than 2.5). A
confidence interval developed for the centralization 3.574)
did not contain the hypothesized mean (i.e., less than 2.5).
Therefore, with the exception of routineness of conversion
and centralization, the data do not provide evidence that
support the rejection of Hypothesis 3.
120

Hypothesis 4: DA comptroller organizations operate inbasically stable environments and exhibit mechanisticsystems of management.
Table IV-2 contains a listing of the means for
the variables which measure whether DA comptroller organiza-
tions operate in stable environments and exhibit mechanistic
systems of management. Confidence intervals developed for
the means of standardization of inputs (2.713), input predic-
tability (2.596), and routineness of conversion (3.074) using
a t-test conducted at the 95% confidence level contained the
hypothesized mean (i.e., 1.0-3.5). Confidence intervals de-
veloped for the means of formalization of comptroller organi-
zation (2.029) and vertical communications (1.530) using a
t-test conducted at the 95% confidence level contained the
hypothesized mean (i.e., less than 2.5). Confidence inter-
vals developed for the means of centralization (3.574) and
span of control (5.859) using a t-test conducted at the 95%
confidence level did not contain the hypothesized mean (i.e.,
less than 2.5). Therefore, with the exception of centraliza-
tion and span of control, the data dc not provide evidence
that support the rejection of Hypothesis 4.
The background Lnformation listed in Table IV-2
pertaining to the flow of comptroller functions (i.e., Figure
11-3) provide further indication that DA comptroller organi-
zations operate in stable environments. Specifically, there
is little or no change in the market structure for DA comp-
troller organizations. For example, as shown in Figure 11-3,
comptrollers functions are performed primarily at the MACOM,
121

installation and division levels of commands. This hierarchi-
cal structure fosters a high degree of stability within the
DA comptroller community, since each comptroller organization
recognizes the individuals and other organizations it must
interact with in order to accomplish the mission (e.g., an
installation comptroller organization will interact with a
MACOM and possibly division comptroller organization and will
also interact with certain external agencies such as the Army
Audit Agency and General Accounting Office).
Table IV-3 contains two lists as follows: (1) A
list of frequently mentioned problems experienced by DA comp-
trollers during their first hundred days on the job. (2) A
list of the most frequently mentioned statements of advice by
DA comptrollers regarding the first hundred days on the job.
The authors' developed these two lists after conducting a con-
tent analysis of the comptrollers' responses to questions -3
and 39 respectively. The criteria for lipti: . parkcular
problem or statement of advice was to have . mentioned by at
least 10% of the comptroller respondents. The only exceptions
to this criteria were problem 14 and statements of advice 12
and 13. Problem 14 was mentioned by five of the nine comp-
trollers responding from USAREUR. Statement 13 was mentioned
by two comptrollers from FORSCOM. Statement 14 was mentioned
by the Deputy Chief of Staff for Resource Management (DCSRM)
Headquarters TRADOC, Fort Monroe, Virginia.
The following problems (i.e., problems 1, 2, 4 and
6) and statements of advice (i.e., statements 1-5) mentioned
122
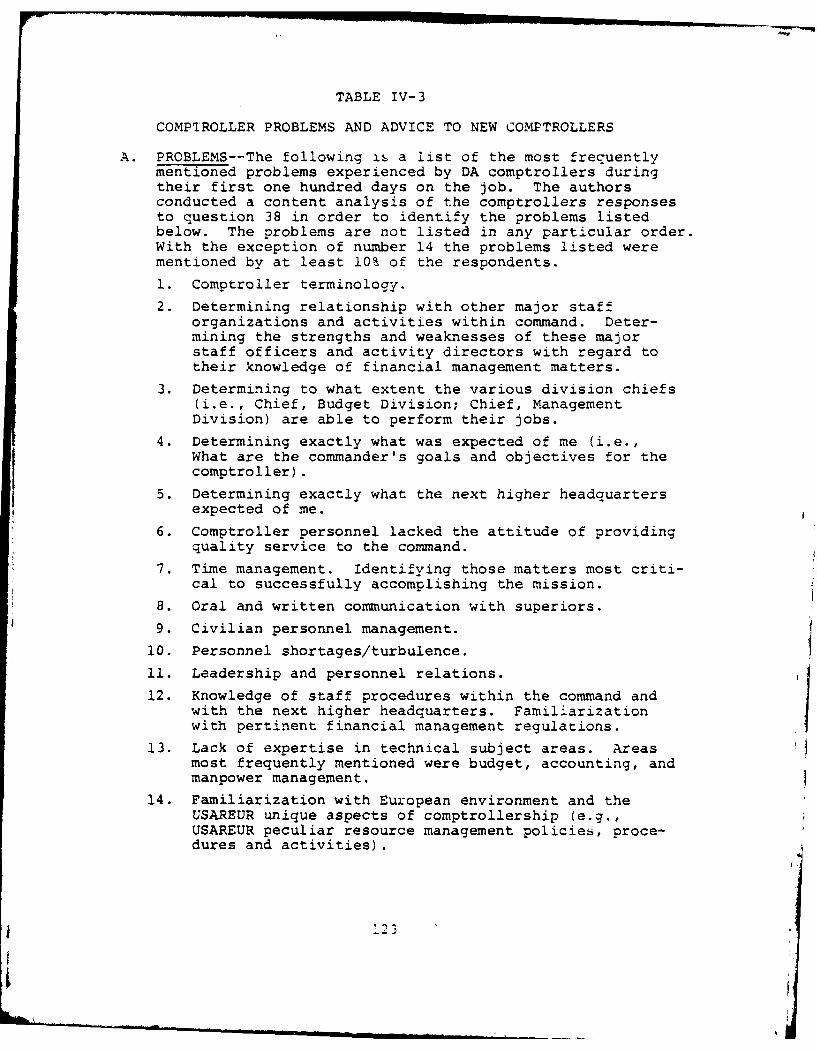
TABLE IV'-3
COMPTROLLER PROBLEMS AND ADVICE TO NEW COMPTROLLERS
A. PROBLEMS--The following i , a list of the most freq~uentlymentioned problems experienced by DA comptrollers duringtheir first one hundred days on the job. The authorsconducted a content analysis of the comptrollers responsesto question 38 in order to identify the problems listedbelow. The problems are not listed in any particular order.With the exception of number 14 the problems listed werementioned by at least 10% of the respondents.
1. Comptroller terminology.
2. Determining relationship with other major stafforganizations and activities within command. Deter-mining the strengths and weaknesses of these majorstaff officers and activity directors with regard totheir knowledge of financial management matters.
3. Determining to what extent the various division chiefs(i.e., Chief, Budget Division; Chief, ManagementDivision) are able to perform their jobs.
4. Determining exactly what was expected of me (i.e.,What are the commander's goals and objectives for theI comptroller).
5. Determining exactly what the next higher headquartersexpected of me.
6. Comptroller personnel lacked the attitude of providingquality service to the command.
7. Time management. Identifying those matters most criti-cal to successfully accomplishing the mission.
8. Oral and written communication with superiors.
9. Civilian personnel management.
10. Personnel shortages/turbulence.
11. Leadership and personnel relations.
12. Knowledge of staff procedures within the command andwith the next higher headquarters. FamiliarizationIwith pertinent financial management regulations.
13. Lack of expertise in technical subject areas. Areasmost frequently mentioned were budget, accounting, andmanpower management.
14. Familiarization with European environment and theUSAREUR unique aspects of comptrollership (e.g.,tJSAREUR peculiar resource management policies, proce-dures and activities).
1 1

TABLE IV-3 (CONTINUED)
B. ADVICE--The following is a list of the most frequentlymenEtioned statements of advice by DA comptrollers re-garding the first one hundred days on the job. The authorsconducted a content analysis of the comptrollers' responsesto question 39 in order to identify the statements ofadvice listed below. The statements are not listed inany particular order. With the exception of numbers 12and 13 the problems listed were mentioned by at least10% of the respondents.
1. Learn comptroller terminology ASAP.
2. Get to know the functions of the other major stafforganizations and activities. Get to know the othermajor staff officers and activity directors.
3. Learn functions of the division chiefs within thecomptroller organization. Determine as quickly aspossible whether these division chiefs are performingtheir functions in a satisfactory manner.
4. Learn what the commander and next higher headquartersexpect of me. Be on the bosses calendar at least oncea week.
5. Insist that comptroller personnel develop an attitudeof providing quality service to the command.
6. Learn important aspects of civilian personnel manage-ment. Schedule meeting with Civilian PersonnelOfficer (CPO) ASAP after assignment.
7. Develop requisite degree of expertise in the technicalareas especially budget, accounting, and manpowermanagement.
8. Listen, ask questions and move slowly to make changes.
9. Size up the organization. If the organization is old,rigid, and goes strictly by the book, encourage inno-vation and new methods. If the organization is new,fluid and operating erratically, introduce standardoperating procedures and strive for a more formalstructure.
10. Develop skills as an honest broker.
11. Establish and maintain credibility with commanderand next higher headquarters.
12. Use booklet entitled "The Installation Comptroller"and article entitled "The First One Hundred Days"by Brigidier General Gudinas.
13. Use checklist entitled "Advice to New Comptroller!DCSRM In First 100 Days of Assignment."'
*This checklist was developed by the Deputy Chief of Stafffor Resource Management (DCSRM) , Headquarters TRADOC, Fort
1_Z4

TABLE IV-3 (CONTINUED)
Monroe, Virginia. The ehecklist is presented in Appendix F.The authors' decision to present the checklist was based ontwo factors. First, the checklist is a comprehensive documentthat contains the managerial and technical information thatcomptrollers must be familiar with in carrying out theirresponsibilities. Second, the checklist is well organizedand straightforward which makes it a useful tool that comp-trollers can utilize to facilitate the crucial transitionperiod of the "first one hundred days" in their new assignment.
125

in the two lists of Table IV-3 provide further indication
that DA comptroller organizations operate in basically stable
environments (i.e., there is little or no change in the market
structure for DA comptroller organizations). For example these
problems and statement of advice reveal that DA comptrollers
can expect to interact on a regular basis with certain major
staff organizations within their commands', the comptroller
organization from the next higher headquarters, and the divi-
sion chiefs within their own organizations. The following
problems (i.e., problems 5 and 7) mentioned in the first list
of Table IV-3 provide further indication that DA comptroller
organizations exhibit a mechanistic system of management (i.e.,
a system of management characterized by vertical communica-
tion and reliance on formal rules and regulations) . For
example, these problems reveal that DA comptrollers must con-
duct oral and weitten communication with their superiors and
be familiar with pertinent financial management regulations.
PROBLEMS
1. Determining relationship with other major staff organiza-tions and activities within the command. Determining thestrengths and weaknesses of these major staff officersand activity directors with regard to their knowledge offinancial management matters.
2. Determining to what extent the various divisio:i chiefsare able to perform their jobs.
3. Determining exactly what the commander expected of me.
4. Determining exactly what the next higher headquartersexpected of me.
5. oral and written communication with superiors.
'126

6. Knowledge of staff procedures within the command and withthe next higher headquarters.
7. Familiarization with pertinent financial management
regulations.
ADVICE
1. Get to know the functions of the other major stafforganizations and activities. Get to know the othermajor staff officers and activity directors.
2. Learn functions of the division chiefs within the comp-troller organization.
3. Learn what the commander and next higher headquarters
expect of me.
4. Listen, ask questions and move slowly to make changes.
5. Establish and maintain credibility with commander andnext higher headquarters.
2. Results of Leadership Data Analysis
a. Hypotheses 5 and 6
Hypothesis 5: DA comptrollers perform both the socio-emotional and task related leadership functions withintheir organizations.
Hypothesis 6: DA comptrollers will be higher in the socio-emotional dimension than the task related dimension.
Table IV-4 contains results of the leadership data
analysis pertaining to hypotheses 5 and 6. The means for the
socio-emotional leadership function range from 2.552 for the
DARCOM subsample to 3.424 for the OTHERS subsample. The
means for the task related leadership function range from
1.443 for the NGB subsample to 3.947 for the TRADOC subsample.
Confidence intervals developed for all the socio-emotional
and task related subsample means using a t-test conducted at
the 95% confidence level contained the hypothesized population
+ + + +mmlnIn'll l lIIIII ] liim'i 7

TABLE IV-4
SUMMARY OF LEADERSHIP DATA PERTAINING TO HYPOTHESES
5 AND 6
*MEAN STD DEV
A. OVERALL
Socio-Emotional 2.985 1.599
Task Related 3.015 1.642
B. MILITARY COMPTROLLERS
Socio-Emotional 3.037 1.725
Task Related 3.329 1.595
C. CIVILIAN COMPTROLLERS
socio-Emotional 2.907 1.278
Task Related 2.537 1.610
D. FINANCE OFFICERS
socio-Emotional 2.601 1.303
Task Related 2.667 1.422
E. NON-FINANCE OFFICERS
Socio-Emotional 3.314 1.903
Task Related 3.706 1.591
F. USAREUR
Socio-Emotional 2.778 0.833
Task Related 3.222 0.667
G. FORSCOM
Socio-Emotional 2.893 1.397
Task Related 3.036 1.374
H. DARCOM
Socio-Emotional 2.552 1.088
Task Related 2.793 1.320
I. TRADOC
socio-Emotional 3.316 1.493
Task Related 3.347 1.779
J. NGB
Socio-Emotional **2.778 1.592
Task Related 1.443 1.247
Y%. OTHERS
socio-Emotional 3.424 2.077
Task Related 3.455 1.839
128

TABLE IV-4 (CONTINUED)
*Means for the Socio-Emotional and Task Related leadershipdimensions cay vary between 0 and 12 with 0 showing thehighest orientation.
**Indicates those means which are significantly differentas determined by the students "t" test at the 95% level.
129

mean (i.e., 0 < < 8.0). Therefore, the data do not provide
evidence that support the rejection of Hypothesis 5.
A comparison of the socio-emotional and task
related sample means using a t-test at the 95% confidence
interval indicates that, with the exception of the NGB sub-
sample, the two means are not significantly different.
Therefore, with the exception of the NGB subsample, it cannot
be said that the DA comptrollers exhibit statistically differ-
ent degrees of socio-emotional and task related leadership
behavior. The NGB comptrollers are higher in the task re-
lated dimension than the socio-emotional dimension.
b. Hypothesis 7
Hypothesis 7: On Tannenbaum and Schmidt's continuum ofleadership behavior, DA comptrollers will utilize a widerange (i.e., 5-7 styles) of leadership styles incarrying out their responsibilities.
Table IV-5 contains results of the leadership data
analysis pertaining to Hypothesis 7. The means for the num-
ber of leadership styles comptrollers utilize in carrying
out their responsibilities range from 5.611 for the NGB sub-
sample to 6.667 for the USAREUR subsample. Confidence inter-
vals developed for all the subsample means using a t-test
conducted at the 95% confidence level contained the hypothe-
sized population mean (i.e., greater than or equal to 5).
Therefore, the data do not provide evidence that support the
rejection of Hypothesis 7.
c. Hypothesis 8
Hypothesis 8: DA comptrollers will strike a relativebalance between managerial authority and subordinatefreedom by utilizing over 50% of time the middle three
130

TABLE IV-5
SUMMARY OF LEADERSHIP DATA PERTAINING TO HYPOTHESIS 7
NU B=.., OF LEADERSHIP STYLES UTILIZED
* MEAN STD DEV
A. OVERALL 5.897 1.551
B. MILITARY COMPTROLLERS 5.854 1.533
C. CIVILIAN COMPTROLLERS 5.963 1.590
D. FINANCE OFFICERS 5.633 1.810
E. NON-FINANCE OFFICERS 6.000 1.356
F. USAREUR 6.667 0.500
G. FORSCOM 5.786 1.500
H. DARCOM 5.793 1.740
I. TRADOC 5.895 1.629
J. NGB 5.611 1.819
K. OTHERS 6.030 1.425
* A confidence interval was developed for the means
using the Students "t" test conducted at the 95%confidence level. All intervals contained thehypothesized population mean.
131

leadership styles depicted along Tannenbaum andSchmidt's continuum of leadership behavior.
Table IV-6 contains results of the leadership
data analysis pertaining to Hypothesis 8. The percentage of
utilization means for the middle three leadership styles de-
picted along Tannenbaum and Schmidt's continuum of leadership
behavior range from 38.5% for the TRADOC subsample to 52.7%
for the USAREUR subsample. Confidence intervals developed for
all the subsample means using a t-test conducted at the 95%
confidence level contained the hypothesized mean (i.e., greater
than or equal to 50%). Therefore, the data do not provide
evidence that support the rejection of Hypothesis 8.
3. Results of Decision-Making Data Analysis--Hypothesis 9
Hypothesis 9: DA comptrollers use mixed decision-makingmethods as decision-making situations change.
Table IV-7 contains results of the decision-making
data analysis pertaining to Hypothesis 9. The predicted uti-
lization intervals for the rational decision-making method
range from 15.4%-24.2% for the NGB subsample to 26.4%-43.6%
for the USAREUR subsample. The predicted utilization inter-
vals for the organizational processes decision-making method
range from 56.4%-60.2% for the USAREUR subsample to 64.4%-67.4%
for the TRADOC subsample. The predicted utilization inter-
vals for the bureaucratic politics decision-making method
range from 0.0%-15.2% for the TRADOC subsample to 0.0%-24.3%
for the NGB subsample. The actual utilization of the rational
decision-making method ranges from 51.0% for the USAREUR sub-
sample to 59.9% for the DARCOM subsample. The actual
132

TABLE IV-6
SUMMARY OF LEADERSHIP DATA PERTAINING TO HYPOTHESIS 8
mean std dsv
A. OVERALL
LDR A 7.616% 8.316%
LDR B 6.647% 8.460%
LDB C 12.3604 10.661%
LDF D 6.081a 5.995%
LDB E 29.360% 22.447%
LDR F 8.015% 9.832%
LDB G 30.132% 23.566%
*Summation of LDR C,D&E = 47.801%
B. MII.ITARY CCNPTROLLERS
LDR A 7.488% 8.838%
LDR B 7.195% 9.981%
LD C 12.720% 12.140%
LDS D 6.073% 6.251%
LDE E 27.890% 23.236%
LDB F 6.512% 7.397%
LDB G 32.305% 26.1721
*Summation of LDR C,D&E = 46.68%
C. CIVILIAN COMPTROLLERS
LDR A 7.815% 7.531%
LDR B 5.8151 5.3771
LDB C 11.8154 7.812
LDR D 6.093% 5.641%
LD E 31.593% 21.209%
LDB F 10.2961 12.401%
LDS G 26.833% 28.693%
*Summation of LDR C,D&E = 49.501%
133

TABLE IV-6 (Continued)
mean std dev
D. FINANCE OFFICEFS LA.767 4.939%
LDB A
LDR 3 5.3334 4.7444
LDR C 13.433% 15.850%
LDB D 5.333% 4.672%
LDF ! 30.833% 24.410%
LDR F 5.367% 6.088%
LOB G 35.100% 27.648%
*Summation of LDR C,D&E = 49.599%
E. NON-FINANCE OFFICERS
LDR h 9.137% 10.249%
LDB 3 8.137% 12.005%
12.157% 9.559%LOB C
LOB D 6.627% 7.017%
LDR E 26.118 % 22.815%
LDR F 7.314% 8.054%
LDS G 30.706% 25.668%
*Summation of LDR C,D&E = 44.902%
f. USAREUR
LDR A 5.000% 4.796%
LBB B 5.3331 4.664%
LDF C 15.111% 7.253%
LDR 3 8.111% 5.159%
LDB E 29.444% 21.715%
LBE P 9.000% 9.165%
LDB G 29.111S 23.299%
*Summation of LDR C,D&E f 52.666%
134
K-- --_ - ?,- ,,,,. 1 ... ... .I Iq 1 til I .. . ...... . .. . - ii Q • _ * __L.. .... -.
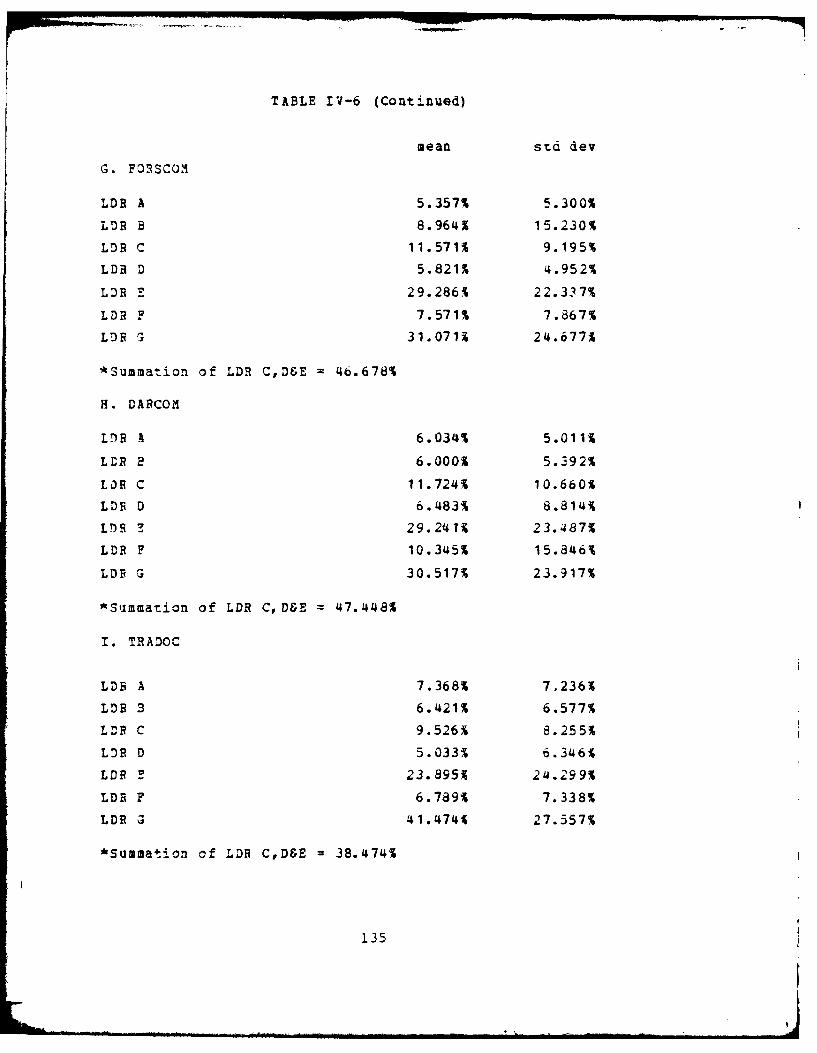
TABLE IV-6 (Continued)
mean std dev
G. FORSCO3
LDR A 5.357% 5.300%
LOB B 8.964 15.230%
LDR C 11.571% 9.195%
LDR D 5.821% 4.952%
LDB E 29.286% 22.337%
LDR F 7.571% 7.867%
L9R G 31.071% 24.6774
*Summation of LDR C,D&E = 46.678%
H. DARCOM
LrB A 6.034% 5.011,
LDP P 6.000% 5.392%
LOF C 11.724% 10.660%
LDR D 6.483% 8.814%
LT) 9 29.241% 23.487%
LDR F 10.345% 15.846%
LD G 30.517% 23.917%
*Summation of LDR CD&E 47.448%
I. TRADOC
LDB A 7.3681 7,236%
LDB 3 6.421% 6.577%
Llo C 9.526Y 8.255%
LOB D 5.033% 6.346%
LDR Z 23.895% 214.299%
LDB F 6.789% 7.338%
LP G 41.4744 27.557%
*Summation of LDR C,D&E = 38.474%
135
i
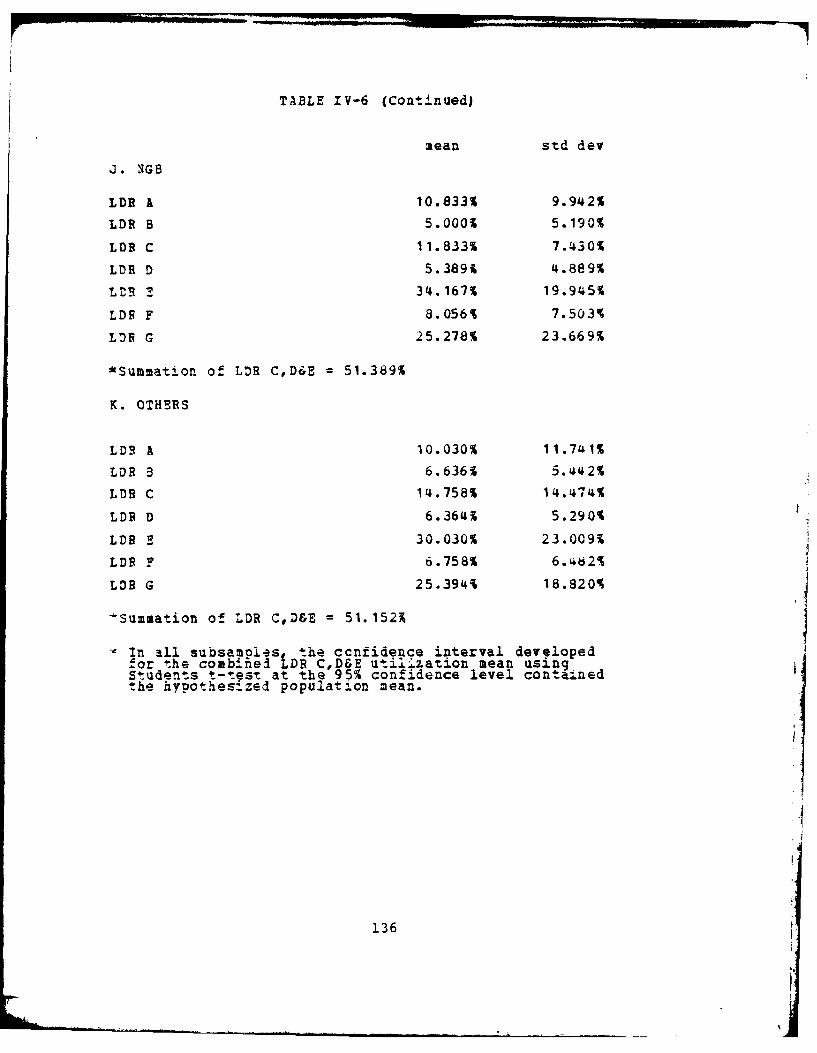
TABLE IV-6 (Continued)
mean std dev
J. NGB
LD A 10.833% 9.942%
LD B 5.0001 5.190%
LDB C 11.833% 7.430%
LDE D 5.3891 4.889%
L. r 34.167% 19.945%
LDB F 8.056% 7.503%
L)R G 25.278% 23.669%
*Summation of LDR C,D6E = 51.389%
K. OTHERS
LD. A 10.030% 11.741%
LDR 3 6.6361 5.442%
L1R C 14.758% 14.474%
LDB D 6.3641 5.290%
LDB E 30.030% 23.009%
LDE F 6.758% 6.482%
LDB G 25.394% 18.820%
Summation of LDR C,D&E i 51.152X
' In all subsamples 'he ccnfidence interval developedfor the combinel EDE C,D&E utii..zation mean usingStudents t-test at the 95% confidence level containedthe hypothesized population mean.
136
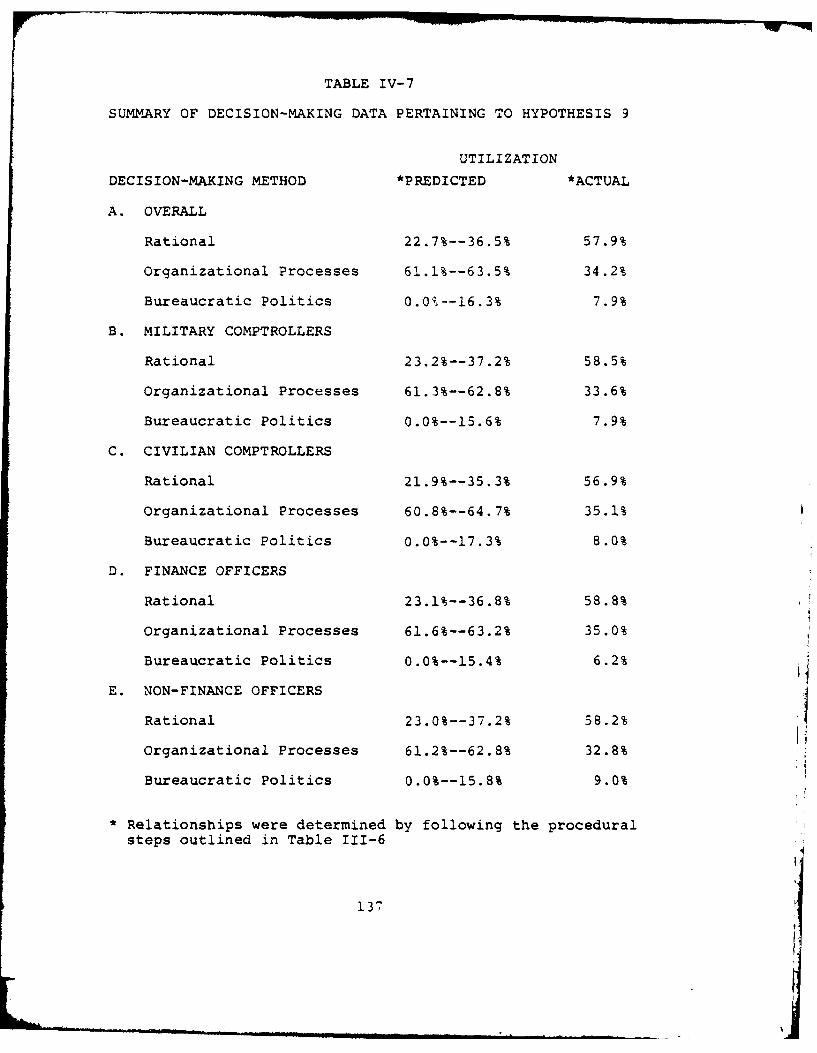
TABLE IV-7
SUMMARY OF DECISION-MAKING DATA PERTAINING TO HYPOTHESIS 9
UTILIZATION
DECISION-MAKING METHOD *PREDICTED *ACTUAL
A. OVERALL
Rational 22.7%--36.5% 57.9%
Organizational Processes 61.1%--63.5% 34.2%
Bureaucratic Politics 0.0;.--16.3% 7.9%
B. MILITARY COMPTROLLERS
Rational 23.2%--37.2% 58.5%
Organizational Processes 61.3%--62.8% 33.6%
Bureaucratic Politics 0.0%--15.6% 7.9%
C. CIVILIAN COMPTROLLERS
Rational 21.9%--35.3% 56.9%
Organizational Processes 60.8%--64.7% 35.1%
Bureaucratic Politics 0.0%--17.3% 8.0%
D. FINANCE OFFICERS
Rational 23.1%--36.8% 58.8%
Organizational Processes 61.6%--63.2% 35.0%
Bureaucratic Politics 0.0%--15.4% 6.2%
E. NON-FINANCE OFFICERS
Rational 23.0%--37.2% 58.2%
organizational Processes 61.2%--62.8% 32.8%
Bureaucratic Politics 0.0%--15.8% 9.0%
* Relationships were determined by following the proceduralsteps outlined in Table 111-6
137
Li

TABLE IV-7 (CONTINUED)
F. USAREUR
*PREDICTED *ACTUAL
Rational 26.4%--43.6% 51.0%
Organizational Processes 56.4%--60.2% 36.0%
Bureaucratic Politics 0.0%--16.3% 13.0%
G. FORSCOM
Rational 24.4%--39.9% 58.8%
Organizational Processes 59.3%--60.6% 34.4%
Bureaucratic Politics 0.0%--16.3% 6.8%
H. DARCOM
Rational 24.0%--39.4% 59.9%
Organizationi Processes 60.0%--60.1% 33.9%
Bureaucratic Politics 0.0%--16.0% 6.2%
I. TRADOC
Rational 20.4%--32 6% 55.0%
Organizational Processes 64.4%--67.4% 32.3%
Bureaucratic Politics 0.0%--15.2% 12.7%
J. NGB
Rational 15.4%--24.2% 56.3%
Organizational Processes 60.3%--75.3% 36.2%
Bureaucratic Politics 0.0%--24.3% 7.5%
K. OTHERS
Rational 24.2%--37.8% 59.6%
Organizational Processes 62.3%--62.8% 33.8%
Bureaucratic Politics 0.0%--15.5% 6.6%
*Relationships were determined by following the proceduralsteps outlined in Table 111-6
138

utilization of the organizational processes decision-making
method ranges from 32.3% for the TRADOC subsample to 36.0%
for the USAREUR subsample. The actual utilization of the
bureaucratic politics methods ranges from 6.2% for the DARCOM
subsample to 13.0% for the USAREUR subsample.
For all subsamples the actual utilization of the
rational method exceeded its predicted utlization. For all
subsamples the actual utilization of the organizational proc-
esses method was lower than its predicted utilization. For
all subsamples the actual utilization of the bureaucratic
politics method was within its predicted utilization interval.
The relationships described above remained after con-
ducting a comparison of the mean percentage of actual utiliza-
tion with the interval established for the mean percentage of
predicted utilization using a t-test at the 95% confidence
interval. Therefore, with the exception of the bureaucratiz
politics method, the data do not provide evidence that support
the rejection of Hypothesis 9.
C. JOB PREPARATION OF JUNIOR LEVEL COMPTROLLERS
1. Organizational Behavior Deficiencies
Data obtained from question 42 verified the existence
of deficiencies in eight major organizational behavior areas.
Table IV-8 contains the list of these eight organizational
behavior deficiencies exhibited by junior level DA comptrollers.
The frequency of mention percentages for the deficiencies
range from 43.0% for oral and written communication to 6.3%
139
[t

TABLE IV-8
ORGANIZATIONAL BEHAVIOR DEFICIENCIES OF JUNIORLEVEL COMPTROLLERS
FREQUENCY OF MENTION
AFFIRMATIVE *PERCENT
A. STAFF PROCEDURES 32 40.5%
B. LEADERSHIP 14 17.7%
C. PERSONNEL RELATIONS 28 35.4%
D. MANAGEMENT PRACTICES 16 20.3%
E. ORAL AND WRITTEN COMMUNICATION 34 43.0%
F. COMMON SENSE 22 27.8%
G. CIVILIAN PERSONNEL MANAGE- 18 22.8%MENT/RELATIONS
H. HUMAN BEHAVIOR AND OE ** 5 6.3%
I. TECHNICAL TRAINING 17 21.5%
J. NO ADDITIONAL TRAINING 1 1.3%
* Percent based on number of individuals who replied to
question 42.
Organizational effectiveness.
140

for human behavior and organizational effectiveness (WE).
The most frequently mentioned organizational behavior defi-
ciencies include oral and written communication (43.0%),
staff procedures (40.5%), personal relations (35.4%), common
sense(27.8%), and civilian personnel management/relations
(22.8%). The technical training of junior level comptrollers
was identified as a deficiency by 21.5% of the comptrollers
who replied to the question. one (1.3%) comptroller who re-
plied to the question stated that junior level comptrollers
required no additional training.
2. Recommendations
Table IV-9 contains a comprehensive list of 29 recom-
mendations of DA comptrollers regarding improvement of the
training and/or performance of junior level DA comptrollers.
The recommendations represent the verbatim responses and are
not listed in any particular order. The subject areas for
the proposed course mentioned in recommendation number 16 for
USAREUR personnel are presented in Appendix G.
D. SUMMARY
This chapter began with the presentation of data analysis
results pertaining to the Pledger comptrollership model.
Specifically, the data analysis results pertaining to the
testing of Hypotheses 1 through 9 were presented (refer to
Tables IV-l through IV-7 and Appendix E).
The chapter continued with the presentation of the data
analysis results pertaining to the identification and ranking
141

TABLE IV-9
RECOMMENDATIONS OF DA COMPTROLLERS REGARDINGIMPROVEMENT OF THE TRAINING AND/OR PERFORMANCE OF
JUNIOR LEVEL DA COMPTROLLERS
The following are verbatim responses to the followingquestion from DA comptrollers: "What are your recommnenda-tions for improving the training and/or performance ofjunior comptrollers?" This question formed the second partof question 42. The first part of question 42 asked DAcomptrollers to identify any non-technical areas involvingArmy comptrollership that their junior level financial managerscould have been better prepared to handle. The recommendationsare not listed in any particular order.
1. Military Comptrollership Course (MCC) is a must priorto the junior level comptrollers' first assignment.
2. Complete troop duty prior to initial assignment so theycan go on in the comptrollership field after completionof the initial assignment.
3. Briefing techniques-organization of briefings, use oftraining aids should be an integral part of all advancedcourses.
4. Junior level comptrollers should take advantage of everyavailable opportunity to build their job knowledge throughexchange of ideas, learning from the experience of others,and from available formal documents and training courses.
5. Junior level comptrollers should be finance officers.
6. It is very important that junior level comptrollers betrained to understand that the Comptroller is to provideservice to the staff and as such he must carry out thedesires of the commander with effective guidance, coordina-tion, and follow-up. This applies to the Command OperatingProgram, budgets and funding programs, expenditure tar-gets, feedback reporting to program managers, and theacceptance of methods and standards studies, and internalreviews.
7. Cost/benefit analysis training.
8. Computer training and knowledge of data processing. Juniorlevel comptrollers must understand basics of automationas a tool of management.
9. Training in military writing.
10. Should have served on a Battalion staff.
11. Training in PPBS.
12. T"raining in DOD/OMB/Corxgressional Decision Processes
13. Training in Civilian Personnel Management.
142

TABLE IV-9 (CONTINUED)
14. Finance officers need detail tours in combat arms inorder to further their understanding of leadership andthe real purpose of comptrollers and the Army.
15. Time Management Training--learn shortcuts of effectivemeetings, staff visits, personnel counseling.
16. Although you didn't ask, I believe the most positiveaction possible for improvement of performance of USAREURjunior level comptrollers during their first 100 dayswould be to initiate a USAREUR peculiar course for prospec-tive comptrollers.*
17. Training in the personnel management of minorities.
18. Teach union cooperation techniques.
19. Two year intern training program for junior level comp-trollers. They are employed in every functional areaand receive on-the-job training (OJT), correspondence, orresident) in each area. I have just "graduated" one, anengineer officer (21/45), and he is probably the onlyengineer who ever worked as a finance officer, auditor,and travel clerk. Upon "graduation" he became a Comp-troller in his own right. The feedback is that he isdoing a super job. Suggest all junior level comptrollersparticipate in this type of program.
20. Junior level comptrollers should serve their first 45(comptrollership) assignment as a Division FinancialManagement Officer (DFMO) in a combat division.
21. Learn logistics operating systems and their interfacewith Financial Systems (i.e., Standard Army IntermediateLogistical Subsystem (SAILS), Division Logistics System(DLOGS), Tactical Unit Financial Management InformationSystems (TUFMIS), Standard Finance Systems (STANFINS),Stock Fund). Learn how a transaction impacts on allsystems. Learn interrelationships between the varioussystems.
22. Set up training program for junior level comptrollers.Six months in Budget, Management, and Force Developmenteach.
23. Basic 45 MOS Training as follows: (a) There should be anintroductory course conducted for United States ArmyReserve (USAR) officers newly assigned to 45 MOS positions.(b) The course must be two weeks in duration (so the off i-cer can attend during an annual training status).
24. There should be a course that prepares a junior level comp-troller to operate in a tactical unit environment. Weneed to teach Division comptrollers about TUFMIS, etc.,before he takes over the job.
143

TABLE IV-9 (CONTINUED)
25. Civilian education/interests should complementcomptrollership.
26. Teach manpower management. Areas of study should in-clude policy, requirements setting process, authoriza-tions or allocations and how to obtain, documentation,relationship between spaces, forces, and OfficerDistribution Plan (ODP).
27. On the Job Training (OJT) is the key. The 5 week MCCor MBA will only help a little--its getting in andpreparing a budget, doing a TDA, defending an economicanalysis that counts.
28. Junior level comptrollers should have a broad generalbackground. There are few officers who can hope to beproficient in all the areas of comptrollership listedAR5-2. Management expertise is more important thanfinancial management expertise.
29. Officers who are going to be comptrollers should startas LTs and CPTs and receive considerable technical aswell as staff training.
*The DA comptroller from USAREUR who made this recommendationalso provided the authors with an outline of the subjectareas for this proposed course. The subject areas for theproposed USAREUR peculiar course are presented in AppendixG. The authors' decision to present the course was based onthree factors. First, 5 of the 9 comptrollers responding fromUSAREUR mentioned problems associated with the uniquenessof this Overseas command (refer to Section A, problem #14,Table IV-3). Second, the authors' belief that this particu-lar course might be an effective and expeditious means offamiliarizing the USAREUR junior level comptrollers with thepeculiar resource management policies, procedures and activi-ties of their command. Finally, the broad general scope ofthe course subject areas appears to be a positive aspect,since the responses to the authors' question 40 indicatethat 83% of the junior level comptrollers from USAREUR occupysupervisory positions (e.g., Chief, Program/Budget Division;Chief, Management Division; Chief, Internal Review Division;Chief, Manpower Management Division). The authors contendthat this broad general scope of course subject areas wouldbe of great benefit to these junior level comptroller super-visors who must quickly become familiar with the USAREURunique aspects of comptrollership, in order to provide theircommands with sound nd timely resource management decisions.
144

in order of importance the specific organizational behavior
deficiencies of junior level DA comptrollers (refer to Table
Iv-8).
The chapter concluded with the presentation of the DA
comptrollers' recommendations for minimizing the organizational
behavior deficiencies exhibited by junior level comptrollers
(refer to Table IV-9).
145
V. RESULTS, DISCUSSION AND CONCLUSIONS
A. INTRODUCTION
In this chapter both the objectives of this thesis and
the Pledger comptrollership model are reviewed. Nixt, the
results of the data analysis pertaining to the Pledger compo-
trollership model and the job preparation of junior level
DA comptrollers are discussed. Then the conclusions and
recommendations of the thesis are presented. Finally, the
limitations of the research are discussed and recommendations
f or future study are presented.
B. THESIS OBJECTIVES
The purpose of this thesis was twofold: First, test the
validity of the Pledger comptrollership model for use within
Department of the Army (DA). Second, identify and rank in
order of importance the specific organizational behavior defi-
ciencies of junior level DA financial managers and develop an
addendum to Tully and Batiste's proposed practical comptroller-
ship course (PCC) that could be used to alleviate the
deficiencies.
C. REVIEW OF THE PLEDGER COMPTROLLERSHIP MODEL
The Pledger comptrollership model was derived by Pledger
(1980) from several organizational behavior theories. The
model and these theori.es were reviewed in Chapter II. The
Pledger comptrollership model was designed to aid comptrollers
146

in analyzing their organizations in terms of technology and
structure, leadership, and decision-making (refer to Figure
11-6). The analytical results of the Pledger comptroller-
ship model would guide the comptrollers to take an appro-
priate course of action.
D. DISCUSSION OF DATA ANALYSIS RESULTS
1. The Pledger Comptrollership Model
a. Technology and Structure Data
The correlations depicted in Table IV-l (Hypothe-
sis 1) reflect the presence of relationships between tech-
nology and structure variables that exist within DA comptroller
organizations. A familiarity with and understanding of these
relationships could assist the comptroller during the first
one hundred days of a new assignment. For example, if the
organization is transitioning from a manual to machine operated
(i.e., increase in automation) conversion process the comp-
troller should expect an increase to occur in the degree of
interdependence among different functions within the organiza-
tion and should take steps to facilitate such a change. This
course of action by the comptroller would also be appropriate
if the organization was changing from one particular computer
software program to another. This type of change process
occurs in the DA as new and better financial management systems
become operational.
The variable means and background information
listed in Table IV-2 (Hypotheses 2, 3 and 4) reflect the
147"

presence of characteristics within DA comptroller organizations
pertaining to the overall operating environment. For example,
the overall operating environment within the DA comptroller
community is basically stable (i.e., the environment is char-
acterized by little or no change in the market structure for
DO comptroller organizations) . A familiarity with and under-
standing of this characteristic could assist the comptroller
during the initial stages of a new assignment. For example,
if there is a clear lack of coordination between the comptroller
organization and other major staff organizations within the com-
mand, the comptroller should immediately ascertain why and
then take appropriate action.
The variable means and background information listed
in Table IV-2 (Hypotheses 2, 3, and 4) reflect the presence
of characteristics within DA comptroller organizations per-
taining to technology. For example, the technology of DA
comptrollership is characterized by fairly standardized in-
puts and products, fairly predictable production steps, par-
tially automated conversion process, and relatively high de-
grees of emphasis on output quality control and performance
evaluation. A familiarity with and understanding of these
characteristics could assist the comptroller during the initial
stages of a new assignment. For example, if there is a clear
lack of emphasis on output quality control and performance
evaluation within the organization, the comptroller should
immediately ascertain why and then take appropriate action.
148

The variable means and background information
listed in Table IV-2 (Hypotheses 2, 3, and 4) reflect the
presence of characteristics within DA comptroller organiza-
tions pertaining to structure. For example, the structure
of DA comptrollership is characterized by a relatively high
degree of formalization (i.e., reliance on formal rules and
regulations), vertical communications, interdependence among
functions, coordination among functions, and specialization
of functions. Additionally, DA comptroller organizations
tend to have clear chains of command and tend to be decen-
tralized with routine decisions being made by division chiefs.
Finally, DA comptroller organizations tend to have relatively
wide spans of control (i.e., 5-6 individuals reporting directly
to the comptroller). A familiarity with and understanding
of these characteristics could assist the comptroller daring
the initial staqes of a new assignment. For example, if there
is a clear lack of vertical communications within the organi-
zation, the comptroller should immediately ascertain why and
then take appropriate action.
In summary, the correlations, variable means, and
background information discussed above provide support for
the environment and technology/structure components of the
Pledger comptrollership model.
b. Leadership Data
The authors' analysis of data pertaining to the
individual characteristics of the leader is one of the three
149

factors of particular importance that a manager must consider
in selecting an optimal leadership style. The other two fac-
tors discussed in Chapter II are the followers and the situa-
ction. These two factors were not included in the design of
Lhis thesis, but stand on the merits of the Tannenbaum and
Schmidt (1973) work.
The data results depicted in Table IV-4 (Hypothe-
ses 5 and 6) indicate the high degree of concern of DA comp-
trollers with both mission accomplishment (i.e., task related
orientation) and subordinate well-being (i.e., socio-emotional
orientation). The data results depicted in Table IV-5 (Hypothe-
sis 7) indicate that DA comptrollers utilize a numger of dif-
ferent leadership styles as the situations and pressures change.
The data results depicted in Table IV-6 (Hypothesis 8) indi-
cate that DA comptrollers maintain a relative balance between
managerial authority and subordinate freedom. These results
pertaining to Hypothesis 8 are not unexpected in view of DA
comptrollers' high degree of socio-emotional and task related
leadership behavior. The large utilization percentage for
leadership style G (refer to Table IV-6) is not unexpected in
view of the relatively high amount of discretion (refer to
Table III-10, question 26) which is held by lower levels within
DA comptroller organizations and the tendency of these organi-
zations to be decentralized with routine decisions being made
by division chiefs.
In summary, both the data analysis results per-
taining to the individual characteristics of the leader and
150

the discussion in Chapter II pertaining to the followers and
situations provide support for the leadership component of
the Pledger comptrollership model.
c. Decision-Making Data
The relationships depicted in Table IV-7 (Hypothe-
sis 9) between particular decision-making methods and their
predicted and actual utilization indicate that, with the ex-
ception of bureaucratic politics, there is little correspondence
between decision-making situations encountered by DA comp-
trollers and their choice of a particular decision-making
method (i.e., that is DA comptrollers use mixed decision-making
methods as decision-making situations change) . For example,
for all subsamples the actual utilization of the rational
method exceeded its predicted utilization and the actual uti-
lization of the organizational processes method was lower than
its predicted utilization. Nevertheless, when a decision-
making situation arises in which a DA comptroller does not
know what method to employ, the Pledger comptrollership model
can be utilized to assist in selecting an appropriate decision-
making method (refer to Section A, Table 111-6). For example,
if the situation is a crisis (i.e., high threat, short time
fuze, and no warning) , there will be no time to successfully
employ the rational decision-making method. The most likely
response would be to follow SOPs, satisf ice, or try a solution
which has worked in the past which are examples of the organi-
zational processes method [Pledger, 19801.

2. Job Preparation of Junior Level Comptrollers
After identifying and ranking in order of importance
the organizational behavior deficiencKt- of junior level DA
comptrollers (Table IV-8), evaluating the comptrollers'
recommendations regarding improvement of the training and/or
performance of junior level DA comptrollers (Table IV-9), and
evaluating the comments of Commander (CDR) Edwin Fincke, USN
and Colonel (COL) William Graham, USA (Appendix H), the authors
developed an addendum to Tully and Batiste's (1980) proposed
PCC. The purpose of the addendum is to alleviate the main
organizational behavior deficiencies exhibited by junior level
comptrollers. The subject areas and related instructional
hours for the proposed PCC addendum contains relevant organi-
zational behavior information and material that will better
prepare the new junior level financial manager for duties within
the DA comptrollership field. The course material listed in
the addendum is designed to alleviate some of the most common
organizational behavior deficiencies exhibited by junior level
DA comptrollers. Specifically, these organizational behavior
deficiencies are oral and written communication, staff proce-
dures, and civilian personnel management/relations. The course
material also includes a two hour block of instruction on the
Pledger comptrollership model. The course material does not
include any instruction on common sense, even though 27.1% of
the comptrollers responding to question 42 identified it as a
deficiency exhibited by junior level comptrollers. This deci-
sion was based on the authors' belief and comments from some
L52.
of the comptroller respondents that common sense is not some-
thing individuals can learn in a classroom, rather it is a
trait that individuals develop as a result of experience.
The technical training of junior level comptrollers
was identified as a deficiency by a substantial number of the
comptrollers who replied to the question. This finding pro-
vides further support for the research of Tully and Batiste
which identified a specific need for improving the technical
skills of junior level comptrollers. Tully and Batiste,
and Graham (1981) suggest that implementation of a comptroller
intern program within each of the DA commands is one course
of action that can be taken to improve the technical skills
of junior level financial managers. Support for this sugges-
tion also came from one comptroller respondent who implemented
a successful two year intern training program for junior level
comptrollers (refer to Table IV-9, recommendation 19).
Five comptrollers responding from USAREUR mentioned
problems associated with the USAREUR unique aspects of comp-
trollership (e.g., USAREUR peculiar resource management poli-
cies, procedures and activities) (refer to Table IV-3). The
comptroller from the DA's 3rd Infantry Division, LTC Quinn,
mentioned that the most positive action possible for improve-
ment of performAnce of USAREUR junior level comptrollers during
their first 100 days would be to initiate a special course
(refer to Table IV-9). LTC Quinn's budget officer, Major
Plowden, provided the authors with an outline of the subject
areas for this proposed course. The subject areas for this
153
proposed USAREUR peculiar course are presented in Appendix
G. The authors' decision to present the course as an appen-
dix was based on three factors. First, as previously dis-
cussed, five of the nine comptrollers responding from USAREUR
mentioned problems associated with the uniqueness of this
overseas command. Second, this particular course may be an
effective and expeditious means of familiarizing the USAREUR
junior level comptrollers with the special resource management
policies, procedures and activities of their command. Finally,
the broad general scope of the course appears well suited for
USAREUR junior le~rel comptrollers who in most instan'ces are
serving in supervisory positions (e.g., Chief of Program/
Budget Division, Chief of Management Divzision, Chief
of Internal Review Division, Chief of Manpower Management
Division).
E. CONCLUSIONS AND RECOMMENDATIONS
1. The Pledger Comptrollership Model
Based upon results of the data analysis the Pledger
comptrollership model is appropriate for use by DA comptrollers
in facilitating the crucial transition period of the "first
one hundred days" in a new assignment. The authors recommend
that the DA adopt the Pledger comptrollership model for j.ob iorientation use within the comptroller community. The DA
should begin teaching the Pledter comptrollership model to
students attending the Military Comptroll~ership Course (MCC)
at Fort Benjamin Harrison, Indiana. The Pledger comptrollership
154
model should be incorporated into the MCC program of instruc-
tion (POI) as a permanent block of instruction.
2. Job Preparation of Junior Level DA Comptrollers
Junior level DA comptrollers exhibit deficiencies in
eight organizational behavior areas (refer to Table IV-8).
Oral and written communications, staff procedures, personnel
relations, common sense and civilian personnel management/
relations were the most frequently mentioned areas in need
of improvement. In order to alleviate these deficiencies,
the authors recommend that the DA adopt and institute the
addendum to Tully and Batiste's proposed PCC. This 24 hour
proposed PCC addendum is presented as Appendix J.
Junior level DA comptrollers exhibit deficiencies in
the technical 3kill areas of comptrollership. In order to
alleviate these deficiencies, the authors recommend the
following two courses of action. First, the DA should adopt
and institute Tully and Batiste's proposed PCC. This 95 hour
proposed PCC is presented as Appendix I. Second, commands
within the DA should implement their own comptroller intern
training programs. These programs should be tailored to the
needs of both the command and the junior level DA comptrollers.
F. LIMITATIONS OF AUTHORS' RESEARCH AND RECOMMENDATIONS FOR
FUTURE STUDYI 1. The Pledger Comptrollership Model
The data pertaining to the Pledger comptrollership
model was analyzed as a total sample and by the 10 subsamples
listed in Table 111-4. This analysis could be expanded to
155

include additional subsamples such as educational level of
the comptroller, experience level of the comptroller, and
size of the command. This type of analysis would provide
additional information about the effects of the particular
characteristics of the comptroller or the command on the
comptroller organization itself.
The leadership questions were structured to provide
a self-report of the degree to which DA comptrollers perform
both the socio-emotional and task-related leadership functions.
As discussed in Chapter III, social desirability response
bias is possible with these questions, since they tend to
provide the opportunity for comptrollers to show themselves
as completely effective and empathic managers. Division
chiefs (i.e., budget chief, management chief, internal review
chief, finance and accounting chief, and force development
chief) could be asked to assess the degree to which DA comp-
trollers perform both the socio-emotional and task related
leadership functions. This information might provide a more
unbiased assessment of the degree to which DA comptrollers
perform both the socio-emotional and task related leadership
functions.
The questionnaire sent to the various DA commands con-
tained a separate question for both the decision-making situa-
tions encountered and the decision-making methods used by DA
comptrollers in carrying out their responsibilities. These
two questions provided the data to conclude, with the excep-
tion of the bureaucratic politics method, that DA comptrollers

use mixed decision-making methods as decision-making situa-
tions change. However, the data did not permit the authors
to directly link the various decision-making methods with the
various decision-making situations. A direct linking is possi-
ble if the list of situations and list of methods are consoli-
dated into one question. For example, for each situation the
respondents would indicate those methods used in making deci-
sions concerning their organization and command. This method
would provide more detailed decision-making information. For
example, for those situations associated with the rational
method (e.g., innovative, inertia and deliberative decision-
making situations) there would be a breakout of how often the
comptroller used the rational, organizational processes, and
bureaucratic politics decision-making methods. For those
situations associated with the organizational processes method
(e.g., circumstantial, routine, crisis, reflexive, adminis-
trative, possibly innovative, and possibly deliberative decision-
making situations) there would be a breakout of how often
the comptroller used each of the three decision-making methods.
For those situations associated with the bureaucratic politics
method (e.g., possibly crisis and possibly reflexive) there
would be a breakout of how often the comptrollers used each
of the three decision-making methods.
The authors recommend testing the Pledger comptroller-
ship model in other uniformed services such as the United
States Marine Corps (USMC), the United States Coast Guard
(USCG) , and the United States Air Force (USAF) . The purpose
is-

of such testing is twofold: One, determine the applicability
of the model for use within the USMC, USCG and USAF. Two,
conduct a comparison of the organizational behavior aspects
associated with each of the uniformed services (i.e., Depart-
ment of the Navy (USN), DA, USMC, USCG and USAF).
2. Job Preparation of Junior Level Comptrollers
A detailed investigation of the unique problems en-
countered by junior level DA comptrollers in USAREUR was not
part of the original design of this thesis. However, based
on the information provided by the USAREUR comptroller respon-
dents, it is apparent that junior level comptrollers in USAREUR
face the additional challenge of quickly grasping the unique
resource management policies and procedures of this overseas
major command (MACOM).
The authors recommend that the DA conduct a more de-
tailed research effort to determine those specific resource
management policies and procedures that must be understood
by USAREUR junior level comptrollers if they are to effec-
tively carry out their responsibilities. Following identifi-
cation of these specific resource management policies and
procedures the DA should devise a course similar to the one
presented as Appendix G. The purpose of such a course would
be to improve the performance of USAREUR junior level comp-
trollers during the first one hundred days of their new
assignment. Finally, the authors recommend that one or two
DA financial management graduate students develop the civilian
personnel relations case study that is part of the 24 hour
proposed PCC addendum (refer to Appendix .
13 8
-MO
G. SUMMARY
This thesis began with an overview of the DA comptroller
community and a review of the literature associated with the
components of the Pledger comptrollership model. The thesis
continued with a discussion of the research methods used in
identifying the specific organizational behavior deficiencies
of junior level DA comptrollers and testing the Pledger comp-
trollership model. This included a detailed description of
the questionnaire, data analysis plan and data preparation
process. The thesis concluded with the presentation and
discussion of the results of the data analysis pertaining to
the Pledger comptrollership model and the job preparation of
junior level comptrollers. The results indicated that the
Pledger comptrollership model is appropriate for use by DA
comptrollers in facilitating the crucial transition period of
the "first one hundred days" in a new assignment, and that
junior level DA comptrollers exhibit deficiencies in eight
organizational behavior areas. Based on these results the
authors' recommended that the DA follow two courses of action.
First, the DA should adopt the Pledter comptrollership model
for job orientation use within the comptroller community.
Second, the DA should adopt and institute the 24 hour proposed
PCC addendum presented as Appendix J.
159

APPENDIX A
COMPTROLLER RESPONSIB ILITIES
The following is a description of the Department of Army
(DA) comptroller responsibilities at the division, installa-
tion and Major Command (MACOM) levels of command.
Division Comptroller. This individual focuses upon budget
execution, simple management analysis activities, internal
review, and follow-up action on external installation, Army
Audit Agency (AAA), and General Accounting Office (GAO) re-
port findings [USAIS, 19781. The division comptroller uses
the internal review capability to monitor the Finance Account-
ing Otf ice (FAQ). Unliquidated balances, accounts receivable,
cash controls, timing of travel claims, and the processing of
vendor's invoices for payments are some areas within FAO that
receive close attention and undergo periodic reviews [USAIA,
1978]. Division comptrollers have found themselves working
more frequently with Brigade and Battalion commanders in order
to better support and justify operating budget requests fIJSAIA,
19781. This interaction with lower level commanders is particu-
larly prevalent in armored and mechanized units. These units
require a great deal of advance financial planning because
they are costly to operate in terms of fuel and repair parts.
Installation Comptroller. This individual also concentrates
on budgeting, accounting, management analysis, internal review
160

and statistical reporting. Additionally, the installation
comptroller's office prepares and issues directives and proce-
dures essential for the preparation of budget estimates and
studies. The comptroller provides the authority for the
utilization of financial resources and conducts budget analy-
sis for the interpretation of resource utilization and obli-
gation rate trends. The comptroller's office also accumulates,
records, and presents statistical data which identifies manage-
ment deficiencies; and it maintains surveillance over the
administrative control and utilization of funds. Finally, the
office insures the collection of necessary data to facilitate
budget execution, reviews the major activity budget execution
reports and insures the continuous compatibility between con-
sumers fund budgets for stock fund items and the Army Stock
Fund Budget [USAIA, 1978]. In summary, the installation comp-
troller's most important and time intensive role involves the
management of the budget development and execution process
[USAIA, 1978].
MACOMComptroller. This individual has basically the same
duties and responsibilities as are found at the installation
level. Additionally, the MACON comptroller must be concerned
with the establishment and maintenance of favorable informal
relationships between the MACOM office, DA, and subordinate
installation comptroller offices. Providing assistance to
the installations and monitoring their compliance to commnand
directives is an important task of the ZMACOM comptroller
161

office. Maintaining close contact with the installation
comptrollers should be a priority for a MACOM comptroller.
This contact facilitates accomplishment of the year-round
budget preparation and execution process [USAIA, 1978].
!62

APPENDIX B
LEADERSHIP STYLES AVAILABLE
The following is a description of the seven leadershipstyles depicted along Tannenbaum and Schmidt's continuum ofleadership behavior (refer to Figure I1-1 4), as quoted from"How to Choose a Leadership Pattern," Harvard Business Review(May-June 1973) by Robert Tannenbaum and Warren H. Schmidt.
1. The Manager Makes the Decisions and Announces it. Inthis case the boss identifies a problem, considers alternativesolutions, chooses one of them, and then reports this decisionto his subordinates for implementation. He may or may notgive consideration to what he believes his subordinates willthink or feel about his decision; in any case, he providesno opportunity for them to participate directly in the decision-making process. Coercion may or may not be used or implied.
2. The Manager "Sells" His Decision. Here the manager, asbefore, takes responsibility for identifying the problem andarriving at a decision. However, rather than simply announcingit, he takes the additional step of persuading his subordinatesto accept it. In doing so, he recognizes the possibility ofsome resistance among those who will be faced with the deci-sion, and seeks to reduce this resistance by indicating, forexample, what the employees have to gain from his decision.
3. The Manager Presents His Ideas, Invites Questions. Herethe boss who has arrived at a decision and who seeks acceptanceof his ideas provides an opportunity for his subordinates toget a fuller explanation of his thinking and his intentions.After presenting the ideas, he invites questions so that hisassociates can better understand what he is trying toaccomplish.
4. The Manager Presents A Tentative Decision Subject ToChange. This kind of behavior permits the subordinates toexert some influence on the decision. The initiative foridentifying and diagnosing the problem remains with the boss.Before meeting with his staff, he has thought the problemthrough and arrived at a decision--but only a tentative one.Before finalizing it, he presents his proposed solution forthe reaction of those who will be affected by it.
5. The Manager Presents The Problem, Gets Suggestions, andThen Makes His Decision. Up to this point the boss has comebefore the group with a solution of his own. Not so in thiscase. The subordinates now get the first chance to suggestsolutions. The manager's initial role involves identifyingthe problem.

6. The Manager Defines The Limits and Requests The Group toMake a Decision. At this point the manager passes to the group(possibly including himself as a member) the right to makedecisions. Before doing so, however, he defines the problemto be solved and the boundaries within which the decisionmust be made.
7. The Manager Permits the Group to Make Decisions WithinPrescribed Limits. This represents an extreme degree of groupfreedom only occasionally encountered in formal organizations,as, for instance, in many research groups. Here the team ofmanagers or engineers undertakes the identification and diag-nosis of the problem, develops alternative procedures forsolving it, and decides on one or more of these alternativesolutions. The only limits directly imposed on the group bythe organization are those specified by the superior of theteam's boss. If the boss participates in the decision-makingprocess, he attempts to do so with no more authority than anyother member of the group. He commits himself in advance toassist in implementing whatever decision the group makes.
164
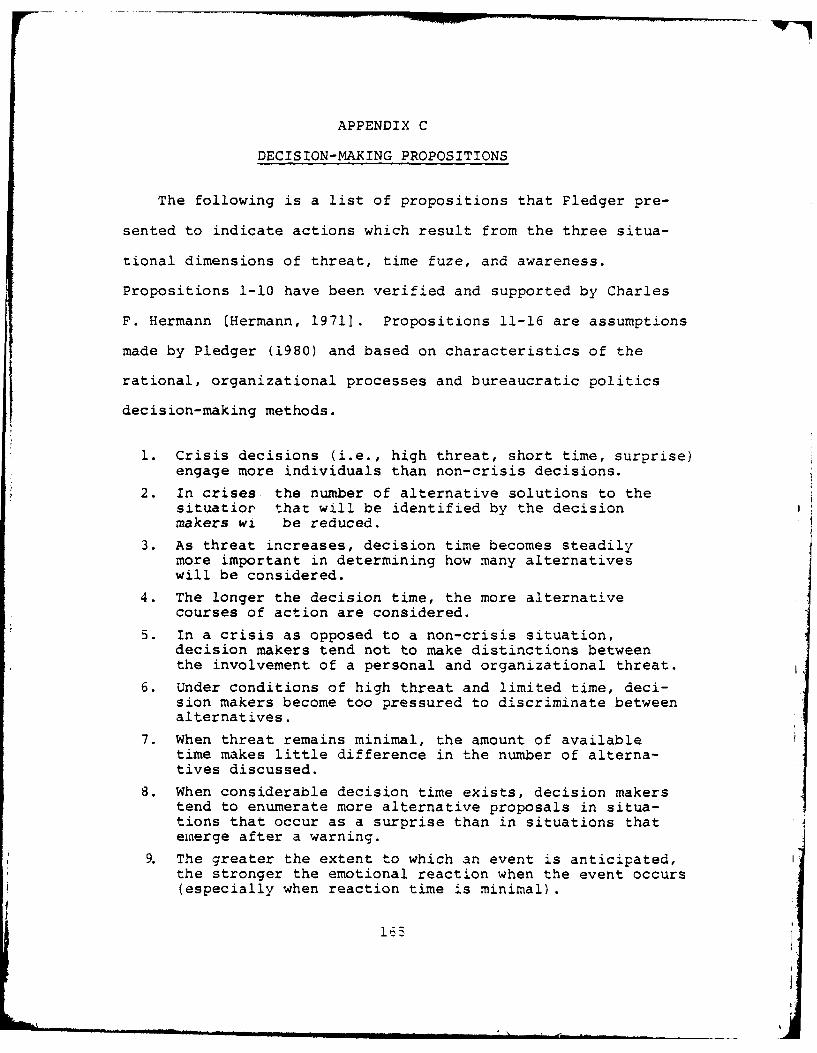
APPENDIX C
DECISION-MAKING PROPOSITIONS
The following is a list of propositions that Pledger pre-
sented to indicate actions which result from the three situa-
tional dimensions of threat, time fuze, and awareness.
Propositions 1-10 have been verified and supported by Charles
F. Hermann (Hermann, 1971]. Propositions 11-16 are assumptions
made by Pledger (1980) and based on characteristics of the
rational, organizational processes and bureaucratic politics
decision-making methods.
1. Crisis decisions (i.e., high threat, short time, surprise)engage more individuals than non-crisis decisions.
2. In crises the number of alternative solutions to thesituatior that will be identified by the decisionmakers wi be reduced.
3. As threat increases, decision time becomes steadilymore important i~n determining how many alternativeswill be considered.
4. The longer the decision time, the more alternativecourses of action are considered.
~.In a cri.sis as opposed to a non-crisis situation,decision makers tend not to make distinctions betweenthe involvement of a personal and organizational threat.
6. under conditions of high threat and limited time, deci-sion makers become too pressured to discriminate betweenalternatives.
7. When threat remains minimal, the amount of availabletime makes little difference in the number of alterna-tives discussed.
8. When considerable decision time exists, decision makerstend to enumerate more alternative proposals in situa-tions that occur as a surprise than in situations thatemaerge after a warning.
9. The greater the extent to which an event is anticipated,the stronger the emotional reaction when the event occurs(especially when reaction time is minimal).
163

10. The greater the crisis, the greater the propensityto supplement information about the objective stateof affairs with information drawn from past experience.
11. The rational process, due to its nature of alternativegeneration and analysis, will take more time than thetwo non-rational methods.
12. The rational process will tend to be utilized more insituations which lend themselves to alternativegeneration and analysis.
13. Non-rational decision-making methods will dominatesituations with short time fuzes for the followingreasons. These situations tend to create stress withinthe decision-maker which results in (1) repetition ofprior responses regarded as successful, (2) perceptionof fewer alternatives available, (3) zero sum (black!white) thinking.
14. The practices of satisf icing and development of SOPsare useful in situations where decisions must be madewith a short time fuze.
15. SOPs and uncertainty avoidance might be used when thereexists a high threat to the decision maker or theorganization.
16. If a decision maker is prone to making decisions based .on personal emotions or ambitions, he/she will mostlikely do so in situations of a high threat nature witha short time fuze. The high threat to the decisionmaker will involve a self-protective reaction. Theshort time fuze allows the decision to be made withoutoutside input or approval.
166

APPENDIX D
QUESTIONNAIRE
Please list your organization and its specific location
To what Major Command is your organization assigned (e.g.,FORSCOM, TRADOC, USAREUR, Health Services Command?)
Please record your autovon telephone number
Please answer the following questions.
1. Designate whether you are military or civilian.What is your rank or GS rating?
2. If military, what is your primary specialty?and secondary specialty?
3. If civilian, what is your specialty code? Number and com-plete nomenclature please
4. Is this your first tour of duty as the comptroller of anorganization?
5. If military, how many tours of duty have you had within the45 specialty area prior to this current assignment?
6. If military, was your last tour of duty (i.e., your tourof duty immediately prior to this current assignment)
- thin the 45 specialty area?
7. How long have you been in your current assignment?(Mo)
8. What is your highest educational degree and major?(Ex. MS in financial management, BS in engineering, etc.)
From what college, university or institution did you re-ceive you highest educational degree?
9. Approximately how many personnel are assigned to yourparticular command? (i.e., if you are the comptroller forthe 2nd Armored Division, please record the total numberof personnel in the Division.)
167

10. Approximately how many personnel are assigned and attached
to your comptroller organization?___________
11. How many personnel report directly to you? _______
12. How many hierarchical levels (e.g., levels of supervisors
and/or managers) are there in your comptroller organization?
13. To whom in the command do you have reporting responsibility?
Please circle the most appropriate answer to each of thefollowing qusios Questions 14-28 relate to structure andtechnology Lithin your comptrol l -F.Trg~nTzatiF.
14. At what organizational level are command financial decisionsmade within your organization?
1 2 3 4 5
At the C.O. level At the comptrolleronly with little level (C.O. rub-advice from the ber stamps).comptroller.
15. At what level are routine decisions made internal to thecomptroller organization?
1 2 3 4 5At the comptroller At the lowest levellevel only. in the organization.
16. To what extent are written procedural rules and regulationsfollowed within the comptroller organization (concerningfunctional procedures such as budgeting, internal review,cost analysis)?
1 2 3 4 5Rules strictly Rules seldom iffollowed always. ever followed.
17. How do you perceive the freedom and amount of upward com-munication within the comptroller organization?
1 2 3 4 5High Very little, if
any.
18. How dependent upon one another are the different functions(e.g., budgeting, internal review, cost analysis) withinthe comptroller organization?
1 2 3 4 5Very dependent. Not at all.
168
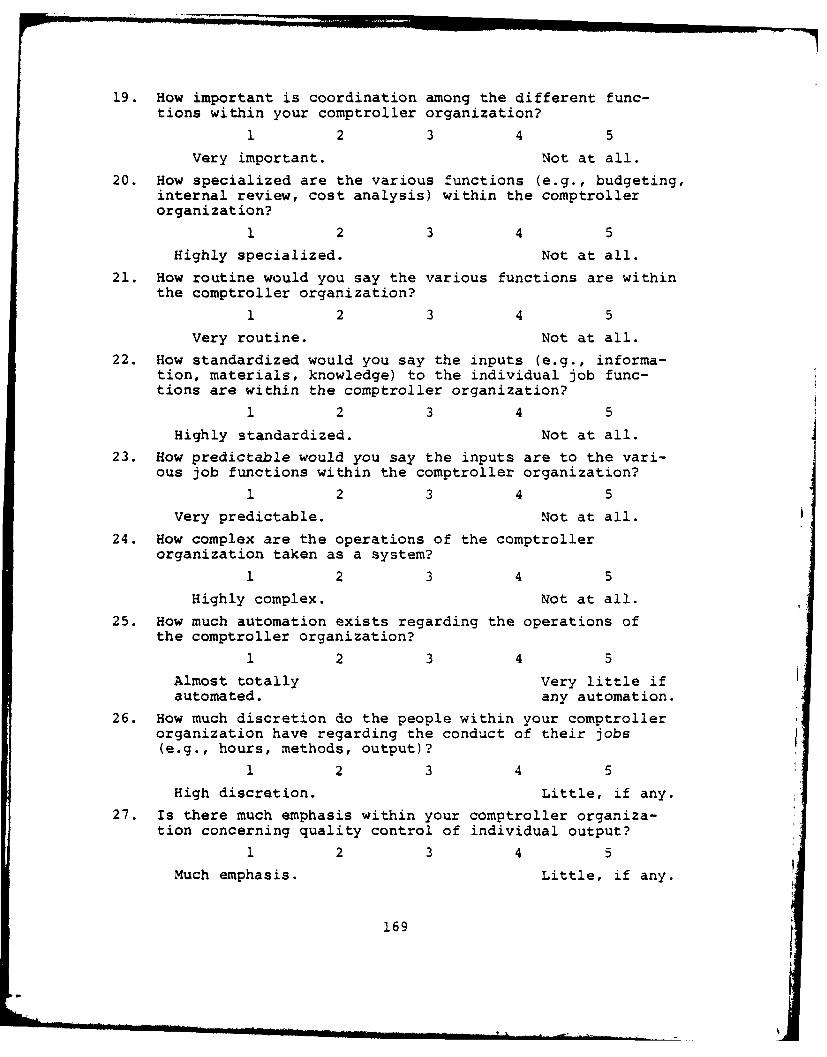
19. How important is coordination among the different func-tions within your comptroller organization?
1 2 3 4 5Very important. Not at all.
20. How specialized are the various functions (e.g., budgeting,internal review, cost analysis) within the comptrollerorganization?
1 2 3 4 5Highly specialized. Not at all.
21. How routine would you say the various functions are withinthe comptroller organization?
1 2 3 4 5Very routine. Not at all.
22. How standardized would you say the inputs (e.g., informa-tion, materials, knowledge) to the individual job func-tions are within the comptroller organization?
1 2 3 4 5Highly standardized. Not at all.
23. How predictable would you say the inputs are to the vari- *ous job functions within the comptroller organization?
1 2 3 4 5Very predictable. Not at all.
24. How complex are the operations of the comptrollerorganization taken as a system?
1 2 3 4 5
Highly complex. N1ot at all.25. How much automation exists regarding the operations of
the comptroller organization?
1 2 3 4 5Almost totally Very little ifautomated. any automation.
26. How much discretion do the people within your comptrollerorganization have regarding the conduct of their jobs(e.g., hours, methods, output)?
1 2 3 4 5High discretion. Little, if any.
27. Is there much emphasis within your comptroller organiza-tion concerning quality control of individual output?
1 2 3 4 5Much emphasis. Little, if any.
169

28. Is employee/subordinate performance feedback emphasized
within your comptroller organization?
1 2 3 45Always. Never.
Questions 29-34 relate to leadership. Please circle the most
appropriate answer to eachof these six questions.-
29. Are you willing to make changes?
0 1 2 3 4
Always Often Occasionally Seldom Never
30. Do you put suggestions that are made by people in yourwork group into operation?
0 1 2 3 4
Always Often Occasionally Seldom Never
31. Do you treat all people in your work group as your equal?
0 1 2 3 4
Always Often Occasionally Seldom Never
32. Do you see to it that people in your work group areworking up to their capacities?
0 1 2 3 4
Always Often Occasionally Seldom Never
33. Do you ask that your subordinates follow to the letter
standard routines handed down to you?
0 1 2 3 4
Always Often Occasionally Seldom Never
34. Do you emphasize to your subordinates the meeting ofdeadlines?
0 1 2 3 4A great Fairly To some Compara- Not at
deal much degree tively alllittle
35. The following is a list of seven different leadershipstyles. In the blanks to the right try to list theapproximate percentage of time you utilize each of theseven leadership styles. (Try to make the %'s equal 100%.)
Leadership style %
a. Manager makes decision and announces it.
b. Manager "sells" decision.
c. Manager presents ideas and invitesquestions.
170

35. (Continued)
Leadership style
d. Manager presents tentative decisionsubject to change.
e. Manager presents problem, gets ges-tions, makes decision.
f. Manager defines limits; asks groupto make decision.
g. Manager permits subordinates to functionwithin limits defined by superior.
Questions 36 and 37 relate to decision making. Please readthe questions ci-fuly Foreanswering.
36. The following is a list of situations in which decisionssometimes must be made. In the blanks to the right, tryto list the approximate percentage of the time you makedecisions in each type of situation. (Try to make the%'s equal 100%.)
Type of Threat to Time Your aware- %situation your per- fuze ness ahead
formance as of timecomptroller
a. Crisis High Short Surprise
b. Innovative High Extended Surprise
c. Inertia Low Extended Surprise
d. Circum-stantial Low Short Surprise
e. Reflexive High Short Anticipated
f. Delibera-tive High Extended Anticipated
g. Routine Low Extended Anticipated _
h. Adminis-trative Low Short Anticipated
37. From the following list, check at least six words/phraseswhich pertain to the process you use as the Comptroller inmaking decisions concerning your organization and thecommand.
unitary decision maker
follow SOP/regulations
personal interests
prefer incremental change to current policy ratherthan radical change if possible
171

37. (Continued)
_______state the objective
_______develop alternatives
_______sell the decision to the commander
_______divide problem into factors to be divided amongsub-units in the organization
______analyze each alternative (e.g., economic analysis,cost/benefit, en'c.)
_______effect of decision on my own career
_______usually pick first acceptable alternative
_______list assumptions concerning alternatives
______________________pick alternative which provides feedback
38. Briefly list those areas which gave you the most problemsduring your first hundred days in your present assignmentas a comptroller. Please expound upon what you feelcaused the problems. These problems can be of a technical(e.g., PPBS, cost analysis) or non technical (e.g., per-sonnel relations, staff procedures) nature.
39. Do you have any advice for the new comptroller with regardto the first hundred days of the assignment? (This isthe first area where you can help me the most. Use backof this page if necessary.)
172

Please answer the following questions which pertain tomilitary officers--n your comptroller organization servingtheir first tour in the comptro lership k 5) speciaJty.
40. How many military officers in your comptroller organiza-tion are serving their first tour in the comptrollershipspecialty (i.e., the 45 specialty area)?
41. For all officers indicated in Quescion #40 above, pleaselist the actual duty position they currently occupy andwhether it is a supervisory position or not.
1st Officer2nd Officer
3rd Officer
Additional Officers
42. Are there any non-technical areas involving Army comptroller-ship that you feel your military subordinates, servingtheir first tour within the 45 specialty area, couldhave been better prepared to handle? If so what are theyand what are your recommendations for improving the train-ing and/or performance of these junior comptrollers. (Thisis the other area where you can help me the most.) (Usethe back of ti-s-paae if necessary.) A "non exhaustive"list of organizational behavior areas is given below forreference.
1. Staff procedures 5. Oral and writtencommunication
2. Leadership 6. Common sense
3. Personnel relations 7. Other
4. Management practices
17
173

APPENDIX E
TECHNOLOGY VS. STRUCTURE RELATIONSHIPS
TABLE 1
TECHNOLOGY VS STRUCTURE FOR OVERALL
SPAN OF HIERARCHICAL CENTRAL- FORMAL-CONTROL LZVELS IZATION IZATION
ROUTINENESS OF -0.0058 0.2802 0.0805 0.1305CONVERSION P=0.473 P=0.000 P=0.176 P=0.065
INPUT -0.0257 0.1356 0.1503 0.1778STANDARDIZATION P=0.384 P=0.058 P=0.040 P=0.019
INPUT -0.0754 0.0475 0.0744 0.0614PREDICTABILITY P=0.192 P=0.292 P=0.195 P=0.239
COEPLEXITY OF -0.1180 -0.1208 0.0253 0.1497CONVERSION P=0.086 P=0.081 2=0.385 P=0.041
AUIOMATION OF 0.0898 -0.1683 0.0774 0.0865CONVERSION P=0.150 P=0.026 P=0.185 P=0.158
DISCRETION IN -0.0302 -0.1215 -0. 1951 0.0019CONVERSION P=0.364 P=0.080 2=0.011 9=0.491
OUTPUT QUALITY -0.1140 0.0331 -0.0599 0.4343CONTROL P=0.094 P=0.351 P=0.244 P=0O.00
PERFORMANCE 0.0114 0.0115 -0.0679 0.3892EVALUATION P=0.448 P=0.447 2=0.216 P=0.000
VERTICAL INTER- COORDI- SPECIAL-COIMNICATICNS DEPENDENCE NAIION IZATION
ROOTINENESS OF -0.049 0.0073 0.0322 -0.0351CONVERSION P=0.285 P=0.465 ?=0.352 P=0.340
INPUT 0.1638 0.1343 0.1042 0.0859STANDARDIZATION P=0.028 P=0.059 P=0.114 P=0.160
INPUT 0.0317 -0.0368 -0.0390 0.1299PREDICTABILITY P=0.357 P=0.335 P=0.326 P=0.066
COMPLEXITY OF 0.0683 0.1901 0.1414 0.1943CONVERSION P=0.215 P=0.013 P=0.050 2=0.012
AUTOMATION OF 0.0244 0.2621 0.1114 0.2029CONVERSION P=0.389 P=0.001 P=0.098 P=0.009
DISCRETION OF 0.0295 -0.0374 0.0539 0.0431CCNVERSION ?=0.367 P=0.333 P=0.267 P=0.309
OUTPUT QUALITY 0.2504 0.1961 0.3293 0.2642CONTROL P=0.002 P=0.011 P=0.000 Pao.001
PESFORMANCZ 0.2998 0.1968 0.2924 0.0974
EVALUATION 2=0.000 P=0.011 P=0.000 P=0.130
174

TABLE 1 A
PARTIAL COaRELATION OF TECHNOLOGY VS STRUCTURE FOE OVERALL
SPAN OF HIERARCHICAL CENTRAL- FORMAL-CONTROL LEVELS IZATION IZATION
ROUTINENESS OF 0.0159 * 0.2495 0.3831 0.1207CONVERSION P=O. 430 P-0.002 P=0.335 P=0.088
INPUT -0.0120 0.1091 0.1514 0.0414STANDARDIZATION P=0.447 ?=0.111 2=0.045 P=0.322
INPUT -0.0845 -0.0991 0.0196 -0.0410PREDICTABILITY P=0.172 9=0.134 P=0.414 P=0.324
COMPLEXITY OF -0.1496 -0.0365 G.1012 0.0881CONVERSION P=0.047 9=0.342 2=0.129 ?=0.162"
AUIOSATION OF 0.1236 -0.1778 0.0453 -0.0354CONVERSION P=0.083 P=0.023 2=0.305 9=0.346
DISCRETION IN -0.0185 -0.0912 * -0.2061 -0.0192CCNVERSION P=0.418 P=0.154 '=0.010 P=0.415
OUTPUT QUALITY -0.1228 -0.0073 -0.0863 * 0.2817CONTROL P=0.085 P=0.468 P=0.167 P=0.001
PEEFORNANCE 0.0884 0.0441 -0.0752 * 0.2110EVALUATION P=0.161 9=0.311 P=0.200 9=0.009
VERTICAL INTER- COORD- SPECIAL-COMMUNICATIONS DEPENDENCE NATION IZATION
ROUTINENESS OF -0.0855 0.0241 0.0470 -0.0728CONVERSION P=0.170 P=0.394 P=0.300 9=0.208
INPUT 0.1120 0.0985 0.0407 -0.0217STANDARDIZATION P=0.105 9=0. 135 9=0.325 P=0.404
INPUT -0.0565 -0.0998 -0.1106 0.1646PREDICTABILITY P=0.264 9=0.132 2=0.138 P=0.032
COMPLEXITY OF -0.0022 0.1304 0.0556 0.1712CONVERSION P=0.490 P=0.072 2=0.267 P=0.027
AU7OMATION OF -0.0383 * 0.2188 0.0411 0.4177CONVERSION P=0.335 P=0.007 P=0.323 P=0.049
DISCRETION OF 0.0106 -0.0806 0.0377 0.0168CONVERSION P=0.453 P=0. 184 =0.337 P=0.426
OUTPUT QUALITY 0.1374 0.1121 * 0.2253 • 0.2310CONTROL P=0.062 2=0.105 P=0.005 P=0.004
PERFORMANCE * 0.1974 0.0524 0.134'5 -0.1117EVALUATION P=0.013 P0. 279 f=0.066 P=0. 106
* INDICATES THOSE RELATIONSHIPS LISTED IN TABLZ IV-1 ANDtISCUSSED IN PREVIOUS CHAPTERS.
175

TABLE 2
TECHNOLOGY VS. STRUCTURE FOR MILITARY COMPTRCLLERS
SPAN OF HIERARCHICAL CENTRAL- FORMAL-CONTROL LEVELS IZATION IZATION
ROUTINENESS OF 0.0722 0.1580 0.1141 0.0602CONVERSION P=0.261 P=0.080 P=0.154 2=0.295
INPUT -0.0382 0.0956 0.1948 0.2692STANDARDIZATION P=0.367 P=0.198 9=0.040 P=0.007
INPUT -0.0216 -0.0504 0.0153 0.0804PREDICTABILITY P=0.424 P=0.328 P=0.446 P=0.236
COMPLEXITY OF -0.1368 -0.0808 0. 1554 0.1257CCNVERSION P=0.112 P=0.237 P=0.082 P=0. 130
AUICNATION OF -0.0923 -0.1703 0. 1738 0.0595CONVERSION P=0.206 P=0.064 P=0.059 P=0.298
DISCRETION IN 0.1253 -0.1577 -0.1319 0.1059CONVERSION P=0.133 P=0.080 P=0.119 2=0.172
OUPUT QUALITY -0.2102 -0.0093 -0.0393 0.4182CONTROL P=0.030 2=0.467 P=0.363 P20.000
PERFORMANCE -0.0006 0.0758 0.0685 0.3595EVALUATION P=0.498 P=0.251 P=0.270 P=0.0CO
VERTICAL INTER- COORDI- SPECIAL-COMMUNICATIONS DEPENDENCE NATION IZATION
ROUTINENESS OF 0.0656 0.0053 0. 0264 -0.0963CONVERSION P=0.279 P=0.481 P=0.407 P=0. 195
INPUT 0.2281 0.2137 0.1279 0.1232STANDARDIZATION P=0.020 2=0.027 P=0.126 P=0. 135
INPUT -0.0019 0.1095 0.0155 0.2491PREDICTABILITY P=0.493 P=0.164 P=0.445 P=0.012
COMPLEXITY OF -0.0478 0.1421 0.1315 0.0880CCNVERSION P=0.335 2=0.101 P=0.119 P=0.216
AT OMATION OF -0.0715 0.3238 0.0875 0.2220CONVERSION P=0.262 2=0.001 P=0.217 P=O. 022
DISCRETION IN 0.1221 0.0210 -0.0339 0.1992CONVERSION P=0.137 P=0.426 2=0.381 20.030
OUTPUT QUALITY 0. 1735 0.0739 0.2290 0.2933CONTROL 20.060 P=0.255 P=0.019 2=0.004
PERFORMANCE 0.1994 0.1649 0.2271 0.0978EVALUATION P=0.036 P=0.069 2=0.020 9=0.191
176

TABLE 2A
PARTIAL CORRELATION OF TECHNOLOGY VS STRUCTURE FORMILITARY COMPTROLLERS
SPAN OF HIERARCHICAL CENTRAL- FORMAL-CONTROL LEVELS IZATION IZATION
ROUTINENESS OF 0.0523 0.1304 0. 1235 0.0617
CONVERSION P=0.330 P=0.136 P=0.149 P=0.302
INPUT 0.0075 0.1445 0.2282 0.1605STANDARDIZATION p=0.475 P=0.111 P=0.026 p=O.087
IPUlT -0.0425 -0.1469 -0.0881 -0.0775
PREDICTABILITY P=0.361 P=0. 108 P=0.229 P=0.257
COMPLEXITY OF -0.1632 -0.0250 0.2118 0.0762
CONVERSION P=0.084 P=0.417 P=0.036 P=0.261
AUTOMATION OF -0.0951 -0.1737 0.0975 -0.0569
CONVERSION P=0.212 P=0.071 P=0.206 P=0.316
DISCRETION IN 0.1865 -0.1138 -0.1931 0.1128
CONVERSION P=0.057 P=0.169 P=0.051 P=0.171
OUTPUT QUALITY -0.2413 -0.0768 -0.1259 = 0.2612
CONTROL P=0.020 P=0.259 2=0.144 p=0.013
PEPFORMANCE 0.1416 0.1108 0.0127 0.1545
EVALUATION P=0.116 P=0.175 =0.'458 P=0.096
VERTICAL INTER- COOED- SPECIAL-COMMUNICATIONS DEPENDENC Z NATION IZATION
BOUTINENESS OF 0.0477 0.0226 0.0481 -0.1238
CCNVERSION P=0.344 P=0.425 P=0.343 P=0. 148
INPUT 0.2193 0.1152 0.0505 -0.0778
STANDARDI.ATICN P=0.031 P=0.166 P=0.336 P=0.256
INPUT -0.1874 -0.0031 -0.0634 0.2799
PREDICTABILITY P=0.056 P=0.490 2=0.297 P=0.008
COMPLEXITY OF -0.0834 0.1303 0.1110 0.041.
CONVERSION P=0.241 P=0.136 P-0.175 P=0.364
AUTOMATION OF -0.1077 * 0.3106 0.0696 0.1533
CONVERSION P=0.182 P=0.004 P=0.279 ?=0.096
DISCRETION IN 0.1688 -0.0588 -0.0698 0.1765
CONVERSION P=0.077 P=0.311 P=0.279 P=0.068
OUTPUT QUALITY 3.0739 -0.0033 0.1377 0.2765
CONTROL P=0.267 P=0.489 P=0.123 P=0.009
PERFORMANCE 0.1417 0.0532 0.0956 -0.1185
EVALUATION P=0.116 P=0.327 P=0.210 F=0.159
, INDICATES THOSE RELATIONSHIPS LISTED IN TABLE IV-1 ANDCISCUSSED IN PREVIOUS CHAPTERS.
177

IABLE 3
TECHNOLOGY VS. STRUCTURE FOR CIVILIAN C0MPTRCLLZRS
SPAN OF HIERARCHICAL CENTRAL- FORSAL-CONTROL LEVELS IZAYION IZATION
,OUTNENESS OF -0,0758 0.4272 0.0 0.2521CONVERSION P=0.293 P=0.001 P=0.500 P=O.031
IIPUT 0.0051 0.2226 0.0153 0.0566STANDARDIZATION P=0.486 P=0.053 P=0.456 P=0. 342
INPUT -0.1167 0.2104 0.0632 0.1561PREDICTABILITY P=0.200 P=0.063 P=0.325 r=0.130
COMPLEXITY OF -0.1083 -0.1884 -0.1863 0.1626CONVERSION P=0.218 P=0.086 2=0.089 P=0.120
AUTiCHATION OF 0.3390 -0.1973 -0.0048 0.3472CONVERSION P=0.006 P=0.076 P=0.486 P=0.367
DISCRETION IN -0.2067 -0.0713 -0.3380 -0.1146CONVERSION P=0.067 P=0.304 P=0.006 P=0.205
OUTPUT QUALITY -0.0075 0.0858 -0,0,45 0.4446CONTROL P=0.478 P=0.269 2=0.322 P=0.000
PERFORMANCE -0.0022 -0.1109 -0.2485 0.3928EVALUATION P=O.494 P=0.212 P=0.035 P=0.002
VERTICAL INTER- COCRDI- SPECIAl-COMMUNICATICNS DEPENDENCE NATION IZATION
ROUTINENESS OF -0.1831 0.0973 0.0935 0.0338CONVERSION P=0.093 P=0.242 P=0.251 P=0.404
INPUT 0.0562 0.0472 0.0919 0.0210STANDARDIZATION P=0.343 P=0.367 P=0.254 P=0.440
INPUT 0.1372 -0.0548 -0.0169 -0.0312PREDICTABILITY P=0.161 P=0.347 2=0.452 P=0.411
COMPLEXITY OF 0.2535 0.2444 0.1311 0.3646CONVERSION P=0.032 P=0.037 P=0.172 P=0.003
AUTVCMATION OF 0. 1640 -0.0692 0.0593 0.1929CONVERSION P=0.118 P=0.309 P=0.335 P=0.081
DISCRETION IN -0.0949 -0.0876 0.2783 -0.1655CCNVERSION P=0.247 P=0.264 2=0.021 240.o116
OTPUT QUALITY 0.3594 0.3976 0.5386 0.2271cTT5cl, P=0.004 P=0.001 P=0.000 P=0.049
P!IFO FfANCz 0.4759 0.0615 0. 3739 0.1096rVALOATION 2=0.000 P=0.329 P=0.003 P=0.215
1boo8

IABLE 3A
PARTIAL CORRELATIONS OF TECHNOLOGY VS STRUCTURZ FOR
CIVILIAN COMPTROLLERS
SPAN OF HIERARCHICAL CENTRAL- FORM AL-CONTROL LEVELS IZATION IZATION
FOUTINEPNESS OF -0.1167 *0.3489 -0.0694 0.2748CONVERSION P=0.217 P=0.008 P=0.322 P=0.031
INPUT 0.0992 0.0431 U.0220 -0.2052STANDARDIZATION P=0.254 2=0.387 P=0.442 E-0.083
INPUT -0.1762 -0.0041 0.0337 0.0742PREDICTABILITY P=0.118 P=0.489 P=0.411 P=0.310
COMLvXITY OF -).2632 -0.0612 -0.1379 9.1692CCNVERSION P=0.037 P=0.341 P=0.178 P=0.128
AUICfIATION OF 0.3975 -0.2079 0.0755 -0.1803CONVERSION P=0.003 P=".J80 P=0.307 P=0.113
DISCR!TION IN -0.1817 -0.0257 -0.2689 -0.2349CONVERSION P=0.111 P=0.432 P=0.034 P=0.056
OUTPUT QUALITY 0.0077 0.0809 0.0430 0.2216CONTROL P=0.479 P=0.294 P=0.387 P=0.067
PERFORMANCE -0.0142 -0.0890 -0.1786 *0.3355EVALUATION P=0.462 P=0.276 2=0.115 P=0.011
VERTICAL INTER- COORD- SPECIAL-COMMUNICATIONS DEPENDENCE NATION IZATION
ROOT'MIENESS OF -0.3067 0.0710 0.0068 0.0465CONVERSION 2=0.018 P=0.318 P=0.482 P=0.378
INPUT -0.0084 0.0450 0.0828 -0.0149STANDARDIZATION P=0. 478 P=0. 382 9=0 .290 P=0.,460
INPUT 0.2125 -0.1350 -0.1649 -0.0094PREDICTABILITY P=0.076 P=0.183 P=0.134 P=0.475
COMPLEXITY OF 0.1817 0.2'441 -0.0403 0.3303CONVERSION P=0.111 P=0.049 P'=0.394 2=0.012
AUTOMATION OF -0.0175 -0.2281 -0.0725 0.0469CONVERSION P=0.454 P=0.062 2=0.314 P=0.377
DISC3ETION IN -0.2296 -0.0996 U.3090 -0.2054CONVERSION 2=0.060 P=0.253 P=0.017 2=0.083
OUTPJT QUALITY 0.1710 *0.4055 *0.4973 0.1245CONTROL P=0.125 P=0.002 P=0.000 P=0.202
PERFORMANCE *0.3707r -0.1235 0.0784 -0.0015EVALUATION P=0.005 P=0.204 P=0.300 2=0.496
*INDICATES THOSE RELATIONSHIPS LISTED IN TAbL:E IV-1 ANDCISCUSSED IN PREVIOUS CHAPTERS.
179

TABLE 4
TECHNOLOGY VS. STRUCTURE FOR FINANC2 OFICEES
SPAS OF 1HX!R1RCHICkL CENTRAL- FORHAL-CONTROL LEVELS IZ.ATION IZkTION
ROUTI13ENESS OF 0.0187 0.0899 -U.2143 0.1603CONVERaSION P=0.461 P=0.321 P=0.128 P=0.199
INPUT -0.106p8 -0.1215 0.0364 0.3695STAUDARDIZATION ?=0.287 P=0.265 P=0.424 P=0.022
INPUT 0.0510 -0.0262 -0.2780 0.15019PREDICTABILITY P-0.394 2=0.44i6 P=0.06a P=0.204
COM PLEXITY o? -0.415'; -0.3259 0.2'472 0.3162CONVERSION 2=0.011 P=0.042 P=0.094 2=0.044
AU'ICIATION OF -0.2021 -0.2652 0.1364 0.1107COVRINP=0.142 E=0.082 P=0.233 P=0.2803
DISCRZTION 0? -0.2979 -0.3805 -0.0565 0.2123CONvvE2SION P=0.061 2=0.021 P=0.383 P=0.13,)
OUTPUT QUALITY -0.3983 0.0339 0.1041 0.4835C03TROL P=0.015 P-0.431 P=0.292 P=0.003
PERFORM1ANCE -0.0444 -0.02283 -0.0309 0.5923EVALUATION P=0.4108 P=0.453 P=0.436 P=0.030
VERTICAL IN T RR COORDI- SPECIAL-CO4UNICATICNS DEPENDENCE NATION IZATIO4
ROUTINENESS OF 0.1046 0.0783 -0.1408 -0.14814CO14V!nSION P=0.291 P=0.340 P=0.229 P=0.217
INPUT 0.3790 0.3761 J.1280 0.1816STANDARDIZATION P=0.019 2=0.020 P=Q.253 2=0.168
INPUT 0.1024 0.2493 -0.0454 0.2467PREDICTABILITY P=0.295 P=0.092 P=0.406 2=0.094
COMPLZXXTY OF 0.0737 0.0773 0.3049 0.2312CONVE2SION P2=0.349 P=0.342 P-0.051 2=0. 109
AU CIIATION o? 0.1342 0.5680 0.3700 0.2104CosvtErSOm P=0.240 20.001 P=0.022 P-0.132
DICR2TION IF 0.1056 0.1536 -0.0197 -0.0328CONVBRSION P=0.289 P=0.206 2=0.459 P=0.432
OUTPUT QUALTY 0.3427 0.1654 0.2714 0.4077CONTROL P-0.032 P=0.191 P=0.073 2=0.013
PERFORMANCS 0.3038 0.3618 0.2665 0.3140EVALUATION P=0.051 P=0.025 P=0.077 P=0.046
2.80

TABLE 14A
PARTIAL CORRELATIONS O? TECHNOLOGY VS STRUCTURE FOR FINANCECFFICERS
SPAN OF HIERARCHICAL CENTRAL- FORMAL-CONTROL LEVELS IZATION IZATION
ROUTINENESS OF -0.0468 0.0982 -0.1207 0.3919CONVERSION P=0.418 P=0.332 P=0.296 P20.036
INPUT -0.1359 -0.1755 0.2522 0.2917STANDARDIZATION P=0.273 P2=0.217 P=0.129 P=0.094
INPUT 0.1639 0.0255 -0.3827 -0.1701PREDICTABILITY P=0.233 P=0.455 P=0.039 P=0.225
COMPLEXITY OF -0.1638 -0.3325 0.0777 0.3517CONVERSION P=0.233 P=0.065 2=0.366 P=0.054
ktPOIATION OF -0.2174 -0.1993 0.1814 -0. 1481CCNVEBSION P=0.166 P=0.187 P=0.210 P=0.255
DISCRETION OF -0.1990 -0.3186 -0.1828 0.1019CONVERSION P=0.189 P=0.074 P=0.208 P=0.326
OUTPUT QUALITY -0.3307 0.2875 0.0978 0.0323CCNTRCL P=0.066 2=0.097 P=0.332 P=0.443
PERFORMANCE 0.2194 -0.0363 -0.0521 0.5275EVALUATION P=0.163 P=0.436 f=0.409 P=0.006
VERTICAL INTER- COORD- SPECIAL-COMMUNICATIONS DEPENDENCE NATION IZATION
ROUTINENESS OF 0.1496 0.0408 -0.0759 -0.1314CCNVESION P=0.253 P=0.428 P=0.369 P=0.280
INPUT 0.3299 0.2151 0.0945 -0.0760STANDARDIZATION P=0.067 P=0.168 P=0.338 P=0.368
INPUT -0.2357 -0.1657 -0.2737 0.1839PREDICTABILITY P0.144 P20.231 P=0.109 2=0.206
COMPLEXITY OF -0.0093 0.0493 0.2159 0.0768CONVERSION P=0.484 P=0.414 2=0.167 P=0.367
AU'CMATION OF 0.0990 * 0.5592 0.4570 0.1044CONVERSION 2=0.331 P-0.003 P=0.016 P=0.322
DISCRETION OF 0.0794 0.1253 -0.1431 -0.1218CONVERSION P=0.363 P=0.289 P=0.263 P=0.295OUSPT QUALITY 0.1857 -0.0817 0.0440 0.2425CONTROL P=Q.A20 T2=0.359 2=0.423 =0. 138
PERFORMANCE 0.0622 0.2342 0.1564 0.0879EVALUATION P=0.392 P=0.14 7 P2=0.243 P=0.349
' INDICATES THOSE RELATIONSHIPS LISTED IN TAkL3 IV-I ANDDISCUSSED IN PREVIOUS CHAPTERS.
181
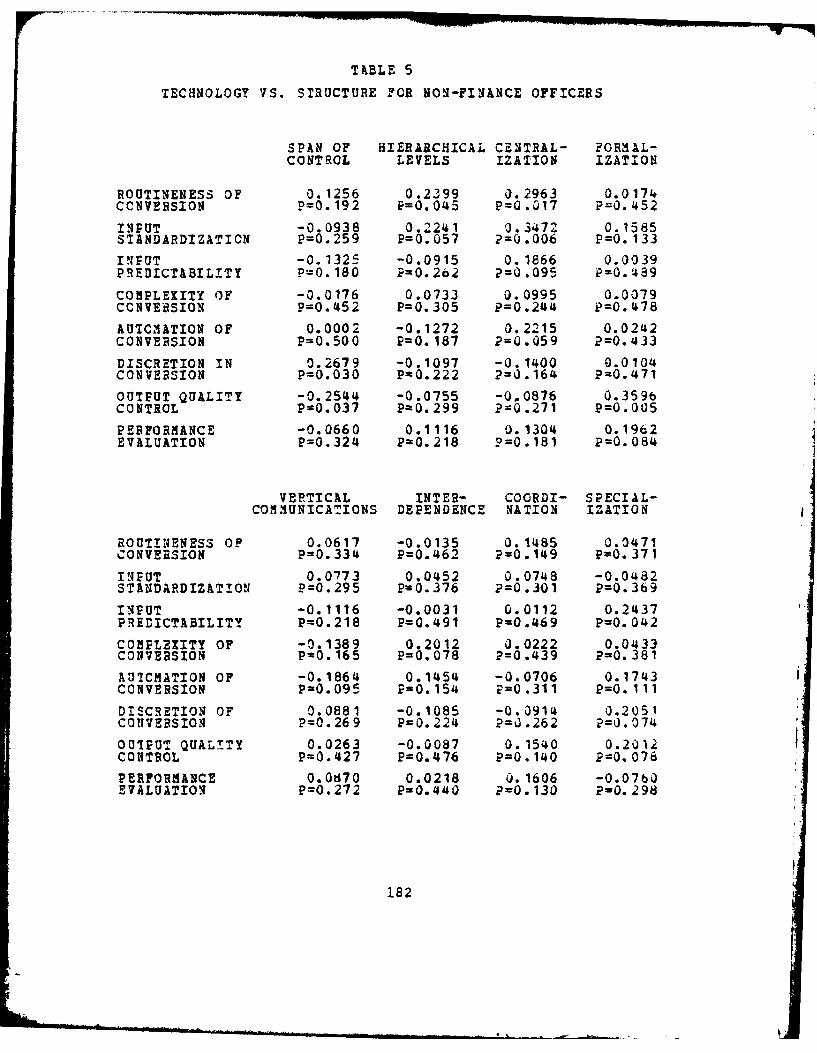
TABLE 5
TECHNOLOGY VS. STRUCTURE FOR NON-FINANCE OFFICERS
SPAN OF HIERARCHICAL CENTRAL- FORM'AL-CONTROL LEVELS IZATION IZATION
ROUTINENESS OF 0.1256 0.2399 0.2963 0.017.CCNVERSION P=0.192 P=0.045 P=0.017 F-0.452
INPUT -0.0938 0.2241 0.3472 0.1585STANDARDIZATION P=0.259 P=0.057 2=0.006 P=0.133
INPUT -0.1325 -0.0915 0.1866 0.0039PREDICTABILITY P=0.180 P=0.2b2 2=0.095 P=0.389
COMPLEXITY OF -0.0176 0.0733 0.0995 0.0079CCNVEASION P=0.452 P=0.305 P=0.244 P=0.478
AU IC ATION OF 0.0002 -0.1272 0.2215 0.0242CONVERSION P=0.500 P=0.187 2=0.059 P=0.433
DISCRETION IN 0.2679 -0.1097 -0.1400 0.0104CONVERSION P=0.030 P=0.222 P=0.164 P=0.471
OUTPUT QUALITY -0.25144 -0.0755 -0.0876 0.3596CONTROL P=0.037 Pa0.299 2=0.271 P=0.005
PERFORMANCE -0.0660 0.1116 0.1304 0.1962EVALUATION 2=0.324 9=0.218 P=0.181 P=0.084
VERTICAL INTER- COORDI- SPECIAL-COM UNICATIONS DEPENDENCE NATION IZATION
ROUTINENESS OF 0.0617 -0.0135 0. 1485 0.0471CONVERSION P=0.334 P=0.462 2=0.149 P=0.371
INPUT 0.0773 0.0452 0.0748 -0.0482STANDARDIZATION P=0.295 P=0.376 P=0.301 P=0.369
INPUT -0.1116 -0.0031 0.0112 0.2437PREDICTABILITY P=0.218 P=0.491 P=0.469 P=0.042
COMPLEXITY OF -0.1389 0.2012 0.0222 0.0433CONVERSION P=0.165 P=0.078 2=0.439 2=0.381
AU7CMATION OF -0.1864 0.1454 -0.0706 0.1743CONVERSION P=0.095 P=0.154 P=0.311 P=0.111
DISCRETION OF 0.0881 -0.1085 -0.0914 0.2051CONVERSION P=0.269 P=0.224 P=0.262 2=0.074
OUTPUT QUALITY 0.0263 -0.0087 0.1540 0.2012CONTROL P=0.427 P=0.476 P=0.140 P=0.076
PERFORMANCE 0.0870 0.0218 0. 1606 -0.0760E7ALUATION P=0.272 P=0.440 2=0.130 P=0.298
182

TABLE 5A
PARTIAL CORRELATIONS OF TECHNOLOGY VS STRUCTOR3
FOR NON-FINANCE OFFICERS
SPAN OF HIERARCHICAL CENTRAL- FORMAL-CONTROL LEVELS IZATION IZATION
ROUTIENESS OF 0.19 02617 2CONVERSION =.INPUT -0.0037 0.2780 0.2132 0.1148STANDARDIZATION P=0.491 P=0.036 P=0.085 P=0.232
I4PUT -0.1698 -0.2553 0.0850 -0.3508PREDICTABILITY P=0. 138 P=0.049 P=0.294 P=0.373
COMPLEXITY OF -0.1314 0.1287 0.1362 0.0413CONVERSION P=0.200 P=0.205 P=0.192 P=0.396
AU7CMATION OF 0.0152 -0.1967 0.2150 -0.0857CONVERSION P=0.461 P=0.103 P=0.083 P=0.292
DISCRETION IN 0.2966 -0.0679 -). 1561 0.0722CONVERSION P=0.027 P=0.333 2=0.159 P=0.323
OUTPUT QUALITY -0.2527 -0.1686 -0.2223 0.26a9CONTROL P=0.051 P=0.140 P=0.076 P=0.041
PERFORMANCE 0.0526 0.0851 0.0525 0.0313EVALUATION P=0.369 P=0.294 P=0.369 2=0.421
VERTICAL INTER- COORD- SPECIAL-COM M UNICATI0NS DEPENDENCE NATION IZATION
ROUTISENESS OF -0.0176 0.0400 0. 1204 0.1238CONVERSION P=0.455 P=0.399 2=0.221 P=0.214
INPUT 0.1581 0.0091 -0.0100 -0.2246STANDARDIZATION P=0.156 E=0.477 1=0.475 P=0.074
INPUT -0.2390 0.0128 -0.0407 * 0.3640PREDICTABILITY P=0.061 P=0.467 P=0.398 2=0.008
COIPLEXITY OF -0.1974 0.2292 0.0566 0.1242CONVEPSION P=0.102 P=0.703 P=0.359 P=0.214
AUIO ,ATION OF -0.1869 0.1460 -0.0703 0.1901CONVERSION P=0.115 P=0.175 P=0.327 P=0.111
DISCRETION OF 0.1790 -0.1897 -0.0792 0.2024CCNV-9SION P=0.125 P=0.112 P=0.307 P=0.096
OUTPUT QUALITY -0.0517 0.0549 0. 1022 0.3089CONTROL P=0.371 P=0.363 2=0.257 P=0.022
PERFORMANCE 0.1834 -0.0737 0.0823 -0.2837EVALUATION P=0.120 P0.319 P=0.300 P=0.033
INDICATES THOSE ELATONSHIPS LISTED IN TABLE IV-1 INDLISCUSSED IN PREVIOUS CHAPTERS.
183
' .. . ... . . . .. ' . .. . m~ m ! * u ' . . . ... . ,I

TABLE 6
TECHNOLOGY VS STRUCTURE FOR USAREUR
SEAN OF HIERARCHICAL CRNIRAL- FORMAL-CONTROL LEVELS IZATION IZATION
ROUTINENESS OF 0.1976 0.2500 0.3750 -0.0287CONVERSION P=0.305 P=0.258 P=0.160 P=0.471
INPUT -0.3162 -0.5000 0.0 0.2294STANDARDIZATICN P=0.204 P=0.085 P=0.500 P=0.276
INPUT -0.3162 -0.2500 0.3750 -0.2294PREDICTABILITY P=0.204 P=0.258 P=0.160 P=0.276
COMPLEXITY OF -0.4581 0.1525 0.5719 -0.0175CONVERSION P-0.107 P=0.34a P=u.054 P=0.482
AUICHATION OF -0.1118 0.0 0.3536 -0.4867CONVERSION P=0.387 P=0.500 P=0.175 p=0.092
DISCRETION IN -0.3508 -0.2774 0.6240 0.1273CONVERSION P=0.177 P=0.235 P=0.036 P=0.372
OUTPUT QUALITY 0.4716 -0.1147 0.5162 0.2895CONTROL P=0.100 P=0.384 P=0.077 P=0.225
PERFORMANCE 0.1356 0.4287 0.5145 -0.1967EVALUATION P=0.364 P=0.125 2=0.078 P=0.306
VERTICAL INTER- COORDI- SPECIAL-COMMUNICATIONS DEPENDENCE NATION IZATION
ROUTINENESS OF 0.2362 -0.3814 -0.2652 -0.4490CONVERSION P=0.270 P=0.156 P=0.245 P=0.113
IN1PUT -0.1890 0.1387 0.3536 0.0898STANDARDIZATION P=0.313 r=0.361 P=O.175 P=0.(409
INPUT -0.6614 0.6934 0.5303 0.0449
PREDICTABILITY P=0.026 p=0.019 P=0.071 P=0.454
COHPLEXITY OF 0.1441 0.1480 0.4852 0.4656CONVERSION P-0.356 P=0.352 P=0.093 P0. 103
AUICMATION OF 0.0 0.2942 0.2500 0.1905CONVERSION ?=0.50C P=0.221 P=0.258 P=0.312
DISCRETION IN -0.1048 0.6538 0. 25 0.4234CCNV!sSION P=0.394 P=0.028 P=0.001 P=0.128
OUTrUT QUALITY 0.3468 0.2704 0.7300 0.6387CONTROL P=O.180 P=0.241 p=0.013 P=0.032
P!RFORMANCE 0.4537 -0.3686 -0.1819 -0.1694EVALUATION D=0.110 P=0.164 ?=0.320 P=0.332
184

TABLE 6A
PIBTIAL COREELATIONS OF TECHNOLOGY VS STRUCTUE FCi $A1ZUR
SEVENTH ORDER PARTIAL CORRELATIONS WERE NOT POSSIBLE DUE
TO THE SMALL SAM PLE SIZE.
185

TABLE 7
TECHNOLOGY VS. STRUCTURE FOR FORSCOM
SPAN OF HIERARCHICAL. CEN~TRAL- FORMAL-CONTROL LEVELS IZATION IZATION
ROUTINENESS CF 0.2017 0.4433 0.0326 0.30000CONVERSION P=0.156 P=0.010 P=0.435 2=0.500
I1PU' -0.0781 0.1781 0.09()b 0.3374STANDARDIZATION P=0.349 E=0.187 P=0.323 P=0.040
IN1PUT 0.0511 0.0989 -0.2284 -0.1055PRELICTABILITY P=0.400 P=0.312 P=0.121 P=0.297
COfiPLEXITY OF 0.2549 -0.1001 0.1116 0.1039CONVERSION P=0.100 P=0.310 P=0.286 2=0.299
AUTCMIATION OF -0.2812 -0.1306 0.3355 0.3189CONVERSION P=0.078 P=0.258 2=0.040 P=0.049
DISCRETION IN 0.0719 -0.1590 -0.4547 0.0000CONVERSION P=0.361 P=0.214 ?=0.008 P=0.500
OUTPUT QUALITY -0.1444 -0.1298 -0.0058 0.4932CONTROL P=0.236 P-0.259 P=0.488 P=0.004
PERFORMIANCE 0.0753 -0.0261 0.2108 0.4486EVALUATION P=0.355 P=0.449 P=0.141 P=0.008
VERTICAL INTER- COORDI- SPECIA-COMM~UNICATICSS DEPENDENCE NATION IZATIOS
ROUTINENESS OF -0.1244 -0.0218 0. 1456 -0.3685CONVERSION P=0.264 P=0.456 P=0.230 P=0.027
IN1PUT 0.3151 0.2461 0.1103 0.1301STANDARDIZATION P=0.051 P=0.103 P=0.288 2=0.255
INPUT 0.0318 -0.2042 -0.2781 0.3414PREDICTABILITY P=0.436 P-0.149 P=0.076 P=0.038
COMPLEXITY OF 0.0376 -0.0659 0.0240 0.0980CONVERSION ?=0.423 P=0.369 P=0.452 P=0.310
AUTCHATION OF 0.0884 0.4916 0.1333 0.21910CCNVERSION P=0.327 P=0.004 P=0.249 P=0.0o6
DISCRETION IN 0.1870 3.1312 -0.0896 0.4616CONVERSION 2-0.170 P=0.253 P=0.325 P=0.307
OUTPUT QUALITY 0. 2749 -0.0352 U.1921 0.2ba-7COSTROL 2'=0.078 P=0.429 2=0.164 P=0.085
PERFORMANCE 0.4258 0.3237 0.3172 0.2 186EVALUATION 2=0.012 P=0.046 P=0.050 P=0.132
186

TABLZ 7A
PARTIAL COaRELATIONS OF TECHNOLOGY VS STRUCTURE FOR FORSCOS
SPAN OF dIERARCHICAL CZT3AL- FORMAL-CONTROL LEVELS IZATION IZATION
ROUTINENESS OF 0.0937 0.3207 0.1118 0.1892CONERSION 2=0.351 P=0.090 2=0.324 2=0.219
INPUT -0.1471 0.1574 -0.3046 0.1002STANDARDIZATION 2=0.274 P=0.260 P=0.102 P=0.342
I'PUT 0.0330 -0.0278 -0.1664 -0.2133PREDICTABILITY P=0.368 P=0.455 P=0.248 P=3.190
COMPLEXITY OF -0.2103 0.0928 -0.1670 -0.0482CCNVEPSION P=0.194 P=0.353 P=0.247 P=O.422AUTOMATION OF -0.2502 -0.0923 0.4414 0.2508CcuVERSION 2=0.151 P=0.353 P=0.029 P=0.150
DISCRETION IN 0.0894 -0.0004 * -0.6792 0.0195CCNVV!SION P=0.358 P=0.1499 2=0.001 P=0.468
OUTPUT QUALITY -0.1546 -0.1229 0.1442 0.3651CONTROL P=0.264 P=0.308 P=0.278 P-0.062
PERFORMANCE 0.2086 -0.0473 0.4733 0.0730EVALUATION P=0.122 P=0.424 P=0.020 P=0.383
VERTICAL INTER- COCRD- SPECIAL-COM UICATICNS DEPENDENCE NiTION IZATION
RO' ZTNENESS OF -0.0605 0.2173 u.3191 -0,3220CCNVERSION P=0.403 2=0.186 P=0.092 P=0.089
INPUT 0.0145 -0.0867 -0.1837 0.0597STANDARDIZATION P=0.476 P=0.362 ?=0.226 P=0.404
I.PUT -0.0652 -0.3180 -0.3001 0.4931PREDICTABILITY P=0.395 2=0.092 2=0.106 P=0.016
COMPLEXITY OF -0.1124 -0.2191 -0.0990 0.0749CONVERSION P=0.323 P=0.184 P=0.343 P=0.380
AUICMATION Of 0.0395 * 0.5729 0.2673 0.1039CONVESSION P=0.436 P=0.005 P=0.134 0=0.336
DISCRETION IN 0.0543 -0.0059 -0.1676 0.5191CCNVERSION 2=0.413 P=0.490 P=,.246 P=0.011
OUTPUT QUALITY 0.2208 0.1359 0.2726 0.0003CONTROL P=0.182 P=0.290 P=0.129 P=0.499
PERFORMANCE 0.3085 0.24b49 0.2773 -0.0802EVALUATION P=0.099 P=0.137 2=0.125 P=0.372
I1DICATES THOSE RELATIONSHIPS LISTED IN !A13.E IV-1 ANIDLISCUSSED IN PREVIOUS ZHAFTERS.
187

TABLE 8
TECH!NOLOGY VS STRUCTURE FOR 3kaCIC
SPAN OF HIERARCHiICAL CENTRAL- FORMAL-CONTROL LEVELS IZATION IZATION
ROUTINENESS OF -0.2534 0.0865 -0.1143 0.3142CONVERSION P=0.092 P=0.328 P=0.278 P=0.048
INPUT 0.0057 -0.1307 -0.1538 0.3761STANDARDIZATION P=0.488 P=0.250 2=0.213 P=0.022
INPUT -0.1376 -0.0681 -0.2412 0.3306PREDICTABILITY P=0.238 PO0.363 P=0.104 P=0.040
COM~PLEXITY OF 0.1638 -0.2593 -0.2592 0.0438CONVERSION P=0.198 E=0.087 P=0.087 P=0.411
AU CMATION OF 0.520r5 -0.2658 -0.0290 0.2324CONVERSION P=0.002 P=0.082 P=0.441 P=0.113
DISCRETION IN 0.034'z -0.0509 -0.1220 0.0521CONVERSION P=0.436 P=0.396 P=0.264 P=0.394OUTPUT QUALITY -0.0410 0.1639 -0.0396 0.519?)
CONTROL P=0.416 2=0.198 P=0.419 2=0.002PERFORMANCE 0.492e -0.0198 -0.2178 0.5596EVAIUATION P=0.003 P=0.459 2=0.128 P=0.001
VERTICAL INTER- COORDI- SPECIAL-COMMUNICATIONS DEPLNDENCE NATION lZATION
FOUTINENESS OF 0.0724 0.2236 -).0500 0.0735CON4VERSION P=0.355 P=0.122 2=0.3 08 P=0.352
TIPUT 0.3496 0.3140 0.1038 0.0554STANDARDIZATION P=0.031 P=0.049 P=0.296 P=0.388
INPUT 0.4169 0.3494 0.2392 -0.0117PREDICTABILITY P=0.012 P=0.032 P=0.106 P=0.476
COMPLEXITY OF 0.0760 0.0540 -0.0581 0.3640CONVERSION 2=0.348 P=0.390 2=0.382 2=0.026
AUTOMATION OF 0.2847 0.1286 -0.0395 0.4786CON4VERSION P=0.067 P=0.253 P=0.419 P=.004
DISCR!TION Il1 0.2138 -0.0522 0.1812 0.1165CONVERSION P=0.075 P=0.394 2=0.173 2=0.274
OITPUT QU&L:TY 0.2900 0.4437 0. 5941 0.3350CONTROL 2=0.,064 F=0.008 P=0.000 P=0.038
?EFORd1ANCE 0.5636 0 2b34 0. 3540 0.2267EVALUATION 2=0.001 2=0. 079 P=0.030 2=0.118
188

TABLE 8A
PARTIAL CORRELATIONS OF T!CHNOLOGY VS STRUCTUiE FOR DARCOA
SPAN OF HIERARCHICAL CE:TRAL- FOR AA"-CONTROL LEVELS IZATION IZA,014
ROUTINENESS OF -0.2169 0.1909 -0.1420 0.2776CONVERSION P=0.166 2=0.197 2=0.264 2=0.105
INPUT 0.0938 -0.1505 u.1014 0.1736STANDARDIZATION P=0.339 P=0.252 P=0.327 P=0.220
IN UT -0.2742 -0.0742 -0.1592 -0.1874PREDICTABILITY P=0.108 P=0.371 P=0.240 P=0.202
COMPLEXITY OF -0.3495 -0.2040 -0.2806 -0.1344CONVERSION P=0.055 P=0.181 P=0.103 P=0.275
LO'IMATION OF * 0.5189 -0.2695 0.1737 -0.0289CONVERSION P=0.007 r-0.113 P=0.220 P=0.449
DISCRETION IN 0.1206 0.0160 0.0,488 -0.0087CCNVERSION 2=0.296 P=0.472 P.-0.415 P=0.485
OU'FUT QUALITY -0.2671 0.1274 0.1199 0.3654CONTROL P=0.115 P=0.286 P=0.298 P=0.047
P-2RORMANCZ * 0.5117 0.2157 -0.1464 0.4518EVALUATION P=0.007 F=0.168 P=0.258 P=0.017
VERTICAL INTER- COORD- S PECI AL-COM UNICATIONS DEPENDENCE NATION IZATION
ROUTINENESS OF -u. 1294 -0.0254 -0.2792 0.0441CCNVERSION P=0.283 P=0.455 2=0.104 P=0.423
INPUT 0.0085 0.0871 -0.0711 0.1699STANDARDIZATION P=0.485 P=0.350 P=0.377 P=0.225
INPUT 0.1693 0.1355 0.1790PREDICTABILITY P=0.226 P=0.274 ?=0.213 P=0.196
COMPLEXITY OF -0.2776 0.0783 -0.2818 0.2179CONVERSION ?=0.105 P=0.365 P=0.102 P=0.165
AUTOMATION OF 0.2005 0.0211 -0.0784 0.3772CONVERSION P=0.185 P=.463 2=0.364 P=0.042
DISCRETION IN 0.2282 -0.2074 0.0910 0.0&51CONVERSION P=0.153 2=0.177 2=0.344 P=i.421
OUT UT QUILITY 0.0573 0.3939 * 0.5557 0.3453CONTROL P=0.400 P=0.035 P=0.004 P=0.058
PIEEORMANCE 0.3705 -0.0205 0.1718 -0.1369EVA UATION P=0.045 P=0.464 P=0.222 P=O.d272
INDICATES THOSE RELATIONSHIPS LISTED IN TABLZ I7-1 ANDEISCUSSED IN PREVIOUS CHAPTERS.
189

TABLE 9
*TECHNOLOGY VS STRUCTURE FOR rRADOC
SPAN CF HIERARCHICAL CENTRAL- FORMAL-CCNTROL LEVELS IZATION IZATION
ROUTINENESS OF 0.1324 0.2370 0.3632 0.1752CONVERSION P=0.294 2=0.164 P=0.063 P=O.237
INPUT -0.2386 0.3143 J.,4619 -0.1193
STANDARDIZATIO- P=0.16'4 E=0.095 P=0.023 P=O.313
INPUT -0.3258 0.1121 0.4,737 0.11485
PRErICTABILITY P=0.087 P=0.324 P=0.020 P=0.272
COEPLEXITY OF 0.1071 -0.2369 0.0 -0.3052CONVERSION P=0.331 P=0.164 P=0.500 P=0.102
AU'ICATION OF 0.1993 0.0706 0.0456 -0.1040CONVERSION P=0.207 P=0.387 P=0.427 P=0.336
DISCRETION IN 0.2290 -0.3110 -0.5034 0.0894
CONVERSION P=0.173 P=0.097 ?=U.014 P=0.35d
O91PUT QUALITY 0.1849 0.3811 '.1805 -0.0402CONTROL P=0.224 P=0.054 P=0.230 2=0.435
PERFORMANCE -0.0929 -0.3037 -0.1117 0.1036EVALUATION P=0.353 P=0.103 P=0.324 P=0.337
VERTICAL INTER- COORDI- SPECIAL-COHUNICATICNS DEPENDENCE NATION IZATION
ROUTINENESS OF -0.2805 0.0163 3.0089 0.2570CONVERSION P=0.122 2=0.474 P=.086 P=0.144
INPUT 0.1767 -0.0175 0.1038 0.2252STANDARDIZATION ?=0.235 2=5.472 P=0.33a P=0. 177
INPT 0.4425 0.0651 -0.0163 0.4514
PREDICTABILITY P=0.029 P=0.396 2=0.474 P=0.026
COiPLEXITt OF -0.2762 0.2468 0.3022 -0.3425
CONVERSION P=0.12b E=0.154 P=0.104 P=0.076
AUIOMATION OF 0.0118 -0.0788 -0.0429 -0.2699CONVERSION P=0.481 P=0.374 ?=0.431 p=0.132
DISCRETION lN -0.0315 -0.2852 -0.1345 -0.3902
CCNVERSION P=0.449 P=0.118 P=0.292 p=0.049
OUTPUT QUALITY 0.0909 -0.0433 0.1721 0.1277
CONTROL P=0.356 P=0.430 ?=0.240 P=0.301
PERFORMANCE -0.2344 0.2885 0.4218 0.1615
EVALUATION P=0.167 2=0.115 ?=0.036 P=0.255
190

TABLZ 9A
PARTIAL CO RELATIONS OF TECHNOLOGY VS STRUCTURE FOR TRADOC
SPAN OF EIIRAaCH:CAL CENTRAL- FORMAL-CONTROL LEVELS IZATION IZATION
ROUTINENESS OF 0.1125 -0.2233 0.4432 -0.0734CCNVERSION P=0.364 P=0.243 P=0.075 P=0,410
INPUT -0.4066 -0.4543 0.4091 -0.3347STANDARDIZATION P=0.095 P=0.069 P=0.093 P=0. 144
INPUT -0.1196 0.3519 0.3090 0.3487PREDICTABILITY P=0.356 2=0.131 P=0.164 P=0.133
COPPLEXITY OF -0.0872 -0.4011 0.4851 -0.4916CONVERSION P=0.394 P=0.098 P=0.055 P=J.052
AUTOMATION OF 0.1819 0.2547 0.2775 0.0317CONV!RSION P=0.286 P=0.212 P=0.191 P=0.461
DISCRETION IN 0.0684 -0.4111 -0.5758 0.3288CONVERSION P=0.416 P=0.092 2=0.025 P=0. 148
OUTPUT QUALITY 0.3493 * 0.7368 -0.0573 0.2383CONTROL P=0.133 P=0.003 P=0.430 P=0.228
PERFORMANCE -0.3757 * -0.7108 -0.2547 0.2563EVALUATION P=0.114 r=0.005 P=0.212 P=0.211
VERTICAL INTER- COC2D- SPECIAL-COMMUNICATIONS DEPENDENCE NATION IZATION
ROUTINENESS OF -0.4202 0.2516 0.1428 -0.1591CONVERSION ?=0.087 P=0.215 P=0.329 ?=0.311
INPUT 0.1064 0.2922 0.2851 -0.2049STANDARDIZATION P=0.371 P=0.178 P=0.185 P=0.261
INPUT -0.5551 -0.1808 -0.0844 0.5424PREDICTABILITY P=0.031 P=0.287 P=0.397 P=0.034
COPLEXITY OF -0.3777 0.4486 0.319 -0.4415CONVERSION P=0.113 P=0.072 P=0.124 P=0.075
AUICATION OF -0.1536 -0.0850 -0.1228 -0.1033CCNVERSION ?=0.317 P=0.396 9=0.352 2=0.375
DISCRETION IN -0.2019 -0.3803 -0. 1683 -0.0875CONVERSION P=0.265 P=0.111 P=0.301 P=0.393
OUTPUT QUALITY 0.1882 -0.4118 -0.2521 0.3591CONTROL ?=0.279 .=0.092 P=0.215 P=0. 126
PE??ORMANCE -0.4466 0.3491 0.3935 0.2952EVALUATION P=0.073 2=0. 133 P=0.103 P=0. 176
* INDICATES :HOSE RE'ATIONSHIPS LISTED IN TABLE IV-1 ANDDISCUSSED IN PREVIOUS CHAPTERS.
i91

AN ORGANIZATIONAL BEHAVIOR VIEW OF DEPARTMENT OF THE ARMY IDA) --ETCtU)DEC 81 M J GRISWOLD, K J1 KEHOE
UNCLASSIFIED N

11111 I .0 2 .0~2
II!'I "II~
11111" 2---- - I-II I 1ART
N.

TABLE 10
TECHNOLOGY VS STRUCTURE FOR NGB
SPIN OF HIERARCHICAL CENTRAL- FORMAL-CONTROL LEVELS IZATION IZATION
ROUTINENESS OF -0. 4745 0.2520 -0.0867 0.1260CONVERSION ?=0.023 P=O. 157 =0.366 P=0.309
INPUT 0.0394 0.1443 0.2649 -0.2887STANDARDIZATION P=0.438 P=0.284 P=0.144 P=0. 123
INPUT -0.1608 -0.1179 0.4867 -0.1179
PRErICTABILITY ?=0.262 9=0.321 P=0.020 P=0.321
COMPLEXITY CF -0.3104 0.2275 -0.0939 -0.0910CONVERSION ?=0.105 P=0.182 P=0.355 P=0.360
A ICSATION OF 0.3304 0.1892 -0.0977 -0.1892CONVERSION P=0.090 P=0.226 P=0.350 P=0.226
DISCRETION IN -0.3914 -0.1478 -0.4918 0.0000CCNVERSION P=0.054 P=0.279 P=0.019 P=0.500
OUTPUT QUALITY -0.2396 0.2582 0.0592 0.0000CONTROL P=O.169 9=0.153 P=0.408 P=0.500
PERFORMANCE -0.3093 -0.1667 -0.3824 0.3333EVALUATION P=0.106 r-0.254 P=0.059 P=0.088
VERTICAL INTEr- COCRDI- SPECIAL-CO UNICATICNS DEPENDENCE NATION IZATION
ROUTINENESS OF -0. 1816 -0.1899 0.0 0.0529CONVERSION P=0.235 P=0.225 P=0.500 P=0.417
INPUT -0.2774 0.0 0.0884 0.1213STANDARDIZATION 9=0.133 E=0.500 r=0.364 P=0.316
INPUT -0.1132 -0.2843 0.0722 -0.0990PREDICTABILITY F=0.327 P=0.126 P=0.388 2=0.348
COMPLEXITY O? 0.3279 0.2607 -0.0279 0.1338CONVERSION P-0.092 PO.148 2=0.456 P=0.298
AUICMATION OF 0.2045 0.1569 0 2Q27 0.3378CCsVERSION P-0.208 P=0.267 P=5.210 2=O. 085
DISCRETION IN 0.1776 -0.1560 0.3169 -0.2795CONVERSION P=0.240 P=0.268 2=0.100 P=0.131
OUTPUT QUALITY 0.1240 0.2335 0.3162 0.1085CONTROL P=0.312 P=0.175 P=0.101 2=0.334
PEFFORMANCE 0.1601 -0.4020 0.1021 0.0000EVALUATION P=0.263 2=0.049 P=0.343 P=0.500
192

TABLE 1OA
.ZARTIAL CORRELATIONS OF TECHNOLOGY VS STRUCTURE FOR NGB
SrAN OF HIERARCHICAL .ENTRAL- FORMAL-CONTROL LEVELS IZATION IZATION
ROOTINENESS OF -0.2710 0.3445 -0.1628 0.4189CCNVERSION 9=0.210 P=0.15C P=0.316 P=0.100
INPUT 0.1935 0.1438 0.2017 -0.3794STANDARDIZATION 2=0.284 P=0.337 P=U.276 P=0.125
I1PUT -0.3529 -0.2614 0.5557 -0.3832PEEDICTABILITY P=0.144 P=0.219 P=0.038 9=0.122
COEPLvXITY OF -0.4402 0.0121 0.2524 -0.2755CONVERSION 9=0.088 9=0.486 P=0.227 9=0.206
AUICHATION OF 0.4032 0.1498 -0.1390 -0.1668CCNVEBSION P=0.109 90.330 9=0.342 P=0.312
DISCRETION IN -0.2873 -0.2991 -0.1811 -0.4069CONVERSION P=0.196 P=0.186 ?=0.297 P=0.107
OUTPUT QUALITY 0.0453 0.1474 -0.0143 -0.0247CONTROL 2=0.447 9=0.333 P=0.483 P=0.'471
PERFORMANCE -0.1720 -0.0855 -0.5349 0.5238EVALUATION P=0.307 P=0.401 P=0.045 P=0.049
VERTICAL INTER- COOED- SPECIAL-COMMUNICATIONS DEPENDENCE NATION IZATION
?OUTINENESS OF -0.0738 -0.2726 -0.3993 0.2989CCNVERSION P=0.415 P=0.209 P=0.112 P=0.186
INPUT -0.3017 0.1439 -0.0088 0.1312STANDARDIZATION P=0.184 P=0.336 2=0.490 9=0.350
INPUT 0.0471 -0.2027 U.2012 -0.2838PREDICTABILITY 9=0.445 9=0.275 P=0.277 P=0. 199
COMPLEXITY OF 0.3177 0.0231 -0.2350 0.0203CONVERSION 9=0.171 P=0.'473 P=0.243 P=0.476
AIJTCMATION OF 0.2259 0.0456 0.2725 0.3424CONVERSION P=0.252 P=0.447 P=0.2n9 P=0.151
DISCRETION IN -0.2627 0.0677 0.5640 -0.4b07CCNVERSION 9=0.218 P=0.422 9=0.035 P=0.077
OUTPUT QUALITY -0.0450 0.4060 0.5204 -0.0637CONTROL P=0.448 P=0.108 E=0.050 P=0.426
PERFORMANCE 0.3293 -0.4530 -0.2616 0.2382EVALUATION 2=0.161 9=0.081 9=0.219 9=0.240
INDICATES THOSE RELATIONSHIPS LISTED IN TABLE IV-1 ANDCISCUSSED IN PREVIOUS CHAPTERS.
193

TABLE 11
TECHNOLOGY VS. STRUCTURE FOR OTHERS
SPAN OF HIERARCHICAL CENTRAL- FORMAL-CCNTROL LEVELS IZATION IZATION
ROUTINENESS OF 0.1195 -0.0099 0.0659 0.0355CCVVERSION P=0.254 P=0.478 P=0.358 P=0.422
INPUT -0.1002 0.1365 0.1663 0.2399STANDRRDIZATICN P=0.290 P=0.224 P=0.178 2=0.089
INPUT -0.0170 0.0479 -0.0876 0.0802PREDICTABILITY P=C.463 P=0.396 P=0.314 P=0.329
COPLEXITY OF 0.0353 -0.0275 0.0871 0.5005CONVERSION P=0. 423 2=0.440 P=0.315 9=0.002
AUCMATION OF -0. 1312 -0.7058 -0.0143 -0.0389CCNVERSION P=0.233 r=0.000 P=U.468 P=0.415
DISCRETION IN 0.2021 -0.0067 0.1462 0.1815CCNVERSION P=0.130 P=0.485 P=0.209 P=0.156
OUTPUT QUALITY -0.2872 -0.0561 -0.2203 0.4077CONTROL P=0.053 P=0.378 P=0.109 2=0.009
PERFORRANCE -0.2294 0.0296 -0. 1371 0.4390EVALUATION P=0.100 P=0.435 P=0.223 ?=0.0Q5
VERTICAL INTER- COORDI- SPECIAL-CONMUUNICATICNS DEPENDENCE NATION IZATION
ROUT ZIENESS OF 0.0961 -0.0983 -0.3!503 0.1627CONVERSION P=0.297 P=0.293 P=0.390 P=0. 183
INPUT 0.1338 -0.0417 0.0538 -0.0168STANDARDIZATION P=0.229 P=0.409 P=0.383 r= ,463
INPUT 0.0159 -0.1890 -0.1138 0.11i"PRErICTABILITY P=0.465 P=0.146 P=0.264& P=0.267
COEPLEXITY OF 0.1270 0.3600 0.2115 0.2562CONVERSION P=0.241 2=0.020 2=0.119 P=0.075
AUICMATION OF -0. 1799 0.0231 0.0553 0.0065CCNVERSION 2=0.158 P=0.449 P=0.380 P=0.486DISCRETION IN -0.0813 0.0725 0.2271 -0.3826CONVERSION P=0.326 F=0.344 P=0.102 2=0.324
OUIPUT QUALITY 0.2479 0.0071 0.0914 0.2266CONTROL P=0.082 P=0.4 4 P=0.307 P=0.102
PERFORNANCE 0.4970 0.0374 0.1876 0, 5EVALUATION P=0.002 P=0.418 P=0.148 ?ac
194

TABLE 11A
PARTIAL COR?9ELATIONS CF TECHNOLOGY 7S S RUCTU3E
FCP OTHERS
SPAN OF HIERARCHICAL CEBTRAL- FORMAL-CONTROL LEVELS IZ&SION IZATION
ROUTINENESS OF 0.1201 -0.1731 0.1815 0.16147CONVERSION P=0.279 2=0.199 P=0.187 P=0.211
INPUT 0.0222 0.1989 0.3529 0.1709STANDARDIZATION P=0.457 P=0.165 P=0.038 ?=0.202
INPUT 0.0379 0.1654 -0.1859 -0.02140PREDICTABILITY 2=0.1427 F=0.210 P=0.182 P=0.1454
COMPLEXITY OF 0.0377 0.2220 0.0215 *0.6423CONVERSION P=0.428 P=0. 138 P=0.458 P=0.000
AUICHATION OF -0.1015 *-0.7437 0.0314 -0.2946CONVERSION P=0.311 P=0.000 P=0.1439 P=0.072
DISCSETION IN 0.2316 -0.0296 0.2086 0.1941CONVERSION P=0.127 P=0.443 2=0.153 P=0.171
OUTPUT QUALITY -0. 1569 0.0217 -0.1919 0.381;9CONTROL P=0.222 P=0.J458 P=0.174 P=0.026
PMPORINCE -0.0837 -0.0825 -0.0315 0.0959EVALUATION P=0.342 P=0.344 P=0.1439 P=0.321
VERTICAL INTER- COOED- SPECIAL-CO~!AUNICATICNS DEPENDENCE NATION IZAflON
ROUTINENESS OF 0.2975 -0.0533 0.0999 0.064~5CONV2RSION P=0.070 r-0.398 P=0.331 P=0.377
INPUT 0.06145 0.0179 J.1043 -0.1503STANDARDIZATION P=0.377 P=0.1465 P=0.306 P=0.232
INPUT -0.0282 -0.1271 -0.1863 0.1320PREDICTABILITY P=0.1446 P=0.268 P-0.181 P-0.260
COMtPLEXITY 0F 0.1309 0.3364 0. 4367 0.3834CONVERSION P=0.262 P=0.0146 ?=0.253 2=0.327
AUTOM!ATION OF -0.1765 -0.0714 J.0302 -0.1258CONVERSION P=0.194 2=0.364 P=4).442 2=0.270
DISCRETION IN -0.2167 0.0773 0.2313 -0.0913CCIVERSION P=0.144 P=0.354 P~=0.128 P=0.329
OUTPUT QUALITY -0.1497 0.1667 0.0785 0.2774CONTROL P=0.233 20o.;08 P=0.352 P=0.095
P!NFORMANC3 0.5156 -0.1210 0.0543 -0.1256EVALUATION ?=0.004 P*0.278 P-0.396 2-0.270
*INDICATZS THOSE RLATICNSHIPS LISTZD IN TABLE IV-1 ANDCI.SCUSSED IN PREVIOUS CHAPTERS.
195

APPENDIX F
ADVICE TO NEW COMPTROLLER/DCSRM
IN FIRST 100 DAYS OF ASSIGNMENT
This checklist was developed by the Deputy Chief of Staff
for Response Management (DCSRM), Headquarters TRADOC, Fort
Monroe, Virginia. The authors decision to present the check-
list was based on two factors. First, the checklist is a
comprehensive document that contains the managerial and techni-
cal information that comptrollers must be familiar with in
carrying out their responsibilities. Second, the checklist
is well organized and straightforward which makes it a useful
tool that comptrollers can utilize to facilitate the crucial
transition period of the "first one-hundred days" in their
new assignment.
A. GENERAL:
1. You are a manager.
2. Assess strong and weak points of your organization.
3. Get to know well those you support and those whosupport you.
4. Pay attention to what your boss says.
5. Don't reorganize.
6. Don't allow your subordinates to pass you the "monkey."(i.e., encourage subordinates to present alternativesolutions, with advantages and disadvantages, fortheir problem.)
7. Establish rapport with the local CPO (learn the CPO)language, procedures, channels.
8. Secure the confidence of your Command Group.
9. Assess the capabilities of your people. Determinethose that can run with the ball and those that needsome supervision.
196

B. MANAGEMENT ANALYSIS:
1. Conduct a detailed analysis of current situation toinclude:
a. Financial management processes in effect.
b. Viability of PSAC and Working PBAC
c. Commander's management indicators and methods.
2. Insure that the commander and staff are knowledgeablein financial management applications; if not, con-duct awareness training.
3. Insure real time review and analysis established, ifnot implement.
4. Insure there is a financial management improvementprogram on-going; if not, implement.
C. BUDGET:
1. Is there a phased obligation plan for the current yearto measure actual execution?
2. is there a listing of your current most urgent fundrequirements, along with a plan if resources don'tmaterialize.
3. Is there a plan for a windfall funds-capability toobligate on short notice, along with a convincingdescription of the benefits to be derived from theiraccomplishment?
4. Clearly assign budget analyst responsibilities; i.e.,program director, high priority projects/actions.
5. Establish effective communication with higher head-quarters insuring that no one is surprised. Periodicvisits pay off.
6. What was the obligation rate for operating appropria-tions last fiscal year? What are the deobligationsthis year? (An indicator of the validity of lastyear's obligations.)
7. How do you control and monitor your reimbursable program?Is the ISSA (Inter Service Support Agreement) functionin your organization? If not, how is the financialimpact of an ISSA coordinated?
8. Do you control the Budget function? Or do the ProgramDirectors? Is your budget office merely a bookbindingoperation for the program directors? Do you controlall reprograming?

D. FINANCE AND ACCOUNTING:
1. RS 3679 Violations:
a. Prohibits authorizations of obligations anddisbursements in excess of funds available.
b. AR 37-20 describes what constitutes a violation.
c. Prevent RS 3679 by establishing clear lines ofauthority/responsibility, directing Major ActivityDirectors to review obligations for validity monthlyand responding to assistance and audit findingswith positive follow-up action.
2. Fund Control and Distribution:
a. Familiarity with various appropriations received.
b. Insuring personnel are knowledgeable in FundAuthorization Document restrictions, financialand administrative limitations and targets.
C. Utilize decentralized fund distribution andcontrol concept.
3. Philosophy of 99.9 Percent Obligation Rate:
a. Serves as an informal bench marker.
b. Not necessarily a viable measure of effectiveand efficient fund utilization.
4. Year-end Accounting Procedures:
a. Preparation and dissemination of LOI and checklist.
b. Effect coordination with Automated ManagementOfficer (AMO)
c. Insure timely reporting.
d. Awareness of New FY Changes.
5. Accounts Receivable:
a. Establish adequate controls in aging of receivables.
b. Establish firm procedures to charge interest forlate payments.
C. Insure no undue delay exists in processing collections.
6. Installation Accountant Duties: Provides policy andguidance for general fund, nonappropriated, stock fundand financial reporting.
7. Validating Unliquidated obligations.
a. Continuous review to free up funds.
b. Timely liquidation.
198
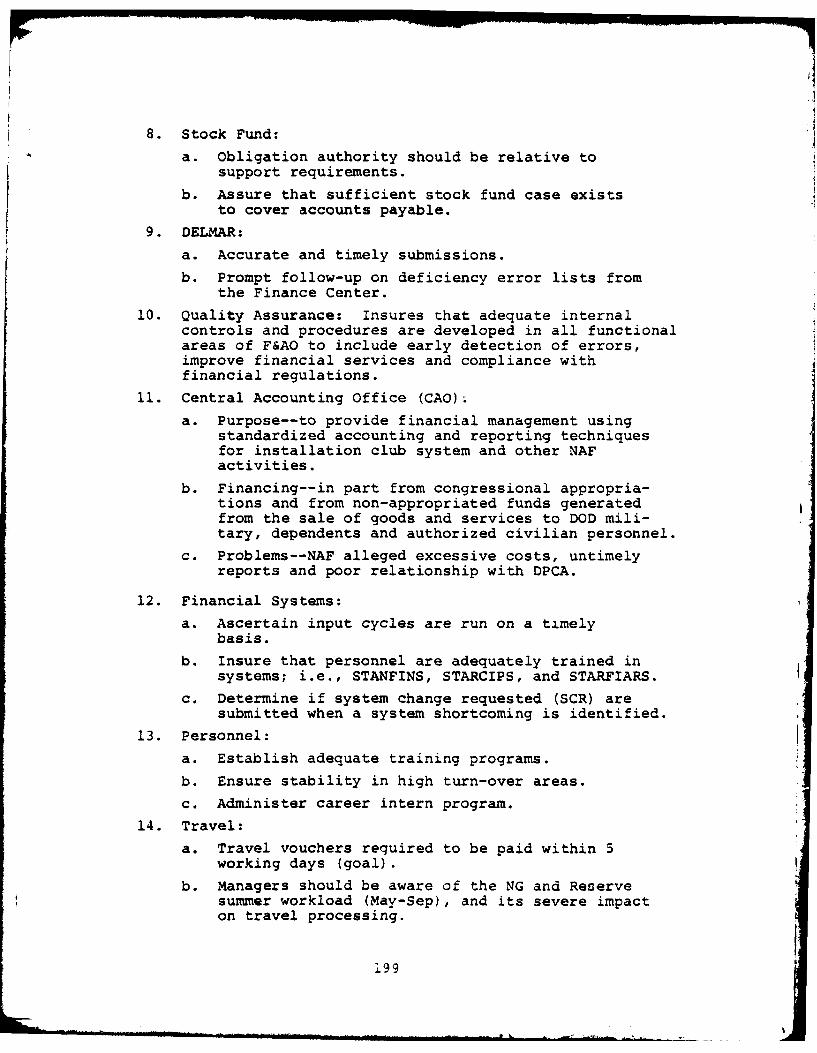
8. Stock Fund:a. Obligation authority should be relative to
support requirements.
b. Assure that sufficient stock fund case existsto cover accounts payable.
9. DELMAR:
a. Accurate and timely submissions.
b. Prompt follow-up on deficiency error lists fromthe Finance Center.
10. Quality Assurance: Insures that adequate internalcontrols and procedures are developed in all functionalareas of F&AO to include early detection of errors,improve financial services and compliance withfinancial regulations.
11. Central Accounting Office (CAO)i
a. Purpose--to provide financial management usingstandardized accounting and reporting techniquesfor installation club system and other NAFactivities.
b. Financing--in part from congressional appropria-tions and from non-appropriated funds generatedfrom the sale of goods and services to DOD mili-tary, dependents and authorized civilian personnel.
c. Problems--NAF alleged excessive costs, untimelyreports and poor relationship with DPCA.
12. Financial Systems:
a. Ascertain input cycles are run on a timelybasis.
b. Insure that personnel are adequately trained insystems; i.e., STANFINS, STARCIPS, and STARFIARS.
c. Determine if system change requested (SCR) aresubmitted when a system shortcoming is identified.
13. Personnel:
a. Establish adequate training programs.
b. Ensure stability in high turn-over areas.
c. Administer career intern program.
14. Travel:
a. Travel vouchers required to be paid within 5working days (goal).
b. Managers should be aware of the NG and Reservesummer workload (May-Sep), and its severe impacton travel processing.
i99

15. Contingency Plans:
A a. Plans should exist to support military and civilianpay should computer support fail.
b. Backup computer support and manual proceduresshould be outlined.
16. Military Pay:
a. Input error rate (to Fi.nance Center) and documentlate submission rates (from servicing units)should be readily available.
b. Status of tax input should be known especially ifassuming duties during Nov-Jan.
17. Civilian Pay: Review retirement processing proceduresto insure records are forwarded to office of PersonnelManagement (OPM) 30 days after retirement as required.
18. Commercial Accounts: Review receiving report sub-missions since late receipts are the major cause oflost discounts.
19. Finance Monthly Operations Report and the CommandSummary and Analysis Report: Provides the Comptrollerand Command with information concerning major areasof interest.
E. INTERNAL REVIEW:
1. Annual Internal Review Program:
a. Is there an annual Internal Review Program?
b. Was it signed by the installation commander?
c. Where are the internal review resources being used?
d. Does the program provide a balanced coverage,that is, are many of the audits requested by thecommander's staff?
e. What is the extent of program backlog and "degreeof risk" this exposes the command to. In otherwords, is what you're not going to do, becauseof lack of audit manda~s-7 also shown in the annualplan? Is some conscious judgment made by thecommand group that what you're not going to doconstitutes an acceptable degree of risk to thecommand?
2. Post Audit Results: Obtain a briefing on the resultsof past audits (briefing should cover last twelvemonths), findings, and recommendations, to includeboth external (GAO, DAS, and AAA) and internal reviewaudit reports. Briefings should also cover currentstatus of corrective actions on the audit reports.
200

3. Internal Review Audit Staff:
a. Is the staff doing work other than audit? If so,why?
b. Does the audit staff feel independent in terms oftheir ability to conduct audits and report un-biased results--especially findings in the comp-troller area?
c. Does the audit staff have a good audit traini~ngpro-jram--is programed training accomplished?
d. Does the grade level of the auditors appear ade-quate--are internal review grade levels comparableto other comptroller divisions' grade levels?
e. Does the internal review chief report directlyto the comptroller?
f. Is there a formal system for controlling staffwork (e.g., audit assignment sheets, etc.)?
4. Audit Follow-up Program: Determine if a program hasbeen established to follow-up on and track theprogress of corrective actions on a timely basis.
5. Report Process:
a. Are written reports prepared for all internal re-view and follow-up reviews?
b. What is the process internal review reports gothrough for issuance, activity response, and finalapproval? Do commanders receive a copy of everyreport?
c. Are written reports issued on a timely basis?
d. Is any special action taken on audit reportswhich reflect repeat findings?
F. RESOURCE AND ECONOMIC ANALYSIS:
1. Determine what capability exists within the office toperform missions and functions in this area. In somecases, authorized organizations do not exist, yet thefunction may have to be performed. If no activityexists, identify individuals that have backgrounds inmathematics, statistics, economics, accounting, oropezations research and assign these functions toone or more individuals within the office.
2. Identify to what extent analytic studies are beingdone, techniques are being used and applied.
3. Eliminate any make-work efforts that are not con-tributing to the overall operation of the Comptrolleror DCSRM organization unless directed by regulations.Even question those when it is felt they are worthless.

4. Develop a plan of attack on how quantitative tech-niques can be integrated into the program and budgetprocess. Specifically consider the use of economicanalysis (comparison of alternatives) when looking atvarious programs or projects for implementation.It is better to justify with analytic proof prior tothe decision rather than after the fact.
5. Make sure you have an up to date file of appropriatecost and economic analysis regulations and handLooks.These are a necessity if you are tasked by higherheadquarters to conduct a study.
G. MORE GENERAL:
1. Get to know your Program Directors and their people.visit them. Assist them in accomplishing their mission.
2. Truly become an honest broker.
3. Take care of your people.4. Enjoy yourself; smile a lot; you've got a great job.
202

APPENDIX G
PROPOSED USAREUR PECULIAR COURSE FOR DAJUNIOR LEVEL COMPTROLLERS
The following is an outline of the subject areas for the
USAREUR peculiar course proposed by the 3rd Infantry Division
Comptroller, LTC Quinn. LTC Quinn's budget officer, Major
Plowden, provided the authors with this outline.
1. Duration--5 days
2. Eligiblity--Personnel assigned to junior comptrollerposition (i.e., budget, manpower management, managementor internal review).
3. Course Content
a. Control of Logistical Expenditure (COLEX) funding systemin Europe.
b. Procurement System
(1) USAREUR peculiar aspects/procedures.
(2) General procedures.
c. Cost Models for tactical units to allocate COLEXfunding.
d. Peculiarities of Special Programs.
(1) P95-Representation funding for partnershipactivities.
(2) P87-Training Funds for community education centers.
e. USAREUR budgeting system/philosophy for preparationof command operating budget estimates.
This course could be taught at the Human Resources and Manage-ment Department of the Seventh Army Combined Arms TrainingCenter at McGraw Kaserne in Munich. The authors envision juniorlevel comptrollers attending this course ASAP after initialassignment. Time and mission perritting, junior level comp-trollers could then attend any of the more specialized resourcemanagement course (e.g., program/budget, manpower management,fund control courses) now being taught at the Seventh ArmyCombined Arms Training Center in Munich. These more specializedcourses are listed in USAREUR PAM 350-205.
203

APPENDIX H
INTERVIEWS
In the course of gathering research for this thesis the
authors conducted separate interviews with Commander Edwin
Fincke, Assistant Professor in Financial Managemeait, Naval
Postgraduate School, Monterey, California, and Colonel William
Graham, Comptroller, 7th infantry Division at Fort Ord, Cali-
fornia. Commander Fincke was also the past Director of the
United States Navy (USN) Practical Comptrollership Course (PCC).
The interview with Commander Fincke was conducted on 2 October,
1981. The interview with Colonel Graham was conducted on 16,
October, 1981. The topic of discussion for the two interviews
was the training of junior level DA comptrollers. What follows
is a point by point account of what the two officers said in
the interviews.
A. Interview with Commander Fincke
1. Junior level comptrollers should receive some formaltraining in civilian personnel relations. The training shouldconsist of three parts. First, a Civilian Personnel officershould familiarize the junior level comptrollers with pertinentcivilian personnel regulations, especially the regulations re-lating to firing and overtime procedures. Second, a CivilianPersonnel Officer should familiarize the junior level comp-trollers with the important aspects of the labor union versusmanagement relationship. A case study could be used to generatesuch a discussion. Commander Fincke mentioned that the Practi-cal Comptrollership Course (PCC) taught at the Naval Post-graduate School used the Naval Communications Station CaseStud as a vehicle for generating class discussions of the
~iiian versus military relationship.
2. Junior level comptrollers should receive some formaltraining in written and oral communication. Specifically,young comptrollers must understand the perspective of the
204

person being addressed (i.e., in most cases, what is importantto the boss).
3. Junior level comptrollers should receive some smallamount of formal instruction in time management. It isimportant that junior level comptrollers learn how to prior-itize tasks in both their professional and personal lives.
4. Junior level comptrollers should receive some formaltraining on the reasons for and benefits of long range planningwithin comptroller organizations. Junior level comptrollersshould learn how to conduct long range planning for theirparticular organization or division thereof. Crisis manage-ment is easy since people like to put out fires. Managersreceive instant results when they resolve a crisis.
5. Junior level comptrollers should make all possibleefforts to achieve harmony with their boss. Use common senseat all times.
6. Junior level comptrollers must recognize that thereis a corporate knowledge (i.e., an institutional memory) withcivilian personnel. Military officers should not reinventthe wheel when they arrive in an organization composed pri-marily of civilians.
7. A good leader/manager in a military environment willbe a good manager in a civilian environment.
B. Interview with Colonel Graham
1. Junior level comptrollers must learn technical aspectsof dealing with civilians (i.e., the rules and regulations).
2. Dealing with civilians important. Comptrollers mustgo see the civilian activity directors on a fairly regularbasis in order to develop a rapport with them.
3. Newly assigned junior level comptrollers should partici-pate in an intern program in order to develop the necessarytechnical skills required of comptrollers. The intern programshould be an 18 month program. Fifteen of these months shouldbe spent in the budget division. This intern program shouldbe part of the career program scheme for a military officerwith the comptroller (i.e., 45) specialty and should be forCaptains.
4. Necessary schooling for junior level DA comptrollersincludes a civilian master's program plus the Military Comp-trollership Course taught at Fort Benjamin Harrison, Indiana.
205

APPENDIX I
TULLY AND BATISTE'S PROPOSED PRACTICALCOMPTROLLERSHIP COURSE (PCC)
DAY SUBJECT PERIOD
General Coverage (5 hours)
1 Course Overview 1
1 Basic Comptrollership Organizations 2-5
Accounting and Finance Systems (30 hours)
1 Functions of USAFAC 6
1 Duties of the Installation 7Accountant
1 Fiscal Code Overview 8
2 Fiscal Code Overview (cont'd) 1
2 Funds Flow 2-5
2 Control of Funds 6-8
3 Control of Funds (cont'd) 1
3 Accounting Management 2-5
3 Accounting Reports (STANFINS) 6-8
4 Accounting Reports (DELMARS) 1-5
4 Revolving Fund Concepts 6-7
4 Accounting Exercise 8
5 Accounting Exercise/Critique 1-3
Management Practices (20 hours)
5 Management Organizational 4-5Functions
5 Manpower Management 6-7
5 Manpower Surveys/Job Time Accting 8
206

DAY SUBJECT PERIOD
6 Manpower Surveys/Schedule X 1-3Reports
6 Internal Review 4
6 Army Audit Agency 5
6 Cost Analysis 6-8
7 Cost Analysis (cont'd) 1-5
7 Management/Economic Analysis 6-7
Budget Formulation and Execution (40 hours)
7 PPBS Overview 8
8 PPBS Overview (cont'd) 1-3
8 Activity Budgeting 4-5
8 Installation Budgeting 6-7
8 Major Command Budgeting 8
9 Major Command Budgeting (cont'd) 1
9 Appropriation Budgeting 2-3
9 Quantitative Budget Analysis 4-8
10 Computer Exercise, Budget 1-8Formulation/Critique
11 Review and Analysis 1-4
11 Budget Execution/Reprogramming 5-8
12 Budget Execution Exercise/ 1-7Critique
12 Course Wrap Up/Critique 8
TOTAL 95
207

APPENDIX J
ADDENDUM TO TULLY AND BATISTE'S PROPOSED PRACTICALCOMPTROLLERSHIP COURSE (PCC)
A. GENERAL
This 24 hour course addendum contains relevant organi-
zational behavior information and material that is designed
to better prepare the new junior level financial manager for
duties within the DA comptrollership field. The course
material listed in the addendum is designed to alleviate some
of the most common organizational behavior deficiencies ex-
hibited by junior level DA comptrollers (refer to Table IV-8).
Specifically, these organizational behavior deficiencies are
staff procedures, oral and written communication and civilian
personnel management/relations. Additionally, in selecting the
material for inclusion in the course addendum, the authors
undertook the following two actions. (1) Conducted a thorough
evaluation of Commander Fincke's and Colonel Graham's comments
(refer to Appendix H). (2) Conducted a thorough evaluation
of the DA comptrollers' recommnendations outlined in Table
IV-9.I
B. PROPOSED PCC ADDENDUM
The proposed PCC addendum contains 24, 1 hour periods
over a period of 3 days. The addendum is a continuation of
Tully and Batiste's PCC outlined in Appendix I and therefore
begins on day 13.
208

DAY COURSE MATERIAL REFERENCE PERIOD
Staff Procedures (4 hours)
13 "Organizational Management Bobulinski, 1981 1-2and Field Comptrollership orBeing in the Trenches."
13 Planning Objectives and Webber, p. 267, 3Goals 1979
13 Controlling Performance Webber, p. 297, 41979
Written Communication* (8 hours)
13 Principle of Shortness DA Effective Writ- 5-6ing Workbook I andFilm #MF12-5317
13 Principle of Simplicity DA Effective Writ- 7-8ing Workbook IIand Film #MF12-5318
14 Principle of Strength DA Effective Writ- 1-2ing Workbook IIIand Film #NIF12-5319
14 Principle of Sincerity DA Effective Writ- 3-4ing Workbook IVand Film #MF12-5320
Civilian Personnel Management/Relations** (4 hours)
14 Civilian Personnel Admin- Applicable DOD and 5-7istzation Procedures DA Regulations
14 Civilian Personnel Rela- N/A 8tions Case Study
Oral Communications*** (4 hours)
15 "Talk, Talk, A Series of Olewine, Fall 1972--l-4Ideas, to Improve Your Pre- Spring 1975sentations: Parts OneThru Eleven"
General (4 hours)
15 "A Management Philosophy" Kjellstrom, 1974 5"A Philosophy for Military Lynn, 1974Comptrollers"
209

DAY COURSE MATERIAL REFERENCE PERIOD
15 "The First One Hundred Gudinas 6Days""Comptrollers Manage Re- Beisser, 1977sources, Why Not Time?"
15 The Pledger Comptrollership Griswold and 7-8Model Kehoe, 1981
TOTAL HOURS FOR THIS PCC ADDENBUM = 24
TOTAL HOURS FOR TULLY AND BATISTE'S PCC + GRISWOLD AND KEHOE'SPCC ADDENDUM = 119
*Number MF12-5317 is a 24 minute film.Number MF12-5318 is a 21 minute film.Number MF12-5319 is a 21 minute film.Number MF12-5320 is a 25 minute film.
ST 17-186-1 (1981) can be used as a supplement to this coursematerial. The information on written communication was ob-tained from Stoller (1981).
**The authors envision a Civilian Personnel Officer teachingthis block of instruction. The instruction would cover suchtopics as performance appraisal, complaints, grievanceprocess, training and development, pay setting proceduresand basic support training (Middaugh, 1981]. The purpose ofa case study is to generate a class discussion (i.e., anexchange of ideas) of the civilian versus military relation-ship within DA comptroller organizations.
***This block of instruction is based on the 11 short articleswritten by Olewine (1972-1975) in the Armed Forces Comptroller.The instructor and students should be able to cover 2-3 ofthese articles per 1 hour period.
210
BIBLIOGRAPHY
Allison, G., "Conceptual Models and the Cuban Missile Crisis,"American Political Science Review, V. LXIII, No. 3,p. 689-718, September, 1979.
Barrow, Jeffrey C., "The Variables of Leadership: A Reviewand Conceptual Framework," Academy of Management Review,Vol. 2, No. 2, p. 231-251, April 1977.
Becker, Tally, All Points Bulletin Division, United StatesArmy Finance and Accounting Center, Fort Benjamin Harrison,Indiana, Telephonic Conversation; 17 November 1981.
Beisser, F.G., "Comptrollers Manage Resources, Why Not Time?,"Armed Forces Comptroller, V. 22, p. 14, August, 1977.
Bobulinski, Robert A., "Organizational Management and FieldComptrollership or Being in the Trenches," Armed ForcesComptroller, V. 26, p. 9, Fall 1981.
Bobulinski, Robert A., Organizational Management and FieldComptrollership, Working paper prepared for the UnitedStates Navy Practical Comptrollership Course, 1979.
Dalton, Gene W., Lawerence, Paul R., and Lorsch, Jay W.,(Ed.), Organizational Structure and Design, Irwin, 1970.
Dessler, G., Organization Theory, Integrating Structure andBehavior, Prentice-Hall, 1980.
Fincke, Edwin, From a class on Public Policy Processes atthe Naval Postgraduate School, March 1981.
Fincke, Edwin, Commander, U.S. Navy, Instructor in FinancialManagement, Naval Postgraduate School, Interview; 2October, 1981.
Fleishman, E.A., "A Leader Behavior Description for Industry,"and "The Leadership Opinion Questionnaire," in R.M.Stogdill and A.E. Coons, Leader Behavior: Its Descriptionand Measurement, p. 103-133, Columbus: Ohio State Univer-sity, Bureau of Business Research, 1957.
Goodhartt, W.R., "The Comptroller: Manager or Servant?,"Armed Forces Comptroller, V. 24, p. 7, May,1979.
Graham, William, Colonel, U.S. Army, Comptroller, 7th InfantryDivision and Fort Ord, California, Interview; 16 October,1981.
211

Hermann, C., International Crises: Insight from BehavioralResearch, The Free Press, 1972.
Hersey, P. and Blanchard, K.H., "Leadership Adaptability Effec-tiveness and Description (Lead), in J.W. Pfeiffer and J.E.Jones, Annual Handbook for Facilitators, La Jolla, Cali-fornia University, 1976.
Hoel, Paul G. and Jessen, Raymond J., Business Statisticsfor Business and Economics, 2nd Ed., John Wiley andSons, 1977.
HQ, Department of the Army, DA PAM 37-4, Army ComptrollerHandbook, April, 1976.
HQ, Department of the Army, DA PAM 600-3, Officer ProfessionalDevelopment, September, 1977.
HQ, Department of the Army, Films ME 12-5317 Thru ME 12-5320,Army Effective Writing Series, 1977.
Kaplan, Bradley J., An Analysis of Leadership Effectivenessin the Naval Surface Community, Master cf science Thesis,Naval Postgraduate School, Monterey , June 1979.
Kjellstrom, John A., "A Management Phi Armed ForcesComptroller, V. 19, p. 8, Fall 1974o
Lynn, W.M., "A Philosophy for Militaky rollers," ArmedForces Comptroller, V. 19, p. 10, Fall 1974.
Middaugh, Charles, Civilian Personnel cfficer, Defense Lan-guage Institute, Presidio of Monterey, California,Telephonic Conversation, 18 November 1981.
Nie, Norman H., and others, Statistical Package for the SocialSciences, 2nd Ed., McGraw-Hill, 1975.
Olewine, Laurence E., "Talk Talk, A Series of Ideas toImprove Your Presentation, Parts One Thru Eleven," ArmedForces Comptroller, V. 17, N. 4, Through V. 20, N.Fall 1972 Through Spring 1975.
Perrow, C., "A Framework for the Comparative Analysis ofOrganizations," American Sociological Review, p. 194-205,1963.
Pledger, James E., An Organizational Analysis Model for NavyField-Level Comptrollership, Master of Science Thesis,Naval Postgraduate School, Montery, California, September1980.
212

Roussseau, Denise M., "Assessment of Technology in Organizations:Closed Versus Open Systems Approaches," Academy ofBusiness Review, V. 4, p. 531-542, 1979.
Rousseau, Denise M., Seminar on "Technology in Organiza-tions," presented at the Naval Postgraduate School,June, 1980.
Senger, J.D., "The Co-Manager Concept," California ManagementReview, V. 13(3), p. 77-83, 1971.
Stoller, John, Chief, Communicative Skills/ProfessionalDevelopment Division, Fort Knox, Kentucky, TelephonicConversation, 16 October 1981.
Tannenbaum, R. and Schmidt, W., "How to Choose a LeadershipPattern," Harvard Business Review, p. 162-180, May-June,1973.
Tha pa, J., Organizations in Action, McGraw-Hill, 1967.
Tully, Robert B. and Batiste, John R., The Development of theJunior Level Army Financial Manager, Master of ScienceThesis, Naval Postgraduate School, Monterey, California,September 1980.
Ullrich, Robert A. and Wieland, George F., Organization Theoryand Design, 2nd Ed., Irwin, 1980.
U.S. Army Armor School, Special Text 17-186-1, CommunicationsTechniques of Effective Writing, January 1981.
U.S. Army Armor School, Army Effective Writing WorkbooksI-IV, August 1977.
U.S. Army Finance and Accounting Center, "Autovon Directoryfor Financial Management Personnel," All Points Bulletin,January 1981.
U.S. Army Institute for Administration, Military Comptroller-ship Course Program of Instruction, November 1979.
U.S. Army Institute of Administration, Special Text 14-191Memoranda 1-19, 1978.
U.S. Army Research Institute for the Behavioral and SocialSciences, Questionnaire Construction Manual, September 1976.
U.S. Army War College, Army Command and Management, Septem-ber 1978.
Webber, Ross A., Management: Basic Elements of ManagingOrganizations, 2nd Ed., Irwin Inc., 1979.
213

Weitzman, R., From a Class on Behavioral Research Methodogyat the Naval Postgraduate School, April, 1981.
21
214

INITIAL DISTRIBUTION LIST
No. Copies
1. Defense Technical Information Center 2Cameron StationAlexandria, Virginia 22314
2. Defense Logistics Studies Information 2Exchange
U.S. Army Logistics Management CenterFort Lee, Virginia 23801
3. Library, Code 0142 2Naval Postgradute SchoolMonterey, California 93940
4. Department Chairman, Code 54 1Department of Administrative SciencesNaval Postgraduate SchoolMonterey, California 93940
5. Deputy Under Secretary of the Army 1For Operations Research
Room 2E261, PentagonWashington, D.C. 20310
6. Director, Army Comptrollership Program IACP, Syracuse UniversitySyracuse, New York 13210
7. HQ Department of the Army 1DCS, ComptrollerWashington, D.C. 20310
8. Commander 1U.S. Army Institute of AdministrationATTN: Military Comptrollership CourseFort Benjamin Harrison, Indiana 46216
9. LCDR Robert Bobulinski, Code 54Bb 4Department of Administrative SciencesNaval Postgraduate SchoolMonterey, California 93940
10. Asst. Professor Ken Euske, Code 54Ee 1Department of Administrative SciencesNaval Postgraduate SchoolMonterey, California 93940
215

11. ASSt. Professor Meryl Louis, Code 54Ld 1Department of Administrative SciencesNaval Postgraduate SchoolMonterey, California 93940
12. COL William Graham 1Comptroller7th Infantry DivisionFort Ord, California 93941
13. LTC Duane Ingalike IACSRMHeadquarters SETAFAPO New York 09168
14. CPT Myron J. Griswold 212 Loantaka WayMadison, New Jersey 07940
15. CPT Kevin J. Kehoe 348 Broad StreetSalamanca, New York 14779
16. CPT Dallas T. Lower 1Headquarters TCATAFort Hood, Texas 76541
17. CPT Robert B. Tully 1232 Harbon CircleMarina, California 93933
18. CPT John Batiste 1Thorndike Pond RoadJaffrey Center, New Hampshire 03454
19. LT. James E. Pledger 19824 Wolcott Ct.Burke, Virginia 22015
20. MAJ Clifford T. Rock, Jr., USA 11450 Paradise Hill RoadClarksville, Tennessee 37040
21. MAJ Steven Funk, USA 1119 E. Alisal StreetSalinas, California 93901
216