AD-A124 188 ALTERNATIVE ANALYSIS TECHNIQUES FOR …ad-a124 188 alternative analysis techniques for...
66
AD-A124 188 ALTERNATIVE ANALYSIS TECHNIQUES FOR NEEDS AND NEEDS 1/ DOCUMENTATION TECHNIQUES(U) BATTELLE COLUMBUS LABS OH J D HILL 28 JUN 80 F33608-BS-C-W4 UNCLASSIFIED F/G 05/5 N EhEEohhohhoiE EhhhohhohhhhhE smhohEohmhhhh EhhhhmhhhhhhhE * fl lfl lfl lf Fl w ED ~~I "L.___
Transcript of AD-A124 188 ALTERNATIVE ANALYSIS TECHNIQUES FOR …ad-a124 188 alternative analysis techniques for...
AD-A124 188 ALTERNATIVE ANALYSIS TECHNIQUES FOR NEEDS AND NEEDS 1/DOCUMENTATION TECHNIQUES(U) BATTELLE COLUMBUS LABS OHJ D HILL 28 JUN 80 F33608-BS-C-W4
UNCLASSIFIED F/G 05/5 N
EhEEohhohhoiEEhhhohhohhhhhEsmhohEohmhhhhEhhhhmhhhhhhhE
* fl lfl lfl lf Fl w ED
~~I "L.___

I..
I.IVA
1.25 I.A 11.
MICROOPY ESOLTIONTESTCHAR
4,jMA SU2A OFSANAD-16-

PHOTOGRAPH THIS SHEET
[:: LEVELL-E El INVENTORY
~4~ z- Task SWbN Qn sc). bfte~rn~.1(ss anymsieB 0-Al ees , j Naedr- 7 vcwYe!htfwa, Tee igueDOCUMENT IDENTIFICATION
".DISTRIBUTION STATEMENT
ACCESSION FORNTIS GRAD
cDTC TAB
JURVICAMh 0 E ECTE. JUSTIFICATION f
Byev-tw ot i FEB 8 1983
DATRDICTRE EUDIONN D,", 'AVAILABILITY CODES
L DIfr AVAIL AND/OR SPECIAL DATE ACCESSIONED
GeV*
": DISRIBUTION STAMP
83 02 07 106
PHOTOGRAPH THIS SHEET AND RETURN TO DTIC-DDA-2
DTIC FORM 70A DOCUMENT PROCESSING SHEET
::£ . . .. . , ... -. .- .. . ... ..-- - --. , - .. ,- ... . . . .. -.O..C-T 7. .- .- . . . .. . - - ... ., .

.. 0BaaeueColumbus Laboratories505 King AvenueColumbu., Ohio 43201lelephone t614) 424-6424
Tlelx 24-5454
June 20, 1980
,01'4 Mr. Coye Bridges, XRBF
DCS/Plans and ProgramsAir Force Logistics Command
Wright-Patterson AFB, OH 45433
Dear Coye:
Reference Contract No. F33600-80-C-0414
- Enclosed are two deliverables due seven weeks after contract award. The-, related task and title of each deliverable are as follows:
Task Deliverable
Task 5(b)N Alternative Analysis Tecbniques for .ieeds
Task 5(c)N Alternative Needs Documentation Techniques
You will note that both deliverables have been combined into one documentbecause of their tight coupling.
-, Also enclosed are:
1. A list of "High Level Guidance Items" that have beenextracted from various USAF documents and which canbe used to augment the scenarios.
2. "Descriptors that will be Important Drivers inthe Proposed Scenarios" (addendum to Task 4(b)).
3. "Stimulating Topics for the Back Pocket" whichlist some topics (to be augmented by Maj. A. Dunn)that may be brought up as appropriate duringplanning sessions.
,%
Approwvd for pulliz r.le(9bDi'txiL, ut.r Unlimited I
4 . V .

-7-, .. .: .T, , -. . " . ' . - - -" -- . ." -"." - . . , " .-. -. * .. .. :-' .:.' . .- . " " ; 5:5 5 i
Mr. Coye Bridges 2 June 20, 1980
4. Revised Task 5 (a)N deliverable that now includes
the LMS concept description.
' Please let me know if we need to get together to discuss the deliverables.
Sincerely,
J. Douglas Hill- Research Leader
Defense Systems & Technology Section
JDH: eah
Enc.
.4
!.
-I
".
,,,. w,4-. ,,... - . .. -.: ,,• . ., -..- :, - .• ." " " ' - ' _ - .:'_ . - -..: - " "- . ".,.." .. - .

TASK 5(b)N AND 5(c)N: ALTERNATIVE ANALYSIS
TECHNIQUES FOR NEEDS AND NEEDS DOCUMENTATION TECHNIQUES
It is impractical to separate the analysis techniques and the
documentation methods to be uaed in analyzing the session content. Most
analysis techniques have an inherent recording method which is most suitable
for maintaining an audit trail. Therefore, we will combine the reporting of
these items in the same paper.
Policy Planning Session
* Analysis and Documentation of
;*-.. Scenarios
The Theme Scenarios being developed basically describe the environment
within which the War Scenarios may occur. It is likely that these themes will
influence the probability of the occurrence of a given war scenario, e.g.
a condition of high availability of alternative fuels will decrease the
probability of a conflict over Mid-East oil resources. At this stagc in
the development of the planning process, we will not attempt to quantify these
relationships, but merely acknowledge their existence. Further refinements of
* -the scenarios may be based on the quantification of probabilities.
At this p'int, however, the primary concern is to identify the
relationships betwein scenario drivers/descriptors and their impact on the
Logistics Management System.
To obtain usable information from this process it will be necessary
1. To describe the initial condition of the scenarios in
enough detail that impacts can be consistently identified
|' 2. To structure the ability to change the scenarios as they
become further defined through the planning process.
The changes may include:
o Additions of driver/description;
o Changes in arrows or signs or;
o Elimination of descriptors determined to be non-relevant.
In order to establish the initial description and an audit trail
for change, a coding system is being developed. The tentative selection is an
'4
. .

2
alpha-numeric value assigned to each descriptor in the initial scenarios. This
identifier would refer to the theme scenarios involved, the war scenarios
being considered, the class of descriptor, and numeric identifier for theL individual descriptors.
There are three theme scenarios, which also will have titles, but
will be referred to as A, B, or C. The war scenarios will be 1-4. There are
five classes of descriptors.
Geo-political and International Economics (IE)
Military (MI)
US Economy (UE)
Social (SO)
Demographic (DE)
The descriptors will he numbered consecutively within their respective
groups, e.g. IEl, IE15; UEl, UE18. Sample codes are shown in Figure 1.
AIMI4
A - Theme Scenario A
1 - 1st War Scenario
MI - Military area
4 - Consecutive number
FIGURE 1. SAMPLE CODE
As the scenarios evolve throughout the planning process, it is very
*likely that some simplification will occur. At present, the relationships
between the drivers, (exogenous variables being used to drive the scenarios)
*and the internal variables or descriptors are being developed so that
impacts on the logistics functions can be defined and logistics management
* information needs determined. In the process of deriving the impacts' logic
trail the key drivers should be identified, and associated directly with the
impacts. The techniques, to be used with the scenarios, include:
1. The cognitive map, which displays the relationships between
scenario elements, by means of an arrow to establish the direction, a plus sign
to signify a direct relationship, and a minus sign to signify an inverse
relationship. The net effect of several events reacting on another descriptor
is indicated by the use of a delta (A) with an arrow indicating a net increase
(At), a net decrease (A+), or relative stability (A-).
- ****'. 5 p 5

3
arrow indicating a net increase (A+), a net decrease (A+), or relative
stability (A-).
These symbols also will be used in a tabular form to demonstrate the
common areas of the various scenarios, and conversely, the areas of change.
2. The coding system, which consists of the alpha-numeric
identifier previously described. A log will be maintained for each descriptor
which will include: a title, a brief description of what it is intended to
include, the code assigned, the direct links established to other descriptors,
along with the direction and sign, and a record of changes.
This will all be done manually in the initial stages of the project.
As the planning process evolves, it may prove necessary to automate the
maintenance of these files to allow the tracing of paths through the scenarios
* by merely identifyiag the driver. This would involve a networking technique.
This is not recommended at this time due to the evolutionary nature of the
planning effort. We expect, as we mentioned earlier, that the scenarios may
be simplified, and manual maintenance may remain adequate.
3. A crcss impact analysis may be used if the scenarios evolves to
the simplified levei. It is not recommended at this time.
Analysis and Documeatation of the Impactof the Scenarios on AFLC Process/Perspectives
Once the scenarios have been adequately described, the next step
* will be the identification of their impacts on the processes and perspectives.
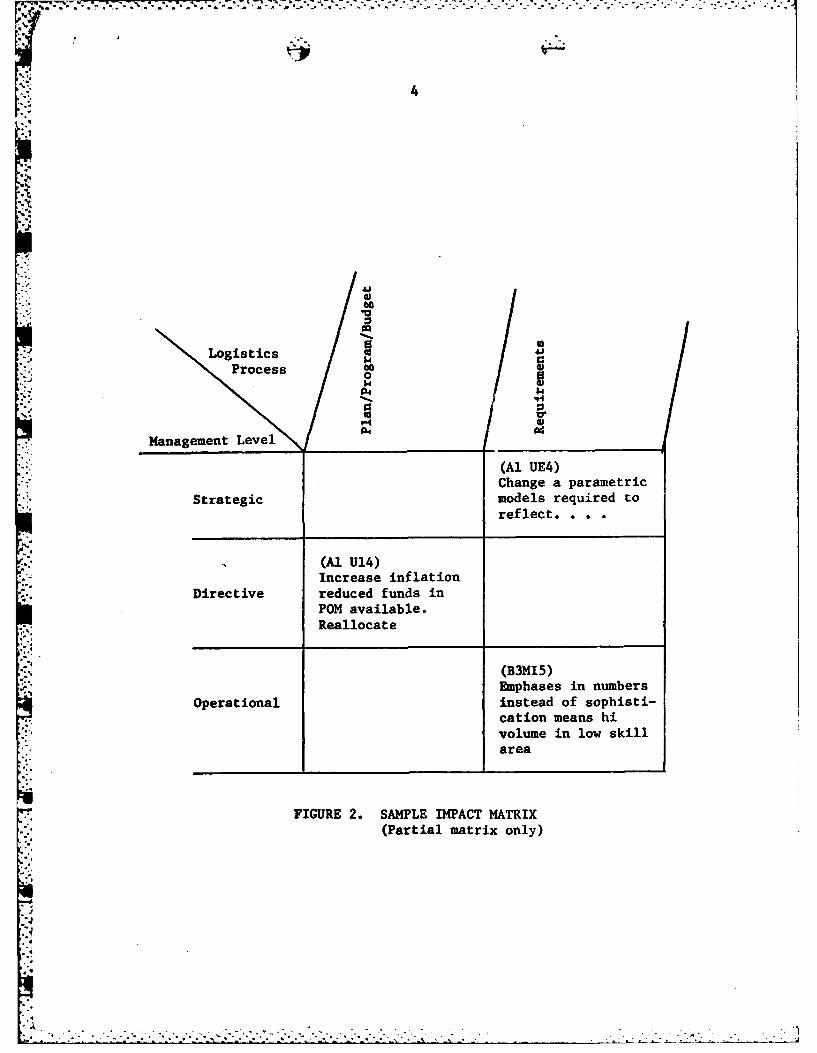
* In order to record these impacts, a matrix will be developed with one axis
being tiie level of management and the second being the processes and perspectives.
A partial sample record is displayed in Figure 2.
During the sessions, the recorder selected will note the impacts
* defined by putting a few key words in the appropriate section of the matrix
which will be displayed on easels. This display will serve as a guide in the
-' session, and be used to present the findings of the smaller groups to the complete
group. In each of the smaller groups, an observer will be present to note the
descriptor code and to make relevant notes concerning the derivation of these
.
- 44
r4
LogistipaamersStatgi moesrqurdt
Pefleess . .
(AoU4Inraeinlto
Direcive educd fuds i
Strategicatmodel requsido
relct
Increase inflationly

5
Impacts, e.g. background discussion, related areas, etc. The observer also
will be responsible for identifying the specific descriptor if the recorder
fails to do so. After each sesson, the observer's notes will be edited and typed
and added to a log of proceedings. Key elements will be extracted and summarized,
to be presented to the participants for approval. This summarized edition of the
proceedings for each session will serve as the input for the succeeding sessions.
The recorded information will be sorted using the identifier
* code, so that impacts will be aligned by: War scenarios, theme scenario, and
* process/perspective.
This cross tabulation will allow the development of a synopsis
of the impact of a given scenario, and the information needs required by a
given process.
Needs Planning Session
Analysis and Documentation of Scenarios
The same technique described in the Policy Planning Section willbe continued in thez Needs Planning Session. One additional piece of information
will be tracked, however, and that will be any changes suggested in the
second session.
New impacts or suggested changes identified will be listed
separately, and reviewed for inclusion in the formal documentation.
* Analysis and Documentation of theScenarios on AFLC Processes/Perspectives
The approved results of the first session will be presented to
the Needs session. The first objective of this review is to elicit agreement
that the impacts are adequately and correctly identified. The second objective
is to realign the impacts that are associated with the particular topics and
associated LAG(s) under discussion. Since the LAG(s) can cross both management
levels and processes, it will be necessary to identify the impacts related to the
LAG, and identify crossovers with other LAGs. In some cases the further division
into logic clusters will be necessary in order to arrive at viable units for
further analysis.

6
In order to document and control the planning process, it will be necessary
to designate an orderly flow of information from one planning segment to the
next. This requires the careful identification of the inputs required for
- - each segment, the expected transformations, the desired outputs, and the
controls and mechanisms for effecting this transformation.
Successful planning also requires effective communications with
all involved in the planning process. The IDEF model is a recommended
candidate because it can serve three functions. It serves as:
o A graphic portrayal of the functions (performed
by man or machines) and things (objects or
information) which constitute the logistics system.
o A hierarchical structure with major functions at
the top and successive levels revealing well-founded
details.
o A communication device to allow review of the
developing model and a record of all decisions
in writing. Consistent portrayal and terminology
is used throughout to facilitate precise transfer
of information.
IDEF is a system requirements definition technique which provides
training for Architecture Builders, Information Model Builders, and User
Model Builders. It was developed by SofTech, Inc. for the USAF programm for
Integrated Computer-Aided Manufacturing (ICAM). This version is based on
an underlying discipline, called "structured analysis". (Ross, "Structured
Analysis (SA): A Language for Communicating Ideas", IEEE Transactions
on Software Engineering, 3, 1, January 77).
Structured analysis is a graphic language for describing any
system. By system, we mean both what something is and what it does. A
structured analysis model simply describes that tangible or functional reality.
Man-made systems are composed of interacting or interdependent
. parts that work together to perform a useful function. The parts may be
- anything, including machinery (hardware), information, objects, processes,
software, or people. These systems are, universally, composed of things (parts)
• -

- -- - - - - - - - - -
7
that perform activities that act on other things (objects or information).
Structured analysis can be used to describe activities performed by systems
or parts of systems.
Structured analysis represents a system by way of a model composed
of diagrams. Diagrams are composed simply of boxes and arrows. To describe
functions, activity diagrams are used. In these diagrams, the boxes represent
activities and arrows represent things processed by the system. By "things",
we mean anything - any kind of data that can be named with a noun,.from
tangible objects to abstract information.
IDEF starts by representing the whole system as a single modular
unit -- a box with arrow interfaces. Since the single box represents the
system as a whole, the descriptive name written In the box must be general,
rather abstract, and lacking in detail. The same is true of the interface
arrows, since they also represent the complete set of external interfaces
to the system as a whole.
The box that represents the system as a single module is then detailed
on another diagram with several boxes connected by interface arrows. These
interconnections make the boxes represent major submodules of the single
parent module. The decomposition reveals a complete set of submodules, each
represented as a box whose boundaries are defined by the interface arrows.
Each of these submodule boxes may be similarly decomposed to expose even more
detail.
IDEF provides rules covering how to gradually introduce further
detail during decomposition. A module is always divided into no fewer than
three, but no more than six submodules. The upper limit of six forces the use
of a hierarchy to describe complex subjects. The lower limit of three
was chosen to insure that enough detail is introduced to make the decomposition
*: of interest.
Each diagram in a model is shown in precise relationship to other
*diagrams by means of interconnecting arrows. When a module is decomposed into
submodules, the interfaces between the submodules are shown as arrows.
The name of each submodule box plus its labeled interfaces define a bounded
context for the detailing of that submodule.
.- .. •. .• -.. .

8
In all cases, every submodule is restricted to contain only those
elements that lie within the scope of its parent module. Further, the
module cannot omit any elements. Thus, as already indicated, the parent
-'- box and its interfaces provide a context. Nothing may be added or
- removed from this precise boundary.
Figure 3 demonstrates the relationship between the components.
* AN ORGANIZED SEOUENCEOF "BLUEPRINT" DRAWINGS
* STRUCTURE OF FUNCTIONSAND SUBFUNCTIONS
* INTERACTION.- BETWEEN FUNCTIONS SYST
* EVENT AND INFORMATION FLOW
• USER INTERACTIONS
AU0
a2
FIGURE 3. RELATIONSHIP BETWEENCOMPONENTS USING IDEF

9
Further information on the IDEF system is contained in Appendix A.
An alternative documentation technique that provides a hierarchical
graphic structure for portraying logic trails, discussion trails and for
." plugging them into logical relationships is the relevance tree.
Relevance Tree
The relevance tree is normally structured in levels. Each level
may represent a certain class of vertex entries. Connection from one level
to another is based upon the relevance of one class of entries to another
class of entries. The relevance tree is usually a hybrid tree.
Generally,. the broader classes are presented at the top of a
relevance tree, with the highly specific classes being represented at the
bottom of a tree. For example, the highest level may represent a very broad
'A problem to be solved. The next highest level may represent constituents
of the environment. Down at the very bottom of the tree might be specific
* technological developments that could contribute to the solution of the broad
problem, such as a means of removing sulphur from coal tn assist in alleviating
Sair pollution.
An example of a relevance tree appears in Figure 4. Its hybrid
character is evident from the nature of the items.
a n MUN*S AND NATvR OF OIg?(S Ba
SIP 0u..99-M .- pa 0..-
0 W 0 n. A.- .0b~ L kw.eC
[ i I....i .
-°d 4-. f I • • S
9M . W ^ P. e
&WO Na)f IubWe4 0..... 9..99e-
FIGURE 4. NASA'S APOLLO PAYLOAD EVALUATIONRELEVANCE TREE
..*

10
A more detailed discussion of relevance trees is contained in a
paper in Appendix B.
The first diagrams, whether IDEF structures or Relevance trees, will
be produced as a result of the input from the Needs Planning Sessions. Draft
versions will be produced and distributed to selected planning participants
for review and comment. All comments must be in writing and all response to
comments must be written in the same copy. Suggestions are accepted or
rejected in writing along with the reasoning used.
As mentioned earlier in this report, the IDEF method has been developed
for Air Force use. Courses in the method have been offered regularly through
the ICAM office. Courses to individuals requesting them have been offered
at a cost of approximately $1000/student plus instructors expenses for a
four-day workshop with a minimum of six students/class. Students attending
these through ICAM pay only for expenses.
It would be necessary to train authors and readers in each LAG area
as it was being analyzed. Transfer of documents for reader comments can be
done through the use of the Cybernet system using a program called AUTO-IDEF.
Use of this capability would not be a requirement.
The model outlined in this report is tie IDEF-0 model, which
identifies functions. The IDEF-l model is the iihformation model, which
identifies the data base lay-out required for each area analyzed. The IDEF-2
model is the dynamics model which treats with time-oriented behaviors and
allows the construction of simulations.
All three models currently are available, ahtough their development
is continuing.
Relationship Between Needs Identifiedand LMS Principles
The analysis of the Needs identified in the planning sessions must
be tempered by the application of the LMS principles. These are being derived
from:
o Air Force Doctrine
o Logistics Principles
o Management Science Principles

o Information Management Principles
o Government Policy/Law.
These coustraints are being used to identify areas, and principles
relating to aach. As the Needp Identification progresses, it will be necessary
to use these as a guiding mechanism to insure good practice in defining
systems to be developed to meet these needs. These principles will help identify
the scope of information needed to adequately define the needs. Therefore,
a checklist of information to adequately define the Need will be generated,
based on the principles identified.
For example:
Area: Privacy and Security Access/Control
Principle: Systems must-be compatible with, and should support
any necessary security requirements.
Check Litt: Security Requirements identified.
Planning Participant Reaction
Obtaining participant reaction to the format of the planning sessions
and planning techni-jues used is an essential part of the analysis procedure.
Some of this reaction will be obtained through casual comment and conversations
and these will be documented as relevant. Another measure of satisfaction
will be the willingaess of the planners to contribute to future planning
sessions either in person or by sending their best staff members. We will
compare "who s requested" with "who shows up".
These indirect measures will be complemented by two questionnaires
designed to assess participant satisfaction with the planning sessions. One
will be administered at the beginning of the first morning session and the
second will be administered on the last afternoon. They are designed to
measure both general satisfaction and satisfaction with the group planning
techniques. Copies of the questionnaires are contained in Appendix C.
If

APPENDIX A
IDEF DESCRIPTIVE MATERIAL

V A-i
STANDARD DIAGRAM FORM
The entire discipline of structured analysis depends on a single
form - the Diagram Form - and that form has minimum structure and
constraints. Other than name and date information that would be
expected for any form, the sheet supports only the functions important
to the discipline. They are:
i Establishment of context;
0 Cross-referencing between pieces of paper;
0 Notes about the content of each sheet.
The diagram form is a single standard size for ease of filing and copy-
ing. The form is divided into three major sections:
- Working Information (top)
a Message Field (center)
0 Identification Fields (bottom)
The form is designed so that, when a final, "approved for publication"
version is completed, the working information at the top of the form::. imay be cut off. The diagram form should be used for everything written,
from rough notes through sketches to finished diagrams and texts.
K(Note: when using a diagram form, always fill in the "Number" and
"Author/Date/Project" fields first, before actually using the form.
These fields are explained in this section.)
.-. 4
7'-500-11 4-1
- -

A-2
4. Workin InfoU-Ation
The "Author/Date/Project" Field
These tell who originally created the diagram, the date that it was
first drawn, and the project title under which it was created. The "date"
field may contain additional dates, written below the original date. These
dates represent revisions t9 the original sheet. If a sheet is re-released
without any change, then no revision date is added.
The "Notes" Field
This provides a check-off of notes written on the diagram sheet.
It ensures that the next higher note number is assigned without scanning
the sheet to find all previous notes. The notes themselves are called
," notes," and are of the form:
"® message"
where the "n" is the note number, assigned sequentially on each diagram
sheet by the person making the note. The "message" portion is any com-
ment made by a reader (or aut. . ;- about the diagram. Information whichis part of the basic diagram itself is not an Q note, and does not contain
the "o " prefix.
. The "Status" Field
The status classifications provide a coarse ranking of approval.
They are:
WORKING The diagram is a major change, regard-less of the previous status. New diagramsare, of course, working copy.
DRAFT The diagram is a minor change from the pre-vious diagram, and has reached some agreed-upon level of acceptance by a set of readers.Draft diagrams are those proposed by a taskleader, but not yet accepted by a review meet-ing of the technical committee or coalition.
R RECOMMENDED Both this diagram and its supporting texthave been reviewed and approved by a meet-ing of the technical committee or coalition,and this diagram is not expected to change.
PUBLICATION This page may be forwarded as is for final
printing and publication.
The "Reader/Date" area is for a commenter to initial and date the form.
7500-11 4-2
- . .,: ,, .' . - . .... .- ,. ,. . , .. . .. .

A-3
The "Contcxt'ticld*
This indicates explicitly the context in which the diagram form is
to be interpreted, even if it is used for non-diagram purposes. The con-
text sketch always is at the next higher level from the current diagram.
The sketch normally shows only as much as is needed to make the context
clear. The current diagrant is shown as a box in the sketch, to highlight
it; all other parts of the higher level are drawn as ovals. Arrows are
omitted. The C-number of the higher level diagram is written at the top
of the Context field, and the node number in the lower left.
tO C:) ONTEXT: DT2 81Node number | c i Author C-numberof context 0 of context
The Context fie'd of a context diagram (node rumber - 0) is "NONE." The
Context field of a top level diagram (node nurr.ber 0) is "TOP."
The "Used At" Field*
This is a list of diagrams, other than the immediate context, which
use this sheet to show details. These may include the work of several authors.
4. 2 The "Message" Field
The Message field contains the primu.ry message to be conveyed.
The field is normally used for diagramming. However, the field can be
used for any purpose. This freedom is essential, for otherwise the
author would have no place to keep definitions, checklists, notes,
sketches, etc. The author should use no paper other than diagram
forms. Conventions allow complete reconstruction of his thought
process in doing the work.
* "node number" and "C-number" are discussed later in this section.
7500-11 4-3

A-4
4.3 The "Node" "Title," Fields
" When the diagram form is actually used to draw structured dia-
grams, referencing is based on the hierarchy of diagrams. The hier -
archy is expressed by a node number for each diagram. By convention,
the components of a diagram are shown as numbered boxes. Each box is
detailed in a diagram at the next lower level, and so forth. If one were
to spread out all of the diagrams, a structure like that shown below
would appear. The place of each diagram is indicated by a node number,
derived from the numbering of the boxes. For example, A21 is the
diagram which details box 1 on the A2 diagram. Similarly, A2 details
box 2 on the AO diagram, which is the top diagram. This hierarchy may
be shown in an index of diagram names and their node numbers called a
diagram tree, if all diagrams are shown, or a node tree, if all box
names are shown. The figure shown below is a typical tree. Each box
in this tree represents a whole diagram.
A table of contents may also be formed by a node index. This is
simply an indented list of the node numbers and titles of all boxes. Of
course, the graphic language of diagrams provides much more i mor-ation
than either of these outlines alone.
The Title field may contain the name of a diagram and qualifying
descriptors of any kind. If the Message field contains a diagram, then
the contents of the Title field precisely match the name written in the
corresponding high-level box.
vsO at#- ? all al
7500-l1 4-4

A-5
NODE INDEX AND. CORRESPONDING DIAGRAMS.
Node Index Corsodn tutr
A -0 Gather Information (Context)
AO Gather Information
Al1 Coordi-ni:te and Monitor
AZ Prepare. for In-tcrview
A21 Confirm Data
A2Z Det:.rrine Eligibility
AZ3 Prepare Notifications
A24 Notify Unit and Member
A3 Inte rview
A31 Confirm Preparedness.....
A32 Instruict Memnber re Option~s A &V
A33 *Gather Member Chokces and Data
A34 Prepare Forms and Instructions
A35 Instruct Member
A4 Prepare Items
A5 Perform Fiwil Actions
7500-11 4-5

A -6
4.4 The "Numba- Field
This field contains all numbers by which this sheet may be
referenced. The most basic is the "C-number" or "creation number."
The C-number is composed of two or three letters of the author"s
initials, followed by a nurhber sequentially assigned by the author. This
C-number is placed in the lower left corncr of the Number field, and is
the primary means of reference to a sheet. When a model is published,
the C-number may be replaced by a standard sequential page number
(e. g., "pg 27").
If the diagram replaces a previous version of the same diagram,
a- second C-number is written in parentheses following the first C-number,
to identify the replaced sheet. For example, if the Number Field reads
"FI158 (F124)," this says that F158 replaces the former F124 version of
* -the diagram. This is used to show the complete revision history.
A reader kit page number may also be written by the librarian
at the right hard side of the Number Field. This is composed of the
document number followed by a letter identifring the sheet within thc
document, in alphabetical order.
The "node number, ", when presented, is found in the upper right
hand corner of the Number field and is always given if the sheet contains
=* a diagram or rr.aterial related to a diagram (text, FEO, etc.). (Note
that the node nimber appears twice: here in the NUMBER field and also
'in the NODE field, where it may also include a model name.)
Node numberof this sheet
lNUMBER:Author C-number of To be used bythis sheet (and its history) Project Librarian
In authoring an original sheet, only write as follows:
NUMBER. 7) 31
7500-11 4-6

A-7
* Thc C-Nun- Loa
The C-Number Log aids an author in assigning chronological
sheet numbers. The Log prevents duplicating or skipping numbers, and
provides a handy index of shcets used. Thc Log should be thc first page
in an author' s project workbook.
An author begins a new C-number sequence at the start of each
project. The first entry is the log sheet itself, sheet number 0. If
needed, additional log pages will be numbered 100, 200, 300, and so forth.
For each new diagram forma used, an abbreviated title (or the
appropriate node number) may be written in the next available space on
the Log. At the same time, the assigned numbehr is written on the dia-
* gram form. Every diagram form should be identified with a sequential
C-number.
Note &..t the Log is slightly more than a simple check-off. It
indicates for what purpose each diagram form was used. And it provides
a concise summary of all sheets used.
INTIfS 1 2 3 4 S67 9 2
OeMMKS PTARTING AT& oo
01 - .7,errf L4 D. 26 71 75 _________
P rq -27 52 77
2gOM M VV P- 9 S4 79 ___________
07 _________ 17332____________
43- 82~r ____________
3 ____________ 631 64
30r o 64 __ _ _ _ 9 _ _ _ _
do 6 0 _____________
41 96 8______________ 42 69 u
46 74 9
TOIL. SaoC44UMUR LOG
500-11 4-7

A-8
2.3 Personnel Roles
The roles and functions of people involved in the author/reader
cycle are:
. Authors People who design or analyze a
system or create a document.
- Commenters People who review ki~s and commenton them in writing.
0 Readers People who read documents for infor-mation but are not expected to makewritten comments.
0 Librarian A person assigned the responsibilityof maintaining a file of documents,maling copies, distributing readerkits, and keeping records.
In addition, the full process requires that the following roles also be
identified:
0 Technical Senior technical people assigned toCommittee resolve technical questions or disagree-
ments, or recommend a decision to theproject management. This will usuallybe in the form of a review% meetina co.--ducted by a coalition of senior area repre-sentatives, occurring either regularly(monthly) or as documents are readicdfor publication.
* Experts People from whom authors obtain forinformation by means of interviews.Most experts are also asked to serveas commenters.
. Project Manager The member of the project who hasfinal responsibility for the finishedproduct.
It is important to note that these are generic roles and that theauthor/reader cycle may be used at any time. The subject of a "kit"
may be a plan, an analysis, a design, or a computer program. A "role"
has nothing to do with someone's job title, and the same person may be
asked to perform several roles. For example, one may be an expertand a commenter, or an author and a commenter (of others' work).
* "Thus, each individual's participation in the project is, in fact, unique.
7500-11 2-3

A-9
KEEPING FILES
Each author and commenter will handle many diagram forms
during the course of a proicct. It is not enough simply to have every-
thing written on paper; one must also be able to find the papers and to
relate them properly. Thus, the librarian, each author, and each com-
menter maintain files of documents. The librarian maintains the central
master and reference files for the project. Each author maintains files
showing current versions and the annotated sheets which record. how
they evolved. Each comimenter keeps records of his interactions with
authors.
The files of reader kits must permit easy access, while still
maintaining the integrity of valuable master files. Variations in the
filing process -nay occur at individual sites, but it is recommended that
four files be maintained:
* Model Files, maintained by each author andc,)mmenter, contains the most current versionof each document or model.
* Original File, maintained by the librarian. Originalsare kept unbound in reverse chronological order.
-% Reference File, maintained by the librarian, containsone archive copy of each document or reader kit.(In large projects, an Index File, of reader kit coversheets only, may also be kept.)
0 Extra Copies File, maintained by the librarian.
(Note: Do not remove the Original File or the Reference File from the
library. Obtain copies from the Extra Copies File or by making a
request for a copy to the librarian. The Reference File may be read
by any project member.)
The "model files" maintained by comnmenters should be designed
for convenient use. They should include reader kits (both in process
and obsolete kits) and the most current version of the evolving document
or model.
7500-11 5-1

A-1O
2.3 Boxes
When the boxes on a diagram represent activities, they are each
described by an active verb phrase, written inside the box. Each box on
a- diagram is also numbered in its lower right corner, in order from "I"
to at most "6. "
The arrows that coilnect to a box represent real objects or infor-
mation needed by or produced by the activity. They are each labeled with
a noun phrase, written beside the arrow. "Data" may be information, objects,
or anything that can be described with a noun phrase. The arrows are con-
straints that define the boxes, not just sequences or flows of activities.
The side of the box at which an arrow enters or leaves shows the
arrow's role as an input, a control or an output. Incoming arrows
(left and top of box) show the data needed to perform the activity. Outgoing
arrows (right of box) show the data created when the activity is performed.
From left to right (input to output), an activity transforms data. An inpul
is converted by the activity into the output (the input, in effect, "becomes"
the output). Tne terms "input" and "output" convey the notion that a box
repres-,ts a transition from a "before" to an "after" state of affairs.
A contr 1 describes the conditions or circumstances that govern the
transformation. The roles of input and control are decidedly different. The
* distinction is important to understanding the operation of systems. The
assumption is that "an arrow is a control unless it obviously serves only
as input." Every activity box will have at least one control arrow.
The bottom of a box is reserved to indicate a mechanism, which may
be the person or device which carries out the activity. In summary, the
input and output show WHAT is done by the activity, the control shows
WHY it is done, and the mechanism shows HOW it is done.
Boxes represent collections of related activities, not just monolithic
actions. A box may perform various parts of its function under different
circumstances, using different combinations of its input and controls and
producing different outputs. These are called the different activations of
the box. There may be several arrows on any one side of a box.
If it is unclear whether a particular word is a noun (data) or a verb
(activity), an "(n)" or "(v)" may be appended to the word. For example, the
word "Record" could mean a record, or the action of recording. "Record(n)"
is used f6r the former case, and "Record(v)" is used for the latter.
7500-12 2-4

$I'YIS~iA i4o1'ryRE~uR.~rvE~r C cE4.'ric
ARROWS CLARIFY AND BOUND THE MEANING OF EACH BOX
ouT~ ur
WH NY
MECNAA/S~.1NOW
TNIS 1.5 AROCC;S90 &Y rM AcTID'i7Y ro cq*~E Af HI.
EACH BOX REPRESENTS A TRANSFORMATION
ARROWS CONNECT THE BOXES
7500-12 2-5

A-12
2.4 Arrows
Tle arrows on all activity diagram represent data constraints. They do
not represent flow or sequence. Connecting the output of one box to the input
or control of another box shows a constraint. The box receiving the data is
constrained, since the activity cannot be performed until the data is made
available by the box that produces it. The arrows entering a box show all
the data that is needed for the activity to be performed. Several activities on
a single diagram could be performed simultaneously, if the needed constraints
have been satisfied. Arrows connect boxes, and an output of one box may
provide some or all of the data needed by one or more other boxes.
Neither sequence nor time is explicit in activity diagrams. Situations
such as feedback, iteration, continuous processes, and overlapping (in time)
activities are easily shown. This is possible because the arrows connecting to
the left ("input") or top ("control") of a box are "constraints." That is, they
represent data or objects needed to perform so~ie part of the function. For
example, a draft system specification submitted for review (see example oppo-
site) may be approved and thus become final, or it may be returned with com-
ments and with a request that a new draft be submitted. The latter causes a
"re-do" of the design activity. Both the design and the review are done with
respect to the system requirements.
In activity diagrams, arrows may branch (implying that the same data
is needed by more than one activity) or they may join (implying that the
same class of data may be produced by more than one activity). It is usually
the case that more than one kind of data is needed to do an activity, and
that more than one kind of data is produced by an activity. The branches may
each represeht the same thing, or different things of the same general type.
The arrow labels make clear what the arrows are. On any given diagram,
data may be represented by an internal arrow (both ends connected to boxes
shown on the diagram) or a boundary arrow (one end unconnected, implying
production by or use by an activity outside the scope of the diagram).
7500-12 2. 6

A-13.
MEANING OF CONSTRAINT
TAfAo ACT, Vi??f
PRODCESrvfa PATrA.. ~. A~/o* 7WsD4fA s aos VeAe TO
00 800 ZW Amo a
EXAMPLE OF FEEDBACK
SIMULTANEUS ACTIO
Or OSSZ N 4*A
0^VRAN .sJV Aa4.ArLLE
7500-12v2-7

A-14
2.5 Arrow Connections Between Boxes
To. form a complete diagram. from three to six boxes are drawn and
connected by input, output, and control arrows. The boxes are a detailing
of a single box on the "parent" diagram, and cover exactly the same sub-
ject matter as the parent box, in finer detail. Any output arrow may pro-
vide some or all of the input or control (or mechanism) to any other box.
An output arrow may branch and provide data to several boxes. Arrows
that are unconnected at one end represent data that is supplied or con-
sumed outside the scope of the diagram.
All manner of arrow branches and joins are used to show box rela-
tionships. Data arrows, like activity boxes, represent categories. It is
useful to think of high level data arrows as "pipelines" or "conduits."
Such arrows, with general labels, may branch, each branch having a
more specific label. In any case, the arrow labels must convey the author's
intent to the reader. Using fewer arrows will reduce clutter, this making
a diagram easier to understand. Using fewer arrows, while still conveying
the message of the diagram, requires careful choice of meaningful words.
The best use of structured analysis has both abstract and intense meaning
at each level, even though details always are found at lower levels.
I;IF
PIPELINC A SPIir 511 //To49 AND C TO POV'IVEcoNTRoLs TO XC AND V.
7500-12 2-8

i! i ~.. ... .... 5.......... •A-15
This branch means that "files" This 12in means that "account entries"(produced by box 1) arc corn- are created by some from DELIVERposed of "customer records" PRODUCTS (box 2) and/or some from(needed by box 2) and "Price DO BILLING (box 3).
-! and Tax Tables" (needed by-box 3).
-'. I PRICE r ",X
ACCO U A' r
A' NVOiCES
that "orders," upon delivery (box 2), arerecorded as "transactions," which, when billed(box 3), are reflected on "invoices."
7506-12 2-9F- .

.b% . . . . . . . . . . . . . . . .. _•_ . •... . . . .. ..
A-16
2.6 Mechanism Arrows
If a box represents an activity, then input data (on the left"
are transformed into output data (on the right). Controls (on the top)
govern the way the transformation is done.
Control
'In put Ioutput
Mechanlsrn
Mechanisms (on the bottom) indicate the me zns by which the activity is
performed. A "mechanism" might be a person or a committee or a
machine or a process. The box itself, with :ts inputs, controls, and out-
puts, indicates WHAT the system does. The mechanism shows HOW that
activity is accomplished. Diagrams drawn without mechanisms show what
functions a system must perform. Selecting specific mechanisms later
will allow those functions to be implemented.
A downward-pointing mechanism arrow (known as a "call") indicates
a processor that completely performs the function of the box. If there is
a needed for further detailing, it will be found in a separate model of the
mechanism itself.
Mechanism arrows may be the output of other boxes, if those boxes
create or prepare processors (devices) from their inputs and controls.
More often, however, a mechanism model is a separate portion of a multi-
model analysis' or design. (A discussion of such multiple models is beyond
the scope of this document.)
7500-12 2-10
-4 . .2 .; . .' . . -- .' - ' . - - ' ,' -- " " --. . ' , , - -. .. -

APPENDIX B
RELEVANCE TREE PAPER

. ~ ~~~~~~~~~~~ ~ ~~~~~ -, -,._: ,-. --., -. -- -, -. . -.. -.- -- . . L =
;' I _ _____ N,'MII
GRADUATE SCHOOL OF BUSINESS INDIANA UNIVERSITY A Reprint from s s
WILLIAM L. SWAGER
* TECHNOLOGICAL FORECASTING IN PLANNINGA method of using relevance trees
Wiliam L Swqger is assist ant manager, Department of Social Dunckel, Reed, and Wilson of Genecraland Management Systems at Battelle, Columbus Labora- Electric have argued convincingly that thetories. Much of the material in this article is reprinted, bypermission, from the author's series of three papers entitled political and social dimensions of forecasting"Strategic Planning" in Technological Forecasting, IV, Nos. must be added to the more traditional ech-."1, 2.nd.3. 1972and 1973. nical and economic if business planning *s to
Forecasting in the seventies, if it is to be be effective in the seventies.' Little is report-effective, must include political and social cd by thcsc authors or othcrs on how Lhcseconsiderations as well as the traditional tech- kinds of forecasts can be creatively geneiatednical and economic elements. The author to circumscribe threats and opportunities fordescribes a procedure using relevance trees a particular business and how this kind ofthat helps structure and partition forecasting forecasting can be coupled closely withissues in the planning process. The strategic business planning and relatedperspective-tree approach to the identification research and development planning.of threats and opportunities helps to reveal rsac n eeomn lnig
of treas an oportuitis heps o reealThis article describes a procedure Lsingpolicy options at the level of broad businessstrategy. The author lists seven steps of the relevance trees that helps structure andprocess, and points out that twenty-five or partition forecasting issues in the planningthirty such trees can usually be identified. process. It encourages the making of sets ofThe objectives trees clarify the program related social, economic, and political fore-options. Levels of subobjectives need to be casts as well as technological forecasts. Thisadded for more detailed R&D planning. method also provides a model for information
collection and communication among line-Technological forecasts are essential to the and-staff people involved in the planningdevelopment of realistic strategic plans. How- process.ever, many companies' efforts to use techno- The procedures described here involve twological forecasting methods have been less kinds of relevance trees-perspective trees andthan successful for two reasons: first, fore- objectives trees. No attempt will be made tocasts of social, economic, and political trends describq the nature of these tree structures orand events have not been sufficiently inte-grated with those of technological events andtrends, and, second, the technological fore- I. Ead B. Dunckd, William K. Reed, and Ian IL Wilson.casting activity has tended to be divorced The Business Environment of the Seventies: a Trend Analysis
for Business Planning (New York: McGraw-Hi Book Com-from either business or technical planning. peny. 1970).
FEBRUARY, 1973

WILLIAM L. SWAGER
TABLE 1 people-coming from R&D, marketing, orfinance-see things "rightly" but from differ-
Steps in Development and Use of Perspective ent points of view. The perspective-tree
Trees procedure provides a structured process bywhich their data and arguments can lead to
1. Define the business under consideration judgments on strategy-the identification andAn identifiable portion of a business or tech-
nology of concern is the framework within which ranking of threats and opportunities.plans are being developed. Using a perspective-tree approach to the
- - 2. Develop initial lists of relevant factors identification of threats and opportunitiesFactors are listed in two domains-environment, involves careful selection of a planning team
utilities and functions, and technology. The business and a task force representing R&D, market-is also characterized in terms of the functions and ing, finance, and planning; scheduled workutilities of its products and services.
sessions and reviews with executive manage-3. Make an array using an initial categorization mnt ad asvesep ro du.Th
scheme ment; and a scven-step procedure. The
Categories conceptually simple and germane to the members of the planning team and task forcebusiness and/or technology are created. should be selected for their knowledge of the
4. Fill gaps and identify new factors business and/or technology, their demon-This step uses the categorization as a creative stratcd creative approach, and their communi-
device to search for new and more meaningful cativ skills. After being briefed on thefactors.
apprc.ach, these people follow a seven-step5. Assemble initial forecasts and purge array
Each factor listed is implicitly a forecast. Make procedure as given in Table I.'them explicit and, if possible, quantitative. The Steps
6. Search for relationships and identify perspective
treesThis is a search for sets of changes in the Step.!. Define "the Business" Under Consid-
environment that can be related to sets of changes in eration. -This initial definition emphasizes thetechnology through the logic of the utilities and quest:on, "What business are you in?" as"-:: functions.
phras,-d years ago by Peter Drucker. The7. Translate to specific threats and opportunities breadth of view given to the analysis is
*Each perspective tree represents an area of poten-tial change. As such, each represents a threat or governed by the answer. In general, a businessopportunity, depending on the present position of can be defined narrowly by the characteristicsthe company. of its product, more broadly by what the
product does, or still more broadly in athe concepts behind them.2 Rather, step-by- generic class. Examples of the three types of
step procedures are described that will reveal definitions are as follows:in a practical way how these structures Narrow: Writing instruments, electric auto-
mobiles, wallpaperprovide an interlocking framework for fore- Intermediate: Business communications, urbancasting and planning, emphasizing the creative transportation, wall coveringsidentification of options at two levels: policy Generic: Communications, transportation,
options at the level of broad business strategy, interior wall systems.
and program options at the level of functional If thought is given to the definitions atand departmental tactics, various levels, a few days effort at most would
PERSPECTIVE TREES: POLICY OPTIONS 2. For further information on perspective and objectivetrees see W. L Swager, "Strategic Planning 11: PolicyOptions," in Technological Forecasting and Sot ial Change.
A perspective-tree approach to the identifi- No. 3, Vol. IV (1973), and "Strategic Planning III: Programcation of business threats and opportunities is Options," No. 4, Vol. IV (1973).
3. For a more detailed description see Swager. "Strategicas much a process as it is a method. Different Planning il and Ill."
BUSINESS HORIZONS

Tcknotog ul Forecasting k p '
TABLE 2 TABLE 3
Forces of Change in the Paper Industry Functions and Uses of Products in Paper
Social, Economic, and Political Environment IndustryEPA regulations Uses ProductCosts of capitalIncreasing labor costs Communications PrintabilityNox standard, 100-250 micrograms/m 3 Packaging CostSolid waste Construction AvailabilityAir Quality Act of 1970 Health Basis weightOdor standard SurfacePaper imports BrightnessGNP Recycled fiber content
isDemand for recyclingSO1_ S O 3 standard, 80-350 micrograms/m 3 Process ControlFederal guidelines for waterState regulation Digestion Meet standardsSuits against paper mills Washing Reduce chemical consumption
Investment cycle in paper industry Bleaching Reduce effluentsBOD in effluents Recovery Increase capacityColor in effluents Pape, making Increase yieldElectronic communications Converting Reduce laborDemand for paper Reduce energyReturn on capital in the paper industry Increase uniformity
Reduce downtimeC sTechnology Increase safetyClosed system for process waterImproved instrumentationNonwood natural fibers problem. A typical group may include aNew sheet forming processes manager, an engineer, a physicist, a socialNew pulping processesDry bleaching scientist, a marketing man, and a chemist,Electrostatic precipitators selected partially from the task force andWaste-paper pulping partially from elsewhere in the company. TheUse of cryogenics for condensing gaseous pollutants force- of change that should be considered inSynthetic fibersMulti-mini computer control an analysis of the paper industry includeContinuous digesters those listed in Table 2.NH3 pulpingFluidized-bed recovery systems During these group sessions, an indirectK-number sensing approach is used to characterize the business.
Answers to the following questions are listed:
be required to decide on an initial definition. What functions does the product serve? HowDuring the course of the analysis the initial are they measured? What are the tangible anddefinition can be modified as deemed appro- intangible attributes of the product consid-priate. ered to be of value by the user? Again in a
Step 2. Develop Initial Lists of Relevant study of the paper industry, the functions andFactors.-The purpose of this step is to break utilities of the products that help characterizeconventional patterns of thinking by getting the business arc listed (see Table 3).several small groups together to consider the Step 3. Make an Array Using an Initialpossible forces of change that would have an Categorization.-The lists of initial factors inimpact on the initially defined business. A the environment domain include broad aggre-process similar to that of brainstorming is gate terms such as EPA regulations, electronicused except that the effort is to identify communications, and gross national product,relevant social, economic, political, and tech- and micro terms such as NOx standard:nological changes rather than solutions to a 100-250 micrograms per cubic meter, paper
FF.BRUARY, 1973

Tecki"ological Forecasting in Pe.n4L/
TABLE 2 TABLE 3
Forces of Change in the Paper Industry Functions and Uses of Products in Paper
Social, Economic, and Political Environment y
EPA regulations Uses Product
Costs of capital" Increasing labor costs Communications Printability
Nox standard, 100-250 micrograms/rm Packaging Cost
Air Quality Act of 1970 Health Basis weight
Odor standard Surface
Paper imports Brightness
GNP Recycled fiber content
Demand for recyclingSO2 -SO3 staindard, 80-350 micrograms/m 3 Process ControlFederal guidelines for waterState regulation Digestion Meet standardsSuits against paper mills Washing Reduce chemical consumptionInvestment cycle in paper industry Bleaching Reduce effluentsBOD in effluents Recovery Increase capacity
- Color in effluents Papermaking Increase yieldElectronic communica ions Converting Reduce laborDemand for paper Reduce energyReturn on capital in the paper industry Increase uniformity
Reduce downtimeTechnology Increase safety
Closed system for process waterImproved instrumentationNonwood natural fibe. s problem. A typical group may include aNew sheet forming processes manager, an engineer, a physicist, a socialNew pulping processesDry bleaching scientist, a marketing man, and a chemist,Electrostatic precipitat,,rs selected partially from the task force andWaste-paper pulping partially from elsewhere in the company. TheUse of cryogenics for condensing gaseous pollutantsSynthetic fibers forces of change that should be considered inMulti-mini computer control an analysis of the paper industry includeContinuous digesters those listed in Table 2.NH 3 pulpingF!uidized-bed recovery systems During these group sessions, an indirect
K-number sensing approach is used to characterize the business.Answers to the following questions are listed:
be required to decide on an initial definition. What functions does the product serve? HowDuring the course of the analysis the initial are they measured? What are the tangible and
definition can be modified as deemed appro- intangible attributes of the product consid-priate. ered to be of value by the user? Again in a
Step 2. Develop Initial Lists of Relevant study of the paper industry, the functions andFactors.-The purpose of this step is to break utilities of the products that help characterizeconventional patterns of thinking by getting the business are listed (see Table 3).several small groups together to consider the Step 3. Make an Array Using an Initialpossible forces of change that would have an Categorizatio.-The lists of initial factors inimpact on the initially defined business. A the environment domain include broad aggre-process similar to that of brainstorming is gate terms such as EPA regulations, electronicused except that the effort is to identify communications, and gross national product,
relevant social, economic, political, and tech- and micro terms such as NOx standard:
nological changes rather than solutions to a 100-250 micrograms per cubic meter, paper
FEBRUARY. 1973
...........- g..-.
-WILLIAM L SWAGER
CONVERTING
PAPERMAKING
' RECOVERY
BLEACHING
WASHING
DIGESTION
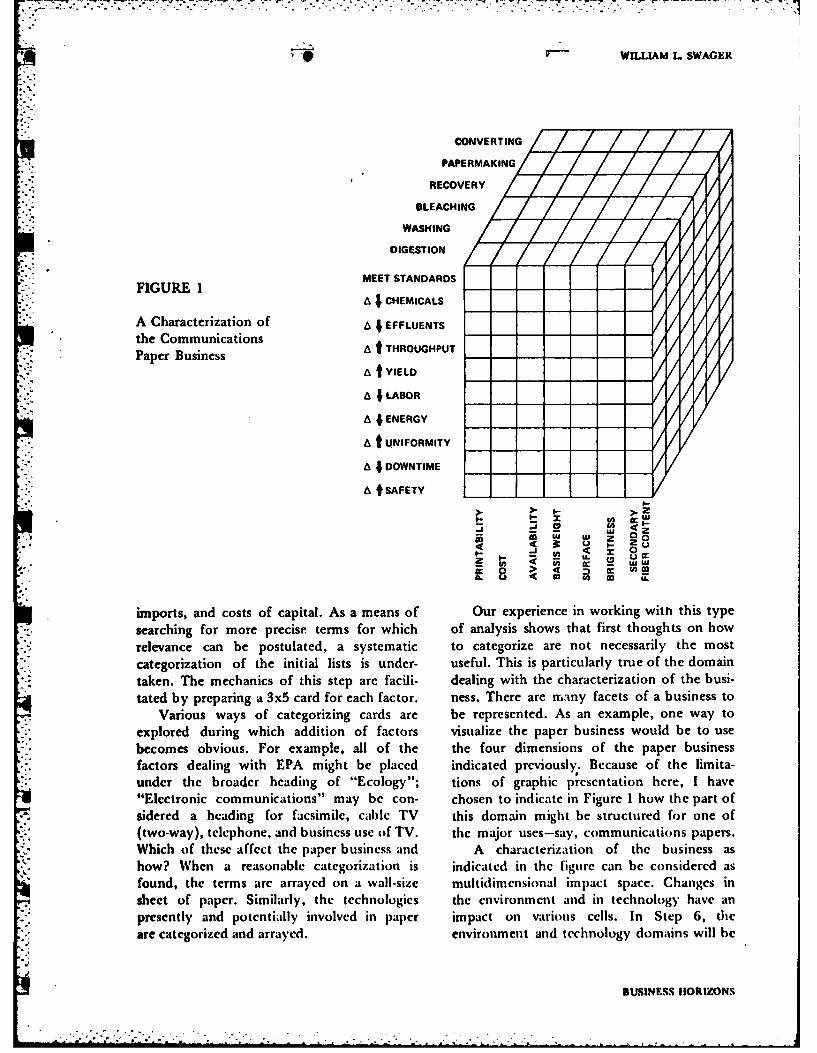
MEET STANDARDSFIGURE 1
A CHEMICALS
A Characterization of 6 4 EFFLUENTSthe CommunicationsPaper Business a t THROUGHPUT
A t YIELD
A 4 LABOR
A 4 ENERGY
A t UNIFORMITY
A 4 DOWNTIME
A SAFETY
ID LU 0w 2U
,w 0
himports, and costs of capital. As a means of Our experience in working with this type
;.,searching for more precise terms for which of analysis shows that first thoughts on how-.. relevance can be postulated, a systematic to categorize are not necessarily the most'."categorization of the initial lists is under- useful. This is particularly true of the domain"--taken. The mechanics of this step arc facili- dealing with the characterization of the busi-
tated by preparing a 3x5 card for each factor. ness. There arc many facets of a business toVarious ways of categorizing cards are be represented. As an example, one way to
.':"explored during which addition of factors visualize the paper business would be to use-. becomes obvious. For example, all of the the four dimensions of the paper business
factors dealing with EPA might be placed indicated previously. Because of the limita-under the broader heading of "Ecology"; tions of graphic presentation here, I have"Electronic communications" may be con- chosen to indicate in Figure I how the part ofsidered a heading for facsimile, cable TV this domain might be structured for one of(two-way), telephone, and business use of TV. the major uses-say, communications papers.Which of these affect he paper business and A characterization of the business ashow? When a reasonable categorization is indicated in the figure can be considered asfound, the terms are arrayed on a wall-size multidimensional impact space. Changes insheet of paper. Similarly, the technologies the environment and in technology have an
.presently and potentially involved in paper impact on various cells. In Step 6, the%,.jare categorized and arrayed. environment and technology domains will be
~BUSINESS HIORIZONS
• " '- {- :? -_- ._ :i . ., i. :, .: .: , . -i~~4 4 - . . .. . .

Tecknotogicul Forecasting in
scanned relative to each cell individually for constituted-or an opportunity for polymersignificant changes affecting that cell. producers. In a recent study, synthetic-fiber
Step 4. Fill Gaps and Identify New technology was purged from the array as anFactors.-This and the next two steps, unlikely event in the next ten to fifteenalthough described in a sequence,'are accom- years-and probably longer. It was notplished in part in parallel and involve several dropped and forgotten, but was put in a listiterations. Review of the array by specialists of factors eliminated from the array forand recategorization of portions of the array reason.bring to light new factors. Step 6. Search for Relationships and
Step 5. Assemble Initial Forecasts and Identify Perspective Trees. -There is a temp-Purge the Array.-Most people-executives as tation to immediately state significant rela-well as managers-tend to expand the array tionships previously recognized. The aboveduring the previous step. More and more steps, however, have set the stage for afactors are added, cluttering the array and systematic cell-by-cell search for sets of fore-obscuring the analysis. casts in the environment and of technology
In the previously presented list of environ- that are related to each other and to one ormental factors for the paper industry, GNP more cells. The diagram of such a searchand demand for piper were listed separately. represents a perspective tree. Small groups,The projection ot demand for paper was composed of members of the core team andderived from a historical relationship to GNP the task force, go through the cell-by-cell
* and a projection of GNP. Until one can search for relationships.postulate a differer t relationship or a differ- An example of a perspective tree identi-ent projection of GNP, one or the other of fled in such a procedure is given in Figure 2.these "forecasts" can be dropped from the This tree states the following relationshipsarray. We would drop the GNP forecast, that might be considered a miniscenario:adding it to the list of factors deleted from forecasts of the costs of capital in thethe array with the reason given, foreseeable future are going to be substan-
" Preliminary forecasts are made for all of tially higher than they have been in the past.the factors in the environmental and the Return on investment in the paper industrytechnological domains. For example, syn- began dropping more than ten years ago andthetic fibers were lsted in the technological has not been at a satisfactory level since.domain. A synthetic fiber can produce techni- Added investment will be forced on the papercally a usable paper. What other forecasts are industry from pollution control regulations.needed to establish the likelihood of signifi- These forces in combination make the twocant use of synthetic fibers? What methods of cells noted-increased throughput andforecasting are applicable? Only recently, increased yield in digestion-much moredomestic petroleum refiners and petro- urgent than they have been heretofore.chemical companies have recognized that Forecasts of potential technical advancesgrowing demand for feedstock and limited in new pulping processes, continuous diges-supplies will put pressures on price. What are tion, direct digital control, and instrumen-reasonable forecasts of availability and cost of tation of K number (a measure of thepetrochemical feedstocks and demand for completion of digestion) hold promise for
J feedstocks from plastics, synthetic fiber, increasing throughput or yield. Environmentallead-free gasoline, and sulfur-free fuels? forces arc consonant; this is an area of likely
Such forecasts, translated to fiber costs change. Figure 2 represents only one of manyand compared to the forecasts of wood fiber perspective trees that can be drawn, linkingcosts, including pollution controls, provide a related environmental and technologicalbasis for judging whether synthetic fibers may changes through one or more cells. Eachbe a threat to the paper industry as now represents a potential threat or opportunity.
FEBRUARY, 1973

WILLIAM L SWAGER
FIGURE 2 changes represents a threat nr an opportunity.By policy a management group can choose to
Example of a Perspective Tree Isolated from respond or not. The obvious question is how athe Array rational priority can be established among
such threats and opportunities.COTSOFPLLTINThe perspective-tree analysis does not in
CONTROL itself provide a basis for establishing prioritybecause it includes no information or judg-
COST OF TREND IN RETURN ON ments on the internal environment of theCAPTALPAPER INDUSTRY company. It provides no quantitative
approach to the ranking and ordering ofpriorities among the threats and opportunitiesthat have been identified. It merely makesmore explicit and elucidates the forecasts that
A# THROUGHPUT were involved, the nature of likely change,*YLand the likely impacts on the business. This
provides a framework for management toCOST arrive at a realisticranking of priorities.
Executives who understand the inte-nalDIRECT DIGITAL environment of their company can rowNH3 PULPING CONTROLT consider the potential thrats and oppo-tu-
CONTINUOUS ON-LINE K NUMBER 1. The Nature and Degree of Impact on
DIGESTION SENSING the Business and the Probability of Occur-
rence.-Some threats could have tidal-naveimpacts on a business. Those future eventshaving high probabilities of occunence
The individual trees, however, may or may usually involve modest to negligible impa, ts,- not be significant until translated into their and those having low probabilities of occur-
likely impacts on a particular company. rence are usually associated with major toStep 7. Translate to Specific Threats and catastrophic impacts. This usual situation of
Opportunities.-The significance of the envi- impacts and probabilities running in counter-ronmental forces and relatcd technological directions increases the chances and signifi-forces noted in Figure 2 differs depending on cance of potential errors in forecasts or theira company's present position. interpretation.
For paper companies, this could be a threat or an Management judgment is essential toopportunity, depending on the strength of the com-
pany's process engineering and control systems staffs assessment of the interaction of a complex setFor paper equipment and machinery manufac- of contingencies implicit and explicit in the
turers, this could be a threat if weak in control- forecasts. If a management group cannotsystems technology
For control systems manufacturers, this could be reach agreement on priorities among thean opportunity for new market penetration. threats and opportunities, the perspective tree
provides a clear framework for developingadditional data and making refined forecasts
Deciding on Changes in Strategy using a variety of methods in order to helpdevelop a consensus. In such a case, however,
Experience with perspective-tree analyses the constraints in temis of time and cost aredemonstrates that twenty-five or thirty such clearly defined by the planning process.trees can usually be identified. Each of these 2. Timing.-Partially explicit in each ofsets of environmental and technological the perspective trees is the mechanism of
BUSINESS iIORIZONS
. * * .. . .

*Technological Forecasting in P, ..
change-a sequence of trends and events, each for refined products. A certain amount ofrelated to time. Management judgment of flexibility in the present system pros ides fortiming is also essential in establishing prior- adjusting to a changing mix of refined pro-ities. Certain of the events are related sequen- ducts. Beyond that, major changes in thetially in time, and others are concurrent. physical facilities at refineries would beForecasts of the timing of impacts may be needed, which may require years for designjudged in relation to the inertial forces of a and construction.system. The characteristics of the apparel
Some systems involve large inertial forces industry, on the other hand, enable thissuch as the infrastructure associated with industry to react quickly to changes in designautomobile transportation. A major change in as well as in fabrics. One executive corn-the vehicle-even involving a diiterent power mented, "A few years ago considerable effortplant and fuel, such as a turbine-would have was made to forecast the length of women'sa gradual impact on the petroleum industry skirts. A great controversy in the managementand precipitous impact on, say, carburetor group of our company developed over themanufacturers. If all new automobiles coming accuracy of the forecasts. The connotation ofoff the assembly lines of the world, beginning the words 'accuracy of forecast' becametomorrow, had turbine power plants, the mear ingless when women began wearing pant-
Schangeover period for the petroleum industry suits rather than dresses. Our ability to react.would be more than ten years. The carburetor quiciy, however, allowed us to succeed in
manufacturer would face an immediate drop spite of misleading forecasts." There are fourin his new-car market and would be limited desigr, cycles per year; therefore, any forecastsubsequently to a dwindling aftermarket. of design features more than six monthc
The point here is that sets of forecasts aheadi is irrelevant. The time required to reactmay involve different inertial forces, and the to change is usually less than six months.timing of the threat they describe is not Judgments of reaction time weigh heavilynecessarily controlled by any one of them, in est iblishing priorities regarding the severalbut by their interaction. Here again the threats and opportunities facing a company.emphasis is on developing sets of forecasts Management's experience in judging thatand, if possible, using different methods of reaction time is an important input.forecasting. 4. Threshold of Effective Effort. -This is
3. Reaction Time.-Also associated with probably one of the most difficult of manage-each Of the threats and opportunities is an ment judgments to be made in assessingestimate of time required for appropriate priorities on threats and opportunities. At thisaction. The time required varies substantially stage, only parti.-ly defined alternatives are
.4 from industry to industry and from one available to counter threats or take advantagethreat or opportunity to another within an of opportunities. Thus only order-of-industry. magnitude estimates are available on the
Reaction time is related to the character- amount of effort required. Here again,istics of the industry involved as well as to the management judgments are essential in con-nature of the threat. The reaction time of the sidering priorities relative to resources.petroleum industry to a diminishing market The perspective-tree analysis in itselffor one of its most highly refined products provides a major increment in improvingand an increase in others is not easily esti- management's ability to reach consensus. Itmated. The mix of crudes now being used, the recognizes that all of the forecasts are condi-type and location of refineries, and the tional, and these arc presented with theworldwide transportation network for crudes realization that management must baseand refined products are the result of an judgment on the conditions surrounding each.evolution to meet the current mix in demand The procedure helps eliminate errors of
FEBRUARY, 1973

WILLIAM L SWAGER
FIGURE 3
Example of an Objectives Tree
TO REDUCE INVESTMENTPER TON OF PULP
TO INCREASE YIELDAND/OR THROUGHPUT TO DEVELOP NEW PROCESSES
IN EXISTING DIGESTORS AND/OR EQUIPMENT
TO DEVELO0P TO USE NEWTO IMPROVE CONTROL TO IMPROVE SCHEDULING CNIUUS PLIN
IN DIGESTION IN DIGESTION AND WASHING DIGESTORS PROCESSES
omission and provides specific sets of fore- stimulus to creative identification of addi-
casts and guidance for the establishment of tional options.priorities. When the lower level objectives are added,
the completed tree provides R&D manage-
ment with alternative paths from which to
OBJECTIVES TREES: PROGRAM OPTIONS choose. If more detailed forecasts are neededto judge the relative merits of competing
If the management of a paper company judges paths, they can be made within realistic timethe forces of change depicted in Figure 2 to and cost constraints. The structure of anbe a threat or opportunity, what are its objectives tree, of course, by appropriateoptions for responding? First, a strategic intuitive "pruning" could be transformed to aobjective related to this threat (or opportu- decision tree for final R&D budgeting. In ournity) is "to reduce investment per ton of experience, this refinement has not beenpulp." There are environmental factors necessary or practical.making this objective more important than ithas been in the past, and there are techno- j As in all forecasting and planning,logical potentialities for achieving it. Alter- "success" depends in great measurenative ways of accomplishing that strategic on top management commitment, concern,objective are partially structured in the and involvement and participation by middleobjectives tree given in Figure 3. Succeeding management and staff groups. Of course,levels of subobjectives need to be added for what is successful and what is not is amore detailed R&D planning. subjective judgment. We judge our efforts as
The adding of such detail involves the successful when they clearly identify threatscreative identification of options at each node and/or opportunities that had not been seenat each level. The tree itself provides a before, or identify new technical approachescommunications vehicle for explaining to to old problems. In both cases, creativity andtechnical specialists the options already judgment of people brought to light newidentified and the strategic objectives behind options. The relevance trees merely structuredthem. This framework has proved, to be a thinking and communications.
BUSINESS HORIZONS
. ." ". . .- " ;' .- ". , ." °. " ", , _ , • _.. . . . :, ..

- k
APPENDIX C
PRE- AND POST-SESSIONQUESTIONNAIRES

PRE-SESSION QUESTIONNAIRE
Name Organization
1. Please place a check mark next to the number of formal group sessions you
have participated in within the last three years.
a. None
Elib. lor2
c. More than 2.
2. Have you ever led a group using a formalized group dynamics technique?
a. Yes b. No
If yes, which technique(s) did you use?
3. Have you previously used the scenario approach to planning?
a. Yes b. No
4. Did you participate in the preparation of the bubble or aggregation charts?
a. Yes b. No
5. Are you familiar with the Long Range Planning process being developedthrough XRB?
a. Yes b. No
6. Are you familiar with the LAG methodology being used to describe the AFLCfunctions?
a. Yes b. No
7. Have you previously participated in a brainstorming session?
a. Yes b, No
' 8. Have you previously participated in a brainwriting session!
a. Yes b. No
9. Have you previously participated in the Nominal Group Technique process?
a. Yes b. No

C-2
i0. Briefly state your expectations for attending this meeting.
11. Please characterize your decision style, acknowledging the fact that mostpeople adapt their decision style to different circumstances, and mayactually be best represented by a mix of styles. Number from 1 to 4, with1 being your most dominant decision style, and 4 the least used.
The Decisive Style
The Decisive Style is seen as one prizing speed, efficiency andconsistency. Just enough data is used to generate an adequatedecision. Decisions are made quickly with few backward glances.
Flexible Style
Flexible Style shares the decisive habit of focus on solution.This style uses minimal data but sees solution as changingconsistently over time. It however relies more on intuitionthan facts.
Hierarchic Style
Hierarchic Style is the style which strives to attain the bestsolution. Rigor extends to method as well as results.
Integrative Style
Integrative Style shares the high data bias of the hierarchicbut generates multiple solutions rather than one. It is astyle which likes information for its own sake and seems mostcreative.
.

<.;.-
C- 3
POST-SESSION QUESTIONNAIRE
Name Organization
In the following statements, please indicate your feeling or attitude by placinga check mark in the appropriate box.
Example
"Computerized data processing is necessary to the modernorganization."
Strongly I I Stronglydisagree . t iagree
1. I found the planning task rewarding.
Strongly I Strongly
disagree agree
2. The introduction presentation defined what was expected of me.
Strongly' Stronglydisagree_ agree
3. The recommended process will be useful in the AF environment.
Strongly'I Stronglydisagree' I I agree
4. I understand how the planning process begun here will affect my organization'sneed for new data systems.
Stronglyi Stronglydisagree I I agree
5. It was easy to present my views using the brainstorming technique.
Strongly I tronglydisagree I agree
6. I was satisfied with the brainstorming technique.
Stronglyl i Stronglydisagree! . agree
7., .a r

C-4
7. I recommend using the brainstorming technique for future sessions.
Strongly I Strongly
disagree !I agree
8. It was easy to present my views using the brainwriting technique.
Strongly!i Stronglydisagree I , agree
* 9. I was satisfied with the brainwriting technique.
Strongly i Stronglydisagree __ agree
. 10. I recommend using the brainwriting technique for future sessions.
Strongly Stronglydisagree _____ __ __ agree
11. It was easy to present my views using the nominal group technique.
Strongly! Stronglydisagree i agree
12. I was satisfied with the nominal group technique.
Strongly I Stronglydisagree ' agree
13. I recommend using the nominal group technique for future sessions.
Strongly i I Stronglydisagree ___ ___ _ __ agree
The following statements are aimed at describing your personal decision style.
14. My personal decision style is primarily intuitive and implicit as opposedto analytical and explicit.
Strongly Stronglydisagreel I I I agree
15. I try to look mostly at the immediate short term, near-at-hand consequencesof a choice. I do not get involved in looking way ahead into the distantfuture.
Strongly[ I I Stronglydisagree _ _ _ ___ agree
d6.
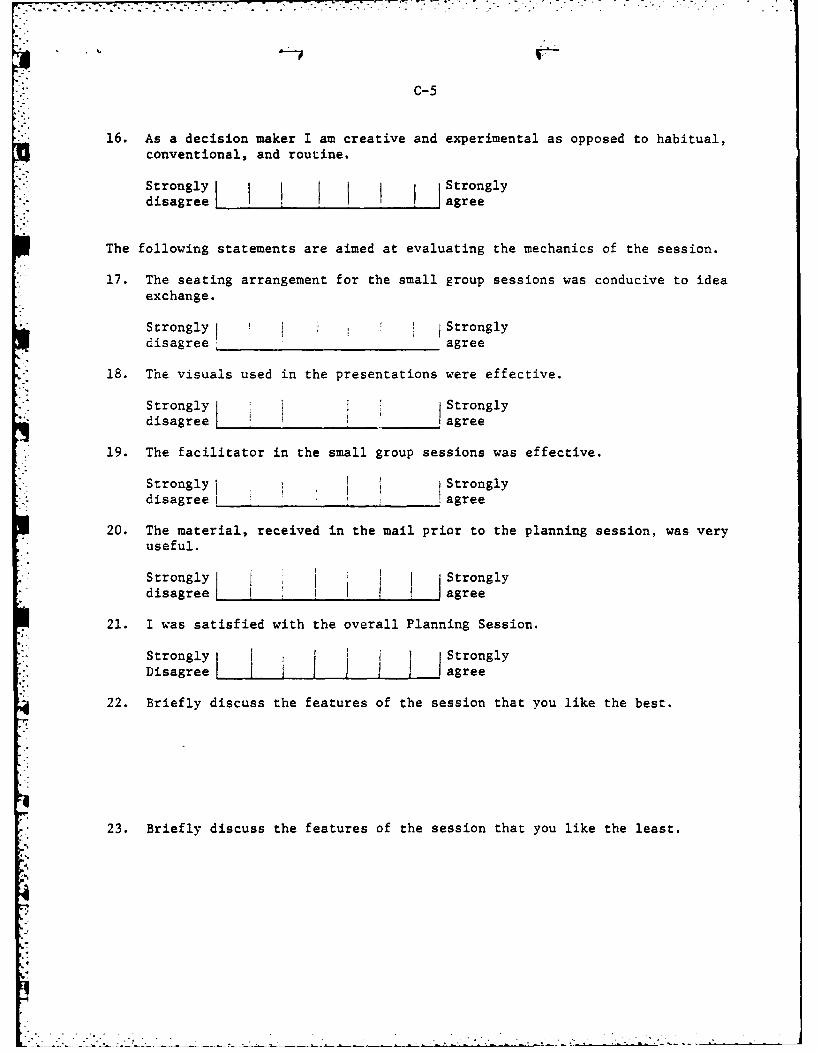
C-5
16. As a decision maker I am creative and experimental as opposed to habitual,conventional, and routine.
Strongly Stronglydisagree t I agree
The following statements are aimed at evaluating the mechanics of the session.
17. The seating arrangement for the small group sessions was conducive to ideaexchange.
Strongly1 i Stronglydisagree: agree
- 18. The visuals used in the presentations were effective.
Strongly Stronglydisagree __ agree
* 19. The facilitator in the small group sessions was effective.
Stronglyj II Stronglydisagree __ __ __ __ _ agree
20. The material, received in the mail prior to the planning session, was veryuseful.
Strongly IStronglydisagree , i ' agree
21. I was satisfied with the overall Planning Session.
Strongly IjStronglyDisagreel I agree
22. Briefly discuss the features of the session that you like the best.
23. Briefly discuss the features of the session that you like the least.4'

High Level Guidance Items
1 . Impact of energy shortages
2. FMS workload impact on AFLC support of USAF readiness
3. Identifying weal'est logistics links to Air Force war fighting capability
" 4. Desirability of increasing NATO interoperability
5. Hardening and increased security of AFLC management information
capabilities
6. Level of detail required for management at HQ AFLC
7. Desirability of interservicing
8. Examples of possible logistics weak links include in theater air lift,
in theater POL storage capacity, and rapid runway repair equipment
* 9. Identification and awareness factors limiting logistics ability
to meet readiness surge
10. Training for logisticians
11. Zero warning time action plans at ALC
12. Required to show long range LMS and ADP replacement plans firmly
based on mission needs analysis
13. Turkey is key to NATO
14. More contractor use of organic facilities within depots
15. Meaningful management indicators for management system
16. Improving wartime planning functions
17. Actions for handling hazardous materials
18. Action for meeting OSHA regulations
19. Contractor surge capabilities
20. LMS capabilities directly support USAF forces, friendly nations
and other federal agencies
* * ** .

*o 2
21. Timely response to contingencies
22. Information for making informed decisions affecting readiness
23. Methods for prioritizing support
* 24. Improvement of material
. 25. Meeting logistics requirements at the lowest possible cost
26. Planning, budgeting and accounting of AFLC resources
d

7I
(Addendum to Scenario Format Task 4(b))
DecitosTa Will Be Important DriversIn The Proposed Scenarios
Descriptors, Driving State of Descriptors
the Scenarios in Scenarios
A B C
Descriptors With States Varying From One Scenarioto the Next
World energy supplies 4. * +
World Non-fuel mineral supplies + ~
Fiscal control by congress 4' +
Government regulation + 4 +
Strength of environmental and health andsafety movements +' *
Descriptors With Constant States
1980's Workforce + + +
1980's Supply of experienced managers + + +
1990's Workforce 4+ + +'
* .Technology of weapon systems + + +
Civil/military logistics infrastructure + t +
Number of countries in NATO4. ' +

STIMULATING TOPICSFOR THE
BACK POCKET
,. 1. DA takes over management of all small partq for DoD
*, 2. Interservicing increases significantly
3. DoD takes over management of all logistics support
* 4. USAF directs the establishment of two-tier maintenance formost systems
5. Number of ALC's is reduced
6. Foreign contractor maintenance increases
7. U. S. contractor maintenance increases
8. U. S. establishes unified armed services with unified logisticscommand
9. Prepositioning is increased (decreased)
10. USAF begins extensive manned space flight operations
11. USAF acquires a large number of simple manned weapons systems
12. USAF weapons system mix tends toward one-tiLe use weapons
13. AFLC incorporates use of NATO Standard StocVs Number
14. Due to U. S. isolationist policy, FMS workload is drastically curtailed
U * * * * * . - . . .. . .. . . . . . . . .. * -, *

TASK 5(a) m: EXPECTED TYPES OF ANALYSIS OF NEEDS
Pre-Requisites for Determining Types of Analysis
In the LMS planning process, there are two aspects that must be
analyzed. The first is the content of the planning material generated in the
planning session; the second is the technique used in developing that content.
* In each planning session the requirements for analyses are different. The
following sections will deal with the two parts of the first planning sessions,
namely the Policy Planning and Needs Planning, and the evaluation of the
* techniques to be used for each. An overview of the overall LMS development
process, from Policy Planning through Data System Design, is shown in Figure 1.
Policy Planning Sessicn
* To provide a planned approach to LHS development, long range planning_
must begin at the logistics management policy level. Top level AFLC managers
will consider the alternative future (scenarios) to which they may have to respond,
and determine the management information that they will need. Readiness to
* respond to contingencies is of prime concern. Once wartime management needs
* are satisfied, consideration will be given to the alternative peacetime
environments. The combined effect of these considerations may have a variety
of impacts on ALC operations.
The consideration of these future scenarios leads to the development
of management policy and a concept of logistics management. In turn, this
logistics management (LM) concept when contrasted with current capabilities
results in the definition of LM needs upon which LMS needs and an LMS concept
can be developed.
The purpose of the policy planning session, therefore is to:
o Establish a War Readiness Philosophy for 1LM Planning
o Establish a Logistics Management Concept
o Identify major impacts on logistics operations and LM
of the combined theme and war scenarios.
To judge the accomplishment of these objectives it is recommended
that a systems approach to analyses be performed. The following steps must
be performed to do so:

* -; -' -. .
-2
. .....
-.
aIn
~- a
a
' aJ~
-di,.d
o UIn *
US
~ *
a ~ ~
In~ *
a
E-4
In
In
Ida.
Ifl
Id
add q
U Inb

Q-i
3
1) Define the significant inputs
2) Identify the transformation process
3) Define the outputs
4) Identify the required controls
5) Identify the mechanisms at work.
Figure 2 illustrates the flow of information required to support the various
planning sessions.
For this process the following inputs have been identified:
o Consolidated Guidance War Scenarios
o Battelle developed theme scenarios
o LAG concept presentation
o Related AFLC planning documents
o Understanding of Process/Perspecti-es.
The following outputs should result:
Zo War Readiness Philosophy for Logistic Management
o Impact of the scenarios on LMS processes/perspectives
o A Logistic Management Concept.
In addition to these outputs, the scenario inputs and the LAG concept
must be confirmed for use as planning framework in subsequent planning sessions.
War Readiness Management Philosophy for LM Planning
This should be a succinct statement of overall objectives developed
for managing AFLC under the conditions specified by each war scenario. These
overall objectives will be further expanded in the Needs Planning session.
They must be clearly stated, achievable, and measurable.
*. Impact of the Scenarios onProcesses/Perspecitves
The output of this effort should be a matrix constructed to show
the impact on each of the processes and perspectives by each of the scenarios,
both war and peace. The information will be cross-tabulated so that all the
effects of a particular scenario can be identified, and all the impacts on a
given process or perspective can be assessed. The listing by scenario will be
used as the source document for developing an audit trail of proposed Needs
S,for the system. The grouping by process will identify all Needs so that solution
designs can be coordinated.

0060
FA 02 0 0H
0r 04r0020 4.40 4j
m0 0o 0.940 )4'0 41' 0)
02 ) 00 c $4
00
0 00
0o. 4)JG)00d)
CjU E-4
H 0 0. 0 -
w-4 4J
"44 0 b 1)-uA10 0 4)(Lm) m. 0 0ul 0 0) Wu 41E
0 i-I H1
0"4 04 00'-444 2
m2 P..4 _
4) ll.0 00r4t94 ~0 ) 0H0 0 r04 0j 4Z
0200~0HC 4) .9-40.9 ~0 -r
A4001
to~ 0 00 00
vi0 41 CO 4 Om4 00w0-H "4 04
NP .0 $404
rq0 0 0440 4.) a-) 4.
.94 .0104.' .~ .04
00
0 40
000.4 r41
U 0 440M

Logistic Management Concept
The heart of a logistics management concept is a description of how
the logistics operations of AFLC are to be managed. This description is
* organized by logistics process and by other considerations. For our initial
sessions, the emphasis is on the strategic level, although some consideration
is given to the directive level and even to the operating level for emergency/
surge actions.
The elements of the descriptions are:
(1) Decisions that must be made to manage the logistics
process/other consideration.
(2) Data needs and analytical capabilities needed to
evaluate alternatives.
(3) General sources for the needed data.
(4) General organizations to implement the decision.
There is no need to include:
(1) The LMS design required to provide the data needs.
(2) Specific organizational units to supply data or
implement decisions.
(3) Detailed requirements and specifications for data
quantities, flows, response times, accuracy, etc.
It is important that the Logistics Management concept provide a basis for
ongoing steps leading to the implementatio-i of an LMS. Omissions might lead
to the need for major modifications during the operation of the LMS. Too
much detail will lead to wasted time and effort in implementing LMS. Unnecessary
elements might lead to unnecessary capabilities built into the LMS. Experience
will be required to strike the optimum balance between too much and too little.
The decisions that must be made are part of a structure that include
decisions all the way from strategic decisions made by the Commander AFLC to-
job assignments made by foreman in the warehouse and maintenance facilities at
the ALCs. These decisions are made by many different people and can only be
-: identified by people at the appropriate levels. Therefore, the complete
logistics management concept cannot be developed in a single session. The
overall series of policy, needs, and requirements sessions will produce a
complete Logistics Management Concept including all three levels. The complete

6
LN concept could be expanded to show the structural relationships among the
decisions.
The complete LM Concept contains some information in addition to the
description of how AFLC is to be managed. The additional information defines
the planning policy (e.g. the planning scenarios, acceptance of the planning
approach) and the implementation policy (e.g. organization, responsibilities,
support for ongoing planning). The LM Concept provides the foundation for
LMS planning.
Policy Planning Results Analysis
The initial analysis of output from this session will be done before
the session adjourns, so that participants will have the opportunity to approve
these efforts as input to the subsequent Needs Sessions. A hierarchical
structuring will be used to trace the future expansion of these inputs at
subsequent levels, and an iterative review process established, since
feedback from lower levels may require further definition of prior concepts.
Some of the techniques being considered for the analysis at this
level include cognitive mapping and relevance treis, which will be discussed
in a later deliverable.
Needs Planning Session
The purpose of the Needs Session is to address the implication of
the selected approaches from the policy sessions on the LAG(s) selected
for analysis as candidates for an "early start".
In order to do so the following inputs are required:
o War Readiness Philosophy in LM planning
. o Impact of the scenarios on LMS processes/perspectives
o The Logistics Management Concept
o Consolidated Guidance War Scenarios
o Battelle developed theme scenarios
o LAG concept understanding
o Bubble chart for area
o Description of topics and associated LAG's.
4 ' - ' -,- . .. " . , - - ' ' ' " . : - . . . . . - . . . . . . . . . ..
. - I ', 3_ " ".' '''' ', 'i ' ... . " ,: .' ' ' ,' "' :, , , " ',".'- '' " ' ' ".

7
Session staff representing AFLC upper management and missions (with
emphasis on staff knowledgeable of the LMS incorporated in the selected LAG)
will use these inputs to define in more detail how to meet upper management's
information needs for managing the selected topics. The perspectives will be
future oriented; that is, they will address how the information needs should
be met so as to provide the information required to manage the functions
incorporated in the selected topics under the conditions described by the
scenarios. The expected output should be a definition of LMS needs that
would be satisfied by a redesign of the LMS incorporated in the associated LAG's.
The specific outputs to be generated include:
o Decision rules resulting from the application
of the LM concept to the selected LAG
o Affirnation or modification of the LAG definition
o A list of interfaces with other LAG's
o Recomrendation of the area of the LAG to be
further developed in the scheduled Requirements
Session(s).
o Contributions to an LMS concept* for specific processes
relatel to topic areas.
Needs Planning Results Analysis
Preliminary documentation of the results of this session must be
. made available to participants in the prior session, those in attendance, and
* those to be attendnlg the related requirements session.
The hierarchical structure begun after the Policy Session will be
. expanded, and effects related to specific scenarios will be coded to maintain
the audit trail.
Some of the techniques considered for this session include the
ICAM Definition Method (IDEF) being used in the Air Force's Integrated
Computer Aided Manufacture (ICAM) program, and the Q Sort Procedure for
prioritizing projects.
* See Attachment Number 1.

8
Group Methods Analysis
A combination of lecture and group participation techniques will be
used to stimulate the development of a futures approach to identifying needs.
UIn order to recommend a format for subsequent meetings, it will be necessary
to evaluate the techniques as to their usefulness.
Some of the factors that will affect the usefulness of the techniques
selected are:
o The individual participant's background and perspectives
e.g., his expectations, familiarity with the technique,
and training or education.
o The make up of the group itself
o The organizational background
o Environmental factors.
All of these will act upon the group process and affect the process outcome.
To measure process outcome, such criteria as the quality of ideas
generated, the quantity of ideas, the time required to complete the process,
the immediate perceived satisfaction of the participants, and the traceability
of the developed logic must be considered.
In addition to the process, the effect of the physical setting, and
the role of the facilitators, will also be evaluated.
The techniques being considered for this area include before and
after attitude testing; a questionnaire comparing the various techniques,
and observations documented by facilitators, observers, and volunteer
participants.
. . . . ...

Attachment Number 1
LMS CONCEPT
The term "LMS Concept" has been used by the AFLC/BCL team for some
time. The term has not yet surrendered to an acceptable definition, nor
consequently to consistent usage. This section is an attempt to provide
at least a basis for definition that will lead to both a complete definition
and consistent usage.
One way of developing a definition is by describing properties
characteristic of a concept or object. In the case of '%MS Concept" we
are interested in defining the functional role of the LMS Concept in the
overall process of evolving new logistics management systems and in describing
how the LMS Concept is portrayed. We also need to define the principles upon
which the LHS Concept is founded and the implications of building upon those
principles. In the following few paragraphs, each of the above properties
will be describei in an attempt to at least bound the definition of the term
"LMS Concept".
Functional Role of the IMS Concept
The LHS Concept is a framework for portraying how logistics processes
are managed. The framework has two basic dimensions; management level and
logistics process area. This is, of course, the framework developed for
developing Logical Application Groups (LAGs). This framework allows one to
portray the management system functions and information flows necessary to
manage logistics functions at each level of management.
The content of the framework can be varied. The framework can
be used to portray graphically the "existing" LMS concept. To do this tbe
aggregation chart is arrayed across the appropriate levels of management.
K- It is already ordered by logistics process. Such a portrayal with today's
set of LMS will reveal considerable sparcity at the upper management levels.
I%
4-
[- .-.-..-..-..- . . . . . . . . . . . . . . . . . .

2
This portrayal also provides the basis for identifying logic
clusters and LAGs. These elements are the basis for synthesizing new management
systems to replace or supplement existing LMS. The gaps revealed in the
framework indicate process areas for which management does not have current
visibility through LMS.
Another way of filling in the framework is to portray various types
of management systems -- automated, manual and informal by developing each
type separately. Through overlays, the interactions amongst different types
of systems can be graphically demonstrated and consideration given to changing
from one type to another in the future.
While the framework provides the basis for portraying LMS changes,
and indeed can be developed to portray in total how the set of LMS would
interact some yeirs in the future, it also provides the basis for evaluating
the impact of c&anges that are proposed from outside of a centralized LMS
planning activity (i.e. from bottom-up requests for LMS). The effects of
such proposed changes on both the existing LMS concept and the planned future
concept can be readily evaluated because, using the framework, the interactions
amongst LMS are visible. The impact of proposed changes on both current and
planned systems ian be readily seen by drawing the management interface
boundaries and examining the impacts of proposed LMS changes. In particular,
changes that change LAG boundaries are notable. In effect the changes imply
changes in the evaluation of the criteria upon which the LAGs have been
developed. Such changes must be carefully examined to determine whether they
are really warranted. The value of the framework is that it makes visible
the changes and their implications. Thus it provides the basis for managing
configuration control of the set of LMS and consequently of the LMS concept
itself. In this sense the LMS concept is both self-regulating and self-updating.
Implicit in the use of the LMS concept is a commitment on the part
of AFLC and Air Staff to continually update the set of LMS and their supporting
hardware. This process may require many years from planning for renewal of
a particular LMS until that LMS comes up for renewal again. This must be
clearly understood and accepted. Application of the concept also implies

that all LHS changes must be consistent with the LMS concept. This
is fundamental :o configuration control of the set of LMS. Nevertheless,
it implies that new organizations may need to be established or existing
organizational roles expanded to assure a consistent process of planning,
conceptualization, design, development and implementation of LMS.
Careful consideration must be given to designing the organizations
responsible for the process steps suggested above. Clearly, LO, MA, AC, SC
and XR should all be involved. The question of how their participation can
be smoothly developed in coordination with their existing functional respon-
sibilities merits study.
Another aspect of the LMS concept and its use is its relation to
A-109 and other regulations that impact system development. The LMS concept
provides the fo-indation for evaluating and spinning off LMS projects. The
planning leading to an LMS project definition is viewed as prior to the
system development steps defined under A-109. The output of the planning would
lead to a project definition suitable for initiating the A-109 process.
Principles Underlying L1S Concept
The LM3 concept is based on the principles that: (1) the AFLC
logistics system consists of processes that are fundamental to logistics and
(2) the management structure of AFLC is hierarchical in nature. That is,
the basic dimensions of the framework are assumed to be fundamental and complete.
It is also assumed that planning activities underway at both XRX
and XRB and the products of the Policy Planning Session will lead to an
accepted "Logistics Management (LM) Concept". This is distinct from an LMS
concept but provides the foundation for it. The LM concept includes the
definition of planning policy (e.g. acceptable planning scenarios, committment
to an evolutionary, incremental process of LS renewal, etc.), definition of
management information needs under various AFLC operating conditions ranging
from peace to full wartime operations, definition of organizational roles,
authorities, and responsibilities in LMS development, and committment of
the resources required to support a permanently continuing process of 124S
evolution.
*8

4
The LHS concept is also based on the principle that it is only
one element, albeit a controlling one, among the elements necessary to evolve
new or updated LHS. The output of the LMS concept is definition of unfulfilled
management needs or partially fulfilled needs requiring augmentation. This
" ;output feeds the elements of LMS requirements definition, LMS design,
Data System design and LMS implementation in terms of ADPE/T conceptualization,
design and acquisition. The result is new or augmented LMS that meet those
* *' management needs on the most appropriate ADPE/T equipment.
. .. .

I