ACUTE AND EARLY CHRONIC RESPONSES TO...
62
Thesis for Doctoral degree, Östersund 2010 ACUTE AND EARLY CHRONIC RESPONSES TO RESISTANCE EXERCISE USING FLYWHEEL OR WEIGHTS Lena Norrbrand Supervisors: Per Tesch Ola Eiken Department of Health Sciences Mid Sweden University, SE‐831 25 Östersund, Sweden ISSN 1652‐893X, Mid Sweden University Doctoral Thesis 89 ISBN 978‐91‐86073‐84‐8
Transcript of ACUTE AND EARLY CHRONIC RESPONSES TO...

Thesis for Doctoral degree, Östersund 2010
ACUTE AND EARLY CHRONIC RESPONSES
TO RESISTANCE EXERCISE USING
FLYWHEEL OR WEIGHTS
Lena Norrbrand
Supervisors: Per Tesch Ola Eiken
Department of Health Sciences Mid Sweden University, SE‐831 25 Östersund, Sweden
ISSN 1652‐893X, Mid Sweden University Doctoral Thesis 89
ISBN 978‐91‐86073‐84‐8

2010
Gårdsvägen 4, 169 70 Solna
i
Akademisk avhandling som med tillstånd av Mittuniversitetet i Östersund framläggs till offentlig granskning för avläggande av doktorsexamen torsdagen den 2 september 2010, klockan 10.30 i sal F 229, Mittuniversitetet Östersund. Seminariet kommer att hållas på engelska.
ACUTE AND EARLY CHRONIC RESPONSES TO RESISTANCE EXERCISE USING
FLYWHEEL OR WEIGHTS
Lena Norrbrand © Lena Norrbrand, 2010 Department of Health Sciences Mid Sweden University SE‐831 25 Östersund Sweden Telephone: +46 (0)771‐975 000 Printed by

ii
To Anders and Tove

iii

iv
ABSTRACT
Resistance exercise using weights typically offers constant external load during coupled shortening (concentric) and lengthening (eccentric) muscle actions in sets of consecutive repetitions until failure. However, the constant external load and the inherent capability of skeletal muscle to produce greater force in the eccentric compared with the concentric action, would infer that most actions are executed with incomplete motor unit involvement. In contrast, use of the inertia of flywheels to generate resistance allows for maximal voluntary force to be produced throughout the concentric action, and for brief episodes of greater eccentric than concentric loading, i.e. “eccentric overload”. Thus, it was hypothesized that acute flywheel resistance exercise would induce greater motor unit and muscle use, and subsequent fatigue, compared with traditional weight stack/free weight resistance exercise. Furthermore, it was hypothesized that flywheel training would induce more robust neuromuscular adaptations compared with training using weights.
A total of 43 trained and untrained men were investigated in these studies. Knee extensor muscle activation, fatigue response and muscle use were assessed during exercises by recording electromyographic signals and by means of functional magnetic resonance imaging, respectively. Flywheel resistance exercise provoked maximal or near maximal muscle activation from the first repetition, induced robust fatigue, and prompted more substantial motor unit and muscle use than weight stack/free weight resistance exercise in both novice and resistance trained men. Both prior to and following five weeks of unilateral knee extension training, the eccentric muscle activation was greater with flywheel than weight stack training. Furthermore, weight stack training generated greater increases of dynamic strength and neural adaptations, while flywheel training generated more prominent hypertrophy of individual quadriceps muscles and greater improvement of maximal isometric strength.
Hence, due to the preferential metabolic cost of the concentric rather than eccentric actions, the maximal activation through the entire range of the concentric action within each repetition of a set during flywheel resistance exercise probably evoked the marked fatigue, and prompted more substantial muscle use than resistance exercise using weights. Furthermore, while any cause‐effect relationship remains to be determined, results of the present study suggest that brief episodes of “eccentric overload” amplify muscular adaptations following concentric‐eccentric resistance training.
Keywords: electromyography, flywheel, magnetic resonance imaging, resistance exercise

v

vi
SAMMANDRAG
Traditionell styrketräning med vikter innebär upprepat muskelarbete till uttröttning under konstant yttre belastning. Den konstanta yttre belastningen tillsammans med skelettmuskelns inneboende förmåga att skapa större kraft under förlängning (excentriskt) jämfört med förkortning (koncentriskt), gör att styrketräning med vikter medför ofullständig aktiveringen av motorenheter under de flesta aktionerna i ett set. En svänghjulsergometer däremot, skapar motstånd genom att använda det inre tröghetsmomentet i ett svänghjul, och därigenom möjliggörs maximal belastning genom hela den koncentriska aktionen och dessutom kortvariga moment av högre belastning excentriskt jämfört med koncentriskt, s.k. ”eccentric overload”. Följaktligen skulle träning med svänghjul potentiellt kunna framkalla högre akut muskelaktivering och muskelanvändning, samt stor uttröttning, jämfört med traditionell styrketräning. Dessutom skulle träning med svänghjul möjligen kunna resultera i större neuromuskulär anpassning jämfört med traditionell styrketräning. Sammanlagt 43 tränade eller tidigare otränade män undersöktes i dessa studier.
För att utvärdera akut muskelaktivering, trötthetssymtom och muskelanvändning hos knäextensorerna vid upprepat koncentriskt‐excentriskt arbete registrerades elektromyografiska signaler och funktionell magnetresonanstomografi. Hos både nybörjare och styrketränade män, så framkallade träning med svänghjulsergo‐meter maximal eller nära maximal muskelaktivering från första repetitionen, och därmed stor uttröttning, samt en högre muskelaktivering och muskelanvändning jämfört med träning i knäsparksmaskin med viktmagasin/fria vikter. I synnerhet var det en högre excentrisk muskelaktivering vid träning med svänghjul jämfört med vikter. Fem veckors träning i knäsparksmaskin med viktmagasin genererade större ökning av dynamisk styrka och neuronal adaptation, medan svänghjulsträningen resulterade i större muskulär anpassning, d.v.s. ökad volym hos individuella knäextensorer och förbättrad maximal isometrisk styrka. På grund av det högre metabola kravet under de koncentriska jämfört med
excentriska aktionerna, var det troligen den nära maximala aktiveringen genom hela den koncentriska aktionen med svänghjulsträning som framkallade den stora uttröttningen och högre muskelanvändningen jämfört med traditionell styrketräning. Trots att orsakssambandet återstår att bevisa, så stöder denna studie att styrketräning med kortvariga moment av ”eccentric overload” förstärker den muskulära anpassningen till följd av koncentrisk‐excentrisk styrketräning. Nyckelord: elektromyografi, magnetresonanstomografi, styrketräning, svänghjul

vii
TABLE OF CONTENTS
ABSTRACT ...................................................................................................................... IV
SAMMANDRAG............................................................................................................VI
LIST OF PAPERS ..............................................................................................................X
1. INTRODUCTION .....................................................................................................1
1.1. BACKGROUND OF RESISTANCE EXERCISE ................................................................1 1.2. CONCENTRIC AND ECCENTRIC ACTIONS ..................................................................1 1.3. ACUTE RESPONSES TO RESISTANCE EXERCISE .........................................................2
1.3.1. Motor unit recruitment and muscle use assessed by EMG and functional MRI.................................................................................................................2
1.3.2. Neuromuscular fatigue ...................................................................................3 1.3.3. Cellular signalling for muscle hypertrophy....................................................3
1.4. EARLY CHRONIC RESPONSES TO RESISTANCE TRAINING..........................................4 1.4.1. Strength and neural adaptations ....................................................................4 1.4.2. Hypertrophy ...................................................................................................4
1.5. LOADING DURING RESISTANCE EXERCISE................................................................5 1.5.1. Loading during weight training......................................................................5 1.5.1. Loading during flywheel training...................................................................5
3. AIMS AND HYPOTHESES .....................................................................................7
3.1. AIMS .......................................................................................................................7 3.2. HYPOTHESES...........................................................................................................7
4. METHODS..................................................................................................................8
4.1. SUBJECTS ................................................................................................................8 4.2. STUDY DESIGN, TEST AND TRAINING PROTOCOL .....................................................8 4.3. RESISTANCE EXERCISE DEVICES, FORCE AND KNEE JOINT ANGLE..........................13
4.3.1. Flywheel training devices.............................................................................13 4.3.2. Weight training devices ................................................................................15
4.4. ELECTROMYOGRAPHY ..........................................................................................17 4.4.1. Multichannel EMG.......................................................................................17 4.4.2. Bipolar EMG................................................................................................18
4.5. MAGNETIC RESONANCE IMAGING.........................................................................19 4.5.1. MRI for assessment of muscle volume..........................................................19

viii
4.5.1. Functional MRI for assessment of muscle involvement................................19 4.6. STATISTICS...........................................................................................................20
5. RESULTS...................................................................................................................21
5.1. STUDY I ................................................................................................................21 5.2. STUDY II ...............................................................................................................21 5.3. STUDY III..............................................................................................................24 5.4. STUDY IV..............................................................................................................28
6. DISCUSSION...........................................................................................................31
6.1. PRACTICAL IMPLICATIONS ....................................................................................34 6.2. SUMMARY.............................................................................................................35
7. ACKNOWLEDGEMENTS.....................................................................................36
8. REFERENCES...........................................................................................................39

ix

x
LIST OF PAPERS
This thesis is mainly based on the following four papers, herein referred to by their Roman numerals: I Pozzo M, Alkner B, Norrbrand L, Farina D, Tesch PA, Muscle‐fiber
conduction velocity during concentric and eccentric actions on a flywheel exercise device. Muscle Nerve 34: 169‐177, 2006.
II Norrbrand L, Fluckey JD, Pozzo M, Tesch PA, Resistance training
using eccentric overload induces early adaptations in skeletal muscle size. Eur J Appl Physiol 102: 271‐281, 2008.
III Norrbrand L, Pozzo M, Tesch PA, Flywheel resistance training calls
for greater eccentric muscle activation than weight training. Eur J Appl Physiol, At press.
IV Norrbrand L, Tous Fajardo J, Vargas R, Tesch PA, Quadriceps
muscle use in the flywheel and barbell squat. Aviat Space Environ Med, In review.
In addition, some unpublished results are included.

xi
LIST OF ABBREVIATIONS AND DICTIONARY ARV Average rectified value BS Barbell squat CON Concentric, shortening muscle action CSA Cross‐sectional area CV Conduction velocity ECC Eccentric, lengthening muscle action EMG Electromyography FS Flywheel squat FW Flywheel / Flywheel training iMNF Instantaneous mean power spectral frequency MRI Magnetic resonance imaging MU Motor unit MVC Maximal voluntary contraction/maximal isometric strength RF M. rectus femoris RFD Rate of force development RMS Root mean square ROM Range of motion T2 Transverse relaxation time VI M. vastus intermedius VL M. vastus lateralis VM M. vastus medialis WS Weight stack / Weight stack training 1 RM One repetition maximum; the maximum amount of weight
that can be lifted during one repetition Isoinertial action A dynamic action against constant inertia Isokinetic action A dynamic action at constant velocity Isometric action An action where neither joint angle nor muscle length
changes Isotonic action A dynamic action against a constant external load
1
1. INTRODUCTION
1.1. Background of resistance exercise Chronic resistance exercise, sometimes referred to as strength training or
weight training, promotes increases in muscle strength, power and size [1‐4], and is employed to enhance athletic performance [5‐7]. Typically, resistance exercise is performed with coupled shortening (concentric) and lengthening (eccentric) muscle actions, whiles the number of sets and repetitions vary depending on the specific aim of the training. Thus, resistance exercises for athletes vary from ballistic exercises [8] to improve explosive strength for e.g. track and field athletes, to the extremely heavy loading often used by power lifters [9]. In the past decades weight training has shown remarkable gain in popularity among the general population, by improving functional strength and benefiting health in recreationally active for general fitness and health promotion [10, 11], sedentary people [12, 13], and elderly [14‐16], and as an adjunct in injury prevention and rehabilitation programs [17, 18].
Resistance exercise has been practiced for centuries [19], and despite the pioneer scientific work by DeLorme and Watkins more than 60 years ago [20, 21], controversy still prevails regarding e.g. training loads, number of sets and repetitions, rest periods etc, to achieve an optimized training response [2]. It is generally held that neural adaptations prevail during the first weeks of resistance training programs [22‐24] with hypertrophy evident after a few weeks of training [25‐28], gradually contributing to improved strength and performance [24]. Cellular signalling resulting in increased protein synthesis may however occur after a single bout of resistance exercise [29‐31], inferring that the hypertrophic process could be initiated in response to the very first training session. It therefore appears likely, that if muscles are exposed to an optimized training stimulus, hypertrophy may contribute more to the gain of strength than what is generally held.
1.2. Concentric and eccentric actions Inherently skeletal muscle possesses the capability to produce greater force in
eccentric (ECC) than concentric (CON) actions [32‐34]. This is in part due to utilization of elastic energy stored in the cross‐bridges formed by actin and myosin filaments of active muscle fibers during stretch [34, 35]. As a result the metabolic cost is lower [36‐38], and thus mechanical efficiency higher [36, 37, 39] during ECC than CON actions. Because ECC and CON actions potentially offers diverse stimulus dictating hypertrophy, neural drive and protein metabolism (see below), it is generally agreed that resistance exercise should comprise both CON and ECC
2
actions [40]. It should also be recalled that most daily activities and motions, e.g., walking, climbing and lifting, are carried out using coupled CON and ECC muscle actions.
1.3. Acute responses to resistance exercise 1.3.1. Motor unit recruitment and muscle use assessed by EMG and
functional MRI According to the size principle [41], smaller/slower motor units (MUs) with
lower twitch force are recruited before larger/faster MUs in response to increased force demand. Hence, any increase in voluntary force is brought about by recruiting additional MUs and/or increasing discharge rate of already recruited MUs [24, 42]. However, exceptions to this general “rule” have been proposed [43], suggesting that performance of ECC actions may call for a unique recruitment strategy [44‐47]. Thus, while remaining a controversial issue, reports suggest that there is selective recruitment of, and greater reliance upon large/fast MUs innervating Type II fibers, during ECC actions [44, 46‐48].
The combined result of recruitment and discharge rate of MUs can be assessed by electromyography (EMG), such that transmission of the action potential travelling along the muscle fiber membrane could be recorded. When progressively increasing force, any increases in discharge rate and/or MU recruitment appear as augmented EMG amplitude [24, 42] and frequency [49]. These signals are typically recorded by means of bipolar electrodes applied on the surface of the muscle belly. Novel multichannel electrode EMG technique in addition [50], allows for the delay of signals between electrodes to be determined, such that action potential propagation along the fiber membrane and conduction velocity can be assessed. Intense exercise induces intramuscular metabolic changes [51, 52] as well as changes in muscle activation [53‐55], impacting amplitude, frequency and conduction velocity of the EMG signals [56]. Thus, the multichannel EMG technique is suitable for studies of muscular fatigue phenomena [50].
When assessing muscle involvement by means of functional magnetic resonance imaging (MRI), the accumulation of metabolic by‐products initiates osmotically driven fluid shifts within the muscle. This effect is believed to cause the acute increase in contrast shift, signal intensity and transverse relaxation time (T2) in exercising muscles [57‐59]. Due to the low energy cost of ECC actions [36‐38], any exercise‐induced increase in T2 appears to correlate mainly with the intensity of the CON actions [60, 61]. Functional MRI therefore allows for evaluation of individual muscle involvement [57‐59, 62]. Similarly, the EMG amplitude correlates with the intensity of the exercise [46, 60], and is typically higher during CON than ECC actions [36, 38, 44, 46, 63‐65], inferring greater MU involvement during shortening than lengthening actions [36, 44, 65].
3
From the above, it should be evident that EMG and functional MRI could serve as complementary methodologies to assess muscle involvement during contractile activity. Whereas EMG allows to distinguish between CON and ECC actions as well as differences in muscle involvement throughout the range of the action, functional MRI measures overall muscle use, and, unlike the surface EMG technique, involvement of deep, not only superficial muscles. Functional MRI however shows variability between subjects, and is therefore only suitable for intra‐subject comparisons [58]. In addition to inter‐subject variability, surface EMG also involves some critical methodological concerns to be controlled for e.g. proper adhesion and contact, positioning with regard to the innervation zone, and repositioning of electrodes between sessions [53, 66]. Given these limitations, EMG amplitude is typically normalized to the EMG amplitude evoked by a standardized maximal isometric task. 1.3.2. Neuromuscular fatigue
Neuromuscular fatigue appears to be of either central or peripheral origin, and depending on e.g. type of action, duration and force level, the mechanisms responsible for fatigue may vary [52, 67]. Among candidate mechanisms to explain central fatigue mechanisms are decreased neural drive [67, 68] and motor neuron inhibition [67]. Peripheral mechanisms explaining fatigue include, e.g., increased concentration of inorganic phosphate, and decreased calcium ion sensitivity and release [51, 52], while impaired transmission of the action potential along the membrane [69] is due to accumulation of extracellular potassium [51, 70].
While performing a sustained submaximal isometric action, decreases in conduction velocity and EMG frequency spectrum correlate [71, 72], and it appears the reduced conduction velocity attenuates EMG frequency spectrum [72‐74]. Whereas a myriad of studies have reported EMG responses during fatiguing sustained isometric actions [72‐79], few investigations have explored neuromuscular fatigue by means of EMG during dynamic actions [54, 55, 80, 81]. Since trains of maximal CON actions evoke markedly greater force decline and changes in EMG indices of fatigue than ECC actions [81], the fatigue response during coupled CON‐ECC actions appears to be induced preferentially by the CON actions. Thus, the fatigue response during maximal coupled CON‐ECC actions, and particularly the relationship between EMG frequency spectrum and conduction velocity, remains to be studied. 1.3.3. Cellular signalling for muscle hypertrophy
The net increase in contractile protein content following chronic resistance exercise is modulated through increased protein synthesis and reduced protein degradation [82]. Cellular signalling for hypertrophy has been reported after a

4
single bout of resistance exercise [29‐31], and protein synthesis increases multi‐fold within hours following a resistance exercise bout [29, 30].
Forceful ECC actions may cause damage to the structural integrity of muscle fibers. For example, ECC actions provoke Z‐line streaming [83‐85], and greater rate of myofibril disruption compared with CON actions [83, 86, 87]. This ultrastructural damage following ECC actions appears to be part of the remodelling process of the muscle fibril [88]. In fact, human and rat muscles subjected to ECC exercise exhibited both a greater rate of myofibril protein synthesis and amplified cellular signalling for protein synthesis than muscles which had performed CON actions [30, 89, 90]. Collectively these results suggest that the ECC action plays a more significant role than the CON action as a stimulus for muscle hypertrophy. 1.4. Early chronic responses to resistance training 1.4.1. Strength and neural adaptations
Following strength training programs, the increase in maximal strength typically exceeds the accompanied rate of hypertrophy [25, 26, 91]. This response has been attributed to neural adaptations, i.e. enhanced ability to coordinate muscle agonists [42, 92, 93], reduced inhibition [63], and/or increased ability for recruitment [25, 26, 42, 92, 94] of high threshold fast/large MUs [24]. According to the concept of specificity [42, 95], strength increases are most evident in the particular training mode. For example, dynamic strength increases more compared with isometric strength after dynamic resistance exercise [93, 96, 97]. Similarly, changes in strength are most apparent at the specific joint angle used during training [98]. As a result of neural adaptations a given force could be produced with less muscle involvement [23, 92, 96, 99, 100].
The greater capability to produce force during the ECC action allows for greater loading during ECC than CON actions [44, 81, 101] in a given exercise mode. While this knowledge has been applied as a part of training by athletes for decades, only a few studies have assessed the efficacy of chronic training using ECC overload. Results show that training‐specific strength [101‐104], isometric strength [101], and jump height [105] increase more after ECC overload compared with constant load during coupled CON‐ECC actions [102, 104‐106] or CON actions only [101, 103]. Altogether, this would suggest that neural adaptations might be more augmented with chronic ECC overload training than training using a constant load. 1.4.2. Hypertrophy
Hypertrophy evident after resistance training [104, 107] is reflected in an increased cross‐sectional area (CSA) of whole muscle or individual muscle fibers.

5
The number of sarcomeres in parallel and in series increases [108, 109], an effect which appears to improve both force production and ability to withstand stress [108]. Moreover, the subsequent increase in fiber pennation angle [110] may contribute to improved neuromuscular efficiency [96].
High mechanical loading and the performance of ECC actions are considered crucial features for optimizing exercise induced hypertrophy [27, 111, 112]. Although some contradictory data have been reported [113, 114], several studies have shown that ECC training induces a greater rate of hypertrophy than CON training in humans [101, 115], and rats [89, 90]. Typically, the CSA of particularly the Type II fibers increase following resistance training [27, 99, 107, 115‐119], and hypertrophy of Type II fibers appear to be preferentially enhanced by ECC actions [27, 115]. Indications of selective recruitment of Type II fibers during ECC actions [44, 46‐48], along with recent findings of selective cellular signalling for hypertrophy in Type II fibers following an acute bout of maximal ECC actions [120], may explain the more substantial hypertrophy noted following ECC resistance training. The reports on hypertrophy following ECC overload and constant load resistance training are scarce and inconclusive [102, 105, 121]. However, the more substantial cellular signalling, myofibrillar disruption, and hypertrophy with ECC than CON actions, would infer that, by employing ECC overload processes stimulating protein synthesis are augmented. 1.5. Loading during resistance exercise 1.5.1. Loading during weight training
Traditional weight training, using coupled CON and ECC actions, employ constant external load, i.e. isotonic loading. Thus, with increasing exertion throughout each set, maximal loading is only offered in the very last repetition, resulting in failure to raise the load. In addition, mainly due to variations in the lever during movement about the joint, the ability to lift a weight in the CON action is limited by the weakest position within the CON range of motion (ROM), i.e. “sticking‐point”. Given that failure is joint angle specific, and that greater force can be produced in the ECC action, these infer that all ECC actions and the major portion of almost all CON actions are executed with a load that is far from maximal. 1.5.1. Loading during flywheel training
The concept of using the inertia of spinning flywheels to generate resistance, used by A.W. Hill in the early 20’s [122], was introduced to offer exercise for space travellers [123, 124], subjected to 0g environment. In contrast to isotonic loading, isoinertial loading offers maximal voluntary force to be produced from the first repetition and force decay throughout the set [124]. The flywheel device allows for

6
maximal CON force throughout the ROM, and brief episodes of greater ECC than CON force, i.e. ECC overload. The more kinetic energy that is imparted in the flywheel(s) during the CON action, the more force must be applied in the ECC action to bring the flywheel(s) to a stop. Hence, while total work for the CON and ECC actions are the same, the peak force of the ECC actions might exceed that of CON actions depending on the strategy to apply force throughout the ROM. Thus, in traditional weight training most CON and all ECC actions within a set,
does not require maximal effort, inferring that MU recruitment and muscle use may not be complete. In contrast, because flywheel exercise allows for maximal force throughout the CON action and brief episodes of ECC overload, this particular loading feature may potentially call for near maximal motor unit recruitment and muscle use. Hence, isoinertial resistance exercise may induce more manifest fatigue response during acute resistance exercise, and more significant training adaptations.

7
3. AIMS AND HYPOTHESES
3.1. Aims With use of flywheel loading, the overall aim of this thesis was to explore acute
effects and early training adaptations of resistance exercise using maximal effort from the first repetition of a set, and using greater loading in the ECC than CON action. Because this unique loading feature potentially has an additional effect on the training response, results were compared with adaptations following traditional weight training. Thus, acute responses and chronic training adaptations were compared between the two loading paradigms in the knee extension (Study I, II, III) and squat (Study IV) exercises. More specifically the aims of this thesis were threefold: (i) To describe the fatigue response during dynamic actions performed with
isoinertial and isotonic loading (Study I, III and IV). (ii) To compare muscle involvement between the isoinertial and isotonic loading
during acute resistance exercise (Study III and IV). (iii) To compare training adaptations with regard to performance, neuromuscular
function and muscle size, following 5 weeks of resistance exercise, employing either isoinertial or isotonic loading (Study II and III).
3.2. Hypotheses
Given that flywheel resistance exercise allows for maximal voluntary force to be produced throughout any CON action, and brief episodes of ECC overload, it was hypothesized that: (i) Isoinertial loading would promote more substantial MU recruitment and
muscle use compared with isotonic loading using weights, and as a result, also induce manifest fatigue during acute resistance exercise.
(ii) Isoinertial training would generate more robust neuromuscular adaptations compared with isotonic training.

8
4. METHODS
4.1. Subjects Forty‐three men, with no previous history of lower limb pathology, or known
neuromuscular or cardiovascular disease, volunteered for these studies (Table 1). Participants in Study I‐III had none or limited experience of lower limb resistance training. Subjects in Study IV were resistance trained with a 10 repetition maximum (RM) in the barbell squat of 138±28 kg. Grp FW (Study II) was a subgroup from an earlier reported study [125]. Subjects of Grp WS were examined in both Study II and III. Subjects received information about the study protocol before written informed consent was obtained. The study protocols were approved by the Ethics Committee at the Karolinska Institutet, Stockholm (Study I‐IV) and the Institutional Review Board at the University of Arkansas for Medical Sciences, Little Rock, AR (Study II). Table 1. Age, height, body mass and training background of subjects participating in Study I‐IV. n Age
(yrs) Height (cm)
Body mass (kg)
Training background
I FW 9 30 (21‐35) 182±4 84±10 Not resistance trained II
Grp WS Grp FW
8 7
39 (32‐54) 39 (29‐53)
187±7 178±6
95±16 86±8
Not resistance trained
III
Grp WS Grp FW Subgroup
# 9 6
# 39 (30‐46) 38 (33‐50)
# 184±9 188±8
# 85±14 99±17
Not resistance trained
IV FS/BS Subgroup
10 4
31 (24‐34) 29 (24‐34)
179±8 179±7
88±14 84±8
>10 yrs of resistance training
Values are mean±SD or range. FW: flywheel knee extension; WS: weight stack knee extension; FS: flywheel squat; BS: barbell squat. Subgroups performed acute tests using both the flywheel device and weight stack machine/free weights. # Results from the same subjects are reported in Study II and III. 4.2. Study design, test and training protocol
Knee extension exercise was performed in Study I‐III. Subjects executed the squat exercise in Study IV. Exercise and test protocols for Study I‐IV are summarized in Table 2 (for details see below). Prior to any test, familiarization sessions with the equipment and test procedures were executed. No subject failed to comply with the prescribed tests and training sessions. A standardized warm‐up up with progressively increased effort was carried out prior to any test or training

9
session. Verbal encouragement was given to ensure maximal effort and proper technique during testing and training. 4.2.1.1. Maximal voluntary contraction (MVC)
To assess non training‐specific maximal strength and maximal muscle activity, maximal voluntary isometric knee extensor force (maximal voluntary contraction; MVC) along with EMG (maximal EMG amplitude; see below) was determined. With hip angle at ∼90° the lever arm was fixed at either 90 or 120° knee angle in the FW knee extension device (Study I‐III, Fig. 1). While grasping the handlebars at least 2 maximal isometric actions, intervened by 1 min rest, were performed to assess MVC. If there was >5% difference in maximal force across the two trials, the subject was asked to perform additional attempt(s). In Study I‐III, the highest force, averaged over a one sec window, showing a steady force level was considered MVC and used to define maximal EMG. In Study IV, the MVC´s were performed in the YoYo Multi Gym, at 90° knee angle. The highest EMG amplitude, averaged over a 3 sec window, was used to determine maximal EMG.

10
Table 2. Test and training protocols, including outcome parameters, of Study I‐IV.
Study Time of test Test protocol Variables I FW Test 1 and 2 MVC
1 x 30 R with FW EMG Force Knee joint angle
II Grp FW Grp WS#
5 wk training program
12 sessions, 4 x 7 R with FW or WS
Force/Training load Knee joint angle
MRI Muscle volume
Pre and post training MVC
4 x 7 R with FW or WS Force/Training load Knee joint angle
III Grp FW Grp WS#
5 wk training program
12 sessions, 4 x 7 R with FW or WS
Force/Training load Knee joint angle
Pre and post training
MVC 4 x 7 repetitions with FW or WS
EMG Force/Training load Knee joint angle
Subgroup Acute test
MVC 2 x 7 R with FW and WS
EMG Force/Training load Knee joint angle
IV FS/BS Functional MRI Signal intensity / T2
Test 1 and 2 MVC
5 x 10 repetitions with FS / BS
EMG Force Knee joint angle
Subgroup Acute test
MVC 2 x 10 R with FS and BS
EMG Force Knee joint angle
BS: barbell squat; CON: concentric; ECC: eccentric; EMG; electromyography; FS: flywheel squat; FW: flywheel knee extension; MRI: Magnetic Resonance Imaging; MVC: maximal voluntary contraction; R: repetitions; T2: transverse relaxation time; WS: weight stack knee extension. # Results from the same subjects are reported in Study II and III. 4.2.1.2. Study I
Nine healthy men performed 30 unilateral CON‐ECC actions, while seated in the FW knee extension device. To assess the fatigue response, multichannel surface EMG signals (see below) were recorded from mm. vastus lateralis (VL) and vastus medialis (VM). The average rectified value (ARV), instantaneous mean power spectral frequency (iMNF), and conduction velocity (CV) were estimated from the sampled 8 channel EMG signals. The same experimental protocol was repeated on two non‐consecutive days.

11
4.2.1.3. Study II Two groups of men with comparable physical characteristics and training
history were subjected to almost identical resistance exercise protocols (e.g., duration, frequency, sets and repetitions) isolating and targeting the quadriceps muscle group. The 5‐wk training protocol comprised unilateral CON‐ECC knee extensions using either a flywheel device (grp FW, n=7, Fig. 1) or a weight stack machine (grp WS, n=8, Fig. 3). Training was performed two (wk 1, 3 and 5) or three (wk 2 and 4) times weekly. Each session consisted of or aimed at four sets of seven maximal, CON‐ECC knee extensions using the left limb. In grp FW, coupled actions were performed with a repetition cycle of about 3 s, with the CON and ECC action each lasting about 1.5 s. Similarly, in grp WS, the repetition cycle was about 3 s; and the CON and ECC actions were about 1 and 2 s, respectively. Individual weights were chosen to result in failure to lift and control lowering the weight with seven repetitions. In order to control for ROM, the ECC‐CON turning point for grp WS was set to the same angle as used for grp FW. Sets were interspersed by 2 min rest periods. Training load/force production was measured during every training session. Prior to and at completion of the training period, quadriceps muscle volume was assessed by means of MRI (see below), and MVC at 90 and 120° knee joint angle were tested. In addition, training specific strength was tested, i.e. grp WS performed 4 x 7 RM in the WS device, and grp FW executed 4 x 7 maximal repetitions in the FW device. In grp FW, CON and ECC force was averaged over a 30° window (5° above the ECC‐CON transition angle). Both limbs were tested in a revised randomized order across the subjects. 4.2.1.4. Study III
This study had a similar design and training protocol as Study II (see above). Prior to and at completion of the training period, grp FW (n=9) and grp WS (n=8) completed tests for knee extensor MVC at 120° knee joint angle, and training specific strength in either the FW device or the WS device. CON and ECC force was averaged over the entire ROM. Root mean square EMG (EMGRMS) was assessed by multichannel EMG (described below) from the trained limb during MVC´s and training specific actions. To validate EMG data from the two training groups, bipolar EMG (described below) was assessed from six subjects, who executed an additional test on a separate day prior to the training period, performing MVC´s at 120° knee joint angle and two maximal sets in either exercise device. The set with the greatest overall normalized EMG was chosen for comparison between exercise modes. 4.2.1.5. Study IV
Ten resistance trained subjects performed three MVC´s followed by 5 sets of 10 RM of squat exercises using either a flywheel device (FS, Fig. 2) or a traditional

12
barbell (BS, Fig. 4) with weights on separate days one week apart, starting with either the flywheel or the free weight exercises in a randomized order. Following a warm‐up consisting of two sets of moderate intensity squats, subjects performed three MVC´s at 90° knee angle in a YoYo Multi Gym (see below). This was followed by 5 sets of 10 RM of either FS or BS with 3 min rest between sets. Quadriceps muscle use was assessed by means of functional MRI scans, acquiring a dual echo sequence prior to and after finishing the exercise (see below). Images obtained were analyzed by measuring average signal intensity and calculating T2. Force, knee joint angle, linear displacement and EMGRMS from the three superficial quadriceps muscles were recorded during exercises. Force was averaged over the entire CON and ECC ROM. To validate EMG data, a subsample of four subjects executed an additional test on a separate day, performing warm‐up, MVC´s and two maximal sets in both exercise devices.

13
4.3. Resistance exercise devices, force and knee joint angle 4.3.1. Flywheel training devices
Tests and FW training in Study I, II and III were performed in a seated knee extension flywheel device (YoYo® Technology Inc., Stockholm, Sweden), equipped with a 4.2 kg (moment inertia 0.11 kg·m2) flywheel (Fig. 1). While seated and slightly reclined and using back support (hip angle 90°) and restraint, the trainee pushes against a cross‐bar mounted at the distal end of a pivoting moment arm, which rotation axis is aligned with the knee joint. From a starting position of about 80° knee angle (180°=full knee extension), flywheel rotation is initiated through the pull of a strap anchored to the flywheel shaft and the distal part of the lever arm and looping around its curved cam. The strap unwinds off the shaft and energy is imparted to the flywheel in the CON action. Once the pushing concentric phase is completed at about 165° knee angle, the strap rewinds by virtue of the kinetic energy of the flywheel and thus, pulls the lever arm back, and the trainee then executes an ECC action while trying to resist. The FW device is equipped with a force sensor (Model 276A, K Toyo, Seoul, Korea) to measure the force developed by the subject. A potentiometer mounted on the lever arm measures the knee joint angle (Study I and II). In Study III, knee joint angle was measured using an electrogoniometer [124] fixed about the knee joint.
Figure 1. Unilateral knee extension performed using flywheel device.

14
In Study IV the squat was performed using a YoYo Multi Gym (YoYo® Technology Inc., Stockholm, Sweden) equipped with two 2.7 kg flywheels with a moment inertia of 0.07 kg·m2 each (Fig. 2). This particular configuration allows for multiple exercises involving upper‐ and lower‐body as well as back muscles [126]. Using a harness connected through a strap to the flywheel axle, the seat slides back and forth on a rail in the coupled CON‐ECC action. With feet placed on the foot stance and knees flexed (∼70° knee angle), the trainee initiates flywheel rotation through the pull of the strap. The strap unwinds off the shaft while the trainee pushes back. Once the CON phase has been completed (∼ 160° knee angle), the ECC muscle action is executed by aiming at resisting the pull of the flywheel(s), which recoils the strap onto the axle again [126]. A force strain gauge (Model 333A, K Toyo, Seul, Korea) placed in between the harness and the pulley was used to measure force during FS. Knee joint angle was measured in a select sample (n=5) using an electrogoniometer fixed about the knee joint (see above).
Figure 2. Squat exercise using flywheel device.
15
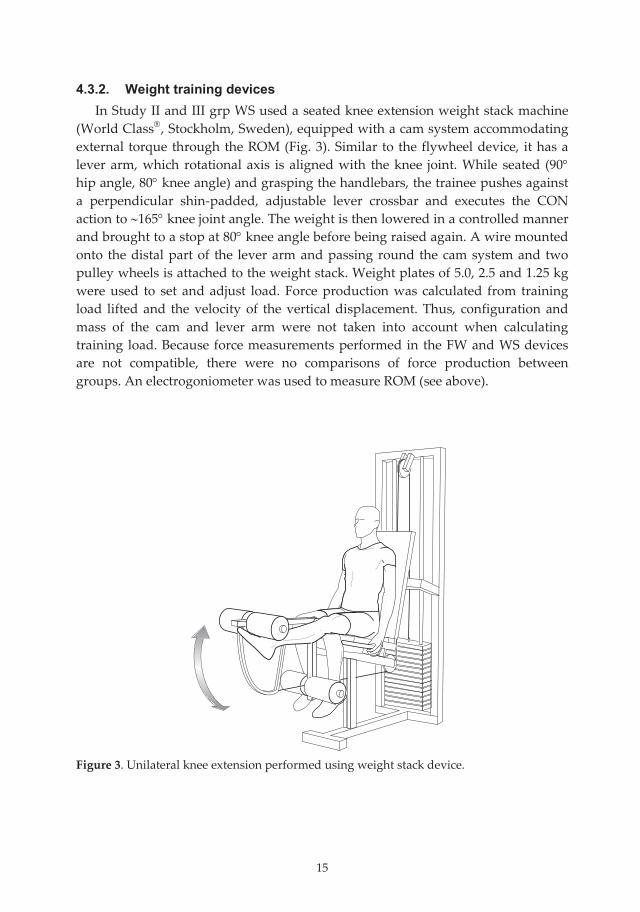
4.3.2. Weight training devices In Study II and III grp WS used a seated knee extension weight stack machine
(World Class®, Stockholm, Sweden), equipped with a cam system accommodating external torque through the ROM (Fig. 3). Similar to the flywheel device, it has a lever arm, which rotational axis is aligned with the knee joint. While seated (90° hip angle, 80° knee angle) and grasping the handlebars, the trainee pushes against a perpendicular shin‐padded, adjustable lever crossbar and executes the CON action to ∼165° knee joint angle. The weight is then lowered in a controlled manner and brought to a stop at 80° knee angle before being raised again. A wire mounted onto the distal part of the lever arm and passing round the cam system and two pulley wheels is attached to the weight stack. Weight plates of 5.0, 2.5 and 1.25 kg were used to set and adjust load. Force production was calculated from training load lifted and the velocity of the vertical displacement. Thus, configuration and mass of the cam and lever arm were not taken into account when calculating training load. Because force measurements performed in the FW and WS devices are not compatible, there were no comparisons of force production between groups. An electrogoniometer was used to measure ROM (see above).
Figure 3. Unilateral knee extension performed using weight stack device.

16
In Study IV back barbell half squats (BS) were performed in coupled ECC‐CON actions using a 20 kg Olympic barbell (Eleiko Inc., Halmstad, Sweden) with additional weights (Fig. 4). With the bar centered across the upper back, the subject descend in a continuous motion by flexing the knees, ankles and hip until the posterior surface of the thighs are parallel to the floor (until ~90° knee angle), and then ascend to the upright position. For force measurements during BS, the weight of the bar and added load together with recordings from a linear encoder (Ergotest AS, Langesund, Norway), measuring vertical displacement, were used. In five of the subjects, knee joint angle was measured using an electrogoniometer (see above).
All signals (force, angle, and vertical displacement) were sampled using a Windows™ based data acquisition system (MuscleLab™, Ergotest AS, Langesund, Norway).
Figure 4. Barbell squat exercise.

17
4.4. Electromyography 4.4.1. Multichannel EMG
Multichannel surface EMG signals were used for assessment of ARV and iMNF, and for the estimation of CV by using detection systems [79]. Using two 8‐electrode, 5‐mm interelectrode distance adhesive arrays (SPES Medica, Salerno, Italy), multichannel surface EMG signals were acquired from the VL and VM muscles (Fig. 5). After detection of the innervation zone and the tendon regions, the arrays were placed along the fiber direction between the innervation zone and the proximal or distal tendon regions. Before array placement, the skin was shaved, rubbed with abrasive paste, and cleaned with a paper towel. Electromyographic electrode location was marked with an ink pen after the first experimental session, ensuring similar electrode positioning. Surface EMG signals were amplified with a multichannel amplifier [79], sampled at 2048 samples/s per channel, and recorded on a computer equipped with EMG acquisition software described elsewhere [127].
Figure 5. Schematic showing multichannel EMG detection using arrays. 4.4.1.1. Study I
Values of iMNF were computed from the central bipolar signal of the two arrays on VM and VL of the dominant limb. In order to reduce estimation variance, each value of iMNF was calculated from 30 consecutive values corresponding to 14.6 ms. The same bipolar signal was chosen to calculate ARV values in 250 ms time intervals (8192 consecutive values). Short signal epochs [79] estimated muscle fiber CV with use of an algorithm described elsewhere [54]. During the dynamic task, CV, iMNF, ARV and force were estimated for each repetition of CON and ECC actions, at time instants corresponding to a joint angle of 120°. The first value of CV, iMNF, ARV and force obtained during the dynamic exercise were considered as initial value (and 100 %), and further were trend lines, i.e. slopes, over repetitions were calculated. To allow for comparisons, the slopes were normalized to the initial values and expressed in percentage.

18
4.4.1.2. Study III Equipment and procedures for electrode placement and repositioning described
in Study I were used. For grp FW and grp WS, the central bipolar signal of the VM and VL array were used to compute EMGRMS values for MVC and dynamic actions. Maximal EMGRMS was computed from the 1‐s window that was chosen to determine MVC. For the dynamic actions, EMGRMS was assessed from the entire CON and ECC ROM, and 150 ms windows at knee joint angles of 90, 120 and 150° in the CON and ECC action, respectively. EMGRMS at 90, 120 and 150° knee angles were further averaged over repetitions and sets. Given the inherent methodological problems with surface EMG recordings [53], EMGRMS was expressed relative to maximal EMG for each individual muscle, i.e. normalized angle specific EMGCON and EMGECC. For evaluation of fatigue response, normalized EMGCON and EMGECC for each repetition was averaged over sets. 4.4.2. Bipolar EMG
Disposable bipolar Ag‐Ag/Cl surface electrodes (Multi Bio Sensors Inc., El Paso, TX, USA) with 25 mm inter‐electrode distance were aligned longitudinally to the fiber direction. Single differential surface EMG signals were amplified using bipolar EMG probes (MuscleLab™). EMGRMS of the raw signal was sampled using the MuscleLab system (see above). The same procedures for electrode placement and repositioning, as used in Study I (see above), were employed. EMGRMS was assessed from VM, VL and rectus femoris; RF. 4.4.2.1. Study III‐IV
In Study IV, EMGRMS was assessed during MVC´s and the following 5 sets of 10 RM in either exercise mode. The MVC trial with the greatest overall EMGRMS was considered as maximal EMG. EMGRMS was measured over the CON and ECC actions, averaged over repetitions and sets, and expressed relative to maximal EMG for each specific muscle.
To validate EMG data from the two training groups (Study III) / test days (Study IV), EMGRMS was assessed from the left limb (later used for training; Study III)/dominant limb (Study IV). During the Acute tests, EMGRMS was assessed during MVC´s and two maximal sets in either exercise device. The set with the greatest overall normalized EMG was chosen for comparison between exercise modes. For evaluation of fatigue response, normalized EMGCON and EMGECC for each repetition was averaged across subjects.

19
4.5. Magnetic Resonance Imaging To minimize the potential influence of any fluid shift on muscle size [128]
subjects remained supine (Study II) or resting (Study IV) for 1 h prior to the start of the resting MRI´s. A custom made adjustable foot restraint device was used during all scans to avoid compression of muscles during scanning and to keep the limbs in a fixed position. The graded foot‐brace and detailed description of placement ensured accurate repositioning across sessions. 4.5.1. MRI for assessment of muscle volume 4.5.1.1. Study II
Individual quadriceps muscle volume was assessed by MRI. For grp FW, a 1.5 T MRI (Signa, General Electric, Milwaukee, WI, USA) machine was used. Grp WS was examined with use of a 1.5 T MRI (Intera, Philips Medical Systems, Best, The Netherlands) unit. For all subjects, fifty images with slice thickness 10 mm and no spacing in between slices were obtained. Despite the use of two MRI facilities and slightly different imaging sequences, analyses and procedures used have been validated previously [125, 129, 130]. Anatomical intervals and strategy to choose images for analyses were identical across the two study groups. Using computerized planimetry (Intuos Graphic Tablet, Wacom Technology, Vancouver, WA, USA), areas of interest were identified from the displayed images and manually circumscribed and then automatically computed using public domain software (Scion Image Beta 4.0.2 for Windows, Scion Corporation, Frederick, MD, USA). The four quadriceps muscles (VL, VM, vastus intermedius; VI, and RF) were encircled separately. The areas over the five circumscriptions, showing less than 2% difference between extreme values, were averaged. Anatomical landmarks were used to ensure the same segment of the thigh was measured pre and post training. From stacks of images beginning with the first not displaying m. gluteus maximus and ending with the last image in which RF appears, all (FW) or every third (WS) image was analyzed. This latter approach, which reduces the number of images for analyses, is as reliable as measuring the entire stack of images [130]. Muscle volume of the selected stack was subsequently calculated from the areas determined in individual images. 4.5.1. Functional MRI for assessment of muscle involvement 4.5.2.1. Study IV
A 1.5 T MRI (Intera, Philips Medical Systems, Best, The Netherlands) was used to acquire spin‐echo scans (double echo sequence, proton density with TR/TE: 1500/30 ms) prior to and within 2‐3 minutes after completing the exercise. Seventeen images with slice thickness 10 mm and 10 mm spacing in between slices were obtained. Starting where m. gluteus maximus was not seen and then five slices distally, quadriceps (RF, VI, VL, and VM) were analyzed. Average signal

20
intensity (SI) in the regions of interest was measured using custom made software (DimView, Nordic Ice Medical, Bergen, Norway). Average SI in each slice was obtained and T2 was calculated (T2 = (ΔTE) / ln (SITE 30 / SITE 60)), and further mean T2 over the 5 slices. Care was taken not to include non‐muscular tissues such as fat and blood vessels. 4.6. Statistics 4.6.1.1. Study I
Data were analyzed with repeated measures ANOVA. When appropriate, the Student‐Newman‐Keuls (SNK) post‐hoc test was used for multiple pairwise comparisons. Statistical significance was set to p<0.05. Data are presented as mean±standard error (SE) of the mean. 4.6.1.2. Study II‐IV
One‐, two‐, three‐, or four‐way repeated measures ANOVA were employed to make comparisons within and between groups/exercises modes, e.g. over the 12 training sessions, over pre and post tests, over time for pre and post measurements, (StatSoft, Inc., Tulsa, OK, USA). When an interaction or group difference was found, planned comparisons were executed employing a Bonferroni correction. Hence, any p value obtained was multiplied by the number of planned comparisons, and considered significant if lower than 0.05. When applicable, training induced changes within groups (e.g. mean and peak force) were performed using a Student’s t‐test. The significance level was set to p<0.05. Values are presented as mean±standard deviation (SD).

21
5. RESULTS
5.1. Study I 5.1.1.1. Dynamic actions
During the 30 coupled CON‐ECC actions, all parameters were analyzed at time instants corresponding to 120° knee joint angle. At this knee joint angle, mean CON force was greater (p<0.05) than mean ECC force, and CON force decreased more (p<0.05) than ECC force. CV showed greater relative decrease than iMNF (p<0.05) during both CON and ECC actions. Initial CV was higher (p<0.05) in CON compared with ECC actions. Initial iMNF showed no difference (p>0.05) across muscles, days, or type of action. ARV was greater (p<0.05) during CON than ECC actions. However, the negative slope of ARV was similar (p>0.05) across actions. 5.2. Study II 5.2.1.1. Muscle volume
Both groups showed increased (p<0.05) quadriceps muscle volume in the trained left limb. The change from pre to post training was not different across groups. For individual muscles, there was a trend of a greater increase (p<0.10) of VL in grp FW compared with grp WS (Fig. 6).
In grp FW, the trained quadriceps showed a 6.2 % increase (Pre: 1300±210 cm3, Post: 1380±235 cm3; p<0.05), while the untrained right quadriceps showed no change (Pre: 1276±204 cm3, Post: 1263±205 cm3). Furthermore, all individual muscles of the trained limb showed increased volume (Fig. 6; p<0.05). Neither muscle of the untrained limb showed change over time. In grp WS, the trained quadriceps increased by 3.0 % (Pre: 1430±364 cm3, Post: 1472±381 cm3; p<0.05), while the untrained quadriceps was unchanged (Pre: 1373±309 cm3, Post: 1361±300 cm3). Only the trained RF showed increased volume (Fig. 6; p<0.05). Neither muscle of the untrained limb showed altered volume.
Figure 6. Relative change in volume of VL, m. vastus lateralis; VI, m. vastus intermedius; VM, m. vastus medialis and RF, m. rectus femoris of the trained limb following in grp FW (A) and grp WS (B). * Denotes significant increase from pre to post (p<0.05), † Denotes trend to different response for VL in WS compared with FW (p<0.10).

22
5.2.1.2. Maximal isometric strength MVC at 90° of the trained limb increased (p<0.05) in grp FW, but not grp WS,
following training (Fig. 7). The trained limb showed an increase of MVC at 120° in both groups (p<0.05), and no differences between groups.
Furthermore, when limbs were compared within groups, MVC at 90° showed an interaction (p<0.05) across limbs and time in grp FW. Hence, the trained left limb showed an 11.6 % increase, while the untrained right limb showed no change. Grp FW showed no interaction across limbs and time with regard to MVC at 120°, but there was a trend of an increase over time (p<0.10). In grp WS, there was no interaction across limbs and time with regard to MVC at 90° or 120°.
Figure 7. Maximal isometric force (MVC) at 90° (A) and 120° (B) knee angle of the trained (TR) and untrained (UT) limb pre and post training in grp WS and grp FW. * Denotes increase from pre to post (p<0.05); ‡ Denotes different response for the trained limb across groups (p<0.05).
5.2.1.3. Training load, and mean and peak force during dynamic actions Because WS and FW training load were measured and calculated using
different methods, no direct group comparisons were performed. In grp FW, CON (Session 1: 322±67 N, Session 12: 338±42 N) and ECC (Session
1: 302±60 N, Session 12: 320±44 N) mean force was unchanged over the 12 sessions. In grp WS, the training load increased 48 % (Session 1: 14.5±3.1 kg, Session 12: 21.4±3.2 kg; p<0.05).
In grp FW, ECC peak force was greater (p<0.05) than CON peak force both pre and post training (Table 3). CON and ECC mean and peak force of grp FW was unchanged from pre to post training. The CON and ECC mean and peak force of grp WS increased (p<0.05) following training (Table 3).

23
Table 3. Peak force (N) and knee joint angle (°) at peak force (A), and mean force (B), for the concentric (CON) and eccentric (ECC) actions produced in the flywheel and weight stack devices in Study II and III / free weights in Study IV. A. Peak force Pre / test 1 and 2 Post ECC CON ECC CON Study N ° N ° N ° N °
Grp WS # # # # II Grp FW 489±86 87 447±75 89 526±106 83 481±82 89 Grp WS 165±34 95 185±34 84 247±35* 110 258±32* 96 III Grp FW 368±77 94 344±72 89 432±78* 99 378±64* 94 BS 1513±265 90 1555±292 96 IV FS 2135±277‡ 99 2171±390‡ 122
B. Mean force Pre / test 1 and 2 Post Study ECC (N) CON (N) ECC (N) CON (N)
Grp WS # # # # II Grp FW 401±83 390±73 425±120 407±83 Grp WS 143±29 142±29 207±31* 200±29* III Grp FW 207±57 227±60 246±51* 262±57* BS 1282±256 1261±261 IV FS 1316±183 1538±224‡
FW: flywheel knee extension; WS: weight stack knee extension; FS: flywheel squat; BS: barbell squat. The subgroups performed acute tests using both the flywheel device and weight stack machine/free weights. # Results from the same subjects are reported in Study II and III. In grp FW of Study II force was averaged over a 30° window, while force of grp WS and grp FW (Study III) was averaged over the entire range of motion. Because force measurements performed in the two knee extension devices are not compatible, no comparisons between groups were performed. * Denotes increased force from pre to post test (p<0.05). ‡ Denotes greater force during flywheel squat compared with barbell squat (p<0.05).

24
5.3. Study III 5.3.1.1. MVC
MVC at 120° knee angle increased (p<0.05) by 8.1% (Pre: 576±90, Post: 622±91) in grp FW and by 4.8% (Pre: 594±113, post: 623±103) in grp WS in response to training.
5.3.1.2. Normalized angle specific EMG Grp FW showed higher (p<0.05) overall normalized angle specific EMGECC for
both VL and VM compared with grp WS (Fig. 8). Thus, grp FW showed higher normalized EMG at 90° pre and post training (p<0.05). Grp WS showed higher normalized EMGECC for VL and VM at 150° post training (p<0.05). Normalized angle specific EMGECC did not change with training. Overall normalized angle specific EMGCON showed no differences between groups. Hence, following training EMGCON of grp WS was not different from that of grp FW. Grp FW, however showed higher normalized EMGECC compared with grp WS after training.
Figure 8. Normalized angle specific electromyographic (EMG) amplitude of mm. vastus lateralis (VL) and medialis (VM) during concentric (CON; 90°, 120° and 150°) and eccentric (ECC; ‐150°, ‐120° and ‐90°) actions of unilateral knee extension exercise in grp FW (panel A and B) and grp WS (panel C and D) pre and post training. † Indicates trend to increase over time with training (p<0.10).

25
5.3.1.3. Mean and peak force of the dynamic actions Mean and peak force of CON and ECC actions increased with training in both
groups (p<0.05; Table 3). Because force measurements employed for the two different devices are not compatible, no comparisons between groups were performed.
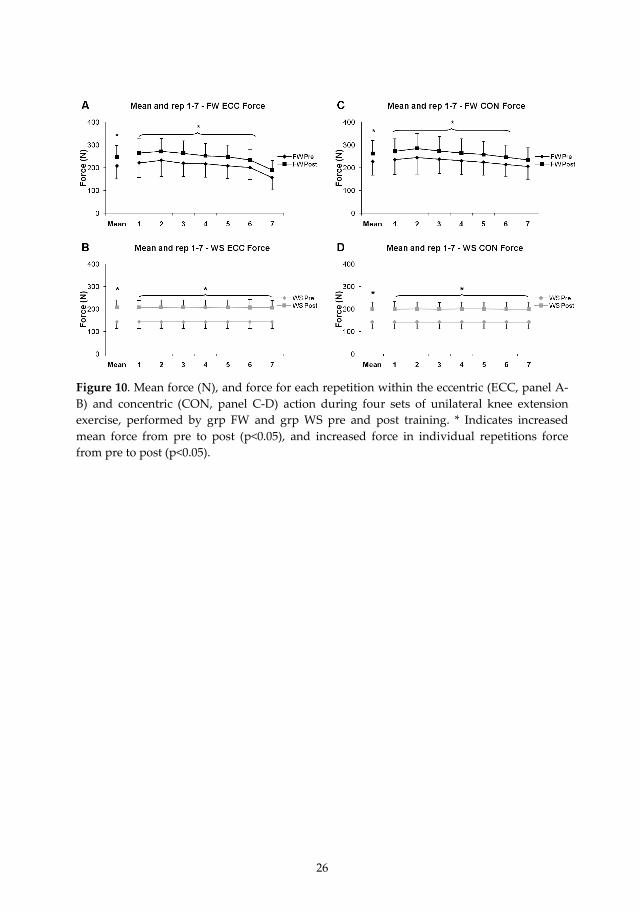
5.3.1.4. EMG fatigue response Normalized EMG and mean force across sets and for each repetition are
displayed in Fig. 9 and Fig. 10. Both vastii muscles showed overall higher normalized EMGECC (p<0.05), with a higher normalized EMGECC across reps 1‐6 (p<0.05) for grp FW compared with grp WS. EMGCON showed no group differences and there was no interaction over group and time, or differences over time for either EMGCON or EMGECC.
Figure 9. Normalized mean electromyographic (EMG) amplitude, and normalized EMG amplitude of mm. vastus lateralis (VL) and medialis (VM) for each repetition (1‐7) within the eccentric (ECC, panel A‐B) and concentric (CON, panel C‐D) action during four sets of unilateral knee extension exercise, performed by the grp FW and grp WS pre and post training. * Indicates higher normalized mean EMG (p<0.05), and higher normalized EMG within repetitions (p<0.05) compared with the other training mode.
26
Figure 10. Mean force (N), and force for each repetition within the eccentric (ECC, panel A‐B) and concentric (CON, panel C‐D) action during four sets of unilateral knee extension exercise, performed by grp FW and grp WS pre and post training. * Indicates increased mean force from pre to post (p<0.05), and increased force in individual repetitions force from pre to post (p<0.05).

27
5.3.1.5. Acute test VM and VL showed greater overall normalized angle specific EMGCON (p<0.05)
and EMGECC (p<0.05) during FW compared with WS (Fig. 11). Overall normalized angle specific EMGECC (p<0.05), but not EMGCON, of RF was greater during FW compared with WS (Fig. 11). Specifically, normalized EMGECC of all three muscles was greater during FW compared with WS at ‐90° (p<0.05). Normalized EMGCON for VL (90°) and VM (120°) was greater (p<0.05) during FW than WS.
Figure 11. Normalized angle specific electromyographic (EMG) amplitude of mm. vastus lateralis (VL; A), rectus femoris (RF; B) and vastus medialis (VM; C) during concentric (CON, 90° to 150°) and eccentric (ECC, ‐150° to ‐90°) actions of unilateral knee extension exercise, performed in the flywheel (FW) and weight stack (WS) devices prior to the training period. * Denotes greater overall normalized angle specific EMG during flywheel than weight stack training (p<0.05). ‡ Denotes greater normalized angle specific EMG during flywheel than weight stack training (p<0.05).

28
5.4. Study IV 5.4.1.1. Functional Magnetic Resonance Imaging
T2 of the quadriceps muscles showed an overall increase following exercise (p<0.05). The relative overall increase of T2 of the quadriceps was greater following FS compared with BS (Fig. 12, p<0.05). There was an interaction over exercise mode and muscle (p<0.05), such that the relative increase in T2 for RF was greater after FS (+24±14%; p<0.05) compared with BS (+8±4%). VL, VM or VI showed no differences across exercise modes. Similarly, there was an interaction over exercise mode and time for absolute T2 values of the four quadriceps muscles (p<0.05), such that T2 of RF increased more (p<0.05) with FS than with BS. There were no differences between exercise modes for T2 of VL, VM or VI.
Figure 12. Relative T2 change for mm. rectus femoris (RF), vastus lateralis (VL), intermedius (VI) and medialis (VM) with flywheel (FS) or barbell squat (BS). * Denotes greater T2 increase in FS compared with BS (p<0.05).
29
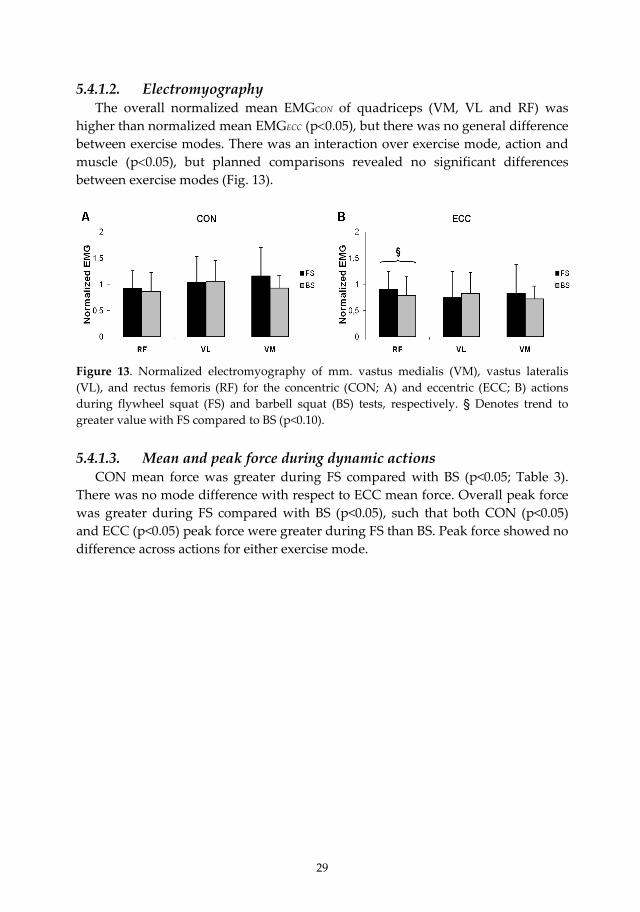
5.4.1.2. Electromyography The overall normalized mean EMGCON of quadriceps (VM, VL and RF) was
higher than normalized mean EMGECC (p<0.05), but there was no general difference between exercise modes. There was an interaction over exercise mode, action and muscle (p<0.05), but planned comparisons revealed no significant differences between exercise modes (Fig. 13).
Figure 13. Normalized electromyography of mm. vastus medialis (VM), vastus lateralis (VL), and rectus femoris (RF) for the concentric (CON; A) and eccentric (ECC; B) actions during flywheel squat (FS) and barbell squat (BS) tests, respectively. § Denotes trend to greater value with FS compared to BS (p<0.10). 5.4.1.3. Mean and peak force during dynamic actions
CON mean force was greater during FS compared with BS (p<0.05; Table 3). There was no mode difference with respect to ECC mean force. Overall peak force was greater during FS compared with BS (p<0.05), such that both CON (p<0.05) and ECC (p<0.05) peak force were greater during FS than BS. Peak force showed no difference across actions for either exercise mode.

30
5.4.1.4. Acute test A subsample of four subjects executed an additional test on a separate day; they
performed MVC´s and sets of 10 maximal repetitions in either exercise mode. Normalized EMG for RF, VM and VL across a set and for each repetition are displayed in Fig. 14. RF showed higher overall mean normalized EMG, and higher normalized EMG of rep 1‐10, with FS than BS (p<0.05). This was true for both EMGECC (p<0.05) and EMGCON (p<0.05). However, VM and VL showed similar normalized EMGECC and EMGCON of rep 1 to 10 for both exercise modes. There was overall higher mean and rep 1‐10 force produced during FS than BS (p<0.05; Table 3); both CON (p<0.05) and ECC (p<0.05) force were greater with FS than BS.
Figure 14. Normalized mean electromyographic (EMG) amplitude, and normalized EMG amplitude for each repetition (1‐10) of mm. rectus femoris (RF), vastus lateralis (VL) and medialis (VM) within the eccentric (ECC, panel A‐D) and concentric (CON, panel E‐H) action during flywheel (FS) and barbell squat (BS), recorded on a separate day in four subjects. * Indicates greater (p<0.05) normalized mean EMGCON and EMGECC, and greater (p<0.05) normalized EMGCON and EMGECC for rep 1‐10, compared with the other exercise mode.

31
6. DISCUSSION
It is generally held that resistance exercise programs aimed at promoting muscle hypertrophy and increased muscle strength should comprise coupled CON and ECC muscle actions. Given the inherently greater force that can be produced during ECC actions, the athletic community for decades has also emphasized ECC overload [131]. To some extent this concept has found support in the scientific literature inferring that well‐founded benefits from chronic resistance exercise may be more prominent when ECC overload is employed. Thus, the current investigation explored and compared acute and early chronic effects of exercise, using either isoinertial flywheel resistance, allowing for brief episodes of ECC overload, or isotonic resistance using traditional weights. Five wk isoinertial resistance training induced more prominent muscular adaptations than isotonic training using weights. Isoinertial resistance exercise offered high mean and in particular, ECC peak forces, and more complete ECC muscle activation than isotonic resistance exercise. Resulting from one of the characteristics of isoinertial exercise, permitting each repetition of a set to be performed using maximal activation and through the entire range of the CON action, such exercise induced marked fatigue. In both novice and resistance trained men, isoinertial exercise using flywheel prompted more substantial muscle use than isotonic resistance exercise. While any cause‐effect relationship remains to be determined, the present study provides evidence to support that brief episodes of ECC overload reinforce skeletal muscle adaptations resulting from CON‐ECC resistance training. It is generally agreed that high mechanical loading, particularly in the ECC
action, is a vital stimulus for inducing muscle hypertrophy [27, 111, 112, 115]. Thus, it is tempting to suggest that the more marked increase in quadriceps volume in response to FW over WS exercise could be attributed to the high ECC peak force evoked in the low knee joint angle during flywheel deceleration, along with the overall greater muscle activation during ECC actions.
The robust 6.2% hypertrophy shown after FW knee extension training conforms with the ~7% increase in muscle cross‐sectional area noted after 5 wk training (there was a significant ~4% increase after 20 d) using identical protocol and exercise hardware [132]. Because MU involvement appears to be lower in ECC than CON actions [36, 38, 44, 64, 65] this would infer that the load placed on each muscle fiber must be greater during ECC/lengthening than CON/shortening actions. This may in part serve to explain the severe myofibrillar disruption demonstrated following ECC actions [83, 86, 87]. Such muscle damage [87, 133] may present the initial stimulus for subsequent remodelling leading to hypertrophy [88, 134]. Given this, the greater ECC loading and ECC muscle activation noted with FW exercise may potentially enhance protein synthesis,

32
cellular signalling for protein synthesis, and ultrastructural changes [30, 83, 84, 86] reported following ECC actions. Moreover, the suggested selective recruitment of high threshold MUs during ECC actions [44, 46‐48], may infer that the load placed on Type II fibers may have been augmented during ECC actions. This indeed corresponds with the notion of ultrastructural damage [83, 135], augmented cellular signalling for protein synthesis [120], and glycogen depletion [136] of Type II fibers in response to intense ECC exercise. Moreover, the more substantial hypertrophy of Type II fibers following resistance training using ECC or CON‐ECC actions, rather than CON actions only [27, 115] certainly corroborate with this hypothesis. Whether there was more complete recruitment of Type II fibers with FW than WS resistance exercise, explaining the robust hypertrophy in response to FW training, however remains open for speculation.
Had the hypertrophic response been solely dependent on high mechanical loading in the coupled CON‐ECC actions, so‐called isokinetic training, providing accommodated maximal resistance throughout any action, would then be superior to any other resistance training mode. This is obviously not the case since isokinetic CON‐ECC training performed at low velocity (relative to Vmax), results in minute hypertrophy [103]. Isokinetic ECC training at modest speed did however induce additional myofibrillar disruption and more hypertrophy than programs employing low‐speed ECC actions [85, 137]. Thus, dissimilarities in, e.g., velocity and loading strategy and associated differences in ECC peak force [85, 137, 138], may partly serve to explain the discrepant results reported following ECC overload compared with constant load resistance training [102, 105, 121].
Although being a subject of controversy [139, 140], one proposed mechanism contributing to the more substantial hypertrophy following ECC resistance training, is the “popping” of overextended sarcomeres [141, 142] due to an imbalance in length and velocity between adjacent sarcomeres during lengthening [143]. In the flexed knee joint position, individual fibers and myofibrils of the quadriceps muscle are somewhat stretched, such that more sarcomeres are at the descending limb of the length‐tension relationship, where the potential for “popping” is greater [141, 142]. High muscle activation at a somewhat lengthened position may imply significant sarcomere and myofibril disruption [141, 142], in turn promoting skeletal muscle remodelling and hypertrophy. Accordingly, ECC actions performed in a somewhat stretched position resulted in more muscle damage [144, 145] and hypertrophy [146] than ECC actions performed at shorter muscle lengths. Therefore, the more substantial hypertrophy noted following 5 wk FW resistance exercise might be attributed to more complete ECC muscle activation and high ECC peak force elicited during flywheel deceleration.

33
Isoinertial resistance exercise also prompted near maximal muscle activity throughout the CON action. Collectively, the force decline and changes in EMG amplitude, conduction velocity and spectral indices during 30 consecutive FW knee extensions reflect marked fatigue [55, 147, 148]. Since the energy cost of CON actions are about fivefold greater for CON than ECC actions, mainly CON actions are responsible for the enhanced energy demand and the subsequent changes altering the intracellular milieu [36‐38, 149]. Thus, accumulation of e.g. inorganic phosphate, along with reduced calcium ion sensitivity and release, appears to compromise contractile force [51, 52], and hence reduce force throughout an exercise bout.
Further, and given that exercise induced contrast‐shifts assessed by functional MRI correlates with metabolic changes [58, 59, 150‐152], and that CON actions mainly cause such shift [60, 61], the overall greater T2 increase of quadriceps muscles with FW than weight loading was likely attributed to greater CON muscle use. Collectively, and by employing functional MRI and EMG techniques, it appears isoinertial resistance exercise prompts greater muscle use in both CON and ECC actions than weight exercise.
All in all, the differences in muscle activation between loading paradigms were less obvious in the squat compared with the knee extension exercise. Coupled ECC‐CON actions were used in the squat, but not in knee extension exercises. Thus, pre‐stretch in the ECC actions [153] and hence utilization of the stretch‐shortening cycle, probably stored elastic energy in the contracting muscles [153‐155]. The stored elastic energy and associated reflex potentiation [156] may have facilitated MU recruitment and force production in the subsequent CON action. In the squat exercise, the so called “sticking‐point” occurs at the onset of the CON action, as reflected in the high EMG amplitude shown here and elsewhere [157, 158]. It is therefore possible that utilization of the stretch‐shortening cycle could have aided in overcoming the “sticking‐point”, allowing for a somewhat heavier weight to be used, and consequently augmented muscle use. In the flywheel exercise, more kinetic energy was probably imparted in the flywheels throughout the CON action, which had to be decelerated in the subsequent ECC action, hence producing a positive high force loop.
Muscle activation during isoinertial exercise was maximal or near maximal before training. In contrast, muscle activation was far from complete in most of the ROM during isotonic knee extension, and maximal or near maximal only at the “sticking‐point” at completion of the CON action, as previously shown [157, 159]. This permitted an increase in muscle activation in response to WS but not FW training. In support, there was unaltered EMG in grp FW, and enhanced EMG and force production particularly in the CON acceleration phase in grp WS. Thus, grp WS experienced a marked increase in training load, yet the increase in MVC was
34
modest. In stark contrast, FW training increased MVC but produced only modest changes in training specific strength.
Improved muscle strength following resistance training has, in part, been attributed to an increase in neural drive [22, 23, 160]. While such an effect may be reflected in a greater rate of force development (RFD) [160], neither training group showed a significant increase in RFD. If anything, the increased MVC (grp WS: +4.8%, grp FW: +8.1%) correlated with the associated hypertrophy (grp WS: +3.0%, grp FW: +6.7%), which allows for almost no latitude of increased neural drive.
The increased mode specific strength, most evident following WS training, was more likely attributed to improved coordination of agonist and stabilizing muscles [53, 93], more efficient timing of individual MUs [161], and/or attenuated antagonist co‐activation [162]. The augmented EMG in the CON action following WS training, accords with earlier reports suggesting such neural adaptations are substantial in the first weeks of training [22, 93, 162]. Hence, muscle activation in the CON action was comparable across groups after training. Yet, EMG in the ECC actions remained higher in grp FW, inferring that a critical stimulus required to optimize skeletal muscle adaptations to resistance exercise was still inadequate in grp WS. 6.1. Practical implications
The enthusiasm of utilizing the inertia, produced by spinning flywheel(s) set in motion by a trainee as means of resistance exercise, originally arose from a challenge to design an apparatus that would allow for “weight lifting” in the 0g environment [124]. There is a consensus among life science space authorities [163, 164], that in‐flight resistance training should be prescribed to space travellers to combat muscle atrophy, and in particular for those postural muscles which are most vulnerable to muscle loss and strength decrements during spaceflight [165‐169]. Indeed, resistance training using weights has proven efficacy as a countermeasure to compromised protein metabolism, size and function of skeletal muscle, resulting from bed rest [170‐172] or unilateral lower limb unloading [173].
In addition to offering high loading, any resistance training equipment to be used on a space craft must comply with various requirements critical to the 0g environment. For example, the restricted power supply and limited space for stowage does not allow for any bulky apparatuses [174]. Unfortunately, compact and light elastic bungee cords and elastomeric or spring‐loaded systems [164] do not offer adequate resistance. Similarly, a device currently in use on the International Space Station has failed to provide sufficient resistance, and in particular ECC load [175].
Combined, the more robust hypertrophy noted after 5 wks FW compared with WS training, and earlier reports of marked strength increases in individuals

35
performing isoinertial training while being subjected to long‐term confinement [126], and blunted or counteracted muscle atrophy in men and women after bed rest or unloading with concurrent isoinertial training [129, 176, 177], are encouraging.
Thus, the current experiments provide further insight to support use of in‐flight isoinertial resistance exercise to combat the muscle atrophy and decreased strength and power that occur during spaceflight. While it should be appreciated that muscles or muscle groups, other than those examined here, show atrophy after spaceflight, there are reasons to believe that the flywheel technology could be employed in the design and engineering of any configuration aimed at 0g use, to successfully replicate established resistance exercises used at 1g.
Also, previous research has convincingly shown that athletes [178, 179], older individuals [180] and patients recovering from knee pathology [181] all benefit from isoinertial resistance exercise paradigms using different configurations engineered to engage various specific muscle groups. However, it remains to be demonstrated whether the efficacy is superior to what can be produced in response to training with weights.
6.2. Summary In accordance to our hypothesis, high peak and mean forces were elicited
during isoinertial resistance exercise, by provoking greater MU and muscle involvement compared with weight stack and free weight exercises (Study III‐IV), inducing a marked fatigue response (Study I, III and IV). Furthermore, confirming our hypothesis, isoinertial training generated more prominent hypertrophy of individual quadriceps muscles and greater improvement of non‐specific strength, while, in contrast to our hypothesis, the isotonic training induced more prominent improvement of training specific strength and indications of neural adaptations (Study II and III). The robust hypertrophic response following isoinertial training (Study II) appears to be mainly attributed to the high ECC peak force and greater ECC muscle activation elicited with isoinertial than isotonic resistance exercise (Study III).
While the particular features characteristic of isoinertial resistance exercise appear to trigger unique responses leading to significant musculoskeletal adaptations, it should be acknowledged that a sole cause‐effect relationship has yet to be discerned. Thus, it remains to be revealed whether the greater overall load/work, the greater ECC/CON ratio (i.e., “ECC overload”), or the brief episodes of very high ECC forces resulting in marked stretch prior to shortening, was responsible for the more robust physiological responses elicited with isoinertial compared with isotonic resistance exercise.

36
7. ACKNOWLEDGEMENTS
This thesis work was supported by: The Swedish National Space Board (SNSB), the European Space Agency (ESA), Swedish National Centre for Research in Sports (Centrum för Idrottsforskning) and the Department of Health Sciences at Mid Sweden University. I wish to express my sincere gratitude to all the people who made this thesis work possible, especially: Per Tesch, my supervisor, for giving me the opportunity to perform this thesis work. Thank you for sharing your vast knowledge, especially about muscle physiology and scientific writing, and for always spurring me to know more. Ola Eiken, my co‐supervisor, for sharing your vast knowledge, for support and interesting discussions about science and life. Björn Alkner, my colleague and friend, for all your support, endless patience, and help throughout the years. I have learned a lot from you. Most of all, thank you for being such a good friend. Marco Pozzo, my colleague and friend, for your hard work, patience, good sense of humour, and good times at and outside work. For sharing many hours in the lab, providing me sugar boosts and coffee when I need it. You are truly something extra! Tommy Lundberg, my colleague, for bringing new energy into our group, for your great collaboration, great discussions about science and life, and good spirit at and outside work. Anna Jansson, my colleague, for your great collaboration and good spirit at and outside work. Mikael Strömmer, my colleague, for your great collaboration and fun times at and outside work. Ferdinand von Walden, my colleague, for support, and for bringing new energy and ideas to our group. Ted Elman, my colleague, for bringing new energy to our group. Thank you for staying cool at all times (except for during biopsies). I need to learn from you. Julio Tous‐Fajardo, my colleague and co‐author, for sharing your knowledge, for good collaboration during experiments and with manuscripts, and for help with finding the local specialty in Aberdeen... Jim Fluckey, my co‐author, for sharing your knowledge, bringing new ideas, and for your good spirit at and outside work. Roberto Vargas, my co‐author, for your great collaboration, for sharing your knowledge about magnetic resonance imaging, and for keeping the good spirit during experiments.

37
Dario Farina, my co‐author, for assistance with the EMG paper. Lars Karlsson, my colleague and friend, for all the support, and all the good times at and outside work. Thank you for being such a good friend. Stéphanie Montmerle‐Borgdorff my colleague and friend, for all the good times at work, and outside work in France and Sweden. Kerstin Hamrin, my colleague and friend, for good advice, support and good times at and outside work. My colleagues at the Department of Health Sciences, who always make me feel welcome in Östersund, especially Maud Magnusson, Louise Dovrén, Anki Englund, Marianne Svedlund, Marie Alricsson, Marko Laaksonen, Mikael Swaren, Glenn Björklund, Sture Espvall, Martina Höök, Jonas Enqvist, and H‐C Holmberg. My colleagues at the Department of Laboratory Medicine for your hospitality, especially for letting me into your group, sharing your discussions and good sense of humor; Eva Jansson, Thomas Gustafsson, Carl‐Johan Sundberg, Barbara Norman, Jessica Norrbom, Anna Wiik, Helene Rundqvist, Anna Strömberg, Maria Westerståhl, Håkan Rundqvist, Eva Brimark, Helene Fisher, Mona Esbjörnsson, Erik Rullman, Susanna Wallman, Malene Klintberg, Eva‐Karin Sällstedt, Majken Lidén, Märit Karlsson, Lovisa Ryding, Andreas Montelius, Fredrik Brolund, Inger Skolin, Seher Alam, Marwa Elnaggar, Mia Ydfors, Elisabeth Bergh and Ted Österlund. Everyone at the Department of Physiology and Pharmacology, who made work and non‐work time into such a joy, especially: Marie Sandström, Ellinor Kenne, Robert Frithiof, Maria Ahlsén, Åsa Atling, Niklas Poijes and Charlotte Wretman, for your friendship and support no matter what. Jan Henriksson, for your hospitality and supportive attitude, and for interesting discussions about science and life. Louise Bovin and Peter Wolf, for always being helpful and making teaching fun. Dag Linnarsson, Lili Andersson, Björn Johannesson, Barbro Bergström and Bo Tedner, for always being helpful and supportive, and for interesting discussions around the lunch table. Roger Kölegård, Gerard Nobel, Mikael Genser, Arne Tribukait, Ulf Berg, for fun and interesting discussions. A special thanks to Patricia Henriksson, for proofreading and editing. Gi Broman, for introducing me to research and for encouraging me to start my PhD. All the subjects who participated in these studies, for your outstanding effort and performance.

38
All my friends, I can’t name you all. You mean so much to me. Thank you for supporting me, sharing joy and laughter, and for endless discussions about life, especially; Pia, Eva, Mia, Sara, Åsa, Ullis and Sonja. My family, Ingrid and Lasse, Olle and Siv, Tomas, Christina, Lova and Leo, Olle and Inger, Lars, Elisabeth and Emil, Monica, Micke, Peter, Stefan, Martin, Astrid and Viktor for all the love and support, and for always being there for me no matter what happens. A special thanks to Lars, who performed outstanding work with the illustrations. Tove, my beloved daughter and the sunshine of my life, who always reminds me of what is important in life. Anders, the love of my life, you are just wonderful and the best part of my life. Thank you for all the love, support and patience. I love you.

39
8. REFERENCES
1. Tesch, P.A., Acute and long‐term metabolic changes consequent to heavy‐resistance exercise. Medicine and Sport Science, 1987. 26: p. 67‐89.
2. American College of Sports Medicine position stand. Progression models in resistance training for healthy adults. Med Sci Sports Exerc, 2009. 41(3): p. 687‐708.
3. McDougall, J.D., Hypertrophy and hyperplasia. The Encyclopedia of Sports Medicine ʹStrength and Power in Sportsʹ, ed. P.V. Komi. 2003, Oxford, UK: Blackwell Science Ltd. pp 252‐264.
4. Morrissey, M.C., E.A. Harman, and M.J. Johnson, Resistance training modes: specificity and effectiveness. Med Sci Sports Exerc, 1995. 27(5): p. 648‐60.
5. Reid, M. and K. Schneiker, Strength and conditioning in tennis: current research and practice. J Sci Med Sport, 2008. 11(3): p. 248‐56.
6. Yamamoto, L.M., et al., The effects of resistance training on road cycling performance among highly trained cyclists: a systematic review. J Strength Cond Res. 24(2): p. 560‐6.
7. Young, W.B. and D.A. Rath, Enhancing Foot Velocity in Football Kicking: The Role of Strength Training. J Strength Cond Res.
8. de Villarreal, E.S., et al., Determining variables of plyometric training for improving vertical jump height performance: a meta‐analysis. J Strength Cond Res, 2009. 23(2): p. 495‐506.
9. Swinton, P.A., et al., Contemporary training practices in elite British powerlifters: survey results from an international competition. J Strength Cond Res, 2009. 23(2): p. 380‐4.
10. Behm, D.G., et al., Canadian Society for Exercise Physiology position paper: resistance training in children and adolescents. Appl Physiol Nutr Metab, 2008. 33(3): p. 547‐61.
11. Williams, M.A., et al., Resistance exercise in individuals with and without cardiovascular disease: 2007 update: a scientific statement from the American Heart Association Council on Clinical Cardiology and Council on Nutrition, Physical Activity, and Metabolism. Circulation, 2007. 116(5): p. 572‐84.
12. Lakka, T.A. and D.E. Laaksonen, Physical activity in prevention and treatment of the metabolic syndrome. Appl Physiol Nutr Metab, 2007. 32(1): p. 76‐88.
13. Strasser, B., U. Siebert, and W. Schobersberger, Resistance training in the treatment of the metabolic syndrome: a systematic review and meta‐analysis of the effect of resistance training on metabolic clustering in patients with abnormal glucose metabolism. Sports Med. 40(5): p. 397‐415.

40
14. Jones, T.E., et al., Sarcopenia‐‐mechanisms and treatments. J Geriatr Phys Ther, 2009. 32(2): p. 39‐45.
15. Orr, R., Contribution of muscle weakness to postural instability in the elderly. A systematic review. Eur J Phys Rehabil Med. 46(2): p. 183‐220.
16. Phillips, S.M., Resistance exercise: good for more than just Grandma and Grandpaʹs muscles. Appl Physiol Nutr Metab, 2007. 32(6): p. 1198‐1205.
17. Fithian, D.C., C.M. Powers, and N. Khan, Rehabilitation of the knee after medial patellofemoral ligament reconstruction. Clin Sports Med. 29(2): p. 283‐90, ix.
18. Potier, T.G., C.M. Alexander, and O.R. Seynnes, Effects of eccentric strength training on biceps femoris muscle architecture and knee joint range of movement. Eur J Appl Physiol, 2009. 105(6): p. 939‐44.
19. Gardiner, E.N., Athletics in the Ancient World. 2002: Dover Publications. 20. DeLorme, T.M., Restoration of muscle power by heavy resistance exercises.
J Bone Joint Surg, 1945. 27: p. 645‐667. 21. DeLorme, T.L. and A.L. Watkins, Techniques of progressive resistance
exercise. Arch Phys Med, 1948. 29: p. 263‐273. 22. Moritani, T. and H.A. deVries, Neural factors versus hypertrophy in the
time course of muscle strength gain. Am J Phys Med, 1979. 58(3): p. 115‐30. 23. Hakkinen, K. and P.V. Komi, Electromyographic changes during strength
training and detraining. Med Sci Sports Exerc, 1983. 15(6): p. 455‐60. 24. Sale, D.G., Neural adaptation to strength training. The Encyclopedia of
Sports Medicine ʹStrength and Power in Sportsʹ, ed. P.V. Komi. 2003, Oxford, UK: Blackwell Science Ltd. pp 281‐314.
25. Narici, M.V., et al., Changes in force, cross‐sectional area and neural activation during strength training and detraining of the human quadriceps. Eur J Appl Physiol Occup Physiol, 1989. 59(4): p. 310‐9.
26. Luthi, J.M., et al., Structural changes in skeletal muscle tissue with heavy‐resistance exercise. Int J Sports Med, 1986. 7(3): p. 123‐7.
27. Hather, B.M., et al., Influence of eccentric actions on skeletal muscle adaptations to resistance training. Acta Physiol Scand, 1991. 143(2): p. 177‐85.
28. Staron, R.S., et al., Skeletal muscle adaptations during early phase of heavy‐resistance training in men and women. J Appl Physiol, 1994. 76(3): p. 1247‐55.
29. Phillips, S.M., et al., Mixed muscle protein synthesis and breakdown after resistance exercise in humans. Am J Physiol, 1997. 273(1 Pt 1): p. E99‐107.
30. Moore, D.R., et al., Myofibrillar and collagen protein synthesis in human skeletal muscle in young men after maximal shortening and lengthening contractions. Am J Physiol Endocrinol Metab, 2005. 288(6): p. E1153‐9.
31. Chesley, A., et al., Changes in human muscle protein synthesis after resistance exercise. J Appl Physiol, 1992. 73(4): p. 1383‐8.

41
32. Katz, B., The relation between force and speed in muscular contraction. J Physiol (Lond), 1939. 96: p. 45‐64.
33. Hill, A.V., The heat of shortening and the dynamic constants of muscle. Proc Roy Soc Lond (Biol), 1938. 126: p. 136‐195.
34. Flitney, F.W. and D.G. Hirst, Cross‐bridge detachment and sarcomere ʹgiveʹ during stretch of active frogʹs muscle. J Physiol, 1978. 276: p. 449‐65.
35. Huxley, A.F. and R.M. Simmons, Mechanical properties of the cross‐bridges of frog striated muscle. J Physiol, 1971. 218(1): p. 59P‐60P.
36. Bigland‐Ritchie, B. and J.J. Woods, Integrated electromyogram and oxygen uptake during positive and negative work. J Physiol, 1976. 260(2): p. 267‐77.
37. Dudley, G.A., et al., Influence of eccentric actions on the metabolic cost of resistance exercise. Aviat Space Environ Med, 1991. 62(7): p. 678‐82.
38. Asmussen, E., Positive and negative muscular work. Acta Physiol. Scand., 1953. 28(4): p. 364‐382.
39. Komi, P.V., M. Kaneko, and O. Aura, EMG activity of the leg extensor muscles with special reference to mechanical efficiency in concentric and eccentric exercise. Int J Sports Med, 1987. 8 Suppl 1: p. 22‐9.
40. Dudley, G.A., et al., Importance of eccentric actions in performance adaptations to resistance training. Aviat Space Environ Med, 1991. 62(6): p. 543‐50.
41. Henneman, E., G. Somjen, and D.O. Carpenter, Functional Significance of Cell Size in Spinal Motoneurons. J Neurophysiol, 1965. 28: p. 560‐80.
42. Enoka, R.M., Neural adaptations with chronic physical activity. J Biomech, 1997. 30(5): p. 447‐55.
43. Grimby, L. and J. Hannerz, Firing rate and recruitment order of toe extensor motor units in different modes of voluntary conraction. J Physiol, 1977. 264(3): p. 865‐79.
44. Enoka, R.M., Eccentric contractions require unique activation strategies by the nervous system. J Appl Physiol, 1996. 81(6): p. 2339‐46.
45. Grabiner, M.D. and T.M. Owings, EMG differences between concentric and eccentric maximum voluntary contractions are evident prior to movement onset. Exp Brain Res, 2002. 145(4): p. 505‐11.
46. McHugh, M.P., et al., Differences in activation patterns between eccentric and concentric quadriceps contractions. J Sports Sci, 2002. 20(2): p. 83‐91.
47. Nardone, A., C. Romano, and M. Schieppati, Selective recruitment of high‐threshold human motor units during voluntary isotonic lengthening of active muscles. J Physiol (Lond), 1989. 409: p. 451‐71.
48. Linnamo, V., et al., Motor unit activation patterns during isometric, concentric and eccentric actions at different force levels. J Electromyogr Kinesiol, 2003. 13(1): p. 93‐101.

42
49. Bilodeau, M., et al., Changes in the electromyographic spectrum power distribution caused by a progressive increase in the force level. Eur J Appl Physiol Occup Physiol, 1995. 71(2‐3): p. 113‐23.
50. Merletti, R., D. Farina, and M. Gazzoni, The linear electrode array: a useful tool with many applications. J Electromyogr Kinesiol, 2003. 13(1): p. 37‐47.
51. Sejersted, O.M. and G. Sjogaard, Dynamics and consequences of potassium shifts in skeletal muscle and heart during exercise. Physiol Rev, 2000. 80(4): p. 1411‐81.
52. Place, N., et al., Muscle fatigue: from observations in humans to underlying mechanisms studied in intact single muscle fibres. Eur J Appl Physiol.
53. Duchateau, J., J.G. Semmler, and R.M. Enoka, Training adaptations in the behavior of human motor units. J Appl Physiol, 2006. 101(6): p. 1766‐75.
54. Farina, D., et al., Assessment of average muscle fiber conduction velocity from surface EMG signals during fatiguing dynamic contractions. IEEE Trans Biomed Eng, 2004. 51(8): p. 1383‐93.
55. Komi, P.V. and P. Tesch, EMG frequency spectrum, muscle structure, and fatigue during dynamic contractions in man. Eur J Appl Physiol Occup Physiol, 1979. 42(1): p. 41‐50.
56. Pozzo, M., D. Farina, and R. Merletti, Electromyography: detection, processing and applications., in Handbook of biomedical technology and devices, J.E. Moore and Z. G., Editors. 2003, Boca Raton: CRC Press. p. 4.1‐4.66.
57. Fleckenstein, J.L., et al., Acute effects of exercise on MR imaging of skeletal muscle in normal volunteers. AJR Am J Roentgenol, 1988. 151(2): p. 231‐7.
58. Meyer, R.A. and B.M. Prior, Functional magnetic resonance imaging of muscle. Exerc Sport Sci Rev, 2000. 28(2): p. 89‐92.
59. Patten, C., R.A. Meyer, and J.L. Fleckenstein, T2 mapping of muscle. Semin Musculoskelet Radiol, 2003. 7(4): p. 297‐305.
60. Adams, G.R., M.R. Duvoisin, and G.A. Dudley, Magnetic resonance imaging and electromyography as indexes of muscle function. J Appl Physiol, 1992. 73(4): p. 1578‐83.
61. Shellock, F.G., et al., Acute effects of exercise on MR imaging of skeletal muscle: concentric vs eccentric actions. AJR Am J Roentgenol, 1991. 156(4): p. 765‐8.
62. Tesch, P.A., Muscle meets magnet. 1993, Stockholm, Sweden. 63. Aagaard, P., et al., Neural inhibition during maximal eccentric and
concentric quadriceps contraction: effects of resistance training. J Appl Physiol, 2000. 89(6): p. 2249‐57.
64. Komi, P.V., et al., Force and EMG power spectrum during eccentric and concentric actions. Med Sci Sports Exerc, 2000. 32(10): p. 1757‐62.

43
65. Moritani, T., S. Muramatsu, and M. Muro, Activity of motor units during concentric and eccentric contractions. Am J Phys Med, 1987. 66(6): p. 338‐50.
66. Farina, D., R. Merletti, and R.M. Enoka, The extraction of neural strategies from the surface EMG. J Appl Physiol, 2004. 96(4): p. 1486‐95.
67. Gandevia, S.C., Spinal and supraspinal factors in human muscle fatigue. Physiol Rev, 2001. 81(4): p. 1725‐89.
68. Sale, D.G., Influence of exercise and training on motor unit activation. Exerc Sport Sci Rev, 1987. 15: p. 95‐151.
69. De Luca, C.J., Myoelectrical manifestations of localized muscular fatigue in humans. Crit Rev Biomed Eng, 1984. 11(4): p. 251‐79.
70. Mills, K.R. and R.H. Edwards, Muscle fatigue in myophosphorylase deficiency: power spectral analysis of the electromyogram. Electroencephalogr Clin Neurophysiol, 1984. 57(4): p. 330‐5.
71. Arendt‐Nielsen, L. and K.R. Mills, The relationship between mean power frequency of the EMG spectrum and muscle fibre conduction velocity. Electroencephalogr Clin Neurophysiol, 1985. 60(2): p. 130‐4.
72. Arendt‐Nielsen, L., K.R. Mills, and A. Forster, Changes in muscle fiber conduction velocity, mean power frequency, and mean EMG voltage during prolonged submaximal contractions. Muscle Nerve, 1989. 12(6): p. 493‐7.
73. Farina, D., et al., Reproducibility of muscle‐fiber conduction velocity estimates using multichannel surface EMG techniques. Muscle Nerve, 2004. 29(2): p. 282‐91.
74. Stulen, F.B. and C.J. DeLuca, Frequency parameters of the myoelectric signal as a measure of muscle conduction velocity. IEEE Trans Biomed Eng, 1981. 28(7): p. 515‐23.
75. DeVries, H.A., Method for evaluation of muscle fatigue and endurance from electromyographic fatigue curves. Am J Phys Med, 1968. 47(3): p. 125‐35.
76. Viitasalo, J.H. and P.V. Komi, Signal characteristics of EMG during fatigue. Eur J Appl Physiol Occup Physiol, 1977. 37(2): p. 111‐21.
77. Cobb, S. and A. Forbes, Electromyographic studies of muscular fatigue in man. Am J Phys, 1923. 65: p. 234‐251.
78. Bigland‐Ritchie, B., E. Cafarelli, and N.K. Vollestad, Fatigue of submaximal static contractions. Acta Physiol Scand Suppl, 1986. 556: p. 137‐48.
79. Pozzo, M., et al., Muscle‐fiber conduction velocity estimated from surface EMG signals during explosive dynamic contractions. Muscle Nerve, 2004. 29(6): p. 823‐33.
80. Masuda, K., et al., Changes in surface EMG parameters during static and dynamic fatiguing contractions. J Electromyogr Kinesiol, 1999. 9(1): p. 39‐46.

44
81. Tesch, P.A., et al., Force and EMG signal patterns during repeated bouts of concentric or eccentric muscle actions. Acta Physiol Scand, 1990. 138(3): p. 263‐71.
82. Goldspink, D.F., Exercise‐related changes in protein turnover in mammalian striated muscle. J Exp Biol, 1991. 160: p. 127‐48.
83. Friden, J. and R.L. Lieber, Structural and mechanical basis of exercise‐induced muscle injury. Med Sci Sports Exerc, 1992. 24(5): p. 521‐30.
84. Clarkson, P.M. and M.J. Hubal, Exercise‐induced muscle damage in humans. Am J Phys Med Rehabil, 2002. 81(11 Suppl): p. S52‐69.
85. Shepstone, T.N., et al., Short‐term high‐ vs. low‐velocity isokinetic lengthening training results in greater hypertrophy of the elbow flexors in young men. J Appl Physiol, 2005. 98(5): p. 1768‐76.
86. Gibala, M.J., et al., Changes in human skeletal muscle ultrastructure and force production after acute resistance exercise. J Appl Physiol, 1995. 78(2): p. 702‐8.
87. Newham, D.J., et al., Ultrastructural changes after concentric and eccentric contractions of human muscle. J Neurol Sci, 1983. 61(1): p. 109‐22.
88. Yu, J.G., D.O. Furst, and L.E. Thornell, The mode of myofibril remodelling in human skeletal muscle affected by DOMS induced by eccentric contractions. Histochem Cell Biol, 2003. 119(5): p. 383‐93.
89. Wong, T.S. and F.W. Booth, Protein metabolism in rat tibialis anterior muscle after stimulated chronic eccentric exercise. J Appl Physiol, 1990. 69(5): p. 1718‐24.
90. Wong, T.S. and F.W. Booth, Protein metabolism in rat gastrocnemius muscle after stimulated chronic concentric exercise. J Appl Physiol, 1990. 69(5): p. 1709‐17.
91. Deschenes, M.R. and W.J. Kraemer, Performance and physiologic adaptations to resistance training. Am J Phys Med Rehabil, 2002. 81(11 Suppl): p. S3‐16.
92. Sale, D.G., Neural adaptation to resistance training. Med Sci Sports Exerc, 1988. 20(5 Suppl): p. S135‐45.
93. Rutherford, O.M. and D.A. Jones, The role of learning and coordination in strength training. Eur J Appl Physiol, 1986. 55(1): p. 100‐5.
94. Van Cutsem, M., J. Duchateau, and K. Hainaut, Changes in single motor unit behaviour contribute to the increase in contraction speed after dynamic training in humans. J Physiol, 1998. 513(Pt 1): p. 295‐305.
95. Sale, D., Specificity of training. Can J Sport Sci, 1992. 17(1): p. 71. 96. Narici, M.V., et al., Human quadriceps cross‐sectional area, torque and
neural activation during 6 months strength training. Acta Physiol Scand, 1996. 157(2): p. 175‐86.

45
97. Sale, D.G., J.E. Martin, and D.E. Moroz, Hypertrophy without increased isometric strength after weight training. Eur J Appl Physiol Occup Physiol, 1992. 64(1): p. 51‐5.
98. Weir, J.P., T.J. Housh, and L.L. Weir, Electromyographic evaluation of joint angle specificity and cross‐training after isometric training. J Appl Physiol, 1994. 77(1): p. 197‐201.
99. Thorstensson, A., et al., Effect of strength training on EMG of human skeletal muscle. Acta Physiol Scand, 1976. 98(2): p. 232‐6.
100. Ploutz, L.L., et al., Effect of resistance training on muscle use during exercise. J Appl Physiol, 1994. 76(4): p. 1675‐81.
101. Komi, P.V. and E.R. Buskirk, Effect of eccentric and concentric muscle conditioning on tension and electrical activity of human muscle. Ergonomics, 1972. 15(4): p. 417‐34.
102. Brandenburg, J.P. and D. Docherty, The effects of accentuated eccentric loading on strength, muscle hypertrophy, and neural adaptations in trained individuals. J Strength Cond Res, 2002. 16(1): p. 25‐32.
103. Colliander, E.B. and P.A. Tesch, Effects of eccentric and concentric muscle actions in resistance training. Acta Physiol Scand, 1990. 140(1): p. 31‐9.
104. Hakkinen, K. and P.V. Komi, Effect of different combined concentric and eccentric muscle work regimens on maximal strength development. J. Hum. Move. Stud., 1981. 7: p. 33‐44.
105. Friedmann‐Bette, B., et al., Effects of strength training with eccentric overload on muscle adaptation in male athletes. Eur J Appl Physiol. 108(4): p. 821‐36.
106. Hortobagyi, T., et al., Effects of standard and eccentric overload strength training in young women. Med Sci Sports Exerc, 2001. 33(7): p. 1206‐12.
107. MacDougall, J.D., et al., Effects of strength training and immobilization on human muscle fibres. Eur J Appl Physiol, 1980. 43(1): p. 25‐34.
108. Yu, J.G. and L.E. Thornell, Desmin and actin alterations in human muscles affected by delayed onset muscle soreness: a high resolution immunocytochemical study. Histochem Cell Biol, 2002. 118(2): p. 171‐9.
109. Wickiewicz, T.L., et al., Muscle architecture of the human lower limb. Clin Orthop Relat Res, 1983(179): p. 275‐83.
110. Kawakami, Y., T. Abe, and T. Fukunaga, Muscle‐fiber pennation angles are greater in hypertrophied than in normal muscles. J Appl Physiol, 1993. 74(6): p. 2740‐4.
111. Higbie, E.J., et al., Effects of concentric and eccentric training on muscle strength, cross‐ sectional area, and neural activation. J Appl Physiol, 1996. 81(5): p. 2173‐81.
112. Goldspink, G., Changes in muscle mass and phenotype and the expression of autocrine and systemic growth factors by muscle in response to stretch and overload. J Anat, 1999. 194 ( Pt 3): p. 323‐34.

46
113. Jones, D.A. and O.M. Rutherford, Human muscle strength training: the effects of three different regimens and the nature of the resultant changes. J Physiol (Lond), 1987. 391: p. 1‐11.
114. Housh, D.J., et al., Hypertrophic response to unilateral concentric isokinetic resistance training. J Appl Physiol, 1992. 73(1): p. 65‐70.
115. Hortobagyi, T., et al., Adaptive responses to muscle lengthening and shortening in humans. J Appl Physiol, 1996. 80(3): p. 765‐72.
116. Aagaard, P., et al., A mechanism for increased contractile strength of human pennate muscle in response to strength training: changes in muscle architecture. J Physiol, 2001. 534(Pt. 2): p. 613‐23.
117. Hakkinen, K., P.V. Komi, and P.A. Tesch, Effect of combined concentric and eccentric strength training and detraining on force‐time, muscle fiber and metabolic characteristics of leg extensor muscles. Scandinavian Journal of Sports Science, 1981. 3: p. 50‐58.
118. Houston, M.E., et al., Muscle performance, morphology and metabolic capacity during strength training and detraining: a one leg model. Eur J Appl Physiol Occup Physiol, 1983. 51(1): p. 25‐35.
119. Tesch, P.A., Skeletal muscle adaptations consequent to long‐term heavy resistance exercise. Med Sci Sports Exerc, 1988. 20(5 Suppl): p. S132‐4.
120. Tannerstedt, J., W. Apro, and E. Blomstrand, Maximal lengthening contractions induce different signaling responses in the type I and type II fibers of human skeletal muscle. J Appl Physiol, 2009. 106(4): p. 1412‐8.
121. Godard, M.P., et al., Effect of accentuated eccentric resistance training on concentric knee extensor strength. J Strength Cond Res, 1998. 12(1): p. 26‐29.
122. Hill, A.V., An instrument for recording the maximum work in muscular contraction. J Physiol, 1920. 53: p. 88‐90.
123. Berg, H.E. and P.A. Tesch, Designing methods for musculoskeletal conditioning in weightlessness. Physiologist, 1992. 35(1 Suppl): p. S96‐8.
124. Berg, H.E. and A. Tesch, A gravity‐independent ergometer to be used for resistance training in space. Aviat Space Environ Med, 1994. 65(8): p. 752‐6.
125. Tesch, P.A., et al., Muscle hypertrophy following 5‐week resistance training using a non‐gravity‐dependent exercise system. Acta Physiol Scand, 2004. 180(1): p. 89‐98.
126. Alkner, B.A., et al., Effects of strength training, using a gravity‐independent exercise system, performed during 110 days of simulated space station confinement. Eur J Appl Physiol, 2003. 90(1‐2): p. 44‐9.
127. Gazzoni, M., D. Farina, and R. Merletti, A new method for the extraction and classification of single motor unit action potentials from surface EMG signals. J Neurosci Methods, 2004. 136(2): p. 165‐77.

47
128. Berg, H.E., B. Tedner, and P.A. Tesch, Changes in lower limb muscle cross‐sectional area and tissue fluid volume after transition from standing to supine. Acta Physiol Scand, 1993. 148(4): p. 379‐85.
129. Tesch, P.A., J.T. Trieschmann, and A. Ekberg, Hypertrophy of chronically unloaded muscle subjected to resistance exercise. J Appl Physiol, 2004. 96(4): p. 1451‐8.
130. Alkner, B.A. and P.A. Tesch, Efficacy of a gravity‐independent resistance exercise device as a countermeasure to muscle atrophy during 29‐day bed rest. Acta Physiol Scand, 2004. 181(3): p. 345‐57.
131. Moore, C.A. and B.K. Schilling, Theory and application of augmented eccentric loading. Journal of Strength and Conditioning, 2005. 27(5): p. 20‐27.
132. Seynnes, O.R., M. de Boer, and M.V. Narici, Early skeletal muscle hypertrophy and architectural changes in response to high‐intensity resistance training. J Appl Physiol, 2007. 102(1): p. 368‐73.
133. Friden, J., M. Sjostrom, and B. Ekblom, Myofibrillar damage following intense eccentric exercise in man. Int J Sports Med, 1983. 4(3): p. 170‐6.
134. Yu, J.G., L. Carlsson, and L.E. Thornell, Evidence for myofibril remodeling as opposed to myofibril damage in human muscles with DOMS: an ultrastructural and immunoelectron microscopic study. Histochem Cell Biol, 2004. 121(3): p. 219‐27.
135. Lieber, R.L., L.E. Thornell, and J. Friden, Muscle cytoskeletal disruption occurs within the first 15 min of cyclic eccentric contraction. J Appl Physiol, 1996. 80(1): p. 278‐84.
136. Friden, J., et al., Adaptive response in human skeletal muscle subjected to prolonged eccentric training. Int J Sports Med, 1983. 4(3): p. 177‐83.
137. Farthing, J.P. and P.D. Chilibeck, The effects of eccentric and concentric training at different velocities on muscle hypertrophy. Eur J Appl Physiol, 2003. 89(6): p. 578‐86.
138. Hortobagyi, T. and F.I. Katch, Eccentric and concentric torque‐velocity relationships during arm flexion and extension. Influence of strength level. Eur J Appl Physiol Occup Physiol, 1990. 60(5): p. 395‐401.
139. Telley, I.A., et al., Half‐sarcomere dynamics in myofibrils during activation and relaxation studied by tracking fluorescent markers. Biophys J, 2006. 90(2): p. 514‐30.
140. Telley, I.A., et al., Dynamic behaviour of half‐sarcomeres during and after stretch in activated rabbit psoas myofibrils: sarcomere asymmetry but no ʹsarcomere poppingʹ. J Physiol, 2006. 573(Pt 1): p. 173‐85.
141. Morgan, D.L., New insights into the behavior of muscle during active lengthening. Biophys J, 1990. 57(2): p. 209‐21.

48
142. Proske, U. and D.L. Morgan, Muscle damage from eccentric exercise: mechanism, mechanical signs, adaptation and clinical applications. J Physiol (Lond), 2001. 537(Pt 2): p. 333‐45.
143. Friden, J. and R.L. Lieber, Eccentric exercise‐induced injuries to contractile and cytoskeletal muscle fibre components. Acta Physiol Scand, 2001. 171(3): p. 321‐6.
144. Child, R.B., J.M. Saxton, and A.E. Donnelly, Comparison of eccentric knee extensor muscle actions at two muscle lengths on indices of damage and angle‐specific force production in humans. J Sports Sci, 1998. 16(4): p. 301‐8.
145. Newham, D.J., et al., Muscle fatigue and pain after eccentric contractions at long and short length. Clin Sci (Lond), 1988. 74(5): p. 553‐7.
146. Butterfield, T.A. and W. Herzog, The magnitude of muscle strain does not influence serial sarcomere number adaptations following eccentric exercise. Pflugers Arch, 2006. 451(5): p. 688‐700.
147. Choi, H. and W.J. Williams, Improved time‐frequency representation of multicomponent signals using exponential kernels. IEEE Trans. Acoustics Speech and Signal Processing, 1989. 37(6): p. 862‐871.
148. Masuda, T. and A.M. De Luca, Recruitment threshold and muscle fibre conduction velocity of single motor units. J Electromyogr Kinesiol, 1991. 1(2): p. 116‐123.
149. Abbott, B.C., B. Bigland, and J.M. Ritchie, The physiological cost of negative work. J Physiol, 1952. 117(3): p. 380‐90.
150. Vandenborne, K., et al., Relationship between muscle T2* relaxation properties and metabolic state: a combined localized 31P‐spectroscopy and 1H‐imaging study. Eur J Appl Physiol, 2000. 82(1‐2): p. 76‐82.
151. Weidman, E.R., et al., Muscle activity localization with 31P spectroscopy and calculated T2‐weighted 1H images. Invest Radiol, 1991. 26(4): p. 309‐16.
152. Prior, B.M., et al., Fiber type and metabolic dependence of T2 increases in stimulated rat muscles. J Appl Physiol, 2001. 90(2): p. 615‐23.
153. Cavagna, G.A., B. Dusman, and R. Margaria, Positive work done by a previously stretched muscle. J Appl Physiol, 1968. 24(1): p. 21‐32.
154. Asmussen, E. and F. Bonde‐Petersen, Apparent efficiency and storage of elastic energy in human muscles during exercise. Acta Physiol Scand, 1974. 92(4): p. 537‐45.
155. Thys, H., T. Faraggiana, and R. Margaria, Utilization of muscle elasticity in exercise. J Appl Physiol, 1972. 32(4): p. 491‐4.
156. Komi, P.V., Physiological and biomechanical correlates of muscle function: effects of muscle structure and stretch‐shortening cycle on force and speed. Exerc Sport Sci Rev, 1984. 12: p. 81‐121.

49
157. Escamilla, R.F., et al., Biomechanics of the knee during closed kinetic chain and open kinetic chain exercises. Med Sci Sports Exerc, 1998. 30(4): p. 556‐69.
158. Signorile, J.F., et al., The effect of knee and foot position on the electromyographical activity of the superficial quadriceps. J Orthop Sports Phys Ther, 1995. 22(1): p. 2‐9.
159. Eloranta, V., Patterning of muscle activity in static knee extension. Electromyogr Clin Neurophysiol, 1989. 29(6): p. 369‐75.
160. Aagaard, P., et al., Increased rate of force development and neural drive of human skeletal muscle following resistance training. J Appl Physiol, 2002. 93(4): p. 1318‐26.
161. Cracraft, J.D. and J.H. Petajan, Effect of muscle training on the pattern of firing of single motor units. Am J Phys Med, 1977. 56(4): p. 183‐94.
162. Hakkinen, K., et al., Changes in agonist‐antagonist EMG, muscle CSA, and force during strength training in middle‐aged and older people. J Appl Physiol, 1998. 84(4): p. 1341‐9.
163. Baldwin, K.M., et al., NASA roundtable: Musculoskeletal adaptations to weightlessness and development of effective countermeasures. Med Sci Sports Exerc, 1996. 28(10): p. 1247‐53.
164. NASA, Human Research Roadmap: A Risk Reduction Strategy for Human Space Exploration (WWW doc.). http://humanresearchroadmap.nasa.gov/, 2010: p. Last Updated : Feb.
165. Akima, H., et al., Effect of short‐duration spaceflight on thigh and leg muscle volume. Med Sci Sports Exerc, 2000. 32(10): p. 1743‐7.
166. LeBlanc, A., et al., Regional muscle loss after short duration spaceflight. Aviat Space Environ Med, 1995. 66(12): p. 1151‐4.
167. LeBlanc, A., et al., Muscle volume, MRI relaxation times (T2), and body composition after spaceflight. J Appl Physiol, 2000. 89(6): p. 2158‐64.
168. Tesch, P.A., et al., Effects of 17‐day spaceflight on knee extensor muscle function and size. Eur J Appl Physiol, 2005. 93(4): p. 463‐8.
169. Trappe, S., et al., Exercise in space: human skeletal muscle after 6 months aboard the International Space Station. J Appl Physiol, 2009. 106(4): p. 1159‐68.
170. Akima, H., et al., Inactivity and muscle: effect of resistance training during bed rest on muscle size in the lower limb. Acta Physiol Scand, 2001. 172(4): p. 269‐78.
171. Bamman, M.M., et al., Impact of resistance exercise during bed rest on skeletal muscle sarcopenia and myosin isoform distribution. J Appl Physiol, 1998. 84(1): p. 157‐63.
172. Shackelford, L.C., et al., Resistance exercise as a countermeasure to disuse‐induced bone loss. J Appl Physiol, 2004. 97(1): p. 119‐29.
50
173. Schulze, K., P. Gallagher, and S. Trappe, Resistance training preserves skeletal muscle function during unloading in humans. Med Sci Sports Exerc, 2002. 34(2): p. 303‐13.
174. Yang, Y., et al., Space cycle: a human‐powered centrifuge that can be used for hypergravity resistance training. Aviat Space Environ Med, 2007. 78(1): p. 2‐9.
175. Lee, S.M., et al., Foot‐ground reaction force during resistive exercise in parabolic flight. Aviat Space Environ Med, 2004. 75(5): p. 405‐12.
176. Alkner, B.A. and P.A. Tesch, Knee extensor and plantar flexor muscle size and function following 90 days of bed rest with or without resistance exercise. Eur J Appl Physiol, 2004. 93: p. 294‐305.
177. Trappe, S., et al., Single muscle fiber function with concurrent exercise or nutrition countermeasures during 60 days of bed rest in women. J Appl Physiol, 2007. 103(4): p. 1242‐50.
178. Askling, C., J. Karlsson, and A. Thorstensson, Hamstring injury occurrence in elite soccer players after preseason strength training with eccentric overload. Scand J Med Sci Sports, 2003. 13(4): p. 244‐50.
179. Tous‐Fajardo, J., et al., The flywheel leg‐curl machine: offering eccentric overload for hamstring development. International Journal of Sports Physiology and Performance, 2006. 1: p. 293‐298.
180. Onambele, G.L., et al., Neuromuscular and balance responses to flywheel inertial versus weight training in older persons. J Biomech, 2008. 41(15): p. 3133‐8.
181. Greenwood, J., et al., Comparison of conventional resistance training and the fly‐wheel ergometer for training the quadriceps muscle group in patients with unilateral knee injury. Eur J Appl Physiol, 2007.