ACTUARIAL STUDY OF CYPRUS NATIONAL HEALTH …
65
ACTUARIAL STUDY OF CYPRUS NATIONAL HEALTH EXPENDITURE AND NATIONAL HEALTH SYSTEM HEALTH INSURANCE ORGANISATION OCTOBER 2013
Transcript of ACTUARIAL STUDY OF CYPRUS NATIONAL HEALTH …

ACTUARIAL STUDY OF CYPRUS NATIONAL HEALTH EXPENDITURE AND NATIONAL HEALTH SYSTEM HEALTH INSURANCE ORGANISATION OCTOBER 2013

ACTUARIAL STUDY OF HEALTH SYSTEM CYPRUS HIO
i
- MERCER i
CONTENTS
1. Executive Summary 1
• 1.1 Under The Current Healthcare System 2
• 1.2 Following NHS Implementation in 2016 3
2. Introduction 5
3. Current Healthcare Environment and the Proposed Healthcare Environment 7
• 3.1 The Current Healthcare Environment in Cyprus 7
• 3.2 Proposed Healthcare Environment - the main characteristics of the NHS 13
4. National Health Expenditure Analysis from 2005 to 2010 15
• 4.1 NHE evolution 15
• 4.2 Snapshot of NHE expenditure in 2010 16
5. Methodology 20
• 5.1 Expenditure projection modelling 21
• 5.2 Co-payments 26
• 5.3 Income projection modelling 26
6. Data 29
7. Key Assumptions 30
8. Healthcare Projection Results 32
• 8.1 National Healthcare Expenditure 2010 to 2016 in million € 32
• 8.2 Healthcare Expenditure 2016 to 2025 Assuming No NHS Implementation 32
• 8.3 Projections Assuming NHS Implementation in 2016 33
9. Sensitivity Analysis to Key Assumptions 37
10. Alternative Implementation Scenarios 39
11. Alternative Economic Scenario 40
• 11.1 National Healthcare Expenditure 2010 to 2016 in million € 41
• 11.2 Healthcare Expenditure 2016 to 2025 Assuming No NHS Implementation 41
• 11.3 Projections Assuming NHS Implementation in 2016 42
12. Risk & Benefits 45

ACTUARIAL STUDY OF HEALTH SYSTEM CYPRUS HIO
ii
- MERCER ii
Appendix A: Services excluded from NHS Coverage 48
Appendix B: Health Economic Analysis 49
• Methodology 51
• Data 54
• Results 55
Appendix C: Analysis of utilisation of inpatient and outpatient activity 56
Appendix D: NHS Income by Income Source 59
Appendix E: Proposed HIO Co-payments 60

ACTUARIAL STUDY OF HEALTH SYSTEM CYPRUS HIO
1
- MERCER 1
1 Executive Summary
Mercer has been asked by the Health Insurance Organisation (HIO) of Cyprus to provide an
updated actuarial estimation of the Cyprus National Health Expenditure (NHE), the National
Health System (NHS) expenditure and the contribution rate required to finance the NHS.
This analysis will be used to review the programme to design and install a NHS in Cyprus.
The last analysis was completed in September 2008. This report has been prepared in
accordance with the requirements of the Memorandum of Understanding on Specific
Economic Policy Conditionality between the Republic of Cyprus and the European
Commission acting on behalf of the European Stability Mechanism1.
The current Cyprus healthcare system consists of 2 parallel sub-systems (a public and a
private system) which operate separately leading to some inefficiencies and lack of
coordination of care. The financing of the current system is characterised by a high
proportion of out of pocket expenditure which implies a lack of equity within the system.
Although the current health expenditure is relatively low compared to the EU average, there
are concerns for upward trends in future which will increase the financial burden and
increase the risk of a financially unsustainable system.
The proposed National Health System (NHS) is designed to tackle the challenges of the
current system and achieve universality in coverage, good quality of care, equity, solidarity
and long term financial sustainability.
To reflect the current economic situation, Mercer has developed a composite model of the
Cyprus healthcare system, incorporating an economic analysis within an actuarial approach.
This model aims to capture the characteristics of the proposed NHS and thus represent
better the reality in the future. During the current period of economic uncertainty and until the
introduction of NHS (assumed to be 2016), the expected healthcare expenditure is forecast
using the economic analysis. From 2016, our actuarial model is used to forecast healthcare
expenditure. To ensure consistency between the approaches, the implied medical inflation
from the economic model has been used within our actuarial model.
A detailed expenditure snapshot was developed for 2010. This reflects our best estimate of
the NHE in 2010. Our healthcare model was then used to project this forward.
Regarding data, we were provided with considerable information from the Cyprus Statistical
Service of the Ministry of Finance and the Ministry of Health. For public sector, financial data
was available up to 2012. The private sector data was only available to 2011. There were
however areas where the data was limited particularly around recent healthcare activity and
private consultations.
The underlying assumptions are based on the agreed economic and demographic
framework with the Troika. Historical and current experience data on utilisation has been
1 Signed May 2013 – European Economy - Occasional Paper Number 149.

ACTUARIAL STUDY OF HEALTH SYSTEM CYPRUS HIO
2
- MERCER 2
used to estimate future experience.
The key results and findings are as follows:
1.1 Under The Current Healthcare System
2010 to 2016 National Healthcare Expenditure In million €
2010 2011 2012 2013 2014 2015 2016
Public* 572 605 585 594 550 512 510
Private* 708 704 687 607 580 597 624
Total NHE 1,280 1,308 1,272 1,201 1,130 1,109 1,134
Expenditure for services covered under NHS
1,006 1,029 999 949 891 873 891
*These are calculated after Mercer adjustments
Total healthcare expenditure is expected to continue falling until 2015. This downward trend
is expected to reverse from 2016 onwards. Private sector expenditure is more elastic and
falls more rapidly than the public sector expenditure over the period 2012 to 2014, but this
downward trend reverses earlier from 2015 onwards.
2016 to 2025 National Healthcare Expenditure Projections Assuming Current
System Million € 2016 2017 2018 2019 2020 2021 2022 2023 2024 2025
Total NHE 1,134 1,175 1,224 1,276 1,330 1,386 1,446 1,509 1,574 1,643
Expenditure for services covered under NHS
891 921 959 1,000 1,041 1,084 1,130 1,178 1,229 1,282
Note it takes 9 years (2020) to surpass the 2011 NHE of €1,308m.
Under the current healthcare system, expenditure is projected to continue to rise throughout
the projection period. In particular, the total expenditure increases from €1,134 m to €1,643
m over the period 2016 to 2025 representing an average growth rate of 4.2% p.a. Private
expenditure increases at a higher rate (4.87% p.a. over the period) than the Public
expenditure (3.33% p.a.).

ACTUARIAL STUDY OF HEALTH SYSTEM CYPRUS HIO
3
- MERCER 3
1.2 Following NHS Implementation in 2016
2016 to 2025 National Healthcare Expenditure Projections In Million €
2016 2017 2018 2019 2020 2021 2022 2023 2024 2025
Total NHE* 1,128 1,177 1,221 1,265 1,309 1,351 1,404 1,459 1,517 1,576
Expenditure for services covered under NHS*
886 927 964 995 1,027 1,058 1,098 1,140 1,184 1,230
NHE savings under NHS
7 (2) 3 12 21 35 42 50 58 66
*- This includes allowance for HIO administrative expenses and assumes fully utilised by 2018.
Following the initial slight impact of HIO administration costs, there will be increased control
of expenditure which will result in a reduction in the expenditure inflation over the period
2016 to 2025, limiting the growth rate to 3.7% p.a. Over the above period, cumulative
savings are € 292 m.
NHS will make use of several best practices such as global budgets, co-payments and
reimbursement methods to the healthcare providers (for details see section 3.2), which will
improve the cost containment. We have assumed that under NHS, the healthcare trend both
in the public and private sector will be similar and controlled with an overall annual trend
similar to the projected public spend trend of the current system. If the medical inflation could
be reduced by another 0.5%, then this would result in a 4.3% reduction in 2025 NHS costs.
2016 to 2025 NHS Income and Expenditure Projections Assuming NHS
Implementation in 2016 in Million €
2016 2017 2018 2019 2020 2021 2022 2023 2024 2025
Contributions in line with 2001 NHS Law
758 783 815 849 885 915 952 991 1031 1073
Minus Expenditure for services covered under NHS
886 927 964 995 1027 1058 1098 1140 1184 1230
Plus Co-payments based on HIO proposal (Appendix E)
90 92 94 97 101 104 108 112 116 120
(Deficit) / Surplus
(38) (52) (52) (48) (42) (39) (38) (38) (37) (36)

ACTUARIAL STUDY OF HEALTH SYSTEM CYPRUS HIO
4
- MERCER 4
It follows from the above table that the contributions as per 2001 NHS Law with co-payments
in line with HIO proposals will not be sufficient to meet the NHS expenditure. There will
therefore need to be additional funding. Expenditures will generally rise at a slightly lower
rate than the contributions and the deficit therefore reduces over the period. There are the
following policy options for funding this deficit:
1) through additional co-payments - increasing co-payments from €90m to €142m in
2016 (and thereafter increasing in line with medical inflation.
2) through a proportionate increase in contribution rate from all sources by 6.7 per cent.
The resulting contribution rates by source are as follows :
3) If the State’s contribution was increased to the budget level forecast under the current
system (i.e. the State would pay no more than they would do under the current
system), then the deficit could be financed by additional co-payments of €49m or an
increase in contributions rate from non-State contributors of 15.1 per cent resulting in
the following contribution rates
Source of Income Individual Employer State
Salaried employees 2.30% 2.93%
In-line with budgets Self employed 4.09% n/a
Pensioners 2.30% n/a
Other Income 2.30% n/a
Alternatively, this may be financed by excluding certain services or by using a combination of
the above.
The projections are particularly sensitive to the medical inflation. One percentage point
increase in medical inflation would increase the contribution rate required by approximately
6%. Cost containment measures are therefore key in the future.
We have also considered alternative scenarios. Firstly the potential of a phased
implementation of the NHS starting 12 months prior to 2016. It is noted that this could lead to
benefits more quickly but also has some additional costs up front. Secondly, an alternative
economic scenario (including higher unemployment and lower GDP in 2013 and 2014).
Under this scenario, healthcare spending reduces more rapidly and then grows in line with
economic growth. Contributions also reduce due to the lower employment rate. Overall, the
resultant funding requirements are similar to the above rates.
Source of Income Individual Employer State Total
Salaried employees 2.13% 2.72% 4.85% 9.71%
Self-employed 3.79%
4.85% 8.64%
Pensioners - GSIS, GEPS, other 2.13%
4.85% 6.99%
Other Income - Rent, interest, dividends, other
2.13%
2.13%

ACTUARIAL STUDY OF HEALTH SYSTEM CYPRUS HIO
5
- MERCER 5
2 Introduction
As part of an overall programme to design and install a NHS to provide universal coverage
through a single payor system for health care in Cyprus. Mercer has been asked to provide
an actuarial estimation of the Cyprus National Health Expenditure (NHE), the National
Health System (NHS) Expenditure and the contribution rate required to finance the NHS.
The present report is carried out in accordance with the requirements of the Memorandum of
Understanding on Specific Economic Policy Conditionality (MoU) between the Republic of
Cyprus and the European Commission acting on behalf of the European Stability
Mechanism2. Mercer’s first phase cost estimation analysis was completed in September
2008.
Historically, the discussion for health care reforms in Cyprus started 20 years ago with a
University of Harvard-University of York study. Since then several attempts have been made
to reform the health system and in 2001 the House of Parliament decided to introduce a
NHS. The design of NHS was based on the establishment of a universal social insurance
system financed by social insurance contributions and public funds, promoting at the same
time competition in the public and the private sector. Following the law, the HIO was set up
and has been developing the implementation strategy for the system with details around its
functionality and operation.
In Spring 2012 the Cyprus Council of Ministers, reaffirmed the formation of a road map for
the implementation of health care reforms aiming at universal coverage with long term
financial sustainability. Furthermore, the recently signed MoU between the Republic of
Cyprus and the European Commission encourages the development of policies for greater
efficiency and effectiveness of health care resources with closer public–private partnerships,
gate-keeping, Diagnosis Related Groupings (DRG’s), user charges and measures aiming at
the overall improvements in the performance of the health system.
Mercer has been asked to provide updated estimates of the NHE and NHS income and
expenditure under two different bases: firstly assuming no changes to the current healthcare
system; and secondly assuming NHS is introduced in 2016.
Our report provides
A brief summary of the current healthcare system and the proposed NHS development;
A detailed analysis of current healthcare expenditure;
A description of our methodology, data and assumptions;
The projection results with some key sensitivities and scenario analyses; and
Our key findings.
2 Signed May 2013 European Economy Occasional Paper Number 149

ACTUARIAL STUDY OF HEALTH SYSTEM CYPRUS HIO
6
- MERCER 6
In completing this analysis, Mercer have complied with International Actuarial Standards
including IASP1 and the following technical actuarial standards: TAS D (Data), TAS M
(Modelling) and TAS R (Reporting).
Mercer would like to thank the Health Insurance Organisation, the Ministry of Health, the
Ministry of Finance and the Statistical Service for their help and support in producing this
report.
We would also like to thank Professor John Yfantopoulos of the University of Athens for his
considerable support on the Health Economic Analysis.
We have focussed on an actuarial analysis for the current NHS proposals and have not
considered other policy options. We have also focussed on the financial position of NHS, i.e.
on the income and expenditure components rather than on specific health outcomes.
This report has been prepared for the Health Insurance Organisation (HIO). Mercer do not
accept any liability or responsibility to any third party in respect of this report.
Unless otherwise stated, we have relied on the information and data supplied to us and from
published sources, without independent verification. Mercer will not be responsible for any
inaccuracy in the report that is a result of any incorrect information provided to us.

ACTUARIAL STUDY OF HEALTH SYSTEM CYPRUS HIO
7
- MERCER 7
3 Current Healthcare Environment and the Proposed Healthcare Environment
3.1 The Current Healthcare Environment in Cyprus
Healthcare in Cyprus is currently offered by both the public and the private sector. The public
health service provision is exclusively financed by the State budget with services provided
through a network of hospitals and health centres, whereas the private health service
provision is mostly financed by out-of-pocket payments made directly to providers. Out-of-
pocket expenditure is estimated at approximately 87%3 of private healthcare expenditure
and 49% of total healthcare expenditure. Such a high proportionate share of out-of-pocket
expenditure, which is the highest among EU countries, implies lack of equity in financing and
accessing healthcare services.
Chart 1 – Out-of-Pocket Expenditure
Approximately 80% of the population is entitled to the provision of free healthcare services
from the public sector while the rest of the population is uncovered. Despite this, a much
smaller percentage of the public healthcare beneficiaries actually use these services. The
private and public sectors currently operate separately leading to concerns of overall
wastage of resources, overlaps in service coverage and lack of co-ordination and continuity
3 Source SHA Expenditure Data 2010

ACTUARIAL STUDY OF HEALTH SYSTEM CYPRUS HIO
8
- MERCER 8
of care. The oversupply of certain infrastructure in the private sector such as specialized
diagnostic equipment (MRIs, CT scans) highlights some inefficiencies in the system leading
to higher private healthcare expenditure.
Healthcare expenditure has been gradually increasing since 1999 both in monetary terms
and as a proportion of GDP (see Chart 2). Both total healthcare expenditure and public
healthcare expenditure are low compared to the EU average. The EU countries devote on
average around 8.9% of their GDP on health of which 6.5% is public and 2.4% is private.
Cyprus spends 7.4% of GDP on health of which 3.2% is public and 4.2% is private.
According to the data depicted in Chart 3 the proportionate share of the private sector is the
highest among the EU Member States. The recent growth trend particularly in the private
sector raises concerns of the future sustainability of the current system.
Chart 2 – Healthcare Expenditure Growth
Source: Cyprus Statistical Services, Health & Hospital Statistics 1998-2010; Provisional data 2011-12
€m

ACTUARIAL STUDY OF HEALTH SYSTEM CYPRUS HIO
9
- MERCER 9
Chart 3 Healthcare Expenditure Spend within Europe (% of GDP)
0,0
2,0
4,0
6,0
8,0
10,0
12,0
Ne
the
rlan
ds
Fran
ce
Ge
rman
y
De
nm
ark
Au
stri
a
Po
rtu
gal
Be
lgiu
m
Gre
ece
Spai
n
Swe
de
n
Un
ite
d K
ingd
om
Ital
y
Ire
lan
d
Slo
vak
Re
pu
blic
Slo
ven
ia
EU-2
7
Fin
lan
d
Mal
ta
Luxe
mb
ou
rg 3
Hu
nga
ry
Cze
ch R
ep
ub
lic
Cyp
rus
Bu
lgar
ia
Po
lan
d
Lith
uan
ia
Latv
ia
Esto
nia
Ro
man
ia
Swit
zerl
and
Serb
ia
No
rway
Ice
lan
d
Mo
nte
ne
gro
Cro
atia
FYR
of
Mac
ed
on
ia
Turk
ey
6,5
3,2
2,4
4,2
Private
Public
Source : Health at a Glance Europe 2012 OECD
Medical inflation has been one of the key drivers of private healthcare expenditure in Cyprus.
It is also higher than the EU average (see chart 4), raising concerns of the future
sustainability of the current system. Chart 5 demonstrates that this is being driven by
outpatient and inpatient. Drugs have remained level apart from the VAT increase in 2011.
Chart 4 – Healthcare Index for Cyprus vs EU – 2003-2012
Source – Eurostat HCPI Data

ACTUARIAL STUDY OF HEALTH SYSTEM CYPRUS HIO
10
- MERCER 10
Chart 5 – Comparisons between Consumer Price Inflation and Health Items For
Cyprus
Source – Eurostat HCPI Data

ACTUARIAL STUDY OF HEALTH SYSTEM CYPRUS HIO
11
- MERCER 11
Health Outcomes
Despite the relatively low level of expenditure, health care in Cyprus is currently of high
standards according to health outcome indicators and the World Health Organization
assessment classifies Cyprus among the developed countries of the World.
Life Expectancy
Cyprus enjoys a high level of health status in comparison to the rest of the EU-27 European
Countries. The life expectancy for men is 78.6 years (a gain of 3.3 year above the EU-27
average) and for women 83.4 (a corresponding gain of 2.7 years above the EU-27 average).
Health Life Years
Health Life Years (HLY) is an important policy indicator endorsed by the European Union
indicating the number of years lived in a good health. Alternatively HLY is a measure of life
expectancy without disability. Cyprus is the fifth Country among the EU-27 with the highest
HLY (see chart 6) indicating a gain of around 5 years above the average for the males and
3.7 years for the females.
Chart 6 - Health Life Years Males
0,0
10,0
20,0
30,0
40,0
50,0
60,0
70,0
80,0
Slo
vak
Re
pu
blic
Latv
ia
Esto
nia
Hu
nga
ry
Lith
uan
ia
Ge
rman
y
Slo
ven
ia
Fin
lan
d
Po
lan
d
Po
rtu
gal
Au
stri
a
Ro
man
ia
EU-2
7
Cze
ch R
ep
ub
lic
Ne
the
rlan
ds
De
nm
ark
Bu
lgar
ia
Fran
ce
Ital
y
Spai
n
Be
lgiu
m
Ire
lan
d
Cyp
rus
Luxe
mb
ou
rg
Un
ite
d K
ingd
om
Gre
ece
Mal
ta
Swe
de
n
61,064,9
Health Life Years Males
Source – Health at a Glance Europe 2012 OECD
Life Expectancy and HLY are influenced by a wide range of factors related to economy
(often approximated by GDP per capita) and the health sector, often expressed as health
expenditure per capita. The relationship between health spending and HLY is depicted in
Chart 7.

ACTUARIAL STUDY OF HEALTH SYSTEM CYPRUS HIO
12
- MERCER 12
Chart 7 – Health Life Year v Healthcare Expenditure
y = 40,859x0,0547
R² = 0,1573
50,0
55,0
60,0
65,0
70,0
75,0
0 500 1000 1500 2000 2500 3000 3500 4000 4500
He
alth
Lif
e Y
ear
s
Health Spending
CyprusGre.
Slo
Mal Swe
Lat
Nor
Health Inequalities
The World Health Organization has often argued that the prime objective of the health
systems across the world is to improve the health status of the population subject to existing
human, social and economic resources. This objective incorporates two important aspects
related to: 1) the highest attainable average level of health (“Goodness”) and 2) the smallest
possible differences in health among individuals and groups (“Fairness”). In the European
Council of 2006 the Ministers of Health of the EU countries stressed the importance of
certain values for their health systems related to: Universality, Access to good quality care,
Equity, Solidarity, and Long term financial sustainability.
The European Commission and the Eurostat have launched recently an investigation on the magnitude of health inequalities across Europe by combining the best practices in health inequalities measurement by taking into account the most reliable and comparable data sources. The results have indicated that health inequalities have been proven to be persistent and increasing over time across the EU Member States. This increase may be attributed to existing socio-economic differences between social groups, regions and countries, differences in health related behavior and the lack of targeted health policies and health care interventions. Chart 8 presents the magnitude of health inequalities based on subjective health for the EU-27 Member States. Health inequalities are measured by the Gini coefficient (G) ranging (O<G<1) from 0= perfect equality (Pure egalitarian) to maximum inequality =1. Cyprus presents one of the highest Gini coefficients among the EU countries, the 2nd highest after Greece.

ACTUARIAL STUDY OF HEALTH SYSTEM CYPRUS HIO
13
- MERCER 13
Chart 8 – Health Inequalities Index
0,0000
0,0500
0,1000
0,1500
0,2000
0,2500
0,3000
AT BE CY CZ DE DK EE ES FI FR GR HU IE IS IT LT LU LV NL NO PL PT SE SI SK UK Total
0,2848
0,2248
Gini coefficient
Source : European Commission, Eurostat
The challenges that the current health system faces such as rising costs, maintaining the
quality of services, inequalities in financing and accessing services, coupled with the current
economic conditions, highlight the need for changes to the current system.
3.2 Proposed Healthcare Environment - the main characteristics of the NHS
The proposed National Health System (NHS) is an insurance-based system which has been
designed to address the current challenges, distortions and deadlocks in the healthcare
sector. This will be achieved by adopting good practices of other national health systems4
and adjusting these to the needs of the local population whilst taking into account social and
economic conditions. The main principles and characteristics of the proposed NHS are
briefly described below:
Universal coverage: All Cypriot citizens will become beneficiaries of the NHS.
Comprehensive benefits package: The NHS benefits package will cover a broad
spectrum of healthcare services including primary care, outpatient specialist care,
pharmaceuticals, clinical laboratory tests, allied health professionals, accident &
emergency care, ambulance care, inpatient care and limited dental care.
Equal treatment of beneficiaries: All beneficiaries will have the same rights in respect
of the provision of healthcare services and therefore reducing the health inequalities
within the NHS.
4 As recommended in a recent Joint Report on Health Systems prepared by the European Commission and the
Economic Policy Committee.

ACTUARIAL STUDY OF HEALTH SYSTEM CYPRUS HIO
14
- MERCER 14
Free choice of healthcare providers: Beneficiaries will have the right to choose their
healthcare providers from both the public and the private sector.
Solidarity: Beneficiaries will contribute to the NHS according to their income level.
Hence, beneficiaries with higher income will contribute more to the benefit of
beneficiaries with lower income.
Access to healthcare services by beneficiaries will take place after enrolment to the system,
followed by registration with a Family Doctor (FD)/Paediatrician Family Doctor (PFD). As a
rule, the beneficiaries will visit directly the FD/PFD and if then required will be referred to
other healthcare providers within the system depending on his/hers specific medical needs.
In order to contain the growth rate of healthcare expenditure and improve the quality of
healthcare services, the NHS incorporates the following mechanisms and good practices:
a) Single payor organization: The NHS will be managed independently by a single
organization (the Health Insurance Organization), which is expected to increase economies
of scale and reduce the overall costs through bulk buying.
b) Solid basis for financing: The NHS will be self-funded by the contributions that will be
made by the employees, self-employed, other income earners (such as income from
dividends, interest and rent), employers and the State. This ensures a solid basis of
financing from multiple sources.
c) Global Budget: Total expenditure for the provision of services within the NHS will be pre-
determined, following collective negotiations with healthcare providers and actual
expenditure will not exceed the total pre-determined budget.
d) Healthcare provider reimbursement method: The reimbursement method of healthcare
providers such as capitation fees for Family Doctors, Diagnosis Related Group (DRG) based
fees for inpatient care and point system mechanism will discourage the excessive use of
services and incentivize the prudent behaviour of healthcare providers. The reimbursement
mechanism for drugs will incentivize the use of generic drugs where available.
e) Cost sharing: The introduction of co-payments that the users will have to make for
certain services will discourage the overuse of services offered and will contribute further to
the containment of expenditure.
f) Family doctor: The introduction of the Family Doctor (FD) concept will organize efficiently
the provision of primary healthcare. It will ensure immediate access of patients to healthcare
services and contribute significantly to the prevention of diseases, the improved
management of chronic diseases and the control and containment of expenditure since the
FD will assume the role of “gatekeeper” within the system.
g) Introduction of minimum requirements and treatment guidelines for healthcare providers:
All providers offering services within the NHS will have to comply with certain minimum
requirements regarding their qualifications, available resources and infrastructure and to
follow approved treatment guidelines so as to ensure uniform and high-level quality of
services.

ACTUARIAL STUDY OF HEALTH SYSTEM CYPRUS HIO
15
- MERCER 15
4 National Health Expenditure Analysis from 2005 to 2010
The main objectives of this section are to review the historical evolution of the NHE in
Cyprus over the years from 2005 to 2010 and establish the 2010 ‘snapshot’ figures for
healthcare spending in Cyprus under the existing health system.
4.1 NHE evolution
Chart 9 shows the historical trend in NHE, in total and by main type of service (see Table 10)
over the period 2005-2010 based on the joint OECD, Eurostat and WHO system of health
accounts system (SHA) methodology.
Chart 9 - Cyprus National Health Expenditure 2005-2010 – Amounts in million € by main
type of service
249 279 298425 460 480
244259
277
359381
400
4650
53
5963
67
194204
217
241239
250
10393
90
8691
87
0
200
400
600
800
1,000
1,200
1,400
2005 2006 2007 2008 2009 2010
NH
E in
millio
n €
Other
Medical goods to OP
Clinical labs
Out-patient
In-patient
835884
934
1,1691,234
1,284
Source: Eurostat (SHA) 2005-2010
Table 10 - The main categories of healthcare expenses
Category Description
Inpatient Inpatient curative and rehabilitative care, day cases, A&E and ambulance.
Outpatient Outpatient primary care, specialist care including diagnostic imaging, allied health professionals and miscellaneous ancillary services.
Clinical labs Clinical laboratory
Medical Goods to Outpatients
Pharmaceutical and other medical non-durables, and therapeutic appliances and other medical durables
Other Administration, prevention health and capital formation

ACTUARIAL STUDY OF HEALTH SYSTEM CYPRUS HIO
16
- MERCER 16
The main points from Chart 9 are as follows :
The NHE, over the period 2005-10, has increased from €835m to €1284m
representing an increase of 54%;
The largest expenditure increase came from inpatient services which grew from
€249m in 2005 to €480m in 2010, representing a 93% increase ; and
The second largest increase came from outpatient which grew from €244m in 2005
to €400m in 2010, representing a 64% increase.
Chart 11 - Cyprus National Health Expenditure 2005-2010 – Allocation of NHE by main
type of service
30% 32% 32% 36% 37% 37%
29% 29% 30%31% 31% 31%
5% 6% 6%5% 5% 5%
23% 23% 23%21% 19% 19%
12% 11% 10% 7% 7% 7%
0%
10%
20%
30%
40%
50%
60%
70%
80%
90%
100%
2005 2006 2007 2008 2009 2010
Allocation of NHE by main type of service
Other
Medical goods to OP
Clinical labs
Out-patient
In-patient
Source: Eurostat (SHA) 2005-2010
It follows from Chart 11 that the Inpatient service has consistently been the largest
expenditure amounting to 37% in 2010 while the outpatient service has been the 2nd largest
amounting to 31%. The proportionate allocation has been consistently level since 2008.
4.2 Snapshot of NHE expenditure in 2010
Following a detailed review performed on the 2010 health expenditure data in Cyprus, as per
SHA methodology, and an assessment of the reliability of that data through internal and
external benchmarks, Mercer has concluded that there has been a small overestimate of
total spend in 2010 of approximately €5m, consisting of an underestimate of public spending
of €22m and an overestimate of private spending of €27m. In addition, evidence suggested
the need for a reallocation of some funds in both the public and private sectors between a
number of categories of spend. Charts 12 and 13 present graphically the decrease and
reallocation of health expenditure in 2010.

ACTUARIAL STUDY OF HEALTH SYSTEM CYPRUS HIO
17
- MERCER 17
Chart 12 - Snapshot 2010 – Comparison of total spending with and without Mercer
assumptions (in million €)
Source – Eurostat (SHA) 2010, Mercer estimates
1,284 1,279

ACTUARIAL STUDY OF HEALTH SYSTEM CYPRUS HIO
18
- MERCER 18
Chart 13 - Snapshot 2010 – Comparison of Public and Private Spend with and without
Mercer revisions (in million €)
Source – Eurostat (SHA) 2010, Mercer estimates

ACTUARIAL STUDY OF HEALTH SYSTEM CYPRUS HIO
19
- MERCER 19
We have highlighted below the main points in relation to the Mercer assumptions, which
were used to derive the public and private expenditure figures for 2010 as shown in Chart 13
above:
1. Total public spend – The spending on the public health system in 2010 has been revised upwards from €550m to €572m in line with State budget figures.
2. Allocation of public spending - The public spending of €572m was allocated into the various categories of spend (service departments) based on a cost accounting allocation exercise undertaken by the HIO and reviewed by Mercer. Under that exercise, direct costs, such as staff costs, were allocated directly to service departments, while indirect costs, such as repairs and maintenance, utilities and office administration, were allocated to service departments primarily by the proportion of direct costs.
3. Total private spending – The private health care spending in 2010 has been revised downwards from €735m to €708m because:
i. A total amount of approximately €5m representing State subsidies towards some specialised institutions, such as Genetics Institute and Karaiskakio, was subtracted from the private sector since it was included in the public spending figures; and
ii. An amount of €22m representing an overestimate in spending on medical goods to outpatient. This was based on a detailed research performed by HIO and reviewed by Mercer. Through that research, actual volume data of medical goods in private sector, broken into inpatient/ outpatient and prescription/ over-the-counter, was collated and analysed.
4. Private – movement from outpatient to inpatient spending - In the private sector, an amount of €25m has been shifted from outpatient to inpatient based on the reliability checks performed on the inpatient and outpatient data. In particular, through a detailed analysis of utilisation data for inpatient and outpatient through internal and external benchmarks, it was established that private outpatient spending was overestimated by approximately €25m. Details on the above analysis are presented in Appendix C. The above shift can be explained by the fact that private doctors, when they perform inpatient work, are in a lot of cases paid under a separate billing arrangement than the hospitals. This means that in those cases their inpatient activity gets captured in the outpatient part of the SHA health expenditure data.
5. Private labs - In the private sector, an amount of €10m has been shifted from clinical
labs to inpatient based on the reliability checks performed on the clinical labs figures.
In particular, based on the results of a previous study on outpatient private labs tests
volume and an analysis of the weighted average price per lab test in the private
sector, which was estimated using the detailed public labs tests volume (which
represents 75%-80% of the total volume) and applying to them available private
prices per lab test, Mercer believes that €10m should be moved to the inpatient
spending.

ACTUARIAL STUDY OF HEALTH SYSTEM CYPRUS HIO
20
- MERCER 20
5
Methodology
The actuarial review of health system makes use of a comprehensive methodology
developed for the purposes of meeting the two key policy aims of the study – assessing the
financial impact of the introduction of the proposed national health reforms in 2016 (through
the actuarial model) and reviewing the significant impact of the current economic situation in
Cyprus on healthcare expenditure (through the economic model). The overall model is
consistent as the medical inflation assumption for 2016 onwards is derived from the
economic model. The deployment of such a composite modeling approach allow us to
capture the key features of the proposed NHS and model its financial consequences, as well
as better measure the sensitivity of key variables onto projection results. Chart 14 shows
graphically the methodology used in this actuarial study.
Chart 14 – Projection Methodology
As shown in Chart 14 above, the projections in this study are based on the legal provisions
of the current situation and proposed future National Health System, data regarding the
starting point of projections including the snapshot health expenditure data, and assumptions
regarding future demographic and economic experience.
The actuarial exercise starts with a projection of the future demographic and economic
environment of Cyprus, based on a framework of assumptions agreed with Troika and which
relate to the general population, the economic growth, the labour market and the evolution
and distribution of wages. Next, other economic projection factors specifically related to the
current health system, which is assumed to be in force from now until the end of 2015, and
to the proposed NHS, which is assumed to be in force from 2016 onwards, are determined
and are used in combination with the demographic/ economic framework.

ACTUARIAL STUDY OF HEALTH SYSTEM CYPRUS HIO
21
- MERCER 21
5.1 Expenditure projection modelling
In the previous actuarial study in 2008, the expenditure model used was an actuarial
component-based model which enabled us to consider the impact of the proposed health
reforms through their impact on utilisation and unit costs. We have updated this model to
reflect the latest available data. To reflect the economic situation in the short and medium
term, we have also integrated a macro level econometric model which enables us to
consider the economic impact until 2016. From 2016, we have also incorporated certain
health economic factors, such as medical inflation, consistent with the underlying economic
framework.
Our overall health care expenditure model is therefore a combined model enabling us to
more accurately reflect future healthcare expenditure.
The diagram below provides a summary of our overall approach. We will then provide further
details regarding the economic and actuarial elements of our model.
Chart 15 – Determining the drivers of healthcare expenditure – our approach
SUPPLYFACTORS
■ Out-patient■ In-patient■ Other services
PRICES ANDUNIT COSTS
UTILISATIONRATES
■ Total healthspending
■ Public healthspending
■ Private healthspending
■ Reimbursementof providers
■ Gatekeeping■ Financing
■ Populationstructure
■ National income■ Health status
■ Resource inputs- Human- Infrastructure
HEALTH SYSTEMFEATURES
DEMANDFACTORS
EXOGENOUSFACTORS
■ Socio-economic conditions ■ Health policies■ Technological advances■ Climate change
Interaction between Demand-side factors,Supply-side factors and
Health system institutional features
Healthcare
Expenditure
■ Out-patient■ In-patient■ Other services

ACTUARIAL STUDY OF HEALTH SYSTEM CYPRUS HIO
22
- MERCER 22
5.1.1 The Economic Model (focussed on 2011 – 2015)
We are focusing here on the medium term impact of the economic situation and basing our
projections on the agreed economic framework. A key driver of healthcare spending is GDP
and therefore this is a major variable in our models. We considered several econometric
models to produce estimates of the healthcare expenditure costs and its components from
2011 to 2016 based on the historical data of the period 1998-2010. Following these analysis,
various statistical tests were undertaken to determine the suitability of the models. The most
suitable models were then incorporated within our analysis to determine the Healthcare
Expenditure until 2016.
For Public Expenditure, the model incorporates the impact of its own lagged value and GDP.
This is expected to provide the best indicators of medium-term forecasts of Health
Expenditure. This takes the form:
HEt = α + β1HEt-1 + β2GDPt + β3GDPt-1 + εt
where HEt = Health expenditure for time t, GDPt = Gross Domestic Product for time t, β is
unknown fixed regression coefficient, a = constant term, et = random error term
For Private Expenditure, the model was based on current GDP reflecting the more short
term considerations around private spend, primarily due to the importance of out-of-pocket
expenditure. Health Expenditure is regressed as a linear function of GDP (assuming all other
factors unchanged), and it takes the form:
HEt = α + β1 GDPt + εt
where HEt = Health expenditure for time t, GDPt = Gross Domestic Product for time t, β is
unknown fixed regression coefficient, a = constant term, et = random error term
A key assumption is that the historic experience is relevant in the future. In particular, we
assume that the historical elasticities developed are symmetric i.e. they are appropriate
during economic growth or decline.
More details on the economic modelling are provided in Appendix B.
ACTUARIAL STUDY OF HEALTH SYSTEM CYPRUS HIO
23
- MERCER 23
5.1.2 The Actuarial Model (2016-2025)
This actuarial model is an activity based model. The healthcare expenditure is based on the
projected healthcare activity level multiplied by forecasted unit costs for each activity within
each main category of spending such as inpatient, outpatient etc.
From the snapshot expenditure results as presented in Section 4 of this report, we have data
regarding the utilisation and unit costs for each major activity in 2010. There is a
considerable variation in healthcare utilisation with age and we have therefore reflected this
by considering the utilisation for each age band. This is particularly important to ensure that
we allow for the impact of the ageing population.
We use this historic experience as a guide for our future projections. We have made
adjustments to this to reflect any changes in the system over time. In particular, we have
reflected the impact of the current economic situation and also the structural changes
proposed through the introduction of NHS.
2011 to 2016
Based on historic utilisation experience, the forecast demographic profile and the
adjustments highlighted below, we have forecasted the expected activity. Until 2016, the
system will be consistent with the current system but will clearly be affected by the economic
situation. The unit costs are calculated to be consistent with the projection results as per
economic model.
2016 to 2025
From 2016, the NHS changes are introduced. The expected impact is reflected by
adjustments to the projected utilisation and unit costs from 2016. In addition, demographic
changes, the economic situation and current trends all continue to impact. Mercer believe
that the combination of NHS measures and the focus on cost containment will improve the
ability to control costs and manage medical inflation in the future.
The following adjustments were allowed for:
Trend : This represents the underlying changes in service utilization and cost over
time. This will reflect the effects of changes in morbidity, technology, general
appetite/demand for services, and price inflation. Annual trend factors reflect the
combined effects of utilization change, price inflation, demographic changes and the
mix of services used. To ensure economic consistency, we have used trend figures
from the economic model.
Provider reimbursement: This reflects the expected change in unit cost levels
associated with NHS changes in provider contracting (beyond that associated with
annual price inflation). In particular, the impact of the global budget and the single
payor organisation. These should lead to more effective cost management.
Insurance effect: A sustained increase in service utilization that reflects the
phenomenon that individuals use more health care services when they are insured
than when they are responsible for full payment out of pocket. Note out of pocket
expenses are relatively high for Cyprus.
ACTUARIAL STUDY OF HEALTH SYSTEM CYPRUS HIO
24
- MERCER 24
Care management: This reflects changes in expected utilization of services
associated with system design elements such as a physician gatekeeper/medical
home environment, electronic record keeping and real-time editing of prescription
drugs, and incentives to reduce unnecessary A&E visits. This will also lead to
switches from inpatient to outpatient activity.
Physician incentives: Additional care management effects associated with the
implementation of performance incentives for family doctors, paediatric family
doctors, and outpatient specialist physicians. The baseline scenario assumes that the
first 3 years of the NHS implementation include incentive payments for data
submission. Beginning in year 2019, incentives will be based on referral and
prescription patterns and thus may influence service utilization levels.
This approach is used for each of the key areas. We have highlighted below any particular
issues for each of these areas.
Inpatient
Care management will lead to a slight reduction in inpatient activity. This will be through the
physician gatekeeper (ensuring that only appropriate activity is undertaken and outpatient is
considered where more appropriate). We have, however, allowed for an initial slight increase
in services due to increased coverage. However, this is expected to be smaller and for a
shorter term as compared to other types of service as a result of the less discretionary
nature of inpatient services.
In addition, the reimbursement method through the Diagnosis Related Group (DRG) system
will lead to a more uniform and predictable model of expenditure. We expect that this shift
will also lead to a more efficient use of resources.
We have assumed that the cost per hospital day is the same for each specialty. The average
length of stay figures are relatively low compared to other countries and we have assumed
that these remain level over the projection period.
Outpatient Specialists
There is limited information available around private sector use of outpatient facilities. We
have however followed a consistent approach to that described in the Snapshot analysis.
Following NHS implementation, we would expect the global budget approach and point
system mechanism to have a considerable impact on the outpatient specialists’ behaviour.
We expect care management through FDs to influence outpatient activity in two ways: on the
one hand we expect the FD to better filter visits to outpatient specialists but on the other
hand we would expect the physician gatekeeper to refer some potential inpatient activity to
more cost effective outpatient activity, in line with protocols to be introduced.
Medical goods to outpatients
The design of NHS introduces measures that will control the utilisation of medical goods
such as co-payments, generic drug reimbursement and the use of a uniform information

ACTUARIAL STUDY OF HEALTH SYSTEM CYPRUS HIO
25
- MERCER 25
technology platform that will enable monitoring of prescribing patterns and stockpiling by
patients. In addition, the increased expenditure for new medicines will be counterbalanced
by the increased use of generics.
The fact that the price negotiations for medical goods will be undertaken by a single payor
organisation achieves high negotiation power and stable levels of budgets over time.
Family doctor costs
The reimbursement methods used for Family Doctors (FD) through capitation fee adjusted
for age, ensure that the FD expenditure over time will be highly controlled.
It should be added that even though it is expected that there will be an insurance effect for
the FD services this will not affect the expenditure as the reimbursement methods used is
not related with the volume of services provided by the FDs. FD expenditure is expected to
increase only due to medical inflation.
Accident & Emergency (A&E) and Ambulance
The expenses for A&E and Ambulances are expected to increase in line with outpatient
activity and underlying medical inflation costs.
For A&E, NHS will introduce a stricter implementation of a triage process that aims in routing
the non-urgent cases from A&Es to primary healthcare. Under NHIS, the new
reimbursement system based on care levels is expected to further control costs by
reimbursing a casemix of services.
In the case of Ambulances, the global budget principle will ensure that yearly expenses are
contained to the budgeted ones.
Allied Health professionals
The global budget principle is an important measure since it will ensure that expenditure for
AHP will not exceed the agreed budget.
Furthermore, control of access to AHP services through FD / Outpatient specialist and the
introduction of co-payments will further control the AHP expenditure despite an expected
increase in the activity due to the insurance effect.
Labs The referral system through Family Doctor / Outpatient specialist in combination with the co-payment and the clinical protocols is expected to control the expenditure in respect of the laboratories and will counterbalance any insurance effect.
Other
These are expected to increase in line with medical inflation.

ACTUARIAL STUDY OF HEALTH SYSTEM CYPRUS HIO
26
- MERCER 26
5.2 Co-payments
HIO has provided Mercer with a detailed analysis of co-payments for each type of service,
which are considered by HIO to be the base case scenario (see Appendix E for details).
Mercer has included the figures in the actuarial model and estimated that the co-payments of
the base case scenario will finance NHS with €90m in 2016. These co-payments are
assumed to increase in line with medical inflation.
The total expenditure less the co-payments represents the funding required for NHS. 5.3 Income projection modelling
HIO has provided us with a base case scenario for the financing method of NHS. Based on
this scenario, the HIO will be financed primarily through contributions and at a lesser extent
via co-payments.
5.3.1 Contributions
The main components of contribution income under the NHS is contributions paid by active
insured population and pensioners, primarily of the General Social Insurance Scheme
(GSIS). Other smaller sources of NHS income include contributions from rent, interest on
deposits, etc.
In order to model NHS contribution income, a macro-economic actuarial pension model was
deployed, consistent with the pension model used for the actuarial valuation of the GSIS.
The model uses a cohort approach using the “flow method” for generating future generations
of active insured persons and pensioners on a single age basis.
Contribution income is the result of the contribution rate applied to the covered earnings.
Under existing NHS legislation the contribution rates for each contributor segment are shown
below (Chart 16).
Chart 16 – Contribution rates under current statute
Individual Employer State
Employed
Salaried employees 2.00% 2.55% 4.55% 9.10%
Self-employed 3.55% 4.55% 8.10%
Pensioners
GSIS, GEPS, other 2.00% 4.55% 6.55%
Rent, interest, dividends, other 2.00% 2.00%
Source of IncomeContributor
Total
Other income

ACTUARIAL STUDY OF HEALTH SYSTEM CYPRUS HIO
27
- MERCER 27
Covered earnings result from:
1. the number of active insured persons and the average earnings on which contributions
are paid; and
2. the number of pensioners and the average pension on which contributions are paid.
Chart 17 illustrates how the NHS income from GSIS active insured persons over the period
2016-25 is developed.
Chart 17 – Income development process for active insured population
Base
population
2011
Assumptions
Labour force
participation rates
Unemployment
rates
Assumptions
GSIS coverage
rates
Assumptions
Fertility
Mortality
Migration
Projected
population
2016-2025
Employed
population
2016-2025
Assumptions
Salary inflation
Distribution of earnings
by age and gender
Salaries in
base year
2011
GSIS projected average
contributory earnings
2016-2025
NHS
contribution
rateX X
NHS income from GSIS active insureds
2016-2025
GSIS active
insured population
2016-2025
As it is shown in Chart 17, the demographic projections of the active insured population are
derived from the following:
The total population is projected starting with the actual population by age and sex, and
projecting that population over several decades using appropriate assumptions concerning fertility, mortality and migration;
Labour force participation rates are applied to the total population to obtain the labour force, distributed by age and sex;
The labour force is then separated into employed and unemployed persons;
Finally, NHS contributors represent a subset of the employed population. They are projected by using appropriate assumptions about the rate of coverage of the employed population under the NHS.

ACTUARIAL STUDY OF HEALTH SYSTEM CYPRUS HIO
28
- MERCER 28
Chart 18 illustrates how the NHS income from GSIS pensioners over the period 2016-25 is
developed.
Chart 18 – Income development process for GSIS pensioner population.
As it is illustrated in Chart 18, in order to determine the projected number of GSIS
pensioners, by type of pension, the following income development process is applied:
Starting with the number of active insured persons and using past service records it is
determined whether these persons are eligible to the various types of pensions.
Once this potential population of beneficiaries is established, a probability of occurrence of the risk involved (type of benefit) is applied to the eligible population to determine the number of new pensioners that will emerge each year.
The probability of occurrence of the benefit varies according to the benefit involved. It may
be:
retirement rates for determining old-age pensions;
invalidity incidence rate for determining invalidity pensions; and
mortality rates for determining survivors’ pensions.
These new GSIS pensioners are then projected in the future using survival rates.

ACTUARIAL STUDY OF HEALTH SYSTEM CYPRUS HIO
29
- MERCER 29
6
Data
Mercer had several meetings with the HIO, who provided considerable detail around the
current healthcare system and the proposed changes. Some of the major data sources used
in this study are the following:
Cyprus Statistical Services - Health & Hospital Statistics 2003 – 2010 (providing
detailed information around public healthcare usage); Household budget survey
2009; Consumer price indexation data, provisional financial and utilization data for
2011 and 2012, Economic Statistics on Health 2009 and 2010.
Eurostat healthcare expenditure as per SHA methodology.
Additional incident level data for public and private sector was provided by the
Ministry of Health.
Eurostat’s and OECD’s healthcare databases were also used to provide external
benchmarking data.
Ministry of Finance – budget data for health services 2010 to 2015.
Social insurance services – data on the insured population for actives and
pensioners of the General Social Insurance Scheme.
Data Limitations
There were several areas where data was limited. Our approach regarding these areas is
described below.
a) Details of public health activity were only available to 2011. Private inpatient data
was available to 2012. There is therefore limited data to assess the impact of the
economic situation. Note our economic analysis has been used to assess the impact
of the economic situation.
b) No recent private outpatient activity data is available. We have therefore been
required to estimate this based upon the consistency in the ratio of total outpatient to
inpatient activity levels. That assumption was validated through external
benchmarking (see Appendix C for details on this).
c) For inpatient data, we do not have detailed data around disease.
d) There will be significant reductions in healthcare spending over the next few years. It
is not possible at this time to specify what these changes will be. We have therefore
not allowed for all the potential additional benefits arising from NHS implementation
as it may not be possible to deliver these economies following the reductions until
2016. We would however expect NHS to ensure that healthcare effectiveness,
outcomes and health inequalities are improved.

ACTUARIAL STUDY OF HEALTH SYSTEM CYPRUS HIO
30
- MERCER 30
7
Key Assumptions Economic framework
We have used the economic framework as agreed with the Troika. This ensures that any
assumptions are economically consistent. The key assumptions are as follows :
2012 2013 2014 2015 2016 2017 2018
GDP growth (real) -2.4% -8.7% -3.9% 1.1% 1.9% 2.3% 2.2%
CPI Inflation 3.1% 1.0% 1.2% 1.6% 1.7% 1.7% 1.8%
GDP deflator 2.0% 0.6% 1.1% 1.5% 1.8% 1.9% 1.9%
Unemployment 11.9% 15.3% 16.7% 14.4% 13.5% 12.7% 11.8%
Real wage inflation -4.0% -4.9% -5.0% -3.4% -0.5% -0.1% 0.0%
2019 2020 2021 2022 2023 2024 2025
GDP growth (real) 1.9% 1.8% 2.1% 2.0% 2.1% 2.0% 2.1%
CPI Inflation 1.9% 2.0% 2.0% 2.0% 2.0% 2.0% 2.0%
GDP deflator 1.9% 2.0% 2.0% 2.0% 2.0% 2.0% 2.0%
Unemployment 10.9% 10.0% 9.7% 9.5% 9.2% 9.0% 8.8%
Real wage inflation 0.0% 0.0% 0.5% 0.6% 0.7% 0.9% 1.1%
In section 11, we consider an alternative economic scenario.
Demographic – The demographic framework has also been agreed with Troika. It is in line
with the demographic projections of the 2012 ageing report of the Ageing Working Group of
the Economic Policy Committee (EPC) of the EU. The average age is expected to increase
from 37.6 (in 2010) to 40.4 (in 2025). It is noted that 3rd country nationals are included within
our projections.
Medical Inflation - We have undertaken an economic analysis to determine the expected
healthcare inflation assumptions. This implies that private healthcare costs will rise more
rapidly than public healthcare costs.
NHS Administration Costs – These are as agreed in the statute. We have assumed that
the NHS system will be fully utilized by 2018.
NHS Development Costs – Note we have assumed that the NHS development costs will be
funded from future administrative costs.
Health Assumptions - We have used historic experience to provide estimates of expected
future utilisation. As can be seen from charts below, these are very dependent on age.
Within our projections, we have therefore allowed for age profile of the membership and
calculated the impact of this.

ACTUARIAL STUDY OF HEALTH SYSTEM CYPRUS HIO
31
- MERCER 31
Chart 19 – Public Inpatient Discharges Per 1,000 Lives By Age band and Year
Chart 20 – Public Outpatient Visits Per 1,000 Lives By Age band and Year
For inpatient and outpatient, unit costs have been calculated as at 2016. Total expenditure is
calculated as the unit cost multiplied by the underlying activity with an adjustment for
expected medical inflation.

ACTUARIAL STUDY OF HEALTH SYSTEM CYPRUS HIO
32
- MERCER 32
8
Healthcare Projection Results
This section provides the detailed results with a brief summary of the key points.
8.1 National Healthcare Expenditure 2010 to 2016 in million €
2010 2011 2012 2013 2014 2015 2016
Public 572 605 585 594 550 512 510
Private 708 704 687 607 580 597 624
Total NHE 1,280 1,308 1,272 1,201 1,130 1,109 1,134
Services not covered under NHS 274 279 273 252 239 236 243
Expenditure for services covered under the NHS
1,006 1,029 999 949 891 873 891
Under the current healthcare system, private healthcare expenditure over the period 2011 to
2016 is expected to be relatively more sensitive to current economic conditions and
therefore has already started to reduce from 2011 with a particularly marked impact in 2013.
It is however expected to return to real growth in 2015. It is noted that inpatient spend is
likely to be less elastic and is therefore expected to decrease at a lower rate over the
projection period.
Public healthcare expenditure is expected to have more of a time lag and therefore the major
reduction is expected in 2014. It still however continues to decrease throughout the period.
8.2 National Healthcare Expenditure 2016 to 2025 Assuming No NHS Implementation in million €
2016 2017 2018 2019 2020 2021 2022 2023 2024 2025
Total NHE Expenditure
1,134 1,175 1,224 1,276 1,330 1,386 1,446 1,509 1,574 1,643
Services not covered under NHS
243 254 264 276 289 302 316 331 345 361
Expenditure for services covered under the NHS
891 921 959 1,000 1,041 1,084 1,130 1,178 1,229 1,282
If there are no changes to the current healthcare system, then total healthcare expenditure is
projected to increase over the period 2016-2025 at an average of 4.2% p.a. It takes nine
years (i.e. up to 2020) until NHE surpasses the 2011 level of €1,308m. Private sector growth
over the period is 4.9% p.a. whereas public sector growth is limited to 3.3%.

ACTUARIAL STUDY OF HEALTH SYSTEM CYPRUS HIO
33
- MERCER 33
8.3 Projections Assuming NHS Implementation in 2016
8.3.1 National Healthcare Expenditure 2016 to 2025 Assuming NHS
Implementation in 2016 in million €
2016 2017 2018 2019 2020 2021 2022 2023 2024 2025
Total NHE Expenditure*
1,128 1,177 1,221 1,265 1,309 1,351 1,404 1,459 1,517 1,576
Services not covered under NHS
242 250 257 270 282 293 306 319 333 346
Expenditure for services covered under the NHS *
886 927 964 995 1,027 1,058 1,098 1,140 1,184 1,230
*- This includes allowance for HIO administrative expenses and assumes fully utilised by 2018.
If the NHS is implemented in 2016, then NHE will rise at a relatively lower rate (3.7% p.a.
over the projection period) reflecting the additional expenditure controls in place. Over the
projection period, cumulative NHE savings are € 292m.
Projected savings in NHE arising under NHS in million €
2016 2017 2018 2019 2020 2021 2022 2023 2024 2025
Implied NHE savings arising under NHS
7 (2) 3 12 21 35 42 50 58 66
Chart 21 shows graphically the potential gain in NHE assuming implementation of NHS in
2016 over NHE assuming no implementation of NHS takes place.
Chart 21 – Potential gain of NHE with NHS over NHE without NHS (in million €)

ACTUARIAL STUDY OF HEALTH SYSTEM CYPRUS HIO
34
- MERCER 34
8.3.2 Contribution Income 2016 to 2025 under NHS Chart 22 – Breakdown of NHS contribution income 2016-2025 by income source
(in million €)
It follows from Chart 22 that contributions from actively working population represent the
greatest component of income to finance the NHS amounting to approximately 80% of the
total. The pensioner population provides broadly 16% of the total, of which 10% is in respect
to the GSIS. The ‘Other income’ accounts for approximately 4% of the total. The
contributions by source are included in Appendix D.
Based on the existing NHS legislated State’s contribution rate of 4.55% as a general subsidy
and 2.55% as an employer, we have projected the State’s contribution amount towards
financing NHS.
Table 23 – NHS contribution income financing by State (in million €)
State contribution 2016 2017 2018 2019 2020 2021 2022 2023 2024 2025
Gen. Subsidy - Salaried employees
291 301 314 327 341 352 367 381 397 413
Gen. Subsidy - Self-employed persons
15 15 15 16 16 16 17 17 17 18
Gen. Subsidy - GSIS pensioners
58 59 62 65 68 71 75 79 83 88
Gen. Subsidy - Other pension
27 27 28 29 29 30 31 32 33 33
State contribution as employer
43 43 42 42 43 43 44 45 46 47
TOTAL 433 445 461 479 497 514 534 554 576 599

ACTUARIAL STUDY OF HEALTH SYSTEM CYPRUS HIO
35
- MERCER 35
8.3.3 NHS Income and Expenditure 2016 to 2025 Assuming NHS
Implementation in 2016
Under the baseline scenario of health care expenditure, assuming that co-payments totaling
€90m are introduced in 2016 (and thereafter increase in line with underlying medical
inflation) and the contribution rates for each contributor segment are as in current statute
(see Table 16 in Section 5.2.1). The income generated for the NHS would produce an
annual deficit with a maximum of €52m in 2017/ 2018 reducing to €36m over the period
2016-2025 against the projected NHS expenditure and co-payments.
2016 2017 2018 2019 2020 2021 2022 2023 2024 2025
Contributions in line with 2001 NHS law
758 783 815 849 885 915 952 991 1,031 1,073
Minus Expenditure for services covered under NHS*
886 927 964 995 1,027 1,058 1,098 1,140 1,184 1,230
Plus co-payments 90 92 94 97 101 104 108 112 116 120
(Deficit)/ Surplus (38) (52) (52) (48) (42) (39) (38) (38) (37) (36)
*- including HIO administrative expenses.
8.3.4 Financing Options under NHS
We have set out below alternative approaches for financing the above deficit.
1. The deficit is fully financed through additional co-payments
Additional co-payments could be introduced to finance this deficit. Additional co-payments of
€52m in 2016 would result in the following:
2016 2017 2018 2019 2020 2021 2022 2023 2024 2025
Contributions 758 783 815 849 885 915 952 991 1,031 1,073
Minus Expenditure for services covered under NHS
886 927 964 995 1,027 1,058 1,098 1,140 1,184 1,230
Plus co-payments 90 92 94 97 101 104 108 112 116 120
(Deficit)/ Surplus (38) (52) (52) (48) (42) (39) (38) (38) (37) (36)
Additional co-payments
52 53 54 56 58 60 62 64 67 69
Co-payments require the users of the NHS to make contributions to the cost of their
treatment. They will also lead to lower utilization of the system as users will consider more
carefully whether they visit health care providers due to the additional out-of-pocket costs
required.
2. The Deficit is fully funded through Increased Contributions
All contributions could be increased to finance this deficit. We would suggest an increase of
6.7 per cent on all current contribution rates which would result in the following:

ACTUARIAL STUDY OF HEALTH SYSTEM CYPRUS HIO
36
- MERCER 36
2016 2017 2018 2019 2020 2021 2022 2023 2024 2025
Contributions 809 836 870 906 944 977 1,016 1,057 1,100 1,145
Minus Expenditure for services covered under the NHS
886 927 964 995 1,027 1,058 1,098 1,140 1,184 1,230
Plus co-payments 90 92 94 97 101 104 108 112 116 120
(Deficit)/ Surplus 13 0 2 8 17 22 25 28 31 35
This would imply the following contribution rates by contributor segment.
Source of Income Contributor
Total Individual Employer State
Salaried employees 2.13% 2.72% 4.85% 9.71%
Self-employed 3.79%
4.85% 8.64%
Pensioners - GSIS, GEPS, other 2.13%
4.85% 6.99%
Other Income - Rent, interest and other 2.13%
2.13%
3. The State contribution within budget under current system, deficit financed by co-
payments or increased contributions from non-State sources (in million €)
2016 2017 2018 2019 2020 2021 2022 2023 2024 2025
State maximum contributions
442 449 464 481 498 515 533 553 573 594
Plus contributions - non State
325 338 355 372 390 404 421 440 459 479
Minus Expenditure for services covered under the NHS*
886 927 964 995 1,027 1,058 1,098 1,140 1,184 1,230
Plus co-payments 90 92 94 97 101 104 108 112 116 120
(Deficit)/ Surplus -29 -49 -51 -46 -41 -38 -39 -40 -41 -42
Under this scenario, we assume that the public expenditure remains within the budget
forecast under the current system. This means that the total State’s contribution towards
financing the NHS and services not covered by NHS will not be higher than that under the
current system.
The above deficit could be financed by additional co-payments of €49m in year 2016 or an
increase in the contribution rate of non-state sources by 15.1 per cent.
Source of Income Individual Employer State
Salaried employees 2.30% 2.93%
In-line with budgets Self employed 4.09% n/a
Pensioners 2.30% n/a
Other Income 2.30% n/a
Alternatively, this may be financed by excluding certain services or by using a combination of
the above.

ACTUARIAL STUDY OF HEALTH SYSTEM CYPRUS HIO
37
- MERCER 37
9
Sensitivity Analysis to Key Assumptions
Since all projections have a degree of uncertainty, sensitivity tests were carried out on the
results in order to test the model’s sensitivity to certain key assumptions which are subject to
a relatively high degree of uncertainty. It is important to highlight that all the assumptions
should be consistent and so typically a change in one assumption would also lead to change
in other assumptions within the model. This analysis does though provide an indication of
the sensitivity of the model to these specific assumptions. These sensitivities are compared
with the base case where NHS is introduced in 2016 with co-payments of €90m.
Base Case
2016 2017 2018 2019 2020 2021 2022 2023 2024 2025
Contributions in line with 2001 NHS law
758 783 815 849 885 915 952 991 1,031 1,073
Minus Expenditure for services under the NHS*
886 927 964 995 1,027 1,058 1,098 1,140 1,184 1,230
Plus co-payments 90 92 94 97 101 104 108 112 116 120
(Deficit)/ Surplus (38) (52) (52) (48) (42) (39) (38) (38) (37) (36)
9.1 Medical Inflation
This is clearly the key driver of healthcare costs.
Medical Inflation: + 1 percentage point
2016 2017 2018 2019 2020 2021 2022 2023 2024 2025
Expenditure for services under NHS
886 936 980 1,024 1,067 1,109 1,163 1,219 1,278 1,340
Impact on expenditures
0 9 19 29 40 52 65 79 94 110
Deficit (38) (62) (71) (77) (82) (91) (103) (117) (131) (146)
Deficit increase 0 (9) (19) (29) (40) (52) (65) (79) (94) (110)
The estimated increase in the 2001 NHS Law contribution rates would need to increase by
an additional 6% over the period. In addition, the expenditure is increasing at a higher rate
than contributions and therefore this will need to increase further over time. Medical Inflation: – 1 percentage point
2016 2017 2018 2019 2020 2021 2022 2023 2024 2025
Expenditure for services under NHS
886 918 945 966 987 1,006 1,034 1,063 1,093 1,124
Impact on expenditures
0 (9) (19) (29) (40) (52) (64) (77) (91) (106)
Deficit (38) (43) (33) (19) (2) 13 26 39 54 70
Deficit decrease 0 9 19 29 40 52 64 77 91 106

ACTUARIAL STUDY OF HEALTH SYSTEM CYPRUS HIO
38
- MERCER 38
The estimated increase in the 2001 NHS Law contribution rates could decrease by 1% over
the period.
We can see that an increase in medical inflation of 1 percentage point would increase the
deficit by €110m at the end of the projection period. A reduction would effectively remove the
deficit by 2021. It is therefore key that there is a focus on controlling expenses.
9.2 NHS Cost Control
Improved cost control by 0.5%.
2016 2017 2018 2019 2020 2021 2022 2023 2024 2025
Impact on NHS expenditure
0 (4) (9) (14) (20) (25) (31) (38) (45) (52)
Improvement in Deficit
0 4 9 14 20 25 31 38 45 52
If NHS can improve cost control by 0.5% p.a., then the estimated increase in contributions
required from the 2001 NHS Law contributions would reduce from to 6.7% to 6.1%.

ACTUARIAL STUDY OF HEALTH SYSTEM CYPRUS HIO
39
- MERCER 39
10
Alternative Implementation Scenarios
We consider below potential alternative scenarios for phased implementation of NHS. We
have highlighted below the impact of these compared with the current proposed approach of
NHS implemented in full in 2016.
Phased Implementation - Inpatients launched in April 2015, Rest in 2016
2016 2017 2018 2019 2020 2021 2022 2023 2024 2025
Impact on expenditure for services under NHS
(3) (3) (3) (4) (4) (4) (4) (4) (4) (4)
Deficit reduction 3 3 3 4 4 4 4 4 4 4
In addition, we would need to include additional HIO administrative expenses in 2015.
Phased Implementation – Outpatients launched in July 2015, rest in 2016
2016 2017 2018 2019 2020 2021 2022 2023 2024 2025
Impact on expenditure for services under NHS
(2) (2) (2) (2) (2) (2) (2) (2) (2) (2)
Deficit reduction 2 2 2 2 2 2 2 2 2 2
In addition, there would be additional HIO administrative expenses in 2015.
Phased Implementation results in a quicker reduction in costs, which then continues
throughout the projection period. It is noted though that some inefficiencies may be built into
system.

ACTUARIAL STUDY OF HEALTH SYSTEM CYPRUS HIO
40
- MERCER 40
11
Alternative Economic Scenario
We have also considered an alternative economic scenario, which was agreed by the Troika.
This reflects higher unemployment and a more significant fall in economic growth in 2013
and 2014, but with higher growth thereafter.
According to the baseline scenario, the overall unemployment rate for both males and females is assumed to progressively increase from its current level of 11.9% in 2012 to its highest level of 16.7% in 2014 and thereafter gradually decrease to reach the level of 8.8% in 2025 (see section 7).
In this alternative economic scenario of higher unemployment, the unemployment rate is assumed to be, on average, higher than in the baseline scenario by approximately two percentage points over the projection period 2012-2025, while on a yearly basis the above difference between baseline and higher unemployment scenario ranges between one and three percentage points.
Assumptions
We have highlighted below the alternative economic assumptions:
Table 24 – Higher unemployment scenario
2012 2013 2014 2015 2016 2017 2018
GDP growth (real) -2.4% -9.8% -6.3% 1.4% 2.1% 2.6% 2.4%
Unemployment 11.9% 16.3% 19.7% 17.2% 16.1% 15.1% 14.0%
Real wage inflation -4.0% -4.9% -5.0% -3.4% -0.5% -0.1% 0.0%
2019 2020 2021 2022 2023 2024 2025
GDP growth (real) 2.1% 2.1% 2.3% 2.3% 2.3% 2.3% 2.1%
Unemployment 12.9% 11.8% 11.3% 10.9% 10.4% 10.0% 9.8%
Real wage inflation 0.0% 0.0% 0.8% 0.8% 0.9% 1.1% 1.1%
The Healthcare Results
This section provides the detailed results (in a similar format to section 8) with a brief
summary of the key points.
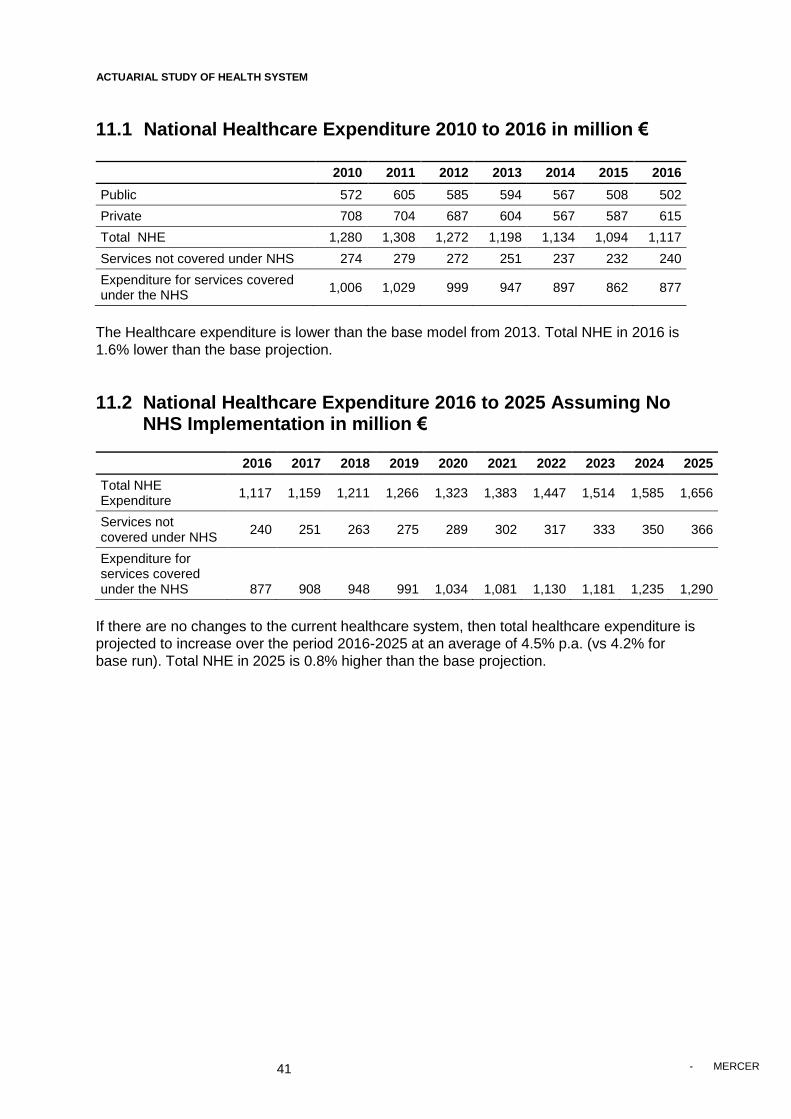
ACTUARIAL STUDY OF HEALTH SYSTEM CYPRUS HIO
41
- MERCER 41
11.1 National Healthcare Expenditure 2010 to 2016 in million €
2010 2011 2012 2013 2014 2015 2016
Public 572 605 585 594 567 508 502
Private 708 704 687 604 567 587 615
Total NHE 1,280 1,308 1,272 1,198 1,134 1,094 1,117
Services not covered under NHS 274 279 272 251 237 232 240
Expenditure for services covered under the NHS
1,006 1,029 999 947 897 862 877
The Healthcare expenditure is lower than the base model from 2013. Total NHE in 2016 is
1.6% lower than the base projection.
11.2 National Healthcare Expenditure 2016 to 2025 Assuming No NHS Implementation in million €
2016 2017 2018 2019 2020 2021 2022 2023 2024 2025
Total NHE Expenditure
1,117 1,159 1,211 1,266 1,323 1,383 1,447 1,514 1,585 1,656
Services not covered under NHS
240 251 263 275 289 302 317 333 350 366
Expenditure for services covered under the NHS 877 908 948 991 1,034 1,081 1,130 1,181 1,235 1,290
If there are no changes to the current healthcare system, then total healthcare expenditure is
projected to increase over the period 2016-2025 at an average of 4.5% p.a. (vs 4.2% for
base run). Total NHE in 2025 is 0.8% higher than the base projection.

ACTUARIAL STUDY OF HEALTH SYSTEM CYPRUS HIO
42
- MERCER 42
11.3 Projections Assuming NHS Implementation in 2016
11.3.1 National Healthcare Expenditure 2016 to 2025 Assuming NHS
Implementation in 2016 in million €
2016 2017 2018 2019 2020 2021 2022 2023 2024 2025
Total NHE Expenditure*
1,110 1,159 1,205 1,251 1,296 1,341 1,397 1,455 1,516 1,580
Services not covered under NHS
238 247 258 270 281 293 307 322 337 351
Expenditure for services covered under NHS*
872 912 947 981 1,015 1,048 1,090 1,133 1,179 1,229
*- This includes allowance for HIO administrative expenses and assumes fully utilised by 2018.
If the NHS is implemented in 2016, then NHE will rise at a relatively lower rate (4.0% p.a.
over the projection period) reflecting the additional expenditure controls in place. Over the
projection period, cumulative NHE savings are €352m (€292m for base run).
Projected savings in NHE arising under NHS in million €
2016 2017 2018 2019 2020 2021 2022 2023 2024 2025
Implied NHE Savings arising under NHS
6 0 6 16 27 42 50 59 69 76
11.3.2 Contribution Income 2016 to 2025 under NHS
Based on the existing NHS legislated State’s contribution rate of 4.55% as a general subsidy
and 2.55% as an employer, we have projected the State’s contribution amount towards
financing NHS.
Table 25 – NHS contribution income financing by State (in million €)
State contribution 2016 2017 2018 2019 2020 2021 2022 2023 2024 2025
Gen. Subsidy - Salaried employees
283 294 307 321 335 347 362 377 393 410
Gen. Subsidy - Self- employed persons
14 15 15 15 16 16 16 17 17 18
Gen. Subsidy – GSIS pensioners
58 60 62 65 68 71 75 79 83 88
Gen. Subsidy – Other pension
27 27 28 29 29 30 31 32 33 33
State contribution as employer
43 43 42 42 43 43 44 45 46 47
TOTAL 425 438 454 472 491 508 529 550 572 595
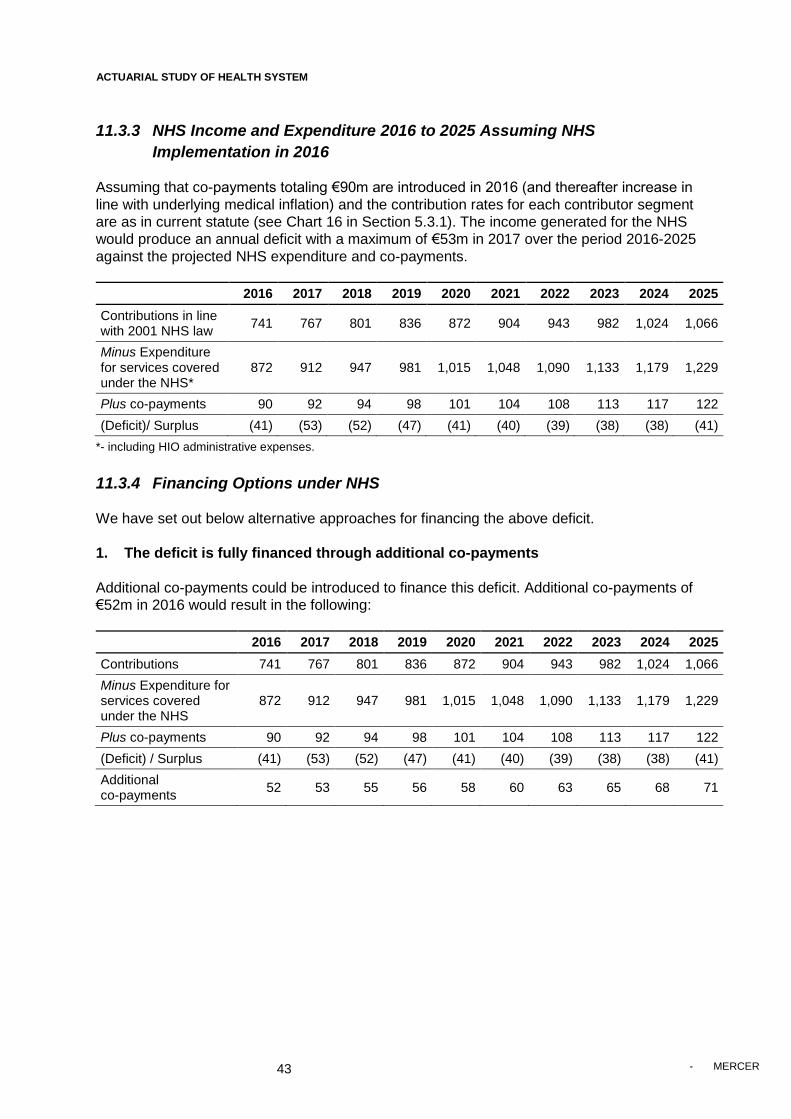
ACTUARIAL STUDY OF HEALTH SYSTEM CYPRUS HIO
43
- MERCER 43
11.3.3 NHS Income and Expenditure 2016 to 2025 Assuming NHS
Implementation in 2016
Assuming that co-payments totaling €90m are introduced in 2016 (and thereafter increase in
line with underlying medical inflation) and the contribution rates for each contributor segment
are as in current statute (see Chart 16 in Section 5.3.1). The income generated for the NHS
would produce an annual deficit with a maximum of €53m in 2017 over the period 2016-2025
against the projected NHS expenditure and co-payments.
2016 2017 2018 2019 2020 2021 2022 2023 2024 2025
Contributions in line with 2001 NHS law
741 767 801 836 872 904 943 982 1,024 1,066
Minus Expenditure for services covered under the NHS*
872 912 947 981 1,015 1,048 1,090 1,133 1,179 1,229
Plus co-payments 90 92 94 98 101 104 108 113 117 122
(Deficit)/ Surplus (41) (53) (52) (47) (41) (40) (39) (38) (38) (41)
*- including HIO administrative expenses.
11.3.4 Financing Options under NHS
We have set out below alternative approaches for financing the above deficit.
1. The deficit is fully financed through additional co-payments
Additional co-payments could be introduced to finance this deficit. Additional co-payments of
€52m in 2016 would result in the following:
2016 2017 2018 2019 2020 2021 2022 2023 2024 2025
Contributions 741 767 801 836 872 904 943 982 1,024 1,066
Minus Expenditure for services covered under the NHS
872 912 947 981 1,015 1,048 1,090 1,133 1,179 1,229
Plus co-payments 90 92 94 98 101 104 108 113 117 122
(Deficit) / Surplus (41) (53) (52) (47) (41) (40) (39) (38) (38) (41)
Additional co-payments
52 53 55 56 58 60 63 65 68 71

ACTUARIAL STUDY OF HEALTH SYSTEM CYPRUS HIO
44
- MERCER 44
2. The Deficit is fully funded through Increased Contributions
All contributions could be increased to finance this deficit. This would require an increase of
6.8 per cent on all current contribution rates. This would imply the following contribution rates
by contributor segment.
Source of Income Contributor
Total Individual Employer State
Salaried employees 2.14% 2.72% 4.86% 9.72%
Self-employed 3.79%
4.86% 8.65%
Pensioners - GSIS, GEPS, other 2.14%
4.86% 7.00%
Other Income - Rent, interest and other 2.14%
2.14%
3. The State contribution within budget under current system, deficit financed by co-
payments or increased contributions from non-State sources (in million €)
2016 2017 2018 2019 2020 2021 2022 2023 2024 2025
State maximum contributions
435 441 456 474 492 509 529 549 570 593
Plus contributions - non state
316 330 346 364 381 396 414 432 451 471
Minus NHIS expenditure * 872 912 947 981 1,015 1,048 1,090 1,133 1,179 1,229
Plus co-payments 90 92 94 98 101 104 108 113 117 122
(Deficit)/ Surplus (31) (49) (50) (46) (40) (39) (39) (39) (41) (43)
Under this scenario, we assume that the public expenditure remains within the budget
forecast under the current system. This means that the total State’s contribution towards
financing the NHS and services not covered by NHS will not be higher than that under
current system.
The above deficit could be financed by additional co-payments of € 48m in year 2016 or an
increase in the contribution rate of non-state sources by 15.2 per cent.
Source of Income Individual Employer State
Salaried employees 2.30% 2.94%
In-line with budgets Self employed 4.09% n/a
Pensioners 2.30% n/a
Other Income 2.30% n/a
Alternatively, this may be financed by excluding certain services or by using a combination of
the above.

ACTUARIAL STUDY OF HEALTH SYSTEM CYPRUS HIO
45
- MERCER 45
12
Risk & Benefits
NHS Benefits
Expenditure Savings
The NHE Expenditure for Cyprus has gradually increased as a proportion of GDP from 1999
to 2010. Under the current system, we expect that the healthcare expenditure will fall in the
short term as a proportion of GDP but gradually increase again (see the red line below). The
introduction of NHS is forecast to control and manage this increase in healthcare
expenditure. The drivers of this expense control are through the introduction of the expense
control best practice measures. The cumulative savings on NHE which are expected to arise
due to NHS implementation amount to €292m for the period 2016-2025.
Chart 26 – Historic and Forecast Expenditure 1999 to 2025
Improved Cost Containment and Control of Medical Inflation
Our analysis indicates that private sector expenditure is expected to grow more rapidly than
public sector expenditure. This is consistent with the historical data (see Chart 26) and
indicates that on-going private sector expense inflation is a major concern. The market is
currently uncontrolled and therefore the proposed NHS cost containment measures should
have particular impact.

ACTUARIAL STUDY OF HEALTH SYSTEM CYPRUS HIO
46
- MERCER 46
Chart 27 – Historic Public and Private Expenditure (% GDP)
.
Transparency in the Management of Total Health Expenditure
The NHS will also lead to more information and analysis becoming available to enable more
informed decisions to be taken.
Risks
General Risks NHE grows more rapidly than expected
Under the current system, the private sector is not controlled and hence there is a risk that
healthcare expenditure will grow more rapidly than expected. Under NHS, this risk will be
mitigated by the cost control measures and best practices (as per section 3.2) that are being
introduced.
Health outcomes
Given the current economic conditions, potential reductions in future health expenditure may
lead to a worsening of health outcomes. Under NHS, this can be mitigated to some degree
due to the introduction of universal coverage and improved access to healthcare services. In
addition, improved information /analysis can ensure that these factors are considered.
Note our figures are based on the assumptions as detailed in the report. Experience may
vary from these assumptions. The model can however be used to estimate the potential
impact of these alternative scenarios.

ACTUARIAL STUDY OF HEALTH SYSTEM CYPRUS HIO
47
- MERCER 47
NHS Specific Risks NHS may not lead to the savings forecast.
Our figures have used a conservative trend for NHS expenditure in line with the projected
public sector growth i.e. we are assuming that under NHS the private sector cost control will
be similar to the public sector’s. This is conservative due to the various best practice cost
containment measures that are being introduced. In addition, we would expect that cost
effective management of future budgets will be achieved under the introduction of NHS
through the global budget mechanism, the single payor organisation (HIO) and also through
the integration of the private and public sector.
Under NHS, contributions may not be sufficient to meet the NHS costs.
However, the use of global budgets and other cost control measures should ensure that
expenditure is set at an affordable level and that it does not exceed the pre-determined
budget. In addition, various options may be implemented to meet actual costs, including a
combination of increased cost sharing measures and / or excluding certain NHS services.
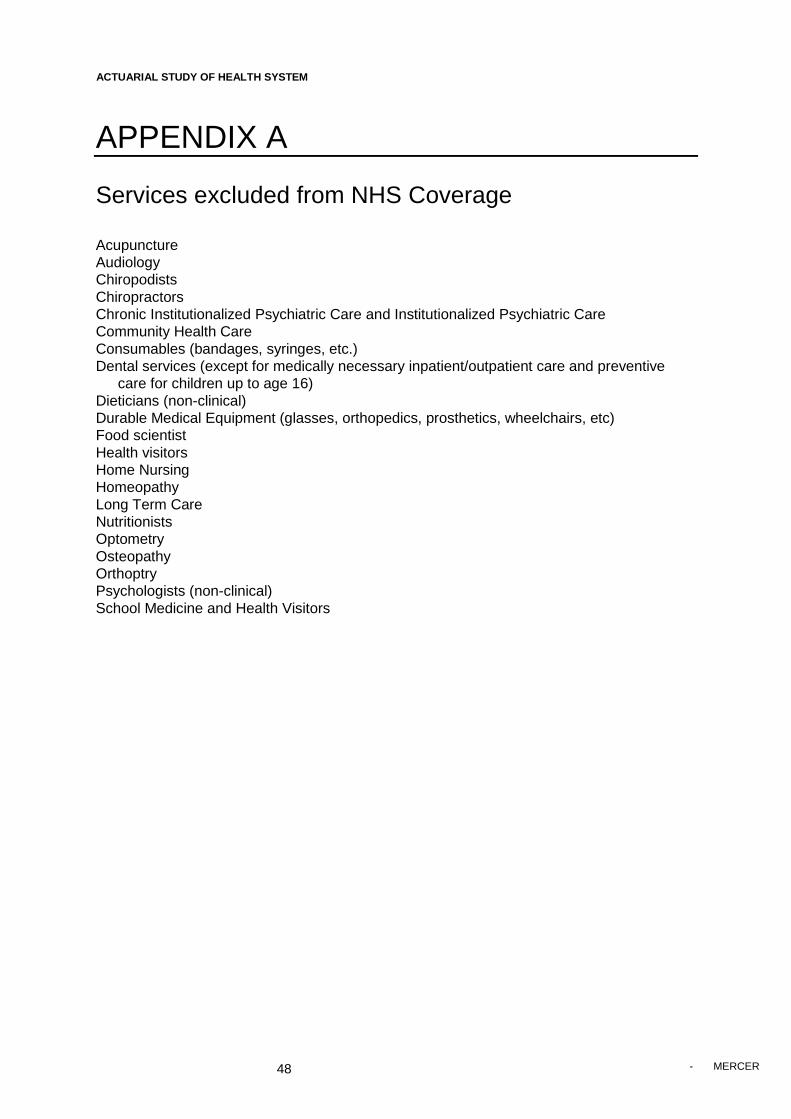
ACTUARIAL STUDY OF HEALTH SYSTEM CYPRUS HIO
48
- MERCER 48
APPENDIX A
Services excluded from NHS Coverage Acupuncture
Audiology
Chiropodists
Chiropractors
Chronic Institutionalized Psychiatric Care and Institutionalized Psychiatric Care
Community Health Care
Consumables (bandages, syringes, etc.)
Dental services (except for medically necessary inpatient/outpatient care and preventive
care for children up to age 16)
Dieticians (non-clinical)
Durable Medical Equipment (glasses, orthopedics, prosthetics, wheelchairs, etc)
Food scientist
Health visitors
Home Nursing
Homeopathy
Long Term Care
Nutritionists
Optometry
Osteopathy
Orthoptry
Psychologists (non-clinical)
School Medicine and Health Visitors

ACTUARIAL STUDY OF HEALTH SYSTEM CYPRUS HIO
49
- MERCER 49
APPENDIX B
Health Economic Analysis
The objective of this section is to discuss the forecast of Health Expenditure in Cyprus, for
Total, Public and Private Health Expenditure, and subsequently for several subcategories of
Health Expenditure, over the period 2011-2016.
Health Expenditure forecasting aims to inform the policy makers of Cyprus on future trends
in order to plan and implement effective and efficient reforms towards a Health Insurance
System. Forecasting models can also clarify the drivers of Health Expenditure, and thus
providing a more enriched picture of the policy options available.
Following the literature of health economics we may distinguished among three broad
categories of forecasting methods. (Astolfi et al., 2012):
1. Micro-level analysis, which makes use of microsimulation techniques and focus on
individual as the unit of analysis. A large sample of individuals is required in order to
capture the characteristics and behaviour of the whole population of interest, so as
future health spending can be forecasted, after the simulation of life course events
and the costs associated with related health-care interventions.
2. Component-based models, which stratify sections of health expenditures or
individuals to groups by financing agents, providers, goods and services consumed,
by groups of individuals (cohorts) or by some combination of these groups. These
models demand less data than microsimulation models, and health expenditures are
forecasted by multiplying the average costs associated with each cell in the model by
the projected number of individuals included in each cell.
3. Macro-level models, which target on aggregate Health Expenditure within the
context of the whole economy. These models are more appropriate for short to
medium-term projections and are the least data demanding (Bartosz, 2010).
Forecasting is based on extrapolation of statistical models, after the use of
econometric regression analysis of time series data, or they can be based on the
projected values of the exogenous variables.
Different time horizons can be used for the projections. As the time window expands, the
degree of uncertainty increases, since the drivers of health expenditures can change in all
sort of different ways. Furthermore, while for short-term projections Health Expenditure at
current prices is often considered more suitable, for medium-term is more appropriately
expressed at constant prices, and in the long run the health spending to GDP ratio is
regarded as the most appropriate forecasting measure (Astolfi et al., 2012).
Many factors have been identified as determinants of health expenditures growth, which concern demand-side, supply-side and regulatory drivers, and whose impact depends
on the time window of the projection.

ACTUARIAL STUDY OF HEALTH SYSTEM CYPRUS HIO
50
- MERCER 50
Income or GDP is regarded as the most important driver of health expenditures. Higher
levels of GDP enables increased health spending (Newhouse, 1992) and people are inclined
to spend a larger share of their income on improving their health (Fogel, 2008). The income elasticity (ey) varies across empirical studies reporting inelastic (ey<1), elastic (ey>1), or
unitary (ey=1) elasticities. In a review of nearly 40 empirical studies, Getzen (2006) reported values ranging from 0 to 2.2, and concluded that elasticity increases with the unit of
analysis, while more recent studies have highlighted the importance of the estimation
techniques, with more advanced ones to lead to values below 1 (Di Matteo, 2010). The
overall conclusion is that the value of income elasticity constitutes more an empirical
exercise than a theoretical foundation.
Demographic effects measure the impact of population structure on the upward trend of
health spending. Although it is a widely accepted view that that an ageing population
increases health care costs, as the ageing of the population is presumably associated with a
deterioration of the health status, empirical findings suggest only a minor to modest impact
of the againg on the rising of health expenditures (Fogel, 2008, Smith et al., 2009, Morgan
and Cunningham, 2011, Kea et al., 2011). This gave rise to the “red-herring argument”
(Zweifel et al., 1999), according to which longevity gains would not raise health
expenditures, but instead it would postpone it, since health expenditures tend to concentrate
in the time-to-death period (Yang et al., 2003, Seshamani and Gray, 2004). Three
hypothesis have been suggested to represent the relationship between life expectancy and
mortality (Astolfi et al., 2012). The “healthy ageing” hypothesis assumes that life expectancy
gains correspond to an equal increase in healthy life years. The “expansion of morbidity”
hypothesis suggests instead a longer-time spent with ill-health, based on the extension of
the life of people with diseases and disabilities, attributed to technological advancements.
Finally, according to the “compression of morbidity” hypothesis, life expectancy
improvements are associated with an increase in healthy life years.
New health technologies improve the intenseness of patients’ treatments, which may lead
to cost savings (Astolfi et al., 2012). Nevertheless, high cost of research may also be cost-
increasing, since unit costs would likely rise more than any cost-savings in the health system
(Banks, 1995). Furthermore, even inexpensive treatments tend to increase health
expenditures, as health improvements to a large share of population incur further costs
related to improved life expectancy and new health-care needs (Goldman et al., 2005).
Inflation in health-care related prices and the lower productivity of the health sector are also
reported as a possible driver of health expenditures. According to Baumol’s model of
unbalanced growth (Baumol, 1967), health sector’s productivity is lower than other sectors
due to the fact that health services are labour intensive. Thus, prices for health services tend
to inflate in relation to other prices so that wages between sectors are balanced (Baltagi and
Moscone, 2010). The “Baumol effect” is still an unsettled issue with contradictory empirical
findings, and it seems to affect mainly developed economies (Kea et al., 2011).
The organization of the health care system, concerning primarily the insurance coverage,
the financing and the delivery of the system, is also a determinant of health expenditures
growth (Baltagi and Moscone, 2010). Insurance coverage drives health spending via: a) the
proportion of population with insurance, b) the depth of coverage, and c) the level and
structure of reimbursement (Astolfi et al., 2012). Public-integrated and public-contract
models may exert leverage on providers constraining health spending (Docteur and Oxley,
2003).

ACTUARIAL STUDY OF HEALTH SYSTEM CYPRUS HIO
51
- MERCER 51
Health promotion and disease prevention programs, and health-seeking behaviour may
also influence the health status and the demand for health care services (Wanless, 2002),
but these factors are difficult to measure and thus to be included in projection models.
Section two of this paper describes the methodology of the forecasting procedure for this
study, where we specify the econometric models, the strategy of analysis and the data we
used. Section three presents the results of the best models, while the corresponding
outcomes of the other models are included in the Appendix.
Methodology
Specification of the econometric models
Following the literature we projected Health Expenditure developments for Cyprus by
applying econometric models to forecast the values of its components and the ratio to the
projected GDP for each year from 2011 to 2016, based on the historical data of the period of
1998-2010. According to this modeling, Health Expenditure varies in line with GDP, and the
estimations will be accomplished through the implementation of four different econometric
models. In the subsequent analysis we specify four econometric models based on the
available information on: 1) data characteristics, 2) and pattern evolution (Theil, 1966),
1) The first model Health Expenditure is regressed as a linear function of GDP (assuming
all other factors unchanged), and it takes the form:
Health Expenditure = function of (GDPt)
or HEt = α + β1 GDPt + εt
at the time points t = 1998 – 2016, where
β is unknown fixed regression coefficient, and
a = constant term
HEt = Health expenditure for time t
GDPt = Gross Domestic Product for time t
et = random error term
2) The second model explores the lag impact of GDP on Health Expenditure.
(assuming all other factors unchanged). This lag effect is expected since health care
budgets are generally set in the previous year. The model takes the form: Health Expenditure = function of (GDPt , GDPt-1, GDPt-2)
or HEt = α + β1GDPt + β2GDPt-1 + β3GDPt-2 + εt
at the time points t = 1998 – 2016, where
β’s are unknown fixed regression coefficients, and
a = constant term
HEt = Health expenditure for time t
GDPt = Gross Domestic Product for time t
GDPt-1 = Gross Domestic Product for time t-1 (first lag of GDP)
GDPt-2 = Gross Domestic Product for time t-2 (second lag of GDP)
et = random error term
3) The third model forecasts Health Expenditure growth rate as a function of GDP
growth rate (assuming all other factors unchanged), and it takes the form: Health Expenditure growtht = function of (GDP growtht + GDP growtht-1 +
GDP growtht-2)
or HEgrt = β1GDPgrt + β2GDPgrt-1 + β3GDPgrt-2 + εt

ACTUARIAL STUDY OF HEALTH SYSTEM CYPRUS HIO
52
- MERCER 52
at the time points t = 1998 – 2016, where
β’s are unknown fixed regression coefficients, and
HEgrt = Growth rate of Health Expenditure between time t and t-1
GDPgrt = Growth rate of GDP between time t and t-1
GDPgrt-1 = Growth rate of GDP between time t-1 and t-2 (first lag)
GDPgrt-2 = Growth rate of GDP between time t-2 and t-3 (second lag)
et = random error term
4) The 4th Model which provides best indicators of medium-term forecasts of
Health Expenditure are suggested to be its own lagged value and GDP. This function
applies the fourth model, which takes the form: Health Expenditure=function of (Health Expendituret-1, GDPt , GDPt- 1)
or HEt = α + β1HEt-1 + β2GDPt + β3GDPt-1 + εt
at the time points t = 1998 – 2016, where
β’s are unknown fixed regression coefficients, and
a = constant term
HEt = Health expenditure for time t
HEt-1 = Health expenditure for time t-1 (first lag of HE)
GDPt = Gross Domestic Product for time t
GDPt-1 = Gross Domestic Product for time t-1 (first lag of GDP)
et = random error term
We also explored a scenario based on an equivalent assumption derived from a recent
OECD paper (Scherer and Devaux, 2010). According to this scenario, Health Expenditure
ceases to grow and remains stable at the level of the last observed figures of 2010. This
simplistic assumption, though “unrealistic”, aims to isolate and highlight the impact of the
estimated recession of the next few years in Cyprus on the ratio of health expenditure to
GDP.
Strategy of analysis
At first, we calculated GDP and Health Expenditure at constant prices. Subsequently, we
forecasted Health Expenditure values by the implementation of the four specified
econometric models with the use of Eviews 7.1 statistical software package.
There were 6 stages of the analysis for each model:
Stage 1: Running the model and estimating parameters of the model based on the historical
data of 1998-2010.
Stage 2: Applying augmented Dickey-Fuller unit root test on the residuals for the detection
of cointegration between the regressed variables. A series is said to be stationary if the
mean and autocovariances of the series do not depend on time (has changing means and
variances over time). Many studies have concluded that the apparent strong relationship
between Health Expenditure and GDP is the result of non-stationarity, rather than evidence
of a real economic relationship (Hansen and King, 1996, Blomqvist and Carter, 1997,
Gerdtham and Lothgren, 2000, Dybczak and Przywar, 2010). Nevertheless, if the non-
stationary variables are cointegrated in a linear combination, the problems of non-stationarity
ceases to exist, and the regression estimates are robust (Dybczak and Przywar, 2010). A
number of studies confirm the presence of a cointegration relationship between Health
Expenditure and GDP (Blomqvist and Carter, 1997, Gerdtham and Lothgren, 2000, Okunad
and Murthy, 2002).

ACTUARIAL STUDY OF HEALTH SYSTEM CYPRUS HIO
53
- MERCER 53
Stage 3: Using the estimated parameters to forecast fitted values of the dependent
variables, alongside with 95% forecasting intervals, and the evaluation of the forecast. The
evaluation of each forecast included the following statistics:
The Root Mean Squared Error.
The Mean Absolute Error.
The Mean Absolute Percentage Error.
Theil Inequality Coefficient.
The bias proportion, which depicts the distance between the mean of the forecast
and the mean of the actual series.
The variance proportion, which represents the distance between the variation of
the forecast and the variation of the actual series.
The covariance proportion, which measures the remaining unsystematic
forecasting errors.
The first two measures depend on the scale of the dependent variable, while the third and
fourth are scale invariant. These statistics can be used as comparative measures between
models; the smaller the error, the better the forecasting ability of the particular model
according to each criterion. The Theil inequality coefficient always lies between zero and
one, where zero indicates a perfect fit. The bias, variance, and covariance proportions
decompose mean squared forecast error, so they add up to one; for a forecast to be reliable,
the bias and variance proportions should be small.
Stage 4: Combination of out-of-sample forecasts of the models for which cointegration
between the variables was confirmed by taking the average. Literature depicts that by
averaging either simply or weighted, forecasts gain accuracy and precision and reduce
uncertainty (Makridakis and Winkler, 1983, Makridakis et al., 1998) compared to an
individual model.
Estimation of Elasticities: Furthermore, we calculated GDP elasticities for the main
components of Health Expenditure, i.e. Total Health Expenditure, Public Health Expenditure
and Private Health Expenditure. At first, we estimated the elasticity of GDP by applying
Model 1, where GDP and Health Expenditure were transformed to their logarithmic form. For
a log-log model, the slope coefficient β of an explanatory variable estimates directly the
elasticity coefficient of the dependent variable with regard to the given explanatory variable.
Thus, the elasticity estimation model was:
Natural logarithm of Health Expenditure = function of (natural logarithm of GDPt)
or LOGHEt = α + β1 LOGGDPt + εt
at the time points t = 1998 – 2010, where
β is unknown fixed regression coefficient which also represents the elasticity,
a = constant term
LOGHEt = Natural logarithm of Health expenditure for time t
LOGGDPt = Natural logarithm of Gross Domestic Product for time t
et = random error term

ACTUARIAL STUDY OF HEALTH SYSTEM CYPRUS HIO
54
- MERCER 54
Subsequently, we calculated the short run and long run GDP elasticities by applying Model
4, where explanatory and dependent variables were log transformed. Therefore, the
elasticity estimation model had the form: Natural logarithm of Health Expenditure=function of (natural logarithm of Health
Expendituret-1, GDPt , GDPt- 1)
or LOGHEt = α + β1LOGHEt-1 + β2LOGGDPt + β3LOGGDPt-1 + εt
at the time points t = 1998 – 2010, where
β’s are unknown fixed regression coefficients, and
b1= short run GDP elasticity and = long run GDP elasticity
a = constant term
LOGHEt = Natural logarithm of Health expenditure for time t
LOGHEt-1 = Natural logarithm of Health expenditure for time t-1
LOGGDPt = Natural logarithm of Gross Domestic Product for time t
LOGGDPt-1 = Natural logarithm of Gross Domestic Product for time t-1
et = random error term
Elasticity results are presented in a separate report.
Demographic Effects: Finally, we explored the demographic effect on Health Expenditure
main components, i.e. Total Health Expenditure, Public Health Expenditure and Private
Health Expenditure. We used Model 4, which among all models depicted the best fit, to
explore the effect of the proportion of the elderly to the total population. Consequently, we
applied the following model: Health Expenditure=function of (Health Expendituret-1, GDPt , GDPt- 1)
or HEt = α + β1HEt-1 + β2GDPt + β3GDPt-1 + β4AGESHAREt +εt
at the time points t = 1998 – 2010, where
β’s are unknown fixed regression coefficients, and
a = constant term
HEt = Health expenditure for time t
HEt-1 = Health expenditure for time t-1 (first lag of HE)
GDPt = Gross Domestic Product for time t
GDPt-1 = Gross Domestic Product for time t-1 (first lag of GDP)
AGESHAREt= proportion of people aged 65+ to the total population for time t
et = random error term
Demographic effect results are presented in a separate report.
Data
For the forecasting we used GDP and Health Expenditure at constant prices. Nominal GDP
and nominal Health Expenditure components were provided for the period of 1998-2010 by the Cyprus Statistical Services . Table 1 presents Total Health Expenditure and its
components.
Table 1 Total Health Expenditure and its components
Total Health Expenditure = Public Health Expenditure + Private Health
Expenditure
Public Health Expenditure = Gross Capital Formation + Compensation of
Employees + Social Benefits + Intermediate Consumption + Other Current
Transfers
Private Health Expenditure = Current Expenditure + Capital investments

ACTUARIAL STUDY OF HEALTH SYSTEM CYPRUS HIO
55
- MERCER 55
Current Expenditure = Medical and Pharmaceutical Products + Therapeutic
Appliances and Equipment + Physicians, Dentists and Other Medical Services
+ Hospital Care + Health Insurance
We extracted GDP and Health Expenditure components in constant prices by deflating
nominal GDP and nominal Health Expenditure components. GDP deflators were derived
from the IMF official databases. Projections of real GDP growth till 2016 were provided by
the Ministry of National Economy, from which we then calculated absolute values of real
GDP.
Finally, we attempted to estimate the demographic effect, and we used Eurostat data
calculating the ratio of Cyprus people aged 65+ to the total population, for the period of
1998-2010.
Results
In this section we present the results of the Models which best forecasted Health
Expenditure components in line with the criteria we discussed in the previous section. According to the forecast evaluation, Model 1 and Model 4 depicted the best fit, and the
results are presented in this section. The corresponding results of the other models are
included in the Appendix.
For each health expenditure component the following results are included:
1. The specified equation that was estimated.
2. The estimation output of the Model.
3. The results of the cointegration test, i.e. the result of the augmented Dickey Fuller
test on the residuals of the equation.
4. The forecast graph, which also depicts the 95% forecasting intervals, and the
forecast evaluation of the particular Model.
5. The evolution of the Health Expenditure component in absolute values, as it was
forecasted.
6. The evolution of the Health Expenditure component as % of GDP, as it was
forecasted.
At the end of each Model’s analytical presentation, we summarize in a table the forecasts of
all health expenditure components in absolute values, with the 95% forecasting intervals,
and as % of GDP, while the historical data are also included for comparisons and inference.

ACTUARIAL STUDY OF HEALTH SYSTEM CYPRUS HIO
56
- MERCER 56
APPENDIX C
Analysis of utilisation of inpatient and outpatient activity
Data on public inpatient activity is available from the annual Health & Hospital Statistics
report whereas data on private inpatient activity is available from the Commissioner of
Private Hospitals. Both sets of data are believed to be relatively reliable and can be used to
derive the annual growth rates of public, private and total volumes of inpatient activity (See
chart below).
Chart C1 – Index of inpatient activity 2003-11
80
100
120
140
160
180
200
220
240
260
280
2003 2004 2005 2006 2007 2008 2009 2010 2011
Inpatient - public Inpatient - private Inpatient - total
Source: Health & Hospital Statistics, Commissioner of Private Hospitals

ACTUARIAL STUDY OF HEALTH SYSTEM CYPRUS HIO
57
- MERCER 57
Data on public outpatient visits is available from the annual Health & Hospital Statistics
report. Given these, it is possible to derive a reliable estimate of the volume and growth of
private outpatient visits, by matching the growth rate of total inpatient visits in total outpatient
visits and deducting the public outpatient visits (Chart C2). Making the assumption of a
constant ratio is reasonable by historical external benchmarks as illustrated by Table C3.
Chart C2 – Index of outpatient activity 2003-11
80
100
120
140
160
180
200
2003 2004 2005 2006 2007 2008 2009 2010 2011
Outpatient - public Outpatient - private Outpatient - total
Source: Health & Hospital Statistics, Mercer Analysis

ACTUARIAL STUDY OF HEALTH SYSTEM CYPRUS HIO
58
- MERCER 58
Table C3 – Ratio of number of outpatient consultations to number of inpatient discharges
2004 2005 2006 2007 2008 2009
Austria 25.6 25.7 25.4 25.6 25.9 26.1
Belgium 43.7 43.0 43.2 44.0 40.9
Denmark 25.6 26.1 26.1 26.2 27.6 27.0
Estonia 35.8 36.9 36.1 37.1 36.5 37.1
Finland 20.5 21.4 21.9 22.1 22.8 22.8
France 39.9 40.2 39.3 39.8 39.2 39.3
Germany 32.0 33.9 33.1 33.1 34.0 35.5
Hungary 54.3 55.1 56.9 57.0 61.3 64.3
Luxembourg 35.3 36.3 36.4 37.4 38.0 39.9
Netherlands 52.1 51.9 52.4 52.1 52.4 49.2
Poland 41.6 38.2 37.3 38.9 38.3 33.8
Portugal 42.0 43.0 38.6 40.1 39.7 36.5
Sweden 17.7 17.7 17.5 17.3 17.9 17.8
United Kingdom 39.2 36.9 38.1 37.5 43.4 36.7
Average 36 36 36 36 37 36
CountryYear
Source: OECD Dataset: Health Expenditure and Financing

ACTUARIAL STUDY OF HEALTH SYSTEM CYPRUS HIO
59
- MERCER 59
APPENDIX D
NHS Income by Income Source
These figures are based on the 2001 NHS Law.
Source of income 2016 2017 2018 2019 2020 2021 2022 2023 2024 2025
Salaried employees 582 603 628 654 682 705 733 763 794 826
Self-employed persons 26 27 27 28 29 29 30 30 31 32
GSIS pension 84 86 89 94 98 103 108 114 120 126
Other pension 38 39 40 41 42 43 45 46 47 48
Other income 28 29 31 32 34 35 37 38 40 41
TOTAL 758 783 815 849 885 915 952 991 1,031 1,073

ACTUARIAL STUDY OF HEALTH SYSTEM CYPRUS HIO
60
- MERCER 60
APPENDIX E
Proposed HIO Co-payments
Proposed HIO co-payments
Healthcare Providers
Co-payment per visit/ test/
pharmaceutical/ inpatient day
Adult Family Doctors
Other activities 0.0 €
Home visits 0.0 €
Pediatrician Family Doctors
Other activities 0.0 €
Home visits 0.0 €
Outpatient Specialists
Haematology 0.0 €
Pathological Oncology
0.0 €
Allergology 0.0 €
Endocrinology 0.0 €
Gastro-enterology 0.0 €
Nephrology 0.0 €
Rheumatology 0.0 €
Cardiology 0.0 €
Pneumology 0.0 €
General Surgery 0.0 €
Thoracic Surgery 0.0 €
Vascular Surgery 0.0 €
Paediatric Surgery 0.0 €
Plastic Surgery 0.0 €
Neurosurgery 0.0 €
Orthopaedics 0.0 €
Urology 0.0 €
Ophthalmology 0.0 €
Otolaryngology (ENT)
0.0 €
Obstetrics - Gynaecology
0.0 €
Neurology 0.0 €
Psychiatry 0.0 €
Dermatology - Venereology
0.0 €
Diagnostic Radiology
0.0 €
Radiation Oncology 10.0 €

ACTUARIAL STUDY OF HEALTH SYSTEM CYPRUS HIO
61
- MERCER 61
Proposed HIO co-payments
Healthcare Providers
Co-payment per visit/ test/
pharmaceutical/ inpatient day
Outpatient Specialists (cont)
Physical Medicine and Rehabilitation
0.0 €
Anaesthetics 0.0 €
Nuclear Medicine 0.0 €
Cytology 0.0 €
Pathological Anatomy (Histopathology)
0.0 €
Maxillofacial Surgery
0.0 €
Home visits 15.0 €
Allied Health Professionals
Clinical Dieticians 10.0 €
Occupational Therapists
10.0 €
Physiotherapists 10.0 €
Psychologists 10.0 €
Nurses and Midwives
10.0 €
Speech Language Therapists
10.0 €
Labs
Ungrouped lab tests 0.5 €
Grouped lab tests 5.0 €
Per Referral 5.0 €
Pharmaceuticals Generics 1.0 €
Originals 4.0 €
Inpatient Per day of inpatient treatment
50.0 €
A&E - 0.0 €
Ambulance - 0.0 €
Based upon forecast activity, we would estimate that these co-payments should total € 90m
in 2016.
Please note that various co-payment combinations can be used in practice.

Mercer Limited is authorised and regulated by the Financial Services Authority
Registered in England No. 984275 Registered Office: 1 Tower Place West, Tower Place, London EC3R 5BU