Actual and perceived effects of offshoring on economic ... · Actual and perceived effects of...
53
CHAPTER 5 Actual and perceived effects of offshoring on economic insecurity: The role of labour market regimes William Milberg and Deborah Winkler * 5 5.1 Introduction Despite broad public concern with the effect of firms’ offshoring behaviour on economic insecurity, there is scant research. Most analysis over the past 20 years – widely acknowledged as a period of rapid globalization – has focused on the impact of offshoring on workers depending on whether they are “skilled” or “unskilled”. The main research question has been the relative contribution of trade versus technological change to the rise in wage inequality in many industrialized countries. In this chapter we seek to broaden our understanding of the effect of offshoring on economic insecurity and also to connect the question of economic insecurity to national labour market institutions and to workers’ perceptions of globalization. We shift the focus to the effect of offshoring on the labour share of income rather than on its relative impact on high- and low-skilled workers. The labour share (or one minus the capital share) is affected by firm-level changes in productivity, labour demand and the distribution of value added. It is useful to capture profits and wages in the measure of economic security, since offshoring is driven by the corporations’ pursuit of higher profits and greater flexibility. Moreover, the labour share comprises workers’ earnings and employment, and analysis of the impact of offshoring on economic insecurity should include both. In a second step we take into account the institutional structure of labour markets, and consider how different “regimes” of labour market regulation mediate the effects of offshoring on economic insecurity. In a sample of Organisation for Economic Co-operation and Development (OECD) countries, we identify five different regimes based on labour market programmes and the strictness of employment protection legislation. Regression analysis for a sample of countries in each “regime” reveals that the effects of offshoring on the labour share of income are positive under labour market structures commonly viewed as more supportive and negative in those groups of countries with minimal labour market support. We conclude that it is mistaken to speak of the effect of offshoring on economic insecurity in the abstract. Institutions matter crucially for how offshoring affects employment, wages and salaries. * This chapter draws on and extends the findings in Milberg and Winkler (2009, 2010b). 147
Transcript of Actual and perceived effects of offshoring on economic ... · Actual and perceived effects of...

CH
AP
TE
R 5
Actual and perceived effects of offshoring on economic insecurity: The role of labour market regimes
William Milberg and Deborah Winkler*
5
5.1 Introduction
Despite broad public concern with the effect of firms’ offshoring behaviour on economic insecurity, there is scant research. Most analysis over the past 20 years – widely acknowledged as a period of rapid globalization – has focused on the impact of offshoring on workers depending on whether they are “skilled” or “unskilled”.The main research question has been the relative contribution of trade versus technological change to the rise in wage inequality in many industrialized countries. In this chapter we seek to broaden our understanding of the effect of offshoring on economic insecurity and also to connect the question of economic insecurity to national labour market institutions and to workers’ perceptions of globalization.We shift the focus to the effect of offshoring on the labour share of income rather than on its relative impact on high- and low-skilled workers. The labour share (or one minus the capital share) is affected by firm-level changes in productivity, labour demand and the distribution of value added. It is useful to capture profits and wages in the measure of economic security, since offshoring is driven by the corporations’ pursuit of higher profits and greater flexibility. Moreover, the labour share comprises workers’ earnings and employment, and analysis of the impact of offshoring on economic insecurity should include both.
In a second step we take into account the institutional structure of labour markets, and consider how different “regimes” of labour market regulation mediate the effects of offshoring on economic insecurity. In a sample of Organisation for Economic Co-operation and Development (OECD) countries, we identify five different regimes based on labour market programmes and the strictness of employment protection legislation. Regression analysis for a sample of countries in each “regime” reveals that the effects of offshoring on the labour share of income are positive under labour market structures commonly viewed as more supportive and negative in those groups of countries with minimal labour market support. We conclude that it is mistaken to speak of the effect of offshoring on economic insecurity in the abstract. Institutions matter crucially for how offshoring affects employment, wages and salaries.
* This chapter draws on and extends the findings in Milberg and Winkler (2009, 2010b).
147

148 MAKING GLOBALIZATION SOCIALLY SUSTAINABLE
In the third step, we make a comparison of “perceived” insecurity based on public surveys and “actual” insecurity based on our econometric estimates of the impact of offshoring on the labour share. We find that in general the perception of the impact of globalization or offshoring is more (less) favourable the more (less) beneficial is actual offshoring to the labour share. This is consistent with the findings of Scheve and Slaughter (2003) for the United States, who found that workers most affected by trade liberalization (low-skilled workers in their analysis) were also those workers most opposed to such policies, and indicates that popular resistance to globalization is not based on misinformation or irrationality, and that it can be mitigated by protective labour market policies.
The analysis in this chapter is premised on a distinction between economic vulnerability and economic insecurity. Economic vulnerability is the risk of a negative shock to household income or of losing a job. Economic insecurity is the result of this risk, mitigated by any buffer or insurance enjoyed by households, either privately on their own behalf or from public programmes, including labour market support and health insurance. Countries subject to the same degree of economic vulnerability due to globalization may experience very different levels of economic insecurity due to variations in social protection provided by the state or insurance obtained by households.
In section 5.2 we present indicators of economic insecurity with a focus on the workers across six major industrialized countries for the period beginning in the 1980s. In section 5.3 we consider the role of government, and specifically labour market regulation, in mediating the effect of markets on incomes and shifting the burden of risk from rapid income decline. Section 5.4 provides a brief literature review on the theoretical and empirical relation between offshoring and economic insecurity. In section 5.5 we present estimates of the effect of offshoring on the labour share for the period 1991–2008 using a sample of 21 manufacturing sectors for 15 OECD countries. In order to detect differential effects of labour market regimes, we interact offshoring with policy indicators of labour market flexibility and labour support. We find that offshoring significantly increases the labour share. However, splitting the sample into the periods 1991–99 and 2000–08 shows that this result seems to be driven by the first period. Between 2000 and 2008, a country’s public expenditure on labour market programmes increases the effect from offshoring on the labour share. Also, higher short-term net unemployment replacement benefits positively influence the effect of offshoring on the labour share.
We then present estimates of the labour share equation over samples defined by the nature of the labour market regime. We find that a given increase in offshoring is associated with more economic security in those countries with more supportive labour market institutions and is associated with greater economic insecurity in

EFFECTS OF OFFSHORING ON ECONOMIC INSECURITY 149
CH
AP
TE
R 5
areas characterized by less supportive labour market institutions. The findings support the view that labour market institutions matter in mediating the effects of globalization on workers in OECD countries.
In section 5.6, we show indicators of offshoring-induced perceived economic insecurity. We then correlate these indicators with the results of the offshoring coefficients in the labour share equations to examine if perceptions reflect reality. We find a weakly negative correlation between the effect of offshoring on the labour share and more optimism about economic openness. Section 5.7 concludes. In the absence of adequate compensation or supportive institutions, fears of globalization are not unjustified.
5.2 The rise of economic insecurity in the OECD
The period 1950–73 is widely referred to as the “Golden Age” of capitalism, but it might be better termed the period of rising economic security for people in the industrialized countries. Not only did the OECD countries experience rapid growthin real gross domestic product (GDP), but this was reflected in rising median wages, even more rapid improvements in median family income, relatively low rates of unemployment, falling inequality and improvements in the post-Great Depression system of social protection in most countries. Since 1973, the major industrialized economies have grown more slowly, as productivity growth has diminished. Over the entire OECD, total factor productivity growth fell to 1.5 per cent per annum on average after 1985, from rates morethan twice that during the 20 years before 1973 (Howell, 2005, table 3.2). As seen in table 5.1, six countries had higher rates of average annual GDP growth for the period 1950–73 than they did over the period 1980–2007. These countries represent a broad spectrum of the advanced industrialized world, and although all have expanded their exposure to international trade and investment they have not all experienced the same degree of increased economic insecurity. In some cases (France, Germany and Japan) the growth rate fell by more than half. Note thatthe United States showed the highest average annual GDP growth rate in thepost-1973 period. Labour productivity growth follows a similar pattern. Thus, the rate of growth of GDP per person employed fell in all six countries, but most dramatically in France, Germany and Japan.
The post-1973 period has seen a significant increase in worker insecurity in many industrialized countries. The average rate of unemployment (on a standardized basis) has been significantly higher in the post-Golden Age era compared to the 1956–73period, ranging from slightly higher in the United States to more than five times

150 MAKING GLOBALIZATION SOCIALLY SUSTAINABLE
higher in Denmark, France and Germany (see table 5.1). The incidence of long-term unemployment, defined as unemployment duration greater than one year, also rose over the post-Golden Age in many industrialized countries. France, Germany, Japan and the United States all saw long-term unemployment higher in 2006 comparedto 1991, while Denmark and the United Kingdom saw a decline (see figure 5.1).
Table 5.1 Economic performance, Golden Age versus post-Golden Age, selected countries
Denmark France Germany Japan United United Kingdom States
Gross domestic product* (CAGR) 1950–1973 3.8% 5.0% 6.0% 9.3% 2.9% 3.9% 1980–2007 2.1% 2.0% 2.2% 2.3% 2.5% 3.0% GDP per person employed** (CAGR) 1950–1973 2.9% 4.7% 4.7% 7.5% 2.4% 2.3% 1980–2007 1.7% 1.5% 0.8% 1.8% 2.1% 1.6% Average unemployment rate (per cent of labour force) 1956–1973 1.1%*** 1.9% 1.3% 1.5% 1.8% 5.0% 1980–2006 7.2% 10.1% 7.6% 3.3% 7.9% 6.2%
Source: Milberg and Winkler (2010b). Data: The Conference Board and Groningen Growth and Development Centre, Total Economy Database, January 2008. OECD Labour Force Statistics.
Notes: *In millions of 1990 US$ (converted at Geary Khamis PPPs). **In 1990 GK$. ***Average based on 1960, 1965, 1967, 1969–73. CAGR = compound annual growth rate.
Figure 5.1 Share of long-term unemployed in total unemployed (in per cent), selected countries
Source: OECD Labour Force Statistics. Note: Long-term unemployed refers to more than one year.
Denmark France Germany Japan UnitedKingdom
UnitedStates
31.4
20.3
34.2 42
.9
31.5
56.6
17.5
33.0
28.5
22.1
6.3 10
.0
1991
2006

EFFECTS OF OFFSHORING ON ECONOMIC INSECURITY 151
CH
AP
TE
R 5
The United States still shows lower long-term unemployment rates than most other countries.
The post-Golden Age period of slower GDP and productivity growth and higher rates of unemployment also involved a slowdown in the growth of wages. Beginning inthe early 1980s, the labour share of national income began to fall across many industrialized countries. This trend in the labour share captures in a broad way the growing economic insecurity in the industrialized world. We see two turning points in figure 5.2. At the beginning of the 1980s, the increases in the labour share from the early 1970s began to level off. This can be associated with the advent of neoliberal policies, labour market deregulation and the retreat of the welfare state in some countries. The second turning point occurs at the end of the 1990s, with a clear downward trend in the labour share across the sample. This second shift has been linked to financialization and globalization, and in particular the emergence of China, India and other low-wage exporting countries.
Equally dramatic is the rise in inequality across wage earners, documented intable 5.2, which shows the ratio of wages in the top decile to the bottom decile for 1985, 1991 and 2005. Over the entire period, income inequality in the United States has been far above the others, and compression of incomes much greater in Denmark than in all the rest. Since 1985, France and Japan were the only countries of these six not to experience an increase in inequality. Japan’s slow growth seems to have affected all groups proportionally. France underwent a large increase in the minimum wage, which served to compress the wage distribution (for details see Howell and Okatenko, 2010). The percentage increase in inequality over 1985–2006 was greatest in Denmark and the United States.
Table 5.2 Wage inequality, selected countries (ratio of wages of top 10 per cent of earners to bottom 10 per cent of earners)
1985 1991 2005
Denmark 2.2 2.2 2.6
France 3.1 3.3 2.9
Germany 2.9 2.8 3.3
Japan 3.1 3.1 3.1
United Kingdom 3.2 3.4 3.6
United States 4.1 4.3 4.9
Source: Wages per full-time employee are calculated based on OECD Labour Force Statistics.Notes: 1985 wages only for former West Germany. 1990 wages for Denmark, 2004 wages for France.

152 MAKING GLOBALIZATION SOCIALLY SUSTAINABLE
Fig
ure
5.2
Lab
ou
r co
mp
ensa
tio
n (a
s p
er c
ent o
f GD
P),
19
70
–20
05
/06
, sel
ecte
d c
ou
ntr
ies
Sou
rce:
Ow
n ill
ustr
atio
n. D
ata:
OE
CD
Ann
ual N
atio
nal A
ccou
nts
Sta
tistic
s.
66 64 62 60 58 56 54 52 50 48 46 44 42
1970197119721973197419751976197719781979198019811982198319841985198619871988198919901991199219931994199519961997199819992000200120022003200420052006
Labour compensation (in % of GDP)
Den
mar
k
Fran
ce
Ger
man
y
Japa
n
Uni
ted
Kin
gdom
Uni
ted
Sta
tes

EFFECTS OF OFFSHORING ON ECONOMIC INSECURITY 153
CH
AP
TE
R 5
5.3 Mitigating economic vulnerability: The role of the state
Varieties of worker protection and labour market regulation
There are private and public responses to rising economic vulnerability for workers. Despite the general rise in economic insecurity after 1980 in our sample of industrialized countries, governments have generally reduced social protection and labour market protections. The neoliberal move to deregulate markets has involved efforts to increase labour market flexibility in Europe, to bring greater fiscal constraint in the Eurozone, and to reduce the role of labour unions in the United States. Within these broad trends, there is still considerable variation across industrialized countries in the amount and form of social protection they provide. We focus on three aspects of social protection – the gross unemployment replacement rate, public expenditures on active labour market programmes and the strictness of employment protection legislation. According to these measures, there remain clear differences in governments’ responses to economic insecurity.
While the United States is different from our other five countries in terms of its privatization of the burden of health insurance and pensions, in fact all countries except the United Kingdom have reduced short-term net unemployment benefits as a percentage of earnings, that is, unemployment benefits that are paid within the first year of unemployment, since 2001 (see table 5.3). All countries except Japan lowered long-term net unemployment benefits, that is, unemployment benefits that are paid after five years of unemployment. The United States showed by far the lowest net unemployment replacement rate (long-term period). Denmark’s rate is far above the others.
Table 5.3 Labour market policy indicators
Denmark France Germany Japan UK US
Short-term net unemployment 2001 80.1% 73.9% 68.5% 61.4% 49.4% 58.8%replacement rate 2007 77.8% 71.4% 66.5% 59.7% 57.1% 55.7% Long-term net unemployment 2001 76.8% 53.6% 65.0% 55.4% 60.9% 28.9%replacement rate 2007 74.1% 53.0% 59.5% 55.9% 58.9% 24.3% Public expenditures for active 1985 4.7% 2.1% 1.7% n.a. 2.3% 0.8%labour market programmes 1991 5.9% 2.3% 2.9% 0.6% 1.5% 0.9%(% of GDP) 2001 4.1% 2.6% 3.2% 0.8% 0.6% 0.7%
2008 2.6% 2.0% 1.9% 0.6% 0.5% 1.0%
Source: Own illustration. Data: OECD Social Expenditures and OECD Tax-Benefit Models.
Note: Short-term benefits refer to unemployment benefits that are paid within the first year of unemployment. Long-term benefits refer to unemployment benefits that are paid after five years of unemployment.

154 MAKING GLOBALIZATION SOCIALLY SUSTAINABLE
Between 1991 and 2008, France, Japan and the United States kept their spending on active labour market programmes as a percentage of GDP relatively constant, while Denmark, Germany and the United Kingdom reduced them quite significantly (table 5.3). Active labour market programmes include expenditures related to worker placements; worker training; job rotation and sharing; employment incentives; employment support and rehabilitation; direct job creation; and start-up incentives. The low levels of active labour market programmes in Japan, the United Kingdom and the United States stand out in the sample.
There has been a different pattern of change in terms of the strictness of employment protection legislation (EPL), which measures the regulation of hiring and firing. The OECD uses the term employment protection legislation to refer to all types of employment protection measures, whether grounded primarily in legislation, court rulings, collectively bargained conditions of employment or customary practice.1 These are combined into an index in which six represents the most strict regulation and zero the least strict. Less strict employment protection legislation would indicate that employers would have more flexibility to hire and fire. The United States shows a constant EPL between 1990 and 2008, Denmark, Germany and Japan became less strict, and France and to some extent the United Kingdom became more strict (see table 5.4). In section 5.5 (subsection “Regression results by country and by labour market regime”) we use the EPL and combine it with measures of labour support to identify five different models of labour market regulation across a broad sample of OECD countries.
The burden of economic risk
Denmark and the United States represent polar opposites in terms of the political response to economic insecurity. The Danish flexicurity model has attracted a lot of
Table 5.4 Strictness of employment protection legislation (higher values imply more strict)
1991 2001 2008
Denmark 2.40 1.50 1.50
France 2.98 3.05 3.05
Germany 3.17 2.34 2.12
Japan 1.84 1.43 1.43
United Kingdom 0.60 0.68 0.75
United States 0.21 0.21 0.21
Source: Own illustration. Data: OECD Labour Statistics.
Note: Higher values indicate stricter regulation on hiring and firing.

EFFECTS OF OFFSHORING ON ECONOMIC INSECURITY 155
CH
AP
TE
R 5
attention because of Denmark’s superior performance in trade and employment and the unusual combination of policies, with flexibility in terms of hiring and firing and strong social protection for those seeking employment, including a high level of unemployment benefits and considerable levels of spending on active labour market programmes (see, for example, Gazier, 2006; Clasen, 2007; and Kuttner, 2008). Moreover, Denmark greatly exceeds the other countries in terms of pension benefits relative to lifetime earnings (figure 5.3). This system of flexicurity is in part the reason for Denmark’s attainment of a high level of economic security as measured by changes in the labour share and the level of wage inequality.
Over the past 20 years, the United States has experienced a dramatic shift in the burden of risk, from government to the households themselves. This has resulted from a combination of more volatile household income and an increase in health insurance costs, a greater reliance on private (as opposed to public) pensions and a continuation of policies of low levels of unemployment benefits. Hacker (2006) describes these political changes as “the great risk shift” as governments and employers shifted the burden of insuring against a rapid decline in income to the employees and households themselves (see also Gosselin, 2008).
Households may borrow in order to insulate their spending patterns from earnings volatility and the rise in home equity loans in the United States and consumer credit in the United Kingdom are partly for this reason.2 Household saving rates out of
Figure 5.3 Gross pension replacement rates by earnings based on 2004 rules (per cent of median earnings)
Source: Milberg and Winkler (2009). Data: OECD pension models, taken from: OECD Pensions at a Glance,pp. 33–34.
Note: For median income earner. The figures are “estimates of the level of pension people will receive if they work for a full career and if today’s pension rules stay unchanged”.
83.6
51.2
39.9 36.8 34.443.6
Denmark France Germany Japan UnitedKingdom
UnitedStates

156 MAKING GLOBALIZATION SOCIALLY SUSTAINABLE
disposable income fell over the 1990s for the major OECD countries (France and Germany being the exceptions), indicating the need for households to limit saving in order to maintain economic security and to incur debt for the same purpose (OECD, 2007a).
Economic security is by many measures lowest in the United States and this is supported by the unusually high perception of insecurity and fear of globalization in the United States discussed in section 5.2. We have seen that the United States, often lauded for the degree of flexibility in its labour markets, stands out in terms of its low levels of unemployment benefits and limited state spending on active labour market programmes (table 5.3). In their long-term historical analysis of income distribution in the United States, Temin and Levy (2006, p. 5) argue that the deterioration of the social safety net in the United States, combined with the decline of other institutions such as trade unions, has been a source of the bifurcation in the growth of productivity and the growth of wages:
the recent impacts of technology and trade have been amplified by the collapse of these institutions, a collapse which arose because economic forces led to a shift in the political environment over the 1970s and 1980s. If our interpretation is correct, no rebalancing of the labour force can restore a more equal distribution of productivity gains without government intervention and changes in private sector behaviour.
As an indication of the changes in the United States, table 5.5 shows union density in our sample countries since 1981, with Denmark remaining at very high levels and the United States experiencing by far the greatest decline. The United Kingdom, following a similar model, is second in the extent of decline of unionization, but in 2001 still remained at a much higher level than the United States. France’s low rate of unionization is deceptive, since bargaining coverage of union agreements has remained very broad.
Table 5.5 Union members as share of total labour force (in per cent), selected countries
1981 1991 2001 2008
Denmark 79.9 75.8 73.8 67.6France 17.8 10.0 8.0 7.7Germany 35.1 36.0 23.7 19.1Japan 30.9 24.8 20.9 18.2United Kingdom 50.0 38.2 29.6 27.1United States 21.0 15.5 12.8 11.9
Source: Own illustration. Data: OECD Trade Union Statistics.
EFFECTS OF OFFSHORING ON ECONOMIC INSECURITY 157
CH
AP
TE
R 5
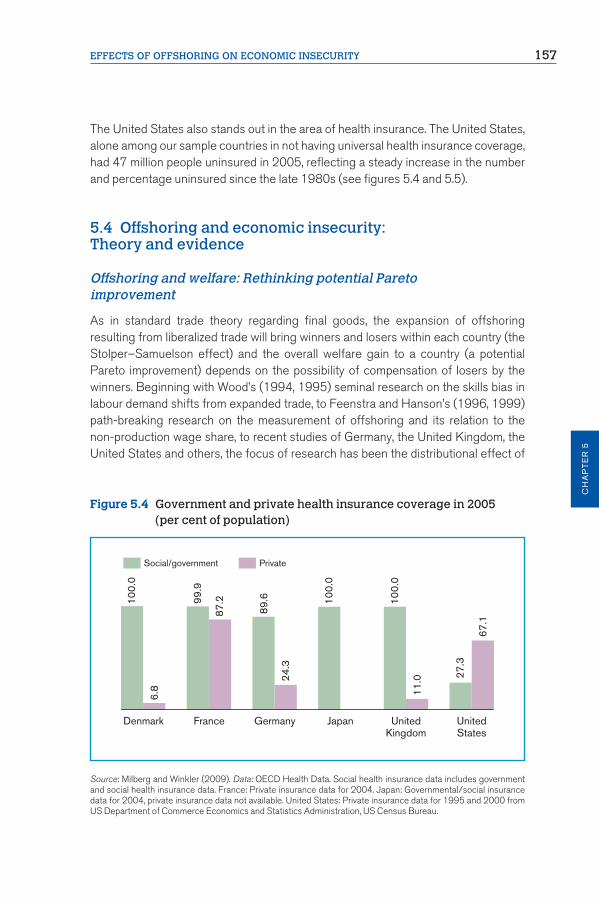
The United States also stands out in the area of health insurance. The United States, alone among our sample countries in not having universal health insurance coverage, had 47 million people uninsured in 2005, reflecting a steady increase in the number and percentage uninsured since the late 1980s (see figures 5.4 and 5.5).
5.4 Offshoring and economic insecurity:Theory and evidence
Offshoring and welfare: Rethinking potential Paretoimprovement
As in standard trade theory regarding final goods, the expansion of offshoring resulting from liberalized trade will bring winners and losers within each country (the Stolper–Samuelson effect) and the overall welfare gain to a country (a potential Pareto improvement) depends on the possibility of compensation of losers by the winners. Beginning with Wood’s (1994, 1995) seminal research on the skills bias in labour demand shifts from expanded trade, to Feenstra and Hanson’s (1996, 1999) path-breaking research on the measurement of offshoring and its relation to the non-production wage share, to recent studies of Germany, the United Kingdom, the United States and others, the focus of research has been the distributional effect of
Figure 5.4 Government and private health insurance coverage in 2005 (per cent of population)
Source: Milberg and Winkler (2009). Data: OECD Health Data. Social health insurance data includes government and social health insurance data. France: Private insurance data for 2004. Japan: Governmental/social insurance data for 2004, private insurance data not available. United States: Private insurance data for 1995 and 2000 from US Department of Commerce Economics and Statistics Administration, US Census Bureau.
Denmark France Germany Japan UnitedKingdom
UnitedStates
100.
0
6.8
99.9
87.2
89.6
24.3
100.
0
100.
0
11.0 27
.3
67.1
Social/government Private

158 MAKING GLOBALIZATION SOCIALLY SUSTAINABLE
Fig
ure
5.5
Nu
mb
er o
f peo
ple
wit
ho
ut h
ealt
h in
sura
nce
in th
e U
nit
ed S
tate
s
Sou
rce:
Milb
erg
and
Win
kler
(2
00
9).
Dat
a: U
S C
ensu
s B
urea
u, C
urre
nt P
opul
atio
n S
urve
y, 1
98
8 t
o 2
00
7 A
nnua
l Soc
ial a
nd E
cono
mic
Sup
plem
ents
. Peo
ple
as o
f M
arch
of
the
follo
win
g ye
ar, t
aken
from
: Inc
ome,
Pov
erty
, and
Hea
lth In
sura
nce
Cov
erag
e in
the
Uni
ted
Sta
tes:
20
06
(20
07
), p.
58
.
50 45 40 35 30 25 20 15 10 5 0
16 15 14 13 12 11 10 9 8 7 6
1987
1988
1989
1990
1991
1992
1993
1994
1995
1996
1997
1998
1999
2000
2001
2002
2003
2004
2005
2006
31,026
32,680
33,385
34,719
35,445
38,641
39,713
39,718
40,582
41,093
42,359
42,943
41,014
38,426
39,760
42,019
43,404
43,498
44,815
46,995
12.9%
13.4%
13.6%
14.1%
15.0%
15.3%
15.2%
15.4%
15.4%
15.7%
15.8%
14.8%
13.7%
14.1%
14.7%
15.1%
14.9%
15.3%
15.8%
13.9%
Number of uninsured people (in ’000)
Uninsured in total population (%)
Num
ber o
f uni
nsur
edP
erce
ntag
e of
uni
nsur
ed

EFFECTS OF OFFSHORING ON ECONOMIC INSECURITY 159
CH
AP
TE
R 5
offshoring on low-skilled versus high-skilled workers. Most studies show that more offshoring is associated with higher wages and employment for high-skilled workers and a decline in employment for low-skilled workers.3
There are some important exceptions to these findings, however. Geishecker and Görg (2007) in a study of Germany, and Geishecker et al. (2008) in a study of Germany and the United Kingdom find that offshoring is associated with lower wages for high-skilled workers. Unlike most studies, these two papers are based on firm-level data. The most recent studies indicate that offshoring may no longer have such a skills bias in its impact on labour demand. Geishecker (2008) finds that employment duration and thus economic security is negatively affected by offshoring in Germany across all skill levels. Winkler (2009) reports that the effect of services offshoring in Germany was negative for the relative demand for high-skill German labour for the period 1995–2004.
As the volume of offshoring and intermediates trade has grown and the range of products and services being offshored has expanded, economists began to recognize that a qualitatively new form of international exchange was emerging. Grossman and Rossi-Hansberg (2006, 2008), in a widely cited set of papers, assert that globalization is no longer characterized by the traditional image of an exchange of “wine for cloth”, the Ricardian example that captured the notion of final goods specialization and exchange. Today’s world is characterized by what Grossmanand Rossi-Hansberg call “trade in tasks”. They attribute the rise of this new phaseof offshoring primarily to technological improvements in transportation and communication. In their model of offshoring, the production process includes a setof intermediate tasks that can be produced by low-skilled or high-skilled labour.
A drop in the cost of offshoring – presumably due to technological improvements in transportation and communication – can affect less-skilled workers through three channels: (1) the productivity effect, (2) the labour-supply effect and (3) the relative-price effect. The productivity effect is the result of the fact that low-skill tasks in the home country are being performed with less home labour than before the increasein offshoring. This increase in productivity implies a higher marginal product of domestic low-skilled labour and thus a higher wage. The labour-supply effect occurs when the reduced demand for low-skilled domestic workers effectively raises the number of available low-skilled workers. The relative-price effect is the impact on wages from a decline in the price of the low-skill-intensive tasks and thus an improvement in the terms of trade, as the price of imports falls with increased offshoring, resulting in a decline in wages of low-skilled workers following the Stolper–Samuelson effect.

160 MAKING GLOBALIZATION SOCIALLY SUSTAINABLE
The key finding of Grossman and Rossi-Hansberg (2006) is that the productivity effect of offshoring low-skill-intensive tasks was so large in the United States over the period 1997–2004 that it offset the negative effect on wages from the relative price effect and the labour supply effect, resulting in the surprising result that increased offshoring over this period led to an increase in the wages of low-skilled domestic workers. The premise is that when the cost of offshoring declines, leading to an increase in trade in tasks, this is equivalent to an increase in productivity oflow-skilled workers that generates an increase in their real wage.
If, as the Grossman and Rossi-Hansberg calculations indicate, expanded task trade leads to an increase in the wages of low-skilled workers, then the normative side of the analysis becomes a lot less sticky, since no transfers from one group to another are required to bring a Pareto improvement. If, however, there is a decline in earnings for one group, then an actual Pareto improvement would require a transfer from another group to the group suffering earnings declines. Economists have traditionally ignored the ex post outcome and argued that if there are earnings increases that exceed the losses then there exists a potential income transfer that could bring Pareto improvement.
Extensive econometric research over many years, including the large literature on high- and low-skilled labour discussed above, puts the Grossman and Rossi-Hansberg finding into serious doubt. Even the econometric analysis on the effect of offshoring on overall employment gives conflicting results. Amiti and Wei (2009) confirm the positive productivity effects of offshoring in US manufacturing between 1992 and 2000. Amiti and Wei (2006) also find that services offshoring in the United States over the same period reduced manufacturing employment by 0.4 to 0.7 per cent per year at a highly disaggregated level (450 industries). At a more aggregated level (100 industries), the negative effect disappears.4 The authors attribute this result to the possibility that services offshoring increases efficiency in certain sectors, which leads to the creation of new jobs in other sectors. Winkler (2009, 2010) equally finds a positive productivity effect, but a negative effect of offshoring on German employment.
Another recent study for the United States finds that, since the late 1980s, less-productive portions moved offshore, leading to a decline in employment, while maintaining higher value-added parts. As a consequence, overall productivity has risen, while the tradable sector has generated only incremental employment (Spence and Hlatshwayo, 2011). Interestingly, Autor (2010) suggests that job opportunities in the United States only fell for middle-wage, middle-skilled jobs since the late 1980s, while high-skilled, high-wage and low-skilled, low-wage employment expanded, which he relates, among other factors, to offshoring of middle-skilled

EFFECTS OF OFFSHORING ON ECONOMIC INSECURITY 161
CH
AP
TE
R 5
“routine” tasks that were formerly performed mainly by workers with moderate levels of education.
Amiti and Wei (2005) test the impact of goods and services offshoring on home employment for the United Kingdom between 1995 and 2001. Including 69 manufacturing industries, they find a significantly positive correlation between service offshoring and employment citing the same explanation as in their US study. The impact of goods offshoring on employment is ambiguous and insignificant. The OECD (2007b) measures the effects of offshoring for 12 OECD countries (Austria, Belgium, Denmark, Finland, France, Germany, Greece, Italy, the Republic of Korea, Norway, Sweden and the United States). Three types of models are estimated,which all cover 26 manufacturing and service industries for the two years 1995 and 2000, that is, growth rates from 1995 to 2000 are used in the regressions. The results indicate a significantly negative effect of goods and services offshoring on manufacturing and service employment, respectively.
Beyond Stolper–Samuelson: Adjustment costs and thethreat effect
Another measure of the effects of trade on economic insecurity is the replacement of earnings for those displaced by import competition. Kletzer (2001) has done the most extensive analysis of the re-employment rate and replacement wage for workers displaced as the result of foreign trade. In a study of the United States from 1979 to 1999 she found that earnings losses of job dislocation are large and persistent over time (see table 5.6). Specifically, she found that 64.8 per cent of manufacturing workers displaced from 1979 to 1999 and one-fourth of those re-employed suffered earnings declines of greater than 30 per cent. Workers displaced from non-manufacturing sectors did a little better: 69 per cent found re-employment, and 21 per cent suffered pay cuts of 30 per cent or more.
The OECD (2005) did a similar study for 14 European countries for 1994–2001 and found that while re-employment rates in Europe were lower than in the United States, a much lower share had earnings losses of more than 30 per cent upon re-employment and a slightly higher share had no earnings loss or were earning more than before displacement, further evidence that labour market institutions and policies result in different outcomes with respect to insecurity even in the face of similar pressures on vulnerability (table 5.6). This cross-country comparison also indicates the usefulness of looking at the effect of trade on the labour share of national income. The European experience has been larger employment losses and smaller declines in wages compared to the United States.

162 MAKING GLOBALIZATION SOCIALLY SUSTAINABLE
In addition to labour demand shifts and job displacement, greater openness to international trade can also raise the sensitivity of labour demand to changes in domestic or foreign wages, that is, the wage elasticity of labour demand. This sensitivity of employment to both domestic and foreign wage movements is further increased as global supply chains become more developed and offshoring increases. According to Anderson and Gascon (2007, p. 2), “disaggregating the value chain has allowed US business to substitute cheaper foreign labour, increasing firms’ own price elasticity of demand for labour, raising the volatility of wages and employment, which increase worker insecurity”.
There have been very few estimates of the relation between trade openness and the wage elasticity of labour demand. Slaughter (2001) studied manufacturers in the United States over the period 1960–91 and found that the labour demand elasticity rose for US production workers (a proxy for lower-skilled workers) and not fornon-production workers over this period. The demand for production workers rose most in those sectors with the greatest increases in offshoring, as well as those with more technical change in the form of more computer-related investment. Scheve and Slaughter (2003) found that foreign direct investment is the key aspect of globalization that raises the elasticity of labour demand. In a study of outward foreign direct investment by firms in the United Kingdom, they found that more foreign investment is associated with a higher labour-demand elasticity, and more volatility of wages and employment.
Table 5.6 Adjustment costs of trade-displaced workers
Industry Share of workers in 14 European United States: 1979–99 countries: 1994–2001a (%) Re- No earnings Earnings Re- No earnings Earnings employed loss or losses employed loss or losses two years earning > 30 per at survey earning >30 per later more cent date more cent
Manufacturing 57.0 45.8 6.5 64.8 35.0 25.0High internationalcompetition 51.8 44.0 5.4 63.4 36.0 25.0
Medium internationalcompetition 58.7 45.7 7.0 65.4 34.0 25.0
Low internationalcompetition 59.6 47.3 6.8 66.8 38.0 26.0
Services and utilitiesb 57.2 49.6 8.4 69.1 41.0 21.0
All sectors 57.3 47.1 7.5 – – –
Source: OECD (2005, Table 1.3, p. 45); and Kletzer (2001, Table D2, p. 102).
Note: (a) Secretariat estimates based on data from the European Community Household Panel (ECHP) for Austria, Belgium, Denmark, Finland, France, Germany, Greece, Ireland, Italy, Luxembourg, the Netherlands, Portugal, Spain and the United Kingdom. (b) Services for Europe.

EFFECTS OF OFFSHORING ON ECONOMIC INSECURITY 163
CH
AP
TE
R 5
The higher elasticity of labour demand can have an indirect effect on wage formation, since it enhances the threat effect, whereby the mere threat by companies to move production overseas influences wage demands. As Freeman (1995, p. 21) notes, “It isn’t even necessary that the West import the toys. The threat to import them or to move plants to less-developed countries to produce toys may suffice to force low-skilled westerners to take a cut in pay to maintain employment. In this situation, the open economy can cause lower pay for low-skilled westerners even without trade.”
A few researchers have explored the importance of firms’ threats to move production abroad on the bargaining power and demands of labour. The issue has received considerable attention by theorists, but has undergone little empirical analysis. Choi (2001) looked at detailed, sectoral data on outward foreign direct investment byUS manufacturers and found that increased outward investment was associated with lower wage premiums for union members during the period 1983–96. Bronfenbrenner and Luce (2004), studying the United States between 1993 and 1999, focussed more narrowly on unionization campaigns as opposed to wages. They found that a firm’s mobility did raise the credibility of the threat to move production offshore and that this influenced union elections, with unionization drives having a much lower rate of success in firms with a credible threat of mobility than in those considered immobile.
Offshoring and the labour share: Combining employment and earnings effects
As we have seen, most research on offshoring – both theoretical and empirical – has concentrated on the differential impact of offshoring on low-skilled and high-skilled labour. We propose a shift in focus in order to get a more comprehensive view of economic insecurity. The labour share is a useful summary measure of economic security, since it captures both employment and wage and is well known to depend on a variety of economic, technological and institutional factors, including offshoring. The labour share is equal to one minus the profit share. Since offshoring is driven by firms’ pursuit of higher profits and greater production flexibility, it is useful to use a measure of economic insecurity that explicitly accounts for the impact of profit-seeking. Offshoring is associated with movements in the labour share to the extent that firms’ cost savings from offshoring are passed through to higher wages and labour demand and the extent to which labour demand is affected directly and indirectly by the firms’ offshoring activity.
The last two decades have seen a broad expansion of the global labour supply in the global economy. Firms have expanded offshoring activity to benefit from this larger pool of labour. The international mobility of goods, services and capital has been enhanced by technological change and liberalization of trade and foreign investment.

164 MAKING GLOBALIZATION SOCIALLY SUSTAINABLE
The collapse of the Soviet Union and of communist governments throughout Eastern Europe and East Asia, the capitalist turn of communist China’s (and Viet Nam’s) economic planning, and even the opening and liberalization of India’s economy, have all served to expand global productive capacity, international trade, foreign investment and international subcontracting. Freeman (2007) has characterized these developments as “the great doubling” of the world capitalist system’s labour force, as it had added 1.3 billion people to the pool of labour seeking work under competitive conditions.
Such a labour supply expansion alone, Freeman argues, is enough to dampen wage growth in the rest of the world, including in the industrialized countries. Glyn (2007)puts an even finer point on this, noting that: “Increasing opportunities for capital to shift production overseas has given a huge bargaining advantage to employers in most of the OECD.” We saw above (figure 5.2) that the labour share of national income has fallen in many industrialized nations. Has the rise in offshoring played a significant role in this? A number of recent papers have taken up the question of trade and the labour (or profit) share at the aggregate or industry level, and they have generally found globalization to be associated with a decline in labour’s share of income.
Milberg and Winkler (2010a) find that offshoring is significantly and negatively associated with movements in the labour share of value added in 35 US manufacturing and service sectors over the period 1998–2006. Harrison (2002) studies the relation between the trade openness and the functional distribution across a large number of developing countries and finds that openness is generally associated with a lower labour share of national income. Harrison concludes that “rising trade shares and exchange rate crises reduce labour’s share, while capital controls and government spending increase labour’s share”. Guscina (2006) finds globalization (measured by trade openness, and the share of FDI in GDP) are both associated with a lower labour share. The effect of trade openness is especially strong in the period from 1985 to 2000. Guscina describes the effects of technological change and globalization as contributing to a new (lower) equilibrium level of the labour share in the industrialized world.
The IMF (2007) estimates that offshoring and immigration are associated with a reduction in the labour share in continental Europe over the period 1982–2002, while in the Anglo-Saxon countries the effect of offshoring is smaller. The IMF (2005) finds that offshoring is a small but nonetheless negative and significant factor in the determination of the labour share of income for a group of OECD countries. In this same study, three aspects of globalization (related to prices, offshoring and immigration) combined to play a large role in explaining the declining labour share. A study by Ellis and Smith (2007) finds no connection between

EFFECTS OF OFFSHORING ON ECONOMIC INSECURITY 165
CH
AP
TE
R 5
openness and the profit share, but links the rising profit share in 19 OECD countries over 1960–95 to increased “churning” in the labour market. They write: “This greater churn strengthens firms’ bargaining positions and allows them to capture a larger share of factor income” (Ellis and Smith, 2007, p. 18).
5.5 Offshoring and the labour share under different labour market regimes
It seems likely that the effect of such “churning” will vary depending on labour market institutions. This becomes more evident when we consider that labour market institutions, including regulations on hiring and firing, training and retraining programmes and unemployment benefits will significantly alter the relation between economic vulnerability and economic insecurity. To the extent that the mitigating role of these institutions is captured in the labour share of national income and, as we have seen above (figure 5.3), there is great variation across OECD countries in the structure of these labour market institutions, then we can assess empirically the impact of these institutions on economic security across OECD countries.
In this section, we estimate the effect of offshoring on the labour share at the sectoral level (two-digit ISIC Rev. 3) for the period 1991–2008 using a sample of21 manufacturing sectors for 15 OECD countries. In order to detect the effect of different labour market regimes, in a second set of labour share model estimations we interact offshoring with policy indicators of labour market flexibility and labour support.
Offshoring intensities in the OECD
We begin with a description of the offshoring data. We have seen that economic insecurity has increased in the industrialized world over the past 30 years. The international trading environment has also changed, and the coincidence is certainly one reason that the two are perceived as connected. In 1950, imports from low-income countries in total imports were especially high in countries with colonial ties, such as France, the United Kingdom and the United States, but also in Germany.The shares declined in the four countries between 1950 and 1991, but showed considerable positive growth after 1991 (see Milberg and Winkler, 2009).
This new wave of globalization beginning in the 1990s reflects political, economic and technological changes that have together encouraged more international trade and foreign investment, altered the structure of trade, and changed the relation between trade and foreign direct investment. Countries have become more open to trade and they have relied increasingly on sophisticated global value chains, as
166 MAKING GLOBALIZATION SOCIALLY SUSTAINABLE
companies in industrialized countries have gone offshore to perform both manufacturing and services in order to focus on “core competencies” related to marketing, finance, research and development and design (see Prahalad and Hamel, 1990). This shift is reflected both in the general growth in trade openness and in particular by the growth in industrialized countries’ intermediate goods imports and goods imports from low-income developing countries.
The input–output measure of offshoring for Germany, the United Kingdom and the United States (not reported here, but see, Campa and Goldberg, 1997 and Milberg and Winkler, 2009), shows that materials and services offshoring, measured as the amount of imported inputs in total non-energy inputs, rose through the 1990s, with materials offshoring accounting for almost 30 per cent of input use in the United Kingdom, 23 per cent in Germany and over 17 per cent in the United States. In the cases of Germany and the United States, these levels reflect slow but steady growth in the reliance on imported inputs of goods, growing about 50 per cent over the period 1998–2006. For services, the level of imported inputs is much lower, butthe rates of growth are generally much higher than for materials offshoring. Asa number of recent studies indicate, services offshoring is likely to continue to expand more rapidly than that of materials in the years to come. These recent increases in offshoring are not new, but reflect an acceleration of a trend fromthe 1980s.
Rather than adopting the standard input–output measure of materials offshoring, which captures only intermediate materials, we use a broader measure that also includes final goods shipments from low- and middle-income countries. Specifically, we measure goods offshoring intensity as manufacturing imports from low- and middle-income countries as a percentage of total manufacturing imports. Low-income countries are used as destination countries for offshoring in order to cut production costs. However, offshore destinations also include developing countries with a middle-income level, such as Brazil, Mexico or South Africa. Moreover, China and India have recently been classified as middle-income countries.5
Figure 5.6 plots offshoring intensities for a sample of 15 OECD countries for the period 1991–2008. We classify countries in three groups: low, medium and high offshoring intensities. The first group includes the five countries with the lowest offshoring intensities as of 2008, namely Portugal, Sweden, Austria, Denmark and Norway. Offshoring intensities in this group grew by between 5.9 (Portugal) and7.2 per cent (Norway) per year over the period 1991–2008, reaching offshoring intensities of between 12 per cent in Portugal and 21.9 per cent in Norway.
The second group includes the five countries with medium offshoring intensities as of 2008, namely the United Kingdom, Spain, the Netherlands, Italy and Finland.

EFFECTS OF OFFSHORING ON ECONOMIC INSECURITY 167
CH
AP
TE
R 5
Offshoring intensities in this group grew by annualized growth rates of between 4.4 (Italy) and 10.7 per cent (Finland) over the period 1991–2008, resulting in offshoring intensities of between 25.1 per cent in the United Kingdom and 31 per cent in
Figure 5.6 Manufacturing imports from low- and middle-income countries (per cent of total manufacturing imports)
Source: Own illustration. Data: UN Comtrade. Note: Manufacturing imports comprise imports to sectors 15–36 at the two-digit ISIC Rev. 3 level. See Appendix table A5.1 for sectoral classification.
22%20%18%16%14%12%10%
8%6%4%
32%
28%
24%
20%
16%
12%
8%
4%
55%50%45%40%35%30%25%20%15%10%
1991
1992
1993
1994
1995
1996
1997
1998
1999
2000
2001
2002
2003
2004
2005
2006
2007
2008
1991
1992
1993
1994
1995
1996
1997
1998
1999
2000
2001
2002
2003
2004
2005
2006
2007
2008
1991
1992
1993
1994
1995
1996
1997
1998
1999
2000
2001
2002
2003
2004
2005
2006
2007
2008
NorwayDenmarkAustriaSwedenPortugal
FinlandItalyNetherlandsSpainUK
JapanUSRepublic of KoreaAustraliaGermany

168 MAKING GLOBALIZATION SOCIALLY SUSTAINABLE
Finland. The final group covers the five countries with the highest offshoring intensities in 2008: Germany, Australia, the Republic of Korea, the United Statesand Japan. Offshoring intensities reached between 31.7 per cent in Germany and51.4 per cent in Japan. Average annualized growth rates ranged from 5 per cent (Japan) to 7.6 per cent (Republic of Korea).
China’s export growth to the industrialized countries has been especially remarkable over the past ten years, reaching 10 per cent of total OECD imports in 2005, and continuing to grow since then. In 2006, the United States ran a US$ 235 billion deficit with China, based on imports of US$ 287 billion and exports of US$ 52 billion. Most of these imports were demanded directly by US corporations, such asWal-Mart, Nike and Mattel and numerous retail, apparel, electronics and automotive companies.6 About 25 per cent of US imports from China are “related party” imports, meaning they are between parties with at least a 5 per cent common ownership interest. Those without affiliates in China often order from large Chinese contract manufacturers or from vendors who subcontract to Chinese firms. In the electronics sector, Chinese production is dominated by foreign investors from Asia.
Empirical model of the labour share
Bentolila and Saint-Paul (2003) show that movements in the labour share can be decomposed into movements along a technology-determined curve and into shifts of this curve. We adopt their model of the labour share which assumes constant elasticity of substitution technology, yielding the following expression for the labour share of income LS.
(5.1)LS = (1 – α)(B · L)γ
= 1 – α(A · k) γ
α(A · K) γ + (1 – α)(B · L)γ
where K and L denote capital and labour, while A, B and γ represent technological parameters. Capital intensity k, that is, the capital–output ratio, is defined as:
k = K γ
α(A · K) γ + (1 – α)(B · L)γ (5.2)
The capital share KS is defined analogously, and thus:
KS + LS = 1 (5.3)
Equation (5.1) shows that there is stable relationship between the labour share and capital intensity k. This relationship does not change if there are changes in factor prices (wages or interest rates), quantities or labour-augmenting technological
� �1/γ

EFFECTS OF OFFSHORING ON ECONOMIC INSECURITY 169
CH
AP
TE
R 5
progress B, since these will only result in movements along the curve described in equation (5.1). However, Bentolila and Saint-Paul (2003) identify two sources of deviation from the relationship in equation (5.1), which result in shifts of the curve:(i) capital-augmenting technological progress A induced changes, for example asa result of import price fluctuations, and (ii) divergence between wages and productivity, brought on, for example, by a shift in labour bargaining power LBP. This leaves four explanatory variables in the model: technological progress A, capital intensity k, import prices MP and LBP. Taking logarithms we obtain:
ln LSit = ß0 + ß1 ln Ait + ß2 ln kit + ß3 ln MPit + ß4 ln LBPct (5.4)
where i designates sectors, c countries and t years.
Capital intensity can have a positive or negative impact on the labour share depending on the sign of γ in equation (5.1). (i) If labour and capital are substitutes, that is γ < 0, a higher capital intensity will reduce the labour share. (ii) If labourand capital are complements, that is γ > 0, a higher capital intensity will increasethe labour share. (iii) In the Cobb–Douglas case, that is γ = 0, the labour share isLS = 1 − α. If the technological parameter A is strictly capital-augmenting, it should have the same coefficient sign as capital intensity. If this is not the case, it suggests a more complex relation between productivity and output.
Prices of imported materials can have a positive or negative influence on the labour share, depending on three effects. (i) If import prices decline, the labour–capital ratio must fall in order to maintain a constant capital intensity, which lowers the labour share. (ii) The second effect is an indirect consequence of the first effect: it captures a rise in the wage rate induced by the lower labour–capital ratio, which has a positive effect on the labour share. (iii) If imported materials increase the marginal product of labour, a lower import price raises material imports, which increases the marginal product of labour and, thus, wages and the labour share. The net effect of import prices on the labour share is ambiguous.
The effect of increased labour bargaining power depends on the underlying bargaining model. (i) In the first model, firms and unions first bargain over wages and then firms set employment unilaterally, taking wages as given. An increase in labour’s bargaining power results in a higher wage rate which increases the capital intensity as firms substitute capital for labour. But the labour share may rise or fall depending on the elasticity of substitution between labour and capital (see above). (ii) In the second model, firms and workers bargain over both wages and employment and will set employment in an efficient way. For a given level of capital intensity, higher labour bargaining power increases the labour share, since labour is paid more than its marginal product. Capital intensity remains unchanged, because of the equality between marginal product and the alternative wage (Bentolila and Saint-Paul, 2003).

170 MAKING GLOBALIZATION SOCIALLY SUSTAINABLE
The labour share is measured as a sector’s compensation of employees in value added, or wL/VA, where w denotes the wage rate and VA value added. The technology parameter in the model is captured with labour productivity LP, measured as value added per employee (VA/L). Capital intensity is obtained by dividing a sector’s capital stock by value added (K/VA). Import prices MP are captured by using goods offshoring intensities as inverse proxies for the prices of imported goods, that is, a higher intensity reflects lower imported goods prices. Offshoring is measuredas the share of sectoral goods imports from low- and middle-income countries ina sector’s total goods imports. We adopt union density UND as a proxy for labour bargaining power, which measures the percentage of union affiliation in total employment, but is only available at the country level. Detailed data description can be found in Appendix A5.1.
This gives the following equation for estimation:
ln LSit = ß0 + ß1 ln LPit + ß2 ln kit + ß3 ln OFFit + ß4 ln UNDct + Di + Dt + εit (5.5)
where ß0 denotes the constant, Di the sector fixed effects, Dt the year fixed effects and εit the idiosyncratic error term.
Interaction with labour market regulations
This completes the basic model of the labour share, expanded to allow estimation of the impact of offshoring. But recall that we also want to explore empirically the effects of offshoring under different labour market regimes. Specifically, we interact offshoring with policy indicators of labour market flexibility and labour support to detect differential effects of offshoring. Interacting offshoring in equation (5.5) with a policy indicator at the country level yields the following equation:
ln LSit = ß0 + ß1 ln LPit + ß2 ln kit + ß3 ln OFFit + ß4 ln UNDct
+ δ1 ln OFFit * policyct–1 + δ2policyct–1 + Di + Dt + εit (5.6)
Where the total effect of offshoring on the labour share is given by ß3 + δ1policyct–1. By definition, the value of policy is positive in our sample (policyt–1 > 0). As a consequence, the total effect (ß3 + δ1policyct–1) will be smaller (larger resp.) than ß3
if the coefficient of the interaction term is negative (positive resp.), that is δ1 < 0(δ1 > 0 resp.).
We use different policy indicators to capture labour market flexibility and labour support at the country level, since none of these indicators are available at the sectoral level. Labour market flexibility is measured using the employment protection legislation index discussed above (see table 5.4).

EFFECTS OF OFFSHORING ON ECONOMIC INSECURITY 171
CH
AP
TE
R 5
We expect that the effects of offshoring on the labour share will be lower the more protective is a country’s labour market, since firms (and sectors) will be more likely to use offshoring mainly to complement existing, domestic operations. Winkler (2009), for instance, finds that offshoring has negative employment effects in Germany, while Amiti and Wei (2005, 2009) find positive effects for the United Kingdom and the United States. Winkler (2010) attributes these differences to different degrees of labour market flexibility. Firms in more rigid labour markets, such as Germany, do not create new jobs when they expand their offshoring despite efficiency gains. The net result is a decline in employment. Moreover, re-employment rates of laid-off labour tend to be higher in the United States compared to Europe (table 5.6). As a consequence, we expect the interaction term of EPL with offshoring to be negative. That is, the overall effect of offshoring on the labour share is smaller the more protective a country is in terms of hiring and firing regulation.
We capture labour support with three different policy indicators: (i) First, we usethe share of a country’s public expenditure on labour market programmes as a percentage of GDP. (ii) Second, we interact offshoring with a country’s short-term net unemployment benefits as a percentage of earnings for benefits paid in the first year of unemployment. (iii) We also use a country’s long-term net unemployment benefits, that is unemployment benefits that are paid after five years of unemployment. The second and third indicators are only available for 2001–07. In general, we expect that more labour support should positively influence the effect of offshoring on the labour share. Thus we hypothesize that the coefficient on the interaction variables will have a positive coefficient sign, that is δ1 > 0. This hypothesis is supported by a study showing at a cross-country level that for the countries providing more labour support – based on an index (using equal weights) composed of spending on labour market programmes and unemployment replacement benefits – offshoring has a less unfavourable or more favourable effect on the labour share of national income (Milberg and Winkler, 2010a).
Regression results across all countries
Our regression analysis covers 21 manufacturing sectors (at the two-digit ISIC Rev. 3 level – see Appendix table A5.1 for a sectoral classification) in 15 OECD countries over the period 1991–2008. Unfortunately, many countries did not report information on capital stock (for instance Belgium, Canada, France, Greece, Ireland and Luxembourg), which restricted our country sample to these 15 countries. However, our country sample still includes a variety of labour market regimes, which allows us to detect the differential effect of offshoring on the labour share. In a first step, we examine the effects of offshoring on the labour share using the whole country and sector sample. In a second step, we focus on the effects of offshoring by

172 MAKING GLOBALIZATION SOCIALLY SUSTAINABLE
country and country grouping following a grouping of five different labour market regimes which develop below.
For the summary statistics, see Appendix table A5.2. A scatterplot of the offshoring and the labour share data over the period 1991–2008 for 22 manufacturing sectors in 15 OECD countries gives no clear picture of the relation, but does show some outliers that might lead to biased results (see Appendix figure A5.2).7 The regression results using the fixed effects estimator are reported in table 5.7. All regressions correct for industry fixed effects and year fixed effects, and are robust to heteroscedasticy. Standard errors are clustered at the country-year level.
The results for the whole period 1991–2008 are reported in columns (1)–(5). Capital intensity is positively and significantly associated with the labour share, suggesting that labour and capital are complements. Labour productivity does not show the same coefficient sign as capital intensity, but it is negative and statistically significant. At a given wage rate, higher productivity per se lowers the labour share. This suggests that the direct effect of the productivity change is dominating any indirect wage effect suggesting a more complex relation between productivity on the production function (see subsection “Empirical model of the labour share”, above).
The variable of most interest, offshoring, has a positive and statistically significant coefficient. This finding is the opposite from what we found in previous research that focused strictly on the United States (see Milberg and Winkler, 2010b). However, given the heterogeneity of labour markets in our sample – what has been termed by others the “varieties of capitalism” – the discrepancy between these results and those of the United States study is not surprising.
We use interaction terms to capture the combined effect of offshoring and the particular structure of labour market regulation on the labour share. Specifically, we are interested in the interaction of offshoring with employment protection legislation and public expenditure on labour market programmes. As hypothesized, the positive effect of offshoring on the labour share is significantly reduced the more protective a country is in terms of hiring and firing (column (4)). Surprisingly, more public expenditure on labour market programmes significantly reduces the positive impact of offshoring on the labour share (column (5)).
Given these somewhat surprising results, we explored the issue further by splitting the time series into two separate periods, 1991–99 and 2000–08. The results for 1991–99 are shown in columns (6) and (7). In this case, the results from the full period sample estimation are confirmed. Most importantly, interacting offshoring with the variable on labour market programmes still shows a negative effect, and it is even larger for the sub-sample period of 1991–99 than for the full period.

EFFECTS OF OFFSHORING ON ECONOMIC INSECURITY 173
CH
AP
TE
R 5
Tab
le 5
.7 O
ffsh
ori
ng
an
d th
e la
bo
ur
shar
e, fi
xed
eff
ects
est
imat
or
Dep
end
ent v
aria
ble
: 19
91–
2008
1991
–99
2000
–08
lnLS
t
(1
) (2
) (3
) (4
) (5
) (6
) (7
) (8
) (9
) (1
0)
(11)
lnLP
t –0
.04
34
***
–0.0
37
0**
–0
.03
70
**
–0.0
59
6**
* –0
.04
38
**
–0.1
02
0**
* –0
.12
90
***
–0.0
93
6**
–0
.12
00
***
–0.0
33
2
–0.0
33
9
(0.0
06
) (0
.01
6)
(0.0
17
) (0
.00
0)
(0.0
14
) (0
.00
1)
(0.0
00
) (0
.03
9)
(0.0
09
) (0
.60
1)
(0.6
01
)ln
k t
0.0
90
4**
* 0
.09
78
***
0.0
97
8**
* 0
.08
83
***
0.1
09
6**
* 0
.12
07
***
0.1
11
7**
0
.16
58
***
0.1
64
9**
* 0
.24
84
***
0.2
50
8**
*
(0.0
00
) (0
.00
0)
(0.0
00
) (0
.00
0)
(0.0
00
) (0
.00
3)
(0.0
11
) (0
.00
0)
(0.0
00
) (0
.00
0)
(0.0
00
)ln
OFF
t
0.0
29
2**
* 0
.02
92
***
0.1
15
4**
* 0
.06
20
***
0.0
75
9**
* 0
.06
20
***
0.0
20
8
–0.0
17
2
–0.1
23
5
0.0
03
9
(0
.00
0)
(0.0
00
) (0
.00
0)
(0.0
00
) (0
.00
2)
(0.0
01
) (0
.55
6)
(0.4
99
) (0
.17
3)
(0.9
31
)ln
UN
Dt
0.0
00
4
0.0
96
9*
–0.0
05
9
0.0
20
3
–0.0
70
1
0.3
28
0
0.4
15
8**
0
.10
23
0
.21
97
(0
.99
4)
(0.0
60
) (0
.91
8)
(0.7
74
) (0
.34
8)
(0.1
24
) (0
.04
9)
(0.6
11
) (0
.29
7)
lnO
FFt* E
PL t
–1
–0
.03
33
***
–0
.02
62
***
0
.00
06
(0.0
00
)
(0.0
02
)
(0.9
64
)E
PL t
–1
–0
.04
42
***
–0
.03
12
–0.0
31
7
(0
.00
7)
(0
.30
2)
(0
.32
8)
lnO
FFt* L
MP
t–1
–0.6
95
0**
*
–1.1
89
3**
*
1.9
12
8*
(0
.00
6)
(0
.00
1)
(0
.05
3)
LMP
t–1
–2
.68
58
***
–5
.06
43
***
–1
.36
38
(0
.00
5)
(0
.00
0)
(0
.63
1)
lnO
FFt* U
RB
_ST t
–1
0
.23
66
*
(0
.06
7)
UR
B_S
T t–1
0.5
58
5*
(0.0
78
)ln
OFF
t* UR
B_L
T t–1
0
.06
02
(0
.42
2)
UR
B_L
T t–1
–0
.05
99
(0
.88
7)
R-s
quar
ed (w
ithin
) 0
.11
0
.09
0
.09
0
.11
0
.1
0.1
6
0.1
8
0.1
6
0.1
9
0.1
8
0.1
8O
bser
vatio
ns
4,4
43
4
,23
4
4,2
34
4
,07
3
3,6
65
2
,20
1
1,9
18
1
,57
0
1,4
86
1
,26
8
1,2
68
Cou
ntrie
s 1
5
15
1
5
15
1
5
15
1
5
15
1
5
15
1
5S
ecto
rs
30
2
30
2
30
2
30
2
30
2
30
2
26
1
30
2
30
2
30
2
30
2
Fixe
d ye
ar e
ffec
ts
Yes
Y
es
Yes
Y
es
Yes
Y
es
Yes
Y
es
Yes
Y
es
Yes
C
ount
ry–y
ear c
lust
ers
Yes
Y
es
Yes
Y
es
Yes
Y
es
Yes
Y
es
Yes
Y
es
Yes
F-
test
of j
oint
sig
nific
ance
:ln
OFF
t + ln
OFF
t* pol
icy t
–1 =
0
p>
F=
p>F=
p>
F=
p>F=
p>
F=
p>F=
p>
F=
p>F=
0
.00
00
0
.00
01
0
.00
51
0
.00
13
0
.52
69
0
.10
60
0
.03
66
0
.15
74
Sou
rce:
Ow
n ca
lcul
atio
ns. p
*<0
.1, p
**<
0.0
5, p
***<
0.0
1 (p
–val
ues
in p
aren
thes
es).

174 MAKING GLOBALIZATION SOCIALLY SUSTAINABLE
Columns (8)–(11) show the results for the period 2000–08. The results are different, in three important ways: first, offshoring no longer has an effect on the labour share; second, the interaction with employment protection legislation is no longer significant (column (9)) and third, the interaction with public expenditure on labour market programmes is now significantly positive. While the effect of offshoring is insignificant, there seems to be a joint significance with the interaction variable (column (10)).
Finally, we include other variables of labour support, namely short-term and long-term net unemployment benefits as a percentage of earnings, which are only available for 2001–07 (columns (10) and (11)). Short-term net unemployment benefits show a positive and statistically significant effect. Moreover, offshoringand the interaction with short-term unemployment benefits is also positive and statistically significant (column (10)).
To sum up, regression analysis for the period 1991–2008 shows that offshoring significantly increases the labour share. The positive effects from offshoring on the labour share are significantly less, however, the more protective a country is in terms of employment protection legislation and the higher a country’s public expenditure on labour market programmes. However, splitting the sample into the periods1991–99 and 2000–08 shows that the overall results seem to be driven by the first period. Between 2000 and 2008, a country’s public expenditure on labour market programmes increases the effect from offshoring on the labour share. We then added a country’s short-term and long-term net unemployment replacement benefits as a percentage of earnings as alternative measures of labour support. We findthat higher short-term net unemployment benefits positively influence the effectof offshoring on the labour share, while such an effect cannot be confirmed forlong-term net unemployment benefits.
Regression results by country and by labour market regime
Even without the outliers listed in endnote 7, the scatterplot of the offshoring and labour share data (see Appendix figure A5.2) does not give a clear picture for our full sample of 15 OECD countries over the period 1991–2008. We saw above that breaking out our sample into sub-periods gave some important insights about the change over time in the relation between offshoring and economic security (captured by the labour share), especially as mediated through labour market institutions. In this subsection we look more carefully at the country coverage, and especially the varieties of countries contained in the sample according to the taxonomy of labour market regimes discussed in section 5.2 above. We therefore run the labour share regressions by country and then by country groupings.

EFFECTS OF OFFSHORING ON ECONOMIC INSECURITY 175
CH
AP
TE
R 5
We define labour support as an indexed combination of public expenditure on labour market programmes and the net unemployment replacement benefit level as a share of earnings. Table 5.8 shows the average strictness of employment protection legislation (EPL) and the average levels of labour support, captured by short-term unemployment replacement benefits and public expenditure on labour market programmes, for our sample of 15 OECD countries for 2001, a year in the middle of our time period of interest and the first year for which short-term unemployment replacement rates are available. We group the countries into three categories – low, medium, and high – defining the thresholds as the 33rd and 67th percentiles.
Five distinct “models” of labour market regulation emerge, and they follow closely the groupings presented in recent discussions of “varieties of capitalism” (see, for example, Boeri, 2002; Sapir, 2006; and Hancke et al., 2007). We can identify an “Anglo-Saxon model” of low levels of regulation on hiring and firing and low levels of worker support. This group includes Australia, the United Kingdom and the United States. The “Mediterranean model” combines very strict employment legislation and medium levels of worker support. This group includes Portugal and Spain. The “flexicurity model” combines relatively flexible labour markets and high levels of worker support. Besides Denmark, we also include Finland and the Netherlands in this group. The “Rhineland model” combines medium to strict employment protection legislation and medium to high levels of worker support. Here we find Austria, Germany and Sweden.
Table 5.8 Rank of EPL and labour support, 2001, 15 OECD countries
Country EPL Group Country URB_ST Group Country LMP Group (%) (%)
USA 0.2 Low UK 49.4 Low Rep. of Korea 0.4 LowUK 0.7 Low Australia 53.0 Low UK 0.6 LowAustralia 1.2 Low Rep. of Korea 54.8 Low USA 0.7 LowJapan 1.4 Low Italy 55.0 Low Japan 0.8 LowDenmark 1.5 Low USA 58.8 Low Norway 1.2 LowItaly 2.0 Medium Japan 61.4 Medium Australia 1.2 MediumFinland 2.0 Medium Austria 63.0 Medium Italy 1.2 MediumRep. of Korea 2.0 Medium Germany 68.5 Medium Portugal 1.6 MediumNetherlands 2.1 Medium Norway 71.6 Medium Austria 1.8 MediumAustria 2.2 Medium Spain 73.1 Medium Spain 2.1 MediumSweden 2.2 High Netherlands 74.9 High Sweden 2.7 HighGermany 2.3 High Finland 77.4 High Finland 2.8 HighNorway 2.6 High Portugal 78.0 High Netherlands 3.1 HighSpain 3.1 High Sweden 78.6 High Germany 3.2 HighPortugal 3.7 High Denmark 80.1 High Denmark 4.1 High
Source: Own calculations. Data: OECD Labour Force Statistics and OECD Going for Growth 2010 Database.
Note: EPL is employment protection legislation, URB_ST is the short-term net unemployment replacement rate in per cent, LMP is public expenditure for active labour market programmes as a percentage of GDP.

176 MAKING GLOBALIZATION SOCIALLY SUSTAINABLE
Japan has always been difficult to categorize in these schemes because although the state supports only low levels of labour market and social protection, the private sector had traditionally supported long-term employment security. Based on our two-variable characterization, we can identify an “East Asian model”, including Japan and the Republic of Korea, which both have greater employment protection than those in the Anglo-Saxon group but have less labour support than most countries. It would seem that the traditional role for the private sector in Japan has given way to a great extent, as seen by the increase in long-term unemployment and involuntary part-time employment in Japan to the levels found in Europe.
Table 5.9 gives a summary of our analysis for the sample of 15 OECD countries, which is the groupings of countries according to the combination of labour support and strictness of employment legislation. Italy cannot be classified into the “Mediterranean group” because of its higher labour market flexibility. Norway fits into neither the “flexicurity model”, because of its strict labour market regulations, nor into the “Rhineland group” because of its medium–low labour support. As a result we have left them out of the sample.
The results of the country-based regressions are shown in table 5.10. As specifiedin column (2) of table 5.7, we used the fixed effects estimator. We report the instantaneous effect of offshoring on the labour share unless only the lagged value of offshoring had a significant impact on the sectoral labour share. In these cases, the level of significance is indicated with crosses instead of stars.
The results in table 5.10 indicate that offshoring has no clear effect on the labour share at the country level. The results for the whole period 1991–2008 are reported in columns (1) and (2). Offshoring has a significantly positive impact in Australia, Austria, Finland, Germany, Italy, the Netherlands and Norway. Note that these are mostly countries characterized by a medium–high level of labour support (seetable 5.8). In contrast, the effect of offshoring is significantly negative in Japan, Spain
Table 5.9 Taxonomy of labour market regimes
Model Anglo-Saxon Mediterranean Rhineland Flexicurity East Asian
Labour support Low Medium Medium–high High LowLabour flexibility High Low Medium–low Medium–high MediumCountries Australia Portugal Austria Denmark Japan
United Kingdom Spain Germany Finland Republic of United States Sweden Netherlands Korea
Source: Own calculations. Data: OECD Labour Force Statistics and OECD Going for Growth 2010 Database.
Note: See footnote of table 5.8 on labour support. Labour flexibility is calculated based on the EPL index(see figure 5.3).

EFFECTS OF OFFSHORING ON ECONOMIC INSECURITY 177
CH
AP
TE
R 5
and the United States, all countries with medium–low levels of labour support. We again break the time period into two parts, and columns (3) and (4) report the results for the period 1991–99. Now, Australia, Denmark, Germany and the Republic of Korea show a significantly positive relation between offshoring and the labour share, while Italy, Portugal and Spain show a significantly negative effect. While Portugal and Spain belong to the Mediterranean model with a medium labour support, the first group includes countries with both a high (Denmark, Germany) and low degree of labour support (Australia, the Republic of Korea).
In the country-level estimations of the labour share for the more recent period, 2000–08, only four countries show a positive and statistically significant coefficient on the offshoring variable, namely Austria, Germany, the Netherlands and Sweden. All of these countries have a medium–high level of labour support. Four countries have a significantly negative effect, namely Japan, Portugal, Spain and the United States, all countries with a low–medium labour support. The negative impact of offshoring on the sectoral labour share in the United States stands out in terms of coefficient size and confirms the findings by Milberg and Winkler (2010a) for 35 manufacturing and service industries between 1998 and 2006. The country-level regressions are suggestive, but our presentation above on economic security andits regulatory dimension focused on a set of five distinct labour market regimes,
Table 5.10 Offshoring and the labour share by country, fixed effects estimator
Dependent variable: 1991–2008 1991–1999 2000-2008 lnLSt Offshoring p-value Offshoring p-value Offshoring p-value (1) (2) (3) (4) (5) (6)
Australia 0.1268*** 0.0010 0.1404*** 0.0060 –0.0414 0.3400Austria 0.1246** 0.0140 0.0099 0.5270 0.3045+++ 0.0080Denmark –0.0021 0.8490 0.0283++ 0.0480 0.0363 0.4560Finland 0.0396+ 0.0780 0.0406 0.3650 –0.0989 0.1660Germany 0.1255*** 0.0000 0.1179*** 0.0070 0.1484++ 0.0430Italy 0.0503++ 0.0170 –0.0449* 0.0680 –0.0435 0.2550Japan –0.0277+ 0.0700 0.0088 0.6390 –0.0868+ 0.0770Republic of Korea 0.0139 0.3400 0.0502* 0.0860 –0.0307 0.1720Netherlands 0.1390*** 0.0080 0.0611 0.1860 0.2340++ 0.0120Norway 0.0803** 0.0480 0.0139 0.7670 0.0045 0.9410Portugal –0.0269 0.1880 –0.0595** 0.0420 –0.0769** 0.0200Spain –0.0331** 0.0420 –0.0653** 0.0310 –0.0931*** 0.0000Sweden 0.0436 0.1140 –0.0009 0.9810 0.1715* 0.0730United Kingdom 0.0001 0.9980 0.0139 0.7800 0.0589 0.4770United States –0.1369** 0.0140 –0.0609 0.2050 –0.2268+ 0.0950
Source: Own calculations.
Note: p*<0.1, p**<0.05, p***<0.01 for instantaneous effect of offshoring (lnOFFt). p+<0.1, p++<0.05, p+++ <0.01 for lagged effect of offshoring (lnOFFt–1).

178 MAKING GLOBALIZATION SOCIALLY SUSTAINABLE
defined by the two dimensions of labour market protection and by spending on labour support, and summarized in table 5.9 above.
We estimated the labour share regression as specified in equation (5.5) for the different labour market regimes. Column (1a) of table 5.11 shows the results for the Anglo-Saxon model, which includes Australia, the United Kingdom and the United States. The results of the Mediterranean model, which includes Portugal and Spain, are shown in column (2). Column (3) focuses on the Rhineland model, including Austria, Germany and Sweden. Column (4) shows the results of the flexicurity model covering Denmark, Finland and the Netherlands, while column (5) shows the results of Japan and the Republic of Korea, the East Asian model. We recognize that Australia is dissimilar from the other countries in the Anglo-Saxon group because of its position in global trade. Australia’s trade structure differs from that of the United Kingdom and the United States, as Australia is a commodity exporter and manufacturing goods importer, and thus cannot be expected to be affected by offshoring in the same way as most OECD countries. Thus column (1b) is estimated for the Anglo-Saxon group excluding Australia.
Once again, this is a very standard specification of a model of the labour share, and our main interest is in the offshoring variable. Offshoring has a positive and statistically significant impact on the labour share in the Anglo-Saxon, flexicurity and Rhineland models. The coefficient is negative and statistically significant in the Mediterranean model and negative but statistically insignificant in the East Asian sample. For the Anglo-Saxon sample, the offshoring coefficient is positive and significant when Australia is included (column (1a)), but the coefficient becomes negative and statistically significant when Australia is excluded (column (1b)). In sum, these findings show that more offshoring is associated with less economic insecurity in those countries with more supportive labour market regimes (flexicurity and Rhineland) and is associated with greater economic insecurity in areas characterized by less supportive labour market institutions (Anglo-Saxon and Mediterranean). The findings support the view that labour market institutions matter in mediating the effects of globalization on workers in OECD countries.
Regarding the other variables in the model, labour productivity has a negative and statistically significant effect on the labour share for all groups except in the East Asian model. The size of the coefficient, however, seems to increase with the amount of labour support, ranging from −0.028 in the Anglo-Saxon model to −0.2606 in the flexicurity model. What would be an explanation for that? Recall that labour productivity is defined as value added per employee (VA/L), whereas the labour share is defined as the compensation of employees in value added wL/VA. By definition, an increase of labour productivity lowers the labour share to the same extent, holding the wage rate w constant. A simultaneous increase in the nominal

EFFECTS OF OFFSHORING ON ECONOMIC INSECURITY 179
CH
AP
TE
R 5
Tab
le 5
.11
Off
sho
rin
g a
nd
the
lab
ou
r sh
are
by
lab
ou
r m
ark
et r
egim
e, fi
xed
eff
ects
est
imat
or,
19
91
–20
08
Dep
end
ent v
aria
ble
: ln
LSt
An
glo
-Sax
on
Med
iter
ran
ean
Rh
inel
and
Fle
xicu
rity
E
ast A
sian
(1a)
(1
b)
(2)
(3)
(4)
(5)
lnLP
t
lnk t
lnO
FFt
lnU
ND
t
–0.0
28
0*
(0.0
98
)–0
.05
03
(0.1
13
)0
.04
72
**(0
.01
8)
0.2
49
8**
(0.0
14
)
–0.0
10
9(0
.49
9)
–0.1
12
9**
*(0
.00
0)
–0.0
42
5*
(0.0
78
)0
.89
31
**(0
.01
9)
–0.1
29
8**
(0.0
24
)0
.13
78
*(0
.08
9)
–0.0
31
6**
*(0
.00
4)
–0.1
38
7(0
.10
0)
–0.1
97
1**
*(0
.00
1)
–0.0
23
3(0
.41
2)
0.0
74
1**
*(0
.00
0)
0.3
40
8**
(0.0
15
)
–0.2
60
6**
*(0
.00
0)
0.1
43
4**
*(0
.00
0)
0.0
33
0**
(0.0
30
)0
.26
80
*(0
.09
3)
0.0
04
8(0
.77
2)
0.1
22
4**
*(0
.00
0)
–0.0
02
9(0
.79
8)
0.6
47
3**
*(0
.00
0)
R–s
quar
ed (w
ithin
)O
bser
vatio
nsC
ount
ries
Fixe
d ye
ar e
ffec
tsC
ount
ry–y
ear c
lust
ers
0.0
88
75
Aus
tral
ia,
Uni
ted
Kin
gdom
, U
nite
d S
tate
s
Yes
Yes
0.2
15
60
Uni
ted
Kin
gdom
, U
nite
d S
tate
s
Yes
Yes
0.1
35
33
Por
tuga
l, Spa
in
Yes
Yes
0.3
18
27
Aus
tria
, Ger
man
y,S
wed
en
Yes
Yes
0.3
38
56
Den
mar
k, F
inla
nd,
Net
herla
nds
Yes
Yes
0.1
76
20
Japa
n,R
epub
lic o
f Kor
ea
Yes
Yes
Sou
rce:
Ow
n ca
lcul
atio
ns.
Not
e: p
*<0
.1, p
**<
0.0
5, p
***<
0.0
1 (p
-val
ues
in p
aren
thes
es).

180 MAKING GLOBALIZATION SOCIALLY SUSTAINABLE
wage rate, on the other hand, can counterbalance this drop in the labour share. Capital intensity significantly increases the labour share in the East Asian, Mediterranean and Rhineland models with coefficient sizes of similar magnitudes. Union density has a significantly positive effect on the labour share in all models except for the Mediterranean one. Moreover, the coefficient size is highest in the Anglo-Saxon model without Australia (column (1b)) and the East Asian model. This suggests that the positive effect of union density is stronger the more flexible the labour markets are.
5.6 Offshoring and perceptions of economic insecurity
Perceptions of offshoring-induced economic insecurity
The media reported heavily on the issue of corporate downsizing in the 1980s, but offshoring did not receive a lot of media attention until the 1990s. Public concern about services offshoring exploded when the Forrester consulting firm issued a prediction that 3.3 million jobs in the United States would be lost to services offshoring over a 15-year period (McCarthy, 2002). Since the release of the Forrester study in 2003, the number of newspaper articles on services outsourcing has skyrocketed, and was particularly high during the US presidential campaign of 2004. Amiti and Wei (2005, p. 309) report 2,634 articles on services offshoring in US newspapers in the first five months of 2004, about five times the amount of coverage found in a similar period in 2001.
In the United States, the offshoring of services has added a new source of public concern about living standards because for the first time in US history it iswhite-collar jobs that are threatened by foreign competition. The jobs that are being moved overseas are not just the low-skilled jobs based in declining manufacturing industries, such as automobiles, footwear and apparel. These are service jobs, ranging from low-skilled call-centre jobs to high-skilled work in software development, semiconductor manufacturing, financial market analysis and radiology exam reporting. Since white-collar work was seen as the main area of future job growth (see, for example, Reich, 1991), the upsurge in services offshoring adds an additional dimension to the debate, which is the question of what sectors in the United States are most likely to provide employment in the future. Still, we can see that even in 2006 the intensity of services offshoring is still well below that for materials. The United States continues to run a trade surplus on services overall, although not in business, professional and technical services, which is the area where the fears are greatest.
Recent surveys show that about half of Americans and Europeans think that “freer trade” results in more job loss than job creation. Also France and the United States

EFFECTS OF OFFSHORING ON ECONOMIC INSECURITY 181
CH
AP
TE
R 5
show the most scepticism toward international trade and investment, although between 2005 and 2007 American sentiment turned against freer trade while European sentiment became less sceptical about the employment benefits of trade liberalization. Half of Americans and a slightly higher percentage of Europeans saw the growth of China’s economy as a threat (see figure 5.7). Of all countries surveyed, France and the United States showed the lowest percentage who did favour foreign companies investing in their country, with only 53 per cent of Americans and 59 per cent of French. This contrasted with 69 per cent of German and UK respondents who were in favour of FDI.8
In the United States, 40 per cent expect that the next generation will have a lower standard of living, 62 per cent said job security had declined and 59 per cent said they have to work harder to earn a decent living. Most striking is that 75 per cent of Americans said that “outsourcing work overseas hurts American workers” (Anderson and Gascon, 2007, p. 1). While this expression of economic insecurity was greatest among those with less education, expressions of a rise in economic insecurity as a result of offshoring were found for all educational categories.9
The contrast between perceptions of globalization across different European countries is clear from the Eurobarometer survey that asked: “what comes firstto mind when you hear the word ‘globalization’?” Possible answers included:(i) “opportunities for domestic companies in terms of new outlets”; (ii) “foreign investments in country”; (iii) “relocation of some companies to countries where labour is cheaper”; (iv) “increased competition for country” and (v) “other”. Answer (iii) reflects perceived worker insecurity with regard to cost-oriented offshoring.Figure 5.8 shows the development of this indicator across selected EU countries from Autumn 2004 to Spring 2008.
Countries with a medium–high degree of labour support strongly associate globalization with job relocations, especially France, flexicurity countries (Belgium, Finland) and Rhineland countries (Germany, Austria). Denmark is the exception. Mediterranean countries (with the exception of Greece) and Anglo-Saxon countries – both groups with a low degree of labour support – generally show a lower association of globalization with job relocations. Over the period, this negative association grew in all countries except for Denmark and Sweden, and most strongly in Germany, Ireland, Luxembourg and Spain.
The Eurobarometer survey also asked the following question: “Which of the following two propositions is the one which is closest to your opinion with regard to globalization?” Possible answers included: (i) “good opportunity for domestic companies”; (ii) “threat to employment and companies” and (iii) “don’t know”.Answer (ii) reflects the perceived negative effects of globalization. Figure 5.9 shows the development of this indicator across selected EU countries from Spring 2006

182 MAKING GLOBALIZATION SOCIALLY SUSTAINABLE
Fig
ure
5.7
Co
nce
rns
abo
ut f
ree
trad
e (p
er c
ent o
f res
po
nd
ents
)
Sou
rce:
Ger
man
Mar
shal
l Fun
d (2
00
7),
Trad
e an
d P
over
ty R
educ
tion
Sur
vey,
Top
line
Dat
a O
ctob
er 2
00
7.
Favo
ur fr
eer t
rade
Favo
ur fo
reig
n co
mpa
nies
inve
stin
g in
our
cou
ntry
Agr
ee th
at tr
ade
cost
s m
ore
jobs
than
it c
reat
es
Agr
ee th
at fr
eer t
rade
lead
s to
mor
e so
cial
and
econ
omic
ineq
ualit
y in
our
cou
ntry
Agr
ee th
at fr
eer t
rade
put
s ou
r cou
ntry
at a
dis
adva
ntag
ebe
caus
e of
our
hig
h la
bour
and
env
ironm
enta
l sta
ndar
ds
Agr
ee th
at th
e C
hine
se e
cono
my
repr
esen
ts a
thre
at
37%
74%
84%
60%
59%
69%
69%
53%
59%
57%
66%
46%
41% 45
%
74%
52%
61%
61% 64
%57
%34
%51
%
42%
42%
Fran
ceG
erm
any
Uni
ted
Kin
gdom
Uni
ted
Sta
tes

EFFECTS OF OFFSHORING ON ECONOMIC INSECURITY 183
CH
AP
TE
R 5
Fig
ure
5.8
Per
cep
tio
ns
of o
ffsh
ori
ng
(per
cen
t of r
esp
on
den
ts)
Sou
rce:
Ow
n ill
ustr
atio
n. S
urve
y da
ta: E
urob
arom
eter
, Pub
lic O
pini
on in
the
EU
, var
ious
sur
veys
.
70 60 50 40 30 20 10 0
Austria
Belgium
Denmark
Finland
France
Germany
Greece
Ireland
ItalyLuxembourgNetherlands
Portugal
Spain
Sweden United Kingdom
Que
stio
n: “
Ther
e ar
e m
ultip
le c
onse
quen
ces
of th
e gl
obal
izat
ion
of tr
ade.
Whe
n yo
u he
ar th
e th
e w
ord
‘glo
baliz
atio
n’, w
hat c
omes
firs
t to
min
d?”
Ans
wer
: ‘R
eloc
atio
n of
som
e co
mpa
nies
to c
ount
ries
whe
re la
bour
is c
heap
er”
Aut
umn
2004
Aut
umn
2005
Spr
ing
2007
Spr
ing
2008

184 MAKING GLOBALIZATION SOCIALLY SUSTAINABLE
Fig
ure
5.9
Per
cep
tio
ns
of g
lob
aliz
atio
n (p
er c
ent o
f res
po
nd
ents
)
Sou
rce:
Ow
n ill
ustr
atio
n. S
urve
y da
ta: E
urob
arom
eter
, Pub
lic O
pini
on in
the
EU
, var
ious
sur
veys
.
Austria
Belgium
Denmark
Finland
France
Germany
Greece
Ireland
ItalyLuxembourgNetherlands
Portugal
Spain
Sweden United Kingdom
70 60 50 40 30 20 10 080S
prin
g 20
06S
prin
g 20
08A
utum
n 20
08
Que
stio
n: “
Whi
ch o
f the
follo
win
g tw
o pr
opos
ition
s is
the
one
whi
ch is
clo
sest
to y
our o
pini
on w
ith re
gard
to g
loba
lizat
ion?
”
Ans
wer
: “Th
reat
to e
mpl
oym
ent a
nd c
ompa
nies
”
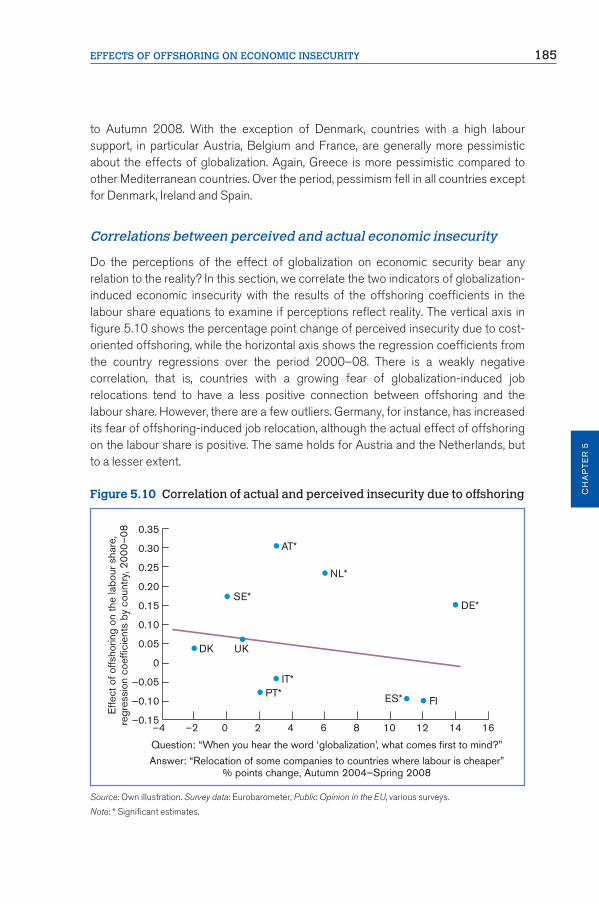
EFFECTS OF OFFSHORING ON ECONOMIC INSECURITY 185
CH
AP
TE
R 5
to Autumn 2008. With the exception of Denmark, countries with a high labour support, in particular Austria, Belgium and France, are generally more pessimistic about the effects of globalization. Again, Greece is more pessimistic compared to other Mediterranean countries. Over the period, pessimism fell in all countries except for Denmark, Ireland and Spain.
Correlations between perceived and actual economic insecurity
Do the perceptions of the effect of globalization on economic security bear any relation to the reality? In this section, we correlate the two indicators of globalization-induced economic insecurity with the results of the offshoring coefficients in the labour share equations to examine if perceptions reflect reality. The vertical axis in figure 5.10 shows the percentage point change of perceived insecurity due to cost-oriented offshoring, while the horizontal axis shows the regression coefficients from the country regressions over the period 2000–08. There is a weakly negative correlation, that is, countries with a growing fear of globalization-induced job relocations tend to have a less positive connection between offshoring and the labour share. However, there are a few outliers. Germany, for instance, has increased its fear of offshoring-induced job relocation, although the actual effect of offshoring on the labour share is positive. The same holds for Austria and the Netherlands, but to a lesser extent.
Figure 5.10 Correlation of actual and perceived insecurity due to offshoring
Source: Own illustration. Survey data: Eurobarometer, Public Opinion in the EU, various surveys.
Note: * Significant estimates.
0.35
0.30
0.25
0.20
0.15
0.10
0.05
0
–0.05
–0.10
–0.15–4 –2 0 2 4 6 8 10 12 14 16
Effe
ct o
f offs
horin
g on
the
labo
ur s
hare
,re
gres
sion
coe
ffici
ents
by
coun
try,
200
0–08
Question: “When you hear the word ‘globalization’, what comes first to mind?”
Answer: “Relocation of some companies to countries where labour is cheaper”% points change, Autumn 2004–Spring 2008
SE*
DK UK
PT*IT*
NL*
AT*
DE*
ES* FI

186 MAKING GLOBALIZATION SOCIALLY SUSTAINABLE
Figure 5.11 shows the percentage point change of perceived insecurity due to globalization on the vertical axis. The correlation with the regression coefficients is again weakly negative, that is, countries with a growing fear of the negative effects of globalization on companies and employment seem to have a less positive actual effect of offshoring on the labour share. Outliers include Austria, where fear of globalization fell only slightly, while offshoring led to actual gains for workers in terms of the labour share. Similar developments can be observed in the Netherlands and Sweden. This weak negative correlation supports the notion that perceptions and reality are linked. It is consistent with the findings for the United States by Scheve and Slaughter (2003), in which low-skilled workers were found to be more sceptical about globalization and trade liberalization than workers with higher skills.
Perceptions of a strong link between globalization and economic insecurity are probably driven both by current reality and by predictions of the future of globalized production. A number of recent studies project potentially very significant expansion
Figure 5.11 Correlation of actual and perceived insecurity due to globalization
Source: Own illustration. Survey data: Eurobarometer, Public Opinion in the EU, various surveys.
Note: * Significant estimates.
0.35
0.30
0.25
0.20
0.15
0.10
0.05
0
–0.05
–0.10
–0.15–25 –20 –15 –10 –5 0 5 10
SE*
DKUK
PT*
IT*
NL*
AT*
DE*
ES*FI
Effe
ct o
f offs
horin
g on
the
labo
ur s
hare
,re
gres
sion
coe
ffici
ents
by
coun
try,
200
0–08
“Which of the following two propositions is the one which is closest toyour opininion with regard to globalization?”
Answer: “Threat to employment and companies”% points change, Spring 2006–Autumn 2008

EFFECTS OF OFFSHORING ON ECONOMIC INSECURITY 187
CH
AP
TE
R 5
of services offshoring. Blinder (2006, 2007a, 2007b) has done a detailed analysis of the US labour force, looking especially at services jobs and the extent to which they are “personally delivered” or “impersonally delivered”. Personally-delivered services cannot be delivered electronically, such as child care or garbage collection. Impersonally-delivered services are those that can be delivered electronically without a significant loss of quality. These would include travel reservations and computer support (Blinder, 2007a, p. 4).
Blinder estimates that 30–40 million current jobs are likely in the future to involve impersonally-delivered services and thus be potentially subject to offshoring. This estimate is equivalent to 22–29 per cent of the current American workforce (Blinder, 2007a, p. 18). Blinder’s analysis is notable not just because the potential labour market displacement is large, but because the displacement affects all skill levels of the US labour force. Blinder sees the potential wave of offshoring as driving a new industrial revolution, writing that “the sectoral and occupational compositions of the U.S. workforce are likely to be quite different a generation or two from now. When that future rolls around, only a small minority of U.S. jobs will still be offshorable; the rest will have already moved off shore” (ibid.). Blinder’s analysis shows that the distinction between high-skilled versus low-skilled labour which characterizes most of the research to date, may be much less relevant in the near future.
5.7 Conclusion
The wave of offshoring by firms in industrialized countries, which has grown steadily over the past 10–20 years has occurred during a period of greater worker vulnerability to economic loss. But vulnerability does not translate directly into economic insecurity. This depends on household efforts to reduce the risk of sudden loss and on national policies to absorb such risks. Different industrialized countries have implemented very different sets of policies, and we have identified five distinct regimes of labour market institutions. On one extreme are the Anglo-Saxon economies, including the United States, with lax hiring and firing regulations, low unemployment benefits and very limited spending on active labour market policies. On the other extreme are the countries in the Rhineland model, including Germany and Austria, who have relatively high levels of employment protection, large unemployment benefits and significant spending on active labour market programmes. Denmark (and a few other countries) seems to have found an effective combination of the two, comprising labour market flexibility with high replacement income programmes for the unemployed and extensive active labour market programmes. Austria and Germany have moved toward flexicurity, but are still quite a distance from a Danish-type system.

188 MAKING GLOBALIZATION SOCIALLY SUSTAINABLE
We adopted the labour share of national income as our main indicator of economic insecurity. This variable comprises both employment and earnings, and it is tied also to the success of the profit-seeking behaviour of firms who use offshoring as a means of raising profits. Our econometric analysis focused on the effect of offshoring on the labour share of value added in 15 OECD countries and 21 manufacturing sectors, where a fall in the labour share is an indicator of heightened economic insecurity. We found that offshoring had a positive effect on the labour share over the period 1991–2008. These results seem to be driven by the period 1991–99, while offshoring has no effect during 2000–08.
Our focus has been on the mitigating role of labour market institutions on this general outcome. We found that for those countries providing more labour market support in the form of greater spending on active labour market policies and higher short-term unemployment replacement benefits, offshoring had larger positive effect. Our regression analysis by country shows that offshoring is associated with a reduced labour share in sectoral value added and, thus, with a higher share of corporate profit in Japan, Portugal, Spain and the United States – all countries with a low and medium labour support. The regression results by country groupings show that the effect of offshoring is negative in the Anglo-Saxon (without Australia) and Mediterranean countries, while it is positive in the Rhineland and flexicurity countries.
In the final section of the chapter we turned to the relation between perceptionsof globalization based on surveys and the actual effect as estimated by our labour share regressions. We found a weakly negative relation between growing enthusiasm for globalization and the effect of offshoring on the labour share. This weak negative correlation supports the notion that perceptions and reality are linked. It is consistent with the findings for the United States by Scheve and Slaughter (2003), in which low-skilled workers were found to be more sceptical about globalization and trade liberalization than workers with higher skills.

EFFECTS OF OFFSHORING ON ECONOMIC INSECURITY 189
CH
AP
TE
R 5
Appendix A5.1 Data
We estimate the effect of offshoring on the labour share at the two-digit ISIC Rev. 3 sectoral level for the period 1991–2008 using a sample of 21 manufacturing sectors for 15 OECD countries. Offshoring is defined as the share of goods imports from low- and middle-income countries in total goods imports. We obtained sectoral import data from UN Comtrade.
The sectoral labour share is calculated as total compensation (nominal) in value added (nominal). We obtained the data for all countries from the OECD STAN Database except for Australia and Japan which we retrieved from the EU KLEMS Database. Labour productivity is measured as gross value added (in constant prices) divided by the number of persons engaged (in 1,000s). The data are obtained from the EU KLEMS Database except for Norway (OECD STAN Database). We used gross value added price indices with 1995 as the base year. Since value added was reported in national currencies, we converted volumes into US dollars using exchange rates from the EIU Database.
Capital intensities are obtained by dividing the sectoral net capital stock (constant prices) by sectoral value added (constant prices). Many countries did not report capital stock data (for example, Belgium, Canada, France, Greece, Ireland and Luxembourg), which restricted our sample to 15 countries. Only Austria and Germany had capital stock data available at the two-digit ISIC Rev. 3 classification. Other countries reported capital stock at the two-digit level for some sectors only. We captured missing sectors by calculating capital intensities at a more aggregated level (at most three two-digit sectors) for which capital stock data were available. This follows the assumption that capital intensities at a higher aggregation are similar to capital intensities at the disaggregated two-digit level. For example, in many countries we had to use the same capital intensity for sectors 17–19 (textiles, wearing apparel, leather and footwear), since capital stock data were not available for the individual sectors. We obtained capital intensities from the OECD STAN Database and the EU KLEMS Database.
Union density, defined as the number of union members in total employment, is based on the OECD Labour Force Statistics and is available at the country level only. The policy indicators are also only available at the country level. The EPL indicator and public expenditure on labour market programmes as a percentage of a country’s GDP are retrieved from the OECD Labour Force Statistics. We obtained net unemployment replacement benefits as a percentage of earnings from the OECD Going for Growth 2010 database. The data are available for the period 2001–07 only. Short-term benefits refer to unemployment benefits that are paid within the first year of unemployment. Long-term benefits refer to unemployment benefits which are paid after five years of unemployment.

190 MAKING GLOBALIZATION SOCIALLY SUSTAINABLE
Table A5.1 Sectoral classification
ISIC Rev. 3 Sector name
15 Food products and beverages16 Tobacco products17 Textiles18 Wearing apparel, dressing and dying of fur19 Leather, leather products and footwear20 Wood and products of wood and cork21 Pulp, paper and paper products22 Printing and publishing23 Coke, refined petroleum products and nuclear fuel24 Chemicals and chemical products25 Rubber and plastics products26 Other non-metallic mineral products27 Basic metals28 Fabricated metal products, except machinery and equipment29 Machinery and equipment, nec*30 Office, accounting and computing machinery31 Electrical machinery and apparatus, nec32 Radio, television and communication equipment33 Medical, precision and optical instruments34 Motor vehicles, trailers and semi-trailers35 Other transport equipment36 Manufacturing, nec
* not elsewhere classified.

EFFECTS OF OFFSHORING ON ECONOMIC INSECURITY 191
CH
AP
TE
R 5
Tab
le A
5.2
Su
mm
ary
stat
isti
cs
19
91–
2008
1991
–99
20
00–
08
O
bs
Mea
n
Std
Dev
O
bs
Mea
n
Std
Dev
O
bs
Mea
n
Std
Dev
lnLS
t
lnLP
t
lnk t
lnO
FFt
lnU
ND
t
lnO
FFt*E
PL t–
1
EP
L t–1
lnO
FFt*L
MP
t–1
LMP
t–1
lnO
FFt*U
RB
_ST t–
1
UR
B_S
T t–1
lnO
FFt*U
RB
_LT t–
1
UR
B_L
T t–1
5,1
04
–0
.46
50
69
4
0.2
54
39
67
4,6
20
3.8
88
02
5
0.6
56
84
65
5,0
58
0.3
93
22
71
0
.50
35
42
2
5,2
94
–1
.92
46
99
1
.04
17
69
5,5
44
–1
.19
47
22
0
.60
33
23
5
5,1
10
–4
.25
05
53
3
.40
18
22
5,2
36
2.0
89
11
6
0.9
42
77
75
4,6
90
–0
.04
75
37
4
0.0
48
02
61
4,7
74
0.0
22
40
36
0
.01
50
71
3
2,6
53
–0
.44
82
02
1
0.2
42
13
78
2,7
09
3.8
26
12
4
0.5
86
09
8
2,6
52
0.4
24
44
0.4
89
64
81
2,5
22
–2
.27
24
28
1
.10
35
51
2,7
72
–1
.11
37
2
0.5
79
82
04
2,3
38
–5
.33
55
11
3
.83
24
07
2,4
64
2.2
75
01
2
1.0
30
78
2
2,0
44
–0
.06
76
93
4
0.0
59
09
63
2,1
28
0.0
27
50
97
0
.01
74
03
2
2,4
51
–0
.48
33
26
8
0.2
65
87
85
1,9
11
3.9
75
77
5
0.7
37
02
84
2,4
06
0.3
58
82
29
0
.51
63
45
5
2,7
72
–1
.60
83
3
0.8
68
85
73
2,7
72
–1
.27
57
23
0
.61
54
76
2
2,7
72
–3
.33
54
63
2
.66
80
71
2,4
64
1.9
15
00
8
0.8
16
20
01
2,6
46
–0
.03
19
67
3
0.0
28
89
53
2,3
80
0.0
17
91
68
0
.01
10
45
5
2,1
56
–1
.05
03
4
0.6
40
85
69
2,1
56
0.6
63
87
43
0
.09
82
38
1
2,1
56
–0
.83
64
44
1
0.5
85
38
54
2,1
56
0
.52
87
64
1
0.1
98
82
18

192 MAKING GLOBALIZATION SOCIALLY SUSTAINABLE
Fig
ure
A5.
1 O
ffsh
ori
ng
an
d th
e la
bo
ur
shar
e, 1
99
1–2
00
8, b
y 2
-dig
it IS
IC s
ecto
r
Sou
rce:
Ow
n ill
ustr
atio
n. S
ee A
ppen
dix
A5
.1 fo
r a d
ata
desc
riptio
n an
d A
ppen
dix
tabl
e A
5.1
for t
he s
ecto
ral c
lass
ifica
tion.
2
Inof
f
Inls0 -2 -4 2 0 -2 -4 2 0 -2 -4 2 0 -2 -4 2 0 -2 -4 –
10–
50
–10
–5
0
–10
–5
0–
10–
50
–10
–5
0
1516
1718
19
20 25 30 35
2122
2324
2627
2829
3132
3334
36

EFFECTS OF OFFSHORING ON ECONOMIC INSECURITY 193
CH
AP
TE
R 5
Fig
ure
A5.
2 O
ffsh
ori
ng
an
d th
e la
bo
ur
shar
e, 1
99
1–2
00
8, w
ith
ou
t ou
tlie
rs, b
y co
un
try
Sou
rce:
Ow
n ill
ustr
atio
n. S
ee A
ppen
dix
tabl
e A
5.1
for a
dat
a de
scrip
tion.
0.5 0
–0.
5–
1.0
–1.
5
0.5 0
–0.
5–
1.0
–1.
5
0.5 0
–0.
5–
1.0
–1.
5
0.5 0
–0.
5–
1.0
–1.
5–
6–
4–
20
–6
–4
–2
0–
6–
4–
20
–6
–4
–2
0
Aus
tral
iaA
ustr
iaD
enm
ark
Finl
and
Ger
man
yIta
lyJa
pan
Rep
ublic
of K
orea
Net
herla
nds
Nor
way
Por
tuga
lS
pain
Sw
eden
Uni
ted
Kin
gdom
Uni
ted
Sta
tes
Inof
f
Inls

194 MAKING GLOBALIZATION SOCIALLY SUSTAINABLE
Endnotes
1. See http://stats.oecd.org/glossary/detail.asp?ID=3535.
2. Barbosa et al. (2007) find that the deterioration in the US current account between 1995 and 2003 closely tracks the rise in health care spending by Americans.
3. See Crino (2009) and Milberg and Winkler (2010b) for reviews of the empirical literature.
4. Most studies on the employment-level effects of offshoring refer to the labour demand specification of Hamermesh (1993), in which conditional labour demand is derived from a cost function using Shephard’s Lemma whereby factor demand is given by the partial derivative of the cost function with respect to the corresponding factor price, regardless of the form of the production function.
5. Countries with a per capita income of US$ 975 or less are classified low income, while countries are classified high income if their per capita income is US$ 11,906 or more.
6. See Scott (2007) on Wal-Mart’s US imports from China and their employment effects in the United States. For analysis of the effect of the recent economic downturn on the consolidation of global value chains (including Chinese gains in import market share in the United States), see Milberg and Winkler (2010c).
7. Sector 16 (tobacco) shows extremely low and also extremely high offshoring intensities. We thus dropped this sector in the regressions. In addition, we identified six outliers due to very high labour shares, namely sector 19 (leather) for Denmark, sector 23 (coke, refined petroleum and nuclear fuel) for Denmark and Portugal, sector 30 (office, accounting, and computing machinery) for Finland, and sector 32 (radio, television and communication equipment) for the Netherlands and Sweden. We also dropped sector 23 (coke, refined petroleum and nuclear fuel) for Japan due to very low labour shares.
8. Note that Scheve and Slaughter (2003) find that in the United Kingdom over 1991–99, perceived economic insecurity was higher in those sectors with greater outward FDI.
9. Even on the issue of perception of insecurity, there is conflicting evidence. Kierkegaard (2007, p. 11) shows that among European countries there is not a statistically significant relation between “public anxiety” over offshoring (as measured by the Eurobarometer 63 of 2005) and the intensity of offshoring and offshore outsourcing.
References
Amiti, M.; Wei, S.-J. 2005. “Fear of service outsourcing: Is it justified?”, in Economic Policy,Vol. 20, No. 42, pp. 305–347.
—; —. 2006. “Service offshoring, productivity and employment: Evidence from the US”, CEPR Discussion Paper, No. 5475, February 2006 (London, Centre for Economic Policy Research).
—; —. 2009. “Service offshoring and productivity: Evidence from the US”, in The World Economy, Vol. 32, No. 2, pp. 203–220.

EFFECTS OF OFFSHORING ON ECONOMIC INSECURITY 195
CH
AP
TE
R 5
Anderson, R.; Gascon, C. 2007. “The perils of globalization: Offshoring and economic security of the American worker”, Working Paper No. 2007-004A, Research Division, Federal Reserve Bank of St. Louis.
Autor, D. 2010. “Polarization of job opportunities in the U.S. labor market: Implications for employment and earnings”, Joint paper for The Center for American Progress and The Hamilton Project/Brookings Institution (Washington, DC), April 2010.
Barbosa, N.; Rada, C.; Taylor, L.; Zamparelli, L. 2007. “Cycles and trends in U.S. net borrowing flows: Pro-cyclical household net borrowing, counter-cyclical government, consumption and the current account, and elusive twin deficits”, Working Paper No. 2007-5, Schwartz Center for Economic Policy Analysis, The New School for Social Research (New York).
Bentolila, S.; Saint-Paul, G. 2003. “Explaining movements in the labor share”, in Contributions to Macroeconomics, Vol. 3, No. 1, Article 9.
Blinder, A. 2006. “Fear of offshoring”, mimeo, Princeton University.
—. 2007a. “How many U.S. jobs might be offshorable?” CEPS Working Paper No. 142 (Princeton, NJ, Center for Economic Policy Studies, Princeton University), March.
—. 2007b. “Offshoring: Big deal, or business as usual?”, CEPS Working Paper No. 149 (Princeton, NJ, Center for Economic Policy Studies, Princeton University), June.
Boeri, T. 2002. “Making social Europe(s) compete”, mimeo, University of Bocconi and Fondazione Rodolfo Debenedetti.
Bronfenbrenner, K.; Luce, S. 2004. “The changing nature of corporate global restructuring: The impact of production shifts on jobs in the US, China, and around the globe”, submitted to the US–China Economic and Security Review Commission, Washington, DC.
Campa, J.; Goldberg, L. 1997. “The evolving external orientation of manufacturing industries: Evidence from four countries”, NBER Working Paper No. 5919, February (Cambridge, MA, National Bureau of Economic Research).
Choi, M. 2001. “Threat effect of foreign direct investment on labor union wage premium”, PERI Working Paper No. 27 (University of Massachusetts at Amherst).
Clasen, J. 2007. “Flexicurity – A new buzzword in EU labour market policy”, mimeo, University of Edinburgh School of Social and Political Studies, presented at Scottish Policy Innovation Forum, Edinburgh, 1 November.
Crino, R. 2009. “Offshoring, multinationals and labour market: A review of the empirical literature”, in Journal of Economic Surveys, Vol. 23, No. 2, pp. 197–249.
Ellis, L.; Smith, K. 2007. “The global upward trend in the profit share”, BIS Working PaperNo. 231 (Basel, Bank for International Settlements).
Feenstra, R.; Hanson, G. 1996. “Globalization, outsourcing and wage inequality”, in American Economic Review, Vol. 86, No. 2, pp. 240–245.

196 MAKING GLOBALIZATION SOCIALLY SUSTAINABLE
—; —. 1999. “The impact of outsourcing and high-technology capital on wages: Estimatesfor the United States, 1979–1990”, in The Quarterly Journal of Economics, Vol. 114, No. 3,pp. 907–940.
Freeman, R. 1995. “Are your wages set in Beijing?”, in Journal of Economic Perspectives, Vol. 9, No. 3, pp. 15–32.
—. 2007. “The expansion of the global labor supply”, in E. Paus (ed.): Global capitalism unbound: Winners and losers from offshore outsourcing (London, Palgrave Macmillan).
Gazier, B. 2006. “Flexicurity and social dialogue, European ways”, seminar on flexicurity, Brussels, available online from http://www.csmb.unimore.it/on-line/Home/Prova/document o36005289.html
Geishecker, I. 2008. “The impact of international outsourcing on individual employment security: A micro-level analysis”, in Labour Economics, Vol. 15, No. 3, pp. 291–314.
—; Görg, H. 2007. “Winners and losers: A micro-level analysis of international outsourcing and wages”, CEPR Discussion Paper No. 6484 (London, Centre for Economic Policy Research), August.
—; —; Munch, J.R. 2008. “Do labour market institutions matter? Micro-level wage effects of international outsourcing in three European countries”, Kiel Institute for the World Economy, Kiel Working Papers No. 1404.
German Marshall Fund. 2007. “Perspectives on trade and poverty reduction: A survey of public opinion”, Key Findings Report (Washington, DC, GMF).
Glyn, A. 2007. “Explaining labor’s declining share of national income”, G-24 Policy Brief, No. 4 (United Nations Conference on Trade and Development (UNCTAD)) available online from http://www.gei.it/EVENTI/Momigliano/2008/pbno4.pdf.
Gosselin, P. 2008. High wire: The precarious financial lives of American families (New York, Basic Books).
Grossman, G.M.; Rossi-Hansberg, E. 2006. “The rise of offshoring: It’s not wine for cloth anymore”, in The new economic geography: Effects and policy implications (Jackson Hole, Federal Reserve Bank of Kansas City), pp. 5–102.
—; —. 2008. “Trading tasks: A simple theory of offshoring”, in American Economic Review,Vol. 98, No. 5, pp. 1978–1997.
Guscina, A. 2006. “Effects of globalization on labor’s share in national income”, IMF Working Paper 06/294 (Washington, DC).
Hacker, J. 2006. The great risk shift (New York, Oxford University Press).
Hamermesh, D. 1993. Labor demand (Princeton, NJ, Princeton University Press).
Hancke, B.; Rhodes, M.; Thatcher, M. (eds). 2007. Beyond varieties of capitalism: Conflict contradiction and complementarities in the European economy (New York, Oxford University Press).

EFFECTS OF OFFSHORING ON ECONOMIC INSECURITY 197
CH
AP
TE
R 5
Harrison, A. 2002. “Has globalization eroded labor’s share? Some cross-country evidence”, mimeo, Department of Agricultural and Resource Economics, University of California, Berkeley.
Howell, D. 2005. Fighting Unemployment: The limits of free market orthodoxy (Oxford, Oxford University Press).
—; Okatenko, A. 2010. “By what measure: A comparison of French and U.S. labor market Performance with New Indicators of Employment Adequacy”, International Review of Applied Economics, Vol. 24, No. 3, pp. 333-357.
International Monetary Fund (IMF) 2005. World Economic Survey (Washington, DC).
—. 2007. World Economic Survey (Washington, DC).
Kierkegaard, J.F. 2007. “Offshoring, outsourcing, and production relocation – labor-market effects in the OECD countries and developing Asia”, Working Paper Series No. WP 07-2, Institute for International Economics (Washington, DC).
Kletzer, L. 2001. Job loss from imports: Measuring the costs (Washington, DC, Peterson Institute).
Kuttner, R. 2008. “The Copenhagen consensus: Reading Adam Smith in Denmark”, in Foreign Affairs, Vol. 87, No. 2, pp. 78–94.
McCarthy, J. 2002. “3.3m US services jobs to go offshore”, Cambridge, MA, Forrester Consultants, November.
Milberg, W.; Winkler, D. 2009. “Globalization, offshoring, and economic insecurity in industrialized countries”, UN-DESA Working Paper No. 87 (New York, United Nations Department of Economic and Social Affairs), November.
—; —. 2010a. “Financialisation and the dynamics of offshoring in the USA”, in Cambridge Journal of Economics, Vol. 34, No. 2, pp. 275–293.
—; —. 2010b. “Economic insecurity in the new wave of globalization”, in International Review of Applied Economics, Vol. 14, No. 2, pp. 42–61.
—; —. 2010c. Outsourcing economics, mimeo, The New School for Social Research.
Organisation for Economic Co-operation and Development (OECD). 2005. Employment Outlook (Paris).
—. 2007a. Economic Outlook (Paris).
—. 2007b. Offshoring and Employment: Trends and Impact, July (Paris).
Prahalad, C.; Hamel, G. 1990. “The core competence of the corporation”, in Harvard Business Review, Vol. 68, No. 3, pp. 79–91.
Reich, R. 1991. The work of nations: Preparing ourselves for 21st century capitalism (New York, Alfred Knopf).

198 MAKING GLOBALIZATION SOCIALLY SUSTAINABLE
Sapir, A. 2006., “Globalization and the reform of European social models”, in Journal of Common Market Studies, Vol. 44, No. 2, pp. 369–390.
Scheve, K.; Slaughter, M. 2003. “Economic insecurity and the globalization of production”, mimeo, Yale University.
Scott, R. 2007. “The Wal-Mart effect: Its Chinese imports have displaced nearly 200,000 U.S. jobs”, Issue Brief No. 235, Economic Policy Institute, Washington, DC.
Slaughter, M. 2001. “International trade and labour-demand elasticities”, in Journal of International Economics, Vol. 54, No. 1, pp. 27–56.
Spence, M.; Hlatshwayo, S. 2011. “The evolving structure of the American economy and the employment challenge”, Council on Foreign Relations, Maurice R. Greenberg Center for Geoeconomic Studies (Washington, DC), March.
Temin, P.; Levy, F. 2006. “Inequality and institutions in 20th century America”, Industrial Performance Center, Massachusetts Institute of Technology Working Paper Series,No. 07-002.
Winkler, D. 2009. Services offshoring and its impact on the labour market – Theoretical insights, empirical evidence and economic policy recommendations for Germany (Heidelberg, Springer).
—. 2010. “Services offshoring and its impact on productivity and employment: Evidence from Germany, 1995–2006”, in The World Economy, Vol. 33, No. 12, pp. 1672–1701.
Wood, A. 1994. North–south trade, employment and inequality: Changing fortunes in a skill-driven world (Oxford, Clarendon Press).
—. 1995. “How trade hurt unskilled workers”, in Journal of Economic Perspectives, Vol. 9, No. 3, pp. 57–80.

Disclaimer
The designations employed in ILO and WTO publications, which are in conformity with United Nations practice, and the presentation of material therein do not imply the expression of any opinion whatsoever on the part of the International Labour Officeor the World Trade Organization concerning the legal status of any country, areaor territory or of its authorities, or concerning the delimitation of its frontiers. WTO state and territory denominations have been utilized in this publication, as its membership basis (states, as well as separate customs territories) is broader than that of the ILO. The responsibility for opinions expressed in studies and other contributions rests solely with their authors, and publication does not constitute an endorsement by the International Labour Office or the World Trade Organization of the opinions expressed in them. Reference to names of firms and commercial products and processes does not imply their endorsement by the International Labour Office or the World Trade Organization, and any failure to mention a particular firm, commercial product or process is not a sign of disapproval.
Copyright © 2011 International Labour Organization and World Trade Organization.
Reproduction of material contained in this document may be made only with the written permission of the WTO Publications Manager.
WTO ISBN 978-92-870-3783-1
ILO ISBN 978-92-2-124583-4
Also available in French and Spanish:French title ILO ISBN 978-92-2-224583-3 / WTO ISBN 978-92-870-3784-8 Spanish title ILO ISBN 978-92-2-324583-2 / WTO ISBN 978-92-870-3785-5
ILO and WTO publications can be obtained through major booksellers or:
ILO PublicationsInternational Labour OfficeCH-1211 Geneva 22SwitzerlandEmail: [email protected] site: www.ilo.org/publns
WTO PublicationsWorld Trade Organization154 rue de LausanneCH-1211 Geneva 21SwitzerlandTel: + 41 22 739 52 08Fax: + 41 22 739 54 58Email: [email protected] site: www.wto.orgOnline WTO bookshop: http://onlinebookshop.wto.org
Printed by WTO Secretariat, Switzerland, 2011.