Activity of the Seyfert galaxy neighbours⋆⋆⋆ · · 2016-07-27A&A 552, A135 (2013) DOI:...
17
This is an electronic reprint of the original article. This reprint may differ from the original in pagination and typographic detail. Powered by TCPDF (www.tcpdf.org) This material is protected by copyright and other intellectual property rights, and duplication or sale of all or part of any of the repository collections is not permitted, except that material may be duplicated by you for your research use or educational purposes in electronic or print form. You must obtain permission for any other use. Electronic or print copies may not be offered, whether for sale or otherwise to anyone who is not an authorised user. Koulouridis, E.; Plionis, M.; Chavushyan, V.; Dultzin, D.; Krongold, Y.; Georgantopoulos, I.; León-Tavares, Jonathan Activity of the Seyfert galaxy neighbours Published in: ASTRONOMY AND ASTROPHYSICS DOI: 10.1051/0004-6361/201219606 Published: 01/01/2013 Document Version Publisher's PDF, also known as Version of record Please cite the original version: Koulouridis, E., Plionis, M., Chavushyan, V., Dultzin, D., Krongold, Y., Georgantopoulos, I., & León-Tavares, J. (2013). Activity of the Seyfert galaxy neighbours. ASTRONOMY AND ASTROPHYSICS, 552(id. A135), 16. DOI: 10.1051/0004-6361/201219606
Transcript of Activity of the Seyfert galaxy neighbours⋆⋆⋆ · · 2016-07-27A&A 552, A135 (2013) DOI:...
This is an electronic reprint of the original article.This reprint may differ from the original in pagination and typographic detail.
Powered by TCPDF (www.tcpdf.org)
This material is protected by copyright and other intellectual property rights, and duplication or sale of all or part of any of the repository collections is not permitted, except that material may be duplicated by you for your research use or educational purposes in electronic or print form. You must obtain permission for any other use. Electronic or print copies may not be offered, whether for sale or otherwise to anyone who is not an authorised user.
Koulouridis, E.; Plionis, M.; Chavushyan, V.; Dultzin, D.; Krongold, Y.; Georgantopoulos, I.;León-Tavares, JonathanActivity of the Seyfert galaxy neighbours
Published in:ASTRONOMY AND ASTROPHYSICS
DOI:10.1051/0004-6361/201219606
Published: 01/01/2013
Document VersionPublisher's PDF, also known as Version of record
Please cite the original version:Koulouridis, E., Plionis, M., Chavushyan, V., Dultzin, D., Krongold, Y., Georgantopoulos, I., & León-Tavares, J.(2013). Activity of the Seyfert galaxy neighbours. ASTRONOMY AND ASTROPHYSICS, 552(id. A135), 16. DOI:10.1051/0004-6361/201219606

A&A 552, A135 (2013)DOI: 10.1051/0004-6361/201219606c© ESO 2013
Astronomy&
Astrophysics
Activity of the Seyfert galaxy neighbours�,��
E. Koulouridis1, M. Plionis2,3, V. Chavushyan3, D. Dultzin4, Y. Krongold4, I. Georgantopoulos1 , and J. León-Tavares5,6
1 Institute of Astronomy & Astrophysics, National Observatory of Athens, Palaia Penteli 152 36, Athens, Greecee-mail: [email protected]
2 Physics Department of Aristotle, University of Thessaloniki, University Campus, 54124 Thessaloniki, Greece3 Instituto Nacional de Astrofísica Optica y Electrónica, Puebla, C.P. 72840 México, Mexico4 Instituto de Astronomía, Universidad Nacional Autónoma de México, Apartado Postal 70-264, D. F. 04510 México, Mexico5 Finnish Centre for Astronomy with ESO (FINCA), University of Turku, Väisäläntie 20, 21500 Piikkiö, Finland6 Aalto University, Metsähovi Radio Observatory, Metsähovintie 114, 02540 Kylmälä, Finland
Received 15 May 2012 / Accepted 23 January 2013
ABSTRACT
We present a follow-up study of a series of papers concerning the role of close interactions as a possible triggering mechanism ofAGN activity. We have already studied the close (≤100 h−1 kpc) and the large-scale (≤1 h−1 Mpc) environment of a local sampleof Sy1, Sy2, and bright IRAS galaxies (BIRG) and of their respective control samples. The results led us to the conclusion that aclose encounter appears capable of activating a sequence where an absorption line galaxy (ALG) galaxy first becomes a starburst,then a Sy2, and finally a Sy1. Here we investigate the activity of neighbouring galaxies of different types of AGN, since both galaxiesof an interacting pair should be affected. To this end we present the optical spectroscopy and X-ray imaging of 30 neighbouringgalaxies around two local (z � 0.034) samples of 10 Sy1 and 13 Sy2 galaxies. Although this is a pilot study of a small sample, variousinteresting trends have been discovered that imply physical mechanisms that may lead to different Seyfert types. Based on the opticalspectroscopy, we find that more than 70% of all neighbouring galaxies exhibit star forming and/or nuclear activity (namely recent starformation and/or AGN), while an additional X-ray analysis showed that this percentage might be significantly higher. Furthermore,we find a statistically significant correlation, at a 99.9% level, between the value of the neighbour’s [OIII]/Hβ ratio and the activitytype of the central active galaxy, i.e. the neighbours of Sy2 galaxies are systematically more ionized than the neighbours of Sy1s.This result, in combination with trends found using the Equivalent Width of the Hα emission line and the stellar population synthesiscode STARLIGHT, indicate differences in the stellar mass, metallicity, and star formation history between the samples. Our resultspoint towards a link between close galaxy interactions and activity and also provide more clues regarding the possible evolutionarysequence inferred by our previous studies.
Key words. galaxies: active – galaxies: Seyfert – galaxies: interactions – galaxies: nuclei – large-scale structure of Universe –X-rays: galaxies
1. Introduction
The properties of the host galaxies of the different types of ac-tive galactic nuclei (AGN) and their environments, up to sev-eral hundred kpc, can give us valuable information on the na-ture of the general AGN population, as well as on differentproperties of each AGN subtype. In addition, the availabilitynowadays of large automatically constructed galaxy catalogues,like the SDSS, can provide the necessary statistical significancefor these types of analyses. However, great caution should beused when interpreting results based on large databases, sincethe larger the sample size, the less control one usually has onthe spectral and other details of the individual galaxy entries. Itcould then be difficult to address important questions, such as:Do the Unification paradigm explains all cases of Type 1 andType 2 AGN? What is the true connection between galaxy inter-actions, star formation, and nuclear activity? What is the lifetimeof these phenomena? How do LINERs fit in the general picture,
� Appendix A is available in electronic form athttp://www.aanda.org�� FITS files are only available at the CDS via anonymous ftp tocdsarc.u-strasbg.fr (130.79.128.5) or viahttp://cdsarc.u-strasbg.fr/viz-bin/qcat?J/A+A/552/A135
and can all be considered AGN? Do evolutionary trends affectthe AGN phenomenology?
Nowadays, it is widely accepted that the accretion of ma-terial into a massive black hole (MBH), located at the galacticcentre, is responsible for the detected excess emission (radia-tion not emitted by stellar photospheres) in the AGN’s spectra,and these black holes do exist in all elliptical galaxies and spiralgalaxy bulges (Kormendy & Richstone 1995; Magorrian et al.1998), including our own (e.g. Melia & Falcke 2001). However,we still lack complete understanding of the various aspects ofthe nuclear activity, for example, the triggering mechanism andthe feeding of the black hole, the physical properties of the accre-tion disk and the obscuring torus predicted by the unified scheme(Antonucci et al. 1993), the origin of jets in radio loud objects,the connection with star formation and the role of the AGN feed-back. Even the exact mechanism that produces the observed in-frared, X-ray, and gamma-ray emission is still only partially un-derstood (e.g. León-Tavares et al. 2011). Although successful inmany cases, the unification model has not been able to fully ex-plain all the AGN phenomenology (among others, the role ofinteractions on induced activity; Koulouridis et al. 2006a,b, andreferences therein).
Despite observational difficulties and limitations, therehave been many attempts, based on different diagnostics, to
Article published by EDP Sciences A135, page 1 of 16

A&A 552, A135 (2013)
investigate the possible triggering mechanisms of nuclear ac-tivity. Most agree that the accretion of material into a MBH(Lynden-Bell 1969) is the mechanism responsible for the emis-sion, but it is still necessary to understand the feeding mecha-nism of the black hole. It is known and widely accepted that in-teractions between galaxies can force gas and molecular cloudstowards the galactic centre, where they become compressed andproduce starburst events. (e.g., Li et al. 2008; Ellison et al. 2008;Ideue et al. 2012). Many also believe that the same mecha-nism could give birth to an active nucleus (e.g. Umemura 1998;Kawakatu et al. 2006; Ellison et al. 2011; Silverman et al.2011; Villforth et al. 2012). Even though the exact mechanismis still unknown, in the local Universe a minimum accretion rateof ∼10−6±1M�/yr is needed to fuel the black hole (Ho 2008). Atsuch low accretion rates, nuclear activity is probably relativelyweak compared to the host galaxy, and most of the spectral sig-natures of the AGN are “buried”. Theoretically the feeding of theblack hole can only be achieved by means of a non-axisymmetricperturbation that induces mass inflow. This kind of perturbationscan be provided by interactions, and the result of the inflowis feeding of the black hole and activation of the AGN phase,maybe ∼50−250 Myr after the initial interaction took place (seebelow). An interaction certainly predicts such a time delay, sinceafter the material has piled up around the inner Linblad reso-nance, enhancing star formation, it can be channelled towardsthe nucleus by loosing significant amounts of angular momen-tum, a process that is not instantaneous.
Indeed, post starburst stellar populations have been observedaround AGN (Dultzin-Hacyan & Benitez 1994; Maiolino &Rieke 1995; Nelson & Whittle 1996; Hunt et al. 1997; Maiolinoet al. 1997; Boisson et al. 2000, 2004; Cid Fernandes et al. 1998,2001, 2004, 2005) and in close proximity to the core (∼50 pc).This fact implies the continuity of these two states and a delayof 50–250 Myr between the onset of the starburst and the feed-ing of the AGN (e.g., Müller Sánchez et al. 2008; Wild et al.2010; Davies et al. 2012), which may reach the peak of its ac-tivity after ∼500 Myr (Kaviraj et al. 2011). When studying thecosmic X-ray background (CXRB), Ballantyne et al. (2006) con-clude that Seyfert galaxies (dominating in the production of theCXRB) are likely fueled by minor mergers or interactions thatcan trigger a circumnuclear star formation event, but that theremay be a significant delay between the interaction and the ig-nition of the nucleus. After analyzing star formation in the nu-clei of nine Seyfert galaxies, Davies et al. (2007) found recent,but no longer active, starbursts that occurred 10–300 Myr ago.Further support for an interaction-activity relation has recentlybeen provided by HI observations of Tang et al. (2008), whofound that 94% of the Seyfert galaxies in their sample were dis-turbed in contrast to their control sample (where only 19% weredisturbed), but see also Georgakakis et al. (2009) and Cisternaset al. (2011) in the AEGIS and cosmos surveys, respectively.
This paper is the third in a series of three-dimensional stud-ies of the environment of active galaxies (Koulouridis et al.2006a,b), extending previous 2D analyses (Dultzin et al. 1999;Krongold et al. 2002) in an effort to shed more light on the star-burst/AGN connection and on the evolutionary scenario, trig-gered by interactions, proposed in our previous papers. It is afollow-up spectroscopic pilot study aiming at investigating thepossible effects of interactions on the neighbours of our Seyfertgalaxies and understanding the conditions necessary for the dif-ferent types of activity.
In Sect. 2 we discuss our galaxy samples and present ourobservations and data reduction. The spectroscopic analysis andclassification of the galaxies, basic host galaxy properties, results
from STARLIGHT stellar population synthesis code, and theanalysis of the available X-ray observations are presented inSect. 3. Finally, in Sect. 4 we will interpret our results and drawour conclusions. All distances are calculated taking the local ve-locity field into account (which includes the effects of the follow-ing structures: Virgo, Great Attractor and Shapley) for the stan-dard ΛCDM cosmology (Ωm = 0.27, ΩΛ = 0.73). Throughoutour paper we use H◦ = 100 h km s−1 Mpc−1, following our pre-vious study of the same samples.
2. Data
2.1. Sample definition and previous results
The samples of active galaxies were initially compiled from thecatalogue of Lipovetskij et al. (1987), which itself is a compila-tion of all Seyfert galaxies known at the time from various sur-veys and in various frequencies (optical, X-ray, radio, infrared).It includes all extended objects and several starlike objects withabsolute magnitudes lower than −24. Available multi-frequencydata are listed, including: coordinates, redshifts, Seyfert type(and sub-type), UBVR-photoelectric magnitudes, morphologicaltypes, fluxes in Hβ and [OIII]5007, JHKLN fluxes, far-infrared(IRAS) fluxes, radio fluxes at 6 and 11 cm, monochromaticX-Ray fluxes in 0.3–3.5 and 2–10 keV1. About half of the listedSeyfert galaxies can also be found in the IRAS catalogue.
Dultzin-Hacyan et al. (1999) selected from the cataloguetwo volume-limited and complete samples, consisting of 72 Sy1and 60 Sy2, to study their projected circumgalactic environment.In Koulouridis et al. (2006a) we used practically the same sam-ples to verify their results, using in addition redshift data fromthe CFA2 and SSRS surveys and our own deeper spectroscopicobservations. Well-selected control samples (same redshift, di-ameter, and morphology distributions) were used for the com-parison in both studies.
Using the CfA2 and SSRS redshift catalogues, and ourown deeper low-resolution spectroscopic observations (reachingto mB ∼ 18.5), we searched for neighbours within a projecteddistance R ≤ 100 h−1 kpc and a radial velocity separation δu ≤600 km s−1 and we found that:
– The Sy1 galaxies and their control sample show a similar(consistent within 1σ Poisson uncertainty) fraction of ob-jects having at least one close neighbour.
– There is a significantly higher fraction of Sy2 galaxies hav-ing a near neighbour, especially within D ≤ 75 h−1 kpc, com-pared to both their control sample and the Sy1 galaxies.
– The large-scale environment of Sy1 galaxies (D = 1 h−1 Mpcand δu ≤ 1000 km s−1) is denser than that of Sy2 galaxies, al-though it is consistent with their respective control samples.
– Using deeper spectroscopic observations of the neighboursfor a random subsample of 22 Sy1 and 22 Sy2 galaxies wefound that the differences between the close environmentof Sy1 and Sy2’s persists even when going to fainter neigh-bours, correspond to a magnitude similar to the one of theLarge Magellanic Cloud.
For the purposes of the present study, we obtained new medium-resolution spectroscopy to resolve the Hα and [NII] lines – un-resolved in our original low-resolution spectra, of all the neigh-bours around the aforementioned subsamples of the 22 Sy1
1 All data can be found online at the vizier database (http://vizier.cfa.harvard.edu/viz-bin/VizieR?-source=VII/173).
A135, page 2 of 16

E. Koulouridis et al.: Neighbours of Seyfert galaxies
and 22 Sy2, respectively. In Tables 1 and 2 we present thenames, celestial coordinates, OMAPS magnitudes2, and redshiftsof the Sy1 and Sy2 galaxies that have at least one close neigh-bour (within δu < 600 km s−1). The full samples are presentedin detail in Koulouridis et al. (2006a,b). We have kept the origi-nal neighbours enumeration of the previous papers (for example,in Table 2, NGC 1358 has only neighbour 2, since neighbour 1had δu > 600 km s−1).
2.2. Spectroscopic observations
We have obtained medium-resolution spectroscopic data of allthe neighbouring galaxies in our samples in order to clas-sify them according to their optical emission lines (Sect. 2.3).Optical spectra were taken with the Boller & Chivens spec-trograph mounted on the 2.1 m telescope at the ObservatorioAstronómico Nacional in San Pedro Mártir (OAN-SPM).Observations were carried out during photometric conditions.All spectra were obtained with a 2.′′5 slit. The typical wavelengthrange was 4000–8000 Å and the spectral resolution R = 8 Å.Spectrophotometric standard stars were observed every night.
The data reduction was carried out with the IRAF3
package following a standard procedure. Spectra were bias-subtracted and corrected with dome flat-field frames. Arc-lamp(CuHeNeAr) exposures were used for wavelength calibration.All emission line galaxy spectra can be found in Appendix A.
2.3. Analysis and classification method
In this section we present the results of our spectroscopicobservations of all the neighbours with D ≤ 100 h−1 kpcand mOMAPS � 18.5 for the samples of Sy1 and Sy2 galaxies. Wealso used SDSS spectra when available.
Our aim was to measure six emission lines: Hβ λ4861,Hα λ6563, [NII] λ6583, [OIII] λ5007, [SII] λ6716, and[SII] λ6731, in order to classify our galaxies, using the Baldwinet al. (1981, hereafter BPT), and Veilleux & Osterbrock (1987)diagrams. For the cases where it was not possible to measurethe Hβ and [OIII] emission lines, we use the more approximateclassification by Stasinska et al. (2006).
Based on the above, we adopted the following classificationscheme:
– absorption line galaxies (ALG), i.e. galaxies with no emis-sion lines;
– galaxies with emission lines (ELG), meaning that they ex-hibit nuclear or/and recent star forming activity.
Flux ratios for the emission lines mentioned above have beenmeasured after subtracting the host galaxy contamination fromeach spectrum. We disentangled the spectral contribution of thehost galaxy from the observed spectra by using the stellar pop-ulation synthesis code STARLIGHT4. Spectra processing andfits were carried in the same fashion as described in Sect. 3.1of León-Tavares et al. (2011). For a detailed description of
2 O (blue) POSS I plate magnitudes of the Minnesota AutomatedPlate Scanner (MAPS) system. We used OMAPS magnitudes becauseZwicky magnitudes were not available for the fainter neighbours, andwe needed a homogeneous magnitude system for all our objects.3 IRAF is distributed by National Optical Astronomy Observatoriesoperated by the Association of Universities for Research inAstronomy, Inc. under cooperative agreement with the National ScienceFoundation.4 http://starlight.ufsc.br/
the STARLIGHT code and its scientific results, we refer to thepapers of the SEAGal collaboration (Mateus et al. 2006; Asariet al. 2007; Cid-Fernandes et al. 2005, 2007). We only note thatwe have calculated the 1σ standard deviation of the flux as fol-lows (Tresse et al. 1999):
σ = σcd√
2Npix + EW/d (1)
where σc is the standard deviation of the continuum about theemission line, d is the spectral dispersion in Å per pixel and Npixis the base-width of the emission line in pixels. In our case theparameter d ∼ 4 Å/pix, while for the SDSS spectra is ∼1.1 Å/pixfor the Hβ area and ∼1.5 Å/pix for the Hα area. To the above wehave added in quadrature the errors of the Gaussian fitting ofthe emission lines. We should note here that in some cases theB telluric band is very close to the [SII] doublet (see for exam-ple NGC 1019-N2 on the left of the doublet or UGC 7064-N1Bon the right of the doublet) introducing a further uncertainty onthe calculation of the flux. In all these cases, we have simulta-neously fitted the telluric absorption and the emission lines tobetter measure the [SII] doublet’s flux. Although we do not haveany exact evaluation of the uncertainty due to the above spectralfeature, we presume (at least for the cases that the B telluric bandis close to the doublet) that the reported error is underestimated5.
Although it is possible to distinguish between a star formingnucleus (SFN) galaxy6 and an AGN using only the [NII]/Hα ra-tio, we cannot distinguish between a low-ionization (LINER)and a high ionization (Seyfert) AGN galaxy. We have also mea-sured [OI] (λ = 6300) when possible, as an extra indicator ofAGN activity. However, the weakness of the line in most casesdid not allow further use of it in a separate BPT diagram.
In Fig. 1a we plot the line ratios log ([OIII]/Hβ) versuslog ([NII]/Hα) (BPT diagram) for those neighbours of Seyfertgalaxies for which we have the four necessary emission linesavailable7. We also plot the Kauffmann et al. (2003a) separationline between SFN and AGN galaxies, given by
log ([OIII]/Hβ) =0.61
(log ([NII]/Hα) − 0.05+ 1.3,
and the corresponding one of Kewley et al. (2001):
log ([OIII]/Hβ) =0.61
(log ([NII]/Hα) − 0.47+ 1.19.
We also plot in Fig. 1b the line ratios log ([OIII]/Hβ) vs.log ([SII]/Hα). Qualitatively, the same results as those presentedin Fig. 1a are repeated here as well. The dividing line is given byKewley et al. (2006a,b). However, we do not have the respectiveline of Kauffmann et al. (2003a), as it is not available in the lit-erature, and thus we cannot separate pure star forming galaxiesfrom composite objects. Since, as already discussed, the mea-surement of the [SII] doublet is probably contaminated by ab-sorption of the B telluric band, we present only results based onthe [NII] forbidden line.
5 We should also note that the standard deviation of the continuumabout the [SII] doublet was calculated after the subtraction of the B tel-luric band.6 We choose to call SFN all galaxies with prominent emission linesthat do not show AGN activity.7 We have excluded one merger neighbour (UGC 7064-N1) since itstwo nuclei are in an advanced merging state and their properties aremost probably independent of any interaction that may have with thecentral active galaxy.
A135, page 3 of 16

A&A 552, A135 (2013)
Tabl
e1.
Obs
erva
tion
alan
dSS
Pre
sult
s,em
issi
onli
nera
tios
and
clas
sifi
cati
on.
NA
ME
No
RA
Dec
mU
TSt
artU
TE
xp.
[OII
I]/Hβ
[NII
]/Hα
[SII
]/Hα
1E
W(Hα
)χ
2〈Z〉〈lo
gt〉
logt
SB
CS
tC
BP
T
(1)
(2)
(3)
(4)
(5)
(6)
(7)
(8)
(9)
(10)
(11)
(12)
(13)
(14)
(15)
16)
(17)
(18)
NG
C86
302
1433
.5−0
046
0014
.58
N1
0214
29.3−0
046
0518
.25
SD
SS
––
––
––
0.6
0.02
09.
309.
30A
LG
AL
GM
RK
1400
0220
13.7+
0812
2017
.07
N1
0219
59.8+
0810
4517
.25
06/1
0/07
07:3
148
000.
55±0.0
40.
31±0.0
10.
35±0.0
1–3
7.4±0.8
1.3
0.01
29.
076.
70S
FN
SF
NN
GC
1019
0238
27.4+
0154
2815
.02
N2
0238
25.4+
0158
0716
.28
21/1
0/06
08:2
548
000.
54±0.0
90.
46±0.0
10.
32±0.0
1–1
9.6±0.3
1.8
0.00
88.
386.
93T
OT
ON
GC
1194
0303
49.1−0
106
1315
.38
N1
0303
41.2−0
104
2516
.99
SD
SS
––
0.37±0.0
50.
31±0.0
10.
35±0.0
1–2
0.9±0.3
0.8
0.03
98.
166.
30S
FN
SF
NN
403
0412
.5−0
111
3415
.75
25/1
0/06
07:5
654
000.
33±0.0
40.
38±0.0
10.
36±0.0
1–2
0.4±0.4
1.3
0.01
78.
647.
20S
FN
SF
N1H
1142−1
7811
4540
.4−1
827
1616
.82
N1
1145
40.9−1
827
3618
.01
19/0
5/07
04:2
930
00–
––
–1.
40.
014
9.38
8.40
AL
GA
LG
N2
1145
38.8−1
829
1918
.45
21/0
5/07
04:1
660
000.
72±0.3
50.
35±0.0
60.
57±0.0
8–8
.0±0.7
2.4
0.05
09.
119.
10S
FN
SF
NM
RK
699
1623
45.8+
4104
5717
.21
N1
1623
40.4+
4106
1617
.59
18/0
5/07
10:2
721
000.
64±0.2
40.
60±0.0
70.
67±0.0
6–8
.2±0.5
2.3
0.03
09.
319.
11T
OT
ON
GC
7469
2303
15.5+
0852
2614
.48
N1
2303
18.0+
0853
3715
.58
01/1
2/06
03:0
736
000.
30±0.0
90.
37±0.0
10.
29±0.0
1–3
1.7±0.5
1.0
0.01
07.
516.
90S
FN
SF
NN
GC
526A
201
2354
.5−3
503
5615
.693
N1
0123
57.1−3
504
0915
.803
08/1
0/07
06:3
924
003.
60±0.5
01.
37±0.2
01.
32±0.1
9–3
.0±0.7
1.9
0.03
610
.21
10.3
0A
GN
AG
NN
201
2358
.1−3
506
5415
.683
08/1
0/07
08:3
915
00–
––
–1.
40.
030
9.93
8.07
AL
GA
LG
N3
0124
09.5−3
505
4216
.373
08/1
0/07
09:3
436
000.
57±0.1
30.
35±0.0
20.
35±0.0
3–3
1.1±0.6
1.9
0.01
99.
579.
39S
FN
SF
NN
401
2359
.2−3
507
3816
.043
08/1
0/07
07:3
336
000.
34±0.1
00.
34±0.0
10.
38±0.0
1–2
0.4±0.5
1.1
0.02
68.
337.
11S
FN
SF
NN
GC
5548
1417
59.5+
2508
1214
.18
N1
1417
33.9+
2506
5217
.16
SD
SS
––
0.50±0.2
00.
36±0.0
20.
52±0.0
2–9
.4±0.2
0.5
0.02
68.
006.
39S
FN
SF
NN
GC
6104
1616
30.7+
3542
2915
.11
N1
1616
49.9+
3542
0716
.44
18/0
5/07
09:3
718
00–
––
–2.
30.
050
9.11
9.10
AL
GA
LG
Not
es.(
1)N
ame
ofA
GN
,(2)
num
ber
ofne
ighb
our,
(3)–
(4)
righ
tas
cens
ion
and
decl
inat
ion
inth
eeq
uato
rial
coor
dina
tesy
stem
,(5)
OM
AP
Sap
pare
ntm
agni
tude
,(6)
–(8)
date
(dd/
mm/y
y),
tim
ean
dto
tal
expo
sure
tim
e(s
ec)
ofob
serv
atio
n,(9
)–(1
1)em
issi
onli
nera
tios
,(12
)eq
uive
lant
wid
thof
the
Hα
emis
sion
line
inÅ
,(13
)χ
2of
the
STA
RL
IGH
Tfi
t,(1
4)m
etal
lici
ty,(
15)
aver
age
age
ofth
est
ella
rpo
pula
tion
,(1
6)ag
eof
the
mos
tre
cent
star
burs
tev
ent,
(17)
clas
sifi
cati
onba
sed
onS
tasi
nska
etal
.(2
006)
,(1
8)cl
assi
fica
tion
base
don
the
BP
Tdi
agra
ms
(Bal
dwin
etal
.19
81).
(1)
Err
ors
ofth
e[S
II]
doub
let
are
prob
ably
unde
rest
imat
edin
the
case
sth
atth
eB
tell
uric
band
islo
cate
dne
arth
esp
ecifi
cem
issi
onli
nes.
(2)
Reg
ion
not
cove
red
byM
AP
Sca
talo
gue.
(3)
OM
AP
Sca
lcul
ated
from
OU
SN
O,u
sing
the
rela
tion
OM
AP
S=
14.6
1(±1.2
5)+
0.11
(±0.
11)O
US
NO
obta
ined
from
Vér
on-C
etty
etal
.(20
04)
Tabl
e2.
A135, page 4 of 16

E. Koulouridis et al.: Neighbours of Seyfert galaxies
Tabl
e2.
Obs
erva
tion
alan
dSS
Pre
sult
s,em
issi
onli
nera
tios
and
clas
sifi
cati
on.
Nam
eN
oR
AD
ecm
UT
Star
tUT
Exp
.[O
III]/Hβ
[NII
]/Hα
[SII
]/Hα
1E
W(Hα
)χ
2〈Z〉〈lo
gt〉
log
t SB
CS
tC
BP
T
(1)
(2)
(3)
(4)
(5)
(6)
(7)
(8)
(9)
(10)
(11)
(12)
(13)
(14)
(15)
16)
(17)
(18)
ES
O54
5-G
013
0224
40.5−1
908
3114
.41
N1
0224
50.9−1
908
0316
.19
01/1
2/06
05:1
336
00–
0.37±0.0
20.
37±0.0
2–2
6.1±1.2
1.2
0.03
88.
446.
59S
FN
–N
GC
3786
1139
42.5+
3154
3313
.88
N1
1139
44.6+
3155
5213
.53
06/0
3/06
06:3
436
001.
08±0.2
30.
71±0.0
80.
57±0.0
8–1
.5±0.1
1.0
0.03
49.
137.
44A
GN
TO
UG
C12
138
2240
17.0+
0803
1415
.93
N1
2240
11.0+
0759
5918
.77
08/1
0/07
02:4
936
004.
48±0.1
90.
07±0.0
10.
18±0.0
1–4
2.2±1.5
1.3
0.04
17.
546.
79S
FN
SF
NU
GC
7064
1204
43.3+
3110
3815
.11
N1B
212
0445
.6+
3111
2716
.68
18/0
5/07
07:1
142
000.
25±0.0
80.
38±0.0
10.
15±0.0
1–1
6.4±0.3
0.3
0.01
19.
669.
46S
FN
SF
NN
1A12
0445
.2+
3111
3316
.68
SD
SS
––
3.55±0.7
21.
34±0.4
70.
83±0.3
4–1
.2±0.3
0.3
0.02
19.
579.
12A
GN
AG
NN
212
0445
.1+
3109
3416
.33
06/0
3/06
08:4
021
000.
74±0.1
30.
56±0.0
30.
30±0.0
3–1
5.4±0.6
2.2
0.01
29.
346.
74T
OT
OIR
AS
0016
0−07
1900
1835
.9−0
702
5615
.73
N1
0018
33.3−0
658
5417
.80
06/1
0/07
09:2
142
000.
93±0.0
60.
25±0.0
10.
44±0.0
1–3
3.1±0.6
1.3
0.01
59.
579.
35S
FN
SF
NE
SO
417-
G06
0256
21.5−3
211
0815
.54
N1
0256
40.5−3
211
0417
.43
06/1
0 /07
11:0
842
001.
29±0.0
50.
21±0.0
10.
29±0.0
1–7
2.5±1.3
2.0
0.01
19.
196.
62S
FN
SF
NN
GC
1241
0311
14.6−0
855
2013
.56
N1
0311
19.3−0
854
0915
.41
30/1
1/06
08:0
036
001.
02±0.1
00.
34±0.0
10.
35±0.0
1–1
8.2±0.3
0.7
0.00
49.
587.
14S
FN
SF
NN
GC
1320
0324
48.7−0
302
3214
.59
N1
0324
48.6−0
300
5615
.07
25/1
0/06
09:3
836
00–
––
–0.
40.
021
9.64
6.71
AL
GA
LG
MR
K61
203
3040
.9−0
308
1615
.78
N1
0330
42.3−0
309
4916
.13
29/1
1/06
09:4
436
00–
––
–2.
20.
327.
626.
97A
LG
AL
GN
GC
1358
0333
39.7−0
505
2213
.98
N2
0333
23.5−0
459
5514
.95
21/1
0/06
11:0
836
00–
––
–0.
90.
017
9.83
7.26
AL
GA
LG
NG
C76
7223
2731
.4+
1223
0715
.23
N1
2327
19.3+
1228
0314
.67
21/1
0/06
05:5
136
00–
––
-1.
00.
035
9.96
7.00
AL
GA
LG
NG
C76
8223
2903
.9+
0332
0014
.88
N1
2328
46.6+
0330
4114
.64
25/1
0/06
06:4
236
001.
25±0.0
20.
45±0. 0
10.
27±0.0
1–7
0.6±0.8
0.9
0.03
38.
088.
23T
OT
ON
GC
7743
2344
21.1+
0956
0312
.16
N3
2344
05.5+
1003
2616
.95
20/1
0/06
07:0
054
002.
27±0.0
50.
07±0.0
10.
24±0.0
1-5
8.2±1.2
1.0
0.01
37.
947.
29S
FN
SF
N
Not
es.(
1)–(
18)
asin
Tabl
e1.
(1)
As
inTa
ble
1.(2
)N
eigh
bour
ing
gala
xies
notr
esol
ved
inM
AP
Sca
talo
gue.
A135, page 5 of 16

A&A 552, A135 (2013)
-2 -1 0 1
-1
0
1
(a)
Kauffmann et al. (2003a)------ Kewley et al. (2001)
-2 -1 0 1
-1
0
1
(b)
------ Kewley et al. (2006)
Fig. 1. a) BPT diagram, and b) Veilleux & Osterbrock classificationdiagram of the neighbours of Sy1 and Sy2 galaxies. The neighboursof Sy2 and Sy1 galaxies are indicated by black triangles and redsquares, respectively. For clarity, only the errorbars for those galaxieswith the largest uncertainties in the [OIII]/Hβ ratio are presented in thediagrams.
We can now classify our objects in the following categories:
– SFN: all the objects that are found below the line ofKaufmann et al.
– AGN: the objects found above the line of Kewley et al.– TO (transition object): the ones that are found between the
two lines and exhibit characteristics of both nuclear activityand recent star formation.
We do not attempt to divide the star forming galaxies intomore subcategories since such a categorization appears to behighly subjective and depends on the applied methodology (e.g.Knapen & James 2009).
For one of our objects (ESO 545-G013-N1), the Hβ and[OIII] (λ5007) lines were not observed, so we classified it us-ing the more approximate method of Stasinska et al. (2006),
which is based solely on the NII/Hα ratio. in order to evalu-ate this method, we applied it to all our galaxies and found aconsistency with the BPT classification in all cases but one (seeTable 3).
Further classification of the Seyfert galaxies in Types 1 and 2was obtained by direct visual examination of the spectra from thebroadening of the emission lines. No broad lines were discov-ered in the spectrum of the two neighbours classified as AGNand therefore they should be considered as Type 2. In Tables 1and 2 we list, for all neighbours, their line ratios and the twodifferent classifications.
We also measured the equivalent width of the Hα emissionline, in order to use it as an extra indicator of the galaxy’s starforming history, in addition to the STARLIGHT code’s results.The minimum equivalent width, defined as the integrated localcontinuum rms noise normalized to the level of the local con-tinuum, at a 5σ confidence level, is found to be EWmin ∼ 1 Å.We should note here that in a small number of cases the [OIII]and Hβ lines were detected only after the subtraction of the con-tinuum. We calculated the 1σ standard deviation of the EW asfollows (Tresse et al. 1999):
σEW =EWFσcd√
2Npix + EW/d + (EW/d)2/Npix (2)
where σc is the standard deviation of the continuum about theemission line, d is the spectral dispersion in Å per pixel, Npix isthe base width of the emission line in pixels and F the flux of theemission line.
3. Results and analysis
3.1. Activity of the neighbours
In this section we discuss the results of our spectroscopy andclassification in more detail. We have excluded the mergingneighbour of UGC 7064, since the properties of its two nu-clei are more affected by their mutual interaction rather thanby their neighbouring Seyfert. We can draw our first results foreach sample separately inspecting Tables 1 and 2. From theanalysed 15 neighbours of Sy1 only 4 are ALGs, while 8 ofthem are SFNs, 2 are classified as TOs, and one is classifiedas AGN. Similar results hold for the neighbours of Sy2 galax-ies. 4 out of 13 neighbours do not present emission lines, 6 areSFNs, and 3 are TOs. Therefore, at least 70% of the neighbours,within 100 h−1 kpc, of both type of Seyfert galaxies have emis-sion lines. We should note here that Ho et al. (1997), studying amagnitude limited sample of galaxies (BT ≤ 12.5), came up witha similar high percentage of activity (86%). However, the resultsof our sample of faint neighbours cannot be directly comparedwith those of Ho et al. due to the brighter magnitude limit of thelatter.
We can extract one of the most interesting results of our anal-ysis by examining Fig. 1, i.e., that the neighbours of Sy2 galax-ies have systematically higher values of [OIII]/Hβ than theneighbours of Sy1 galaxies. Using a Kolmogorov-Smirnov two-sample test for the [OIII]/Hβ ratio we find that the null hypoth-esis that the samples are drawn from the same parent populationis rejected at a 99.9% level. Especially for those galaxies thatexhibit only star formation, the ratio [OIII]/Hα is mainly relatedto their ionization level. This fact could indicate a more recentstarburst event in the neighbours of Sy2 galaxies than of Sy1’s,caused possibly by the interaction with a neighbouring galaxy,
A135, page 6 of 16

E. Koulouridis et al.: Neighbours of Seyfert galaxies
Tabl
e3.
Bas
icpr
oper
ties.
Seyf
ert
1Se
yfer
t2N
ame
No
TD
D/D
AG
NM
RI R
I MI Δ
MS
umTy
peN
ame
No
TD
D/D
AG
NM
RI R
I MI Δ
MS
umTy
pe(1
)(2
)(3
)(4
)(5
)(6
)(7
)(8
)(9
)(1
0)(1
1)(1
2)(1
)(2
)(3
)(4
)(5
)(6
)(7
)(8
)(9
)(1
0)(1
1)(1
2)
NG
C86
3N
1–
18.5
*0.
27–1
6.11
231
00
1A
LG
ES
O54
5-G
013
N1
S–
––1
8.79
720
10
1S
FN
MR
K14
00N
1–
29.0
0.98
–17.
3494
00
11
SF
NN
GC
3786
N1
SA
Bab
pec
107.
40.
91–1
9.00
131
11
3T
ON
GC
1019
N2
–30
.40.
75–1
7.57
760
11
2T
OU
GC
1213
8N
1–
––
–15.
4878
00
00
SF
NN
GC
1194
N1
–23
.00.
36–1
6.05
311
00
1S
FN
IRA
S00
160-
0719
N1
–11
.20.
41–1
5.74
630
00
0S
FN
NG
C11
94N
4S
B35
.40.
55–1
7.12
910
01
1S
FN
ES
O41
7-G
06N
1–
14.8
0.34
–15.
9656
00
00
SF
N1H
1142
-178
N1
–18
.60.
91–1
7.04
111
01
2A
LG
NG
C12
41N
1S
Bc
320.
28–1
7.54
191
00
1S
FN
1H11
42-1
78N
2–
––
–16.
6663
00
00
SF
NN
GC
1320
N1
E42
.60.
47–1
7.13
121
01
2A
LG
MR
K69
9N
1–
21.8
*1.
58–1
7.49
520
11
2T
OM
RK
612
N1
–45
.21.
04–1
7.85
281
11
3A
LG
NG
C74
69N
1S
Acd
pec
47.7
0.54
–17.
8319
11
13
SF
NN
GC
1358
N2
S0
71.6
0.70
–17.
9577
01
12
AL
GN
GC
526A
N1
E28
.01.
01–1
7.97
101
11
3A
GN
NG
C76
72N
1S
A0
76.6
1.98
–18.
1767
01
12
AL
GN
GC
526A
N2
SB
O/a
87.6
3.15
–18.
1151
01
12
AL
GN
GC
7682
N1
SB
0pe
c39
.60.
61–1
8.96
670
11
2T
ON
GC
526A
N3
–24
.40.
50–1
7.33
590
00
0S
FN
NG
C77
43N
3–
––
–14.
1843
10
01
SF
NN
GC
526A
N4
S13
.80.
88–1
7.88
630
11
2S
FN
UG
C70
64N
2S
30.2
0.69
–18.
3026
11
13
TO
NG
C55
48N
1–
18.4
0.35
–16.
6610
00
00
0S
FN
NG
C61
04N
1E
27.2
0.69
–18.
2410
00
11
2A
LG
Not
es.(
1)N
ame
ofA
GN
,(2)
num
ber
ofne
ighb
our,
(3)
mor
phol
ogic
alty
pe,(
4)is
opho
tald
iam
eter
sat
25.0
B-m
agar
csec−2
from
the
RC
3in
arcs
ec(*
near
-inf
rare
dis
opho
tald
iam
eter
sat
20.0
K-m
agar
csec−2
from
the
2MA
SS
cata
logu
e),(
5)ra
tio
ofne
ighb
ours
toS
eyfe
rtdi
amet
er,(
6)ab
solu
teO
map
sm
agni
tude
,(7)
proj
ecte
dra
dial
sepa
rati
onin
h−1
kpc,
(8)
Inde
x:0
ifR>
50h−
1kp
cor
1el
sew
ise,
(9)
Inde
x:0
ifM>−1
7.5
or1
else
wis
e,(1
0)In
dex:
0ifΔ
M>
1.5
or1
else
wis
e,(1
1)su
mof
indi
ces
5to
7,(1
2)cl
assi
fica
tion
asin
Tabl
e1
and
Tabl
e2.
A135, page 7 of 16

A&A 552, A135 (2013)
or an effect of the galaxy downsizing; i.e., more massive galax-ies have formed their stellar populations earlier than less mas-sive ones. Asari et al. (2007) argue that the location of galaxieson the BPT diagram is considered to be a result of downsizing.Should the downsizing explanation be true, the ionization levelcan be considered as an indicator of metallicity, which is closelyrelated to the stellar mass. Thus, galaxies having lower values of[OIII]/Hβwould be more massive and would have higher metal-licities, indicative of an older average age of the stellar popula-tion. In Tables 1 and 2 we can see a weak trend of the mean stel-lar metallicity (〈Z〉) values (extracted from STARLIGHT) for theSy2 SFN neighbours being lower compared to that of the Sy1’sand although stellar masses cannot be directly derived from ourdata, most low metallicity SFNs are also faint and small in size(Table 3). However, no trend can be found by comparing the av-erage age of the stellar populations, and given the small numberof galaxies these results remain rather inconclusive.
The equivalent width of the Hα emission line is also a goodindicator of the star formation history, since it represents the ra-tio of present to past star formation; i.e., during a starburst eventyoung massive stars strengthen the emission lines and enhancetheir EW, but as time passes the strength of the emission linefades, the continuum rises again and the value of the EW de-clines. The highest values of the EW(Hα) can be found in thespectra of the star forming neighbours of our Sy2 sample, whileon the other hand some of the lowest values can be found in therespective Sy1’s neighbours spectra.
A more direct way to explore the possibility that the differ-ences of the ionization level is due to the age of the interactionof the central active galaxies with its neighbour, is by determin-ing the age of the most recent peak of star formation with theSTARLIGHT code. As it was expected, however, most of the starforming galaxies present a recent event within the last 20 Myr,a necessary fact in order to detect strong emission lines, and wecan not detect any significant differences between Sy1 and Sy2SFN neighbours. On the other hand, an interesting result is thefact that six out of seven Sy2’s non-SFN (ALG, AGN, or TO)companions present a recent star formation peak <30 Myr, whilesix out seven Sy1’s corresponding neighbours are “quiet” formore than 100 Myr. The above fact may indicate that indeed theSy1 galaxies have interacted with their neighbour earlier thanthe Sy2s.
Summarizing our main results of this section:
– More than 70% of the neighbours of the two AGN samplesexhibit optical emission lines, indicating recent star forma-tion and/or nuclear activity.
– Around 30% of the neighbours of Sy1 and Sy2 galaxies showthe presence of AGN activity, mainly in the form of TOs.
– The neighbours of Sy2s are systematically more ionized thanthe neighbours of Sy1s and their EW(Hα) values tend also tobe higher.
– Most of the non-SFN neighbours of Sy2 galaxies show a re-cent starburst event (<30 Myr), while the corresponding agefor most of the Sy1’s neighbours is >100 Myr.
– The previous two results indicate differences in the star for-mation history of the neighbours of different types of AGNas well as in the age of the most recent interaction.
Finally we should note how close to a composite state are theneighbours of active galaxies, in agreement with Kewley et al.(2006a) who showed that the star forming members of closepairs, lie closer to the classification line than the star formingfield galaxies. We suggest that galaxies between the curves of
Kauffmann et al. (2003) and Kewley et al. (2001) possibly mi-grate from a pure star forming phase to a pure AGN phase. Thissuggestion is very important to the formulation of a possible evo-lutionary scenario and is also discussed further in Sect. 4.
3.2. Magnitude and distance analysis
Since we have already applied a homogeneous magnitude sys-tem to our samples, we can now study whether there is a cor-relation between the activity of an interacting pair of galax-ies and their magnitudes. The activity–magnitude comparison isperformed by examining the absolute magnitude difference be-tween the neighbour and the central active galaxy (ΔM), withlow values (ΔM < 1.5) indicating a stronger pair interactions.We tag these pairs as equally bright. Another parameter that canbe used is the absolute magnitude of the neighbour, indicatingits size. On average, absolute magnitude and size are correlatedin small redshift intervals (as it is in our case), and therefore wecan safely presume that a faint galaxy is also small in size and abright one is large. The latter has been also optically inspectedfor our galaxies to further confirm the correlation (see also mapsof Fig. 3), while the median absolute magnitude M = −17.49is considered to be the separating limit between bright and faintcompanions. In addition we also examine the isophotal diame-ters at 25.0 B-mag arcsec−2) from the Third Reference Catalogueof bright galaxies (RC3) to compare with the absolute magni-tudes, by considering any neighbour with D/DAGN < 1/2 asbeing small. In two cases, because of lack of RC3 data, theirnear-infrared isophotal diameters (at 20.0 K-mag arcsec−2) fromthe Two Micron All Sky Survey (2MASS) extended object cat-alogue were used for the comparison. We should note that onlyin the case of NGC 1241 the diameter criterion does not agreewith the absolute magnitude criterion (marginally) and by alsoinspecting the SDSS image we concluded that the neighbour isindeed small. Finally, radial separation can also be considered asa crucial factor of the strength of the interaction. In Table 3 welist all the above-mentioned values plus three respective indicesthan take values between 0 and 1. With 1 we denote a value thatis in favour of the interaction, with 0 the opposite. In more detail,if the radial separation R is less than 50 h−1kpc the respective in-dex ID is 1 and the same is true for bright neighbours and equallybright pairs, since all these factors may affect positively the in-teractions between two galaxies. The sum of the three indices isalso listed in Table 3. Obviously the strength of the interactionof a neighbour with the sum of the three indices equal to 0 (i.e.small and faraway neighbour of a large AGN) would be signif-icantly different from one with a sum equal to 3 (i.e. large andclose galaxy of a comparable sized AGN). It therefore becomesevident that
– All faint neighbours and all neighbours of a non-equallybright pair of galaxies are primarily absorption line orpurely SFN.
– All neighbours that host an AGN or are transition objects(TO), fall in the bright category, and are neighbours of anequally bright pair.
– All neighbours with interaction indices sim ≤1 are purelystar forming galaxies.
– All ALGs, AGN, and TO galaxies have interaction indicessum ≥2 (except NGC 863-N1).
From our results we can infer that when a faint/small galaxycomes in interaction with another galaxy, the encounter inducesat most a starburst but no AGN activity in the small galaxy;
A135, page 8 of 16

E. Koulouridis et al.: Neighbours of Seyfert galaxies
Table 4. XMM-Newton observations.
Name Neigh. No 2XMM ID Opt. Class log LX (0.2–12 keV) Flux (0.2–12 keV) X/O offset HR(erg s−1) (erg cm−2 s−1) (arcmin)
NGC 1194 N1 – SFN <39.59 <7.3 × 10⁻¹⁵ – –NGC 1194 N4 – SFN <39.72 <1.1 × 10⁻¹⁴ – –NGC 526A N1 J012357.0-350410 AGN 40.46 3.3 × 10⁻¹⁴ 0.023 −0.28 ± 0.09NGC 526A N2 J012358.1-350653 ALG 40.75 5.9 × 10⁻¹⁴ 0.008 0.05 ± 0.1NGC 526A N3 – SFN <39.65 <4.7 × 10⁻¹⁵ – –NGC 526A N4 J012359.0-350741 SFN 39.95 9.4 × 10⁻¹⁵ 0.035 −0.61 ± 0.29UGC 12138 N1 – SFN <40.63 <2.8 × 10⁻¹⁴ – –NGC 1320 N1 J032448.6-030057 ALG 39.46 1.2 × 10⁻¹⁴ 0.020 −0.38 ± 0.17MRK 612 N1 J033042.5-030949 ALG 39.59 3.4 × 10⁻¹⁵ 0.060 −0.67 ± 0.24NGC 1358 N2 J033323.3-045953 ALG 40.19 3.8 × 10⁻¹⁴ 0.044 0.05 ± 0.3NGC 7682 N1 J232846.7+033041 TO 42.04 1.30 × 10⁻¹² 0.026 −0.32 ± 0.02NGC 7743 N3 – SFN <39.44 3.4 × 10⁻¹⁴ – –NGC 3786 N1 J113944.3+315547 TO 39.73 2.7 × 10⁻¹⁴ 0.08 −0.46 ± 0.30
however it can trigger a bright AGN in the larger one. This couldbe due to the absence in small galaxies of a massive black hole(Wang & Kauffmann 2007; Volonteri et al. 2008). If this asser-tion is correct, only galaxies that experience a major close in-teraction or merger can exhibit AGN activity, and this could bewhy AGN hosts are more frequently found in early type galaxies(e.g., Marquez & Moles 1994; Moles et al. 1995; Ho et al. 1997;Knapen et al. 2000; Wake et al. 2004). This can also account forthe large fraction of star forming galaxies among our samples ofneighbours.
To cover all aspects of this issue, we should mention herethat Galaz et al. (2011) show that the fraction of low surfacebrightness galaxies hosting an AGN is significantly lower thanthe corresponding fraction of high surface brightness galaxies,independently of the mass. So the deficiency of AGN in faintgalaxies seems to be due to an intrinsic inability of these galaxiesto host or to feed a massive black hole.
Our results indicate that the interaction of a bright galaxy es-pecially in an equally bright pair results in an AGN or an ALG.Finding some massive galaxies, members of an equally bright in-teracting pair, without emission lines implies either a nonevent-ful interaction or a delay of the outcome of the interaction. Onthe other hand, weak star formation or low luminosity nuclearactivity may not be detectable by optical spectroscopy, althoughit could possibly be detected in X-rays. Such an analysis is pre-sented below.
3.3. The XMM-Newton observations
We explore here, using the XMM-Newton public archive,whether the neighbours show X-ray activity. We find that 13 tar-get fields have been observed by XMM-Newton. However, someof them are very bright and have been observed in partial win-dow mode, rendering the observations in centre of the field-of-view unusable (NGC 5548, NGC 863, 1H1142-178, NGC 7469).The list of the remaining observations (13 neighbours and 9 cen-tral Seyfert galaxies) is shown in Table 4, in which we presentX-ray fluxes for the detections, as well as upper limits forthe undetected sources. The fluxes have been taken from the2XMM catalogue (Watson et al. 2009). The fluxes refer to thetotal 0.2–12 keV band for the PN detector or the combinedMOS detectors in the case where PN fluxes are not available
Fig. 2. X-ray (0.2–12 keV) to optical (B-band) flux diagram for both thecentral active galaxy targets (solid circles) and the neighbours (open cir-cles). The triangles (upper limits) denote the neighbours with no X-raydetection. The upper, lower solid line, and the dashed line correspondto fX/ fB = +1,−1,−2 respectively. The only neighbour (open circle)that lies in the AGN regime is NGC 7682-N1.
and are estimated using a photon index of Γ = 1.7 and anaverage Galactic column density of NH = 3 × 1020 cm−2.Luminosities were estimated using the same spectral parameters.In the same table we quote the 2XMM hardness ratios, derivedfrom the 1–2 keV and 2–4.5 keV bands (hardness ratio-3 accord-ing to the 2XMM catalogue notation). The upper limits, derivedusing the FLIX software, are estimated following the method ofCarrera et al. (2007). This provides upper limits to the X-ray fluxat a given point in the sky covered by XMM-Newton pointings.The radius used for deriving the upper limit was 20 or 30 arcsecdepending on the presence of contaminating nearby sources.
In Fig. 2 we present the X-ray to optical flux diagram fX− fB(e.g. Stocke et al. 1991). This diagram provides an idea onwhether a galaxy may host an active nucleus. This is be-cause AGN have enhanced X-ray emission for a given optical
A135, page 9 of 16

A&A 552, A135 (2013)
Fig. 3. Images of the AGN galaxies and their neighbours. The AGN is located in the centre of the image except from NGC 7682, which is easilyspotted on the left of the image.
A135, page 10 of 16

E. Koulouridis et al.: Neighbours of Seyfert galaxies
magnitude relative to ALG galaxies. The space usually popu-lated by AGN is shown between the continuous lines. The cen-tral Seyfert galaxies are shown as filled points, but since X-rayflux has not been corrected for X-ray absorption, a number ofabsorbed AGN galaxies lie between the lower continuous lineand the dashed line, while the heavily absorbed Sy2 NGC 7743(Akylas & Georgantopoulos 2009), lie far below the dashed line.One neighbour that lies in the AGN regime (NGC 7682-N1)can be clearly seen. This has been classified as a TO galaxy inthe optical spectroscopic analysis and is one of the three neigh-bours (for which XMM-Newton observations are available, seeTable 4) having an active nucleus based on optical spectroscopy.Additional information on the nature of our sources can be ex-tracted from the hardness ratios. Two sources NGC 526-N2 andNGC 1358-N2 have hardness ratios suggesting an absorptionof NH ≈ 1022 cm−2, consistent with the presence of a moder-ately obscured active nucleus. Both these galaxies present nooptical emission lines and thus are classified as ALG, based ontheir optical spectra. In other words, the lack of optical emis-sion lines from the nucleus of these objects could be a resultof obscuration and indeed this seems to be the case, since thedetection limit of the EW of emission lines is low enough. Inaddition, we should mention here that all galaxies among thosethat fall in fields observed by XMM-Newton, classified as ALGthrough optical spectroscopy, present X-ray emission. In con-trast, all SF galaxies except one in the X-ray subsample do notshow an X-ray detection.
We should note here that unobscured low accretion rateSy2 objects and/or low luminosity AGN, where the narrow lineregion (NLR) cannot be detected by means of optical spec-troscopy, or even X-ray binaries may account for the X-ray de-tection of unobscured ALG galaxies. However, emission fromX-ray binaries is not detected in the spectra of the SFNs ren-dering this interpretation less plausible. This analysis thereforeimplies that the total fraction of neighbours of AGN that showrecent star formation or AGN, based on optical spectroscopy orX-ray observations, is at least 80% and possibly quite higher.This matter will be fully addressed in future work.
4. Discussion and conclusions
We have investigated the close environment (≤100 h−1kpc) ofa local sample (z < 0.034) of AGN. In particular we exploredthe spectroscopic, photometric and X-ray properties of 30 neigh-bouring galaxies around 10 Sy1 and 13 Sy2 galaxies. Based onoptical spectroscopy, we found that the large majority of theseneighbours show some activity, mostly recent star formation(emission line spectrum) but AGN as well. In addition, our X-rayanalysis of a subsample of neighbours with public XMM-Newtonobservations showed that the neighbours that are classified asALG based on optical spectroscopy might have a low-luminosityactive core, since all of them are X-ray detected, while two outof five appear to have a moderately obscured active nucleus.The X-ray detections could be due to X-ray binaries, but we ar-gue that this is less probable since the pure star-forming neigh-bours do not show any X-ray emission down to the flux limit ofthe available observations. From both optical spectroscopy andX-ray observations, it becomes clear that the fraction of AGN’sneighbours that exhibit recent star formation and/or nuclear ac-tivity, within 100 h−1 Mpc, is >80% and possibly higher.
Furthermore, the close neighbours of Sy1 galaxies, espe-cially the SFNs, are less ionized and have lower values ofEW(Hα) than do those of Sy2 and thus seem to be a different,
more evolved population than those of Sy2s. Other discoveredtrends in metallicity, host galaxy size, and age of the most re-cent starburst event indicate possible physical differences be-tween the neighbours of Sy1 and Sy2 galaxies as well, whichmay link AGN activity with interactions.
Indeed, over the past two decades there have been sev-eral studies that supported the idea of an evolutionary sequencefrom starburst to Seyfert galaxies (e.g. Storchi-Bergmann et al.2001, see also Introduction). Furthermore, there are also stud-ies that separate Type I from Type II objects (e.g. Hunt et al.1997; Maiolino et al. 1997; Gu et al. 2001), implying that re-cent star formation is only present in Type II objects (see alsoColdwell et al. 2009). Based on the number and proximity ofclose (�60–100 h−1 kpc) neighbours, around different types ofactive (Sy1, Sy2 and BIRG) galaxies (e.g. Dultzin-Hacyan et al.1999; Krongold et al. 2002; Koulouridis et al. 2006a,b), a veryinteresting evolutionary sequence has been suggested, startingwith a close interaction that triggers the formation of a nuclearstarburst, subsequently evolving to a Type 2 Seyfert, and finallyto a Sy1. Recent observational results by Villarroel et al. (2012)and Kollatschny et al. (2012) also seem to support this scheme.This sequence is likely independent of luminosity, since sim-ilar trends have been proposed for LINERs (Krongold et al.2003) and ULIRGs and quasars (Fiore et al. 2008 and referencestherein). The above findings were also supported by numericalsimulations (Hopkins et al. 2008), which outlined such an evolu-tionary scheme for merging galaxies. The proposed activity evo-lution can explain the excess of starbursts and Type 2 AGN ininteracting systems, as well as the lack of Type 1 AGN in com-pact groups of galaxies (Martínez et al. 2008) and galaxy pairs(e.g., Gonzalez et al. 2008).
Since the physical properties of the neighbours should be re-flected in the state of the central active galaxy, we argue thatour results may be going in the same direction as those of ourprevious papers (Koulouridis et al. 2006a,b), supporting an evo-lutionary sequence of galaxy activity, driven by interactions, themain path of which follows the sequence of induced star for-mation, Sy2 and finally Sy1 phase. A time delay should existbetween the pure star-forming and AGN phases (see discussionin the Introduction), where active nucleus and circumnuclearstarburst coexist. In this initial phase, the nucleus is heavily ob-scured by the still star-forming molecular clouds, and it can beobserved as a transition stage of composite Sy2-starburst objects.We should note here that according to Ballantyne et al. (2006),a non-evolving torus cannot provide the AGN obscuration overall cosmic time and that extra obscuration by star formation isneeded.
The most probable manner for the AGN to dominate is toeliminate the starburst, possibly by the AGN outflows or by ra-diation pressure. We point out that a great theoretical success ofthe starburst/AGN connection is the quenching of the inducedstar formation by the AGN feedback, which can explain the for-mation of red and dead elliptical galaxies (e.g. Springel et al.2005a; Di Matteo et al. 2005; Khalatyan et al. 2008). This canbe achieved by outflows from the core that have enough energyto dissipate the material around it and thus suffocate star for-mation (e.g. Krongold et al. 2007, 2009; Blustin et al. 2008;Hopkins & Elvis 2010; Novak et al. 2011; Cano-Díaz et al. 2012;Zubovas & King 2012). Recent observational studies and simu-lations have shown that ionized outflows from the AGN maycarry enough energy to cease star formation in the host galaxyrapidly, in less than 1 Gyr (see for example Kaviraj et al. 2011).As the starburst fades (see relevant discussion and references inthe Introduction), the Seyfert 2 state starts dominating, to be
A135, page 11 of 16

A&A 552, A135 (2013)
followed at the end by a totally unobscured Sy1 state, plausi-bly ∼1 Gyr after the initial interaction (see Krongold et al. 2002).More details about the co-evolution of the torus and the AGNare given by Liu & Zhang (2011), supporting our evolutionaryscheme. We should note here that recent observations (Hasingeret al. 2008; Treister et al. 2010) verified a significant increase inthe Type 2 AGN fraction with redshift, a fact that agrees withour evolutionary scheme.
Alternatively, there is a possibility that the SFN neighboursof Sy1 galaxies are systematically more massive compared tothose of Sy2 and that their older stellar population is due todownsizing; i.e., more massive galaxies have evolved earlier,while less massive ones exhibit more recent star formation andthus a younger stellar population. However, there is no obviousexplanation on why more massive galaxies should be locatedpreferentially near Sy1 galaxies and not Sy2. The combinationof both downsizing and the interaction driven sequence, as pre-sented previously, can also be at work.
We stress that the suggested evolutionary scenario does notcompletely invalidate the unification scheme. It implies that theorientation of the torus can determine the AGN phenomenol-ogy only at specific phases of the evolutionary sequence. Inparticular, this probably occurs when the obscuring molecularclouds form the torus (possibly when the AGN activity reachesits peak ∼0.5 Gyr after the initial interactions (Kaviraj et al.2011) and before being completely swept away, possibly af-ter 1 Gyr (Krongold et al. 2002). From our point of view, in anever-evolving universe an evolutionary scheme is more probablethan the original unification paradigm, which proposes a ratherstatic view of AGN. Of course, orientation could and should alsoplay a role between the obscured Sy2 and Sy1 phase, when therelaxing obscuring material forms a toroidal structure.
There are still many unresolved issues and caveats concern-ing these suggestions, since the evolutionary sequence is notunique and should also depend on the geometry, the density, andother factors of the obscuring and the accreting material, as wellas on the mass of the host galaxy and its black hole. Furthermore,the sample presented in this pilot study is rather small, and theresults should be considered as indicative and should be con-firmed by analysis of larger samples.
Acknowledgements. E.K. thanks the IUNAM and INAOE, where a major partof this work was completed, for their warm hospitality. We also thank theOAGH and OAN-SPM staff for excellent assistance and technical support atthe telescopes. V.C. acknowledges funding by CONACyT research grants 54480and 15149 (México). MP acknowledges funding by the Mexican Governmentresearch grant No. CONACyT 49878-F and DD support from grant PAPIITIN111610 from DGAPA, UNAM. Y.K. acknowledges support from CONACyT168519 grant and UNAM-DGAPA PAPIIT IN103712 grant. This research hasmade use of the USNO-B catalog (Monet et al. 2003) and the MAPS Catalogof POSS I (Cabanela et al. 2003) supported by the University of Minnesota (theAPS databases can be accessed at http://aps.umn.edu/). The STARLIGHTproject is supported by the Brazilian agencies CNPq, CAPES and FAPESP andby the FranceBrazil CAPES/Cofecub programme. Funding for the SDSS andSDSS-II has been provided by the Alfred P. Sloan Foundation, the ParticipatingInstitutions, the National Science Foundation, the US Department of Energy, theNational Aeronautics and Space Administration, the Japanese Monbukagakusho,the Max Planck Society, and the Higher Education Funding Council for England.The SDSS web site is http://www.sdss.org/. Finally, we would like to thankthe anonymous referee for his or her comments and suggestions that helped tosignificantly improve our paper.
ReferencesAkylas, A., & Georgantopoulos, I. 2009, A&A, 500, 999Antonucci, R. 1993, ARA&A, 31, 473Asari, N. V., Cid Fernandes, R., Stasinska, G., et al. 2007, MNRAS, 381, 263
Ballantyne, D. R., Everett, J. E., & Murray, N. 2006, ApJ, 639, 740Baldwin, J. A., Phillips, M. M., & Terlevich, R. 1981, PASP, 93, 5Blustin, A. J., Dwelly, T., Page, M. J., et al. 2008, MNRAS, 390, 1229Boisson, C., Joly, M., Moultaka, J., Pelat, D., & Serote Roos, M. 2000, A&A,
357, 850Boisson, C., Joly, M., Pelat, D., & Ward, M. J. 2004, A&A, 428, 373Cabanela, J. E., Humphreys, R. M., Aldering, G., et al. 2003, PASP, 115, 837Cano-Díaz, M., Maiolino, R., Marconi, A., et al. 2012, A&A, 537, L8Carrera, F. J., Ebrero, J., Mateos, S., et al. 2007, A&A, 469, 27Cid Fernandes, R. J., Storchi-Bergmann, T., & Schmitt, H. R. 1998, MNRAS,
297, 579Cid Fernandes, R., Heckman, T., Schmitt, H., Delgado, R. M. G., &
Storchi-Bergmann, T. 2001, ApJ, 558, 81Cid Fernandes, R., Gu, Q., Melnick, J., et al. 2004, MNRAS, 355, 273Cid Fernandes, R., González Delgado, R. M., Storchi-Bergmann, T., Martins,
L. P., & Schmitt, H. 2005, MNRAS, 356, 270Cid Fernandes, R., Asari, N. V., Sodré, L., et al. 2007, MNRAS, 375, L16Cisternas, M., Jahnke, K., Inskip, K. J., et al. 2011, ApJ, 726, 57Coldwell, G. V., Lambas, D. G., Söchting, I. K., & Gurovich, S. 2009, MNRAS,
399, 88Davies, R., Genzel, R., Tacconi, L., Mueller Sánchez, F., & Sternberg, A. 2007,
in The Central Engine of Active Galactic Nuclei, ASP Conf. Ser., 373, 639Davies, R., Burtscher, L., Dodds-Eden, K., & Orban de Xivry, G. 2012, J. Phys.
Conf. Ser., 372, 12046Di Matteo, T., Springel, V., & Hernquist, L. 2005, Nature, 433, 604Dultzin-Hacyan, D., & Benitez, E. 1994, A&A, 291, 720Dultzin-Hacyan, D., Krongold, Y., Fuentes-Guridi, I., & Marziani, P. 1999, ApJ,
513, L111Ellison, S. L., Patton, D. R., Simard, L., & McConnachie, A. W. 2008, AJ, 135,
1877Ellison, S. L., Patton, D. R., Mendel, J. T., & Scudder, J. M. 2011, MNRAS, 418,
2043Fiore, F., Grazian, A., Santini, P., et al. 2008, ApJ, 672, 94Galaz, G., Herrera-Camus, R., Garcia-Lambas, D., & Padilla, N. 2011, ApJ, 728,
74Georgakakis, A., Coil, A. L., Laird, E. S., et al. 2009, MNRAS, 397, 623González, J. J., Krongold, Y., Dultzin, D., et al. 2008, Rev. Mex. Astron. Astrofis.
Conf. Ser., 32, 170Gu, Q., Maiolino, R., & Dultzin-Hacyan, D. 2001, A&A, 366, 765Hasinger, G. 2008, A&A, 490, 905Ho, L. C. 2008, ARA&A, 46, 475Ho, L. C., Filippenko, A. V., & Sargent, W. L. W. 1997, ApJS, 112, 315Hopkins, P. F., & Elvis, M. 2010, MNRAS, 401, 7Hopkins, P. F., Hernquist, L., Cox, T. J., & Kereš, D. 2008, ApJS, 175, 356Hunt, L. K., Malkan, M. A., Salvati, M., et al. 1997, ApJS, 108, 229Ideue, Y., Taniguchi, Y., Nagao, T., et al. 2012, ApJ, 747, 42Kauffmann, G., Heckman, T. M., Tremonti, C., et al. 2003, MNRAS, 346,
1055Kaviraj, S., Schawinski, K., Silk, J., & Shabala, S. S. 2011, MNRAS, 415,
3798Kawakatu, N., Anabuki, N., Nagao, T., Umemura, M., & Nakagawa, T. 2006,
ApJ, 637, 104Kewley, L. J., Heisler, C. A., Dopita, M. A., & Lumsden, S. 2001, ApJS, 132, 37Kewley, L. J., Geller, M. J., & Barton, E. J. 2006a, AJ, 131, 2004Kewley, L. J., Groves, B., Kauffmann, G., & Heckman, T. 2006b, MNRAS, 372,
961Khalatyan, A., Cattaneo, A., Schramm, M., et al. 2008, MNRAS, 387, 13Knapen, J. H., & James, P. A. 2009, ApJ, 698, 1437Kollatschny, W., Reichstein, A., & Zetzl, M. 2012, A&A, 548, A37Kormendy, J., & Richstone, D. 1995, ARA&A, 33, 581Krongold, Y., Dultzin-Hacyan, D., & Marziani, P. 2002, ApJ, 572, 169Krongold, Y., Nicastro, F., Brickhouse, N. S., et al. 2003, ApJ, 597, 832Krongold, Y., Nicastro, F., Elvis, M., et al. 2007, ApJ, 659, 1022Krongold, Y., Jiménez-Bailón, E., Santos-Lleo, M., et al. 2009, ApJ, 690, 773Koulouridis, E., Plionis, M., Chavushyan, V., et al. 2006a, ApJ, 639, 37Koulouridis, E., Chavushyan, V., Plionis, M., Krongold, Y., & Dultzin-Hacyan,
D. 2006b, ApJ, 651, 93León-Tavares, J., Valtaoja, E., Chavushyan, V. H., et al. 2011a, MNRAS, 411,
1127León-Tavares, J., Valtaoja, E., Tornikoski, M., Lähteenmäki, A., & Nieppola, E.
2011b, A&A, 532, A146Li, C., Kauffmann, G., Heckman, T. M., White, S. D. M., & Jing, Y. P. 2008,
MNRAS, 385, 1915Lipovetskij, V. A., Neizvestnyj, S. I., & Neizvestnaya, O. M. 1987, in
Soobshcheniya Spetsial’noj Astrofizicheskoj Observatorii, 55Liu, Y., & Zhang, S. N. 2011, ApJ, 728, L44Lynden-Bell, D. 1969, Nature, 223, 690Magorrian, J., Tremaine, S., Richstone, D., et al. 1998, AJ, 115, 2285
A135, page 12 of 16

E. Koulouridis et al.: Neighbours of Seyfert galaxies
Maiolino, R., & Rieke, G. H. 1995, ApJ, 454, 95Maiolino, R., Ruiz, M., Rieke, G. H., & Papadopoulos, P. 1997, ApJ, 485, 552Marquez, I., & Moles, M. 1994, AJ, 108, 90Martínez, M. A., Del Olmo, A., Coziol, R., & Perea, J. 2008, Rev. Mex. Astron.
Astrofis. Conf. Ser., 32, 164Mateus, A., Sodré, L., Cid Fernandes, R., et al. 2006, MNRAS, 370, 721Melia, F., & Falcke, H. 2001, ARA&A, 39, 309Moles, M., Marquez, I., & Perez, E. 1995, ApJ, 438, 604Monet, D. G., Levine, S. E., Canzian, B., et al. 2003, AJ, 125, 984Müller Sánchez, F., Davies, R. I., Genzel, R., et al. 2008, Rev. Mex. Astron.
Astrofis. Conf. Ser., 32, 109Nelson, C. H., & Whittle, M. 1996, ApJ, 465, 96Novak, G. S., Ostriker, J. P., & Ciotti, L. 2011, ApJ, 737, 26Silverman, J. D., Kampczyk, P., Jahnke, K., et al. 2011, ApJ, 743, 2Springel, V., Di Matteo, T., & Hernquist, L. 2005, ApJ, 620, L79Stasinska, G., Cid Fernandes, R., Mateus, A., Sodré, L., & Asari, N. V. 2006,
MNRAS, 371, 972
Stocke, J. T., Morris, S. L., Gioia, I. M., et al. 1991, ApJS, 76, 813Storchi-Bergmann, T., González Delgado, R. M., Schmitt, H. R., Cid Fernandes,
R., & Heckman, T. 2001, ApJ, 559, 147Tang, Y.-W., Kuo, C.-Y., Lim, J., & Ho, P. T. P. 2008, ApJ, 679, 1094Treister, E., Urry, C. M., Schawinski, K., Cardamone, C. N., & Sanders, D. B.
2010, ApJ, 722, L238Tresse, L., Maddox, S., Loveday, J., & Singleton, C. 1999, MNRAS, 310, 262Umemura, M., Fukue, J., & Mineshige, S. 1998, MNRAS, 299, 1123Veilleux, S., & Osterbrock, D. E. 1987, ApJS, 63, 295Villarroel, B., Korn, A., & Matsuoka, Y. 2012 [arXiv:1211.0528]Villforth, C., Sarajedini, V., & Koekemoer, A. 2012, MNRAS, 426, 360Volonteri, M., Haardt, F., & Gültekin, K. 2008, MNRAS, 384, 1387Wake, D. A., Miller, C. J., Di Matteo, T., et al. 2004, ApJ, 610, L85Wang, L., & Kauffmann, G. 2008, MNRAS, 391, 785Watson, M. G., Schröder, A. C., Fyfe, D., et al. 2009, A&A, 493, 339Wild, V., Heckman, T., & Charlot, S. 2010, MNRAS, 405, 933Zubovas, K., & King, A. 2012, ApJ, 745, L34
Pages 14 to 16 are available in the electronic edition of the journal at http://www.aanda.org
A135, page 13 of 16

A&A 552, A135 (2013)
Appendix A
4000 5000 6000 7000
0
10
20
30
5000 6000 7000
0
50
100
4000 5000 6000 70000
100
200
5000 6000 70000
50
100
4000 5000 6000 7000
0
2
4
6
8
4000 5000 6000 7000
0
20
40
60
5000 6000 7000
Rest Wavelength (Å)
0
10
20
30
40
4000 5000 6000 7000
Rest Wavelength (Å)
0
20
40
60
80
Flux
× 1
0-17 [
erg
× s
-1 ×
cm
-2 ×
Å-1
]
Mrk 1400 #1 NGC 1019 #2
NGC 1194 #1 (SDSS)
1H 1142 #2
NGC 7469 #1
NGC 1194 #4
MRK 699 #1
NGC 526A #1
Fig. A.1. Spectra of the ELG neighbours of AGN galaxies, listed in Tables 1 and 2.
A135, page 14 of 16
E. Koulouridis et al.: Neighbours of Seyfert galaxies
4000 5000 6000
0
50
100
4000 5000 6000
0
20
40
60
4000 5000 6000 7000
0
20
40
60
5000 6000 7000
0
10
20
4000 5000 6000 7000
0
50
100
150
4000 5000 6000 7000
0
10
20
30
4000 5000 6000 7000
Rest Wavelength (Å)
0
50
100
150
5000 6000 7000
Rest Wavelength (Å)
0
10
20
30
Flux
× 1
0-17 [
erg
× s
-1 ×
cm
-2 ×
Å-1
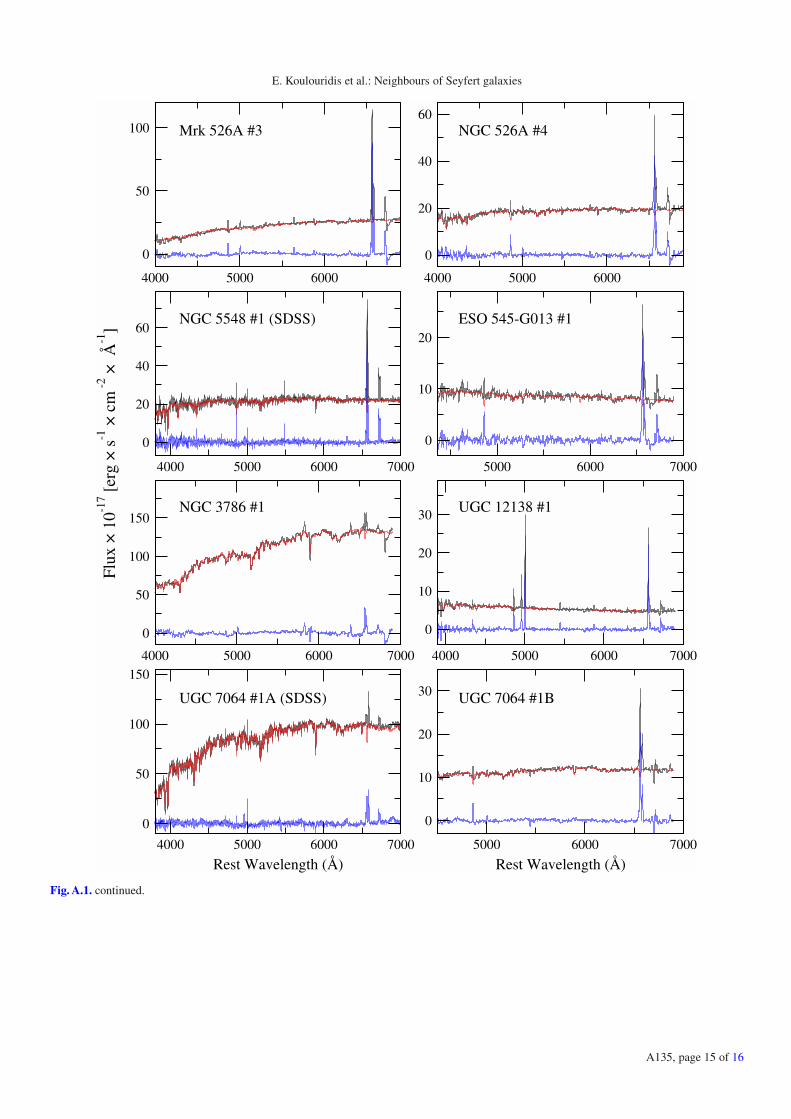
]Mrk 526A #3 NGC 526A #4
NGC 5548 #1 (SDSS)
NGC 3786 #1
UGC 7064 #1A (SDSS)
ESO 545-G013 #1
UGC 12138 #1
UGC 7064 #1B
Fig. A.1. continued.
A135, page 15 of 16

A&A 552, A135 (2013)
4000 5000 6000 7000
0
20
40
60
4000 5000 6000 7000
0
10
20
30
4000 5000 6000 7000
0
50
100
4000 5000 6000 7000
0
50
100
150
4000 5000 6000 7000
Rest Wavelength (Å)
0
500
1000
1500
4000 5000 6000 7000
Rest Wavelength (Å)
0
20
40
60
80Flu
x ×
10-1
7 [er
g ×
s-1
× c
m -
2 × Å
-1]
UGC 7064 #2 IRAS 00160-0719 #1
ESO 417-G06 #1
NGC 7682 #1
NGC 1241 #1
NGC 7743 #3
Fig. A.1. continued.
A135, page 16 of 16