Activity-Based Human Mobility Patterns Inferred from...
13
IEEE TRANSACTIONS ON BIG DATA, TBD-2015-12-0163 1 Activity-Based Human Mobility Patterns Inferred from Mobile Phone Data: A Case Study of Singapore Shan Jiang, Joseph Ferreira, Jr., Marta C. González Abstract—In this study, with Singapore as an example, we demonstrate how we can use mobile phone call detail record (CDR) data, which contains millions of anonymous users, to extract individual mobility networks comparable to the activity-based approach. Such an approach is widely used in the transportation planning practice to develop micro urban simulations of individuals’ daily activities and their travel; yet it depends highly on detailed travel survey data to capture individual activity-based behavior. We provide an innovative data mining framework that synthesizes the state-of-the-art techniques in extracting mobility patterns from raw mobile phone CDR data, and design a pipeline that can translate the massive and passive mobile phone records into interpretable spatial human mobility patterns for urban and transportation planning. With growing ubiquitous mobile sensing, and shrinking labor and fiscal resources in the public sector globally, the method presented in this research can be used as a low-cost alternative for transportation and planning agencies to understand the human activity patterns in cities, and provide targeted plans for future sustainable development. Index Terms—Categories and Subject Descriptors: H.2.8 [Database Management]: Database Applications – Data mining, spatial databases and GIS; I.2.6 [Artificial Intelligence]: Learning – Knowledge acquisition Keywords: call detail record (CDR) data, human mobility networks, mobility motif detection, trajectory data mining —————————— —————————— 1. INTRODUCTION o improve urban mobility, accessibility and quality of life, understanding how individuals travel and conduct activities has been the major focus of city planners, geographers and transportation planners for more than half a century [1]–[4]. In the past, this task was mainly accomplished through collecting survey data in small sample sizes and low frequencies (e.g., planning agencies in metropolitan areas usually conduct 1 per cent household travel diary survey once or twice in a decade), due to the huge amount of labor and fiscal resources required in the data collection process. Today, this traditional approach has many challenges. First, more than half of the global population (54 per cent in 2014) lives in urban areas now, and with the evolution of our society and innovation in technology, cities have become more diverse and complex than ever before in the increasingly interconnected world. Second, urban problems in traffic congestion, environmental pollution and degradation, energy consumption, and green house emission become major threats especially for the rapidly growing cities in developing countries. It is projected that additional 2.5 billion urban population will be added by 2050 and 90 per cent of the increase will be concentrated in Asia and Africa [5]. Third, recent financial crisis has brought substantial stress to the public sector in collecting the traditional survey data to understand cities, the economy and the society. For cities in developing countries, governments usually don’t have resources in collecting expensive data. Despite the fact that urban and transportation theories can go beyond data, analytical methods and modeling approaches in the past were developed from and tailored to the traditional type of data, and cannot meet the current challenges. It is increasingly urgent for urban researchers to look for new approaches to address these challenges, especially for cities in the rapid urbanization process. With the rise of the ubiquitous sensing technologies, digital human footprints can be recorded in unprecedentedly massive scale with high frequency and low costs. It brings great opportunity to change the landscape of urban research to a new horizon (e.g., [6]–[8]), and requires innovation to link the new massive and passive data with urban theory and thinking to derive new urban knowledge called the new urban science [9][10], [11]. In this paper, we use Singapore, a city state as an example, to demonstrate the pipeline of parsing, filtering, analyzing and synthesizing mobile phone data to interpret human mobility in a way that can be used and understood in the planning language and for planning practices. We argue that by properly treating the mobile phone data, planners can derive much richer information for understanding how individuals use different parts of the city and travel, and where to target for future improvement of urban and transportation planning. The rest of the paper is organized as follows. In Section 2, we review the state-of-the-art literature that employs mobile phone call detail record (CDR) data for human mobility and transportation analysis. In Section 3, we present the spatial unit of analysis and data, including CDR data and census data, and household travel survey data for validation purpose. In Section 4, we introduce the data mining pipelines to extract statistically reliable estimates of individual mobility networks from the massive CDR data. In Section 5, we present the spatial patterns of human mobility networks at the transportation planning zone level and interpret the mobility patterns in the urban context. In Section 6, we discuss the planning implications of the finding and future improvement for urban development. T ———————————————— S. Jiang is with the Department of Urban Studies and Planning, and Department of Civil and Environmental Engineering at Massachusetts Institute of Technology, 77 Massachusetts Avenue Room 1-138, Cambridge 02139, USA. E-mail: [email protected]. J. Ferreira, Jr. is with the Department of Urban Studies and Planning, Massachusetts Institute of Technology, 77 Massachusetts Avenue Room 9- 532, Cambridge 02139, USA. E-mail: [email protected]. M.C. González is with the Department of Civil and Environmental Engineering at Massachusetts Institute of Technology, 77 Massachusetts Avenue Cambridge 02139, Room 1-153. E-mail: [email protected].
Transcript of Activity-Based Human Mobility Patterns Inferred from...
IEEE TRANSACTIONS ON BIG DATA, TBD-2015-12-0163 1
Activity-Based Human Mobility Patterns Inferred from
Mobile Phone Data:
A Case Study of SingaporeShan Jiang, Joseph Ferreira, Jr., Marta C. González
Abstract—In this study, with Singapore as an example, we demonstrate how we can use mobile phone call detail record (CDR) data, which contains
millions of anonymous users, to extract individual mobility networks comparable to the activity-based approach. Such an approach is widely used in the
transportation planning practice to develop micro urban simulations of individuals’ daily activities and their travel; yet it depends highly on detailed travel
survey data to capture individual activity-based behavior. We provide an innovative data mining framework that synthesizes the state-of-the-art techniques
in extracting mobility patterns from raw mobile phone CDR data, and design a pipeline that can translate the massive and passive mobile phone records
into interpretable spatial human mobility patterns for urban and transportation planning. With growing ubiquitous mobile sensing, and shrinking labor and
fiscal resources in the public sector globally, the method presented in this research can be used as a low-cost alternative for transportation and planning
agencies to understand the human activity patterns in cities, and provide targeted plans for future sustainable development.
Index Terms—Categories and Subject Descriptors: H.2.8 [Database Management]: Database Applications – Data mining, spatial databases and GIS; I.2.6
[Artificial Intelligence]: Learning – Knowledge acquisition
Keywords: call detail record (CDR) data, human mobility networks, mobility motif detection, trajectory data mining
—————————— ——————————
1. INTRODUCTION
o improve urban mobility, accessibility and quality of life, understanding how individuals travel and conduct
activities has been the major focus of city planners, geographers and transportation planners for more than half a century [1]–[4]. In the past, this task was mainly accomplished through collecting survey data in small sample sizes and low frequencies (e.g., planning agencies in metropolitan areas usually conduct 1 per cent household travel diary survey once or twice in a decade), due to the huge amount of labor and fiscal resources required in the data collection process. Today, this traditional approach has many challenges. First, more than half of the global population (54 per cent in 2014) lives in urban areas now, and with the evolution of our society and innovation in technology, cities have become more diverse and complex than ever before in the increasingly interconnected world. Second, urban problems in traffic congestion, environmental pollution and degradation, energy consumption, and green house emission become major threats especially for the rapidly growing cities in developing countries. It is projected that additional 2.5 billion urban population will be added by 2050 and 90 per cent of the increase will be concentrated in Asia and Africa [5]. Third, recent financial crisis has brought substantial stress to the public sector in collecting the traditional survey data to understand cities, the economy and the society. For cities in developing countries, governments usually don’t have resources in collecting expensive data.
Despite the fact that urban and transportation theories can go beyond data, analytical methods and modeling approaches in the past were developed from and tailored to the traditional type of data, and cannot meet the current challenges. It is increasingly urgent for urban researchers to look for new approaches to address these challenges, especially for cities in the rapid urbanization process. With the rise of the ubiquitous sensing technologies, digital human footprints can be recorded in unprecedentedly massive scale with high frequency and low costs. It brings great opportunity to change the landscape of urban research to a new horizon (e.g., [6]–[8]), and requires innovation to link the new massive and passive data with urban theory and thinking to derive new urban knowledge called the new urban science [9][10], [11].
In this paper, we use Singapore, a city state as an example, to demonstrate the pipeline of parsing, filtering, analyzing and synthesizing mobile phone data to interpret human mobility in a way that can be used and understood in the planning language and for planning practices. We argue that by properly treating the mobile phone data, planners can derive much richer information for understanding how individuals use different parts of the city and travel, and where to target for future improvement of urban and transportation planning.
The rest of the paper is organized as follows. In Section 2, we review the state-of-the-art literature that employs mobile phone call detail record (CDR) data for human mobility and transportation analysis. In Section 3, we present the spatial unit of analysis and data, including CDR data and census data, and household travel survey data for validation purpose. In Section 4, we introduce the data mining pipelines to extract statistically reliable estimates of individual mobility networks from the massive CDR data. In Section 5, we present the spatial patterns of human mobility networks at the transportation planning zone level and interpret the mobility patterns in the urban context. In Section 6, we discuss the planning implications of the finding and future improvement for urban development.
T
———————————————— S. Jiang is with the Department of Urban Studies and Planning, and
Department of Civil and Environmental Engineering at Massachusetts Institute of Technology, 77 Massachusetts Avenue Room 1-138, Cambridge 02139, USA. E-mail: [email protected].
J. Ferreira, Jr. is with the Department of Urban Studies and Planning, Massachusetts Institute of Technology, 77 Massachusetts Avenue Room 9-532, Cambridge 02139, USA. E-mail: [email protected].
M.C. González is with the Department of Civil and Environmental Engineering at Massachusetts Institute of Technology, 77 Massachusetts Avenue Cambridge 02139, Room 1-153. E-mail: [email protected].
2 IEEE TRANSACTIONS ON BIG DATA, TBD-2015-12-0163
2. LITERATURE REVIEW
Researchers have made advancements in developing methods to adopt mobile phone data to understand and estimate human mobility and travel [12]–[14]. Although mobile phone data such as CDRs are sparse in space and time—only showing records when the devices are in use, the large volume and long observation period of such data can be used to infer human footprints in unprecedented scale. Human mobility revealed from CDR data illustrates a pattern of preferential returns to previously visited locations and explorations of new places as a general and universal feature in human mobility [15]–[17]. Based on this feature, it is possible to estimate meaningful human activity locations using cell phone data. CDRs are not as structured as traditional travel survey data which contains location and time information for meaningful activity destinations, or as precise as GPS data which provides higher frequency and accuracy [18]. However, as a byproduct for billing purposes carried out routinely by mobile service carriers, CDR data can be obtained at a much lower cost and on a greater scale.
2.1 Trip-based Approach
CDR data include spatiotemporal information on people’s movements respective to cellular towers or triangulated locations, depending on the location positioning technology used by the service carrier. Based on this feature of CDR data, Wang et al. [19] develop a method to generate tower-to-tower transient origin-destination (OD) matrices for different time periods and further covert them into intersection-to-intersection transient ODs in the road network for areas of interest (Boston and San Francisco). By assigning the transient ODs to the road network and using a bipartite network framework, they present a method to analyze road usage patterns and pinpoint areas as driver sources contributing to major traffic congestion in the study areas. Due to the lack of traffic volume data in ground truthing, the authors use probe vehicle GPS data to validate estimated travel times in road segments and report high correlations between estimated (from CDR data) and observed travel times (from GPS data). Following a similar approach, Iqbal et al. [20] use CDR data collected in Dhaka, Bangladesh over one month, combined with traffic counts data, to estimate intersection-to-intersection transient OD matrices. By using an optimization-based approach, they generate expansion factors for node-to-node transient ODs and compared results with limited traffic counts data.
While the transient OD generation method produces and expands OD tables by time of day from CDR data, it resembles a trip-based approach as it mimics trip segments during human travel. Rather than modeling travel flows between activity destinations, it models segments of travels based on the appearance of people in space and time, as presented in the mobile phone data. This approach can be problematic, especially when CDR data are in low spatial resolution. For example, if spacing between cell towers is wide (more than a few kilometers), but road networks within each tower coverage area are dense, transient OD matrices can introduce biases. It may assign traffic to detoured local roads, although the assigned travel path is not necessarily a direct route from the “true” origin to destination.
In order to address this issue, parsing the trajectories observed in CDR data into stay-locations is important. A vast body of computer science literature has emerged on the topic of trajectory mining, due to the wide adoption of smartphones and location-based mobile applications. A comprehensive review on trajectory mining methods can be found in Zheng [21]. In general, the goal is to find suitable algorithms to extract meaningful stay locations for further analysis of noisy Big Data. By applying algorithms to parse passive CDR trajectories into stay locations, Alexander et al. [22] present methods to estimate average daily OD trip-tables from fine-grained triangulated mobile phone traces for two million users over two months for the Boston metropolitan area. By extracting stay locations from triangulated CDR data inferring the activity types of “home,” “work,” and “other;” and expanding phone samples to represent residential population, they generate estimations comparable to the traditional four-step based OD tables by day type (weekday, weekend), trip purpose such as home-based work (HBW) trips, home-based other (HBO) trips, non-home-based (NHB) trips, and hour of departure (e.g, AM, Midday, PM, and rest of day). By comparing the trip estimations with Census Transportation Planning Products (CTPP), conducted and prepared by the U.S. Department of Transportation Federal Highway Administration, and Household Travel Survey data in the same region, Alexander et al. identify a strong correlation between the three sources at the metropolitan level. Although a comparison between results in spatial details demonstrates a strong correlation between CDR and CTPP estimates at the town level, the correlation at the census tract level is weaker, likely due to geolocation errors embedded in these two sources.
Two recent studies synthesize the methods of processing CDR data to estimate travel demand and propose an innovative framework to derive estimated traffic on road networks and understand road usage patterns from raw CDR data for cities on different continents [23], [24]. These efforts have greatly enhanced our knowledge on how to use CDR data to understand human mobility to produce OD tables at city-scale at a low cost and to estimate travel times on the road networks. However, due to the complexity of implementation, the predominant approach continues to be trip-based, rather than tour-based or activity-based.
2.2 Activity-based Approach
Given the theoretical advantages of an activity-based approach, the development of methods to translate big urban data (particularly CDR data) for travel analysis in an activity-based approach is relevant and important for urban and transportation modeling. By adopting the concept of “motifs” from complex network theory [25], Schneider et al. [26] examine daily mobility networks from CDR data for Paris over a period of six months and from travel survey data for Paris and Chicago for one or two days. Using a simple method of extracting meaningful activity locations, they maintain towers with frequent visits above a certain threshold as potential stay locations for the analysis. Although the treatment of stay locations in this study is a broad brush-stroke approach, it is groundbreaking as it abstracts human daily mobility from Big Data in a similar way to the activity-based approach. Schneider et al. find that by using only 17 unique motifs, 90 percent of the
IEEE TRANSACTIONS ON BIG DATA, TBD-2015-12-0163 3
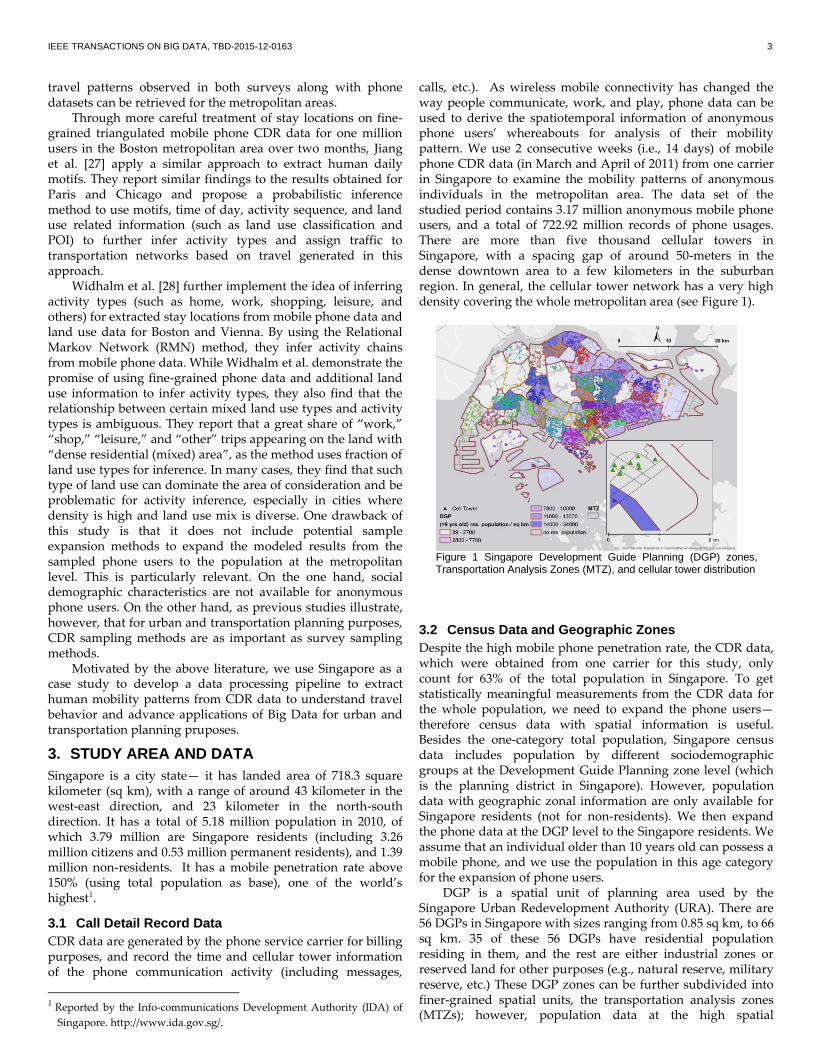
Figure 1 Singapore Development Guide Planning (DGP) zones, Transportation Analysis Zones (MTZ), and cellular tower distribution
travel patterns observed in both surveys along with phone datasets can be retrieved for the metropolitan areas.
Through more careful treatment of stay locations on fine-grained triangulated mobile phone CDR data for one million users in the Boston metropolitan area over two months, Jiang et al. [27] apply a similar approach to extract human daily motifs. They report similar findings to the results obtained for Paris and Chicago and propose a probabilistic inference method to use motifs, time of day, activity sequence, and land use related information (such as land use classification and POI) to further infer activity types and assign traffic to transportation networks based on travel generated in this approach.
Widhalm et al. [28] further implement the idea of inferring activity types (such as home, work, shopping, leisure, and others) for extracted stay locations from mobile phone data and land use data for Boston and Vienna. By using the Relational Markov Network (RMN) method, they infer activity chains from mobile phone data. While Widhalm et al. demonstrate the promise of using fine-grained phone data and additional land use information to infer activity types, they also find that the relationship between certain mixed land use types and activity types is ambiguous. They report that a great share of “work,” “shop,” “leisure,” and “other” trips appearing on the land with “dense residential (mixed) area”, as the method uses fraction of land use types for inference. In many cases, they find that such type of land use can dominate the area of consideration and be problematic for activity inference, especially in cities where density is high and land use mix is diverse. One drawback of this study is that it does not include potential sample expansion methods to expand the modeled results from the sampled phone users to the population at the metropolitan level. This is particularly relevant. On the one hand, social demographic characteristics are not available for anonymous phone users. On the other hand, as previous studies illustrate, however, that for urban and transportation planning purposes, CDR sampling methods are as important as survey sampling methods.
Motivated by the above literature, we use Singapore as a case study to develop a data processing pipeline to extract human mobility patterns from CDR data to understand travel behavior and advance applications of Big Data for urban and transportation planning pruposes.
3. STUDY AREA AND DATA
Singapore is a city state— it has landed area of 718.3 square kilometer (sq km), with a range of around 43 kilometer in the west-east direction, and 23 kilometer in the north-south direction. It has a total of 5.18 million population in 2010, of which 3.79 million are Singapore residents (including 3.26 million citizens and 0.53 million permanent residents), and 1.39 million non-residents. It has a mobile penetration rate above 150% (using total population as base), one of the world’s highest1.
3.1 Call Detail Record Data
CDR data are generated by the phone service carrier for billing purposes, and record the time and cellular tower information of the phone communication activity (including messages,
1 Reported by the Info-communications Development Authority (IDA) of
Singapore. http://www.ida.gov.sg/.
calls, etc.). As wireless mobile connectivity has changed the way people communicate, work, and play, phone data can be used to derive the spatiotemporal information of anonymous phone users’ whereabouts for analysis of their mobility pattern. We use 2 consecutive weeks (i.e., 14 days) of mobile phone CDR data (in March and April of 2011) from one carrier in Singapore to examine the mobility patterns of anonymous individuals in the metropolitan area. The data set of the studied period contains 3.17 million anonymous mobile phone users, and a total of 722.92 million records of phone usages. There are more than five thousand cellular towers in Singapore, with a spacing gap of around 50-meters in the dense downtown area to a few kilometers in the suburban region. In general, the cellular tower network has a very high density covering the whole metropolitan area (see Figure 1).
3.2 Census Data and Geographic Zones
Despite the high mobile phone penetration rate, the CDR data, which were obtained from one carrier for this study, only count for 63% of the total population in Singapore. To get statistically meaningful measurements from the CDR data for the whole population, we need to expand the phone users—therefore census data with spatial information is useful. Besides the one-category total population, Singapore census data includes population by different sociodemographic groups at the Development Guide Planning zone level (which is the planning district in Singapore). However, population data with geographic zonal information are only available for Singapore residents (not for non-residents). We then expand the phone data at the DGP level to the Singapore residents. We assume that an individual older than 10 years old can possess a mobile phone, and we use the population in this age category for the expansion of phone users.
DGP is a spatial unit of planning area used by the Singapore Urban Redevelopment Authority (URA). There are 56 DGPs in Singapore with sizes ranging from 0.85 sq km, to 66 sq km. 35 of these 56 DGPs have residential population residing in them, and the rest are either industrial zones or reserved land for other purposes (e.g., natural reserve, military reserve, etc.) These DGP zones can be further subdivided into finer-grained spatial units, the transportation analysis zones (MTZs); however, population data at the high spatial
4 IEEE TRANSACTIONS ON BIG DATA, TBD-2015-12-0163
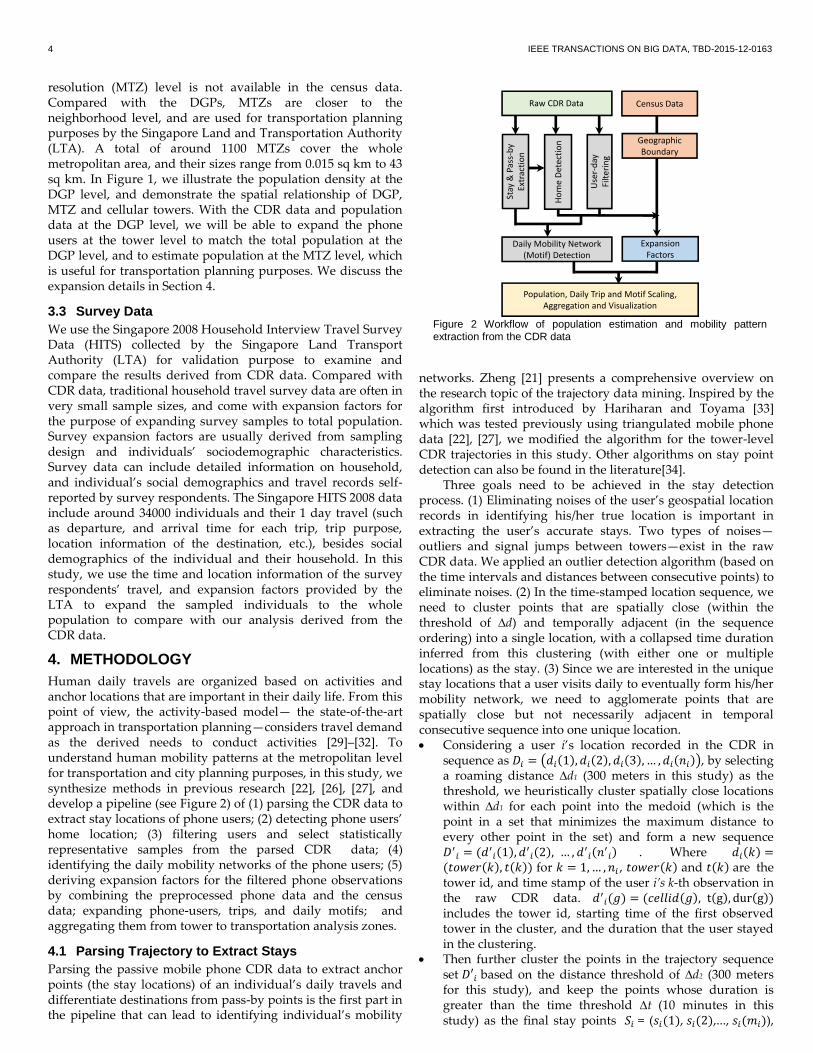
Figure 2 Workflow of population estimation and mobility pattern extraction from the CDR data
Population, Daily Trip and Motif Scaling, Aggregation and Visualization
Ho
me
Det
ecti
on
Raw CDR Data
Stay
& P
ass-
by
Extr
acti
on
Use
r-d
ay
Filt
erin
g
Census Data
Daily Mobility Network (Motif) Detection
Expansion Factors
Geographic Boundary
resolution (MTZ) level is not available in the census data. Compared with the DGPs, MTZs are closer to the neighborhood level, and are used for transportation planning purposes by the Singapore Land and Transportation Authority (LTA). A total of around 1100 MTZs cover the whole metropolitan area, and their sizes range from 0.015 sq km to 43 sq km. In Figure 1, we illustrate the population density at the DGP level, and demonstrate the spatial relationship of DGP, MTZ and cellular towers. With the CDR data and population data at the DGP level, we will be able to expand the phone users at the tower level to match the total population at the DGP level, and to estimate population at the MTZ level, which is useful for transportation planning purposes. We discuss the expansion details in Section 4.
3.3 Survey Data
We use the Singapore 2008 Household Interview Travel Survey Data (HITS) collected by the Singapore Land Transport Authority (LTA) for validation purpose to examine and compare the results derived from CDR data. Compared with CDR data, traditional household travel survey data are often in very small sample sizes, and come with expansion factors for the purpose of expanding survey samples to total population. Survey expansion factors are usually derived from sampling design and individuals’ sociodemographic characteristics. Survey data can include detailed information on household, and individual’s social demographics and travel records self-reported by survey respondents. The Singapore HITS 2008 data include around 34000 individuals and their 1 day travel (such as departure, and arrival time for each trip, trip purpose, location information of the destination, etc.), besides social demographics of the individual and their household. In this study, we use the time and location information of the survey respondents’ travel, and expansion factors provided by the LTA to expand the sampled individuals to the whole population to compare with our analysis derived from the CDR data.
4. METHODOLOGY
Human daily travels are organized based on activities and anchor locations that are important in their daily life. From this point of view, the activity-based model— the state-of-the-art approach in transportation planning—considers travel demand as the derived needs to conduct activities [29]–[32]. To understand human mobility patterns at the metropolitan level for transportation and city planning purposes, in this study, we synthesize methods in previous research [22], [26], [27], and develop a pipeline (see Figure 2) of (1) parsing the CDR data to extract stay locations of phone users; (2) detecting phone users’ home location; (3) filtering users and select statistically representative samples from the parsed CDR data; (4) identifying the daily mobility networks of the phone users; (5) deriving expansion factors for the filtered phone observations by combining the preprocessed phone data and the census data; expanding phone-users, trips, and daily motifs; and aggregating them from tower to transportation analysis zones.
4.1 Parsing Trajectory to Extract Stays
Parsing the passive mobile phone CDR data to extract anchor points (the stay locations) of an individual’s daily travels and differentiate destinations from pass-by points is the first part in the pipeline that can lead to identifying individual’s mobility
networks. Zheng [21] presents a comprehensive overview on the research topic of the trajectory data mining. Inspired by the algorithm first introduced by Hariharan and Toyama [33] which was tested previously using triangulated mobile phone data [22], [27], we modified the algorithm for the tower-level CDR trajectories in this study. Other algorithms on stay point detection can also be found in the literature[34].
Three goals need to be achieved in the stay detection process. (1) Eliminating noises of the user’s geospatial location records in identifying his/her true location is important in extracting the user’s accurate stays. Two types of noises— outliers and signal jumps between towers—exist in the raw CDR data. We applied an outlier detection algorithm (based on the time intervals and distances between consecutive points) to eliminate noises. (2) In the time-stamped location sequence, we need to cluster points that are spatially close (within the threshold of d) and temporally adjacent (in the sequence ordering) into a single location, with a collapsed time duration inferred from this clustering (with either one or multiple locations) as the stay. (3) Since we are interested in the unique stay locations that a user visits daily to eventually form his/her mobility network, we need to agglomerate points that are spatially close but not necessarily adjacent in temporal consecutive sequence into one unique location. Considering a user i’s location recorded in the CDR in
sequence as 𝐷𝑖 = (𝑑𝑖(1), 𝑑𝑖(2), 𝑑𝑖(3), … , 𝑑𝑖(𝑛𝑖)), by selecting a roaming distance d1 (300 meters in this study) as the threshold, we heuristically cluster spatially close locations within d1 for each point into the medoid (which is the point in a set that minimizes the maximum distance to every other point in the set) and form a new sequence 𝐷′
𝑖 = (𝑑′𝑖(1), 𝑑′
𝑖(2), … , 𝑑′𝑖(𝑛′
𝑖) . Where 𝑑𝑖(𝑘) =(𝑡𝑜𝑤𝑒𝑟(𝑘), 𝑡(𝑘)) for 𝑘 = 1, … , 𝑛𝑖 , 𝑡𝑜𝑤𝑒𝑟(𝑘) and 𝑡(𝑘) are the tower id, and time stamp of the user i’s k-th observation in the raw CDR data. 𝑑′
𝑖(𝑔) = (𝑐𝑒𝑙𝑙𝑖𝑑(𝑔), t(g), dur(g)) includes the tower id, starting time of the first observed tower in the cluster, and the duration that the user stayed in the clustering.
Then further cluster the points in the trajectory sequence set 𝐷′𝑖 based on the distance threshold of d2 (300 meters for this study), and keep the points whose duration is greater than the time threshold t (10 minutes in this study) as the final stay points 𝑆𝑖 = (𝑠𝑖(1), 𝑠𝑖(2),..., 𝑠𝑖(𝑚𝑖)),
IEEE TRANSACTIONS ON BIG DATA, TBD-2015-12-0163 5
Figure 3 Stay point detection
d1
d7
d2d3 d5
d6
d4
d8
d9
(a)
s1s2
s3
(b)
where 𝑠𝑖(𝑚) = (𝑐𝑒𝑙𝑙𝑖𝑑(𝑚), t(m), dur(m)) . Using such a method, we eliminate the outliers in the clustering process. We present the input and output of the process in Figure 3 for demonstration.
4.2 Detecting Home
It is important to detect the phone user’s home location (tower) for several reasons. First, when we later expand phone users to population, we need to combine the CDR data with census data, in which population are measured by their residential location. Second, in order to form the mobility networks we make an assumption that for each day, an individual always departures from home, and returns to home by the end of the day. Although in the real world there are exceptions, this assumption simplifies the way that we can extract mobility networks from the CDR data and estimates trips in a justifiable way. Since CDR data passively records phone users’ spatiotemporal information, it does not always give complete information of an individual’s whereabouts. For example, a user may not use her/his phone at home for a particular day, but we can identify her/his home from the entire observation period. Third, for planning purposes, it is important to understand people’s mobility patterns from their residential location, as the built environment and land use of individuals’ residence influence their travel and activities [35], [36]. Being able to identify human mobility patterns associated with urban space will enable planners to target improvement for future urban development. A phone user’s home tower is identified as the most
frequently communicated tower during nights of weekdays, and the entire days of weekends over the study period (i.e., 14 days in this study).
Night time is defined from 7 pm to 7 am. Note that this definition of ‘night’ is a parameter that can be adjusted in different urban contexts. We select this time period based on the local life and culture in Singapore, where people have a relatively rigid work schedule. After processing the CDR data, we obtained 2.88 million
users whose home towers can be observed in the 2-week data. It counts for 91% of all phone users contained in the data for the study period, and around 56% of the total population. By properly expanding these users, we can disaggregate population from aggregated planning area level, to the neighborhood transportation analysis zone (MTZ) level with high spatial resolution. We discuss the population expansion method and results in Section 4.5.
4.3 Filtering Phone User-Day Samples
As discussed previously, CDR data are passive records of human footprints when their mobile phones communicate with cellular towers. Compared with traditional survey data, the advantage of the CDR data is its longer observation period (in this case, 14 days), and larger sample size (e.g. 63% population in this study); and its disadvantage is that not every phone user necessarily uses her/his phone at every destination that s/he visit, which means CDR data may not always reveal individuals travel as what travel dairy or GPS tracking application data can do. Therefore it is important to carefully select the sampled days when a phone user uses his/her mobile device frequently enough that we can use his/her parsed trajectory derived from the CDR data on that day as a proxy to the travel dairy data.
Previous research [26] has found that if a phone user’s phone communication activities can exceed certain threshold, the CDR data can be treated equivalently as survey data, and can generate results that are statistically consistent with travel dairy data in terms of individual mobility pattern. In this study, we adopt similar rules for sample filtering. Only keep a user-day observation, if a user has phone
communication activities in at least 8 of the 48 half-hour time slots in a day (24 hours).
Only keep the observations during the weekday, as mobility patterns can be different on weekdays and weekends. After the filtering, we keep 6.28 million user-days for 1.55
million users in the 10 weekday days of the two weeks. The total users after filtering are around 49% of the original users contained in the raw CDR data for this time period. We plot the frequency distribution of user-days per user after data filtering in Figure 4 (c). We can see that, after the filtering, for these 1.55 million users, 22% of them only have 1-day observation; 15% have 2-day; 13% have 3-day; 11% have 4-day; 10% have 5-day; 8% has 6-day; 7% has 7-day; and 3% has 10-day observations. On average, each user has around 4 weekday observations. This is a relatively good sampling rate— especially if we can have longer observation period, the number of user-days for each user will be longer, and information on the long term trend could be detected.
We summarize the user-day statistics at the tower level based on phone users’ home tower. We see in Figure 4 (e), (b) and (d), the distribution of the average and standard deviation of the number of user-days per user at the tower level. We plot the average number of user-day at the tower level in Figure 4 (a). We can see that in the downtown, the airport, and the west-end of the coastal area, the number of user-day per user is relatively low. Presumably, tourists and foreigners live in these areas. While in residential areas in the suburb, such as Ang Mo Kio, Bukit Batok, Jurong West, Punggol, Sengkang, Tampines, Yishun, and Woodlands, etc. the average numbers of user-days are relatively higher than average.

6 IEEE TRANSACTIONS ON BIG DATA, TBD-2015-12-0163
Figure 4 User-day statistics after sample filtering: (a) spatial distribution, frequency distribution of (b) mean number of day- and (e) standard deviation of day- observations at the tower level, (c) frequency distribution of total number of days for each user, and (d) density distribution of (b) and (e).
Figure 5 Examples of daily mobility networks (1a-1f) in daily travel surveys, (2a-2f) in abstract
4.4 Identifying Activity-Based Mobility Patterns
4.4.1 Daily Mobility Motifs
Human daily mobility can be highly structural—organized by a few activities essential to life. It is important to identify individual mobility networks (i.e., daily motifs) for urban and transportation planning purposes. The most contemporary travel demand models developed and employed by regional transportation agencies are the activity-based approach, and self-reported survey are employed in collecting information on individuals’ socio-demographics, their daily activity purposes, time, and location. Readers can refer to the comprehensive TRB report [32] for more detailed explanation on activity-based travel demand models used in the transportation planning filed.
Figure 5 (1a-1f) show some examples of individual activity pattern structure (daily tours) commonly observed in travel surveys and represented in the transportation modeling language. They are categorized as (1a) 1 home-based work tour; (1b) 1 home-based work tour with a third destination, and work as the primary destination; (1c) 1 home-based work tour with 1 home-based sub-tour; (1d) 2 home-based work tours with a third destination; (1e) 1 home-based work tour with 1 work-based sub-tour; and (1f) 1 home-based work tour with 1 escort
tour (to drop off and pick up somebody). These activity pattern structures can go into numerous combinations; however, if we use a more abstract diagram to represent these activity-chains, they can be reduced into daily motifs that can be captured by the massive and passive mobile phone data. Figure 5 (2a-2f) represent the real world activity pattern structure of (1a-1f) in a highly abstract format, which are called daily motifs. These daily motifs have been proposed and tested as measures of human mobility in previous studies for Paris, Chicago and Boston [26], [27], and have been found comparable to travel survey in aggregate statistics.
Here, we present the algorithm to identify the daily motifs for the filtered phone users whose mobile phone records in a sampled day are frequent enough (explained in Section 4.3) for representing their daily activity pattern. Formally speaking, a motif is an equivalence class of directed graphs. A directed graph is an ordered pair 𝐷 = (𝑉, 𝐴) where V is the set of nodes (or vertices), and A is a set of ordered pairs of nodes (i.e., directed edges). Without loss of generality, when V is a set of n elements, we take V to be the set 𝑉𝑛 ≜ {1,2, … , 𝑛}. Let 𝕯𝑛 be the set of directed graphs with n nodes, i.e., 𝕯𝑛 ≜ {𝐷𝑛|𝐷𝑛 =(𝑉𝑛 , 𝐴), 𝐴 ⊆ 𝑉𝑛 × 𝑉𝑛}. For any mapping 𝑓: 𝑉𝑛 → 𝑉𝑛 , it induces a mapping (𝑓 × 𝑓): 𝑉𝑛 × 𝑉𝑛 → 𝑉𝑛 × 𝑉𝑛 such that (𝑓 × 𝑓)((𝑎, 𝑏)) =(𝑓(𝑎), 𝑓(𝑏)). Then an equivalence relation ~ on 𝕯𝑛 is defined as follows: 𝐷𝑛 = (𝑉𝑛 , 𝐴)~𝐷𝑛
′ = (𝑉𝑛 , 𝐴′) if and only if there exists a bijection 𝑓: 𝑉𝑛 ↣ 𝑉𝑛 such that (𝑓 × 𝑓)(𝐴) = 𝐴′ . Intuitively speaking, 𝐷𝑛~𝐷𝑛
′ if the “graphs” of 𝐷𝑛 and 𝐷𝑛′ appear the same
when the labelling of nodes is ignored. Thus, a motif [𝐷𝑛] (i.e., the equivalence class of 𝐷𝑛) can be visualized by 𝐷𝑛.
With the extracted stay locations, including observed and potential stay locations (described in Section 4.1), users’ identified home location (discussed in Section 4.2), we will be able to identify the mobility networks as illustrated in Figure 5 (2a-2f). We find that not all users necessarily have the first stay-point (or potential stay-point) starting from their home tower, or the last stay point (or potential stay-point) ending at their home tower every day in the filtered trajectory, due to the passive nature of the CDR data. In order to form a complete tour for each user, we make the assumption that, if a user travels in a day, s/he starts the first trip from, and ends the last trip at home. From the extracted stay points and filtered day(s), we
obtain a sequence of destinations on the sampled day k, for a given anonymous user i, denoted by 𝑆𝑖𝑘 = (𝑠𝑖𝑘(1), 𝑠𝑖𝑘(2),..., 𝑠𝑖𝑘(𝑚𝑖𝑘)).
User i’s home ℎ𝑖 was detected in previous step. Always check if for day k, user i’s first and last activity
locations are ℎ𝑖. If not, we add home ℎ𝑖 to the stay point
IEEE TRANSACTIONS ON BIG DATA, TBD-2015-12-0163 7
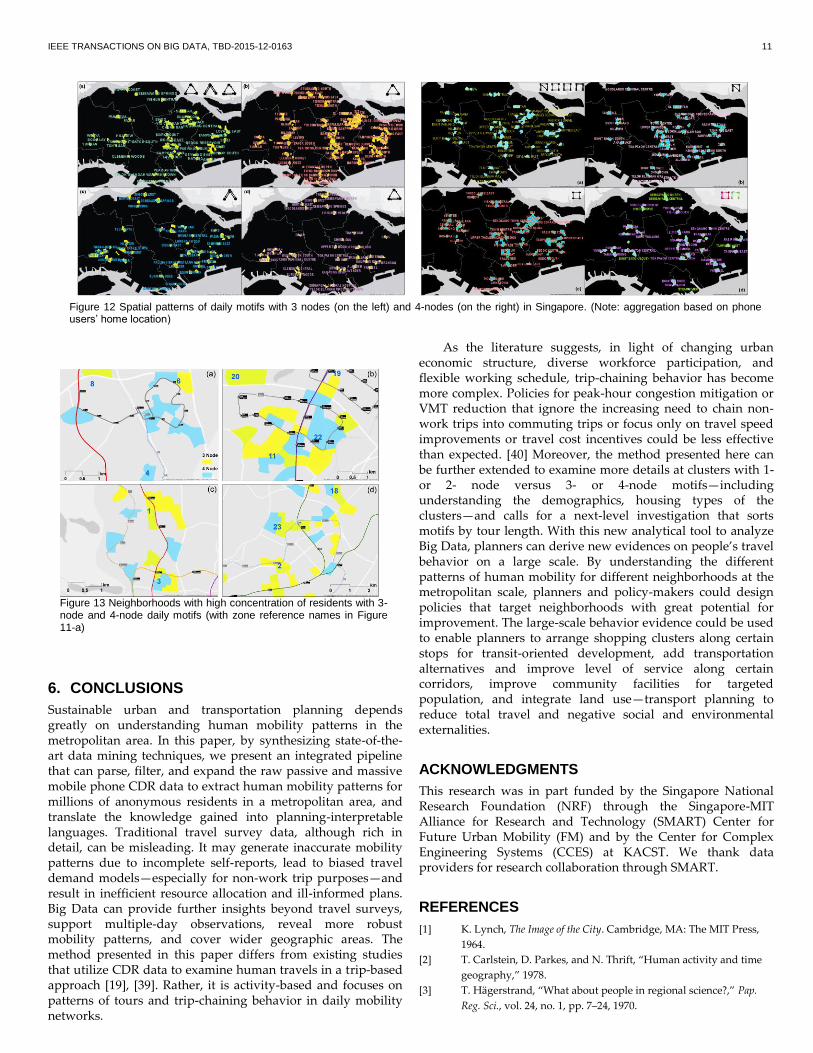
Figure 6 Frequency distribution of (a) total no. of phone usages for filtered users, (b) weekday daily no. of trips for filtered user-day samples by user group, and (c) weekday daily no. of unique locations for filtered user-day samples by user group.
sequence, which forms a new sequence 𝑆𝑖𝑘′ = ( 𝑠𝑖𝑘
′ (1) , 𝑠𝑖𝑘
′ (2),..., 𝑠𝑖𝑘′ (𝑚𝑖𝑘
′ )). Count the total number of trips, 𝑙𝑖𝑘, for user i on day k. Count the total number of distinct nodes, 𝑛𝑖𝑘 , from
trajectory 𝑆𝑖𝑘′ .
Form a network (directed graph) 𝐷𝑖𝑘 with 𝑛𝑖𝑘 nodes: using an 𝑛𝑖𝑘 × 𝑛𝑖𝑘 matrix 𝑀𝑖𝑘 , we represent the mobility network for user i on day k. If there is at least one trip from node o to node d, 𝑀𝑖𝑘(𝑜, 𝑑) = 1 ; otherwise, 𝑀𝑖𝑘(𝑜, 𝑑) = 0.
Obtain the motif [𝐷𝑖𝑘], i.e., the equivalence class of 𝐷𝑖𝑘.
4.4.2 Mobile Phone Usage Patterns and Mobility Patterns
After filtering the user-day samples, it is important to verify that “users with more phone usage events do not have systematic differences in travel behavior”. To this end, we examine the relationship between the filtered users’ cell phone usage patterns and their daily travel patterns. Figure 6 (a) presents the frequency distribution of total number of phone usage observations for all the 1.55 million filtered users in the 10 weekday days. The 5th, 20th, 40th, 60th, 80th, and 95th percentiles of the total phone usages during this period for all the filtered users are 140, 262, 420, 650, 1108, and 2558, respectively. Based on this information, we group the filtered users into 5 groups, with total phone usage observations of [100, 200), [200, 400), [400, 600), [600, 1000), and [1000, 2500). We examine the filtered users’ daily travel patterns, including daily number of trips, and daily number of unique destinations for each of the groups. Figure 6 (b) shows that for these 5 groups of filtered users, the frequency distributions of their daily number of trips are quite similar across the groups. Similarly, Figure 6 (c) shows that the frequency distributions of daily number of unique locations visited by the filtered users of various groups also follow similar patterns.
It indicates that phone users with different phone usage patterns do not have systematic differences in travel behavior. This verification is critical to the validity of using active cell phone user-day samples to further examine human daily mobility patterns, and use these samples to expand to the population.
4.5 Expanding Phone Sample to Population
To derive estimates of trips and daily mobility patterns (motifs), and robust spatial patterns for the population in the metropolitan area, and informative for city planning and transportation planning, we need to expand the phone samples (including users and user-days) properly. In this section, we describe the process in generating the expansion factors for the phone observations.
4.5.1 Expansion Factors
Two types of expansion factors are generated, including (1) user expansion factor, and (2) user-day expansion factor. Figure 7 presents the entity relationship diagram useful in generating these expansion factors. After detecting phone users’ home tower, we store the users’ information in a database table ‘user’, with their anonymized id number that is unique to each user. Home towers of 2.88 million users were detected. We store the mobility patterns of the filtered users who had frequent phone communication activities (in at least 8 half-hour time slots in a day) in the table ‘user_day_motif’, in which each row represents a unique user-day observation, with user id, motif id, and number of trip information. 6.28 million user-day records are included in this table for 1.55 million unique users whose home tower information can be found in the ‘user’ table. The rest of the 1.33 million users, who are in the ‘user’ table but not in the ‘user_day_motif’ table, are those whose phone communication activities are not enough such that their trajectories revealed by their phone records can be treated similar to what the self-reported travel diary may reveal.
As exhibited in Figure 7, the ‘user’ table is linked to the ‘cell_tower’ table through the cell_tower_id of the users’ home_tower_id. By the spatial operation of joining cell towers to the MTZ zones that they fall into, each cell tower is associated with an MTZ. For those towers which are not contained in any MTZs, the nearest MTZ within a 200 meter distance is used to allow for the measurement error in spatial representation of zone and tower location. The ‘cell_tower’ table is linked to the ‘mtz_taz’ table (through mtz_id), which is then linked to the ‘planning_area’ table (through dgp_id), including 56 DGP zones of which 35 contain residential population.
Two sets of expansion factors are considered. One includes the user expansion factors calculated for the 2.88 million users with identifiable home location; the other includes user expansion factors for the 1.55 million users and the user-day expansion factors for the 6.28 million user-day observations (from the 1.55 million users). For the former case, the user expansion factor for every user with home towers in the same planning area is the same. For the latter case, as each user may have observations for more than one day, we normalize the expansion factor by the total number of observation-days for this user. We define the user expansion factor
𝑖 for user 𝑖, and
the user-day expansion factor 𝑖𝑘 for user 𝑖 on day k as follows.
𝑖= 𝑃𝑔/ ∑ 𝑈ℎ𝑔
𝑄𝑔
1 , for user i with a home tower ℎ𝑔. Where 𝑃𝑔 is the population (above 10 years old) in DGP zone g reported in the census; 𝑈ℎ𝑔
is the total number of users whose home tower is at ℎ𝑔 in DGP zone g, and 𝑄𝑔 is the total number of towers in zone g;
𝑖𝑘 = 𝑖/𝐾𝑖, where K𝑖 is the total number of days when the
user i’s motifs are identified.

8 IEEE TRANSACTIONS ON BIG DATA, TBD-2015-12-0163
Figure 7 Entity relation diagram of the processed phone user, user-day mobility data from CDR, and geographic spatial units: towers, transportation analysis zones (MTZs), planning area (DGPs) with census population.
Figure 9 (a) Residential population density estimates at the MTZ level; (b) comparison of population estimation from the sample with all users with detected home (a.k.a. Estimation 1), and filtered users with complete motility networks (a.k.a., Estimation 2) at the tower level, and (c) at the MTZ level.
In Figure 8 (a) we present the spatial distribution of the user expansion factors at the tower level across Singapore, color coded by categories in different standard deviation of the expansion factor. We can see that the user expansion factors are higher in the north part of Singapore, meaning that phone user to the population ratio in this region is lower than the city average. However, when looking at Figure 4 we see that for an average phone user in this north region, s/he tends to have relatively more days of observations. In the central region, the user-expansion factors are lower, meaning that the phone user to population ratio in this region is higher than the city average. Figure 8 (b) and (c) present the frequency distribution of user expansion factors (for the 1.55 million phone users) and user-day expansion factors (for the 6.28 million user-day observations), respectively.
4.5.2 Population Estimation in High Resolution
With the estimated expansion factor for each phone user in the study, we can then estimate population with high spatial resolution that are not available in the census statistics but are useful for the transportation and urban planning. Figure 9 (a) presents the estimated residential population density (for people older than 10 years old) in Singapore at the MTZ level (with more than 1100 zones) by using the phone CDR data. To compare the population estimates from users who only have home location detected (denoted as Estimation 1), with the estimates from the filtered user whose mobility patterns can be identified (denoted as Estimation 2), we plot the two population estimates at the tower level, and at the MTZ level in Figure 9 (b) and (c) respectively. We can see that with proper treatment of expension, by only using the frequent user-observations (albeit it has a smaller sample size), it can provide comparable estimates to that by using all user samples whose home location can be detected without restricting their phone usage frequency observations.
The benefit of using the filtered phone users based on their frequency of phone communication is that we can mine richer mobility patterns from their records, and treat these observations as travel survey in a much larger scale, to inform sound city planning and make wiser decisions on public policies related to urban and transportation development.
4.5.3 Aggregating Daily Trips and Mobility Patterns
After applying the expansion factors to the user-day observations, we aggregate the daily trips and mobility patterns to Singapore residents (above 10 years old) at the metropolitan level, and inferred human mobility patterns for Singapore. Figure 10 presents the inferred frequency distribution of (a) daily mobility patterns, (b) the number of
Figure 8 (a) Spatial distribution of user-expansion factors at the tower level, and frequency distribution of (b) user-expansion factors, and (c) user-day expansion factors.

IEEE TRANSACTIONS ON BIG DATA, TBD-2015-12-0163 9
Figure 10 (a) Daily motifs derived from CDR and survey data, and (b) frequency distribution of daily trips, and (c) activity destinations from CDR data.
daily trips, and (c) the number of unique daily destinations that phone user visited during weekday. Figure 10 (a) also compares the results obtained from the phone data with the estimates from the HITS travel survey data. From the phone data, we find that on an average weekday, 13.5% Singapore residents stayed at home, 33% visited 2 queue places, 30% 3 places, 14% 4 places, 5.5% 5 places, 2.1% 6 places, and less than 2% visited more than 6 places. These patterns cover around 90% of survey respondents’ travel.
When comparing the estimates of daily motifs with survey data, in Figure 10 (a) we find that the motif with 2-nodes reported in the survey is dominant (55%), and much higher than those observed from the phone data. We find the following reasons for explanation. (1) The HITS survey only asks for motorized travel, and excludes non-motorized travel. (2) People tend to underreport their secondary destinations to the primary destinations in the survey than the phone could detect. If we refer to travel survey data in other metropolitan areas such as Chicago, Boston, and Paris, we found that the 2-node travel patterns are always less than 40% [27][26].
A separate study [37] that uses smart phone based survey to track and record individual users’ travels and activities in Singapore conducted by the Future Mobility Survey (FMS) project confirms similar observation. Even though the FMS project only has 387 individuals who answered both the paper-based survey and validated their travel in the smart-phone app based tracking survey, it is found that people significantly under report their travel in the paper-based survey. 76.3% people in the paper-based survey reported 2 trips, while only 20% were detected and verified that they had 2 trips in the smartphone based survey. Therefore, the mobility patterns inferred from the phone CDR data here can be more reasonable than the travel survey data. This difference will have a significant impact on policy implications for urban and transportation planning.
5. SPATIAL PATTERNS OF ACTIVITY-BASED HUMAN MOBILITY
Understanding the spatial patterns of human mobility aggregated at their home location is especially important to help planners understand how their neighborhood and/or the built environment may influence their travel. A vast body of literature in planning [38] has tried to test this theory empirically using traditional travel survey data. With the method presented in this study, we can derive new evidences on people’s travel behavior in a large scale, and facilitate planners and policy makers to identify areas with great potential for improvement, such as provision of transportation alternatives to reduce motorized travel, improvement of community facilities to targeted population. In this section, we present analytical indicators to measure the spatial distribution of the mobility patterns from the perspective of individuals’ home location.
5.1 The 2-node Home-based Tour
Figure 11-b presents the population density of residents with only 2-node motifs. These residents had 1 place besides ‘home’ that are important in their daily life. It could be workplace for workers, school for students, or a social/recreational place for the non-workers/non students. Since they are the majority of the population (around 33%, see Figure 10-a), the spatial distribution of the group with 2-node motifs is very similar to the spatial distribution of total population (shown in Figure 9-a).
We use the concept of Location Quotient, to compare an area's distribution of residents by mobility type to the distribution of a reference area (i.e. the Singapore metropolitan area). To be more specific, for example, to measure how residents with daily motif m are concentrated in a particular neighborhood (at the MTZ level) compared to the population in the metropolitan area, we use the Location Quotient (LQm), detailed as follows. LQ𝑚 = (𝑒𝑚/𝑒)/(𝐸𝑚/𝐸) , where 𝑒𝑚 is the residential
population with daily motif type m (Figure 9-a) in a zone (e.g., MTZ); 𝑒 is the total residential population in zone; 𝐸𝑚 is residential population with daily motif type m in the metropolitan area (Singapore); 𝐸 is the total residential population in the metropolitan area. From Figure 11 (a) and (c), we can see that several
suburban neighborhoods have a unique identity with a greater than metropolitan average share of residents whose daily mobility networks are of 2 nodes. These areas include zones in the West region, such as Jurong East, Jurong West, Clementi, Bukit Batok, Choa Chu Kang; zones in the North-West region, including Woodlands, Sembawang, and Yishun; zones in the North-East region such as An Mo Kio, Sengkang, and Punggol; and zones in Bedok of the East region (see Figure 11-a for zone name references). People who only visit 1 other place besides their home (for work/school as the majority) are overly concentrated in these zones, which are new towns and far away from the city center. It would be potentially important to provide public transportation services with high capacity and frequency during the peak-hour to relieve congestion for residents in these neighborhoods. Meantime it is also important to plan more localized economic and community services in these neighborhoods to help

10 IEEE TRANSACTIONS ON BIG DATA, TBD-2015-12-0163
Figure 11 Highly concentrated areas with residents of (c) 2-node, (d) 1-node (stay-at-home), (e) 3-node, (f) 4-node, and (a) overlay of 2-node, 3-node, and 4-node mobility networks; and (b) population density of residents with 2-node motifs. (Note: aggregation based on phone users’ home location)
reduce long distance travel for the needs of additional activities.
5.2 The 1-node, 3-node and 4-node Motifs
As the 2-node home-based tour pattern (Type 2 in Figure 10) is the majority of mobility patterns in the metropolitan area, we also use it as a reference, and compare other types of mobility patterns to the spatial distribution of the 2-node this pattern, and we call it the Relative Location Quotient, 𝑅𝐿𝑄𝑑 =(𝐿𝑄𝑑)/𝐿𝑄2, for motif type d. Figure 11 (d-f) highlight MTZs that have high concentration of stay-at-home residents, and residents with 3-node, and 4-node in their daily activity motifs.
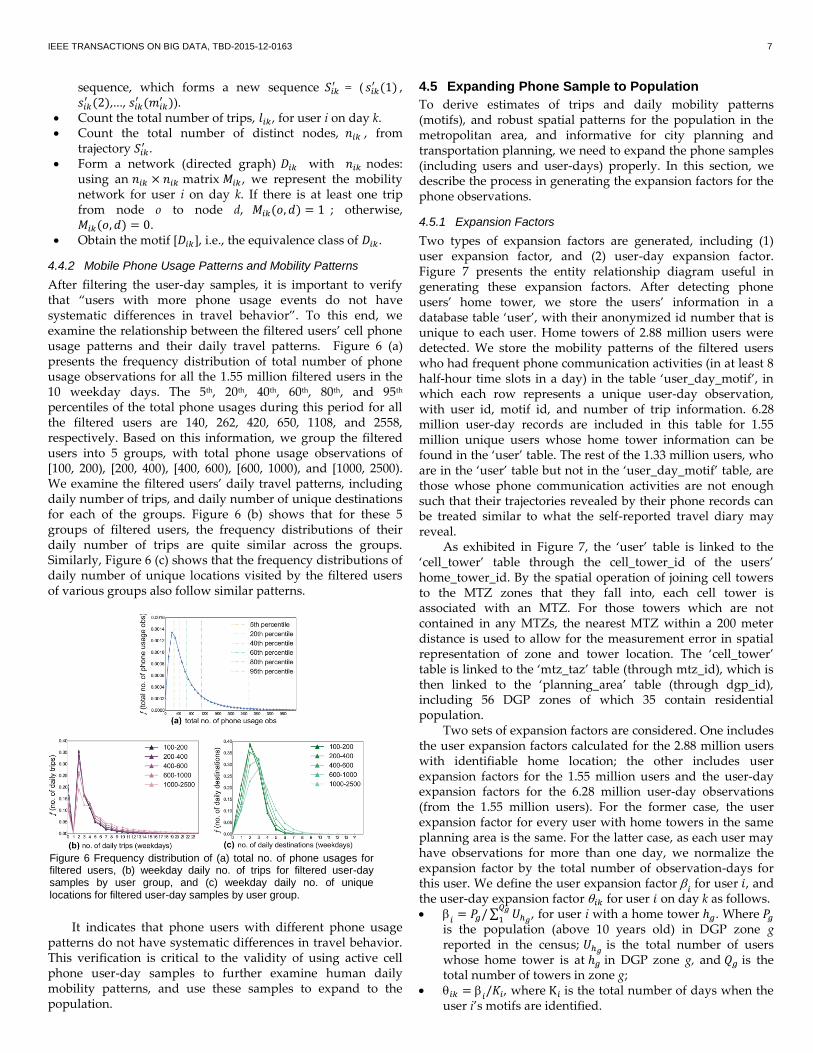
Figure 11 (e) and (f) collapse the spatial distribution of the different motifs with 3-node, and with 4-node into one map. For detailed spatial distribution for each of the distinct motifs with 3-node and 4-node, please referrer to Figure 12. Figure 11 only shows areas with population (for the corresponding type of motif) greater than 500 persons, and population density (for the corresponding type of motif) higher than 1500 person per sq km. We also only show areas that their Location Quotient, and Relative Location Quotient (to 2-node) exceed 1.05 (to allow for 5% error), to illustrate the highly concentrated areas with the corresponding types of daily motifs for residents living in the zones. Figure 11 (a) overlays the highly concentrated zones of residents with 2-node, 3-node, and 4-node in different colors, and illustrates the overall patterns of mobility of Singapore residents. We can see that weekday stay-at-home residents are highly concentrated
in zones in the Central region and along the east coast, and in zones of the North-west region, and some areas in the West region. In the Central region, it contains more mature neighborhoods where senior residents have higher probability to reside.
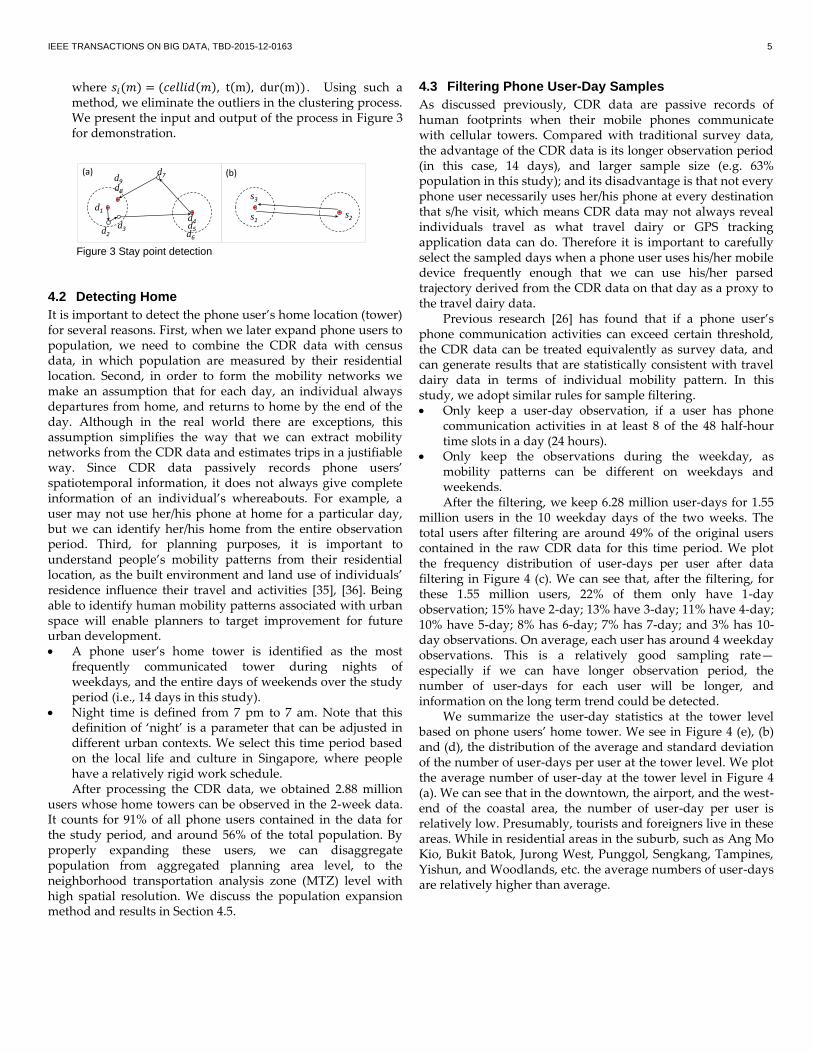
Figure 13 zooms into the neighborhoods containing highly concentrated residents with 3- and 4-node motifs demonstrated in Figure 11 (a). We can see that these area include suburbs that are connected by light rail (grey lines in the figure) to the major transit lines, such as Bukit Panjang, and Bukit Bakok in the West region (Figure 13-a), and Sengkang in the North-East region (Figure 13-b), where accessibility are relatively low. It also includes areas that are currently not served by the MRT, such as Lentor, Mayflower, Bright Hill and Upper Thomason, in Ang Mo Kio and Bishan (Figure 13-c), and neighborhoods in the north part of Bedok and Tempines (Figure 13-d). Neighborhoods that have higher concentration of residents of 3- and 4-node motifs usually have more trips. By providing more convenient public transportation serveries, improved level of services (e.g. for the light rail), and alternative transportation modes can help reduce total travel. It’s worth noting that in some areas, the Singapore LTA has provided plans to improve transit network (and some of them are under construction as depicted in grey dashed line in Figure 13-c and d).
IEEE TRANSACTIONS ON BIG DATA, TBD-2015-12-0163 11
Figure 13 Neighborhoods with high concentration of residents with 3-node and 4-node daily motifs (with zone reference names in Figure 11-a)
Figure 12 Spatial patterns of daily motifs with 3 nodes (on the left) and 4-nodes (on the right) in Singapore. (Note: aggregation based on phone users’ home location)
6. CONCLUSIONS
Sustainable urban and transportation planning depends greatly on understanding human mobility patterns in the metropolitan area. In this paper, by synthesizing state-of-the-art data mining techniques, we present an integrated pipeline that can parse, filter, and expand the raw passive and massive mobile phone CDR data to extract human mobility patterns for millions of anonymous residents in a metropolitan area, and translate the knowledge gained into planning-interpretable languages. Traditional travel survey data, although rich in detail, can be misleading. It may generate inaccurate mobility patterns due to incomplete self-reports, lead to biased travel demand models—especially for non-work trip purposes—and result in inefficient resource allocation and ill-informed plans. Big Data can provide further insights beyond travel surveys, support multiple-day observations, reveal more robust mobility patterns, and cover wider geographic areas. The method presented in this paper differs from existing studies that utilize CDR data to examine human travels in a trip-based approach [19], [39]. Rather, it is activity-based and focuses on patterns of tours and trip-chaining behavior in daily mobility networks.
As the literature suggests, in light of changing urban economic structure, diverse workforce participation, and flexible working schedule, trip-chaining behavior has become more complex. Policies for peak-hour congestion mitigation or VMT reduction that ignore the increasing need to chain non-work trips into commuting trips or focus only on travel speed improvements or travel cost incentives could be less effective than expected. [40] Moreover, the method presented here can be further extended to examine more details at clusters with 1- or 2- node versus 3- or 4-node motifs—including understanding the demographics, housing types of the clusters—and calls for a next-level investigation that sorts motifs by tour length. With this new analytical tool to analyze Big Data, planners can derive new evidences on people’s travel behavior on a large scale. By understanding the different patterns of human mobility for different neighborhoods at the metropolitan scale, planners and policy-makers could design policies that target neighborhoods with great potential for improvement. The large-scale behavior evidence could be used to enable planners to arrange shopping clusters along certain stops for transit-oriented development, add transportation alternatives and improve level of service along certain corridors, improve community facilities for targeted population, and integrate land use—transport planning to reduce total travel and negative social and environmental externalities.
ACKNOWLEDGMENTS
This research was in part funded by the Singapore National Research Foundation (NRF) through the Singapore-MIT Alliance for Research and Technology (SMART) Center for Future Urban Mobility (FM) and by the Center for Complex Engineering Systems (CCES) at KACST. We thank data providers for research collaboration through SMART.
REFERENCES
[1] K. Lynch, The Image of the City. Cambridge, MA: The MIT Press,
1964.
[2] T. Carlstein, D. Parkes, and N. Thrift, “Human activity and time
geography,” 1978.
[3] T. Hägerstrand, “What about people in regional science?,” Pap.
Reg. Sci., vol. 24, no. 1, pp. 7–24, 1970.

12 IEEE TRANSACTIONS ON BIG DATA, TBD-2015-12-0163
[4] S. Jiang, J. Ferreira, and M. C. González, “Clustering daily
patterns of human activities in the city,” Data Min. Knowl. Discov.,
vol. 25, no. 3, pp. 478–510, Apr. 2012.
[5] M. Batty, “Cities as Complex Systems: Scaling, Interactions,
Networks, Dynamics and Urban Morphologies,” in Encyclopedia of
Complexity and Systems Science, vol. 1, R. Meyers, Ed. Berlin, DE:
Springer, 2009, pp. 1041–1071.
[6] “Data for Development (D4D) Challenge.” [Online]. Available:
http://d4d.orange.com/en/Accueil.
[7] J. Wakefield, “Mobile phone data redraws bus routes in Africa,”
BBC, 01-May-2013.
[8] E. Cho, S. A. Myers, and J. Leskovec, “Friendship and mobility:
user movement in location-based social networks,” in Proceedings
of the 17th ACM SIGKDD international conference on Knowledge
discovery and data mining, 2011, pp. 1082–1090.
[9] Y. Zheng, L. Capra, O. Wolfson, and H. Yang, “Urban Computing,”
ACM Trans. Intell. Syst. Technol., vol. 5, no. 3, pp. 1–55, Sep. 2014.
[10] M. Batty, The New Science of Cities. MIT Press, 2013.
[11] E. Arcaute, E. Hatna, P. Ferguson, H. Youn, A. Johansson, and M.
Batty, “Constructing cities, deconstructing scaling laws,” J. R. Soc.
Interface, vol. 12, no. 102, 2014.
[12] N. Caceres, J. P. Wideberg, and F. G. Benitez, “Deriving origin
destination data from a mobile phone network,” Intell. Transp.
Syst. IET, vol. 1, no. 1, pp. 15–26, 2007.
[13] F. Simini, M. C. González, A. Maritan, and A.-L. Barabási, “A
universal model for mobility and migration patterns,” Nature, vol.
484, no. 7392, pp. 96–100, 2012.
[14] M. C. González, C. A. Hidalgo, and A.-L. Barabási,
“Understanding individual human mobility patterns,” Nature, vol.
453, no. 7196, pp. 779–782, Jun. 2008.
[15] C. Song, T. Koren, P. Wang, and A.-L. Barabasi, “Modelling the
scaling properties of human mobility,” Nat Phys, vol. 6, no. 10, pp.
818–823, 2010.
[16] C. Song, Z. Qu, N. Blumm, and A.-L. Barabási, “Limits of
predictability in human mobility.,” Science, vol. 327, no. 5968, pp.
1018–1021, 2010.
[17] L. Pappalardo, F. Simini, S. Rinzivillo, D. Pedreschi, F. Giannotti,
and A.-L. Barabási, “Returners and explorers dichotomy in
human mobility,” Nat. Commun., vol. 6, 2015.
[18] V. W. Zheng, Y. Zheng, X. Xie, and Q. Yang, “Collaborative
location and activity recommendations with GPS history data,”
Proc. 19th Int. Conf. World wide web - WWW ’10, p. 1029, 2010.
[19] P. Wang, T. Hunter, A. M. Bayen, K. Schechtner, and M. C.
González, “Understanding road usage patterns in urban areas.,”
in Scientific reports, 2012, vol. 2, p. 1001.
[20] M. S. Iqbal, C. F. Choudhury, P. Wang, and M. C. González,
“Development of origin–destination matrices using mobile phone
call data,” Transp. Res. Part C Emerg. Technol., vol. 40, pp. 63–74,
Mar. 2014.
[21] Y. Zheng, “Trajectory Data Mining: An Overview,” ACM Trans.
Intell. Syst. Technol., vol. 6, no. 3, pp. 29:1–29:41, May 2015.
[22] L. Alexander, S. Jiang, M. Murga, and M. C. González, “Origin–
destination trips by purpose and time of day inferred from mobile
phone data,” Transp. Res. Part C Emerg. Technol., vol. 58, pp. 240–
250, Sep. 2015.
[23] S. Çolak, L. P. Alexander, B. G. Alvim, S. R. Mehndiretta, and M.
C. Gonzalez, “Analyzing Cell Phone Location Data for Urban
Travel: Current Methods, Limitations and Opportunities,” in TRB
2015 Annual meeting, 2015, no. 15–5279, pp. 1–17.
[24] J. L. Toole, S. Colak, B. Sturt, L. Alexander, A. Evsukoff, and M. C.
González, “The path most traveled: Travel demand estimation
using big data resources,” Transp. Res. Part C Emerg. Technol., May
2015.
[25] R. Milo, S. Shen-Orr, S. Itzkovitz, N. Kashtan, D. Chklovskii, and
U. Alon, “Network motifs: simple building blocks of complex
networks.,” Science, vol. 298, no. 5594, pp. 824–827, Oct. 2002.
[26] C. M. Schneider, V. Belik, T. Couronné, Z. Smoreda, and M. C.
González, “Unravelling daily human mobility motifs.,” J. R. Soc.
Interface, vol. 10, no. 84, p. 20130246, Jul. 2013.
[27] S. Jiang, G. a Fiore, Y. Yang, J. Ferreira, E. Frazzoli, and M. C.
González, “A review of urban computing for mobile phone traces,”
in Proceedings of the 2nd ACM SIGKDD International Workshop on
Urban Computing - UrbComp ’13, 2013, p. 1.
[28] P. Widhalm, Y. Yang, M. Ulm, S. Athavale, and M. C. González,
“Discovering urban activity patterns in cell phone data,”
Transportation (Amst)., vol. 42, no. 4, pp. 597–623, Jul. 2015.
[29] M. A. Bradley, J. L. Bowman, and B. Griesenbeck, “Development
and application of the SACSIM activity-based model system,” in
11th World Conference on Transport Research, 2007.
[30] J. Hao, M. Hatzopoulou, and E. Miller, “Integrating an Activity-
Based Travel Demand Model with Dynamic Traffic Assignment
and Emission Models,” Transp. Res. Rec. J. Transp. Res. Board, vol.
2176, no. -1, pp. 1–13, 2010.
[31] A. R. Pinjari and C. R. Bhat, “Activity-based travel demand
analysis,” A Handb. Transp. Econ., no. 1, pp. 1–36, 2011.
[32] Transportation Research Board, “Activity-Based Travel Demand
Models: A Primer,” 2015.
[33] R. Hariharan and K. Toyama, “Project Lachesis: parsing and
modeling location histories,” Geogr. Inf. Sci., pp. 106–124, 2004.
[34] C.-C. Hung and W.-C. Peng, “A regression-based approach for
mining user movement patterns from random sample data,” Data
Knowl. Eng., vol. 70, no. 1, pp. 1–20, 2011.
[35] R. Cervero and J. Murakami, “Effects of built environments on
vehicle miles traveled: evidence from 370 US urbanized areas,”
Environ. Plan. A, vol. 42, no. 2, pp. 400–418, 2010.
[36] P. C. Zegras, “The influence of land use on travel behaviour:
Empirical evidence from Santiago de Chile,” TRB Annu. Meet. CD
ROM, vol. 1898, no. January, pp. 1–15, 2004.
[37] C. Carrion, F. Pereira, R. Ball, F. Zhao, Y. Kim, K. Nawarathne, N.
Zheng, C. Zegras, and M. Ben-Akiva, “Evaluating fms: A
preliminary comparison with a traditional travel survey,” 2014.
[38] R. Ewing and R. Cervero, “Travel and the Built Environment: A
Synthesis,” Transp. Res. Rec., vol. 1780, no. 1, pp. 87–114, 2001.
[39] J. L. Toole, S. Colak, F. Alhasoun, A. Evsukoff, and M. C.
Gonzalez, “The path most travelled: Mining road usage patterns
from massive call data,” arXiv Prepr. arXiv1403.0636, 2014.
[40] R. Wang, “The stops made by commuters: evidence from the 2009
US National Household Travel Survey,” J. Transp. Geogr., Dec.
2014.

IEEE TRANSACTIONS ON BIG DATA, TBD-2015-12-0163 13
Shan Jiang Dr. Jiang received her dual Bachelor's
degree in Urban Planning and Economics from Peking
University in 2006, dual Master's degree in City
Planning and Transportation from MIT in 2009, and a
PhD in Urban and Regional Planning from MIT in 2015.
She is currently a Postdoctoral Associate in the
Department of Civil and Environmental Engineering at
MIT. Her research interests lie in the fields of urban spatial analytics,
geographic information systems, and the use of information and
communication technology and Big Data in urban planning and
transportation planning. Her work has been published in the Computers,
Environment and Urban Systems, Transportation Research Part C:
Emerging Technologies, Data Mining and Knowledge Discovery,
Proceedings of the ACM SIGKDD International Workshop on Urban
Computing, International Journal on Advances in Intelligent Systems, and
Transportation Research Record, among others.
Joseph Ferreira, Jr. Professor Ferreira was the
founding director of the Planning Department's
Computer Resource Lab and is now head of Urban
Information Systems in the Department of Urban
Studies and Planning at MIT. Both Prof. Ferreira's
undergraduate degree (in electrical engineering) and
his PhD degree (in operations research) are from MIT. He teaches
analytical methods and computer-based modeling for planning and urban
management including courses involving extensive use of geographic
information systems (GIS) and database management. His research uses
GIS and interactive spatial analysis tools to model land use, transportation,
and environmental interactions and to build sustainable information
infrastructures for supporting urban and regional planning. He is a past-
president of the Urban and Regional Information Systems Association
(URISA) and has been principal investigator of numerous research projects
studying job-housing balance, urban performance measures, and urban
information infrastructure. His current research includes the Future Urban
Mobility project within the Singapore/MIT Alliance for Research and
Technology where he is the SMART Research Professor of Urban
Information Systems.
Marta C. González Professor González got her
Licentiate in physics from Universidad Simon Bolivar
in 1999, Magister Sc. in physics from Central University
of Venezuela in 2001, and Ph.D. in physics (Dr. rer. nat)
from Stuttgart Univarsität in 2006. She is an Associate
Professor in the Department of Civil and
Environmental Engineering at MIT. She works in the area of urban
computing, with a focus on the intersections of people with the built
environment and their social networks. She has more than 60 publications,
and her work has been published in Nature, Science, Nature Physics,
Physics A, Journal of the Royal Society Interface, Physical Review Letters,
Scientific Reports, Transportation Research Part C: Emerging Technologies,
Data Mining and Knowledge Discovery, among many others. Prof.
González has injected new tools into transportation research and is a leader
in the emergent field of urban computing. Her ultimate research goal is to
design urban mobility solutions and to enable the sustainable development
of smart cities.