Universal Handheld Devices (UHD) based on Embedded Intel Atom™

Teachers Teaching with Technology™
Activities with Handheld Technology
Classroom resources for teaching and learning mathematics at 11-16, with the TI-83 or TI-84 family of graphics calculators

Teachers Teaching with Technology™
Contents
Activity 1: There and back again Inverse operations Level 5 Activity 2: Round and round Circles and coordinates Level 5 Activity 3: Prime time Exploring divisibility Level 3/4 Activity 4: Drawing shapes Use of coordinates for drawing Level 5/6 Activity 5: Y=MX+C Graphs of linear functions Level 6 Activity 6: Trig ratios Sine, cosine and tangent Level 8 Activity 7: Substitution Substitute in linear expressions Level 5 Activity 8: Ball bounce Distance time graphs with the CBR Level 6+ Activity 9: Coins, marbles and dice Probability from experimental data Level 7 Activity 10: Cumulative frequency Median and IQR for grouped data Level 8
About the activities
These ten activities have been written for teachers by teachers. Each one suggests an activity that uses handheld technology to teach topics that are central to the National Curriculum. The activities are in no particular order and the National Curriculum Levels suggested above are for guidance only For each activity there are detailed notes for the teacher describing ways in which the activity has been used successfully in real classrooms. These notes link the activity directly to the Framework for teaching mathematics: Years 7, 8 and 9. There are also student worksheets that may be photocopied freely. The activities are designed for use with the TI-83 or TI-84 families of calculators. The assumption is that you will have access to a class set of calculators and also a calculator that can be used for whole-class teaching. This demo calculator can take various forms including the TI-SmartView™ emulator or a Viewscreen™. It is possible for schools to borrow from Texas Instruments the very latest technology, both for the class and the teacher – see http://education.ti.com/uk. The 10 activities illustrate using the graphics calculator to teach a wide range of mathematical topics. Some require very little previous experience with using the calculator whereas others are for students and teachers who have already acquired some skill and confidence with using the handheld technology. They have been chosen to illustrate a range of things the calculator can do effectively, including simple calculation and algebra on the home screen, graphing and drawing on the graphing screen, using lists to deal with large data sets and using one of the commonly available software applications. One activity also uses the TI motion sensor known as the CBR™ together with its built-in software Five of the activities have been adapted from those published previously in 30 Calculator Lessons for Key Stage 3, a photocopiable resource published by A+B books. (www.AplusB.co.uk). Details of this and other resources supporting the use of handheld technology in the teaching of mathematics are listed at the back of this book.

Teachers Teaching with TechnologyTM
Activity 1: There and back again Teacher’s notes
Framework reference: Page 85
Strand: CalculationsTopic: Number operations and the
relationships between themPupils should be taught to: Consolidate
understanding of the operations ofmultiplication and division, theirrelationship to each other and toaddition and subtraction
Year group: 8Objectives: Use inverse operationsKey Vocabulary: Inverse, order of operationsResources required: Class set of calculators
plus Viewscreen, or TI-SmartViewemulator.
Summary
For this activity students need only simplecalculator skills. Using the machine for theactual calculations shifts attention onto theoperations and their inverses.
Instructions for the teacher
(1) Remind students of the need for brackets whendealing with some compound operations such as“add 7 then divide by 3”. This can be done byasking them to choose any starting number andthen produce screens such as these: thecompound expression must give the same answeras the two simple operations.
Add 7 then divide by 3
Subtract 12 then multiply by 2
In the second screen the starting number hasbeen previously stored in X.In this lesson it may be best always to use bracketsaround the first binary operation.
(2) Remind students of the meaning of inverse andthat addition and subtraction are inverses, as aremultiplication and division. Do this using the democalculator as shown in the following example.
• Choose any numberand press Í
• Press ¯ 3 Í(Now we are "there".)
• Press ¥ 3 Í(Now we are "backagain".)
Repeat, but this time divide first and then multiply.
(3) Students work through Handout 1. You maywish to use the last question only with more ablestudents. (The problem referred to in Activity 4shows up if you choose a negative value for X.)
(4) Class-teach theinverse of a multipleoperation, perhapsbeginning as shown onthe right and thenmoving on to theshorter version below.Keep using the phrase"there and backagain".
You will need to use y Z here and repeateduse of y [ will also save some time.
(5) Move on to Handout 2.
(6) Finally, draw together results from Activities 5-7and work towards a statement of a general rule forfinding the inverse of multiple operations.
This activity was first published in30 Calculator Lessons for Key Stage 3(A+B Books).
Teachers Teaching with TechnologyTM
Activity 1: There and back again Handout 1
1) Screensnap
Make your calculator look exactly like these.Hint: To store a number in X use ¿ and
„.
This illustrates that multiply by 3is the inverse of divide by 3.But what if X were a really big number, or afraction, or a negative number...?
2) Pick your ownStore any number you like in X and repeat Activity 1.Make sure you end up with the same number you started with.Is multiply by 3 the inverse of divide by 3, whatever number you start with?
3) Other inverses
(a) Produce two screens toshow that add 3is the inverse of subtract 3.
Draw your screens here.
(b) Write the inverse of subtract 0.125
here _________Draw two screens to show this.
(c) Write the inverse of divide by 0.125
here _________Draw two screens to show this.
4) There-and-back with a square
These screens seem to show that squaring andsquare rooting are inverses. Try this with yourown nasty X numbers.To enter √(Ans) press y C y Z ¤.
If you make X nasty enough you'll find that thiswon't work. What's the problem?
Why not choose a reallynasty X number?

Teachers Teaching with TechnologyTM
Activity 1: There and back again Handout 2
5) Screensnap back again
Make your calculator look exactly like these.Hints:• To enter Ans press y Z.• Save yourself time on the second screen by
using y [ several times.
This illustrates that divide by 7 then subtract 5is the inverse of add five then multiply by 7.
6) Find the inverseIn each case draw two screens to illustrate youranswers.
(a) What is the inverse ofadd six then multiply by 17?
____________________
(b) What is the inverse ofdivide by 19 then subtract 51?
____________________
(c) What is the inverse ofadd 0.25 then multiply by 0.005?
____________________
7) Longer journeys there and back
(a) What is the inverse of... add 2 then divide by 3 then subtract 4?
_______________________Draw two screens to illustrate your answer.
(b) Make up some more long there-and-back journeys.

Teachers Teaching with TechnologyTM
Activity 2: Round and round Teacher’s notes
Framework reference: Page 218
Strand: Shape, space and measuresTopic: CoordinatesPupils should be taught to: use coordinates in
all four quadrantsYear group: 7Objectives: Use conventions and notation for
2D coordinates in all 4 quadrants;find coordinates of points determinedby geometric information.
Key Vocabulary: Centre, diameter, radiusResources required: Class set of calculators
plus Viewscreen, or TI-SmartViewemulator
Summary
This activity allows students to explore coordinatesby dealing with the centre point and radius ofcircles
Instructions for the teacher
(1) First set up a window with friendly coordinates.
• Press p• Type the settingsshown here. Tonavigate around thescreen you can usethe cursor keys:
}†|~• Be sure to use Ìthe negative key.
• Press y 5toreturn to the homescreen.
(2) Circles can be constructed using a commandfrom the DRAW menu on the home screen.
• Press y < toselect the DRAWmenu.
• Scroll down with †to see the bottom ofthis menu.
• Choose option 9(Circle). You can eitherpress 9 or scroll downthe menu and pressÍ.
• Press:
1 ¢1 ¢3 ¤(The commas areimportant, but thecalculator willunderstand if you forgetto close the bracket.)
• Press Í
You will have drawn acircle centre (1, 1) withradius 3 units.
Press y 5 to return to the home screen andenter the command for the next circle.
An easy way to do this is to use y[ to recallthe last entry. Then use |to move to a digit andovertype it. If you need less or more digits use {or y6.
The worksheet gives students the chance toexplore sets of circles drawn like this.
Answers
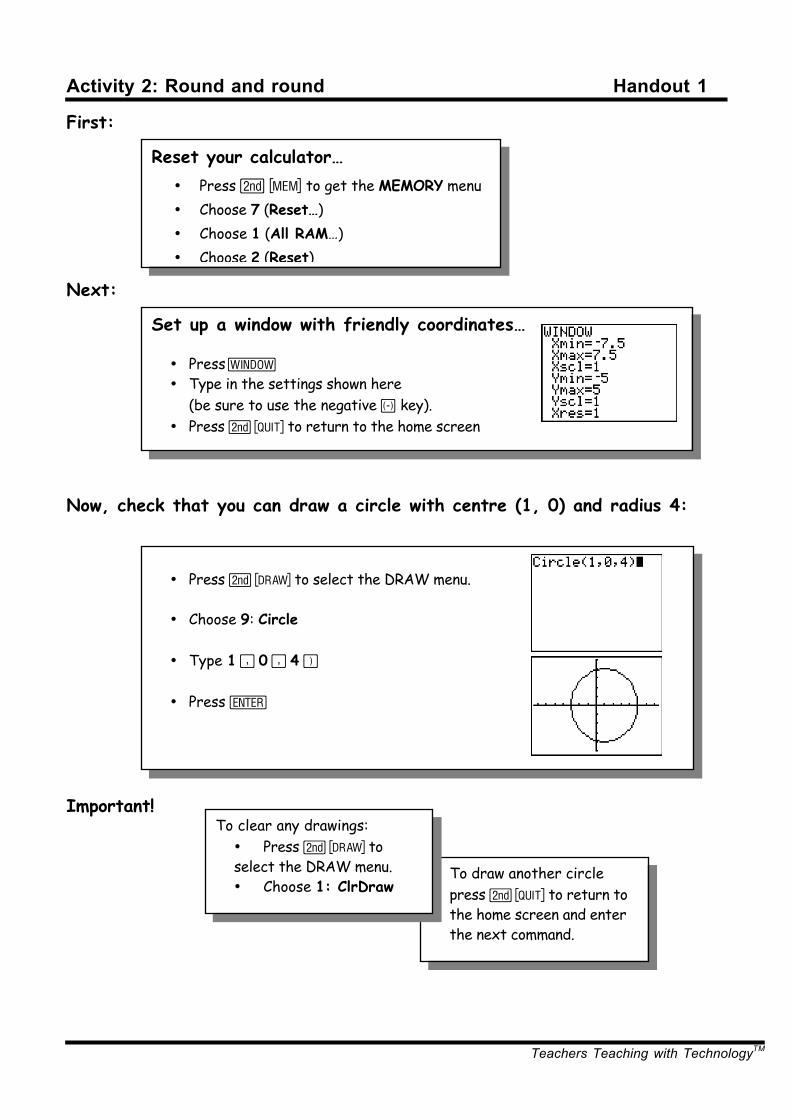
2(a)Circle Centre Radius
1 ( 0 , 0 ) 1
2 ( 0 , 0 ) 2
3 ( 0 , 0 ) 3
b)
Circle Centre Radius
1 ( 1 , 1 ) 1
2 ( 1 , 1 ) 3
3 ( 1 , 1) 5
(c)
Circle Centre Radius
1 ( –2 , 1 ) 2
2 ( –2 , 1 ) 3
3 ( –2 , 1 ) 4
(d)
Circle Centre Radius
1 ( 1 , 1) 2
2 ( 0 , 1) 3
3 ( –1 , 1) 4
Teachers Teaching with TechnologyTM
Activity 2: Round and round Handout 1
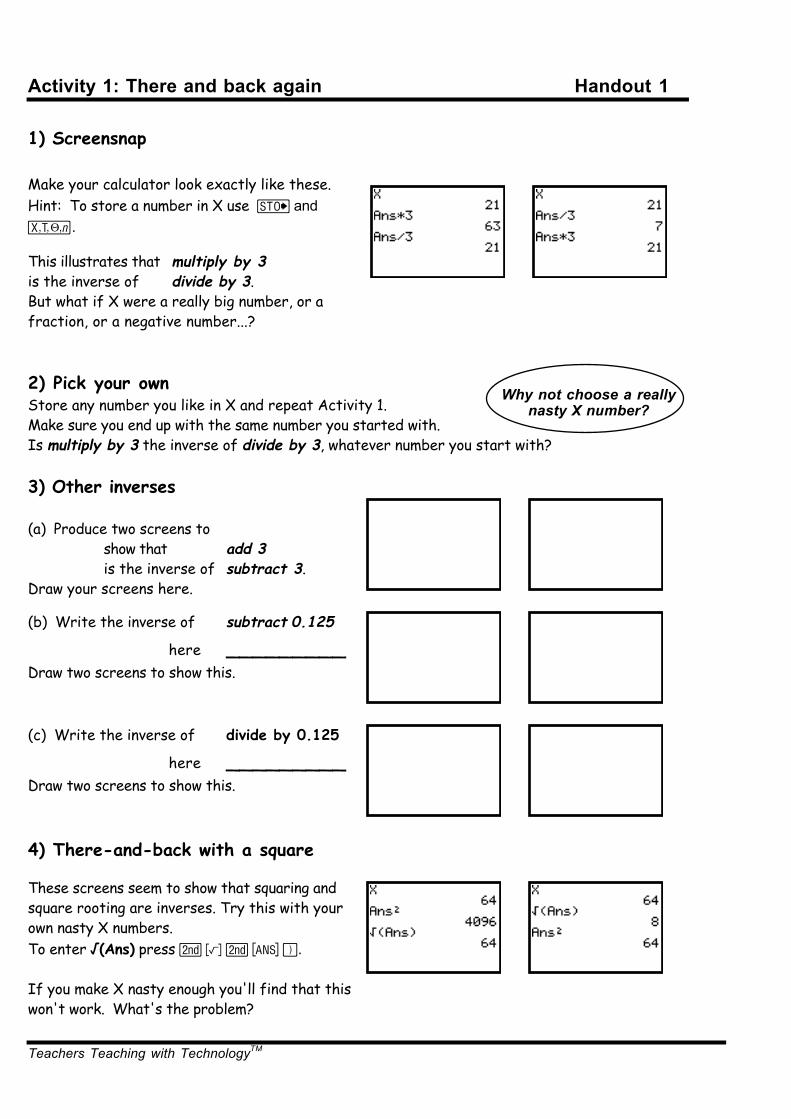
First:
Next:
Now, check that you can draw a circle with centre (1, 0) and radius 4:
Important!
Set up a window with friendly coordinates…
• Pressp• Type in the settings shown here
(be sure to use the negative Ì key).• Press y 5 to return to the home screen
• Press y < to select the DRAW menu.
• Choose 9: Circle
• Type 1 ¢0 ¢4 ¤
• Press Í
To draw another circlepress y 5 to return tothe home screen and enterthe next command.
To clear any drawings:• Press y < toselect the DRAW menu.• Choose 1: ClrDraw
Reset your calculator…• Press y L to get the MEMORY menu• Choose 7 (Reset…)• Choose 1 (All RAM…)• Choose 2 (Reset)
Teachers Teaching with TechnologyTM
Activity 2: Round and round Handout 2
Make your calculator draw each of these screens
Draw and complete a table like this for each one:
(a)
(b)
(c)
(d)
Make up more puzzles like this.
Circle Centre Radius1 (…, …)2 (…, …)3 (…, …)

Teachers Teaching with TechnologyTM
Activity 3: Prime time Teacher’s notes
Framework reference: Page 53
Strand: Numbers and the number system.Topic: Integers, powers and roots.Pupils should be taught to: Recognise and
use multiples, factors and primes;use tests of divisibility.
Year group: 8Objectives: Use a calculator to explore
divisibility.Key Vocabulary: Factor, prime factor.Resources required: Class set of calculators
plus Viewscreenor TI-SmartViewemulator.
Summary
In this activity students investigate prime numbers,using the calculator to check for divisibility.Shortcuts are proposed, enabling the checkingprocess to be automated.
Instructions for the teacher
Lead a discussion exploring primeness.
E.g. Is 223 prime? Using the demonstrationcalculator, divide 223 by 2, 3, 4... etc.
Discuss with the class how far it is necessary to goon – as far as 221, or 110, or what?Establish that there is no point in going on beyond,say 15 (since 15 squared = 225).
Also, was it necessary to try every number? Therewas no need to try 2, since 221 is odd. In factthere was no need to try any even divisor. Alsothere was no need to try 5 since only numbersending in 0 or 5 are divisible by five.In fact it is only really necessary to try consecutiveprimes.Confirm whether or not 223 is prime.
Is 209 prime? Do this more efficiently by dividingonly by known smaller primes and stopping at asuitable point – roughly the square root of 209 (152
= 225, so 15 would do). Students may find itdifficult to understand this last point so it mightbetter be delayed until later in the lesson.
Distribute the handouts and get students totackle the first question.
Demonstrate a semi-programming method fortesting for primes as shown in section 2 of thehandout. An advantage of this approach is thatthe calculations are set up quickly. A disadvantageis that the method is highly inefficient as it dividesby every consecutive whole number, not just everyconsecutive prime number. Does this matter?
Students continue working through the handouts.
The follow-up discussion could pick up thefollowing themes:• How exactly does the ‘semi-program’ in Activity
2 work?• What other tests for divisibility do they know?
(See page 52 of the Framework.)
You could also discuss writing a program for testingprimes. One issue is how the calculator can registerwhether the division is exact. This can be doneusing the = command in the TEST menu. So,iPart(A/B)=A/B will be true if B divides A exactly.
Answers
1)Number Largest
primefactor
needed
Prime? Factors
209 11 no 11, 19 337 17 yes 411 3 no 3, 137
2003 43 yes 1997 43 yes
2) (a) Each time Í is pressed X is increased by1. You can stop pressing Í when X dividesexactly into 209 or when X exceeds the squareroot of 209.(b) 223 is prime.(c) 293, 443, 461, 367, are all prime.207 has the factors 3, 9, 23 and 69.341 has the factors 11 and 31.459 has the factors 3, 9, 17, 27, 51 and 153,
3)(a) 2011 2017 2027 2029 20392053 2063 2069 2081 20832087 2089
(b) 25, 21, 14(c) There are no known patterns in the occurrenceof prime numbers.
This activity was first published in30 Calculator Lessons for Key Stage 3(A+B Books).
There is more on prime numbers in CalculatorMaths: Number (p.48-51) including anefficient simple program for testing forprimeness.

Teachers Teaching with TechnologyTM
Activity 3: Prime time Handout 1
1) Is it prime? (a) Starting with the number 2, write below the first 15 prime numbers. __ __ __ __ __ __ __ __ __ __ __ __ __ __ __ (b) Use the method of dividing by consecutive prime numbers to test whether the following areprime. Write your answers in the table (one has been done for you).
Number Largest primefactor tested
Prime?(yes/no)
If not prime, thefactors are...
209 11 no 11, 19 337
411
2003
1997
2) A partial program for primes (a) Enter the following on the home screen of your calculator. 1 ¿„Í „à 1 ¿„ƒ: yE„¢209 ¥„yFÍ
Keep pressing Í and watch what happens. Then answer the following questions.• What happens to the X value each time Í is pressed?• How do you decide when to stop pressing Í:
if the number isn't prime?if the number is prime?
(b) To test a different number (say 223) for primeness, edit the key sequences as follows.Press ‘ and then y[y[Í (this enters the command 1!X)
Press y[y[ and edit the value 209 to read 223.
As before, repeatedly press Í and watch the screen. Is 223 prime?
(c) Use the method of part (b) to test whether the following numbers are prime.293 443 461 367 207 341 459
If a number is not prime, write down two of its factors.
Teachers Teaching with TechnologyTM
Activity 3: Prime time Handout 2
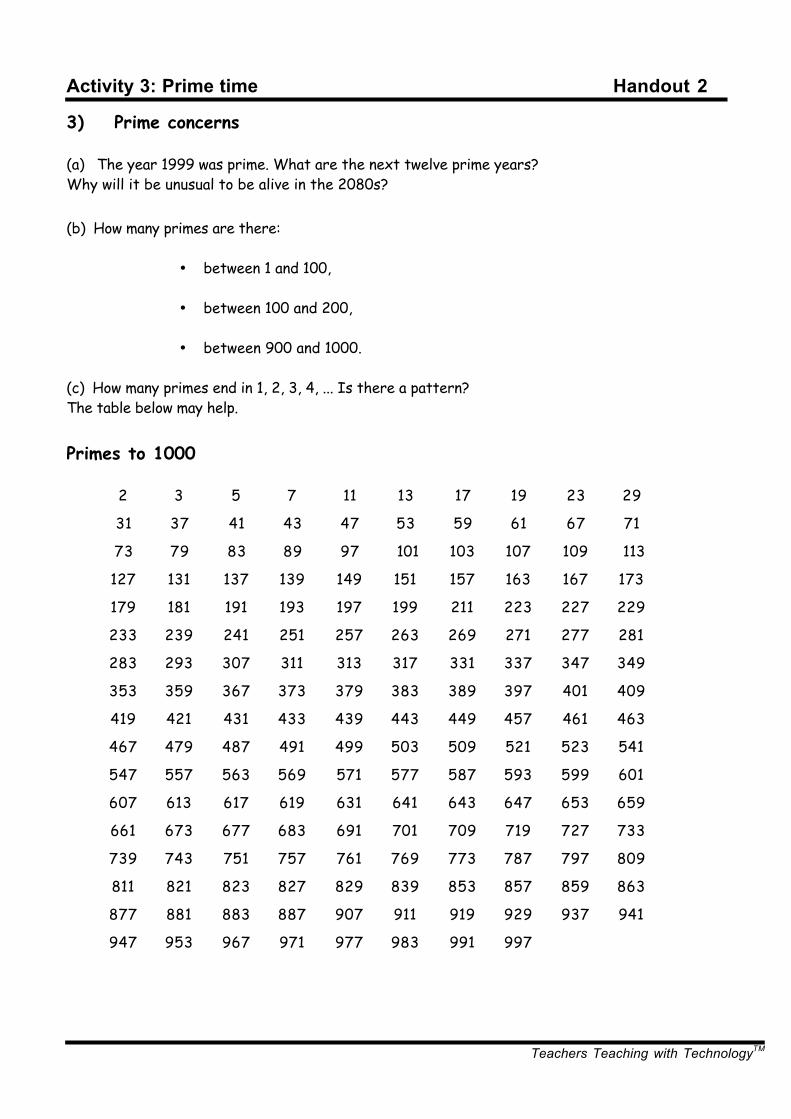
3) Prime concerns
(a) The year 1999 was prime. What are the next twelve prime years?Why will it be unusual to be alive in the 2080s?
(b) How many primes are there:
• between 1 and 100, • between 100 and 200, • between 900 and 1000.
(c) How many primes end in 1, 2, 3, 4, ... Is there a pattern?The table below may help.
Primes to 1000
2 3 5 7 11 13 17 19 23 29
31 37 41 43 47 53 59 61 67 71
73 79 83 89 97 101 103 107 109 113
127 131 137 139 149 151 157 163 167 173
179 181 191 193 197 199 211 223 227 229
233 239 241 251 257 263 269 271 277 281
283 293 307 311 313 317 331 337 347 349
353 359 367 373 379 383 389 397 401 409
419 421 431 433 439 443 449 457 461 463
467 479 487 491 499 503 509 521 523 541
547 557 563 569 571 577 587 593 599 601
607 613 617 619 631 641 643 647 653 659
661 673 677 683 691 701 709 719 727 733
739 743 751 757 761 769 773 787 797 809
811 821 823 827 829 839 853 857 859 863
877 881 883 887 907 911 919 929 937 941
947 953 967 971 977 983 991 997

Teachers Teaching with TechnologyTM
Activity 4: Drawing shapes Teacher’s notes
Framework reference: Page 12
Strand: Using and applying mathematics tosolve problems.
Topic: Applying mathematics and solvingproblems
Pupils should be taught to: Solve wordproblems and investigate in a rangeof contexts.
Year group: 7Objectives: Use coordinates to draw shapes.Key Vocabulary: Coordinates, quadrilateral,
parallelogram, cube.Resources required: Class set of calculators
plus Viewscreenor TI-SmartViewemulator. Link cables (to sharepictures) and TI-Graph Link to printthem.
Summary
This activity introduces the two different ways ofdrawing straight lines on the calculator. Bothmethods offer opportunities for stressing theimportance of coordinates.
Instructions for the teacher
Before the lesson, create a friendly graphingwindow on the demonstration calculator. Pressp and enter the values shown here.
Also prepare a drawing to display, which will attractattention as students arrive for the lesson.
Show students how to enter on their calculatorsthe friendly window settings shown above.Explain how to carry out direct drawing:
• Press s (you must start on the graphingscreen) and then y F 2 to choose Line(from the menu.
• Use the cursor keysto move to the pointwhere the line willstart and pressÍ.
• Move to the point where the line will end andpress Í again. Use the coordinates at thebottom of the screen to make sure the endpoints are where you want them to be.
• Continue moving and pressing Í until theshape is complete.
Explain how to clear the drawings:press y F 1 to choose ClrDraw from themenu.
Explain indirect drawing, which will be used later.Here you must start on the home screen, so pressy5.
Pressy F 2 tochoose Line( and thencomplete the commandby entering thecoordinates of the endpoints, separated bycommas.
To enter another similar command you can savetime by using y ≤ and editing.
Students can then be asked to create their owndrawings using both direct and indirect drawing.Direct drawing is more fun but the difficulty is thento ensure that students are using the coordinatesat the bottom of the screen, rather than justproducing the drawing by eye.There are activities on the handouts that retain thefun aspect, while shifting attention to thecoordinates.
In a final plenary, you may want to display some ofthe students' drawings. They can store theirpictures and then transfer them to the democalculator using the link cable.
There may be other important issues to discusswhich the activities may have highlighted,e.g. the use of coordinates, the properties ofshapes and representing 3-D shapes.
This activity was first published in30 Calculator Lessons for Key Stage 3(A+B Books).
Another way of drawing shapes is to specifycoordinates as two lists and then drawing ascatterplot or line graph. This is a particularlypowerful idea and opens up the possibility oftransforming the shape. See CalculatorMaths: Shape (pages 36-39)

Teachers Teaching with TechnologyTM
Activity 4: Drawing shapes Handout 1
1) Initial activity
Use direct drawing to produce your initials on the screen.
Make sure they are exactly right by keeping an eye on thecoordinates at the bottom of the screen.
2) Follow the star
What are the coordinates of the corners of this six-pointed star?Use direct drawing to produce it on your calculator.
Now try making a similar eight-pointed star.
3) Triangle tangle
This shape is made using three identical triangles that only touchat the corners.Can you make a better one using lots of identical triangles?
4) Heading north-east
What shape is produced by the commands shown here?Enter a fourth line to complete a symmetrical shape.
5) Line pattern
Can you spot the pattern of numbers in these commands?Can you predict the pattern of lines they will draw?Enter the commands to check your prediction.
What should the next Line command be and what line in thedrawing will be produced?And the next? Why does the line pattern go wrong?

Teachers Teaching with TechnologyTM
Activity 4: Drawing shapes Handout 2
6) A sound base
Enter the command shown here.Now imagine that this is the base of a squareDraw the rest of the square using indirect drawing.
Clear the screen and enter Line(3,1,6,1) again.Now imagine that the line is the base of a parallelogram that istwice as high as the square.Draw the rest of such a parallellogram using indirect drawing.
7) Name the shape
Each of these four screens will draw theopposite sides of a quadrilateral.
In each case see if you can predict theshape, then enter the commands, draw theother two sides and see if your predictionwas right.
8) Skeleton cube
Use your calculator to draw the complete outline of the skeletoncube that has been started here,
9) Taking a different view
Try to imagine the three-dimensional shape represented here.Now imagine the shape turned round or stood on its end. Whatwould it look like?
Try to draw it on your calculator.

Teachers Teaching with TechnologyTM
Activity 5: Y=MX+C Teacher’s notes
KS 3 Framework ref: Pages 165-7
Strand: AlgebraTopic: Graphs and FunctionsPupils should be taught to: Generate points
and plot graphs of functionsYear group: 8Objectives: Plot the graphs of linear
functions. Recognise that equationsof the form y=mx+c correspond tostraight line graphs
Key Vocabulary: Linear, function, graphResources required: Class set of calculators
plus Viewscreenor TI-SmartViewemulator
Summary
In this activity students are asked to engage withdifferent functions of the form y = mx + c and tolook for the variability generated with changes in mand c. Also, a link is made to the characteristics ofthe table of values for each function.
Instructions for the teacher
First reset the demo calculator and enter thefriendly window settings shown on Handout 1.
To enter the functionY=2X + 1,press o tosee this screen.
Press 2 „ Ã 1
Now look at the tableof values:
Press y0
You can display thefunction by moving thecursor to highlight theheader row for Y1:
Press ~ (right cursor)Press } (up cursor)
Ask questions such as:“What are the numbers in the function?”.
“What do the 2 and the 1 represent in the table?”.Take some suggestions, but do not formalise them;students will be able to formalise their ideas in theclass activity.
Now look at the graph:
Press s
To display the name ofthe function and showvalues of points on the
line, pressr
Use the left |andright ~cursor keys tomove along the line.
Ask questions such as:“What are the numbers in the function?”“What do the 2 and the 1 represent in the graph?”.Take suggestions as before.
Comments on handouts
In questions 5-7students can enter fourfunctions together. Allfour functions can beviewed on the table orthe graph. Then use allfour cursor keys asbelow.
(If you are using TI-Smartview, the use of the View3
function is really helpful here.)
A function of the form Y= MX+C represents astraight line. In the table of values the M meansthe step or difference between the Y values andthe C means the value for X=0.In the graph, the M means the steepness orgradient and the C means the valkue of Y wherethe line crosses the axis,
Teachers Teaching with TechnologyTM
Activity 5: Y=MX+C Handout 1
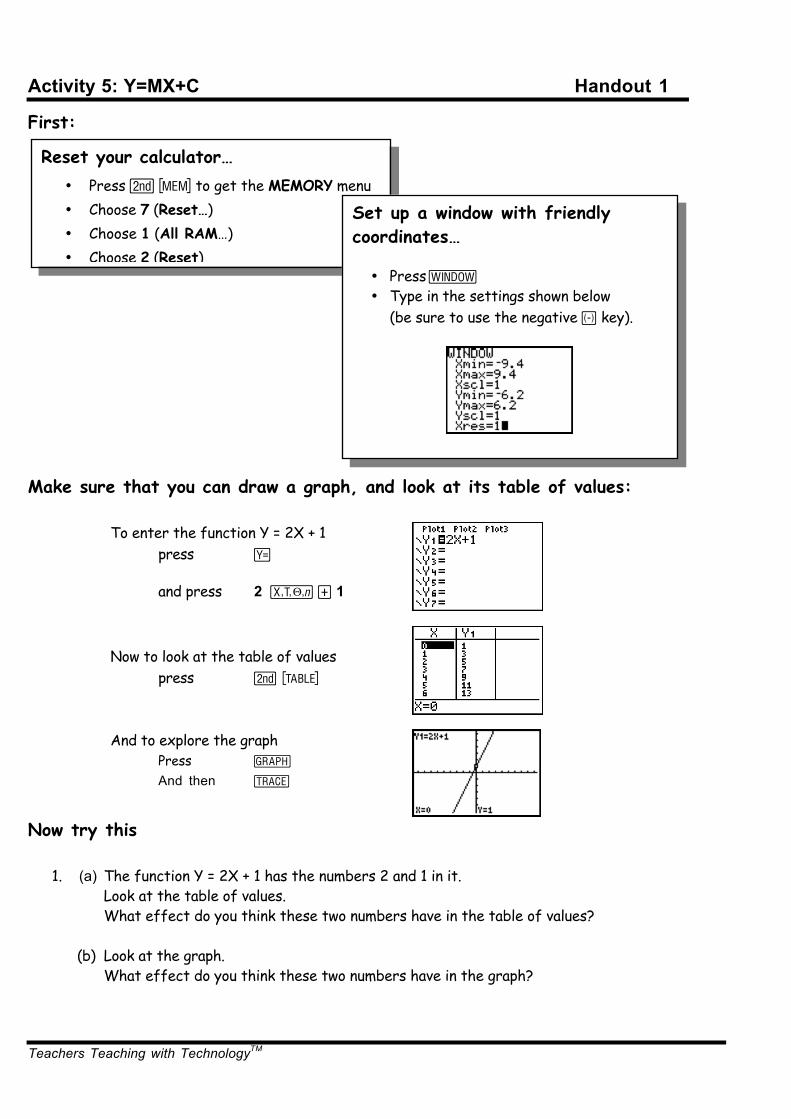
First:
Make sure that you can draw a graph, and look at its table of values:
To enter the function Y = 2X + 1press o
and press 2 „ Ã 1
Now to look at the table of valuespress y0
And to explore the graphPress sAnd then r
Now try this
1. (a) The function Y = 2X + 1 has the numbers 2 and 1 in it. Look at the table of values.
What effect do you think these two numbers have in the table of values?
(b) Look at the graph.What effect do you think these two numbers have in the graph?
Reset your calculator…• Press y L to get the MEMORY menu• Choose 7 (Reset…)• Choose 1 (All RAM…)• Choose 2 (Reset)
Set up a window with friendlycoordinates…
• Pressp• Type in the settings shown below
(be sure to use the negative Ì key).

Teachers Teaching with TechnologyTM
Activity 5: Y=MX+C Handout 2
In Question 1 you should have written down your first ideas about what effect the numbers in thefunction have on the table and the graph.Now check your ideas as you look at some more functions.
Some more functions
2. Start again and look at the table and graph for Y = 3X + 1[Note: use the‘key to get rid of the 2X + 1]
3. Start again and look at the table and graph for Y = X + 1
4. Start again and look at the table and graph for Y = 3X – 1
5. Now look at these four functions together:Y = 2X + 2Y = 2X – 1Y = 2X + 3Y = 2X – 3
6. Now look at these functions together:Y = X – 1Y = 3X – 1Y = 4X – 1Y = −X – 1
7. Now look at these functions:Y = −2X + 2Y = −3X + 2Y = −X + 2Y = 2X + 2
8. The letter M is normally used for number in front of the X.The letter C is normally used for number after the X.Update your report about the meaning of the M and the C.
Key careUse Ì to enter a negativeand | for subtract.So to enter −X – 1 you must press
Ì„|1
Four togetherYou don’t need to ‘ eachone of these.Use the down cursor † anduse Y1, Y2, Y3 and Y4

Teachers Teaching with TechnologyTM
Activity 6: Trig ratios Teacher’s notes
Framework reference: Page 245
Strand: Shape, space and measures.Topic: Measures and mensuration.Pupils should be taught to: Begin to use sine,
cosine and tangent to solveproblems.
Year: 9.Objective: Consider sine, cosine and tangent as
ratios.Key Vocabulary: Adjacent, opposite,
hypotenuse, sine (sin), cosine (cos),tangent (tan), trigonometric ratios.
Resources required: Rulers and protractors.Class set of calculators plusViewscreenor TI-SmartView emulator.
Summary
This activity introduces the concept oftrigonometric ratio. It asks students tohypothesize about the size of the ratios and toexamine them graphically. It is likely to take muchmore than one lesson to cover these aspectsadequately. The activity assumes some basiccalculator familiarity.
Instructions for the teacher
Discuss the definition of the hypotenuse, oppositeand adjacent sides of a right-angled triangle.
Ask the students to imagine a right-angled trianglewith one angle of 30º (“See it in your mind’s eye”.)Imagine the triangle growing but still retaining thesizes of its angles. Ask the students to commenton the ratios of the sides to each other.Encourage students to discuss their ideas witheach other and make some hypotheses.
Give out the handout sheets. Students need tomeasure six angles and the lengths of thecorresponding opposite, hypotenuse and adjacentsides. Encourage careful measurement as theaccuracy (or lack of it!) will be revealed later.
The handouts give the instructions to producescatterplots of the different ratios plotted againstthe angles in degrees. This activity encouragesstudents from the outset to consider thetrigonometric ratios as functions of size of theangle.
They then superimpose the graphs of eachtrigonometric ratio onto their scatterplots, providingfeedback on errors and accuracy ofmeasurements.
The students could initially work in pairs, examiningone ratio each. Subsequently three pairs ofstudents could be grouped to compare andcomment on their individual results.
In a plenary, the teacher will need to focus oneach of the ratios in turn, using the democalculator to show each of the graphs of thetrigonometric functions for 0 < x < 90º.
Explain how the graphs can be used to identify thevalue of the sine, cosine or tangent of any angle.
You can press r † (to move from thescatterplot onto the graph) and either move alongthe graph using the cursor keys or go directly tothe required value by keying it in.
Alternatively, pressing y 0 reveals a tableof sine values and you can scroll down to find arequired value. (You may need to adjust thesettings in TBLSET.)
This activity was first published in30 Calculator Lessons for Key Stage 3(A+B Books).
For a different approach to trig. ratios, seeCalculator Maths: Shape, pp 20-23. There,lengths of the sides are taken from similartriangles drawn on the calculator's screen.

Teachers Teaching with TechnologyTM
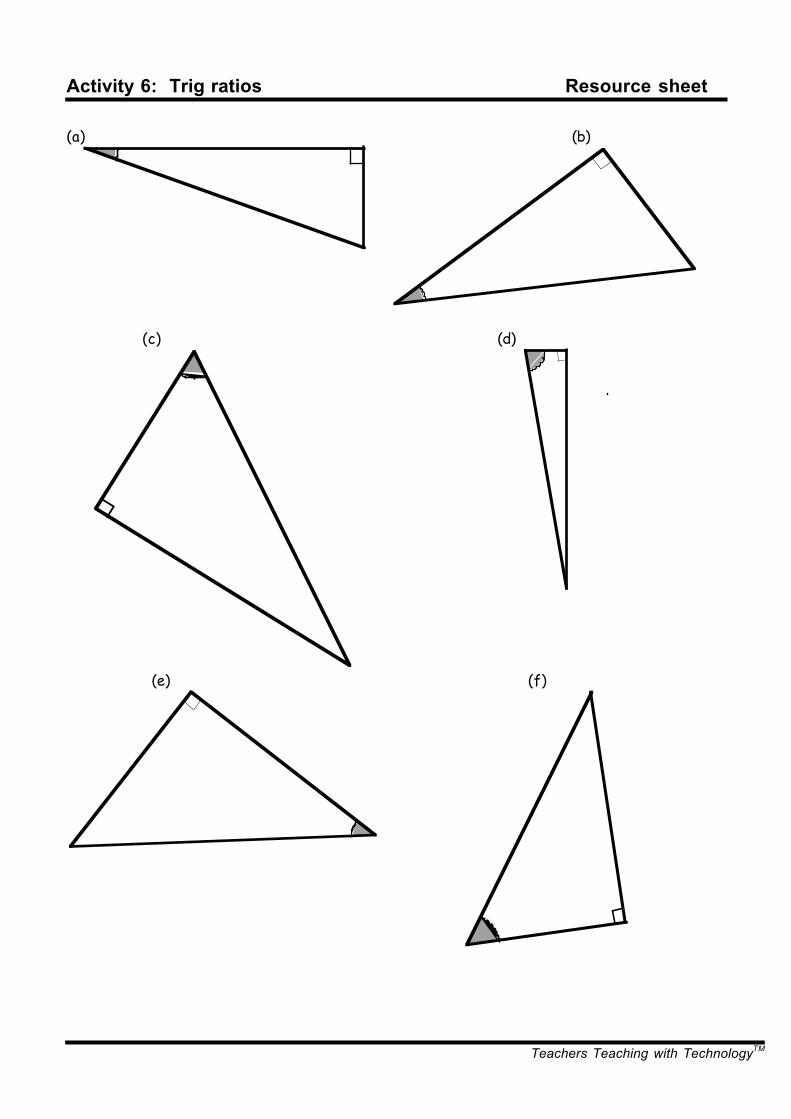
Activity 6: Trig ratios Handout 1
1) Measuring and calculatingFor each of the right-angled triangles on the resource sheet:
• measure the marked angle;• label the opposite, adjacent and hypotenuse sides;• use your calculator to work out the three ratios:
Hypotenuse
Opposite, Hypotenuse
Adjacent
AdjacentOpposite
• record the measurements and calculations in this table.
Lengths of sides Trigonometric ratios (2 d.p.)
Angle (º)L1
Opposite Adjacent HypotenuseOpposite
HypotenuseL2
AdjacentHypotenuse
L3
OppositeAdjacent
L4
(a)
(b)
(c)
(d)
(e)
(f)
2) Assessing the ratiosLook carefully at the three ratios.Comment on the size of the numbers.Thinking carefully about the properties of right-angled triangles, could the ratios
Hypotenuse
Opposite or
Hypotenuse
Adjacent ever be greater than 1? Explain your thinking.
What about the ratio Adjacent
Opposite? What is the greatest value this ratio could have?
3) Set up your calculatorNow enter some of these data into the calculator's lists, so you can explore the relationshipbetween the angle and each of the ratios in turn.
First press z and select the settings shown by using thearrow keys and pressing Í.
Press p and enter the values shown.Why do you think these values have been chosen?
You will probably want to change these window settings laterin the activity.

Teachers Teaching with TechnologyTM
Activity 6: Trig ratios Handout 2
4) Finding the sines
Press … 1 and enter the angles into L1 and each corresponding ratio Hypotenuse
Opposite into L2.
Once you have entered all the data, set up ascatterplot to plot these points on a graph; pressy , 1 and make your screen look likethe one on the right. To select something,highlight it and press Í.
Pressing s should reveal the scatterplot.Make a sketch of it and comment on its key features.
How could you use it to predict some lengths of a right-angled trianglewith an angle of 25º?
The ratio Hypotenuse
Opposite is so useful it has been named the sine of the angle (abbreviation sin).
It has its own key on the calculator: ˜You can superimpose the graph of the function Y1 = sin(X) onto your calculator screen to checkthe accuracy of your measurements and calculations.
Press o and type ˜„ ¤.Press s to see the graph.How accurate were your measurements and calculations?Write a comment on the shape of the graph.
5) Finding the Cosines
Now focus on the ratio Hypotenuse
Adjacent, the cosine (or cos) for each angle.
Enter their values into L3.In the setup screen for Plot1, change the Ylist setting to L3 before pressing s.Superimpose the function Y1 = cos(X) onto your graph.Write a comment about the graph.
6) Off at a tangent
Finally, focus on the ratio Adjacent
Opposite, the tangent (or tan) of each angle.
Enter their values into L4.In the setup screen for Plot1, change the Ylist setting to L4 before pressing s.Superimpose the function Y1 = tan(X) onto your graph.You might need to change the p settings to fit all of your points onto the graph.Write a comment about the graph.
Teachers Teaching with TechnologyTM
Activity 6: Trig ratios Resource sheet
(a) (b)
(c) (d)
(e) (f)

Teachers Teaching with TechnologyTM
Activity 7: Substitution Teacher’s notes
Framework reference: Page 138
Strand: AlgebraTopic: Equations, formulae and identitiesPupils should be taught to: Use formulae from
mathematics and other subjectsYear group: 7Objectives: Substitute positive integers into
simple linear expressions.Key Vocabulary: Substitute, expression,
variable, statementResources required: Class set of calculators
plus Viewscreenor TI-SmartViewemulator
Summary
This activity uses calculator memories to examinethe effect of substituting into algebraicexpressions. The activity assumes no previouscalculator experience.
Instructions for the teacher
(1) Begin by resetting the calculator as on Handout1. Note that this has the effect of storing a zero inevery memory location.
(2) Notice the alphabetic characters above thecorresponding keys on the keyboard. To enterthese letters you must first press ƒ.
• Type 2• Type the A by
pressing ƒfollowed by A
• Type Õ Press ƒB• Press Í Discuss: what’s
happened.
Now give some values for A and B. Ask the classfor possibilities. e.g. A = 3 and B = 5.
• Press
3 ¿ƒA• Press Í
• Press
5 ¿ƒB• Press Í
Now type 2A+B asbefore.“We have substitutedthe values A=3 andB=5 into theexpression 2A+B”.
Repeat with other values of A and B.In particular extend to include negative values.Be sure to use the Ì key for negative.
Notice that using ‘ will clear the screen buthas no effect on the content of the memories.Values stay in the memory until they areoverwritten or until the calculator is reset.
(3) Now use different expressions and othervariables. e.g. Suppose a sequence has Nth term5N – 2. What is the Nth term?i.e. what is the value of 5N – 2?
• Press5 ƒN | 2
• Press Í(Why do we get −2?)
What is the 15th term?• Press
15ƒN• Press Í
Now instead of typing the 5N – 2 again you canuse y[to recall previous entries. In thiscase 5N – 2 was the last but one entry.
• Press y[ torecall the last entry.
• Press y[again to recall the5N – 2.
• Press Í toevaluate theexpression.
Now work out the 10th term, the 18th term, etc.
Answers to questions on handouts
1 a) 17 b) 7 c) 37 d) –13 e) 4.52 a) 6 b) 0 c) –3 d) –9 e) 153 a) 16 b) 18 c) –1 d) 8 e) –274 a) 5 b) 2 c) 1 d) 17 e) 2

Teachers Teaching with TechnologyTM
Activity 7: Substitution Handout 1
Entering expressionsYou can use the ƒ key to type letters.
Why did you get 0?If you substitute the value A = 5 into this expression, what do you think the value of theexpression will be?Write it down.
Explain why you get 16.
First, reset your calculator…• Press y L to get the MEMORY menu• Choose 7 (Reset…)• Choose 1 (All RAM…)• Choose 2 (Reset)
Enter the expression 3A + 1 …• Type: 3• Press ƒ• Type A (It’s written above the I key)
• Type Ã1• Press Í
Enter the value A=5 …• Type 5
• Press ¿• Press ƒ• Press A
• Press ÍRecall the expression 3A + 1 …
• Pressy[to recall the previous entry
• Pressy [ to recall the 3A + 1
• Press Í

Teachers Teaching with TechnologyTM
Activity 7: Substitution Handout 2
Work these outWrite down your own idea first.Then use the graphics calculator to check.
1. Use the expression 5A + 2.What is the value of the expression when:
a) A = 3b) A = 1c) A = 7d) A = −3e) A = 0.5
2. In the expression 12 – 3B, what is the value of the expression when:a) B = 2b) B = 4c) B = 5d) B = 7e) B = −1
3. Here is an expression: 3C + 2D.What is the value of the expression when:
a) C = 2 and D = 5b) C = 4 and D = 3c) C = −3 and D = 4d) C = 4 and D = −2e) C = −5 and D = −6
4. Now use the expression E2 + 1What is the value of the expression when:
a) E = 2b) E = 1c) E = 0d) E = −4e) E = −1
5. Write a short explanation to tell someone else how to substitute values intoexpressions. Give examples.
Use the ¡key to enterthe 2 (squared)
Use the Ì key to entera negative

Teachers Teaching with TechnologyTM
Activity 8: Ball bounce Teacher’s notes 1
Framework reference: Page 173
Strand: AlgebraTopic: Graphs of functionsPupils should be taught to: Construct
functions arising from real-lifeproblems and plot theircorresponding graphs.
Year group: 9Objectives: Use a motion detector and
graphical calculator to plot thedistance-time graph of a bouncingball.
Key Vocabulary: Function, graph, distance-timegraph
Resources required: A Calculator-based ranger(CBR) connected to a demonstrationcalculator (ViewscreenorTI-SmartView emulator)
Summary
This activity uses the CBR as a distance sensor.The software uses an application called ballbounce to take a series of distance measurementsvery quickly over a 4-second period. The user canthen look at distance-time, velocity-time andacceleration-time graphs of the motion.
The instructions below show how to set up thecalculator and CBR unit and how to navigate thesoftware. There are also some suggestions fordata to collect. There are no handouts associatedwith this activity.
Instructions for the teacher
(1) Loading the software
Press ŒSelect CBL/CBR – itmay not be number 2on your machine.
When you see thisscreen press any keyto continue.
From the menu below choose 3:RANGER andpress Í
This is the main menu. Choose 3:APPLICATIONSand then choose 1:METERS
From the next menu choose 3:BALL BOUNCE. Atthis point the calculator will prompt you if the CBRis not connected.
(2) Arranging the kit
Using the longest lead you have, plug the CBRfirmly into the calculator. The screen promptsyou to prepare theexperiment by holdingthe moving object in asuitable place. It is notnecessary to be readyquite yet. Just pressÍ.
Now get everything ready. It is easiest to usethe TRIGGER button on the CBR unit.The unit will start clickingand at every click it willtake a measurement.Remember that it willcarry on taking readingsfor 4 seconds, so youwill have to act quickly!
Teachers Teaching with TechnologyTM
Activity 8: Ball bounce Teacher’s notes 2
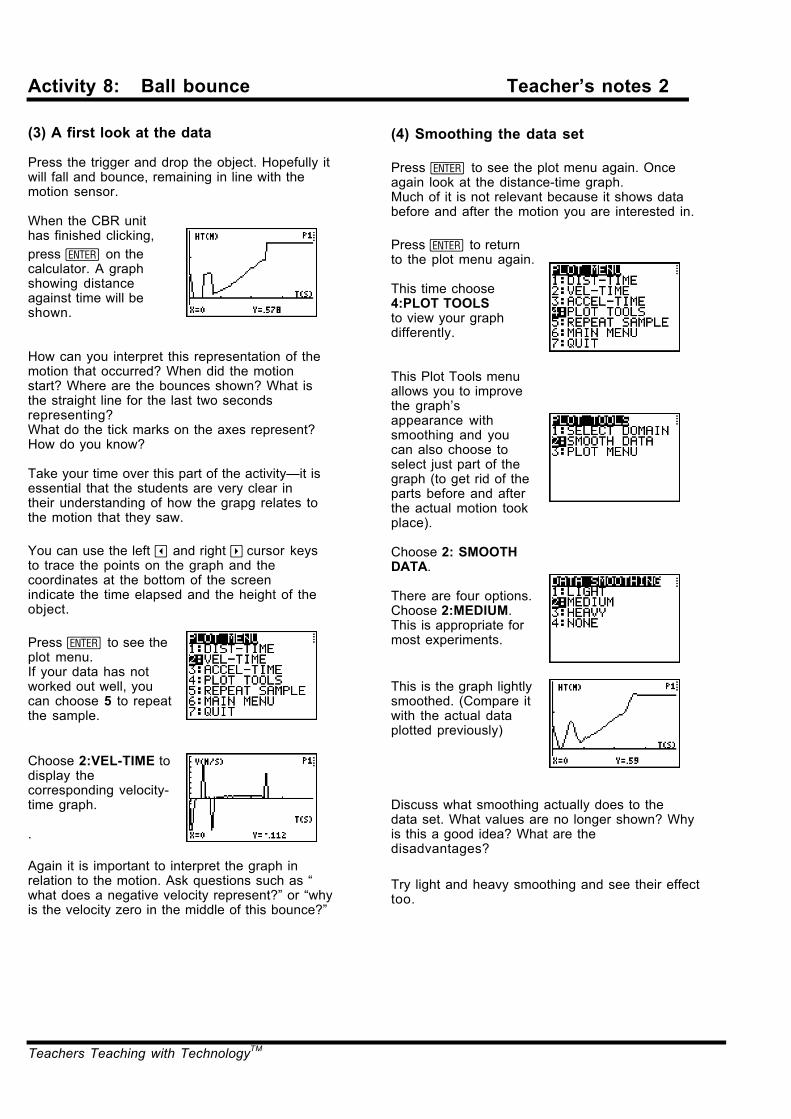
(3) A first look at the data
Press the trigger and drop the object. Hopefully itwill fall and bounce, remaining in line with themotion sensor.
When the CBR unithas finished clicking,press Í on thecalculator. A graphshowing distanceagainst time will beshown.
How can you interpret this representation of themotion that occurred? When did the motionstart? Where are the bounces shown? What isthe straight line for the last two secondsrepresenting?What do the tick marks on the axes represent?How do you know?
Take your time over this part of the activity—it isessential that the students are very clear intheir understanding of how the grapg relates tothe motion that they saw.
You can use the left | and right ~cursor keysto trace the points on the graph and thecoordinates at the bottom of the screenindicate the time elapsed and the height of theobject.
Press Í to see theplot menu.If your data has notworked out well, youcan choose 5 to repeatthe sample.
Choose 2:VEL-TIME todisplay thecorresponding velocity-time graph.
.
Again it is important to interpret the graph inrelation to the motion. Ask questions such as “what does a negative velocity represent?” or “whyis the velocity zero in the middle of this bounce?”
(4) Smoothing the data set
Press Í to see the plot menu again. Onceagain look at the distance-time graph.Much of it is not relevant because it shows databefore and after the motion you are interested in.
Press Í to returnto the plot menu again.
This time choose4:PLOT TOOLSto view your graphdifferently.
This Plot Tools menuallows you to improvethe graph’sappearance withsmoothing and youcan also choose toselect just part of thegraph (to get rid of theparts before and afterthe actual motion tookplace).
Choose 2: SMOOTHDATA.
There are four options.Choose 2:MEDIUM.This is appropriate formost experiments.
This is the graph lightlysmoothed. (Compare itwith the actual dataplotted previously)
Discuss what smoothing actually does to thedata set. What values are no longer shown? Whyis this a good idea? What are thedisadvantages?
Try light and heavy smoothing and see their effecttoo.

Teachers Teaching with TechnologyTM
Activity 8: Ball bounce Teacher’s notes 3
(4) Removing irrelevant data
PressÍ and again choose 4:PLOT TOOLS.
This time chooseoption 1 to select thedomain.
Discuss which parts of the graph are showingirrelevant data. The calculator will allow you toselect a relevant part of the graph and look at itmore closely.
Select the left boundof the domain youwant using the left |and right ~cursorkeys. Keep an eye onthe X and Y values atthe bottom of thescreen too.
When you havedecided press Í .
Now in a similar wayyou need to select theright bound of thedomain you want andpress Í.
A new re-scaled graphis automaticallydisplayed between thepoints you chose.(Note: choose yourbounds with care, youcannot recover theoriginal graph).
Press Í to returnto the Plot Menu. Youcan now look at thethree different graphsand discuss theirinterpretation again
(5) Suggestions about data collection
It can be difficult to control the line of motion of theobject. It must remain in line with the sensorthroughout its motion.
The simplest situation to consider is an object suchas a heavy book falling under gravity. Clamp thesensor to an overhanging shelf or some highplace. Hold the book underneath it and let it fall.Remember that the sensor is only reliable fordistances more than 50cm and less than 6m.
What difference does it make to the graph if thesensor is placed below the object?
Does a heavy book fall faster than a light one?(Many students will think that it must.)
Investigate the effects of air resistance with a lightobject (but not so light it will float out of line!)
To record the bouncing of a ball it is best to use alarge one, such as a football or basketball with theCBR clamped above it. For more than one bounceit can be difficult to control the line of motion of theball. It must remain in line with the sensorthroughout its motion and, unless the floor isperfectly even the ball will often bounce out of line.
Another possibility for investigation is verticaloscillation on a spring: for example, attach theobject to a piece of elastic fixed below or abovethe CBR. Pull the object gently down and releaseit.
The Ranger software can also be used to createdistance-time graphs of students moving atdifferent speeds towards and away from the CBR,clamped horizontally.There are teacher notes and handouts to supportsuch an activity in Lesson 28 of30 Calculator Lessons for Key Stage 3 (A+BBooks).

Teachers Teaching with TechnologyTM s
Activity 9: Coins, marbles and dice Teacher’s notes
KS 3 Framework ref: Page 283-5
Strand: Handling DataTopic: ProbabilityPupils should be taught to: Collect and record
experimental data and estimateprobabliities based on data
Year group: 8Objectives: Estimate probabilities fromexperimental data. Understand that increasingthe number of times and experiment is repeatedgenerally leads to better estimates ofprobability. Compare experimental andtheoretical probabilities in different contexts.Key Vocabulary: Experimental, theoretical,
experiment, outcomeResources required: Class set of calculators
plus Viewscreenor TI-SmartViewemulator
This activity uses the software called Prob Sim--aprobability simulator that is one of the standard“Apps” supplied with TI calculators.
Summary
The aim of te activity is to estimate the theoreticalprobability from the experimental probability and toform a view of the extent to which the experimentalis a good indicator of the theoretical. Noteparticularly that, however many trials, theexperimental probabilities of the outcomes are veryunlikely be exactly equal to the theoreticalprobabilities!
To make this activity meaningful for students, it isbest to start the lesson (or devote the precedinglesson) to practical hands-on experiments with realdice, spinners etc. Students should be encouragedto sketch bar charts showing the outcomes ofthese experiments, so that they realise the powerof being able to quick produce accurate chartsfrom a large number of trials, something that thesoftware does well.
Instructions for the teacher
Using the demo calculator, set up the applicationand show how it works. You can follow theprocedure in Activities 1 and 2 of Handout 1.
Make a table on the board as shown. Repeatsingle coin tosses and fill in the table.
Toss Outcome Fractionof heads
Fractionof tails
1 H 1/1 0/1
2 H 2/2 2/2
3 T 2/3 1/3
4 H 3/4 1/4
Continue up to 10single coin tosses.
Increase the number of coin tosses by 10 bypressing q (below +10) and then by 50 bypressing r (below +50).Fill in the table with the new values. Notice thatthe handouts ask students to use approximatefractions.(e.g a bit more than half.) Howeveryou may prefer to show students to use theactual fractions.You can use the cursorkey ~ to see thefrequencies of tails andheads.
Questions:“What do you notice about the probabilities ofgetting a head or a tail” – they get closer to half aswe toss the coin more“Are there ever exactly half heads or tails?” – Well,the chances of that aree very low
Now repeat this experiment with other types oftrials, e.g. dice, pick marbles and spinner.Press o (below ESC)Press o (below ESCagain)Press o (below YES)This returns you to themain menu, where youcan choose a differentsimulation.
In each standard case, the theoretical probabilitiesof each outcome are equal. However, in the PickMarbles simulation, it is possible to modify thecomposition to make the outcomes different, andthis is explored in Activity 8 on Handout 3.

Teachers Teaching with TechnologyTM
Activity 9: Coins, marbles and dice Handout 1
1) First load the probability simulation:
2) Try using the simulation
3) Draw up a tableMake a copy of this table in your exercise book. It will need about 20 rows.
Toss number Outcome Fraction ofheads
Fraction oftails
On the calculator press p((below +1) to toss the coin.Fill in the fraction of heads and tails you have got so far.Throw again and fill in your table.Keep going until you have made 10 coin tosses and filled up 10 rows.
On your calculator press ŒUse the cursor † to place the highlightbeside the application Prob Sim like this.Press Í
Press any key
Press 1 to choose Toss Coins.
Notice the boxes at the bottom of thescreen. If you want to enter TOSS youpress the key below it marked p).
Do this and see what happens.
Try pressing p((below +1) a few times.
Try pressing q((below +10) and r((below +50)
To start again press s((below CLEAR) and press o((below YES)

Teachers Teaching with TechnologyTM
Activity 9: Coins, marbles and dice Handout 2
4) Lots more coin tossesPress q((below +10) and watch 10 more coin tosses all in one go!Fill in the table: remember this is now 20 coin tosses in total.Now you can probably only write an approximate fraction.For example write either a bit more than __
or a bit less than __or exactly __
Use +10 again. Fill in your table. Do this 5 more times.
Press r((below +50) and watch 50 more coin tosses.Fill in the table. Remember to add an extra 50 coin tosses to the total.
Repeat with +50 until your whole table is filled up.
Answer these questions in your exercise book:What do you notice about the probabilities of getting a head or a tail?Are there ever exactly half heads or tails?
5) A table for diceUse ESC to return to the main Prob Sim menu.Repeat the experiment using option 2: Roll DiceUse a table like this:
Roll number Outcome Fraction of1’s
Fraction of6’s
6) SpinningUse ESC to return to the main Prob Sim menu.Repeat the experiment s using option 4: Spin spinnerUse a table like this:
Spin number Outcome Fraction of1’s
Fraction of4’s

Teachers Teaching with TechnologyTM
Activity 9: Coins, marbles and dice Handout 3
7) A marbles tableUse ESC to return to the main Prob Sim menu.Repeat the experiment using option 3: Pick marbles.Use a table like this:
Pick number Outcome Fraction ofA’s
Fraction ofB’s
8) More marblesReturn to the main Prob Sim menu.Choose option 3: Pick marbles again.Press q((below SET).
Press p((below ADV).Enter 10 A’s, 20 B’s and noothers as shown here.
Return to the simulation by pressing s((below OK) twice.
Now repeat the experiment with the same table as above.
(a) What is the probability of drawing an A? (remember there are 30 marbles in the bag).(b) What is the probability of drawing a B?(c) What do you notice about the probabilities of getting marble A or B?
9) Even more marblesRepeat the experiment with different numbers of marbles, for example:
10 A’s, 10 B’s, 30 C’s, 50 D’s, 100 E’s.
Answer the same questions as for Activity 8.

Teachers Teaching with TechnologyTM
Activity 10: Cumulative frequency Teacher’s notes
Framework reference: Page 259
Strand: Handling data.Topic: Processing and representing data.Pupils should be taught to: Calculate statistics
from the data, using ICT asappropriate.
Year group: 9Objectives: Estimate the median and
interquartile range for a large set ofgrouped data.
Key Vocabulary: Median, interquartile range,cumulative frequency diagram,boxplot.
Resources required: Class set of calculatorsplus Viewscreenor TI-SmartViewemulator
Summary
This is very much a teacher-directed session anduses quite advanced calculator skills.It assumes that the students have already comeacross grouping data into class intervals.The lesson goes through the following stages:Generate data → Frequency table → Cumulativefrequency table → Cumulative frequency graph.Students then use the cumulative frequency graphto read off the values of the quartiles and themedian. Optionally, they will see another method offinding quartiles and median – using a ‘boxplot’.
Instructions for the teacher
(1) Revise grouping data into class intervals, byworking through Activities 1 and 2 using the democalculator. Explain how to calculate 1-Varsummaries of data from a single list (list L1) andfrequency data from two lists (lists L2 and L3).
The method described in Activity 1 of the handoutinvolves storing 100 randomly chosen integerscores, modelled by a normal distribution Ofcourse, there is no need for students tounderstand how or why this works--it is simply away of getting the same set of fairly realistic datainto all the calculators. (An alternative methodwould be to use link cables.)
(2) Distribute the calculators and handouts and askstudents to work through Activities 1 – 3.
The completed table in Activity 2 is shown in themext column.
Interval Mid-points Frequency 0 - 9 4.5 110 - 19 14.5 220 - 20 24.5 730 - 39 34.5 1240 - 49 44.5 1950 - 59 54.5 2660 - 69 64.5 2370 - 79 74.5 780 - 89 84.5 390 - 99 94.5 0
(3) Discuss with the class their responses to Activity3(c). The summaries are as follows
L1 L2,L3Min 6 4.5Q1 41.5 44.5Med 54 54.5Q3 61 64.5Max 87 84.5
The answers are different because transformingthe original data into a frequency table involved aloss of information. Summaries of frequency dataare based on the simplifying assumption that allthe values are centred on the interval that containsthem. So, scores like 31, 61, 72, 41, etc. will notmatch the frequency data well, whereas marks like45, 74, 36, 65 etc. will.
(4) Using the demo calculator, lead the classcarefully through Activities 4 and 5, emphasisingthat this is a ‘less than’ cumulative frequencygraph. i.e. it indicates how many students scoredless than the value plotted on the X axis. You willprobably need to explain quartiles and how theycan be read from a cumulative frequency graph.(Note that in Activity 5 taking horizontal values of25, 50 and 75 will not be exactly correct – forexample the median is halfway between the 50thand 51st value – but with a batch as large as thisthe error is negligible and can be ignored.)
(5) Then ask the class to tackle Activities 4 – 5.
(6) Boxplots provide a simple and intuitive meansof dealing with the median and quartiles, Handout3 provides an extension activity in which a boxplotof the data in L1 is super-imposed on thecumulative frequency graph.
This activity was first published in30 Calculator Lessons for Key Stage 3(A+B Books).
Calculator Maths: Handling Data, p 40provides activities to introduce students toboxplots.

Teachers Teaching with TechnologyTM
Activity 10: Cumulative frequency Handout 1
1) DataYou can make your calculator create 100 numbers that could representthe marks of 100 students.First, reset the calculator’s random facility. Press:
2 ¿ I | 1 ÍNow press:
I ~ 5 I | 6 50 ¢ 15 ¢ 100 ¤¿ y d Í
2) Frequency tableNow you are going to arrange all the L1 data into intervals of 0-9, 10-19, 20-29 etc.
(a) Draw up a table like this:
Interval Mid-points Frequency0–9 4.5 ...
10–19 14.5 ...20–29 ... ...20-29 ... ...30-39 ... ...40-49 ... ...50-59 ... ...60-69 ... ...70-79 ... ...80-89 ... ...90-99 ... ...
(b) In the second column enter all themid-points of the intervals. (Notice 4.5is halfway between 0 and 9.)
(c) Sort list L1 into ascending order. Todo this press …2yd¤Í
Return to the list screen (press …1)and scroll down the re-ordered list L1,counting the number of scores in each ofthe intervals 0-9, 10-19, 20-29, …Record these frequencies in the thirdcolumn of the table.
Use the frequency table to answer the following questions.(d) How many students scored between 30 and 39 inclusive?(e) How many students scored between 50 and 69 inclusive?(f) How many students scored less than 50?(g) How many students scored less than 70?(h) On your calculator enter the interval mid-points into list L2 and the frequencies into list L3.
(3) Summarising frequency data(a) Enter the command 1-Var Stats L1 (press …~ 1ydÍ).Scroll down the screen to find and write down the following summary values for L1.
Minimum, Lower quartile, Median, Upper quartile, Maximum.
(b) Enter the command 1-Var Stats L2,L3 and write down the same five summaryvalues for the frequency data in L2 and L3.
(c) Write a sentence comparing your answers to parts (a) and (b), explaining any similarities ordifferences.
Teachers Teaching with TechnologyTM
Activity 10: Cumulative frequency Handout 2
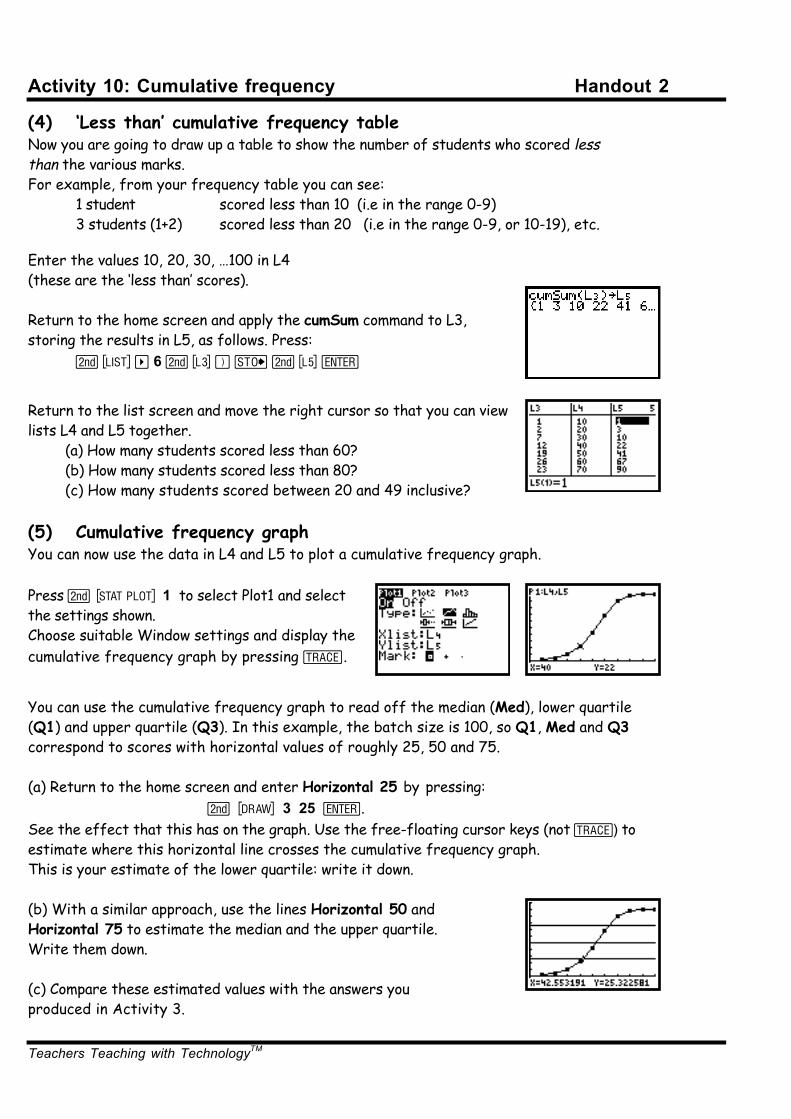
(4) ‘Less than’ cumulative frequency tableNow you are going to draw up a table to show the number of students who scored lessthan the various marks.For example, from your frequency table you can see:
1 student scored less than 10 (i.e in the range 0-9)3 students (1+2) scored less than 20 (i.e in the range 0-9, or 10-19), etc.
Enter the values 10, 20, 30, …100 in L4(these are the ‘less than’ scores).
Return to the home screen and apply the cumSum command to L3,storing the results in L5, as follows. Press:
y 9 ~ 6 y f ¤ ¿ y h Í
Return to the list screen and move the right cursor so that you can viewlists L4 and L5 together.
(a) How many students scored less than 60?(b) How many students scored less than 80?(c) How many students scored between 20 and 49 inclusive?
(5) Cumulative frequency graphYou can now use the data in L4 and L5 to plot a cumulative frequency graph.
Press y " 1 to select Plot1 and selectthe settings shown.Choose suitable Window settings and display thecumulative frequency graph by pressing r.
You can use the cumulative frequency graph to read off the median (Med), lower quartile(Q1) and upper quartile (Q3). In this example, the batch size is 100, so Q1, Med and Q3correspond to scores with horizontal values of roughly 25, 50 and 75.
(a) Return to the home screen and enter Horizontal 25 by pressing:y < 3 25 Í.
See the effect that this has on the graph. Use the free-floating cursor keys (not r) toestimate where this horizontal line crosses the cumulative frequency graph.This is your estimate of the lower quartile: write it down.
(b) With a similar approach, use the lines Horizontal 50 andHorizontal 75 to estimate the median and the upper quartile.Write them down.
(c) Compare these estimated values with the answers youproduced in Activity 3.

Teachers Teaching with TechnologyTM
Activity 10: Cumulative frequency Extension handout 3
(6) Boxplots
The calculator provides another way of displaying the median and quartiles--using a boxplot.
(a) Use Plot 2 to display a boxplot of the data in L1 on the samegraphing screen. Choose the settings shown here.
Press r and the left and right cursor keys to read off thefive key positions of the boxplot
(minX, Q1, Med, Q3 and maxX).Write them down.
(b) Work out and write down the value of the interquartile range, Q3 – Q1.
(c) Compare Q1, Med and Q3 values with the values you estimated fromthe cumulative frequency graph in Activity 5.How accurate was the estimate?
(d) The data in L2 and L3 are similar to the data in L1 but they are in a frequency format.
Set up Plot 3 to display a boxplot of the frequency data in L2and L3 on the same graphing screen. Choose the settings shownhere.Switch off the cumulative frequency graph (Plot1).
Plot the boxplots of L1 and L2,L3 on the same screens.Are there differences?Can you explain them? Think back to what you did in Activity 3.
Teachers Teaching with TechnologyTM
Photocopiable resources from A+B Books
First Lessons with graphics calculators ISBN 0-9541020-5-3
This book is exactly what your students need to start using graphics calculators in the classroom. Thereare 20 different First Lessons based on topics in Number, Algebra, Shape and Handling Data. Each onehas photocopiable worksheets, clear notes and solutions for the teacher as well as suggestions forfollow-up work. But each lesson assumes that the teacher and students have rarely used a calculatorbefore, so all calculator procedures are explained very clearly and simply, with key-presses for guidanceand screen displays for re-assurance.
30 Calculator Lessons for Key Stage 3 ISBN 0-9541020-0-2
Written by and for teachers and closely linked to the Framework for Teaching Mathematics: Years 7, 8 and9, this is an invaluable resource book for those wanting to exploit the power of the calculator in teachingmathematics at this level. Each lesson provides teacher notes and photocopiable worksheets for students.
30 Calculator Programs ISBN 0-9541020-3-7
Most students love creating their own calculator programs. We hope they won't be put off when theydiscover how much maths they learn in the process! This book includes photocopiable worksheets andteacher notes that will form the basis of 30 motivating lessons for students in the 11 to 16 age range.
Other books from A+B Books
There’s Calculator Maths, a series of 5 books dealing with the mathematics taught at KS 3 and4. A wealth of imaginative and fun ideas, using the graphics calculator as a learning tool to aidconcept formation, rather than just as a means of getting correct answers. Traditional mathstopics dealt with in a far-from-traditional manner!
And also, for older students, the 16+ series:Calculator Calculus, Calculator Statistics and Calculator Graphing.
All these books are appropriate for use with any of the Texas Instruments TI-83 or TI-84 families ofgraphics calculators.For special offers, more details or to order, please see the website: www.AplusB.co.uk.
Or contact A+B Books15 Top Lodge,Fineshade,Near Corby,NN17 3BB, UK01780-444360