ACTIVIDAD Y RESULTADOSweb3.cmvm.pt/english/sdi/emitentes/docs/FR46218.pdffinancial performance....
75
1 1 30 July 2013
Transcript of ACTIVIDAD Y RESULTADOSweb3.cmvm.pt/english/sdi/emitentes/docs/FR46218.pdffinancial performance....

1 1
30 July 2013
2 2 Important information Banco Santander, S.A. ("Santander") cautions that this presentation contains forward-looking statements. These forward-looking statements are found in various places throughout this presentation and include, without limitation, statements concerning our future business development and economic performance. While these forward-looking statements represent our judgment and future expectations concerning the development of our business, a number of risks, uncertainties and other important factors could cause actual developments and results to differ materially from our expectations. These factors include, but are not limited to: (1) general market, macro-economic, governmental and regulatory trends; (2) movements in local and international securities markets, currency exchange rates and interest rates; (3) competitive pressures; (4) technological developments; and (5) changes in the financial position or credit worthiness of our customers, obligors and counterparties. The risk factors that we have indicated in our past and future filings and reports, including those with the Securities and Exchange Commission of the United States of America (the “SEC”) could adversely affect our business and financial performance. Other unknown or unpredictable factors could cause actual results to differ materially from those in the forward-looking statements.
Forward-looking statements speak only as of the date on which they are made and are based on the knowledge, information available and views taken on the date on which they are made; such knowledge, information and views may change at any time. Santander does not undertake any obligation to update or revise any forward-looking statement, whether as a result of new information, future events or otherwise.
The information contained in this presentation is subject to, and must be read in conjunction with, all other publicly available information, including, where relevant any fuller disclosure document published by Santander. Any person at any time acquiring securities must do so only on the basis of such person's own judgment as to the merits or the suitability of the securities for its purpose and only on such information as is contained in such public information having taken all such professional or other advice as it considers necessary or appropriate in the circumstances and not in reliance on the information contained in the presentation. In making this presentation available, Santander gives no advice and makes no recommendation to buy, sell or otherwise deal in shares in Santander or in any other securities or investments whatsoever.
Neither this presentation nor any of the information contained therein constitutes an offer to sell or the solicitation of an offer to buy any securities. No offering of securities shall be made in the United States except pursuant to registration under the U.S. Securities Act of 1933, as amended, or an exemption therefrom. Nothing contained in this presentation is intended to constitute an invitation or inducement to engage in investment activity for the purposes of the prohibition on financial promotion in the U.K. Financial Services and Markets Act 2000.
Note: Statements as to historical performance or financial accretion are not intended to mean that future performance, share price or future earnings (including earnings per share) for any period will necessarily match or exceed those of any prior year. Nothing in this presentation should be construed as a profit forecast.
The businesses included in each of our geographic segments and the accounting principles under which their results are presented here may differ from the included businesses and local applicable accounting principles of our public subsidiaries in such geographies. Accordingly, the results of operations and trends shown for our geographic segments my differ materially from those of such subsidiaries.

3 3
Agenda
■ Group performance
— 2Q13 highlights
— Results
■ Business areas performance
■ Conclusions
■ Appendix
4 4
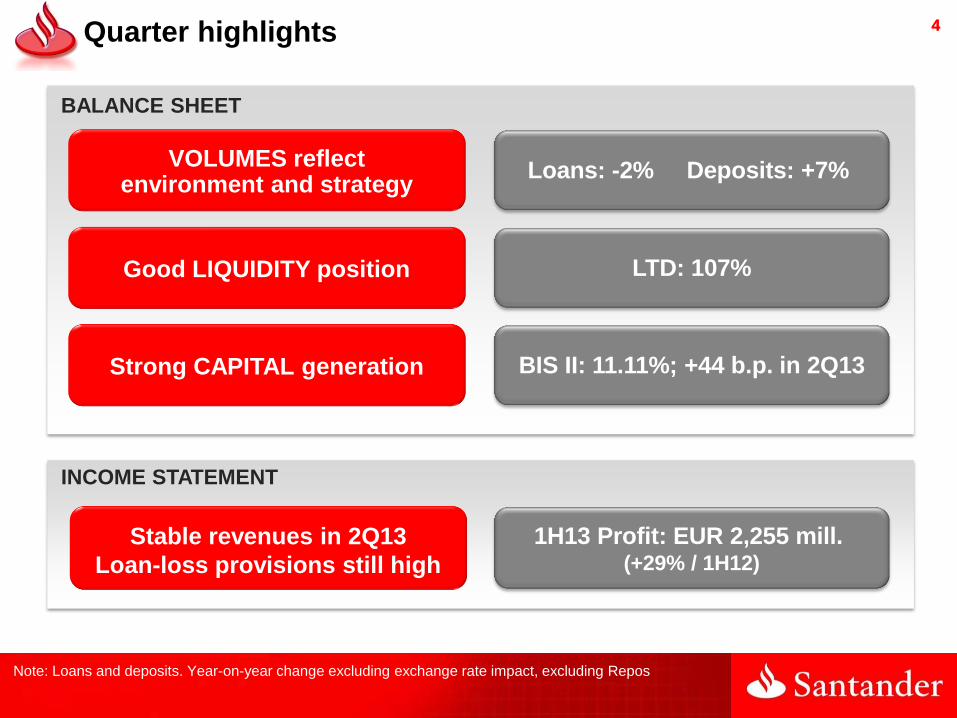
Quarter highlights
Strong CAPITAL generation
Good LIQUIDITY position
VOLUMES reflect environment and strategy
BIS II: 11.11%; +44 b.p. in 2Q13
LTD: 107%
Loans: -2% Deposits: +7%
Stable revenues in 2Q13
Loan-loss provisions still high
1H13 Profit: EUR 2,255 mill. (+29% / 1H12)
BALANCE SHEET
INCOME STATEMENT
Note: Loans and deposits. Year-on-year change excluding exchange rate impact, excluding Repos

5 5
Low-growth macroeconomic environment, expected to improve in 2014
Note: Average GDP data and oficial interest rates have been weighted by the profit share of the 10 core
countries where Santander Group operates.
Interest rates at minimum levels in mature markets and
average fall of 140 b.p. (-20%) in emerging ones
1
1H12 1H13 e 2014 IMF e
+0.6% +0.1%
+1.4%
1H12 1H13 e 2014 IMF e
+2.4% +2.3%
+3.3%
Emerging 56%
Mature 44%
1H13 Attributable profit
1H12 1H13 e 2014IMF e
+1.7% +1.5%
+2.5%
Group footprint
avg. GDP growth
Emerging countries
avg. GDP growth
Mature countries
avg. GDP growth

6 6
Loans and deposits1 evolution
1
Emerging2
Var. Jun’13 / Jun’12
Loans Deposits
+12% +12%
Mature
Loans Deposits
-6%
+6%
Deleveraging scenario in mature markets
Balanced growth in emerging markets
Santander Group
Loans Deposits
-2%
+7%
(1) Year-on-year change excluding exchange rate impact, excluding Repos (2) Excluding KB perimeter effect, +6% in loans and +6% in deposits

7 7
Group focus in recent quarters led to liquidity improvement
Dec'08 Dec'12 Jun'13
150%
113% 107%
2
Net loan-to-deposit ratio2
(1) Difference net loans/deposits (including retail commercial paper). (2) Including retail commercial paper.
FY 2012 1H13
Reduction of commercial1 gap
-EUR 33 bn. Business generated EUR 63 bn.
of liquidity in 18 months
No need for issuances
Liquidity ratios
continue to improve
At very comfortable levels
-EUR 30 bn.

8 8
Strong organic capital generation in the quarter
BIS II Core capital ratio
Dec'11 Dec'12 Mar'13 Jun'13
10.02% 10.33%
10.67%
11.11%
+44 b.p. in the quarter
Dec'12 Mar'13 Jun'13
6.41% 6.41%
6.80%
Leverage ratio1 (according to IMF criteria)
(1) Shareholders' equity / total assets
(2) With DTAs at 2019
BIS III
Core Capital
Phase-in: always above 11% throughout the period
Fully-Loaded2: always above 9%
Low additional capital buffer for systemic risk:
Santander 100 b.p. vs. up to 250 b.p. in other G-SIFIs (160 b.p. average)
3
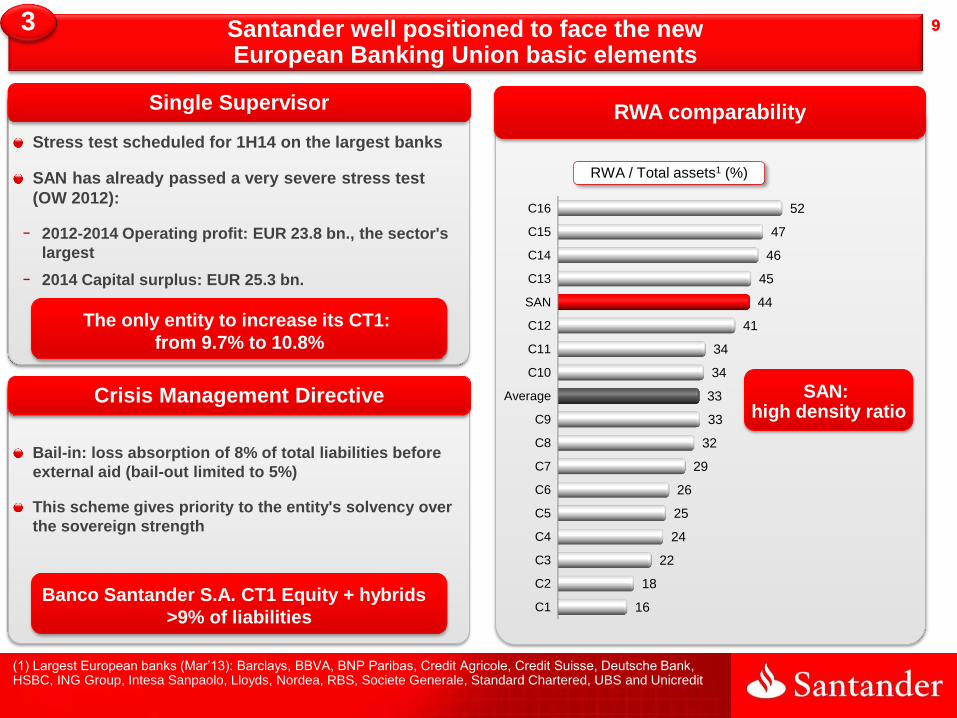
9 9 Santander well positioned to face the new European Banking Union basic elements
(1) Largest European banks (Mar’13): Barclays, BBVA, BNP Paribas, Credit Agricole, Credit Suisse, Deutsche Bank, HSBC, ING Group, Intesa Sanpaolo, Lloyds, Nordea, RBS, Societe Generale, Standard Chartered, UBS and Unicredit
Single Supervisor
Crisis Management Directive
3
Stress test scheduled for 1H14 on the largest banks
SAN has already passed a very severe stress test
(OW 2012):
− 2012-2014 Operating profit: EUR 23.8 bn., the sector's
largest
− 2014 Capital surplus: EUR 25.3 bn.
Banco Santander S.A. CT1 Equity + hybrids
>9% of liabilities
Bail-in: loss absorption of 8% of total liabilities before
external aid (bail-out limited to 5%)
This scheme gives priority to the entity's solvency over
the sovereign strength
The only entity to increase its CT1:
from 9.7% to 10.8%
RWA comparability
C1
C2
C3
C4
C5
C6
C7
C8
C9
Average
C10
C11
C12
SAN
C13
C14
C15
C16
16
18
22
24
25
26
29
32
33
33
34
34
41
44
45
46
47
52
RWA / Total assets1 (%)
SAN: high density ratio
10 10
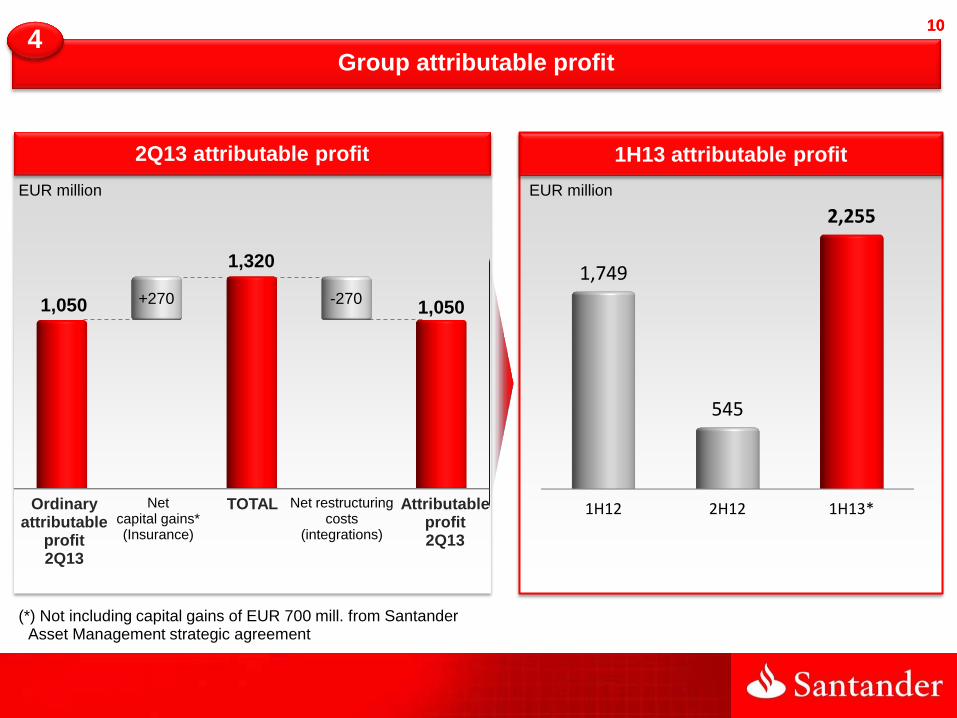
2Q13 attributable profit
1H12 2H12 1H13*
1,749
545
2,255
1H13 attributable profit
EUR million
Group attributable profit 4
1,050
1,320
1,050 +270 -270
EUR million
Net restructuring costs
(integrations)
Attributable profit 2Q13
Net capital gains* (Insurance)
Ordinary attributable
profit 2Q13
TOTAL
(*) Not including capital gains of EUR 700 mill. from Santander Asset Management strategic agreement

11 11
1H13 Var. / 1H12 2Q13 Var. / 1Q13 % %* %
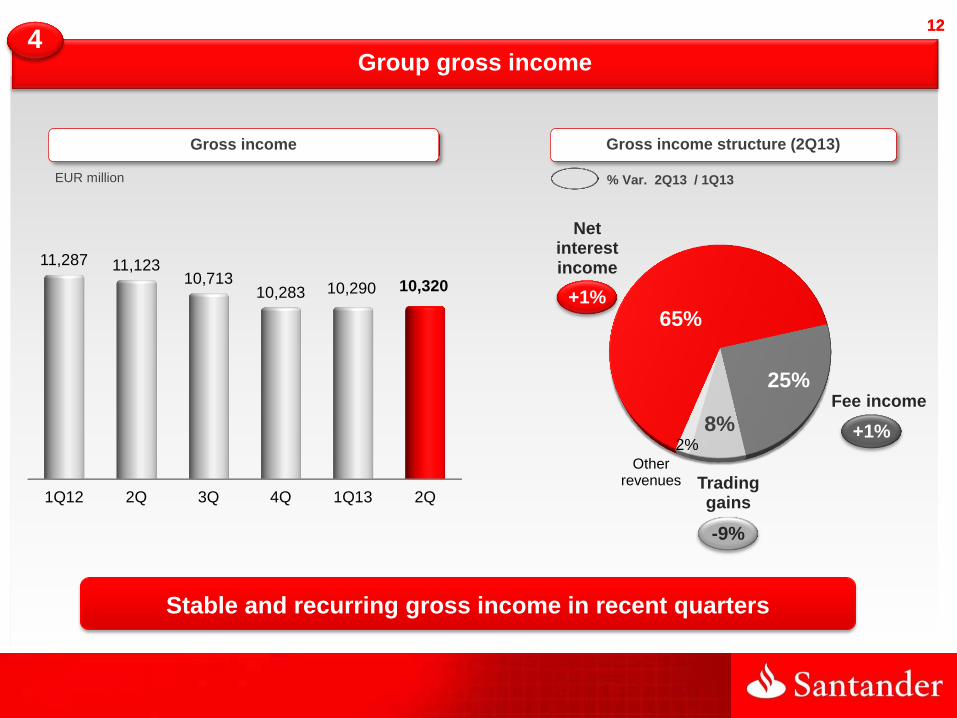
Gross income 20,610 -8.0 -4.0 10,320 0.3
Operating expenses -9,996 0.2 3.3 -5,000 0.1
Net operating income 10,614 -14.6 -9.8 5,320 0.5
Loan-loss provisions -5,984 -8.2 -3.6 -3,065 5.0
Other results -913 -12.9 -9.6 -542 45.8
PBT 3,717 -23.6 -18.1 1,713 -14.5
Net profit 2,814 -20.0 -13.4 1,306 -13.4
Attributable profit 2,255 28.9 50.6 1,050 -12.8
EUR million
(*) Excluding perimeter and exchange rate impacts. Irrelevant exchange rate impact in the quarter (approx. 0.7 p.p.)
Santander Group Results
In the quarter, stable gross income with still high provisions
1H13 1H12 2Q13 1Q13
Capital gains 270 619 270 0
Provisions -270 -1,923 -270 0
12 12
EUR million
Gross income structure (2Q13) Gross income
1Q12 2Q 3Q 4Q 1Q13 2Q
11,287 11,123 10,713
10,283 10,290 10,320
Group gross income 4
65%
25%
8% 2%
Stable and recurring gross income in recent quarters
Net interest income
Fee income
Trading gains
Other revenues
+1%
-9%
+1%
% Var. 2Q13 / 1Q13

13 13
1Q12 2Q 3Q 4Q 1Q13 2Q
5,043 4,934 5,067 4,939 4,996 5,000
Efficiency better than peers and potential for improvement
(1) Operating expenses / Gross income
“Peer Group”: Banco Itaú, BBVA, BNP Paribas, Credit Suisse, HSBC, ING Group, Intesa Sanpaolo, JP Morgan, Mitsubishi, Nordea, Royal Bank of Canada, Societe Generale, UBS, Unicredito and Wells Fargo.
GrupoSantander
Peers average Europeanpeers avg.
48.6
60.1 61.7
Group operating expenses 4
Flat costs with different evolution by unit
EUR million
Operating expenses Efficiency ratio1 vs Peers (%)
1Q13 data

14 14
3.98 4.11 4.34
4.54 4.76
4.92
Mar'12 Jun'12 Sep'12 Dec'12 Mar'13 Jun'13
61
64
70 72 71
69
%
High coverage ratio
following effort made in 2012
Maintained trend on a like-for-like basis
Impact from reclassification of substandard loans in Spain
Credit quality. Group's NPL and coverage ratios 4
CoverageRatio
NPL Ratio
66
5.18
Including reclassification of substandard operations in Spain

15 15
Increase due to companies
and reduced denominator
Additionally, reclassification
(1) % / operating areas
Credit quality. NPL ratio by unit (%) 4
Stable both in retail and corporate
Announced NPLs improvement
trend confirmed
Loans to customers1 (net)
UK
Brazil
Spain
1.83 1.94 2.05 2.03 2.01
J'12 S'12 D'12 M'13 J'13
3.26 3.64 3.84 4.12 4.76
J'12 S'12 D'12 M'13 J'13
6.51 6.79 6.86 6.90
6.49
J'12 S'12 D'12 M'13 J'13
5.75
Including reclassification of interest only mortgages in Spain
Spain 25%
Portugal 4%
Poland 2%
Germany 4% Run-off real estate 1%
Other Europe 4%
United Kingdom
34%
USA 6%
Brazil 10%
Mexico 3%
Chile 4%
Other LatAm 3%

16 16
Group provisions
Net loan-loss provisions
Real estate provisions in Spain
1Q12 2Q 3Q 4Q 1Q13 2Q
3,118 3,401 2,987 3,134 2,919 3,065
2,780 2,230
1,130
EUR million
4
1.51 1.91
2.20 2.38 2.38 2.05
Cost of credit = 12 months net loan-loss provisions / average lending
Cost of
credit (%)
Lower cost of credit after
the effort made in 2012
In the quarter, higher
in Spain and Mexico …
… lower in other large units:
Brazil, UK, USA, SCF and Chile
17 17
■ Group performance
— 2Q13 highlights
— Results
■ Business areas performance
■ Conclusions
■ Appendix
Agenda

18 18
Business areas
High diversification by geography in profit generation
Poland 5%
Brazil 25%
Mexico 12%
Chile 6%
Other LatAm 8%
USA 12%
United Kingdom
13%
Germany 5%
Portugal 1%
Spain 8%
Other Europe 5%
Ordinary attributable profit in 1H13(1)
(1) Over operating areas ordinary attributable profit excluding run-off real estate in Spain

19 19
Activity
Spain*
Market share gain in deposits: +270 b.p. in 18 months
Improved net interest income in the quarter (+4%)
Provisions higher in the quarter due to companies. Lower year-on-year
Loans Deposits
-4%
+19%
Var. Jun’13 / Jun’12
Volumes1 Term deposits cost – New deposits EUR million
2.37%
3.05%
2.04% 1.54%
2Q12 4Q12 1Q13 2Q13
2Q13 % 1Q13 1H13 % 1H12
Gross income 1,794 -1% 3,609 -10%
Expenses -951 -1% -1,913 -1%
LLP -690 +34% -1,205 -14%
Attributable profit 86 -58% 294 -27%
P&L
(*) Including former retail networks of Santander, Banesto and Banif, Global Banking&Markets Spain, Santander AM Spain, Insurance Spain and ALCO in Spain. Excluding SCF Spain and Spain's run-off real estate.
(1) Excluding Repos. Deposits include retail commercial paper.

20 20
Spain
Jun'12 Mar'13 Jun'13
18 18 18 15 10 7
90 88 88
14 13 12
53 52 51
190 181 176 TOTAL
Gross loans Deposits
EUR billion EUR billion
Public sector
Companies
Other loans to individuals
Household mortgages
Repos
Lower demand for loans to individuals
Stable loans to companies
− Actions: Plan 10.000, EIB and ICO
Commercial gap naworring: EUR 33 bn. in 12 months
In 2Q13 demand and time deposits, and mutual funds continued to increase
Jun'13
90
96
8 7
201 TOTAL
Spain LTD: 85%
Demand deposits
Time deposits
Retail commercial paper Repos

21 21
Spain. NPL ratio and entries
Other loans to individuals
Companies w/o real estate purpose
(1) Gross NPL entries by calendar (before recoveries)
Stable household mortgages NPLs
Companies continue to worsen
Total NPL ratio impacted by reclassification
Consumer
Cards
100
207 235
144
216 219 234 287 266 283 300
100
154 164
96 100 89
107 105 103 95 80
100
165 157
101 76 67 62 56 56 55 44 100
138 142
88 64 53 48 48 47 53 50
1H08 2H 1H09 2H 1H10 2H 1H11 2H 1H12 2H 1H13
Base 100: 1H08
Mortgages to individuals
3.35 3.26 3.64
3.84 4.12
4.76
Mar 12 Jun 12 Sep 12 Dec 12 Mar 13 Jun 13
5.75
NPL ratio (%) Entries1 NPL+90 days

22 22
3.28%
2.56% 2.51% 2.27%
2Q12 4Q12 1Q13 2Q13
Activity
Portugal
Santander is the country's most solid franchise. Market share gain in deposits
More stable revenues in the quarter: lower funding cost and higher fee income
Moderate provisions in the last three quarters, after effort made in previous ones
Loans Deposits
-7%
-1%
Var. Jun’13 / Jun’12
Volumes1 Time deposits cost – New deposits EUR million
2Q13 % 1Q13 1H13 % 1H12
Gross income 233 +1% 465 -21%
Expenses -122 -2% -246 -3%
LLP -62 -2% -126 -43%
Attributable profit 25 +16% 46 -34%
P&L
(1) Excluding Repos
-1% / 1Q13
-1% / 1Q13

23 23
Activity
Poland
Constant EUR million
2Q13 % 1Q13 1H13 % 1H12
Gross income 342 +8% 658 +41%
Expenses -145 -8% -302 +42%
LLP -52 +24% -93 +75%
Net profit 124 +37% 214 +31%
Attributable profit 91 +30% 161 +2%
P&L
Loans Deposits
+81% +62%
Integration ahead of schedule: increased productivity and lowered costs
Volumes reflect KB expensive deposits reduction and higher funds (+8% / Mar'13)
Revenues (NII and fees) rose in a low interest rate environment (-225 b.p. in 9 months)
Var. Jun’13 / Jun’12
Volumes1 Stock deposits2 cost
3.00% 3.19%
3.07%
2.51%
2Q12 4Q12 1Q13 2Q13
+2% / 1Q13
-3% / 1Q13
(1)Local currency. Excluding Repos
(2) Perimeter cost for each date

24 24
Activity
Santander Consumer Finance – Continental Europe
Market share gain: stable portfolio amid a recession market
Excellent credit quality and higher profitability than peers
All P&L lines performed well in the quarter
EUR million
2Q13 % 1Q13 1H13 % 1H12
Gross income 775 0% 1,551 -3%
Expenses -341 -3% -692 +3%
LLP -131 -24% -302 -19%
Attributable profit* 201 +14% 377 -1%
P&L
* Not including Santander Consumer UK profit, as it is recorded in Santander UK. If included, 1H13 attributable proft: EUR 433 mill. (+2% year-on-year)
2Q12 4Q12 1Q13 2Q13
2.1% 2.1% 2.3%
2.5%
NII – Provisions / ATAs
Prov.
NII 3.17% 3.19% 3.26% 3.24% 1.09% 1.08% 0.95% 0.73%
Gross loans: EUR 59 bn.
% / total
52
14
12
11 5 6
Germany
Nordic countries
Poland
Other
Italy
Spain
1H13 / 1H12 new lending:
-3% SCF vs. -9% sector1
(1) New car sales in the footprint.

25 25
Total Balance
Spain's run-off real estate1
Real estate exposure dropped 39% in the last twelve months …
.. and coverage continues to be above 50%
1H13 attributable profit: -EUR 337 mill. (-EUR 162 mill. in 2Q13)
Coverage ratio
(1) Including foreclosed real state and equity stakes (Metrovacesa and Sareb)
Mar'12 Jun'12 Sep'12 Dec'12 Mar'13 Jun'13
17.4 14.1
10.6 7.3 6.8 6.5
4.4
4.2
4.2
3.7 3.7 3.6
22.6
19.0
15.5
12.3 11.9 11.6
Loans Foreclosures
51% 54%
Net foreclosures
Net loans
Equity stakes
Buildings: 42%
Land: 61%
EUR billion
26 26
United Kingdom
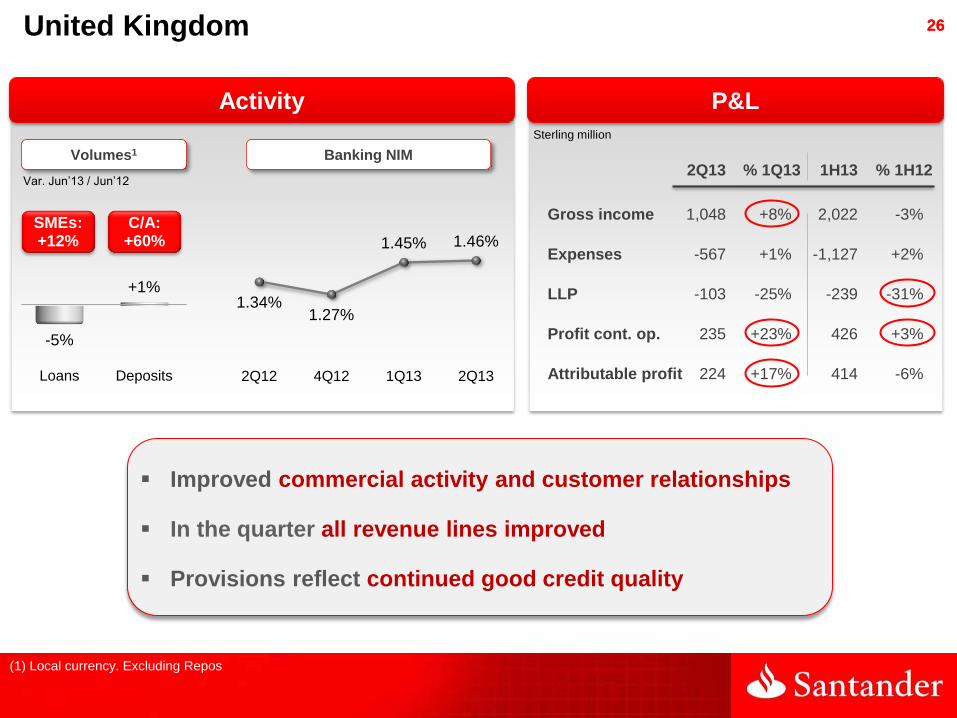
Improved commercial activity and customer relationships
In the quarter all revenue lines improved
Provisions reflect continued good credit quality
Loans Deposits
-5%
+1%
Var. Jun’13 / Jun’12
Volumes1 Banking NIM
Sterling million
1.34% 1.27%
1.45% 1.46%
2Q12 4Q12 1Q13 2Q13
SMEs: +12%
C/A: +60%
2Q13 % 1Q13 1H13 % 1H12
Gross income 1,048 +8% 2,022 -3%
Expenses -567 +1% -1,127 +2%
LLP -103 -25% -239 -31%
Profit cont. op. 235 +23% 426 +3%
Attributable profit 224 +17% 414 -6%
Activity P&L
(1) Local currency. Excluding Repos

27 27 United Kingdom
Dec'10 Jun'12 Jun'13
12.3 13.3
21.3 Selective deposit growth
Current accounts (£ bn.)
Source: PRA - Financial Policy Committee exercise on capital published 20 June 2013 by the Bank of England. Minimum regulatory requirement of 7%
Relationship strategy via 1|2|3 product range
Dec'10 Jun'12 Jun'13
7% 9%
11% Better balance sheet
mix
Mix of Corporates / Total loans
Market share gain in SMEs:
+110 bp in 18 months
Strong capitalisation according to stress test
Stress CET1 (PRA)
No requirement to raise additional capital
C1 C2 C3 C4 SAN UK
4.8% 4.5% 6.4%
8.0% 9.0%

28 28
Loans Deposits
+6% +6%
P&L
Brazil
In the quarter, volumes recovery and greater stability of net interest income. Fee income increased for the fourth consecutive quarter
Expenses rose below inflation
Loan-loss provisions reflect the improved NPLs evolution
2Q13 % 1Q13 1H13 % 1H12
Gross income 3.603 -4% 7.354 -6%
Expenses -1.375 +2% -2.726 +2%
LLP -1.388 -5% -2.844 -2%
Attributable profit 425 -14% 919 -11%
+3% / 1Q13
+4% / 1Q13
Var. Jun’13 / Jun’12
Volumes1
Constant EUR million
Activity
2H12 4H12 1H13 2H13
4.2% 4.0% 3.5% 3.5%
NII – Provisions / ATAs
Prov.
NII 8.65% 7.67% 7.29% 7.10% 4.50% 3.71% 3.83% 3.59%
(1) Local currency. Excluding Repos. Deposits include letras financieras

29 29
1Q12 2Q 3Q 4Q 1Q13 2Q
1,295
1,621
1,433 1,400 1,456 1,388
Credit quality
Brazil
Gross income
NPL ratio
12.0% 12.3% 11.8% 11.2% 11.1%
10.5% Average
SELIC rate
SAN
10.3% 8.9% 7.8%
7.2% 7.1% 7.5%
1Q12 2Q 3Q 4Q 1Q13 2Q
Loans spreads
Constant EUR million
5.76%
6.51% 6.79% 6.86% 6.90%
6.49%
Mar'12 Jun'12 Sep'12 Dec'12 Mar'13 Jun'13
Consumer Auto Cards Payrolls Mortgages SMEs /Companies
Largecompanies
Total
2% -3% 3% 4%
28%
10% 4% 6%
Var. Jun’13 / Jun’12
Lending portfolio
Net interest income impacted by lower spreads and change of mix towards
lower risk products
Improved early arrears (<90 days) start to show in the NPL ratio
and the cost of credit
LLP and cost of credit2
(1) Consumer = Cheque and personal loans (2) Cost of credit = 12 months net loan-loss provisions / average lending
Loan-loss provisions Cost of credit
1 6.13% 6.61%
6.86% 7.38% 7.46%
7.07%

30 30
Mexico
Volume growth amid a reduced business activity scenario. Market share gain in strategic business (SMEs, mortgages and insurance)
Net interest income recovery in the quarter (+2%). Revenues at double-digit growth y-o-y
Provisions affected by homebuilders ("vivienderas") and consumer
Loans Deposits
+6%
+14%
2Q13 % 1Q13 1H13 % 1H12
Gross income 789 0% 1,575 +14%
Expenses -303 -1% -608 +16%
LLP -182 +26% -326 +75%
Net profit 259 -19% 579 0%
Attributable profit2 196 -20% 441 -24%
Var. Jun’13 / Jun’12
Volumes1
Constant EUR million
Activity P&L
+4% / 1Q13
+1% / 1Q13
(1) Local currency. Excluding Repos.
(2) Higher minority interests year-on-year after IPO
NII / ATAs
3.92% 4.19% 4.08%
3.85%
2Q12 4Q12 1Q13 2Q13
31 31
Chile
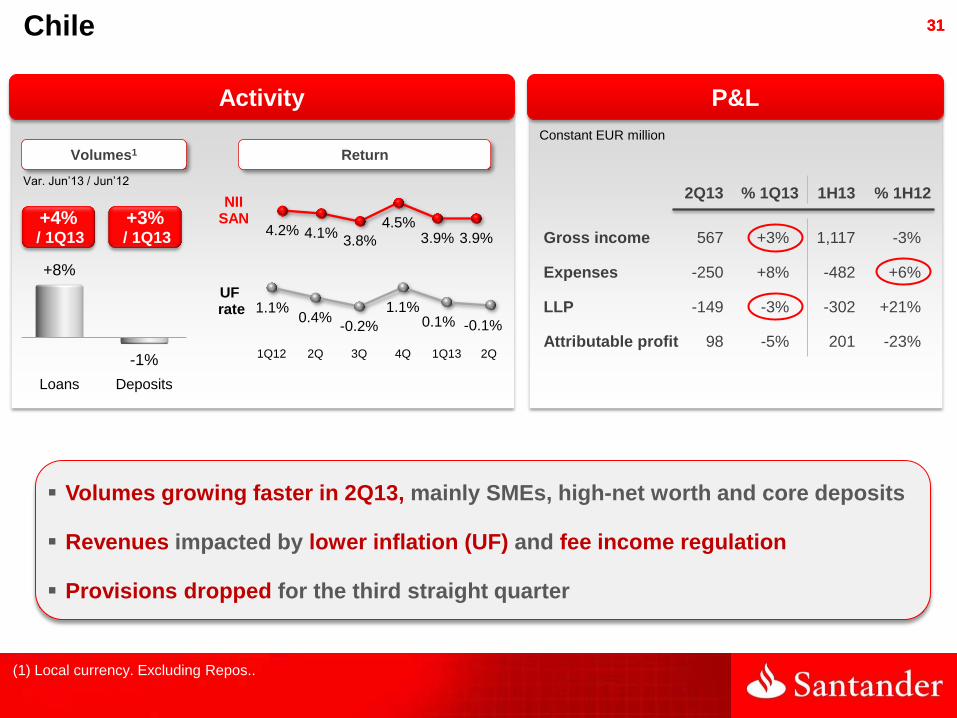
Volumes growing faster in 2Q13, mainly SMEs, high-net worth and core deposits
Revenues impacted by lower inflation (UF) and fee income regulation
Provisions dropped for the third straight quarter
Loans Deposits
+8%
-1%
Return
2Q13 % 1Q13 1H13 % 1H12
Gross income 567 +3% 1,117 -3%
Expenses -250 +8% -482 +6%
LLP -149 -3% -302 +21%
Attributable profit 98 -5% 201 -23%
Var. Jun’13 / Jun’12
Volumes1
(1) Local currency. Excluding Repos..
Constant EUR million
Activity P&L
4.2% 4.1% 3.8%
4.5% 3.9% 3.9%
UF rate
NII SAN
1.1% 0.4%
-0.2%
1.1% 0.1% -0.1%
1Q12 2Q 3Q 4Q 1Q13 2Q
+4% / 1Q13
+3% / 1Q13
32 32
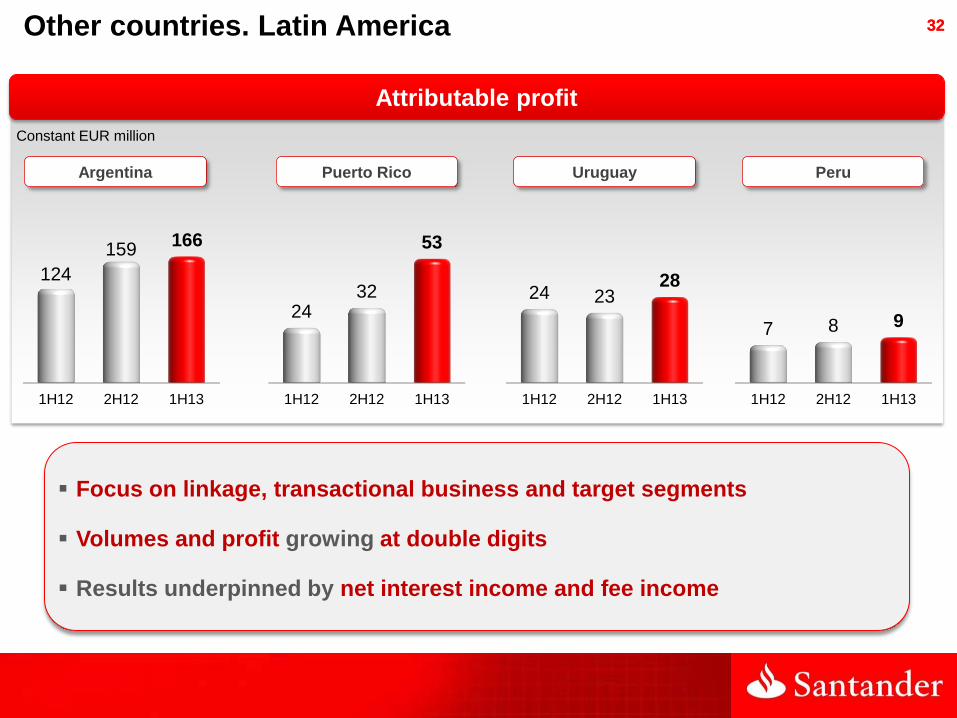
Other countries. Latin America
Focus on linkage, transactional business and target segments
Volumes and profit growing at double digits
Results underpinned by net interest income and fee income
Argentina
Constant EUR million
Attributable profit
1H12 2H12 1H13
124
159 166
1H12 2H12 1H13
24 32
53
1H12 2H12 1H13
24 23 28
1H12 2H12 1H13
7 8 9
Puerto Rico Uruguay Peru

33 33
Activity P&L
USA
Sovereign: in line with transformation plan
− Revenues impacted by spreads contraction, and non-core portfolios reduction
− Costs from franchise development (new cards platform and mobile app)
− Sharp provisions reduction due to good credit quality
SCUSA: growing new lending and contribution to results
Loans Deposits
-4%
+1%
2Q13 % 1Q13 1H13 % 1H12
Gross income 717 -11% 1,519 -13%
Expenses -390 0% -782 +5%
LLP -6 -82% -42 -78%
Attributable profit 248 -19% 555 -5%
Sovereign Bank 146 -9% 306 -15%
SCUSA 102 -31% 249 +9%
US$ million
Var. Jun’13 / Jun’12
Gross loans New loans
+22%
+103%
Sovereign Bank1 SCUSA2
Corporate: +3%
Retail: +5%
Var. Jun’13 / Jun’12
(1) Local currency. Excluding Repos.
(2)Excluding contribution from Chrysler agreement: loans +10%; new lending +47%

34 34
P&L
Corporate Activities
Losses in line with 1H12:
− Higher funding cost, partly affected by liquidity buffer
− Increased trading gains
1H13 1H12
Gross income -470 -510
Expenses -356 -327
Provisions, tax and
minority interests -242 -91
Ordinary attributable profit -1,068 -928
EUR million

35 35
■ Group performance
— 2Q13 highlights
— Results
■ Business areas performance
■ Conclusions
■ Appendix
Agenda

36 36 In the first half of 2013
Activity
Volumes evolution reflected environment and strategy to strengthen the balance sheet
− Increased lending in emerging markets and drop in mature ones due to deleveraging
− Focus on deposits in all geographic areas, with emphasis on pricing
Good liquidity position reducing the need for wholesale funding
High capital generation and well positioned before the EBU comes into effect in 2014
Results
Stable revenues amid an unfavourable environment
− In 2Q13, net interest income and fee income increased slightly
Costs slowing down with potential for further decline in the coming quarters
Provisions still high due to Spain, lower in the rest of the Group
Commercial
activity
Integrations underway: completing stages ahead of envisaged
New Global Division of Retail Banking: promoting retail business
− Focus on SMEs (projects in Spain, the UK and Latam), high net-worth clients (Select)
Strategic agreement to promote Santander Asset Management
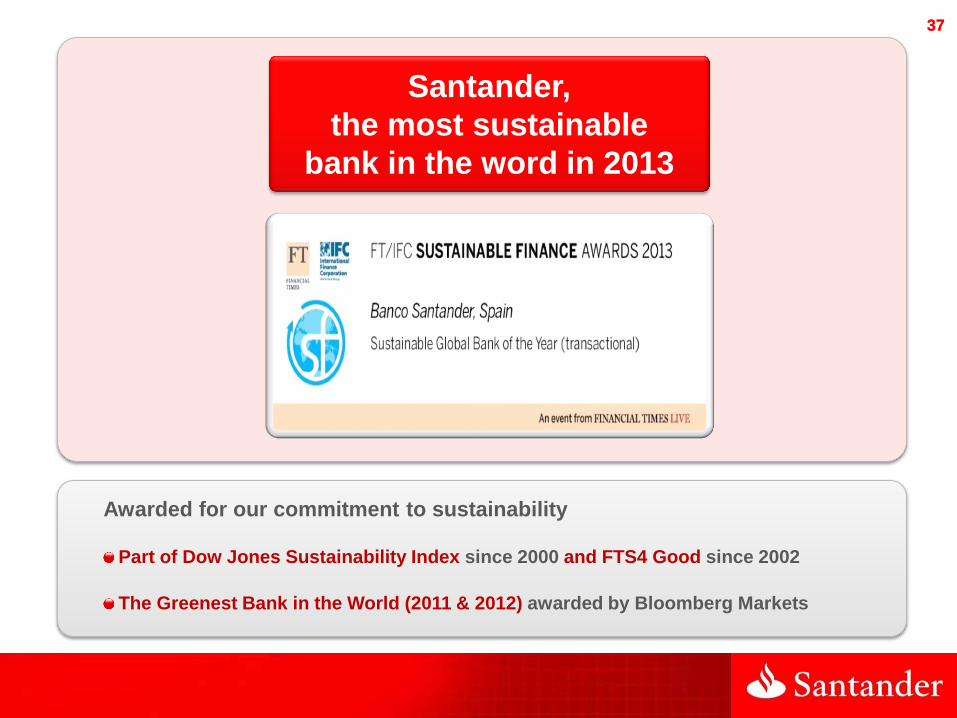
37 37
Santander,
the most sustainable
bank in the word in 2013
Awarded for our commitment to sustainability
Part of Dow Jones Sustainability Index since 2000 and FTS4 Good since 2002
The Greenest Bank in the World (2011 & 2012) awarded by Bloomberg Markets

38 38
■ Group performance
— 2Q13 highlights
— Results
■ Business areas performance
■ Conclusions
■ Appendix
Agenda
39 39
Group's balance sheet
Appendix
Liquidity and Funding
Secondary segments results
NPLs, coverage ratios and cost of credit
Spreads
Quarterly income statement

40 40
Group's balance sheet
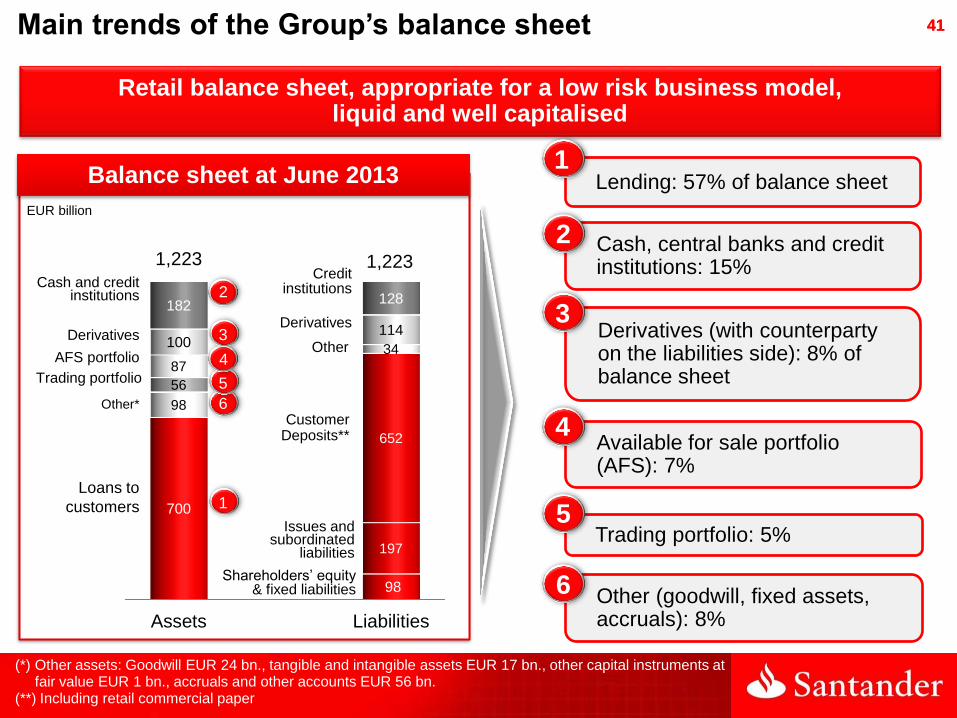
41 41 Main trends of the Group’s balance sheet
Retail balance sheet, appropriate for a low risk business model, liquid and well capitalised
Balance sheet at June 2013
EUR billion
1
6
5
4
3
2
Lending: 57% of balance sheet
Derivatives (with counterparty on the liabilities side): 8% of balance sheet
Cash, central banks and credit institutions: 15%
Other (goodwill, fixed assets, accruals): 8%
Available for sale portfolio (AFS): 7%
Trading portfolio: 5%
1
3
2
4
5
6
Loans to
customers
Derivatives
Cash and credit institutions
Other*
AFS portfolio
Customer Deposits**
Issues and subordinated
liabilities
Shareholders’ equity & fixed liabilities
Credit institutions
Other
Derivatives
(*) Other assets: Goodwill EUR 24 bn., tangible and intangible assets EUR 17 bn., other capital instruments at fair value EUR 1 bn., accruals and other accounts EUR 56 bn.
(**) Including retail commercial paper
Trading portfolio
Assets Liabilities
700
98
98
197
56
652
87
34 100
114
182 128
1,223 1,223

42 42
Liquidity and Funding
43 43
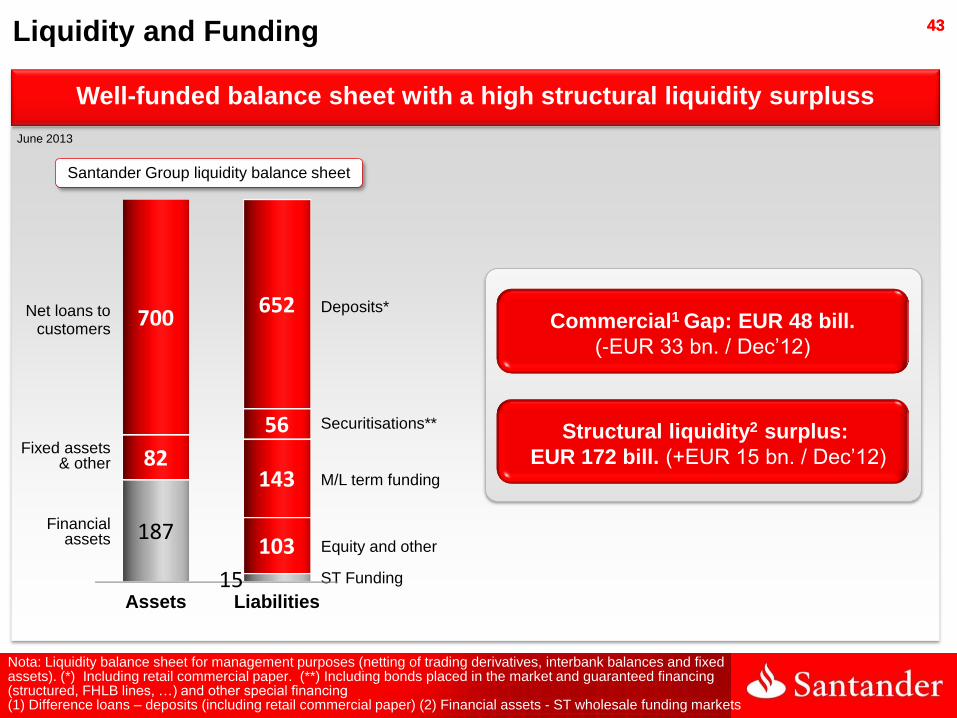
Well-funded balance sheet with a high structural liquidity surpluss
Liquidity and Funding
Nota: Liquidity balance sheet for management purposes (netting of trading derivatives, interbank balances and fixed assets). (*) Including retail commercial paper. (**) Including bonds placed in the market and guaranteed financing (structured, FHLB lines, …) and other special financing (1) Difference loans – deposits (including retail commercial paper) (2) Financial assets - ST wholesale funding markets
Net loans to customers
Deposits*
M/L term funding
Financial assets Equity and other
ST Funding
Securitisations**
Santander Group liquidity balance sheet
June 2013
Structural liquidity2 surplus:
EUR 172 bill. (+EUR 15 bn. / Dec’12)
Commercial1 Gap: EUR 48 bill.
(-EUR 33 bn. / Dec’12)
Assets Liabilities
187
15
82
103
700
143
56
652
Fixed assets & other

44 44
The effort made in recent years is reflected in enhanced monitoring metrics
Liquidity and Funding
(*) Balance sheet for liquidity management purposes (netting of trading derivatives and interbank balances) Note: in 2011, 2012 and 2013 customer deposits included retail commercial paper in Spain (excluding ST wholesale funding).
2008 2009 2010 2011 2012 Jun’13 Net loans over net assets* 79% 79% 75% 77% 74% 72%
Net loan-to-deposit ratio (LTD) 150% 135% 117% 117% 113% 107% Customer deposits and medium- long-term financing over net loans 104% 106% 115% 113% 118% 122%
Short term wholesale funding over net* liabilities 7% 5% 3% 2% 2% 2%
Liquidity structural surplus (% over net* liabilities) 4% 8% 14% 13% 16% 18%
Monitoring metrics. Santander Group

45 45
Adequate liquidity structure of stand-alone units
Liquidity and Funding
June 2013
Main units and liquidity ratios
Note: In Spain, retail commercial paper included in deposits
LTD ratio Deposits + M/L term funding / (net loans / deposits) net loans
Spain 85% 163%
Portugal 107% 102%
Santander Consumer Finance 181% 68%
Poland 96% 106%
United Kigndom 122% 112%
Brazil 103% 129%
Mexico 80% 132%
Chile 137% 96%
Argentina 86% 116%
USA 106% 119%
Total Group 107% 122%
46 46
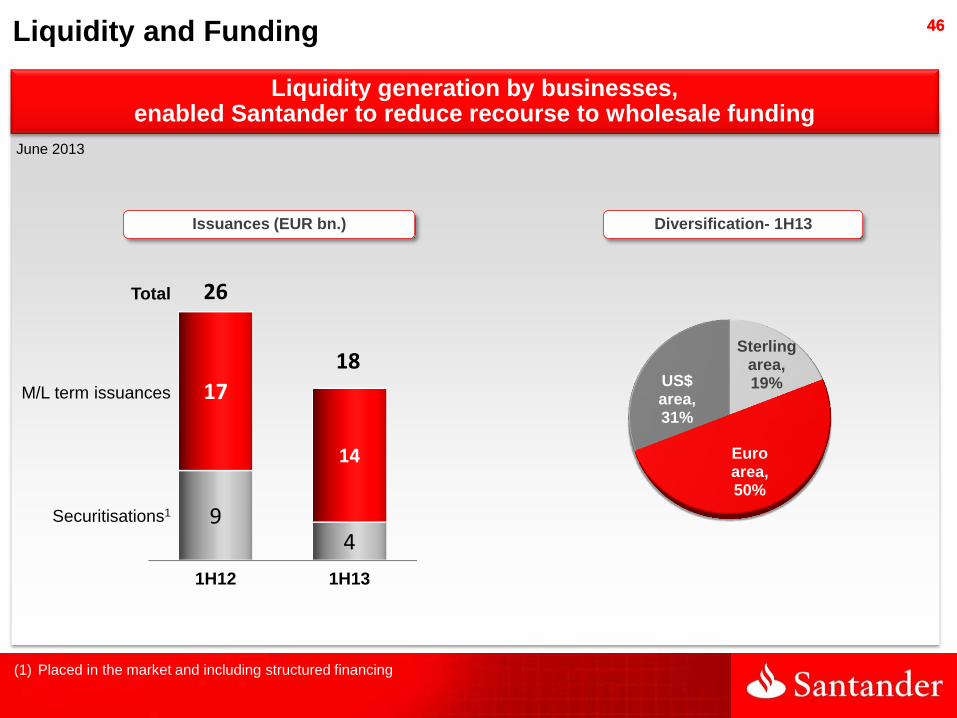
Liquidity generation by businesses, enabled Santander to reduce recourse to wholesale funding
Liquidity and Funding
June 2013
Sterling area, 19%
Euro area, 50%
US$ area, 31%
M/L term issuances
Securitisations1
Total
(1) Placed in the market and including structured financing
1H12 1H13
9 4
17
14
26
18
Diversification- 1H13 Issuances (EUR bn.)

47 47
Secondary segments results

48 48 Retail Banking
Activity1
EUR million
P&L
Improved underlying trend in
recent quarters
– Stable revenues, with the most
basic ones growing (+1% /1Q13)
– Flat costs
– Provisions declining, although
still high
Jun'12 Jun'13
646 614
-5%
Jun'12 Jun'13
522 542
+4%
(1) Excluding Repos. Deposits including retail commercial paper and letras financieras
EUR million
1Q'12 2Q 3Q 4Q 1Q'13 2Q
9,826 9,783 9,640 9,077 9,018 9,055
0%
Gross income
EUR billion
Loans Deposits 2Q13 % 1Q13 1H13 % 1H12
Gross income 9,055 0% 18,073 -8%
Expenses -4,252 0% -8,515 0%
LLP -2,673 +2% -5,287 -15%
Attrib. profit 1,265 -7% 2,621 -12%

49 49 Santander Consumer Finance Total. 1H13
Aggregates Continental Europe, United Kingdom and USA units
Total portfolio2 (Jun’13): EUR 79 bill.
Attributable profit 1H13: EUR 622mill.
EUR billion
EUR million
Basic data
78,910
14.1
157,000
Countries 14 Agreements with manufacturers
for "captive" financing 57
Top 31 in 12 countries
30,986
622
Million euros in loans2
Dealers-participants
Million euros in deposits
Million euros in attributable profit
for 1H13
Million customers
(1) Market share of car financing new loans and/or durable goods
(2) Gross loan portfolio
ContinentalEurope
UK
USA
59
4
16
Continental Europe
UK
USA
377
56
190
50 50
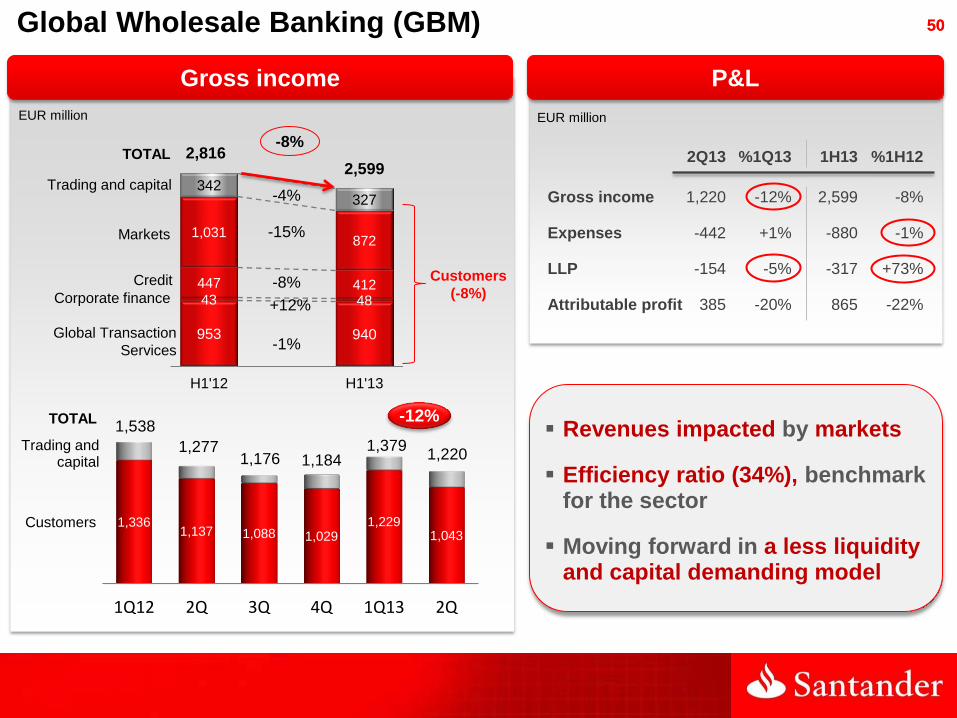
1Q12 2Q 3Q 4Q 1Q13 2Q
1,336 1,137 1,088 1,029
1,229 1,043
1,538
1,277 1,176 1,184
1,379 1,220
Global Wholesale Banking (GBM)
EUR million
TOTAL
Trading and capital
Customers
-12%
Gross income
EUR million
2Q13 %1Q13 1H13 %1H12
Gross income 1,220 -12% 2,599 -8%
Expenses -442 +1% -880 -1%
LLP -154 -5% -317 +73%
Attributable profit 385 -20% 865 -22%
P&L
Revenues impacted by markets
Efficiency ratio (34%), benchmark for the sector
Moving forward in a less liquidity and capital demanding model
953 940
43 48
447 412
1,031 872
342 327
H1'12 H1'13
-8%
-1%
-15%
-4%
TOTAL
Credit
Global Transaction
Services
Markets
Corporate finance
Trading and capital
-8%
2,816 2,599
+12%
Customers
(-8%)

51 51 Asset Management and Insurance
TOTAL
-1%
EUR million
2Q13 %1Q13 1H13 %1H12
Gross income 195 -2% 394 -14%
Expenses -78 +2% -155 +1%
LLP - - - -
Attributable profit 85 -6% 175 -12%
P&L
High revenues generation: 9% of operating areas total
Corporate transactions in order to:
– Promote future growth
– Put business in value (approx. EUR 2 bn. capital gains 2011-13)
(*) Including fees paid to the Group's retail networks (**) Excluding corporate transactions in Spain and Portugal: -2%
Asset
management
Insurance
612 593
1,439 1,376
H1'12 H1'13
EUR million
-4%**
Total revenues for the Group*
-3%
TOTAL
Asset
management
Insurance -4%
2,051 1,969
1Q12 2Q 3Q 4Q 1Q13 2Q
310 302 303 316 289 304
751 689 639 665 702 674
1,061 991 942 981 991 978
52 52
NPL and coverage ratios, and cost of credit

53 53
NPL ratio%
31.03.12 30.06.12 30.09.12 31.12.12 31.03.13 30.06.13
Continental Europe 5.41 5.67 6.07 6.29 6.62 7.83
Spain 3.35 3.26 3.64 3.84 4.12 5.75
Portugal 4.59 5.42 6.16 6.56 6.88 7.41
Poland 4.74 4.93 4.69 4.72 7.39 8.08
Santander Consumer Finance 4.05 3.88 3.96 3.90 3.98 4.04
United Kingdom 1.82 1.83 1.94 2.05 2.03 2.01
Latin America 4.67 5.14 5.31 5.42 5.44 5.26
Brazil 5.76 6.51 6.79 6.86 6.90 6.49
Mexico 1.61 1.64 1.69 1.94 1.92 2.20
Chile 4.52 4.65 5.00 5.17 5.51 5.81
USA 2.46 2.27 2.31 2.29 2.23 2.22
Operating Areas 3.95 4.09 4.33 4.53 4.71 5.16
Total Group 3.98 4.11 4.34 4.54 4.76 5.18
*
*
*
(*) On a like-for-like basis with previous quarters. Continental Europe 7.22%; Spain 4.76%; Total Group 4.92%

54 54
NPL coverage%
31.03.12 30.06.12 30.09.12 31.12.12 31.03.13 30.06.13
Continental Europe 54.1 58.9 68.4 73.0 71.0 63.3
Spain 49.4 43.6 45.7 50.0 50.3 43.1
Portugal 57.6 53.4 51.7 53.1 52.9 52.4
Poland 66.3 62.1 64.0 68.3 67.6 59.3
Santander Consumer Finance 108.3 110.7 109.7 109.5 108.7 106.9
United Kingdom 37.5 37.5 44.8 44.1 42.1 42.1
Latin America 91.6 89.5 89.8 87.5 86.7 85.4
Brazil 90.0 90.1 92.0 90.2 90.4 91.3
Mexico 194.9 183.4 175.4 157.3 157.1 142.7
Chile 68.3 64.0 60.8 57.7 53.9 49.9
USA 107.4 113.3 109.7 105.9 102.8 102.8
Operating Areas 62.1 64.8 71.3 73.3 71.8 66.3
Total Group 61.2 64.3 69.5 72.4 70.9 66.4
*
*
*
(*) On a like-for-like basis with previous quarters, Continental Europe 68.4%; Spain 49.0%; Total Group 69.4%
55 55
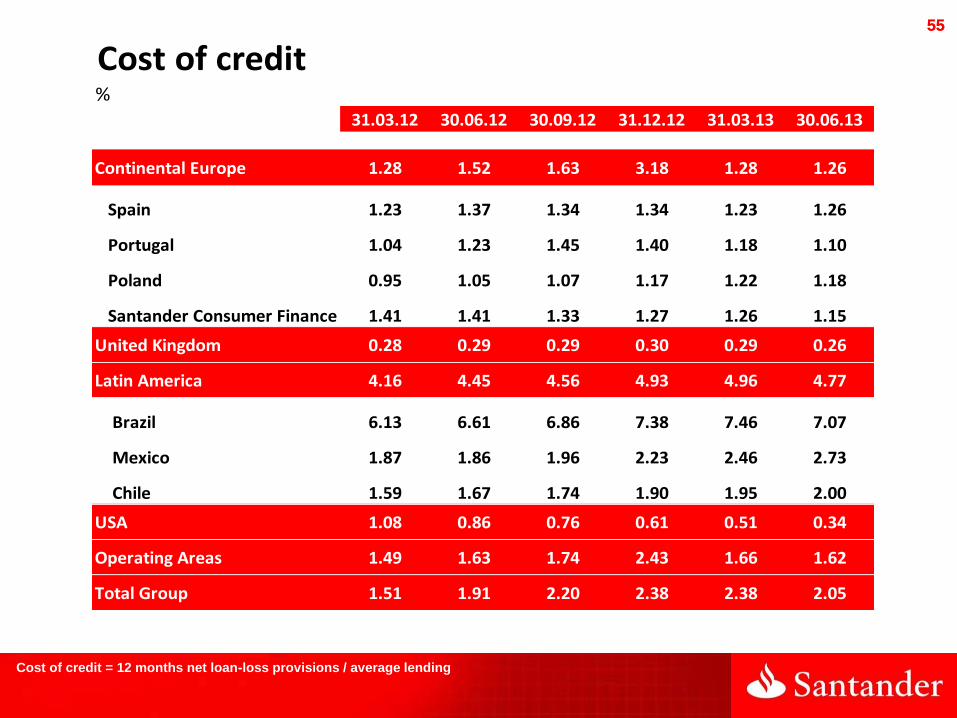
Cost of credit%
31.03.12 30.06.12 30.09.12 31.12.12 31.03.13 30.06.13
Continental Europe 1.28 1.52 1.63 3.18 1.28 1.26
Spain 1.23 1.37 1.34 1.34 1.23 1.26
Portugal 1.04 1.23 1.45 1.40 1.18 1.10
Poland 0.95 1.05 1.07 1.17 1.22 1.18
Santander Consumer Finance 1.41 1.41 1.33 1.27 1.26 1.15
United Kingdom 0.28 0.29 0.29 0.30 0.29 0.26
Latin America 4.16 4.45 4.56 4.93 4.96 4.77
Brazil 6.13 6.61 6.86 7.38 7.46 7.07
Mexico 1.87 1.86 1.96 2.23 2.46 2.73
Chile 1.59 1.67 1.74 1.90 1.95 2.00
USA 1.08 0.86 0.76 0.61 0.51 0.34
Operating Areas 1.49 1.63 1.74 2.43 1.66 1.62
Total Group 1.51 1.91 2.20 2.38 2.38 2.05
Cost of credit = 12 months net loan-loss provisions / average lending

56 56
Total coverage
(problematic assets + performing loans)
Jun'13
52%
Coverage by borrowers' situation
(June 2013)
Gross risk Coverage Net risk Fund
Non-performing 8,009 4,165 3,844
Substandard1 2,069 786 1,283
Foreclosed real estate 7,846 4,228 3,617
Total problematic assets 17,924 9,179 8,744
Performing loans2 3,137 1,758 1,380
Real estate exposure 21,061 10,937 10,124
Spain's run-off real estate. Exposure and coverage ratios
A sharp stock reduction coupled with the provisions made, strongly increased the coverage ratio of real estate exposure in Spain
(1) 100% up-to-date with payments (2) Performing loans: loans in regular situation
Non-performing 52%
Substandard1 38%
Foreclosed real estate 54%
Total problematic assets 51%
Performing loans2 56%
provisions / exposure (%) EUR Million
Total real estate
exposure

57 57
LOANS with real estate purpose Foreclosed REAL ESTATE
EUR Million
Jun’13 Dec’12 Var.
EUR Million
Gross amount Coverage
Net amount
Spain's run-off real estate. Loans and foreclosures
Finished buildings 5,973 6,218 -245
Buildings under constr. 692 1,289 -597
Developed land 3,591 3,861 -270
Building and other land 1,121 1,210 -89
Non mortgage guarantee 1,838 2,072 -234
Total 13,215 14,650 -1,435
Finished buildings 2,422 40% 1,452
Buildings under constr. 656 50% 325
Developed land 3,449 62% 1,325
Building land 1,164 62% 447
Other land 154 66% 52
Total 7,846 54% 3,618

58 58
Spreads

59 59
Spreads on loans and deposits %
Q1 '12 Q2 '12 Q3 '12 Q4 '12 Q1 '13 Q2 '13
Retail Banking Spain*
Loans spreads 1.60 1.59 1.64 1.81 2.21 2.26
Deposits spreads 1.64 1.68 1.44 0.81 0.16 0.28
TOTAL 3.24 3.27 3.08 2.62 2.37 2.54
Retail Banking Portugal
Loans spreads 2.34 2.39 2.47 2.47 2.44 2.44
Deposits spreads (0.91) (0.96) (1.13) (1.24) (1.22) (1.18)
TOTAL 1.43 1.43 1.34 1.23 1.22 1.26
Retail Banking Poland
Loans spreads 3.29 3.33 3.41 3.48 2.41 2.45
Deposits spreads 1.27 1.26 1.16 0.96 0.73 0.72
TOTAL 4.56 4.59 4.57 4.44 3.14 3.17
Santander Consumer Finance
Loans spreads 4.51 4.57 4.67 4.73 4.76 4.83
Retail Banking United Kingdom
Loans spreads 2.49 2.54 2.60 2.66 2.78 2.80
Deposits spreads (1.02) (1.18) (1.26) (1.27) (1.25) (1.17)
TOTAL 1.47 1.36 1.34 1.39 1.53 1.63
* Change in calculation from a quarterly basis to a twelve month basis
60 60
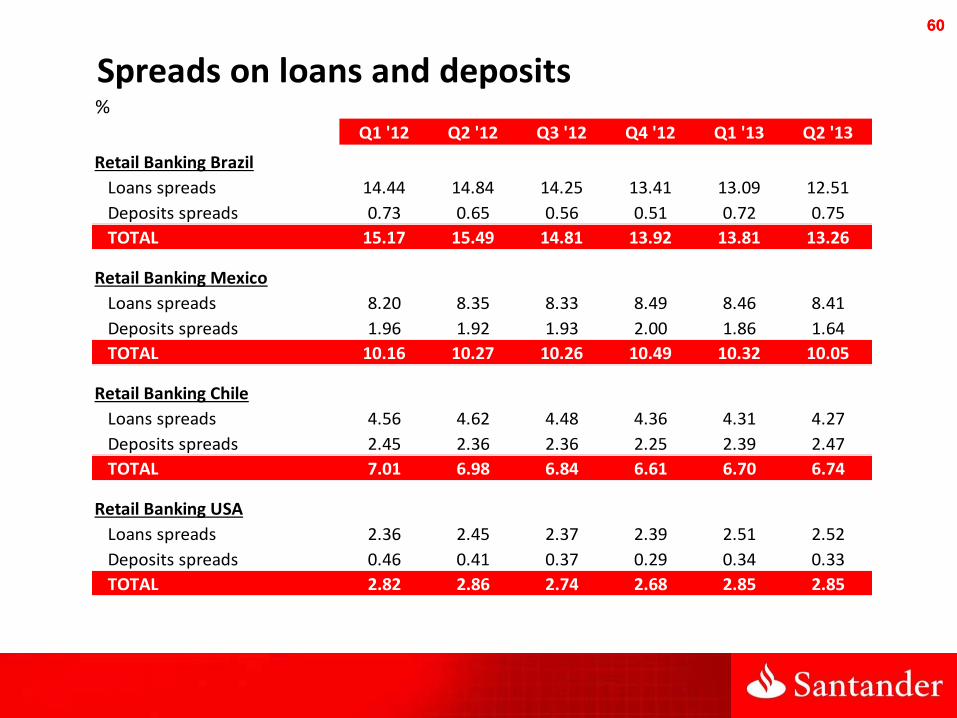
Spreads on loans and deposits%
Q1 '12 Q2 '12 Q3 '12 Q4 '12 Q1 '13 Q2 '13
Retail Banking Brazil
Loans spreads 14.44 14.84 14.25 13.41 13.09 12.51
Deposits spreads 0.73 0.65 0.56 0.51 0.72 0.75
TOTAL 15.17 15.49 14.81 13.92 13.81 13.26
Retail Banking Mexico
Loans spreads 8.20 8.35 8.33 8.49 8.46 8.41
Deposits spreads 1.96 1.92 1.93 2.00 1.86 1.64
TOTAL 10.16 10.27 10.26 10.49 10.32 10.05
Retail Banking Chile
Loans spreads 4.56 4.62 4.48 4.36 4.31 4.27
Deposits spreads 2.45 2.36 2.36 2.25 2.39 2.47
TOTAL 7.01 6.98 6.84 6.61 6.70 6.74
Retail Banking USA
Loans spreads 2.36 2.45 2.37 2.39 2.51 2.52
Deposits spreads 0.46 0.41 0.37 0.29 0.34 0.33
TOTAL 2.82 2.86 2.74 2.68 2.85 2.85
61 61
Quarterly Income Statement
62 62
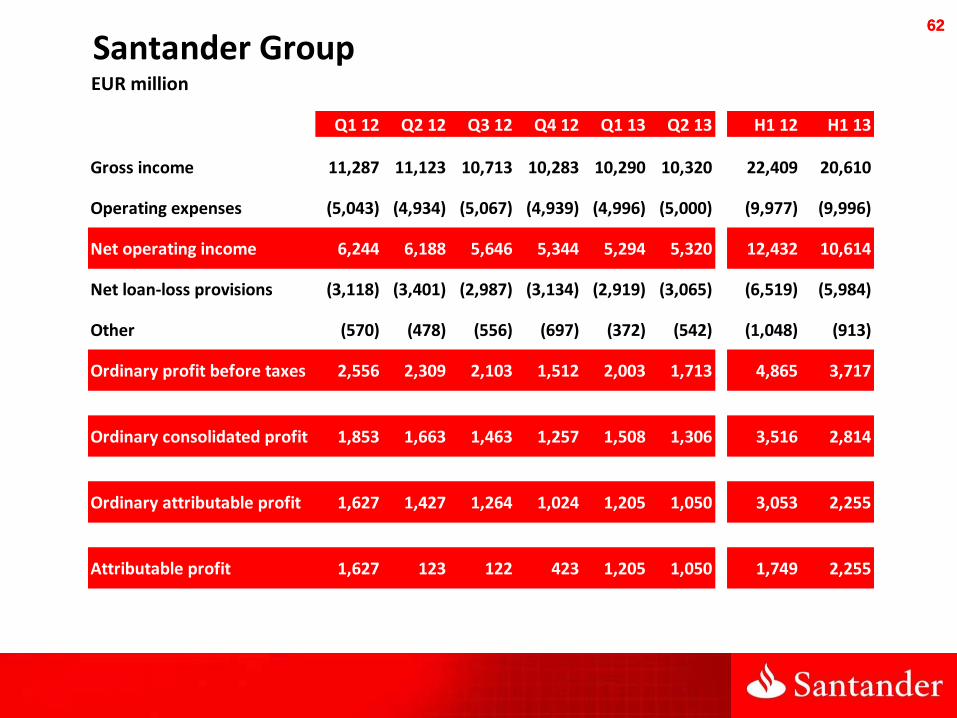
Santander GroupEUR million
Q1 12 Q2 12 Q3 12 Q4 12 Q1 13 Q2 13 H1 12 H1 13
Gross income 11,287 11,123 10,713 10,283 10,290 10,320 22,409 20,610
Operating expenses (5,043) (4,934) (5,067) (4,939) (4,996) (5,000) (9,977) (9,996)
Net operating income 6,244 6,188 5,646 5,344 5,294 5,320 12,432 10,614
Net loan-loss provisions (3,118) (3,401) (2,987) (3,134) (2,919) (3,065) (6,519) (5,984)
Other (570) (478) (556) (697) (372) (542) (1,048) (913)
Ordinary profit before taxes 2,556 2,309 2,103 1,512 2,003 1,713 4,865 3,717
Ordinary consolidated profit 1,853 1,663 1,463 1,257 1,508 1,306 3,516 2,814
Ordinary attributable profit 1,627 1,427 1,264 1,024 1,205 1,050 3,053 2,255
Attributable profit 1,627 123 122 423 1,205 1,050 1,749 2,255
63 63
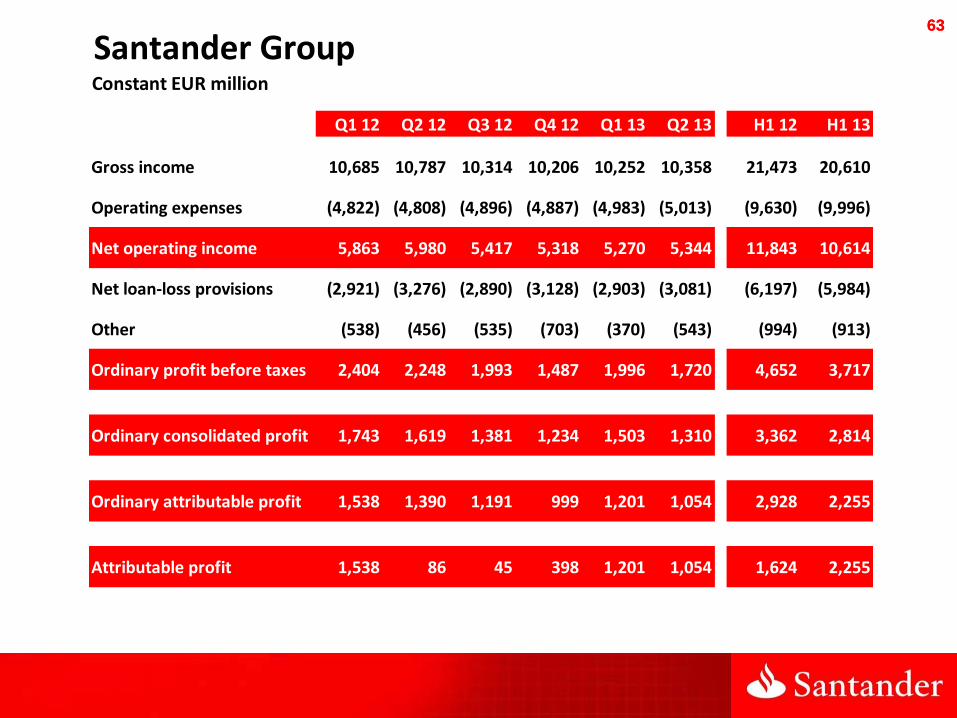
Santander GroupConstant EUR million
Q1 12 Q2 12 Q3 12 Q4 12 Q1 13 Q2 13 H1 12 H1 13
Gross income 10,685 10,787 10,314 10,206 10,252 10,358 21,473 20,610
Operating expenses (4,822) (4,808) (4,896) (4,887) (4,983) (5,013) (9,630) (9,996)
Net operating income 5,863 5,980 5,417 5,318 5,270 5,344 11,843 10,614
Net loan-loss provisions (2,921) (3,276) (2,890) (3,128) (2,903) (3,081) (6,197) (5,984)
Other (538) (456) (535) (703) (370) (543) (994) (913)
Ordinary profit before taxes 2,404 2,248 1,993 1,487 1,996 1,720 4,652 3,717
Ordinary consolidated profit 1,743 1,619 1,381 1,234 1,503 1,310 3,362 2,814
Ordinary attributable profit 1,538 1,390 1,191 999 1,201 1,054 2,928 2,255
Attributable profit 1,538 86 45 398 1,201 1,054 1,624 2,255
64 64
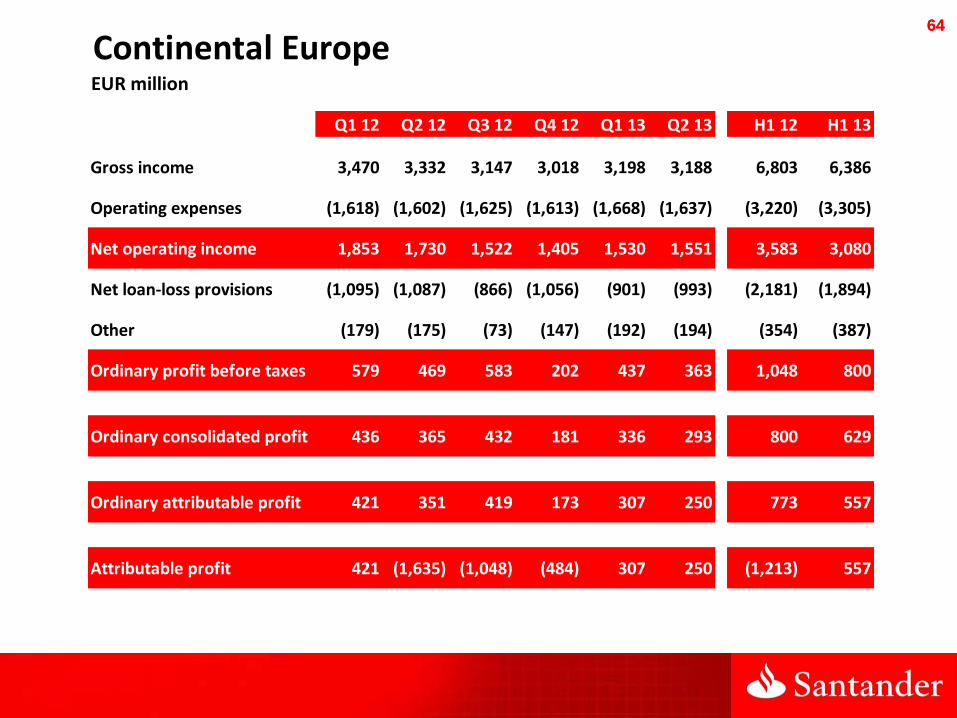
Continental EuropeEUR million
Q1 12 Q2 12 Q3 12 Q4 12 Q1 13 Q2 13 H1 12 H1 13
Gross income 3,470 3,332 3,147 3,018 3,198 3,188 6,803 6,386
Operating expenses (1,618) (1,602) (1,625) (1,613) (1,668) (1,637) (3,220) (3,305)
Net operating income 1,853 1,730 1,522 1,405 1,530 1,551 3,583 3,080
Net loan-loss provisions (1,095) (1,087) (866) (1,056) (901) (993) (2,181) (1,894)
Other (179) (175) (73) (147) (192) (194) (354) (387)
Ordinary profit before taxes 579 469 583 202 437 363 1,048 800
Ordinary consolidated profit 436 365 432 181 336 293 800 629
Ordinary attributable profit 421 351 419 173 307 250 773 557
Attributable profit 421 (1,635) (1,048) (484) 307 250 (1,213) 557

65 65
SpainEUR million
Q1 12 Q2 12 Q3 12 Q4 12 Q1 13 Q2 13 H1 12 H1 13
Gross income 2,043 1,961 1,919 1,758 1,815 1,794 4,004 3,609
Operating expenses (969) (954) (963) (937) (962) (951) (1,923) (1,913)
Net operating income 1,074 1,008 956 821 853 844 2,081 1,696
Net loan-loss provisions (724) (670) (466) (613) (516) (690) (1,394) (1,205)
Other (55) (46) 7 (34) (36) (29) (101) (65)
Profit before taxes 295 291 496 175 301 125 586 426
Consolidated profit 204 202 343 115 208 87 406 295
Attributable profit 202 201 342 116 207 86 404 294

66 66
PortugalEUR million
Q1 12 Q2 12 Q3 12 Q4 12 Q1 13 Q2 13 H1 12 H1 13
Gross income 318 267 258 195 231 233 585 465
Operating expenses (126) (126) (126) (128) (124) (122) (253) (246)
Net operating income 191 141 132 67 107 112 332 219
Net loan-loss provisions (131) (91) (106) (65) (64) (62) (223) (126)
Other (16) (5) 6 4 (13) (17) (21) (30)
Profit before taxes 44 45 31 7 31 32 89 63
Consolidated profit 32 38 26 26 21 25 70 46
Attributable profit 32 38 26 26 21 25 70 46

67 67
PolandConstant EUR million
Q1 12 Q2 12 Q3 12 Q4 12 Q1 13 Q2 13 H1 12 H1 13
Gross income 221 247 234 266 317 342 468 658
Operating expenses (106) (106) (106) (108) (157) (145) (212) (302)
Net operating income 115 141 129 158 160 197 256 357
Net loan-loss provisions (20) (33) (27) (32) (42) (52) (53) (93)
Other 2 (0) 0 (3) (5) 6 2 1
Profit before taxes 97 108 102 123 113 151 205 264
Consolidated profit 76 88 81 97 90 124 164 214
Attributable profit 73 85 78 93 70 91 159 161
68 68
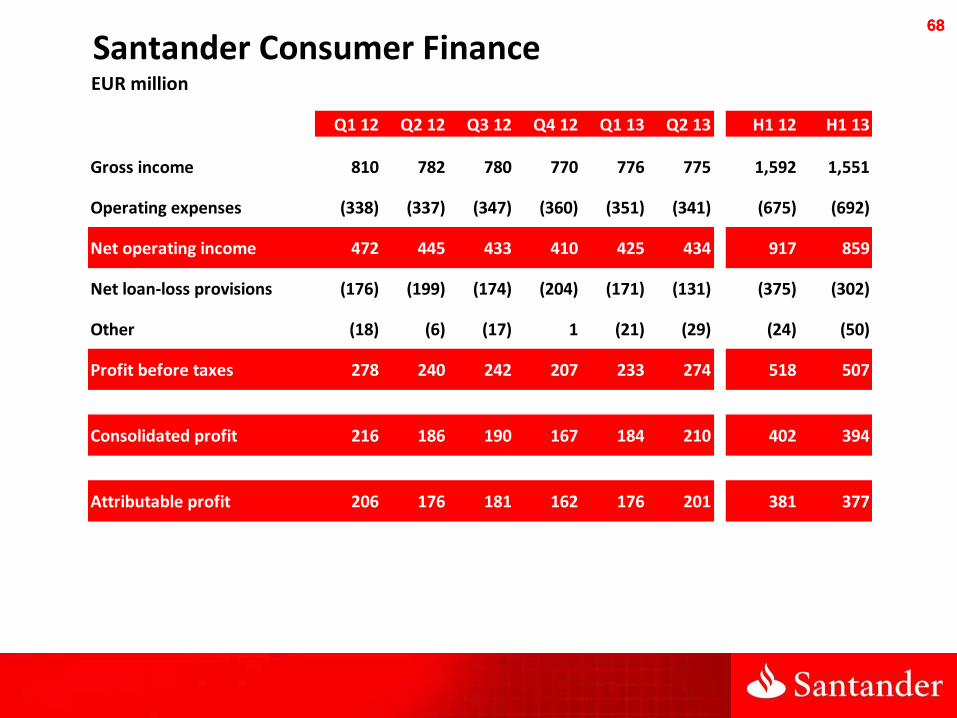
Santander Consumer FinanceEUR million
Q1 12 Q2 12 Q3 12 Q4 12 Q1 13 Q2 13 H1 12 H1 13
Gross income 810 782 780 770 776 775 1,592 1,551
Operating expenses (338) (337) (347) (360) (351) (341) (675) (692)
Net operating income 472 445 433 410 425 434 917 859
Net loan-loss provisions (176) (199) (174) (204) (171) (131) (375) (302)
Other (18) (6) (17) 1 (21) (29) (24) (50)
Profit before taxes 278 240 242 207 233 274 518 507
Consolidated profit 216 186 190 167 184 210 402 394
Attributable profit 206 176 181 162 176 201 381 377

69 69
United KingdomGBP million
Q1 12 Q2 12 Q3 12 Q4 12 Q1 13 Q2 13 H1 12 H1 13
Gross income 1,088 1,006 936 947 973 1,048 2,094 2,022
Operating expenses (552) (558) (546) (524) (560) (567) (1,110) (1,127)
Net operating income 535 448 390 423 413 481 984 894
Net loan-loss provisions (172) (173) (147) (161) (137) (103) (345) (239)
Other (53) (32) (24) (27) (35) (87) (84) (123)
Ordinary profit before taxes 311 244 218 236 241 291 554 532
Ordinary consolidated profit 243 198 190 207 191 224 441 414
Ordinary attributable profit 243 198 190 207 191 224 441 414
Attributable profit 243 198 256 207 191 224 441 414

70 70
BrazilConstant EUR million
Q1 12 Q2 12 Q3 12 Q4 12 Q1 13 Q2 13 H1 12 H1 13
Gross income 3,784 4,007 3,942 3,777 3,751 3,603 7,791 7,354
Operating expenses (1,336) (1,331) (1,393) (1,450) (1,351) (1,375) (2,667) (2,726)
Net operating income 2,448 2,676 2,550 2,326 2,400 2,228 5,124 4,628
Net loan-loss provisions (1,295) (1,621) (1,433) (1,400) (1,456) (1,388) (2,916) (2,844)
Other (193) (230) (228) (109) (77) (134) (423) (211)
Profit before taxes 959 825 888 817 868 706 1,785 1,574
Consolidated profit 713 615 633 648 646 534 1,328 1,180
Attributable profit 557 473 506 518 493 425 1,031 919
71 71
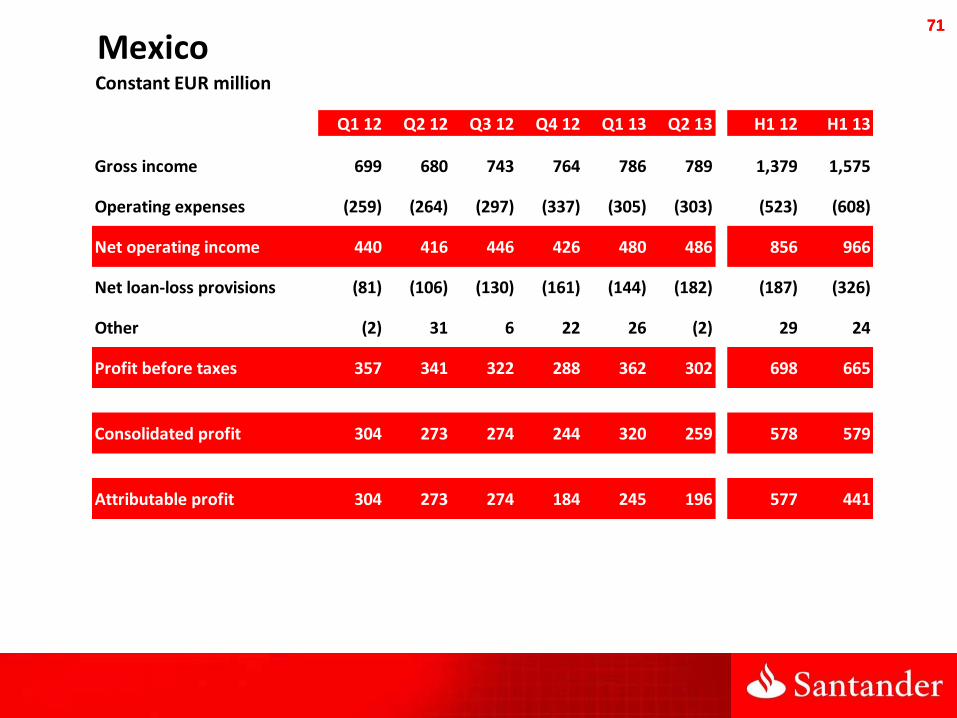
MexicoConstant EUR million
Q1 12 Q2 12 Q3 12 Q4 12 Q1 13 Q2 13 H1 12 H1 13
Gross income 699 680 743 764 786 789 1,379 1,575
Operating expenses (259) (264) (297) (337) (305) (303) (523) (608)
Net operating income 440 416 446 426 480 486 856 966
Net loan-loss provisions (81) (106) (130) (161) (144) (182) (187) (326)
Other (2) 31 6 22 26 (2) 29 24
Profit before taxes 357 341 322 288 362 302 698 665
Consolidated profit 304 273 274 244 320 259 578 579
Attributable profit 304 273 274 184 245 196 577 441

72 72
ChileConstant EUR million
Q1 12 Q2 12 Q3 12 Q4 12 Q1 13 Q2 13 H1 12 H1 13
Gross income 575 579 540 600 550 567 1,154 1,117
Operating expenses (219) (237) (233) (239) (232) (250) (456) (482)
Net operating income 356 342 306 362 317 317 698 634
Net loan-loss provisions (127) (122) (166) (155) (154) (149) (249) (302)
Other (4) (10) 14 6 (1) 3 (15) 2
Profit before taxes 224 209 155 213 163 172 434 335
Consolidated profit 194 185 132 190 147 141 378 288
Attributable profit 134 126 95 132 103 98 260 201

73 73
United StatesUSD million
Q1 12 Q2 12 Q3 12 Q4 12 Q1 13 Q2 13 H1 12 H1 13
Gross income 869 868 803 805 803 717 1,737 1,519
Operating expenses (365) (381) (380) (393) (392) (390) (746) (782)
Net operating income 505 487 423 411 411 326 992 737
Net loan-loss provisions (93) (101) (65) (81) (36) (6) (194) (42)
Other (25) (35) (180) 1 (11) (12) (60) (23)
Profit before taxes 387 350 178 331 365 308 737 672
Consolidated profit 312 275 155 292 307 248 587 555
Attributable profit 312 275 155 292 307 248 587 555

74 74
Corporate ActivitiesEUR million
Q1 12 Q2 12 Q3 12 Q4 12 Q1 13 Q2 13 H1 12 H1 13
Gross income (326) (184) (280) (218) (328) (141) (510) (470)
Operating expenses (171) (156) (149) (54) (178) (177) (327) (356)
Net operating income (496) (340) (429) (272) (507) (319) (836) (826)
Net loan-loss provisions (4) 4 (30) (54) (29) (189) (0) (218)
Other (61) 18 (74) (439) (66) (89) (42) (155)
Ordinary profit before taxes (562) (318) (533) (765) (602) (596) (879) (1,198)
Ordinary consolidated profit (559) (381) (565) (639) (547) (523) (940) (1,070)
Ordinary attributable profit (531) (397) (577) (619) (547) (521) (928) (1,068)
Attributable profit (531) 285 (333) (563) (547) (521) (246) (1,068)

75 75