Actividad antioxidante de compuestos bioactivos aislados ...
18
22 Rev. Cubana Quím. Vol.33, no.1 enero-abril, 2021, e-ISSN: 2224-5421 Artículo original Actividad antioxidante de compuestos bioactivos aislados de la hoja y corteza de Gymnanthes lucida Sw Antioxidant activity of bioactive compounds isolated from leaves and bark of Gymnanthes lucida Sw Diana Julia Arró-Díaz 1* http://orcid.org/0000-0002-3379-0956. Naylan Castelnaux-Ochoa 2 http://orcid.org/0000-0002-3826-9043. Ania Ochoa-Pacheco 3 http://orcid.org/0000-0002-1028-6626. Yuri Mangueira-Do Nascimento 4 http://orcid.org/0000-0002-9732-6191. 1 Center of Toxicology and Biomedicine (TOXIMED), Santiago de Cuba, Cuba 2 Biological-Pharmaceutical Laboratories (LABIOFAM) Enterprise, Santiago de Cuba, Cuba 3 Pharmacy Department, Faculty of Natural Sciences, Oriente University, Santiago de Cuba, Cuba 4 Posgraduate Program of Bioactive Sintetic and Natural Products. Health Sciences Institute. Federal University of Paraíba, Brazil *Autor para correspondencia: correo electrónico: [email protected]
Transcript of Actividad antioxidante de compuestos bioactivos aislados ...
22
Rev. Cubana Quím.
Vol.33, no.1 enero-abril, 2021, e-ISSN: 2224-5421
Artículo original
Actividad antioxidante de compuestos bioactivos aislados de la hoja y corteza
de Gymnanthes lucida Sw
Antioxidant activity of bioactive compounds isolated from leaves and bark of
Gymnanthes lucida Sw
Diana Julia Arró-Díaz1* http://orcid.org/0000-0002-3379-0956.
Naylan Castelnaux-Ochoa2 http://orcid.org/0000-0002-3826-9043.
Ania Ochoa-Pacheco3 http://orcid.org/0000-0002-1028-6626.
Yuri Mangueira-Do Nascimento4 http://orcid.org/0000-0002-9732-6191.
1Center of Toxicology and Biomedicine (TOXIMED), Santiago de Cuba, Cuba
2Biological-Pharmaceutical Laboratories (LABIOFAM) Enterprise, Santiago de Cuba, Cuba
3Pharmacy Department, Faculty of Natural Sciences, Oriente University, Santiago de Cuba,
Cuba
4Posgraduate Program of Bioactive Sintetic and Natural Products. Health Sciences Institute.
Federal University of Paraíba, Brazil
*Autor para correspondencia: correo electrónico: [email protected]
23
RESUMEN
Estudios fitoquímicos sugieren que Gymnanthes lucida Sw. (aité) es un candidato con potencial
antioxidante. Se cuantificó el contenido de fenoles y flavonoides totales, y se evaluó la actividad
antioxidante de extractos, elagitaninos y cumarinas aisladas de la hoja y la corteza mediante los
métodos de secuestro de los radicales 2,2-difenil-1-pricrilhidrazil (DPPH) y ácido 2,2´-azino-
bis(3-etilbenzotiazolín)-6-sulfónico (ABTS) y del poder reductor. El extracto de la hoja mostró
el mayor contenido de flavonoides y fenoles y la mejor actividad de los extractos DPPH
(IC50=12,82 ± 0,12 μg/mL), ABTS (IC50=13,83 ± 3,45 μg/mL) y poder reductor (104% respecto
al ácido ascórbico). El ácido elágico (AE) mostró la mayor actividad de las muestras DPPH
(IC50=11,75 ± 0,53 μg/mL), ABTS (IC50=11,28 ± 0,28 μg/mL) y poder reductor (107% respecto
al ácido ascórbico). Los resultados sugieren que G. lucida es una fuente de antioxidantes donde
el AE es el principal responsable de la actividad de la hoja.
Palabras clave: gymnanthes lucida Sw.; elagitaninos; cumarinas; actividad antioxidante.
ABSTRACT
Phytochemical investigations suggest that Gymnanthes lucida Sw. (aité) is a potential candidate
for obtaining antioxidant principles. Total phenolic and flavonoid content were quantified and in
vitro antioxidant capacity was assessed in extracts, ellagitannins, and coumarins isolated from
the leaf and bark by three methods: 2,2-diphenyl-1-pricrylhydrazyl (DPPH) and 2,2´-azino-bis(3-
ethylbenzthiazoline-6-sulfonic acid) (ABTS) radicals scavenging activities and ferric reducing
power. The highest phenolic and flavonoid content was observed in the leaf extract which also
exhibited the highest activity among the extracts DPPH (IC50=12,82 ± 0,12 μg/mL), ABTS
(IC50=13,83 ± 3,45 μg/mL), and reducing power (104% compared to ascorbic acid). Ellagic acid
(EA) showed the highest activity, with DPPH (IC50=11,75 ± 0,53 μg/mL), ABTS (IC50=11,28 ±
0,28 μg/mL), and reducing power (107 % compared to ascorbic acid). Results suggest that G.
lucida is a natural source of antioxidants where EA is the main secondary metabolite of the leaf
responsible for the activity.
Keywords: gymnanthes lucida Sw.; ellagitannins; coumarins; antioxidant activity.
24
Recibido: 28/11/2020
Aprobado: 20/12/2020
Introduction
Oxidative stress plays a crucial role as main causal event in the ethiopathogenesis of chronic
processes, which are a leading cause of morbidity and mortality. The global recognition of this
problem has led to the development of new substances that provide protection against oxidation.
As a result, synthetic antioxidants have been obtained, but their use is restricted because many of
them are suspected to be carcinogenetic. (1) Therefore, there is a growing interest in natural and
safer antioxidants as therapeutic alternative for the treatment of diseases related to oxidative
stress. This supports and enhances the research of plants with high antioxidant power and low
toxicity.
Gymnanthes lucida Sw. (Excoecaria lucida Sw. sin.),(2) known as yaití or aité belongs to the
Euphorbiaceae family. It is commonly distributed in the tropics. In Cuba, it grows in various
regions such as Sierra Maestra and Nipe-Sagua-Baracoa mountain ranges and also Las Vacas
and Venado keys of Ciénaga de Zapata. (3) The decoction of the bark is traditionally used for
relieving toothache and the latex for destroying callus; (3) while ethno pharmacological data
revealed the use of leaves as antimicrobial and antiasthmatic. However, there are not sufficient
national and international scientific studies to support its therapeutic use with efficacy, safety and
quality.
Phytochemical investigations reported for the first time several bioactive compounds from the
leaf and bark of this species such as hemiterpenes,(4) tannins derived from ellagic acid,(5,6)
coumarins, diterpenes, triterpenes, steroids,(6) alkanes and derivatives of fatty acids.(7) The
presence of several phenolic compounds could be an indicator of the potential antioxidant
activity of this plant. It is well known that polyphenolic tannins have the ability to scavenge free
radicals,(8) while coumarins are capable of capturing radicals and protecting tissue from damage
caused by reactive oxygen species (ROS).(9)
25
Given the need to identify new compounds with antioxidant activity for the treatment of diseases
caused by oxidative stress, G. lucida could be a phytotherapeutic alternative. Consequently,
preclinical pharmacological studies are needed to evaluate its antioxidant capacity, which will
provide the necessary experimental evidence to support its medicinal use and possible medical-
pharmaceutical application. According to this, the aim of the present study was to evaluate the in
vitro antioxidant activity of total extracts, ellagitannins and coumarins isolated from the leaf and
bark of the species Gymnanthes lucida Sw.
Material and methods
Samples and equipment
Samples were obtained as result of investigations (4-7) of the program CAPES/MES 144/11
carried out by the Group of Natural Products of the Pharmacy Department of Universidad de
Oriente and the Universidad de Paraiba, consisting in twelve samples from the leaf and bark of
G. lucida.
• Sample 1: Total ethanol leaf extract (ELE).
• Sample 2: Total ethanol bark extract (EBE).
• Sample 3: Ellagic acid (EA).
• Sample 4: 3,3'-di-O-methylellagic-4'-O-β-D-xylopyranoside acid (DXA).
• Sample 5: 3,3´, 4´-tri-O-methylellagic acid (TMA).
• Sample 6: 3,3´, 4´-tri-O-methylellagic-4-O- β-D-glucopyranoside acid (TGA).
• Sample 7: 3,3'-di-O-methylellagic acid (DMA).
• Sample 8: Dichloromethane Bark Extract (DBE).
• Sample 9: 6,7-dimethoxycoumarin or scoparone (SCP).
• Sample 10: Scopoletin (SCT).
• Sample 11: 6,7-methylenedioxycoumarin or ayapine (AYA).
• Sample 12: 6,7,8-trimethoxycoumarin or dimethylfraxetine (TMC).
26
Samples 1 and 2 were obtained by maceration with ethanol 95% from the leaf and bark,
respectively. The corresponding extracts were pooled and concentrated to dryness (40 °C) using
a German IKA-Werke rotary evaporator. (4-7) Samples 3, 5 and 6 were isolated from the total
ethanol leaf extract, while samples (4, 7, 9-12) were isolated from the total ethanol bark extract.
Sample 8 was obtained by liquid-liquid fractionation of sample 2 using solvents in increasing
order of polarity (hexane, dichloromethane, ethyl acetate and butanol). Chromatographic and
spectroscopic techniques were used for isolation and structural identification, such as medium
pressure liquid chromatography and column chromatography, infrared spectroscopy, one- and
two-dimensional nuclear magnetic resonance, and mass spectrometry. (4-6)
Samples 1 and 2 were solubilized in pure absolute ethanol for analysis, while samples 3-7 in
dimethylsulfoxide (DMSO) and 8-12 in pure methanol for analysis, according to bibliographic
references. [10]
Spectrophotometric readings were determined using a Genesys 10S® UV spectrophotometer. All
analyses were carried out in the MEDICUBA/SWITZERLAND laboratory from the Pharmacy
Department of Oriente University and the Center of Toxicology and Biomedicine (TOXIMED)
of Santiago de Cuba.
Qualitative chemical characterization
Solutions of total dry leaf and bark extracts were prepared in 95 % ethanol (1 mg/mL). The
phytochemical characterization was carried out through qualitative chemical reactions for the
following classes of secondary metabolites: alkaloids (Dragendorff, Mayer, Wagner), triterpenes
and steroids (Liebermann-Burchard, Solkowski and Rosemheim), quinones (Borntrager and
variant with benzene ), coumarins (Baljet and Legal), saponins (foam), reducing sugars (Fehling
and Benedict), phenols and tannins (Ferric chloride), carbohydrates (Molish), amino acids and
free amines (Ninhydrin), polyuronides (Ethanol), flavonoids (Shinoda, concentrated sulfuric acid
and alkalis), resins (resin test) and essential oils and fatty substances (Sudan III). (11)
Quantitative chemical characterization
27
Total phenolic content
Total phenolic content of ethanol leaf and bark extracts were determined by Folin-Ciocalteu
method, according to Arumugam et al., (1) with some modifications. A sample aliquot of 150 μL
was added to 700 μL of distilled water and 100 μL of 50 % Folin-Ciocalteu reagent (Sigma,
USA). Samples and blank were homogenize and 50 μL of 20 % sodium carbonate solution
(Sigma, USA) were added. The absorbance was measured at 760 nm after 1 hour in the dark at
room temperature. Total phenol concentration was calculated from the calibration curve using
gallic acid (80-240 mg/mL) (Sigma, USA) as standard. (Equation 1: y = 0,004 425x – 0,092; R2
= 99,9 %, p <0,05) Results were expressed as milligrams of gallic acid equivalent per grams of
dry weight of extract (GAE/g).
Total flavonoid content
Total flavonoid content of ethanol leaf and bark extracts was determined using the methodology
of Kumazawa et al.(12) This method consisted of mixing an aliquot of 0,5 mL of sample solution
(1mg/mL in 95 % ethanol) with 0,5 mL of 2% ethanol aluminum chloride solution (AlCl3,
Riedel-de Haën, 99,9 % pure, Germany). After one hour of incubation at room temperature, the
absorbance was measured at 420 nm. Quercetin solutions (Sigma, 95 % pure, USA-Aldrich®)
between 5–25 µg/mL were used to construct a calibration curve. Total flavonoid content was
calculated as milligrams of quercetin equivalent per grams of dry weight of extract (QE/g) using
equation 2: y = 3,578x + 0, 313 9; R2 = 99,1 %, p < 0,05.
Antioxidant activity
DPPH free radical scavenging activity
The methodology followed by Patra et al., (13) was used with slight modifications in order to
evaluate the 2, 2 diphenyl-1-picrylhydracil (DPPH) (Sigma-Aldrich®) radical scavenging of
samples. Briefly, a 0.1 mM solution of DPPH was prepared in absolute ethanol (EMSURE®),
and 1,5 mL of this solution was added to 0,25 mL of the samples´ solutions at different
concentrations (samples 1, 2, 4 and 6: 50-800 µg/mL; sample 3: 5-800 µg/mL; samples 5 and 7:
28
10-800 µg/mL and samples 8-12: 10-200 µg/mL). These solutions were vortexed thoroughly and
kept in dark for 30 min. The absorbance was measured at 517 nm against a blank. As a positive
control, ascorbic acid was used at concentrations of 5-800 µg/mL in 95% ethanol. The percent of
DPPH radical scavenging capacity was calculated using equation 3: DPPH scavenging effect (%)
= (AB-AS) / AB * 100. (AB: Blank Absorbance; AS: Sample Absorbance). The antioxidant
capacity against this radical was expressed as the half-maximal inhibitory concentration (IC50)
which is the sample´s concentration required for 50% radical inhibition.
ABTS●+ scavenging activity
The ABTS scavenging activity of the samples was measured according to Kilic et al.,(14) with
slight modifications. ABTS (2,2'-azinobis (3-ethylbenzothiazoline-6-sulfonic acid) radical was
produced by the reaction between 7 mM ABTS and 2,45 mM potassium persulfate in distilled
water, leaving the mixture in the dark overnight at room temperature. Then, 10 mL of the
mixture were taken and diluted with 840 mL of distilled water. Next 3 mL of ABTS solution was
added to 1 mL of each sample at different concentrations (samples 1-7 were 10-1000 µg/mL,
sample 8 was 10-250 µg/mL and samples 9-12 were 350-700 µg/mL). After 90 min, the
absorbance was measured at 734 nm. A solution of distilled water and 3 mL of ABTS solution
were used as blank. Ascorbic acid was used as positive control (50-1000 µg/mL in 95% ethanol).
The ABTS scavenging activity was calculated using equation 4: ABTS radical scavenging (%) =
(AB-As) / AB * 100. (AB: Blank Absorbance; AS: Sample Absorbance). The antioxidant capacity
against this radical was expressed as the half-maximal inhibitory concentration (IC50).
Fe3+ reducing power assay
The ability of samples to reduce iron (III) was assessed by the reducing power assay according to
Deepa et al.(15) First, 2,5 mL of samples (10-500 µg/mL) were mixed with 2,5 mL of phosphate
buffer (0,2 M, pH 6,6) and 2,5 ml of potassium ferricyanide (Reachim®) (K3Fe(CN)6; 10 g/l).
Then, the mixture was incubated at 50 °C for 30 min and 2,5 ml of 10 % trichloroacetic acid
(UNI-CHEM®) (100 g/L) was added. Then, the mixture was centrifuged at 2000 rpm during
10 min. Finally, 2, 5 ml of the supernatant solution was mixed with 2,5 ml of distilled water and
29
0,5 mL of FeCl3 (Sigma-Aldrich®) (1g/L) and was measured at 700 nm against a blank prepared
with distilled water. Ascorbic acid (10-500 µg/mL in absolute ethanol) was used as the reference
standard. The transformation of Fe3+/ Fe2+ was measured through the absorbance generated by
the Blue Prusian complex formed. The reducing power of samples was expressed as the
percentage of the absorbance reached respect to ascorbic acid (100 %) at the evaluated
concentrations.
Statistical analysis and processing of the results
Microsoft Excel 2016 and STATGRAPHICS Plus Version 5.1. softwares were used for
mathematical processing and statistical analysis of data. All data were collected from
independent triplicates experiments and expressed as mean ± standard error (± SD). Means were
compared using the Student's T-statistic at (P < 0,01) and one-way analysis of variance
(ANOVA) at (P < 0,05). Turkey’s Least Significant Differences Test (LSD) determined
differences between data means. A 95% confidence level was considered in all cases. Relation
among the antioxidant variables, as well as between these variables and total phenolic and
flavonoid content were analyzed using correlation and regression analysis (P < 0,05).
Results and discussion
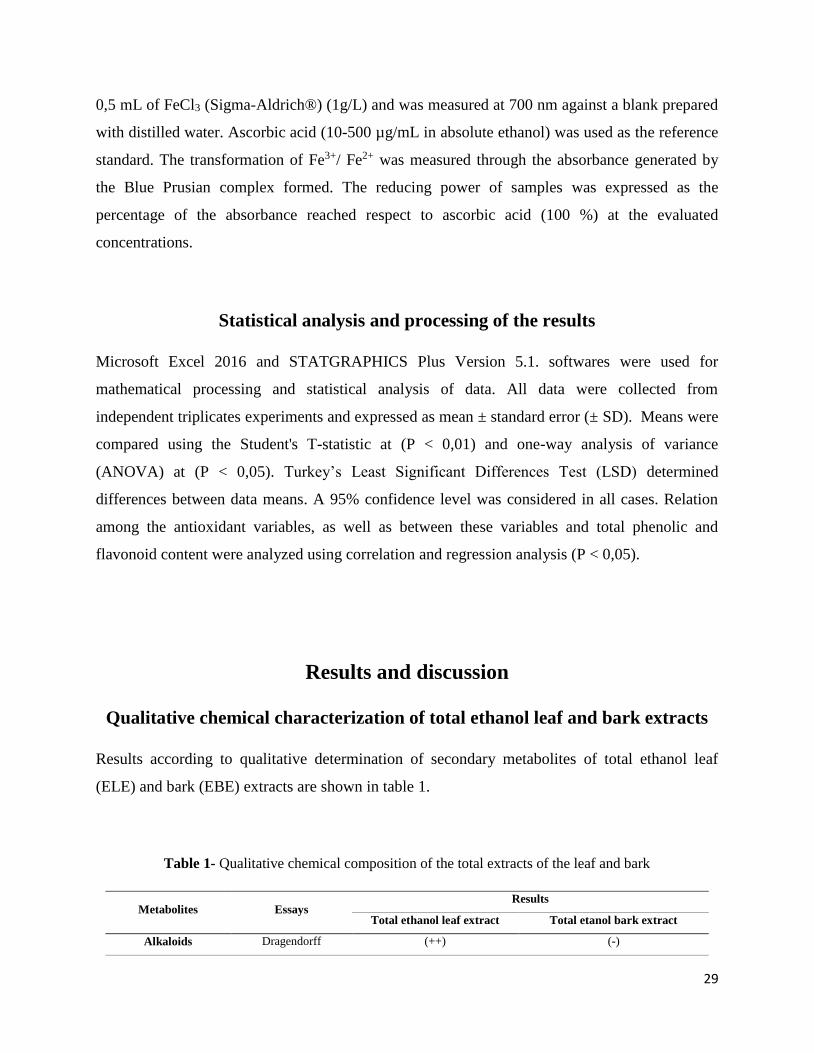
Qualitative chemical characterization of total ethanol leaf and bark extracts
Results according to qualitative determination of secondary metabolites of total ethanol leaf
(ELE) and bark (EBE) extracts are shown in table 1.
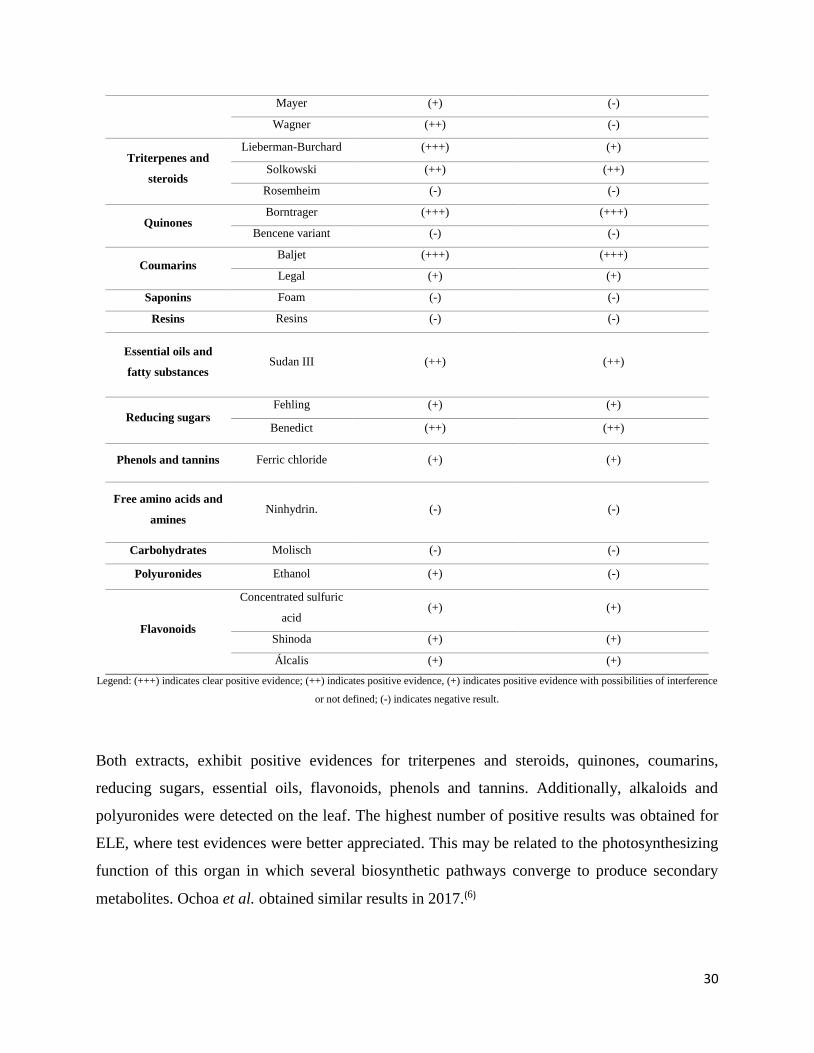
Table 1- Qualitative chemical composition of the total extracts of the leaf and bark
Metabolites Essays Results
Total ethanol leaf extract Total etanol bark extract
Alkaloids Dragendorff (++) (-)
30
Mayer (+) (-)
Wagner (++) (-)
Triterpenes and
steroids
Lieberman-Burchard (+++) (+)
Solkowski (++) (++)
Rosemheim (-) (-)
Quinones Borntrager (+++) (+++)
Bencene variant (-) (-)
Coumarins Baljet (+++) (+++)
Legal (+) (+)
Saponins Foam (-) (-)
Resins Resins (-) (-)
Essential oils and
fatty substances Sudan III (++) (++)
Reducing sugars Fehling (+) (+)
Benedict (++) (++)
Phenols and tannins Ferric chloride (+) (+)
Free amino acids and
amines Ninhydrin. (-) (-)
Carbohydrates Molisch (-) (-)
Polyuronides Ethanol (+) (-)
Flavonoids
Concentrated sulfuric
acid (+) (+)
Shinoda (+) (+)
Álcalis (+) (+)
Legend: (+++) indicates clear positive evidence; (++) indicates positive evidence, (+) indicates positive evidence with possibilities of interference
or not defined; (-) indicates negative result.
Both extracts, exhibit positive evidences for triterpenes and steroids, quinones, coumarins,
reducing sugars, essential oils, flavonoids, phenols and tannins. Additionally, alkaloids and
polyuronides were detected on the leaf. The highest number of positive results was obtained for
ELE, where test evidences were better appreciated. This may be related to the photosynthesizing
function of this organ in which several biosynthetic pathways converge to produce secondary
metabolites. Ochoa et al. obtained similar results in 2017.(6)
31
Quantitative chemical characterization of the total ethanol leaf and bark
extracts
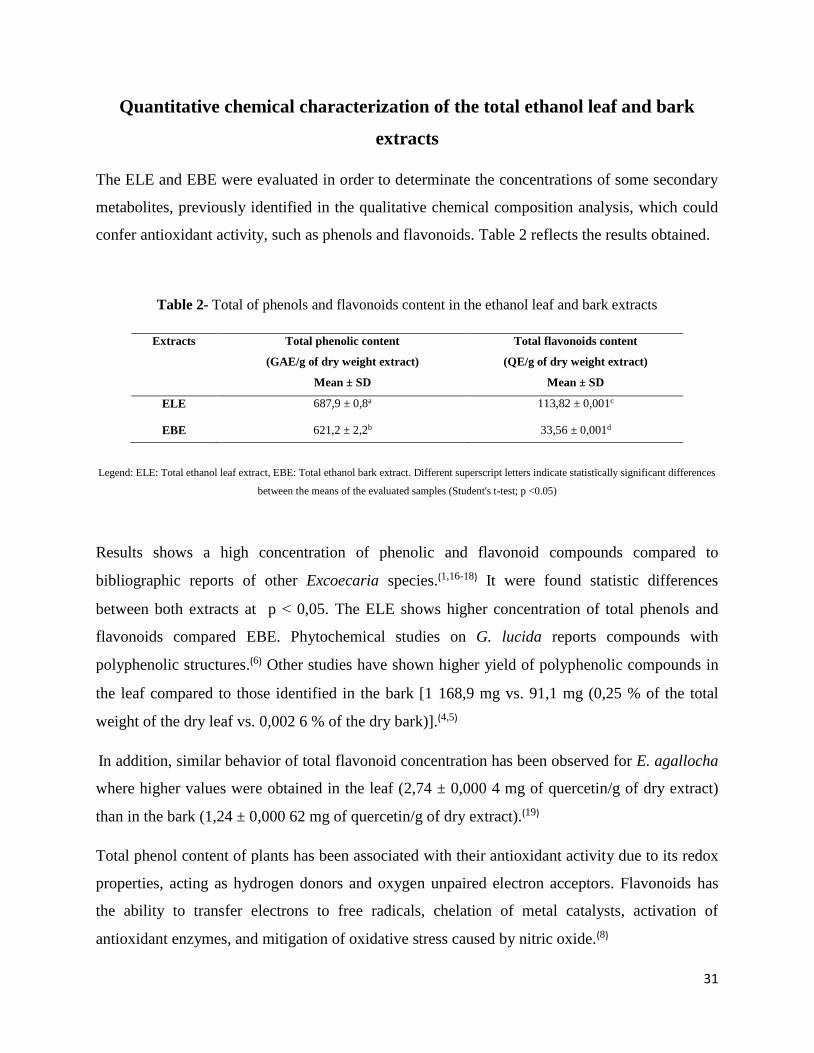
The ELE and EBE were evaluated in order to determinate the concentrations of some secondary
metabolites, previously identified in the qualitative chemical composition analysis, which could
confer antioxidant activity, such as phenols and flavonoids. Table 2 reflects the results obtained.
Table 2- Total of phenols and flavonoids content in the ethanol leaf and bark extracts
Legend: ELE: Total ethanol leaf extract, EBE: Total ethanol bark extract. Different superscript letters indicate statistically significant differences
between the means of the evaluated samples (Student's t-test; p <0.05)
Results shows a high concentration of phenolic and flavonoid compounds compared to
bibliographic reports of other Excoecaria species.(1,16-18) It were found statistic differences
between both extracts at p ˂ 0,05. The ELE shows higher concentration of total phenols and
flavonoids compared EBE. Phytochemical studies on G. lucida reports compounds with
polyphenolic structures.(6) Other studies have shown higher yield of polyphenolic compounds in
the leaf compared to those identified in the bark [1 168,9 mg vs. 91,1 mg (0,25 % of the total
weight of the dry leaf vs. 0,002 6 % of the dry bark)].(4,5)
In addition, similar behavior of total flavonoid concentration has been observed for E. agallocha
where higher values were obtained in the leaf (2,74 ± 0,000 4 mg of quercetin/g of dry extract)
than in the bark (1,24 ± 0,000 62 mg of quercetin/g of dry extract).(19)
Total phenol content of plants has been associated with their antioxidant activity due to its redox
properties, acting as hydrogen donors and oxygen unpaired electron acceptors. Flavonoids has
the ability to transfer electrons to free radicals, chelation of metal catalysts, activation of
antioxidant enzymes, and mitigation of oxidative stress caused by nitric oxide.(8)
Extracts Total phenolic content
(GAE/g of dry weight extract)
Mean ± SD
Total flavonoids content
(QE/g of dry weight extract)
Mean ± SD
ELE 687,9 ± 0,8a 113,82 ± 0,001c
EBE 621,2 ± 2,2b 33,56 ± 0,001d
32
Evaluation of antioxidant activity
There is no single method able to describe the "total antioxidant capacity of a sample" since this
parameter should express the capacity of lipophilic and hydrophilic compounds, reflect the
antioxidant mechanisms and evaluate its reactivity against different reactive species.(8) For that
reason, ellagitannins and coumarins isolated from both organs of the plant were evaluated using
different methodologies to determine their possible contribution to the total antioxidant capacity
of the extracts.
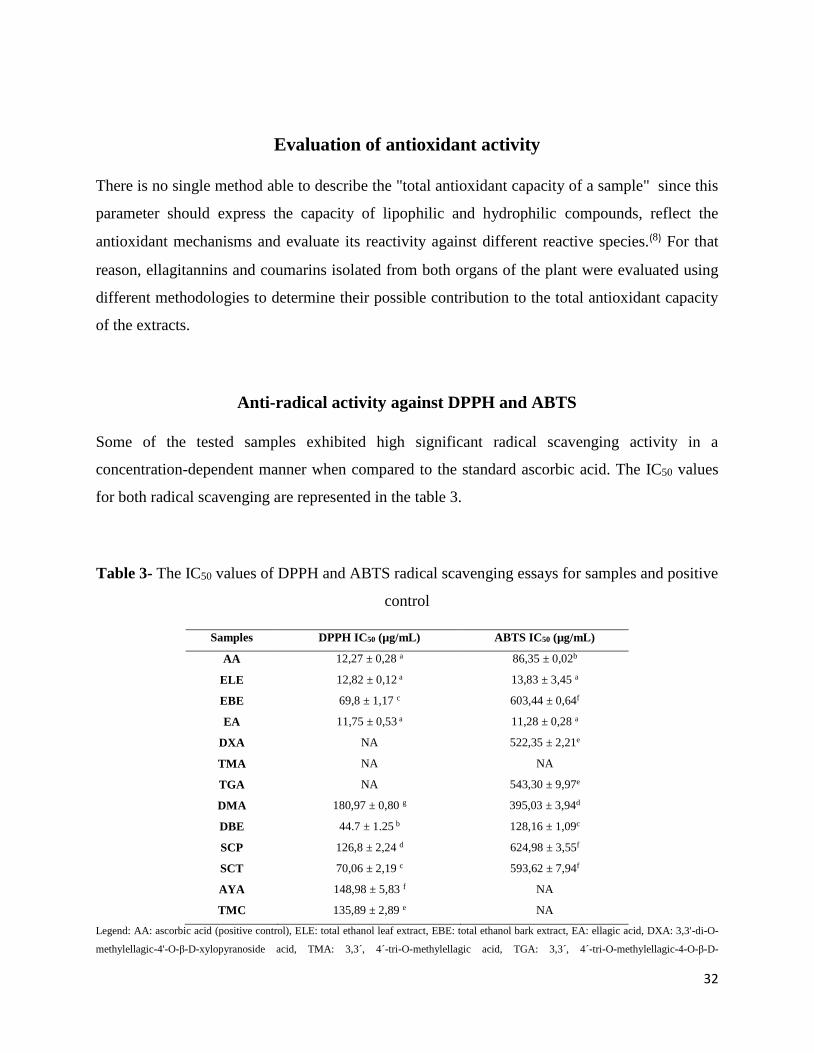
Anti-radical activity against DPPH and ABTS
Some of the tested samples exhibited high significant radical scavenging activity in a
concentration-dependent manner when compared to the standard ascorbic acid. The IC50 values
for both radical scavenging are represented in the table 3.
Table 3- The IC50 values of DPPH and ABTS radical scavenging essays for samples and positive
control
Samples DPPH IC50 (µg/mL) ABTS IC50 (µg/mL)
AA 12,27 ± 0,28 a 86,35 ± 0,02b
ELE 12,82 ± 0,12 a 13,83 ± 3,45 a
EBE 69,8 ± 1,17 c 603,44 ± 0,64f
EA 11,75 ± 0,53 a 11,28 ± 0,28 a
DXA NA 522,35 ± 2,21e
TMA NA NA
TGA NA 543,30 ± 9,97e
DMA 180,97 ± 0,80 g 395,03 ± 3,94d
DBE 44.7 ± 1.25 b 128,16 ± 1,09c
SCP 126,8 ± 2,24 d 624,98 ± 3,55f
SCT 70,06 ± 2,19 c 593,62 ± 7,94f
AYA 148,98 ± 5,83 f NA
TMC 135,89 ± 2,89 e NA
Legend: AA: ascorbic acid (positive control), ELE: total ethanol leaf extract, EBE: total ethanol bark extract, EA: ellagic acid, DXA: 3,3'-di-O-
methylellagic-4'-O-β-D-xylopyranoside acid, TMA: 3,3´, 4´-tri-O-methylellagic acid, TGA: 3,3´, 4´-tri-O-methylellagic-4-O-β-D-
33
glucopyranoside acid, DMA: 3,3'-di-O-methylellagic acid, DBE: Dichloromethane Bark Extract (DBE), SCP: scoparone, SCT: scopoletin, AYA:
ayapine, TMC: 6,7,8-trimethoxycoumarin. NA: Not Active.
Means values with different superscripts in the same column are significantly different (p <0, 05).
Data shows that ellagic acid and the total ethanol leaf extract displays potent radical scavenging
in both tests, with an IC50 statistically similar to ascorbic acid value against the radical DPPH
(11,75 ± 0,53 µg/mL and 12,82 ± 0,12 µg/mL vs. 12,27 ± 0,28 µg/mL, respectively); while the
IC50 values of ABTS assay is lower than ascorbic acid with 11,28 ± 0,28 µg/mL; 13,83 ±
3,45 µg/mL vs. 86,35 ± 0,02 µg/mL, respectively.
The dichloromethane bark extract and the total ethanol bark extract also show good activity
against the DPPH radical, with an IC50 values of 44,7 ± 0,13 µg/mL and 69,8 ± 1,17 µg/mL
respectively, although statistically less active than the positive control. The dichloromethane
phase also shows good ABTS scavenging activity compared to the rest of the evaluated samples,
(IC50 value of 128,16 ± 1,09 µg/mL), unlike the total ethanol bark extract with an IC50 value of
603,44 ± 0,64 µg/mL.
The four coumarins are active in the DPPH assay, however, scopoletin has the higher activity
with IC50 value of 70,06 ± 2,19 µg/mL, showing no significant statistical differences in relation
to the total ethanol bark extract (69,8 ± 1,17µg/mL) at a level of 95 % confidence. This behavior
was also observed when facing ABTS radical, although with less significant results than in the
DPPH test (IC50 593, 62 ± 7, 94 µg/mL). Therefore, this compound could be the main
responsible of the antioxidant activity of this extract and its dichloromethane phase. Results
indicate that isolated coumarins individually have no superior activity than their origin extracts
(ethanol and dichloromethane) suggesting a synergistic effect, although other compounds may
also contribute to the activity. The antioxidant activity of scopoletin has been reported by several
authors.(19,20)
Results confirm that total ethanol leaf and bark extracts of G. lucida have active compounds able
to donate a hydrogen atom/ transferring an electron to a free radical, thus showing antiradical
activity. However, the total ethanol leaf extract shows higher activity than the bark extract in
both tests, with statistical significance for 95 % confidence.
Ellagic acid proved to be the best antioxidant of evaluated samples in both tests, including the
standard reference, which agrees with previous reports.(14, 21) This compound, isolated in a high
34
concentration from the ethyl acetate phase of the leaf, may be responsible of the greater anti-
radical activity of the total extract of this organ.
It is well known that the antioxidant activity of polyphenols is structurally related with the
degree of free phenolic hydroxyl groups present in the molecule, especially if they are adjacent
to each other, forming catechols and galloils.(8)According to this, ellagic acid is the only with this
chemical characteristic and the highest activity. On the other hand 3,3'-di-O-methylelagic acid,
3,3 'acid, 4'-tri-O-methylelagic acid, 3,3'-di-O-methylelagic acid-4'-O-β-D-xylopyranoside and
3,3', 4'-tri-O-methylelagic acid-4-O-β-D-glucopyranoside having occupied those phenols
positions shows the lowest activity.
In the case of coumarins, free radical scavenging activity depends mainly on the number and
position of hydrogen donating hydroxyl groups in the aromatic ring of phenolic molecules, It can
be affected by other factors, such as glycosylation of aglycones and groups that donate
hydrogens (-NH, -SH).(22) According to these approaches, scopoletin is the only one that
possesses free phenolic hydroxyl and the highest activity.
The pure samples showed ABTS radical scavenging activity in a different order than DPPH
assay, except for ellagic acid. This behavior conditioned the statistical analysis showing a weak
correlation between both methods (R2 = 0, 17; p ≥ 0, 05). This may be related to different
reaction conditions, the kinetics of both radicals and molecular interactions in the reaction
medium. Another important difference is that ABTS activity can be measured in organic or
aqueous medium according to the hydrophilic or lipophilic nature of the sample. On the contrary,
DPPH can only be measured in an organic medium, which limits the interpretation of the
antioxidant capacity of the most hydrophilic evaluated compounds(8) (3,3'-di-O-methylelagic-4'-
O-β-D-xylopyranoside acid and 3,3´, 4´-tri-O-methylelagic-4-O-β-D-glucopyranoside acid).
The quantitative analysis shows a direct correlation between the DPPH antioxidant activity and
total phenols and flavonoids content. Correlation coefficients of 0,839 8 (p <0, 05) and 0,689 7
(p > 0,05) respectively, confirms that the phenolic compounds extracted from G. lucida are
responsible of the 83 % of the measured antioxidant activity. Flavonoids do not show any
statistic significant relationship. Same analysis was performed for ABTS radical, obtaining ar
value of 0,873 4 (p < 0,05) and 0,858 3 (p < 0,05) for total phenols and flavonoids respectively.
35
According to these results, it is inferred that the antioxidant activity of the ethanol extracts is not
only limited to phenolic or flavonoid compounds, but may also be related with other secondary
antioxidant metabolites such as coumarins, alkaloids, terpenes and others, which in this case they
contribute in a minor percentage to the activity.
Determination of the reducing power
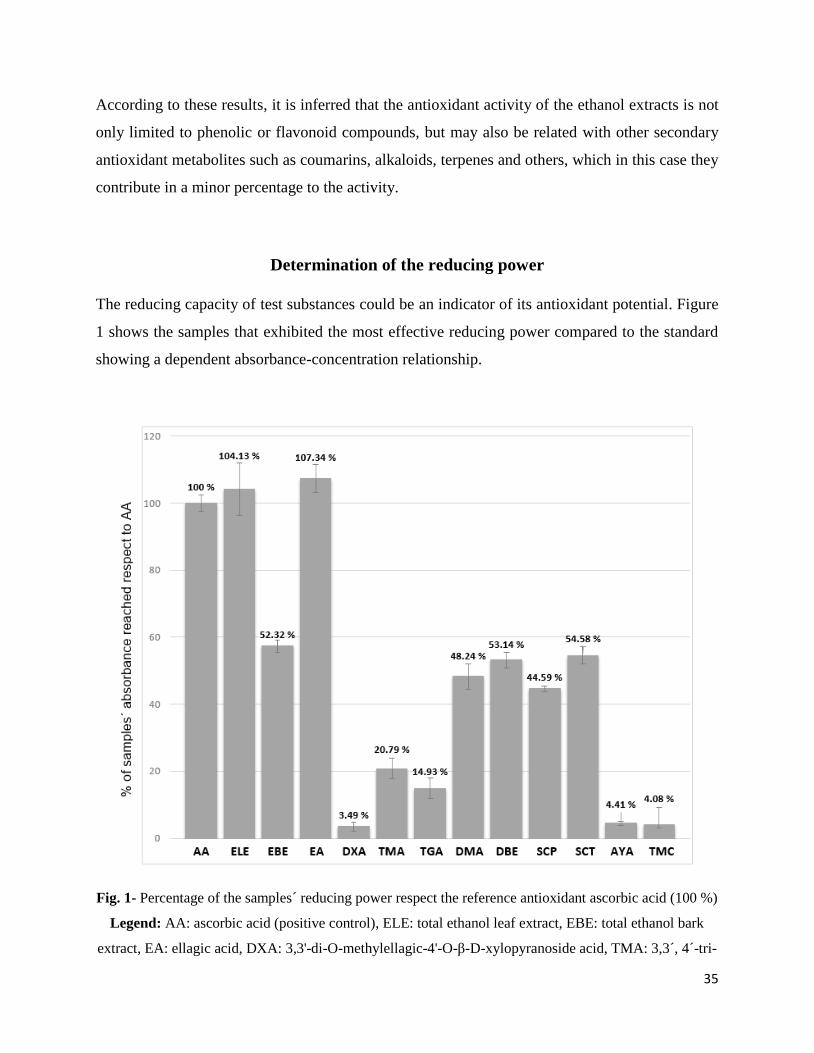
The reducing capacity of test substances could be an indicator of its antioxidant potential. Figure
1 shows the samples that exhibited the most effective reducing power compared to the standard
showing a dependent absorbance-concentration relationship.
Fig. 1- Percentage of the samples´ reducing power respect the reference antioxidant ascorbic acid (100 %)
Legend: AA: ascorbic acid (positive control), ELE: total ethanol leaf extract, EBE: total ethanol bark
extract, EA: ellagic acid, DXA: 3,3'-di-O-methylellagic-4'-O-β-D-xylopyranoside acid, TMA: 3,3´, 4´-tri-
36
O-methylellagic acid, TGA: 3,3´, 4´-tri-O-methylellagic-4-O-β-D-glucopyranoside acid, DMA: 3,3'-di-O-
methylellagic acid, DBE: Dichloromethane Bark Extract (DBE), SCP: scoparone, SCT: scopoletin, AYA:
ayapine, TMC: 6,7,8-trimethoxycoumarin.
These results behave statistically similar to those obtained by the DPPH method, so the analysis
shows a high correlation between both tests (r = 0,983 5). The ABTS method shows a weak
correlation (r = -0,676 3) and a lack of statistic significant relationship with reducing power
assay (p > 0,05). According to Apak (2018), the complex nature of the nitro-radical ABTS can
cause a lack of correlation with other tests that measure the antioxidant capacity, as in the case of
the reducing power test, by slowing down the reaction with polyphenols. (8)
From the twelve evaluated samples, ellagic acid and total ethanol leaf extract exhibit the higher
reducing power (statistically similar at a 95 % confidence level), even higher than ascorbic acid
at the tested concentrations. The rest of the samples were less active than the reference
antioxidant standard.
Other authors had reported similar observations for ellagic acid, like Kilic and collaborators in
2014 who revealed that the reducing power of ellagic acid exceeded the reference antioxidants
such as α-tocopherol, ascorbic acid, BHT (butyl-hydroxytoluene) and BHA (butyl-
hydroxyanisole).(14) The strategic position of hydroxyl and carbonyls groups around this
molecule facilitates its activity in chelating metals.(23)
The number of free phenolic hydroxyl groups in the structure of the evaluated compounds seems
to be directly related to a greater reducing power. This observation has also been raised by other
researchers who stated that the reducing power of a sample is apparently related to an extension
in the conjugation of phenols, as well as the amount of hydroxyls constituents.(8)
The correlation coefficients between the reducing power and total phenols and flavonoids
content were 0,686 2 (p>0,05) and 0,869 1 (p<0,05) respectively, indicating flavonoid type
substances as the main responsible for this activity. Several studies have shown that there is a
direct relationship between the content of total flavonoids and the reducing power of many plant
species.[8] However, a low correlation between the total phenols content and the reducing power
37
could be related to the fact that extracts can contain phenolic and non-phenolic compounds that
can influence their antioxidant potential.(8)
Conclusions
The experimental results obtained revealed that G. lucida´s leaf and bark has significant radical
scavenging activity and ferric reducing power. However, leaf ethanol extract exhibited higher
activity that can be related to its higher polyphenolic content and the presence of ellagic acid and
other metabolites with synergistic effect. Ellagic acid is suggested as the main responsible
metabolite of the antioxidant activity of the leaf.
References bibliographical
1. ARUMUGAM, M. et al. “Antibacterial and antioxidant activity between micropropagated
and field grown plants of Excoecaria agallocha L. International Research” Journal of
Pharmacy. 2012, 3, 235-240. ISSN 2230-8407
2. DÍAZ, J.; CELIA, C.; BISSE, J. “Estudio comparativo de Gymnanthes lucida Sw. en Cuba”.
Revista del Jardín Botánico Nacional Universidad de La Habana. 1983, 4 (2), 19-36.
ISSN 0253-5696
3. ROIG, J.T. Plantas Medicinales, Aromáticas o Venenosas de Cuba. 1st ed. Ciencia y
Técnica, Editorial. La Habana: Cuba; 1974. ISBN 978-959-05-0809-7
4. OCHOA, A.P. et al. “Evaluación fitoquímica de hojas de Excoecaria lucida Sw.(Aité)
(Euphorbiaceae) y Aislamiento e identificacion de un hemiterpenoide”. Revista Cubana de
Plantas Medicinales. 2015, 20 (1), 117-130. ISSN 1028-4796
5. OCHOA, A.P. et al. “Bioassay-guided in vitro study of the antimicrobial and cytotoxic
properties of the leaves from Excoecaria lucida Sw”. Pharmacognosy Research. 2017, 9 (4),
396-400. ISSN 0974-8490
38
6. OCHOA, A. Evaluación fitoquímica de hoja y corteza de Gymnanthes lucida Sw. (Yaití)
(Euphorbiaceae). Doctoral thesis, Universidad de La Habana: Instituto De Farmacia Y
Alimentos, La Habana, Cuba, 2017. Disponible en: http://eduniv.reduniv.edu.cu/index.
php?page=13&id=26&db=1 Consultado: 15/03/2019
7. OCHOA, A. et al. Phytochemical Study of Nonpolar Extracts from Excoecaria lucida Sw.
Leaves (Euphorbiaceae). Acta Chromatográfica. 2016, 28(3), 429–437. ISSN 2083-5736
APAK R, CAPANOGLU E, SHAHIDI F. Measurement of antioxidant activity and capacity:
Recent trends and applications. 1st ed. Canada: Editorial John Wiley & Sons, 2018. ISBN
9781119135357
8. APAGÓN, S.M. Cumarinas en la prevención del estrés oxidativo dependiente de la edad.
Doctoral thesis, Universidad Complutense de Madrid, Madrid, España, 1994. Disponible en:
http://eprints.ucmes/id/eprint/3845/ Consultado: 20/06/2019
9. TUKIRAN, T.; WARDANA, A.P.; HIDAYATI, N.; & SHIMIZU, K. “An Ellagic Acid
Derivative and Its Antioxidant Activity of Chloroform Extract of Stem Bark of Syzygium
polycephalum Miq. (Myrtaceae)”. Indonesia Journal of Chemistry. 2018; 18 (1), 26-34. ISSN
1411-9420-2460-1578
10. FARNSWORTH, N.R. “Biological and Phytochemical Screening of Plants. International”
Journal of Pharmaceutical Sciences. 1966; 55 (3), 262. ISSN 0975-1491.
12. KUMAZAWA, S.; HAMASAKA, T.; NAKAYAMA, T. “Antioxidant activity of propolis
of various geographic origins”. Food Chemistry. 2004, 84 (3), 329-339. ISSN 0308-8146
13. PATRA, J.K. et al. “Screening of antioxidant and antifilarial activity of leaf extracts of
Excoecaria agallocha L”. International Journal of Integrative Biology. 2009, 7 (1), 9-15.
ISSN 0973-8363
14. KILIC, I.; YEŞILOĞLU, Y.; BAYRAK, Y. Spectroscopic studies on the antioxidant
activity of ellagic acid. Spectrochimica Acta Part A Molecular and Biomolecular Spectroscopy.
2014, 130 (2014),447-52. ISSN 13861425
15. DEEPA, M.; DARSAN, M.B.; RAMALINGA, C. “In Vitro Evaluation of the antioxidant,
anti-inflammatory and antiproliferative activities of the leaf extracts of Excoecaria agallocha
L”. International Journal of Pharmaceutical Sciences. 2015, 7 (11), 346-52. ISSN 0975-1491
16. HOSSAIN, S. J.; AOSHIMA, H.; EL-SAYED, M.; & AHMED, F. Antioxidative and anti-
39
histamine release activities of E. agallocha L. Pharmacologyonline. 2009, 2, 927-936.
ISSN 1827-8620
17. SOFÍA, S. & TERESA, M.M. “Investigation of bioactive compounds and antioxidant
activity of Excoecaria agallocha, L”. International Journal of Pharmaceutical Sciences
Research. 2016, 7 (12), 5062-5066. ISSN 0975-8232
18. THIRUNAVUKKARASU, P. et al. “Screening of antioxidant status in selected mangrove
plants in Pichvaram mangrove forest (south east coast of India). International Journal
of Bioassays. 2013, 2 (3), 537-541. ISSN 2278-778X
19. MALIK, A. et al. In vitro antioxidant properties of Scopoletin. Journal of Chemistry and
Pharmacy Research. 2011, 3 (3), 659-665. ISSN 0975-7384
20. DELLAGRECA, M. et al. Antioxidant and Radical Scavenging Properties of Malva
sylvestris. Natural Products Communications. 2009, 4 (7), 893-896. ISSN 1555-9475
21. GIL, M.I. “Antioxidant Activity of Pomegranate Juice and Its Relationship with Phenolic
Composition and Processing”. Journal of Agriculture Food Chemistry. 2000, 48(10), 4581-9.
ISSN 1520-5118
22. KOSTOVA, I. et al. “Coumarins as Antioxidants”. Current Medicinal Chemistry. 2011, 18
(25), 3929-3951. ISSN 1875-533X
23. HOELZ, L.V.B. et al. “Quantitative structure-activity relationships of antioxidant phenolic
compounds”. Journal of Chemical and Pharmaceutical Research. 2010, 2 (5), 291-306.
ISSN 0975-7384
Conflict of interests
Authors declare that there are no conflict of interests.
Authors contributions
Diana Julia Arró Díaz, Ania Ochoa Pacheco and Yuri Mangueira Do Nascimento designed the
experiments. The experiments were performed and the data analysed by Diana Julia Arró Díaz,
Naylan Castelnaux Ochoa and Ania Ochoa Pacheco. Ania Ochoa Pacheco supervised the
experiments.