ACTIVE/PASSIVE - Building a better investment profession · Exercise diligence, independence, and...
20
ACTIVE/PASSIVE Authored by: Sheetal Radia, CFA Supported by Market Integrity and Professionalism Committee
Transcript of ACTIVE/PASSIVE - Building a better investment profession · Exercise diligence, independence, and...

ACTIVE/PASSIVE
Authored by: Sheetal Radia, CFA
Supported by Market Integrity and Professionalism Committee

2 | www.cfauk.org

CONTENTS
020 7648 6200
www.cfauk.org
Follow us:
@cfauk
www.cfauk.org | 3
4 DEFINITION
5 CFA UK’S POSITION AND ITS RELEVANCE TO MEMBERS AND OTHER STAKEHOLDERS
7 PORTFOLIO CONSTRUCTION
8 ACTIVE MANAGEMENT
9 PASSIVE MANAGEMENT
11 INSIGHTS INTO BETA AND ALPHA
15 WHAT ABOUT OTHER ASSET CLASSES AND IMPLEMENTATION?
18 CONCLUSION
4 | www.cfauk.org
DEFINITIONPassive investment vehicles track markets by holding
portfolios that mirror representative indices. Such
vehicles are attractive as they provide close to market
returns at low cost and in efficient markets the scope
for outperformance from active management is
limited. Active investment approaches aim to identify
opportunities to outperform a market or index and are
typically more costly than passive approaches. The
appeal of active investing is thought to be linked to
the belief that investors will attain a higher
risk-adjusted return.
Passive investment makes best sense where markets
are efficient and where there is little scope for active
management to generate the additional return required
to justify the higher fee. However, market efficiency
depends on the work of active managers. Passive
managers are price-takers; whereas active managers
are price makers.
As the factors affecting a security’s valuation change
over time, so its price should change. As the total
share of assets under management invested passively
grows, market efficiency may diminish (and volatility
may increase) providing active managers with
additional opportunities to generate excess returns. In
the meantime, passive management provides low-cost
access to efficient markets and maintains pressure on
active management fees.
THE PURPOSE OF THIS PAPER The growth of passively managed assets has
enhanced the scrutiny of active asset managers,
especially in the current low return environment.
The debate is typically framed as a binary choice
between either an active or a passive approach rather
than focusing on the costs and benefits related to
each method.
When looking to construct the most appropriate
portfolio the aim is always to achieve the highest net
of fees risk-adjusted return for the client subject to
their requirements. Having the entire capital allocation
managed either passively or actively would likely
provide a sub-optimal outcome.
For an individual investor – whether institutional or retail
- there would be disadvantages to having everything
managed passively –
1) There are some asset classes that do not offer a
passive investable alternative e.g private equity.
2) The financial markets can provide opportunities
that can be exploited by active management; one
example is the use of arbitrage.
3) While not all active managers may deliver value
some do and this highlights the importance played
by active managers in price formation, aiding the
process of capital allocation and the pricing of risk.
Similarly, it would probably not make sense to adopt
a purely active approach as active management is
condemned to underperform in aggregate because of
its role in setting the market’s value and the cost of
that activity.
The aim of this paper is to reframe the debate and
focus on what matters – how to deliver risk-adjusted
returns and how best to support clients as they seek to
achieve their investment goals and objectives.

www.cfauk.org | 5
1 Principles for Financial Benchmarks, IOSCO, July 2013 https://www.iosco.org/library/pubdocs/pdf/IOSCOPD415.pdf2 The European Commission’s Proposal for a REGULATION OF THE EUROPEAN PARLIAMENT AND OF THE COUNCIL on indices used as benchmarks in financial instruments and financial contracts September 2013.
3 CFA Institute comment letter to IOSCO on Financial Benchmarks http://www.cfainstitute.org/learning/products/publications/commentletters/Pages/02112013_79115.aspx?PageName=searchresults&ResultsPage=1
CFA UK’S POSITION AND ITS RELEVANCE TO MEMBERS AND OTHER STAKEHOLDERSCFA UK is agnostic about whether assets should be
managed actively or passively. What is important from
our perspective is that the most appropriate portfolio
is constructed so that it reflects the requirements and
preferences of the ultimate beneficiary. Rather than
‘either or’ it should be a client relevant process that
aims to make use of the benefits of both approaches
where appropriate. Of course if the client has strong
preferences we need to respect these but also ensure
that the client is aware of the trade-offs related to
following a mandate that only consists of active or
passive funds.
CFA UK members should ensure that they choose
approaches based on an objective assessment of the
client’s requirements. Within the CFA Institute’s Code
and Standards, Standard V(A) Diligence and Reasonable
Basis states that –
Members and Candidates must:
1. Exercise diligence, independence, and thoroughness
in analyzing investments, making investment
recommendations, and taking investment actions.
2. Have a reasonable and adequate basis, supported
by appropriate research and investigation, for any
investment analysis, recommendation, or action.
When constructing any portfolio to meet an objective,
the aim should be to use the most appropriate
combination of investments that can maximise the
chance of meeting the required risk-adjusted return
net of costs. There are a variety of approaches that
can be used ranging from all passive funds to all active
funds or a combination of both. Regardless of whether
the fund is passively or actively managed there must
be a robust rationale for its inclusion in the portfolio.
Conversely, the same rationale should apply when
removing an investment from a portfolio.
The debate about active and passive styles of
investment management has not always been calm
and considered. This is a shame and is unhelpful,
particularly as the effort involved is misdirected. It is
also odd that the debate has been framed as a binary
choice between active and passive approaches given
the relationship between the two.
The purpose of the investment profession is to deliver
clients’ net risk-adjusted return objectives over their
chosen time period – delivering to clients what they
want at the time or times that they want it. Achieving
this is challenging and the profession’s record of
delivery could be much improved, but the likelihood
is that clients will be better served by an investment
approach that is open to the use of active and
passive approaches at different times and for different
purposes, rather than by an approach that sticks
dogmatically to one or the other.
The current low return environment has contributed
to the vehemence with which the relative merits of
active and passive management are discussed and
reported. In a low return environment, the relatively low
cost of passive investment is attractive. Recent years
have seen a sharp increase in passive management’s
share of global assets under management. Focussing
investors’ minds on the cost of investing is valuable.
Cost is an important factor in any calculation of net
risk-adjusted return. But, while it is welcome that
investors are paying greater attention to cost
alongside performance, the element that is often
overlooked is risk.
When a proper consideration of risk is added into
the discussion, the value of having a broader set of
options to create the appropriate portfolio for the client
becomes much clearer.

6 | www.cfauk.org
PASSIVE PLUS ACTIVE NOT PASSIVE VS ACTIVEThe active/passive matrix below shows there are at least six ways of combining passive and active management
styles with active and passive vehicles.
ACTIVE/PASSIVE MATRIX
Management style Vehicles Overview
Passive Passive A ‘buy and hold’ strategy where the allocations are invested at the outset in passive vehicles and not rebalanced. For example, a portfolio (50/50) of 50% in a passive Gilt Fund and 50% in a passive FTSE All-Share fund is with no rebalancing or other form of risk management. While this approach reduces cost, it is unlikely to deliver optimal net risk-adjusted returns.
Passive Passive and Active
Here the same allocation decision is made, but is invested across passive and active vehicles. Beyond the risk management (adding and subtracting) undertaken in the active fund, no additional attempt is made to manage the risk exposure or to introduce any tactical tilts. Cost increases, but the increased cost may be offset by improved risk-adjusted returns.
Passive Active A buy and hold portfolio using only actively managed vehicles. High cost and unlikely to deliver optimal results as the aggregate risk characteristics of the funds are likely to change over time.
Active Passive Active management of passive vehicles can be carried out in three ways –
a. Rebalancing – rebalance the portfolio when the allocations to each asset class deviate materially from the policy portfolio. For example, in the 50/50 portfolio if the Gilt exposure rises to 60% and the equity exposure is at 40%, then some of the Gilt fund would be sold and the proceeds reinvested into the equity fund to bring the allocation back in line.
b. Tactical tilts – the portfolio is invested in passive vehicles, but the manager takes an active, tactical view on the exposures related to each asset class. For example, if the asset manager expects weakness in the UK equity market, they may reduce the exposure to equities and raise the exposure to Gilts..
c. Risk parity - This approach uses passive vehicles to obtain a specific risk-return profile for the portfolio. Often this approach can involve leverage and derivatives to obtain the desired exposures.
However, this approach may be sub-optimal if there are actively managed vehicles that could provide better risk-adjusted returns than some of the passive vehicles in the portfolio.
Active Passive and Active
Active management of a portfolio consisting of active and passive vehicles expands the choice to construct the most appropriate portfolio. However, while active management of this portfolio can provide benefits it may also incur costs through market timing and turnover.
Active Active The portfolio is composed of allocations to active management styles and is further actively managed through tactical and other tilts. Where capital is invested in illiquid assets, rebalancing may prove to be a challenge. The cost incurred in this approach may be unnecessarily high through investments in active vehicles investing in highly efficient markets.
Source: CFA UK
www.cfauk.org | 7
PORTFOLIO CONSTRUCTIONThe aim of any portfolio should be to achieve the
appropriate risk-adjusted return for the ultimate
beneficiary. Hence, it is important to ensure that the
selection of vehicles have the appropriate beta and
alpha exposures and that these vehicles can be
combined to maximise return for each unit of risk.
RISK-ADJUSTED RETURNS
TABLE 1 - ILLUSTRATION OF RISK-ADJUSTED RETURN
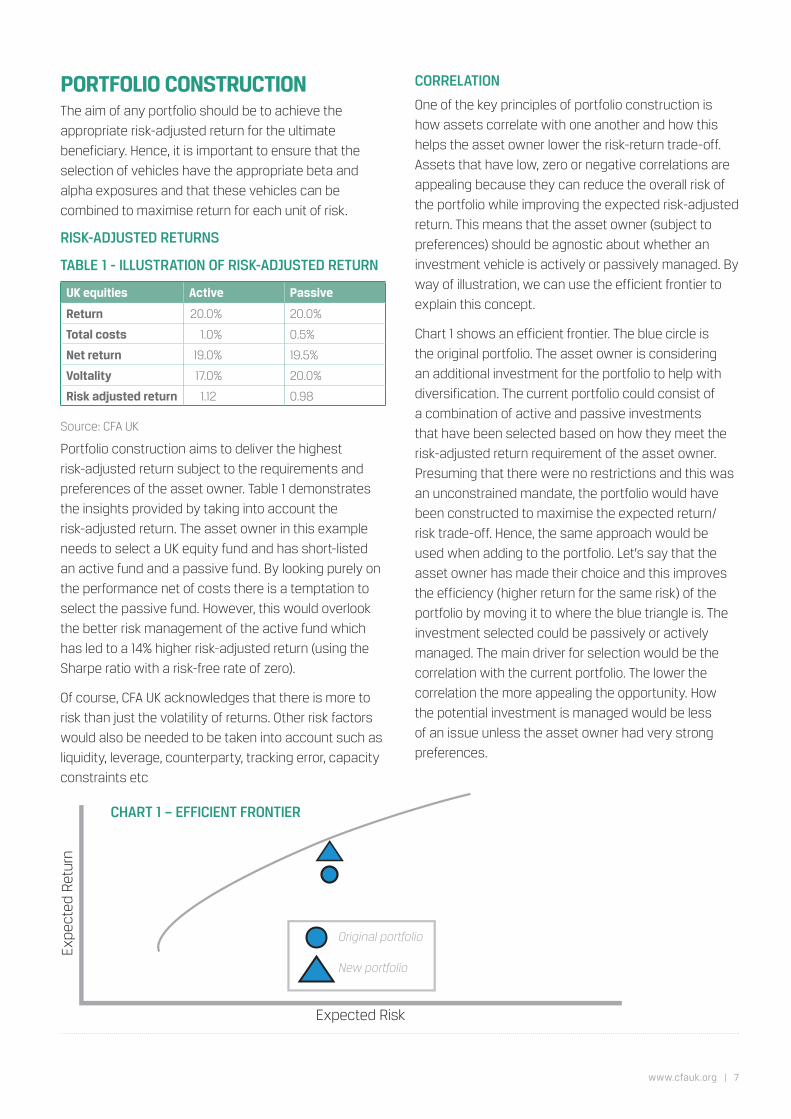
Portfolio construction aims to deliver the highest
risk-adjusted return subject to the requirements and
preferences of the asset owner. Table 1 demonstrates
the insights provided by taking into account the
risk-adjusted return. The asset owner in this example
needs to select a UK equity fund and has short-listed
an active fund and a passive fund. By looking purely on
the performance net of costs there is a temptation to
select the passive fund. However, this would overlook
the better risk management of the active fund which
has led to a 14% higher risk-adjusted return (using the
Sharpe ratio with a risk-free rate of zero).
Of course, CFA UK acknowledges that there is more to
risk than just the volatility of returns. Other risk factors
would also be needed to be taken into account such as
liquidity, leverage, counterparty, tracking error, capacity
constraints etc
CORRELATION
One of the key principles of portfolio construction is
how assets correlate with one another and how this
helps the asset owner lower the risk-return trade-off.
Assets that have low, zero or negative correlations are
appealing because they can reduce the overall risk of
the portfolio while improving the expected risk-adjusted
return. This means that the asset owner (subject to
preferences) should be agnostic about whether an
investment vehicle is actively or passively managed. By
way of illustration, we can use the efficient frontier to
explain this concept.
Chart 1 shows an efficient frontier. The blue circle is
the original portfolio. The asset owner is considering
an additional investment for the portfolio to help with
diversification. The current portfolio could consist of
a combination of active and passive investments
that have been selected based on how they meet the
risk-adjusted return requirement of the asset owner.
Presuming that there were no restrictions and this was
an unconstrained mandate, the portfolio would have
been constructed to maximise the expected return/
risk trade-off. Hence, the same approach would be
used when adding to the portfolio. Let’s say that the
asset owner has made their choice and this improves
the efficiency (higher return for the same risk) of the
portfolio by moving it to where the blue triangle is. The
investment selected could be passively or actively
managed. The main driver for selection would be the
correlation with the current portfolio. The lower the
correlation the more appealing the opportunity. How
the potential investment is managed would be less
of an issue unless the asset owner had very strong
preferences.
Source: CFA UK
UK equities Active Passive
Return 20.0% 20.0%
Total costs 1.0% 0.5%
Net return 19.0% 19.5%
Voltality 17.0% 20.0%
Risk adjusted return 1.12 0.98
Expe
cted
Ret
urn
Original portfolio
New portfolio
Expected Risk
CHART 1 – EFFICIENT FRONTIER

8 | www.cfauk.org
1Manager Selection , Research Foundation Publications December 2013, Vol. 2013, No. 4 by Scott D. Stewart, CFA http://www.cfapubs.org/toc/rf/2013/2013/42Do (Some) University Endowments Earn Alpha? Brad M. Barber, Guojun Wang Financial Analysts Journal, September/October 201,| Vol. 69| No. 5 Source: CFA Institute
32013 NACUBO-Commonfund Study of Endowments® (NCSE) http://www.nacubo.org/Documents/2013NCSEPressReleaseFinal.pdf
US Equity Mutual Funds
Funds-of-Funds Hedge Funds
Venture capital Private Equity Real Estate
Evidence of positive net alpha
Zero Marginal Mixed Mixed Marginal
Evidence of superior managers
Limited Yes Yes Yes Limited
Evidence of alpha persistence
Limited Yes Yes Yes Limited
Evidence of flows to positive-alpha managers
Yes Yes Yes Yes Yes
Notes: "Marginal" means there is some evidence of positive alpha but net alpha is not statistically significant at a high confidence level. "Mixed" means some evidence suggests
positive net alpha but other evidence suggests only marginal alpha. "Limited" means there is evidence for a subset of the universe but that it is not necessarily sufficient for
supporting profitable trading strategies.
Sources: The hedge funds study is Fung, Hsieh, Naik and Ramadorai (2008). The venture capital and private equity study is Kaplan and Schoar (2005). The real estate studies are
Lin and Young (2004) and Bond and Mitchell (2010).
ACTIVE MANAGEMENTThe wealth of empirical evidence into the active vs
passive debate is based on the theoretical view that
markets are efficient. The only way to ‘beat the market’
is by taking on additional risk. The active vs passive
debate has long been a discussion focussed on cost
and performance. The third dimension missing from
this discussion is risk. Asset management is as much
about risk management as it is about performance
generation. Risk-adjusted returns are what matter. Even
if all schemes adopted a passive approach they would
still be exposed to market risk and should achieve
performance net of fees that was below the market
return.
According to the CFA Institute’s Research Foundation
monograph ‘Manager Selection’1
“ Although the whole population of managers cannot be
winners, some managers will beat the market or earn
a positive alpha (that is, beat the relevant benchmark
after an appropriate adjustment for risk).”
Table 2 demonstrates the ability to deliver alpha across
different types of assets is variable. The more illiquid
and esoteric the asset the greater the potential for
active management to deliver excess risk-adjusted
returns. However, the management fees charged by
alternative investment managers are much higher than
those charged by managers of liquid portfolios. Despite
the challenges involved in selecting and investing with
alternative managers; hedge funds, private equity, real
estate, and commodities remain popular with many
investors especially the endowments, despite the
questions raised about how these assets generate
alpha2. Some US endowments (assets US$ 1Bln+)
have allocated the majority of their portfolios to these
alternative asset classes3.
TABLE 2 - EVIDENCE OF ALTERNATIVE INVESTMENT ALPHAS BASED ON RESULTS FROM FOUR RESEARCH STUDIES
Source: ‘Manager Selection’
www.cfauk.org | 9
PASSIVE MANAGEMENTAs set out in ‘Manager Selection’ the goal of an index
fund manager is to track a pre-specified index as
closely as possible. The measure for replication
success is called “tracking error”, investors should also
understand the indirect costs of achieving zero tracking
error. The more assets that follow a benchmark, the
greater the impact of benchmark effects from arbitrary
add/deletes/changes. By trading at the benchmark
effective date, an investment manager may reduce
tracking error but may also reduce the absolute
performance of the underlying index due to price
reversions from short term index effects not related to
fundamental valuation. The acceptable level of “tracking
error” depends on both the relevant security market
and the size, liquidity, and stability of the index. Index
construction and maintenance rules also affect the
ability of an index manager to succeed.
Sources of tracking error include –
» imperfect security weightings (for example, those
attributable to delayed adjustment to constituent
changes);
» cash build up (when the portfolio is not 100%
invested because of income, corporate actions,
contributions, or withdrawals);
» transaction costs (trading to handle constituent
changes and cash flows);
» sampling error; and
» model error (because statistical models for building
index portfolios that do not own every index
constituent do not provide perfect forecasts).
Tracking equity indices with liquid constituents, like
MSCI world, is easier than those with many constituent
companies, illiquid securities, or fixed-income securities
(because bonds typically do not trade in small lots and
many issues that are not current may not trade at all).
The latter may require “sampling” techniques because
not all constituents can be purchased. Effective
sampling techniques go beyond random selection
and instead require the use of statistical models that
measure risk exposures and help managers build
portfolios that are forecast to exhibit low tracking error.
In addition, passive exposure could be attained through
the use of total return swaps which may be lower cost
but add counterparty risk to the mix and even futures.
Risk parity approaches to portfolio management use
a combination of futures and passive funds to create
customised risk/return profiles for portfolios.
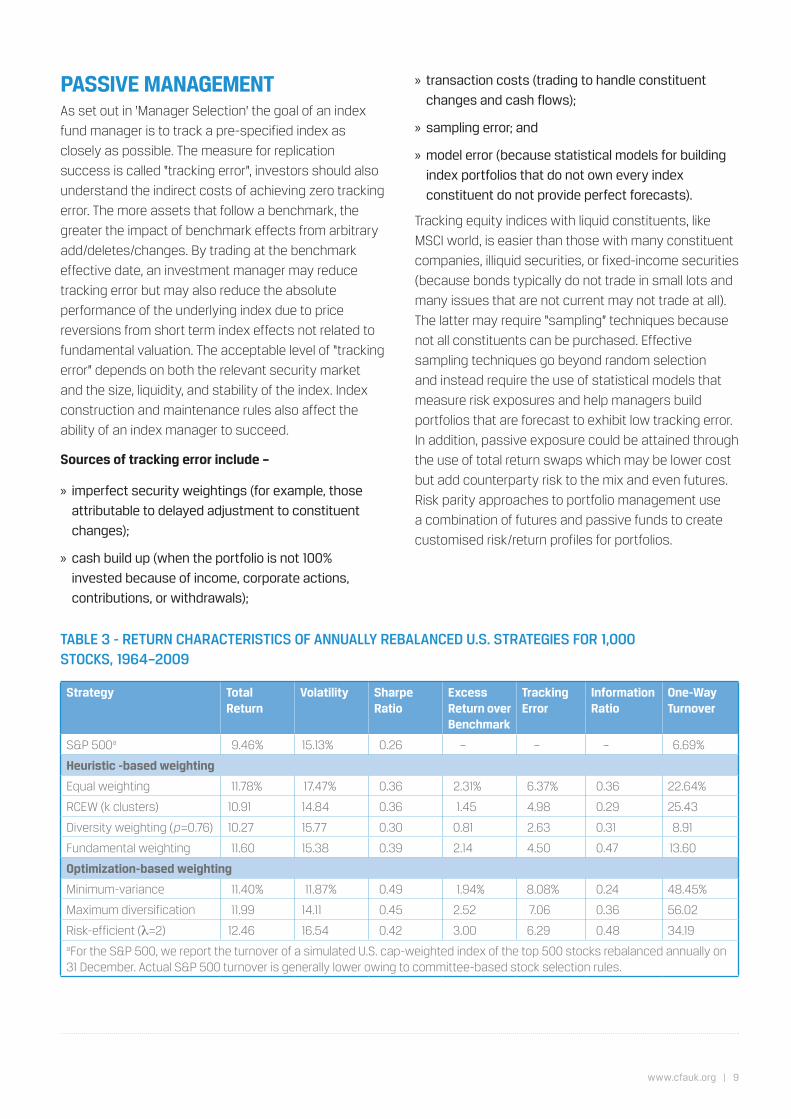
Strategy Total Return
Volatility Sharpe Ratio
Excess Return over Benchmark
Tracking Error
Information Ratio
One-Way Turnover
S&P 500a 9.46% 15.13% 0.26 – – – 6.69%
Heuristic -based weighting
Equal weighting 11.78% 17.47% 0.36 2.31% 6.37% 0.36 22.64%
RCEW (k clusters) 10.91 14.84 0.36 1.45 4.98 0.29 25.43
Diversity weighting (p=0.76) 10.27 15.77 0.30 0.81 2.63 0.31 8.91
Fundamental weighting 11.60 15.38 0.39 2.14 4.50 0.47 13.60
Optimization-based weighting
Minimum-variance 11.40% 11.87% 0.49 1.94% 8.08% 0.24 48.45%
Maximum diversification 11.99 14.11 0.45 2.52 7.06 0.36 56.02
Risk-efficient (l=2) 12.46 16.54 0.42 3.00 6.29 0.48 34.19aFor the S&P 500, we report the turnover of a simulated U.S. cap-weighted index of the top 500 stocks rebalanced annually on 31 December. Actual S&P 500 turnover is generally lower owing to committee-based stock selection rules.
TABLE 3 - RETURN CHARACTERISTICS OF ANNUALLY REBALANCED U.S. STRATEGIES FOR 1,000 STOCKS, 1964–2009

10 | www.cfauk.org
4 A Survey of Alternative Equity Index Strategies; Tzee-man Chow, Jason Hsu, Vitali Kalesnik, and Bryce Little Financial Analysts Journal, September/October 2011, Vol. 67, No. 5:37-57. http://www.cfapubs.org/doi/pdf/10.2469/faj.v67.n5.5
The arrival of ‘smart’ beta has expanded the choice available to gain a rules based approach to asset classes. In
the paper4 by Chow et al they show how different approaches to weighting portfolios can bring about different
outcomes. Alternative weights are used to construct the portfolio for example equal weights, risk weighted and
using accounting metrics to weight the portfolio using business related factors e.g sales. In doing it has been shown
that these alternative approaches to beta (or market return) can result in better risk-adjusted returns than their
traditional passive counterparts.
Table 3 sets out these different approaches for global equities and U.S securities and compares these with the
standard passive index. On a risk-adjusted basis most of the alternative approaches do outperform the traditional
passive index and produce higher risk-adjusted returns (Sharpe ratios). However, are these new passive approaches
more costly?
Global (1987–2009)
Strategy Excess Return over Benchmark
One-Way Turnover
Market Cap (US$ billions)
Avg. Bid-Ask Spread
Adj. Daily Volume (US$ millions)
Trading Costsabc
Cap-weighted benchmark – 8.4%d 66.34 0.11% 464.91 0.10%d
Heuristic -based weighting
Equal weighting 1.05% 21.8% 23.90 0.16% 174.96 0.31%
RCEW (k clusters) 3.20 32.3 37.47 0.17 189.12 0.69
Diversity weighting (p=0.76) 0.16 10.4 52.37 0.12 368.16 0.13
Fundamental weighting 3.54 14.9 59.14 0.14 397.81 0.28
Optimization-based weighting
Minimum-variance 1.01% 52.0% 23.97 0.35% 128.43 0.49%
Maximum diversification 0.18 59.7 20.08 0.45 122.50 0.57
Risk-efficient (l=2) 1.35 36.4 26.90 0.15 193.53 0.33
US (1964–2009)
Cap-weighted benchmark – 6.69%e 80.80 0.03% 735.40 0.03%e
Heuristic -based weighting
Equal weighting 2.31% 22.6% 11.48 0.06% 132.49 0.22%
RCEW (k clusters) 1.45 25.4 37.14 0.04 312.04 0.12
Diversity weighting (p=0.76) 0.81 8.9 50.53 0.04 477.87 0.06
Fundamental weighting 2.14 13.6 66.26 0.05 617.47 0.13
Optimization-based weighting
Minimum-variance 1.94% 48.4% 19.63 0.05% 136.37 0.43%
Maximum diversification 2.52 56.0 14.77 0.06 124.08 0.53
Risk-efficient (l=2) 3.00 34.2 12.06 0.06 140.07 0.25Note: Market Capitalization, bid-aqsk spread, and adjusted daily volume are estimated for rebalancing at the end of 2009.a Trading costs are estimated with the model proposed by Keim and Madhaven (1997), which accounts for (1) different exchanges, (2) size of trade, (3) market capitalization, (4) price per share, and (5) style of investment. Portfolio size is fixed as US$100 million; style of investment is set as indexed.
bWe modified the Keim–Madhaven model to reflect additional costs for trading on the London Stock Exchange (50 bps for selling) and the Hong Kong Stock Exchange (10bps for buying and selling).cTrading costs include portfolio rebalancing only, not the costs of entering and exiting strategies.dTurnover and trading costs are based on a simulated cap-weighted index of the top 1,000 stocks in the global developed market.eTurnover and trading costs are based on a simulated cap-weighted index of the top 500 stocks in the U.S. market.
TABLE 4 - TRANSACTION COST ANALYSIS FOR GLOBAL AND US EQUITIES.
The authors then carried out a transaction cost analysis for a $100 million mandate and applied it to each type of
portfolio. The summary of these results are set out in Table 4. Note that the trading cost estimates are naturally
lowest for the market capitalisation portfolio and are economically higher for the other strategies. From the authors’
estimations, however, it can been seen that the transaction costs for most strategies generally do not erode the
entire return in excess of the cap-weighted benchmark.

www.cfauk.org | 11
5 Research Foundation Publications, April 2009 Vol. 2009 No. 3 . Source: Research Foundation of CFA Institute Roger G. Clarke | Harindra de Silva, CFA | Steven Thorley, CFAhttp://www.cfainstitute.org/learning/products/publications/rf/Pages/rf.v2009.n3.aspx?PageName=searchresults&ResultsPage=1
INSIGHTS INTO BETA AND ALPHATABLE 5 CHARACTERISTICS OF ALPHA AND BETA RISKS
Beta Risk Alpha Risk
Source of return Positive expected premium earned by passive market exposure over time
Return from actively managing exposures to individual securities or timing of market exposure
Skill required Low High – competing with other active managers
Confidence in earning the expected return
High over long periods, but subject to short-term volatility
Low – difficult to identify exceptional managerial talent in advance
Cost Low High – have to pay for managerial talent and trading costs
Allocation of return among investors
All investors simultaneously realise the same return for the same market exposure
Some investors earn active returns at the expense of others
Shape of the return distribution
Can have fat tails but is somewhat symmetric Can be quite skewed (asymmetric distribution), with significant fat-tail risk
To provide further insight into combining active and passive strategies one has to understand the risk factors related
to beta and alpha. The characteristics of alpha and beta risk are set out in the CFA Institute Research Foundation
monograph ‘Investing Separately in Alpha and Beta’5. Table 5 sets out the building blocks that can be used to
combine beta and alpha exposures.
CHART 2 – DECOMPOSITION OF RISK AND RETURN
Chart 2 demonstrates how the beta and alpha risks can be further decomposed in terms of risk and return. In
essence, the return and risk profile of the portfolio can be categorised as exposures to a set of beta and alpha
factors. These insights can then be used to construct the appropriate portfolio. In fact, the number of combinations
available expands when one takes into account the availability of contingent capital. The distinction between actual
capital and contingent capital is demonstrated in Table 6.
Active Management of Securities or Timing of Beta Exposure
Constant Beta Exposure
TOTAL RETURN TOTAL RISK
ACTIVE (ALPHA) RETURN
SYSTEMATIC (BETA) RETURN
RISKLESS RETURN
ACTIVE (ALPHA) RISK
SYSTEMATIC (BETA) RISK
}}
}}
12 | www.cfauk.org
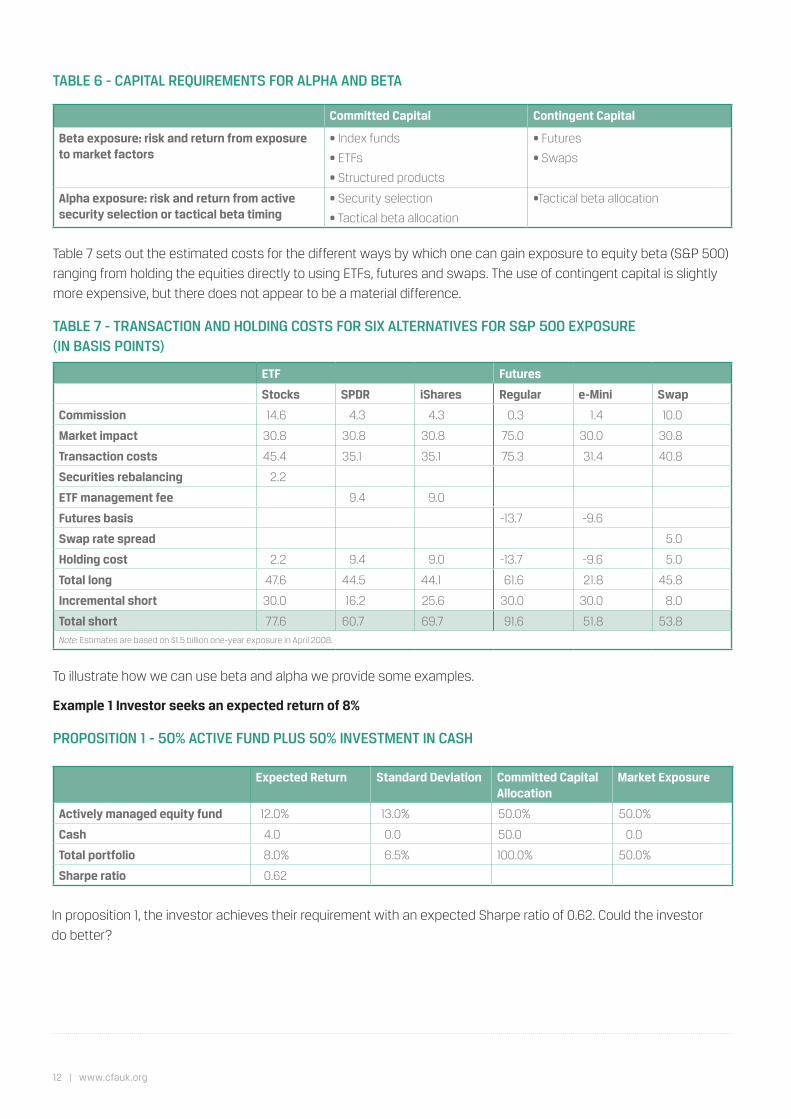
Committed Capital Contingent Capital
Beta exposure: risk and return from exposure to market factors
• Index funds
• ETFs
• Structured products
• Futures
• Swaps
Alpha exposure: risk and return from active security selection or tactical beta timing
• Security selection
• Tactical beta allocation
•Tactical beta allocation
ETF Futures
Stocks SPDR iShares Regular e-Mini Swap
Commission 14.6 4.3 4.3 0.3 1.4 10.0
Market impact 30.8 30.8 30.8 75.0 30.0 30.8
Transaction costs 45.4 35.1 35.1 75.3 31.4 40.8
Securities rebalancing 2.2
ETF management fee 9.4 9.0
Futures basis -13.7 -9.6
Swap rate spread 5.0
Holding cost 2.2 9.4 9.0 -13.7 -9.6 5.0
Total long 47.6 44.5 44.1 61.6 21.8 45.8
Incremental short 30.0 16.2 25.6 30.0 30.0 8.0
Total short 77.6 60.7 69.7 91.6 51.8 53.8
Note: Estimates are based on $1.5 billion one-year exposure in April 2008.
Expected Return Standard Deviation Committed Capital Allocation
Market Exposure
Actively managed equity fund 12.0% 13.0% 50.0% 50.0%
Cash 4.0 0.0 50.0 0.0
Total portfolio 8.0% 6.5% 100.0% 50.0%
Sharpe ratio 0.62
TABLE 6 - CAPITAL REQUIREMENTS FOR ALPHA AND BETA
Table 7 sets out the estimated costs for the different ways by which one can gain exposure to equity beta (S&P 500)
ranging from holding the equities directly to using ETFs, futures and swaps. The use of contingent capital is slightly
more expensive, but there does not appear to be a material difference.
TABLE 7 - TRANSACTION AND HOLDING COSTS FOR SIX ALTERNATIVES FOR S&P 500 EXPOSURE (IN BASIS POINTS)
To illustrate how we can use beta and alpha we provide some examples.
Example 1 Investor seeks an expected return of 8%
PROPOSITION 1 - 50% ACTIVE FUND PLUS 50% INVESTMENT IN CASH
In proposition 1, the investor achieves their requirement with an expected Sharpe ratio of 0.62. Could the investor
do better?
www.cfauk.org | 13
Expected Return Standard Deviation Committed Capital Allocation
Market Exposure
Actively managed equity fund 12.0% 13.0% 90.0% 90.0%
Index futures 5.0 12.0 0.0 -60.0
Cash 4.0 0.0 10.0 0.0
Total portfolio 8.2% 5.8% 100.0% 30.0%
Sharpe ratio 0.73
Hedge ratio 0.67
Expected Return Standard Deviation Committed Capital Allocation
Market Exposure
Alpha fund 7.0% 5.0% 90.0% 0.0%
Beta fund 9.0 12.0 30.0 30.0
Cash 4.0 0.0 -20.0 0.0
Total portfolio 8.2% 5.8% 100.0% 30.0%
Sharpe ratio 0.73
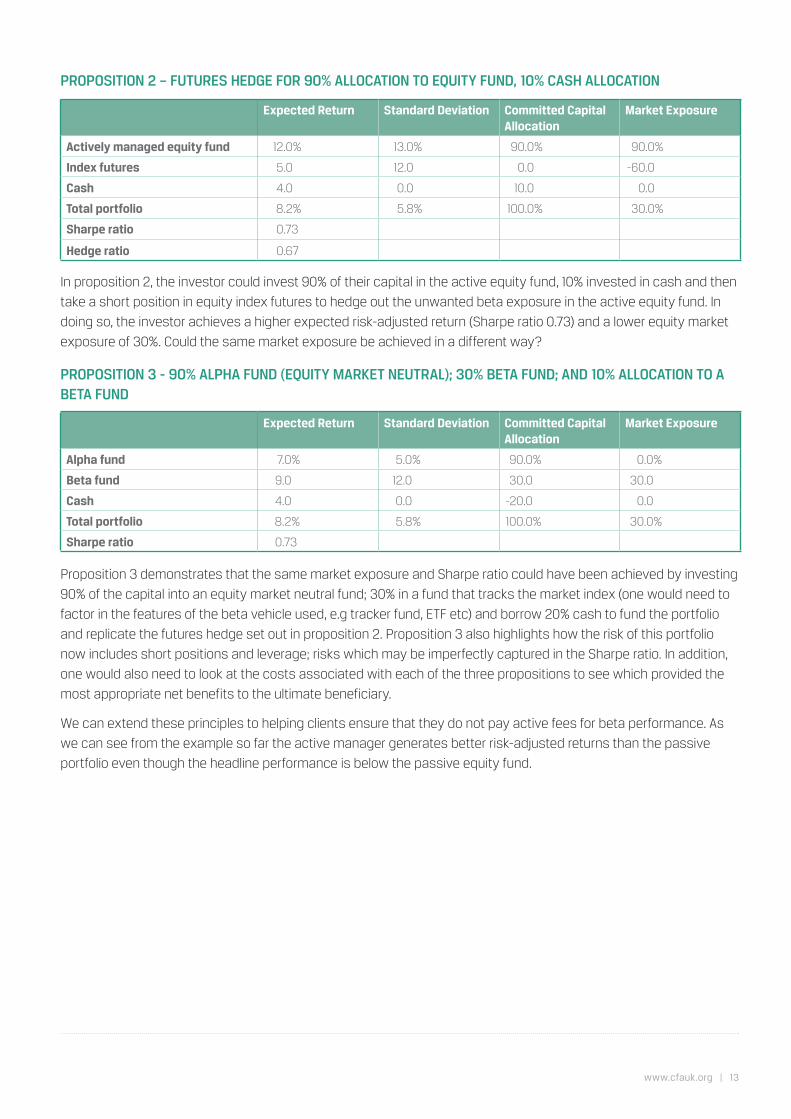
PROPOSITION 2 – FUTURES HEDGE FOR 90% ALLOCATION TO EQUITY FUND, 10% CASH ALLOCATION
In proposition 2, the investor could invest 90% of their capital in the active equity fund, 10% invested in cash and then
take a short position in equity index futures to hedge out the unwanted beta exposure in the active equity fund. In
doing so, the investor achieves a higher expected risk-adjusted return (Sharpe ratio 0.73) and a lower equity market
exposure of 30%. Could the same market exposure be achieved in a different way?
PROPOSITION 3 - 90% ALPHA FUND (EQUITY MARKET NEUTRAL); 30% BETA FUND; AND 10% ALLOCATION TO A BETA FUND
Proposition 3 demonstrates that the same market exposure and Sharpe ratio could have been achieved by investing
90% of the capital into an equity market neutral fund; 30% in a fund that tracks the market index (one would need to
factor in the features of the beta vehicle used, e.g tracker fund, ETF etc) and borrow 20% cash to fund the portfolio
and replicate the futures hedge set out in proposition 2. Proposition 3 also highlights how the risk of this portfolio
now includes short positions and leverage; risks which may be imperfectly captured in the Sharpe ratio. In addition,
one would also need to look at the costs associated with each of the three propositions to see which provided the
most appropriate net benefits to the ultimate beneficiary.
We can extend these principles to helping clients ensure that they do not pay active fees for beta performance. As
we can see from the example so far the active manager generates better risk-adjusted returns than the passive
portfolio even though the headline performance is below the passive equity fund.
14 | www.cfauk.org
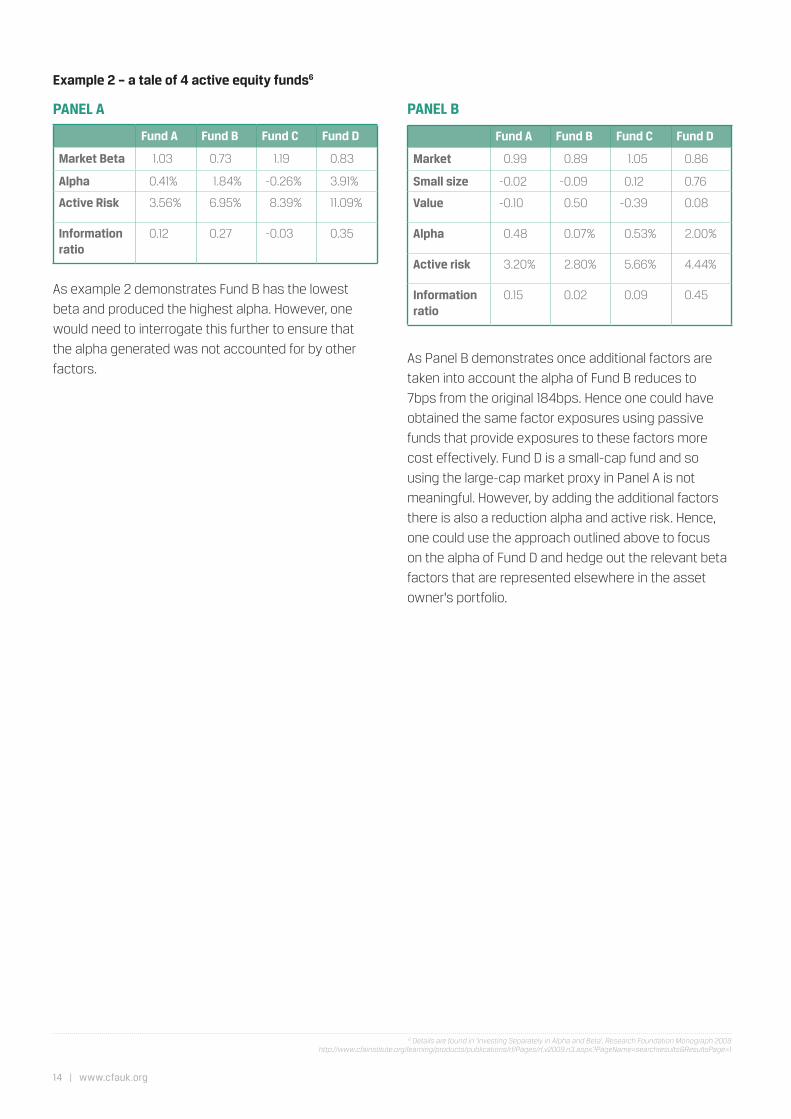
Example 2 – a tale of 4 active equity funds6
PANEL A
As example 2 demonstrates Fund B has the lowest
beta and produced the highest alpha. However, one
would need to interrogate this further to ensure that
the alpha generated was not accounted for by other
factors.
PANEL B
As Panel B demonstrates once additional factors are
taken into account the alpha of Fund B reduces to
7bps from the original 184bps. Hence one could have
obtained the same factor exposures using passive
funds that provide exposures to these factors more
cost effectively. Fund D is a small-cap fund and so
using the large-cap market proxy in Panel A is not
meaningful. However, by adding the additional factors
there is also a reduction alpha and active risk. Hence,
one could use the approach outlined above to focus
on the alpha of Fund D and hedge out the relevant beta
factors that are represented elsewhere in the asset
owner’s portfolio.
Fund A Fund B Fund C Fund D
Market Beta 1.03 0.73 1.19 0.83
Alpha 0.41% 1.84% -0.26% 3.91%
Active Risk 3.56% 6.95% 8.39% 11.09%
Information ratio
0.12 0.27 -0.03 0.35
Fund A Fund B Fund C Fund D
Market 0.99 0.89 1.05 0.86
Small size -0.02 -0.09 0.12 0.76
Value -0.10 0.50 -0.39 0.08
Alpha 0.48 0.07% 0.53% 2.00%
Active risk 3.20% 2.80% 5.66% 4.44%
Information ratio
0.15 0.02 0.09 0.45
6 Details are found in ‘Investing Separately in Alpha and Beta’, Research Foundation Monograph 2009 http://www.cfainstitute.org/learning/products/publications/rf/Pages/rf.v2009.n3.aspx?PageName=searchresults&ResultsPage=1
www.cfauk.org | 15
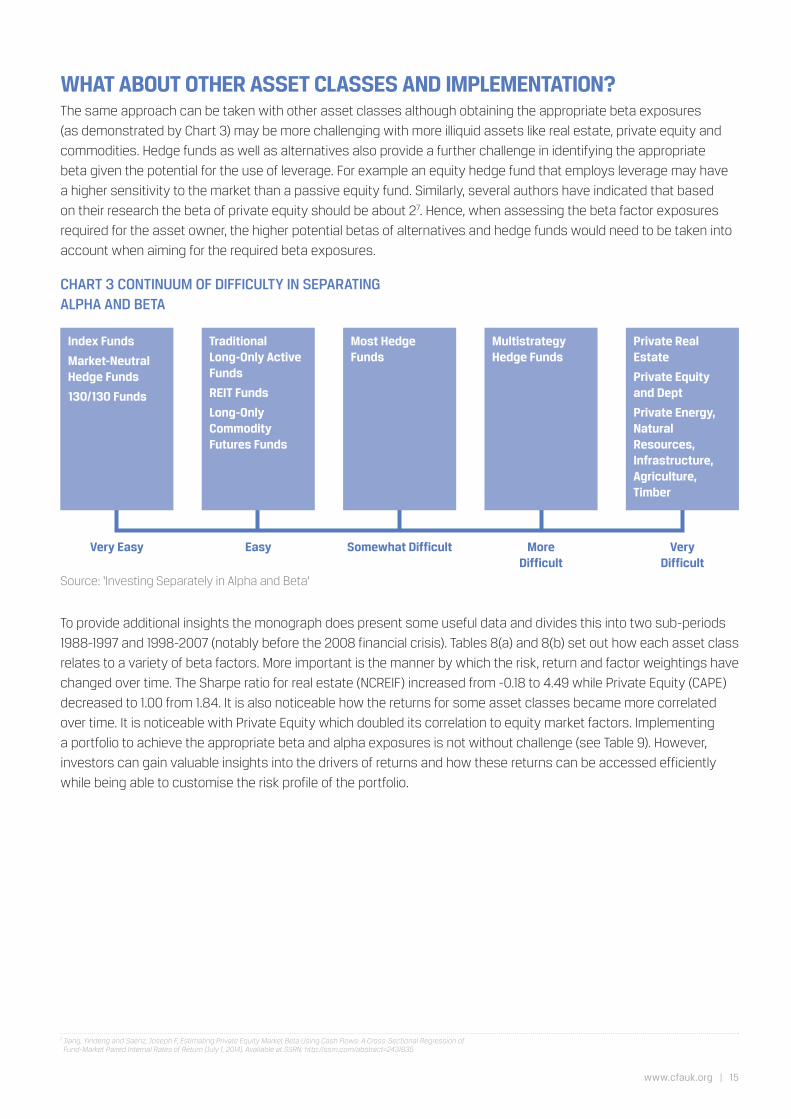
WHAT ABOUT OTHER ASSET CLASSES AND IMPLEMENTATION?The same approach can be taken with other asset classes although obtaining the appropriate beta exposures
(as demonstrated by Chart 3) may be more challenging with more illiquid assets like real estate, private equity and
commodities. Hedge funds as well as alternatives also provide a further challenge in identifying the appropriate
beta given the potential for the use of leverage. For example an equity hedge fund that employs leverage may have
a higher sensitivity to the market than a passive equity fund. Similarly, several authors have indicated that based
on their research the beta of private equity should be about 27. Hence, when assessing the beta factor exposures
required for the asset owner, the higher potential betas of alternatives and hedge funds would need to be taken into
account when aiming for the required beta exposures.
CHART 3 CONTINUUM OF DIFFICULTY IN SEPARATING ALPHA AND BETA
Very Easy Easy Somewhat Difficult More Difficult
Very Difficult
Index Funds
Market-Neutral Hedge Funds
130/130 Funds
Traditional Long-Only Active Funds
REIT Funds
Long-Only Commodity Futures Funds
Most Hedge Funds
Multistrategy Hedge Funds
Private Real Estate
Private Equity and Dept
Private Energy, Natural Resources, Infrastructure, Agriculture, Timber
Source: ‘Investing Separately in Alpha and Beta’
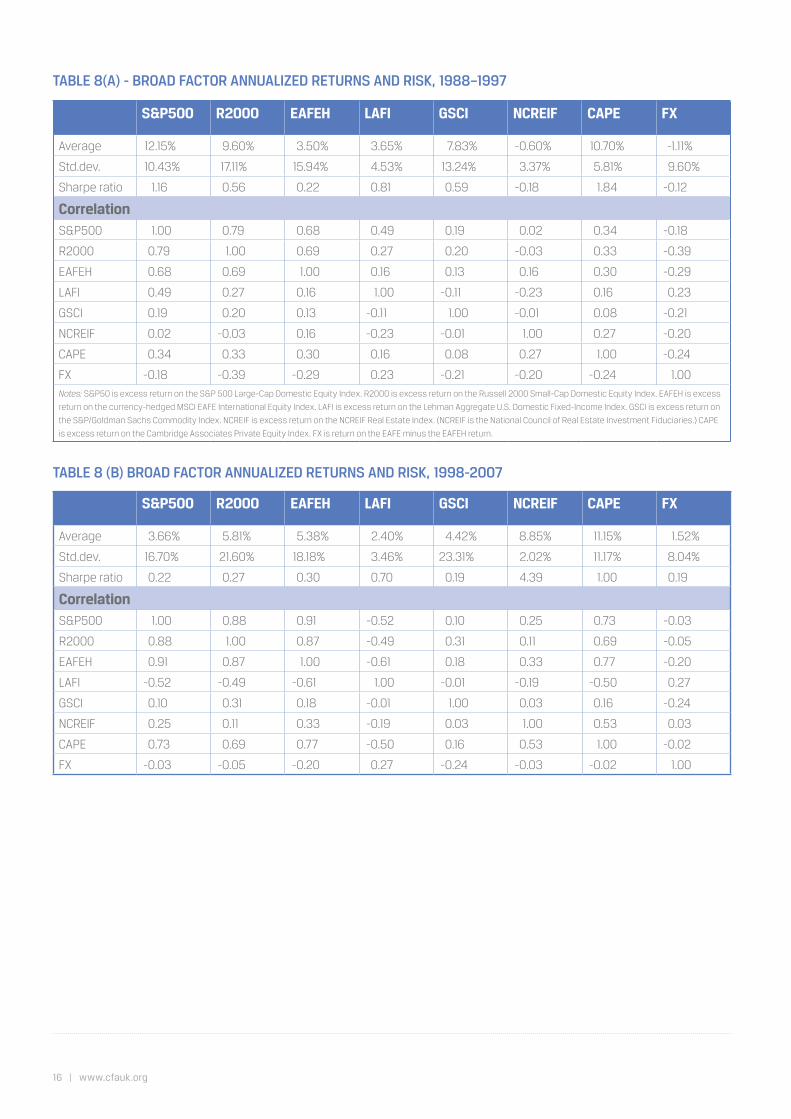
To provide additional insights the monograph does present some useful data and divides this into two sub-periods
1988-1997 and 1998-2007 (notably before the 2008 financial crisis). Tables 8(a) and 8(b) set out how each asset class
relates to a variety of beta factors. More important is the manner by which the risk, return and factor weightings have
changed over time. The Sharpe ratio for real estate (NCREIF) increased from -0.18 to 4.49 while Private Equity (CAPE)
decreased to 1.00 from 1.84. It is also noticeable how the returns for some asset classes became more correlated
over time. It is noticeable with Private Equity which doubled its correlation to equity market factors. Implementing
a portfolio to achieve the appropriate beta and alpha exposures is not without challenge (see Table 9). However,
investors can gain valuable insights into the drivers of returns and how these returns can be accessed efficiently
while being able to customise the risk profile of the portfolio.
7 Jiang, Yindeng and Saenz, Joseph F, Estimating Private Equity Market Beta Using Cash Flows: A Cross-Sectional Regression of Fund-Market Paired Internal Rates of Return (July 1, 2014). Available at SSRN: http://ssrn.com/abstract=2431835
16 | www.cfauk.org
S&P500 R2000 EAFEH LAFI GSCI NCREIF CAPE FX
Average 12.15% 9.60% 3.50% 3.65% 7.83% -0.60% 10.70% -1.11%
Std.dev. 10.43% 17.11% 15.94% 4.53% 13.24% 3.37% 5.81% 9.60%
Sharpe ratio 1.16 0.56 0.22 0.81 0.59 -0.18 1.84 -0.12
CorrelationS&P500 1.00 0.79 0.68 0.49 0.19 0.02 0.34 -0.18
R2000 0.79 1.00 0.69 0.27 0.20 -0.03 0.33 -0.39
EAFEH 0.68 0.69 1.00 0.16 0.13 0.16 0.30 -0.29
LAFI 0.49 0.27 0.16 1.00 -0.11 -0.23 0.16 0.23
GSCI 0.19 0.20 0.13 -0.11 1.00 -0.01 0.08 -0.21
NCREIF 0.02 -0.03 0.16 -0.23 -0.01 1.00 0.27 -0.20
CAPE 0.34 0.33 0.30 0.16 0.08 0.27 1.00 -0.24
FX -0.18 -0.39 -0.29 0.23 -0.21 -0.20 -0.24 1.00
Notes: S&P50 is excess return on the S&P 500 Large-Cap Domestic Equity Index. R2000 is excess return on the Russell 2000 Small-Cap Domestic Equity Index. EAFEH is excess
return on the currency-hedged MSCI EAFE International Equity Index. LAFI is excess return on the Lehman Aggregate U.S. Domestic Fixed-Income Index. GSCI is excess return on
the S&P/Goldman Sachs Commodity Index. NCREIF is excess return on the NCREIF Real Estate Index. (NCREIF is the National Council of Real Estate Investment Fiduciaries.) CAPE
is excess return on the Cambridge Associates Private Equity Index. FX is return on the EAFE minus the EAFEH return.
S&P500 R2000 EAFEH LAFI GSCI NCREIF CAPE FX
Average 3.66% 5.81% 5.38% 2.40% 4.42% 8.85% 11.15% 1.52%
Std.dev. 16.70% 21.60% 18.18% 3.46% 23.31% 2.02% 11.17% 8.04%
Sharpe ratio 0.22 0.27 0.30 0.70 0.19 4.39 1.00 0.19
CorrelationS&P500 1.00 0.88 0.91 -0.52 0.10 0.25 0.73 -0.03
R2000 0.88 1.00 0.87 -0.49 0.31 0.11 0.69 -0.05
EAFEH 0.91 0.87 1.00 -0.61 0.18 0.33 0.77 -0.20
LAFI -0.52 -0.49 -0.61 1.00 -0.01 -0.19 -0.50 0.27
GSCI 0.10 0.31 0.18 -0.01 1.00 0.03 0.16 -0.24
NCREIF 0.25 0.11 0.33 -0.19 0.03 1.00 0.53 0.03
CAPE 0.73 0.69 0.77 -0.50 0.16 0.53 1.00 -0.02
FX -0.03 -0.05 -0.20 0.27 -0.24 -0.03 -0.02 1.00
TABLE 8(A) - BROAD FACTOR ANNUALIZED RETURNS AND RISK, 1988–1997
TABLE 8 (B) BROAD FACTOR ANNUALIZED RETURNS AND RISK, 1998-2007

www.cfauk.org | 17
TABLE 9 CHECKLIST OF IMPLEMENTATION ISSUES
PORTFOLIO STRUCTURE
1. Diversification and Risk allocation
2. Degree of true alpha-beta separation
3. Initial funding; committed vs contingent capital
4. Separate portfolio vs commingled fund
5. Valuation and pricing procedures
6. Custody of funds and accounting audits
7. Use of leverage
8. Portfolio constraints (e.g., regulatory, legal, investor imposed)
ALPHA MANAGEMENT
1. Identified sources of alpha
2. Alpha measurement: pure alpha vs alpha and partial beta
3. Finding managers with alpha-generating skill
a. Reasonable value-added strategies
b. Costs (e.g., management fees, trading and administrative costs)
c. Capacity constraints
d. Alignment of investor and manager incentives
e. Historical performance attribution
4. Counterparty risk
5. Performance measurement and attribution
BETA MANAGEMENT
1. Identified sources of beta
2. Beta measurement
3. Choice of implementation vehicles
a. Tracking error
b. Costs
c. Capacity constraints
d. Source of funding
4. Counterparty risk
5. Performance measurement and attribution
LIQUIDITY MANAGEMENT
1. Initial funding: committed vs contingent capital
2. Settlement of contingent-capital cash flows
3. Spending needs and deferred capital calls
4. Rebalancing
5. Lockup provisions

18 | www.cfauk.org
CONCLUSIONThe debate about active and passive investing requires reshaping as the current focus is on a binary choice
between active and passive rather than how these approaches can be combined to construct the most
appropriate portfolio. When constructing portfolios, the key objective is the risk-adjusted return (net of fees).
How this is achieved relies on a variety of factors, all of which are determined by the asset owner’s preferences
and requirements. The aim should be to use the most appropriate combination of assets and approaches to
align with the client’s requirements.
As this paper demonstrates, both the passive and active approaches to portfolio construction and
management are varied and so provide a range of possible combinations to the client. A binary approach
that focuses on an active or passive approach is likely to limit the choice available to the client to meet their
objectives.
Chart 2 demonstrated how the beta and alpha risks can be further decomposed in terms of risk and return. In
essence, the return and risk profile of the portfolio can be categorised as exposures to a set of beta and alpha
factors. These insights can then be used to construct the appropriate portfolio for the client and so help them
achieve the expected risk-adjusted return.
However, while we should be open about how to construct the most appropriate portfolio for our clients, it is
essential that we understand the implications of the factors that can affect implementation (see Table 9).

www.cfauk.org | 19

CFA Society of the UK
4th Floor, Minster House
42 Mincing Lane
London EC3R 7AE
www.cfauk.org