Active Session History: Advanced Analysis
109
Active Session History: Advanced Analysis David Kurtz
Transcript of Active Session History: Advanced Analysis

Active Session History:
Advanced Analysis
David Kurtz

ASH: Advanced Analysis ©2016 2
• Accenture Enkitec Group
• Performance tuning
– Oracle RDBMS
– PeopleSoft ERP
• Book
– www.psftdba.com
• Oak Table
• .
Who Am I?

ASH: Advanced Analysis ©20163
• Accenture Enkitec Group
• Performance tuning
– Oracle RDBMS
– PeopleSoft ERP
• Book
– www.psftdba.com
• Oak Table
• .
Who Am I?

Agenda: Active Session History
• There are a lot of things that I am not going to talk about.
– Because I want to get to the fun stuff at the end
• What is it? What does it do?
– How does it work
– Theory of DB Time
– Enterprise Manager & ASH Report
– Compare and contrast SQL*Trace
ASH: Advanced Analysis ©2016 4

ASH Fundamentals
& Theory of DB Time
• https://www.youtube.com/watch?v=rxQkvXIY7X0
ASH: Advanced Analysis ©2016 5

Agenda: Active Session History
• Using SQL to Analyse ASH
– Top SQL
– Locking,
– Changing Plans
– I/O
– Temporary Usage
– Index Usage
– Limitations & Pitfalls
ASH: Advanced Analysis ©2016 6

ASH: Advanced Analysis ©2016 7
Resources
• If you can’t hear me say so now.
• Please feel free to ask questions as we go
along.
• The presentation will be available from • Conference website
• http://www.go-faster.co.uk

ASH: Advanced Analysis ©2016 8
Further Reading
• This presentation started out as a paper
about ASH, you might find it easier to work
with that than this presentation.
– Not everything in the paper appears in the
presentation.
– On the conference website, but also at
– http://www.go-faster.co.uk/Practical_ASH.pdf

ASH: Advanced Analysis ©2016 9
Background Reading
• Graham Wood – Sifting through the ASHes of (DB) Time
• http://www.oracle.com/technetwork/database/manageability/ppt-active-session-history-129612.pdf
– ASH Architecture and Advanced Usage• www.youtube.com/watch?v=rxQkvXIY7X0
• Doug Burns’ Oracle Blog• http://oracledoug.com/serendipity/index.php?/plugin/tag/ASH
• http://oracledoug.com/serendipity/index.php?/archives/1477-Diagnosing-Locking-Problems-using-ASH-Part-1.html
• ASH Masters• http://www.ashmasters.com/
• Introduction to DBMS_XPLAN• http://www.go-faster.co.uk/Intro_DBMS_XPLAN.ppt

ASH: Advanced Analysis ©2016 10
Your Mileage May Vary
• Throughout this presentation I will be showing you examples mostly from PeopleSoft systems.
– If you have a different package or you own application, you are likely to face similar challenges.
– Don’t worry about the PeopleSoft specifics.
– Focus on the kind of information I am using to filter my ASH data.

ASH: Advanced Analysis ©2016 12
Licensing
• ASH is a part of the Diagnostics Pack
– That’s means it costs money.
• I don’t like it either, but that is how it is!
– Only available on Enterprise Edition
– S-ASH: Simulated ASH
• OraSASH: http://pioro.github.io/orasash/

ASH data in OEM
ASH: Advanced Analysis ©2016 19

ASH: Advanced Analysis ©2016 26
ASH –v- SQL*Trace
• ASH
– Licensed
– Always there
– No marginal cost
– Real Time
– Who is blocking me?
– Statistical data
– Plan if captured by AWR
– Estimate of duration
• Per wait event
• Operation in 11gR2
• SQL*Trace
– Free
– Enable, File, Profile
– Run-time overhead
– Reactive
– Being Blocked
– Every SQL & event
– Actual execution plan
– Exact duration
• Operations in Plan

ASH: Advanced Analysis ©2016 27
ASH –v- SQL*Trace
• ASH can be used to resolve many of your
performance issues.
• Sometimes, you will still need SQL*Trace

ASH: Advanced Analysis ©2016 28
Application Instrumentation
• It is essential to be able to match
– database sessions
– application processes
• DBMS_APPLICATION_INFO
– set_module, set_action
– Calls in application
• Few packaged application vendors do this

PL/SQL Instrumentation
k_module CONSTANT VARCHAR2(48) := $$PLSQL_UNIT;
…
PROCEDURE my_procedure IS
l_module VARCHAR2(48);
l_action VARCHAR2(32);
BEGIN
dbms_application_info.read_module(module_name=>l_module
,action_name=>l_action);
dbms_application_info.set_module(module_name=>k_module
,action_name=>'MY_PROCEDURE');
…
dbms_application_info.set_module(module_name=>l_module
,action_name=>l_action);
EXCEPTION
WHEN … THEN
dbms_application_info.set_module(module_name=>l_module
,action_name=>l_action);
RAISE / EXIT
…
END my_procedure;
ASH: Advanced Analysis ©2016 29

ASH: Advanced Analysis ©2016 30
DIY Instrumentation
• You may need to be creative!– PeopleTools <8.51: When a process starts (and sets its
own status), I have a trigger that sets module and action
CREATE OR REPLACE TRIGGER sysadm.psftapi_store_prcsinstance
BEFORE UPDATE OF runstatus ON sysadm.psprcsrqst FOR EACH ROW
WHEN ((new.runstatus IN('3','7','8','9','10') OR old.runstatusIN('7','8')) AND new.prcstype != 'PSJob')
BEGIN
…
psftapi.set_action(p_prcsinstance=>:new.prcsinstance
,p_runstatus=>:new.runstatus, p_prcsname=>:new.prcsname);
…
EXCEPTION WHEN OTHERS THEN NULL; --do not crash the scheduler
END;
/

No Instrumentation!
ASH: Advanced Analysis ©2016 31

With Instrumentation!
ASH: Advanced Analysis ©2016 32

ASH: Advanced Analysis ©2016 33
What are you looking for?
• You need a clear idea of the question you are
asking of the ASH data.
• What are you interested in?
– Time Window
• Recent –v- Historical
– Single Session / Group of Sessions / Whole Database
– All ASH Data / One Event / One SQL ID / One Plan
– Related ASH data (sessions blocked by lock)

ASH: Advanced Analysis ©2016 34
Statistical Analysis of ASH data
• RecentSELECT …
, SUM(1) ash_secs
FROM v$active_session_history
WHERE …
GROUP BY …
• HistoricalSELECT …
, SUM(10) ash_secs
FROM dba_hist_active_sess_history
WHERE …
GROUP BY …

ASH: Advanced Analysis ©2016 35
Querying ASH Repository
• DBA_HIST_ACTIVE_SESS_HISTORY
– WRH$_ACTIVE_SESSION_HISTORY
partitioned on DBID and SNAP_ID
• DBA_HIST_SNAPSHOT
– WRM$_SNAPSHOT

ASH: Advanced Analysis ©2016 36
Querying ASH Repository
SELECT /*+LEADING(x) USE_NL(h)*/
…
, SUM(10) ash_secs
FROM dba_hist_active_sess_history h
, dba_hist_snapshot x
WHERE x.snap_id = h.snap_id
AND x.dbid = h.dbid
AND x.instance_number = h.instance_number
AND x.end_interval_time >= …
AND x.begin_interval_time <= …
AND h.sample_time BETWEEN … AND …
AND …
GROUP BY …

ASH: Advanced Analysis ©2016 37
SELECT /*+LEADING(x h) USE_NL(h)*/
h.sql_id
, h.sql_plan_hash_value
, SUM(10) ash_secs
FROM dba_hist_snapshot x
, dba_hist_active_sess_history h
WHERE x.end_interval_time
>= TO_DATE('201402010730','yyyymmddhh24mi')
AND x.begin_interval_time
<= TO_DATE('201402010830','yyyymmddhh24mi')
AND h.sample_time BETWEEN TO_DATE('201402010730','yyyymmddhh24mi')
AND TO_DATE('201402010830','yyyymmddhh24mi')
AND h.SNAP_id = X.SNAP_id
AND h.dbid = x.dbid
AND h.instance_number = x.instance_number
AND h.module like 'PSAPPSRV%'
GROUP BY h.sql_id, h.sql_plan_hash_value
ORDER BY ash_secs DESC
/
Example: On-Line
Application not instrumented
Can Only Filter by Module
Snapshots for Period for
which process was running
ASH Data for period for
which process was running

ASH: Advanced Analysis ©2016 38
Top SQL
SQL Plan
SQL_ID Hash Value ASH_SECS
------------- ---------- ----------
7hvaxp65s70qw 1051046890 1360
fdukyw87n6prc 313261966 760
8d56bz2qxwy6j 2399544943 720
876mfmryd8yv7 156976114 710
bphpwrud1q83t 3575267335 690
…

ASH: Advanced Analysis ©2016 39
Get the Execution Plan from AWR
SELECT * from table(
dbms_xplan.display_awr(
'7hvaxp65s70qw', 1051046890, NULL,
'ADVANCED'));

ASH: Advanced Analysis ©2016 40
Example: A Batch Process
• In PeopleSoft: a process request table
– one row per scheduled process.
• Process Attributes
– Process Instance
– Operator ID
– Process Type & Name
– Begin Date/Time
– End Date/Time

ASH: Advanced Analysis ©2016 41
SELECT /*+LEADING(r x h) USE_NL(h)*/
r.prcsinstance
, h.sql_id, h.sql_plan_hash_value
, (r.enddttm-r.begindttm)*86400 exec_secs
, SUM(10) ash_secs
FROM dba_hist_snapshot x
, dba_hist_active_sess_history h
, sysadm.psprcsrqst r
WHERE x.end_interval_time >= r.begindttm
AND x.begin_interval_time <= r.enddttm
AND h.sample_time BETWEEN r.begindttm AND r.enddttm
AND h.snap_id = x.snap_id
AND h.dbid = x.dbid
AND h.instance_number = x.instance_number
AND h.module = r.prcsname
AND h.action LIKE 'PI='||r.prcsinstance||'%‘
AND r.prcsinstance = 1956338
GROUP BY r.prcsinstance, r.prcsname, r.begindttm, r.enddttm
, h.sql_id,h.sql_plan_hash_value
ORDER BY ash_secs DESC
Example: A Batch Process
Process Request Table
One Row per Process
Specifc Process by ID
Snapshots for Period for
which process was running
ASH Data for period for
which process was running
Filter ASH data by MODULE
and ACTION
Hint to guarantee sensible
join order, and partition
elimination

ASH: Advanced Analysis ©2016 42
Example: A Running Batch Process
• The process has been running for a long
time.
– “It appears to have ground to a halt.”
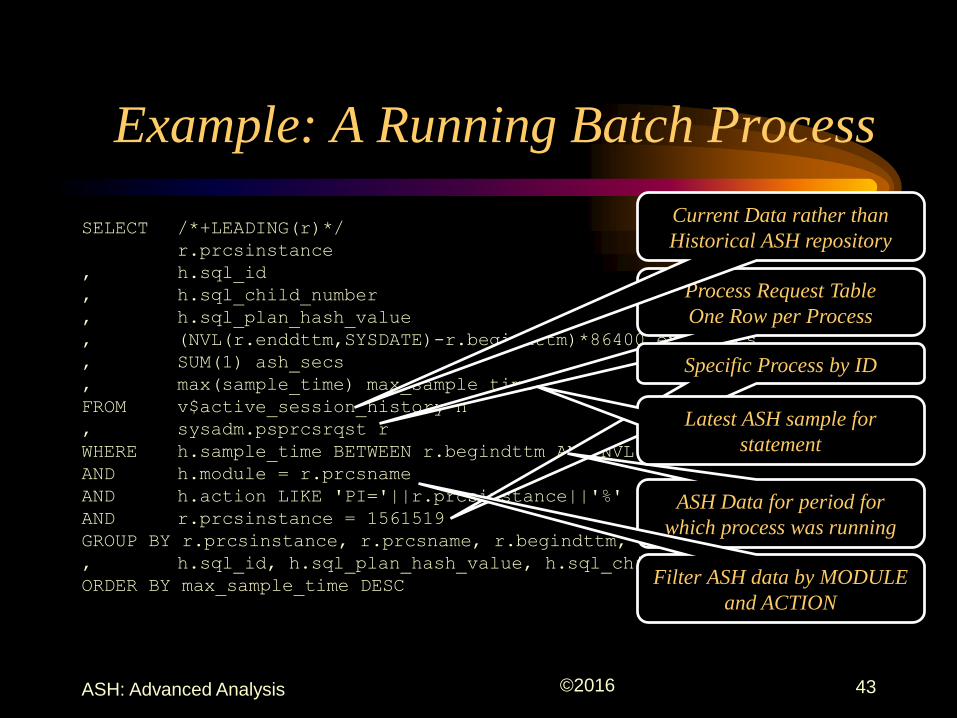
ASH: Advanced Analysis ©2016 43
SELECT /*+LEADING(r)*/
r.prcsinstance
, h.sql_id
, h.sql_child_number
, h.sql_plan_hash_value
, (NVL(r.enddttm,SYSDATE)-r.begindttm)*86400 exec_secs
, SUM(1) ash_secs
, max(sample_time) max_sample_time
FROM v$active_session_history h
, sysadm.psprcsrqst r
WHERE h.sample_time BETWEEN r.begindttm AND NVL(r.enddttm,SYSDATE)
AND h.module = r.prcsname
AND h.action LIKE 'PI='||r.prcsinstance||'%'
AND r.prcsinstance = 1561519
GROUP BY r.prcsinstance, r.prcsname, r.begindttm, r.enddttm
, h.sql_id, h.sql_plan_hash_value, h.sql_child_number
ORDER BY max_sample_time DESC
Example: A Running Batch Process
Process Request Table
One Row per Process
Specific Process by ID
ASH Data for period for
which process was running
Filter ASH data by MODULE
and ACTION
Current Data rather than
Historical ASH repository
Latest ASH sample for
statement

ASH: Advanced Analysis ©2016 44
Example: A Running Batch Process
Process Child SQL Plan Exec ASH
Instance SQL_ID No. Hash Value Secs Secs Last Running
---------- ------------- ------ ---------- ------ ------ -------------------------
1561509 9yj020x2762a9 0 3972644945 18366 17688 19-FEB-14 04.24.41.392 PM
1561509 9yj020x2762a9 0 799518913 18366 1 19-FEB-14 11.26.29.096 AM
1561509 b5r9c04ck29zb 1 149088295 18366 1 19-FEB-14 11.26.28.085 AM
1561509 5vdhh2m8skh86 1 0 18366 1 19-FEB-14 11.26.27.075 AM
1561509 gyuq5arbj7ykx 0 3708596767 18366 1 19-FEB-14 11.26.26.065 AM
1561509 0 0 18366 1 19-FEB-14 11.26.25.055 AM
1561509 5jkh8knvxw7k2 0 1549543019 18366 1 19-FEB-14 11.26.24.043 AM
1561509 9pz262n5gbhmk 0 1935542594 18366 1 19-FEB-14 11.26.23.033 AM
1561509 6qg99cfg26kwb 1 3610545376 18366 1 19-FEB-14 11.26.22.035 AM
1561509 gpdwr389mg61h 0 672996088 18366 422 19-FEB-14 11.26.21.014 AM
1561509 gpdwr389mg61h 0 3588911518 18366 1 19-FEB-14 11.19.13.931 AM
1561509 fmbbqm351p05q 0 2548875690 18366 1 19-FEB-14 11.19.12.916 AM
1561509 dwfwa9bsgsnv3 0 2495151791 18366 14 19-FEB-14 11.19.11.912 AM
1561509 d0wu61901pbx4 0 3123499903 18366 9 19-FEB-14 11.18.57.771 AM
1561509 g7psub9favw54 0 2314801731 18366 10 19-FEB-14 11.18.48.679 AM
1561509 cbppam9ph5bu8 0 0 18366 1 19-FEB-14 11.18.38.571 AM
1561509 cbppam9ph5bu8 0 3488560417 18366 1 19-FEB-14 11.18.37.551 AM
1561509 3cswz2x9ubjm3 0 504495601 18366 1 19-FEB-14 11.18.36.541 AM
This Statement has been
running for a while

ASH: Advanced Analysis ©2016 45
Same Process, a little later
Process Child SQL Plan Exec ASH
Instance SQL_ID No. Hash Value Secs Secs Last Running
---------- ------------- ------ ---------- ------ ------ -------------------------
1561509 5zq8mtxp0nfn8 0 1505304026 38153 1 19-FEB-14 09.28.52.628 PM
1561509 b023ph16myv5d 0 1416307094 38153 30 19-FEB-14 09.28.51.618 PM
1561509 b023ph16myv5d 0 51594791 38153 1 19-FEB-14 09.28.21.300 PM
1561509 14k7bqan2vfh8 0 1620828024 38153 1 19-FEB-14 09.28.20.280 PM
1561509 d2498j5x025rq 0 3746253366 38153 82 19-FEB-14 09.28.19.270 PM
1561509 fsywq5xqn66nf 0 3232283327 38153 43 19-FEB-14 09.26.54.280 PM
1561509 4z29htzn27cct 0 763665386 38153 14 19-FEB-14 09.24.54.853 PM
1561509 4z29htzn27cct 0 3569720797 38153 1 19-FEB-14 09.24.27.533 PM
1561509 a4zg5sgfc23kt 0 1936785589 38153 78 19-FEB-14 09.24.26.523 PM
1561509 8x1u4hd6jq6pg 0 2692129132 38153 42 19-FEB-14 09.23.07.685 PM
1561509 amakpc5aqxvh4 0 3033962754 38153 3 19-FEB-14 09.22.25.207 PM
1561509 8za7232u5pnrf 0 3717166321 38153 13296 19-FEB-14 09.22.21.167 PM
1561509 8za7232u5pnrf 0 2937741215 38153 1 19-FEB-14 05.38.13.085 PM
1561509 8msvfudz3bc1w 0 1444355751 38153 24 19-FEB-14 05.38.11.939 PM
1561509 5fvtbncfpkbuu 0 1444355751 38153 32 19-FEB-14 05.37.47.615 PM
1561509 59sdxn718fs8w 0 1746491243 38153 11 19-FEB-14 05.37.13.236 PM
1561509 g0by0mj1d6dy2 0 2128929267 38153 1 19-FEB-14 05.37.02.049 PM
1561509 7sx5p1ug5ag12 1 2873308018 38153 1 19-FEB-14 05.37.01.033 PM
1561509 9yj020x2762a9 0 3972644945 38153 13295 19-FEB-14 05.36.59.620 PM
Same Statement as before,
but shows less run time.
ASH Buffer has flushed some
data

ASH: Advanced Analysis ©2016 46
Obtain Execution Plan from Library
Cache
SELECT * from table(
dbms_xplan.display_cursor(
'9yj020x2762a9', 0, 'ADVANCED'));
ASH: Advanced Analysis ©2016 47
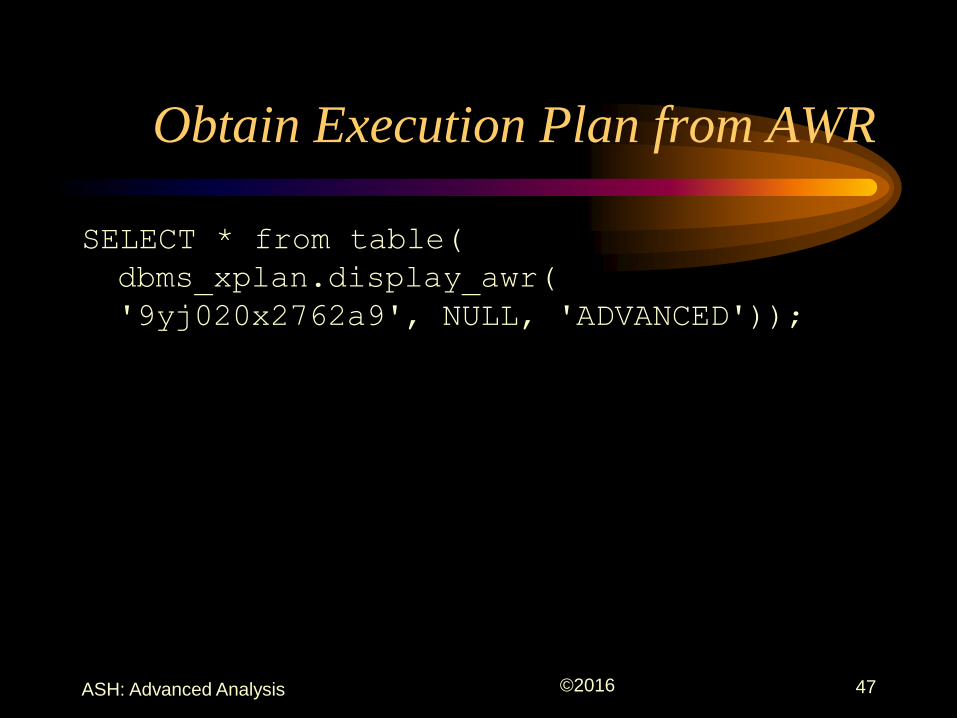
Obtain Execution Plan from AWR
SELECT * from table(
dbms_xplan.display_awr(
'9yj020x2762a9', NULL, 'ADVANCED'));

ASH: Advanced Analysis ©2016 48
Use SQL Query to Generate Code to
Obtain Execution Plan
SELECT DISTINCT 'SELECT * FROM
table(dbms_xplan.display_cursor('''||
sql_id||''','||sql_child_number||
',''ADVANCED''));'
FROM v$active_session_history
…

Which Part of Execution Plan
Consumed the Most Time?
SELECT …
, h.sql_plan_line_id
, sum(10) ash_secs
FROM dba_hist_snapshot x
, dba_hist_active_sess_history h
…
WHERE …
AND h.sql_id = 'a47fb0x1b23jn'
GROUP BY …
, h.sql_plan_line_id
ORDER BY prcsinstance, ASH_SECS DESC
ASH: Advanced Analysis ©2016 49

Which Part of Execution Plan
Consumed the Most Time?
PRCSINSTANCE SQL_PLAN_HASH_VALUE SQL_PLAN_LINE_ID ASH_SECS
------------ ------------------- ---------------- ----------
4945802 483167840 25 2410
483167840 24 1190
483167840 26 210
483167840 20 190
483167840 21 30
483167840 16 20
483167840 23 10
483167840 22 10
483167840 18 10
483167840 10
483167840 7 10
ASH: Advanced Analysis ©2016 50

Which Part of Execution Plan
Consumed the Most Time?
Plan hash value: 483167840
---------------------------------------------------------------------------------------------------------------------------------------
| Id | Operation | Name | Rows | Bytes | Cost (%CPU)| Time | TQ |IN-OUT| PQ Distrib |
---------------------------------------------------------------------------------------------------------------------------------------
…
| 14 | NESTED LOOPS | | | | | | Q1,04 | PCWP | |
| 15 | NESTED LOOPS | | 3988 | 669K| 113K (1)| 00:06:08 | Q1,04 | PCWP | |
| 16 | HASH JOIN SEMI | | 3851 | 481K| 112K (1)| 00:06:05 | Q1,04 | PCWP | |
| 17 | PX RECEIVE | | 3771K| 233M| 61175 (1)| 00:03:19 | Q1,04 | PCWP | |
| 18 | PX SEND HASH | :TQ10003 | 3771K| 233M| 61175 (1)| 00:03:19 | Q1,03 | P->P | HASH |
| 19 | PX BLOCK ITERATOR | | 3771K| 233M| 61175 (1)| 00:03:19 | Q1,03 | PCWC | |
| 20 | TABLE ACCESS FULL | PS_CM_DEPLETE | 3771K| 233M| 61175 (1)| 00:03:19 | Q1,03 | PCWP | |
| 21 | BUFFER SORT | | | | | | Q1,04 | PCWC | |
| 22 | PX RECEIVE | | 6058K| 364M| 50906 (1)| 00:02:46 | Q1,04 | PCWP | |
| 23 | PX SEND HASH | :TQ10001 | 6058K| 364M| 50906 (1)| 00:02:46 | | S->P | HASH |
| 24 | INDEX FULL SCAN | PS_CM_DEPLETE_COST | 6058K| 364M| 50906 (1)| 00:02:46 | | | |
| 25 | INDEX UNIQUE SCAN | PS_TRANSACTION_INV | 1 | | 1 (0)| 00:00:01 | Q1,04 | PCWP | |
| 26 | TABLE ACCESS BY INDEX ROWID| PS_TRANSACTION_INV | 1 | 44 | 1 (0)| 00:00:01 | Q1,04 | PCWP | |
…
---------------------------------------------------------------------------------------------------------------------------------------
ASH: Advanced Analysis ©2016 51

Profile by Line and Event
--------------------------------------------------------------------------------------------------
| Id | Operation | Name | Rows | Bytes | Cost (%CPU)| Time |
--------------------------------------------------------------------------------------------------
| 0 | INSERT STATEMENT | | | | 318 (100)| |
| 1 | LOAD TABLE CONVENTIONAL | | | | | |
| 2 | FILTER | | | | | |
| 3 | TABLE ACCESS BY INDEX ROWID| PS_PROJ_RESOURCE | 724 | 337K| 314 (0)| 00:00:04 |
| 4 | INDEX RANGE SCAN | PSEPROJ_RESOURCE | 724 | | 9 (0)| 00:00:01 |
| 5 | INDEX RANGE SCAN | PS_PRJRE_SBF_TMP | 1 | 6 | 4 (0)| 00:00:01 |
--------------------------------------------------------------------------------------------------
ASH
SQL_PLAN_LINE_ID EVENT Secs
---------------- ------------------------------------------ --------
3 db file sequential read 40320
3 read by other session 12280
1 10680
1 db file sequential read 4320
3 2800
db file sequential read 1560
4 db file sequential read 1160
520
4 240
4 read by other session 200
read by other session 80
5 db file sequential read 40
--------
sum 74200
ASH: Advanced Analysis ©2016 52

Adaptive Execution Plan
SELECT sql_full_plan_hash_value, sql_plan_hash_value,
sql_adaptive_plan_resolved
, COUNT(DISTINCT sql_exec_id) execs
, sum(10) db_secs
FROM dba_hist_active_Sess_history
WHERE sql_id = '4dszd9dysry0c'
AND sql_plan_hash_value > 0
GROUP BY dbid, sql_plan_hash_value, sql_full_plan_hash_value,
sql_adaptive_plan_resolved
SQL_FULL_PLAN_HASH_VALUE SQL_PLAN_HASH_VALUE SQL_ADAPTIVE_PLAN_RESOLVED EXECS DB_SECS
------------------------ ------------------- -------------------------- ---------- ----------
4059585501 4114868852 0 0 10
4059585501 4114868852 1 274 3050
4059585501 3412983073 1 387 3980
ASH: Advanced Analysis ©2016 53
One SQL statement,
two plan hash values,
same full plan hash value

Adaptive Execution Plan
select * from table(dbms_xplan.display('ASH_PLAN_TABLE','4dszd9dysry0c',null ,'dbid=2783210685 and
plan_hash_value = 3412983073'));
Plan hash value: 3412983073
---------------------------------------------------------------------------------------------------------
| Id | Operation | Name | Rows | Bytes | Cost (%CPU)| Time |
---------------------------------------------------------------------------------------------------------
| 0 | SELECT STATEMENT | | | | 13 (100)| |
| 1 | SORT ORDER BY | | 9 | 747 | 13 (8)| 00:00:01 |
| 2 | HASH JOIN | | 9 | 747 | 12 (0)| 00:00:01 |
| 3 | JOIN FILTER CREATE | :BF0000 | 9 | 747 | 12 (0)| 00:00:01 |
| 4 | TABLE ACCESS BY INDEX ROWID BATCHED| PGRELS | 9 | 585 | 5 (0)| 00:00:01 |
| 5 | INDEX RANGE SCAN | LINKSOURCE_201 | 9 | | 3 (0)| 00:00:01 |
| 6 | JOIN FILTER USE | :BF0000 | 122 | 2196 | 7 (0)| 00:00:01 |
| 7 | TABLE ACCESS STORAGE FULL | USERGROUPS | 122 | 2196 | 7 (0)| 00:00:01 |
---------------------------------------------------------------------------------------------------------
Note
-----
- this is an adaptive plan
ASH: Advanced Analysis ©2016 54

Adaptive Execution Plan
select * from table(dbms_xplan.display('ASH_PLAN_TABLE','4dszd9dysry0c','+ADAPTIVE' ,'dbid=2783210685 and
plan_hash_value = 3412983073'));
Plan hash value: 3412983073
------------------------------------------------------------------------------------------------------------
| Id | Operation | Name | Rows | Bytes | Cost (%CPU)| Time |
------------------------------------------------------------------------------------------------------------
| 0 | SELECT STATEMENT | | | | 13 (100)| |
| 1 | SORT ORDER BY | | 9 | 747 | 13 (8)| 00:00:01 |
| 2 | HASH JOIN | | 9 | 747 | 12 (0)| 00:00:01 |
| 3 | JOIN FILTER CREATE | :BF0000 | 9 | 747 | 12 (0)| 00:00:01 |
|- 4 | NESTED LOOPS | | 9 | 747 | 12 (0)| 00:00:01 |
|- 5 | NESTED LOOPS | | | | | |
|- 6 | STATISTICS COLLECTOR | | | | | |
| 7 | TABLE ACCESS BY INDEX ROWID BATCHED| PGRELS | 9 | 585 | 5 (0)| 00:00:01 |
| 8 | INDEX RANGE SCAN | LINKSOURCE_201 | 9 | | 3 (0)| 00:00:01 |
|- 9 | INDEX UNIQUE SCAN | SYS_C008784 | | | | |
|- 10 | TABLE ACCESS BY INDEX ROWID | USERGROUPS | 1 | 18 | 7 (0)| 00:00:01 |
| 11 | JOIN FILTER USE | :BF0000 | 122 | 2196 | 7 (0)| 00:00:01 |
| 12 | TABLE ACCESS STORAGE FULL | USERGROUPS | 122 | 2196 | 7 (0)| 00:00:01 |
------------------------------------------------------------------------------------------------------------
Note
-----
- this is an adaptive plan (rows marked '-' are inactive)
ASH: Advanced Analysis ©2016 55

Adaptive Execution Plan
select * from table(dbms_xplan.display('ASH_PLAN_TABLE','4dszd9dysry0c','+ADAPTIVE' ,'dbid=2783210685 and
plan_hash_value = 4114868852'));
Plan hash value: 4114868852
------------------------------------------------------------------------------------------------------------
| Id | Operation | Name | Rows | Bytes | Cost (%CPU)| Time |
------------------------------------------------------------------------------------------------------------
| 0 | SELECT STATEMENT | | | | 13 (100)| |
| 1 | SORT ORDER BY | | 8 | 664 | 13 (8)| 00:00:01 |
|- 2 | HASH JOIN | | 8 | 664 | 12 (0)| 00:00:01 |
| 3 | JOIN FILTER CREATE | :BF0000 | 8 | 664 | 12 (0)| 00:00:01 |
| 4 | NESTED LOOPS | | 8 | 664 | 12 (0)| 00:00:01 |
| 5 | NESTED LOOPS | | | | | |
|- 6 | STATISTICS COLLECTOR | | | | | |
| 7 | TABLE ACCESS BY INDEX ROWID BATCHED| PGRELS | 8 | 520 | 5 (0)| 00:00:01 |
| 8 | INDEX RANGE SCAN | LINKSOURCE_201 | 9 | | 3 (0)| 00:00:01 |
| 9 | INDEX UNIQUE SCAN | SYS_C008784 | | | | |
| 10 | TABLE ACCESS BY INDEX ROWID | USERGROUPS | 1 | 18 | 7 (0)| 00:00:01 |
|- 11 | JOIN FILTER USE | :BF0000 | 122 | 2196 | 7 (0)| 00:00:01 |
|- 12 | TABLE ACCESS STORAGE FULL | USERGROUPS | 122 | 2196 | 7 (0)| 00:00:01 |
------------------------------------------------------------------------------------------------------------
Note
-----
- this is an adaptive plan (rows marked '-' are inactive)
ASH: Advanced Analysis ©2016 56

Profiling Adaptive Plans
select sql_plan_hash_value
, sql_full_plan_hash_value
, sql_plan_line_id
, sql_adaptive_plan_resolved
, sum(10) db_secs
from dba_hist_active_Sess_history
where sql_id = '4dszd9dysry0c'
group by
sql_plan_hash_value
, sql_full_plan_hash_value
, sql_plan_line_id
, sql_adaptive_plan_resolved
order by 1,2,4
/
ASH: Advanced Analysis ©2016 57

Profiling Adaptive Plans
SQL_PLAN_HASH_VALUE SQL_FULL_PLAN_HASH_VALUE SQL_PLAN_LINE_ID SQL_ADAPTIVE_PLAN_RESOLVED DB_SECS
------------------- ------------------------ ---------------- -------------------------- ----------
3412983073 4059585501 1 1 60
3412983073 4059585501 2 1 1540
3412983073 4059585501 3 1 80
3412983073 4059585501 7 1 50
3412983073 4059585501 8 1 50
3412983073 4059585501 12 1 750
3412983073 4059585501 1 560
4114868852 4059585501 0 10
4114868852 4059585501 1 1 230
4114868852 4059585501 2 1 20
4114868852 4059585501 3 1 200
4114868852 4059585501 4 1 40
4114868852 4059585501 7 1 140
4114868852 4059585501 8 1 150
4114868852 4059585501 9 1 70
4114868852 4059585501 10 1 800
4114868852 4059585501 1 1180
ASH: Advanced Analysis ©2016 58
SQL Plan Line IDs
correspond to
+ADAPTIVE plan

ASH: Advanced Analysis ©2016 59
Bind Variables
• Developers Should Use Them!
• Unfortunately…

ASH: Advanced Analysis ©2016 60
Different SQL, Same Plan
P.I. SQL_ID SQL_PLAN_HASH_VALUE EXEC_SECS ASH_SECS
-------- ------------- ------------------- ---------- ----------
1949129 0uj7k70z1s76y 2239378934 619 210
1949819 0sd03jvun7us6 2239378934 336 20
1953197 22kn2sb7vttnp 2239378934 753 150
1956338 0xkjtywub2861 2602481067 19283 18550
1956338 998wf4g84dk8z 1041940423 19283 10
1956805 7c7dzavm70yku 2602481067 16350 15690
1956925 1knvx57dnrz29 2602481067 15654 15010
1956925 a9mw8hjxfwczm 338220129 15654 10
1957008 9s2jct0jfmwgy 2602481067 15077 14430
1957008 9s2jct0jfmwgy 3265949623 15077 10
1957087 cwarnq7kv4d84 2602481067 14638 14000
1957691 9nv93p134xjb0 2602481067 13477 12980
1958659 9s2jct0jfmwgy 2602481067 9354 9140
1958697 1bd0fg0fvsfyp 2602481067 9176 8950

ASH: Advanced Analysis ©2016 61
Non-Shareable SQL
SQL_ID djqf1zcypm5fm
--------------------
SELECT ...
FROM PS_TL_EXCEPTION A,
PS_PERSONAL_DATA B,
PS_PERALL_SEC_QRY B1,
…
WHERE B.EMPLID = B1.EMPLID
AND B1.OPRID = '12345678'
…
ASH: Advanced Analysis ©2016 62
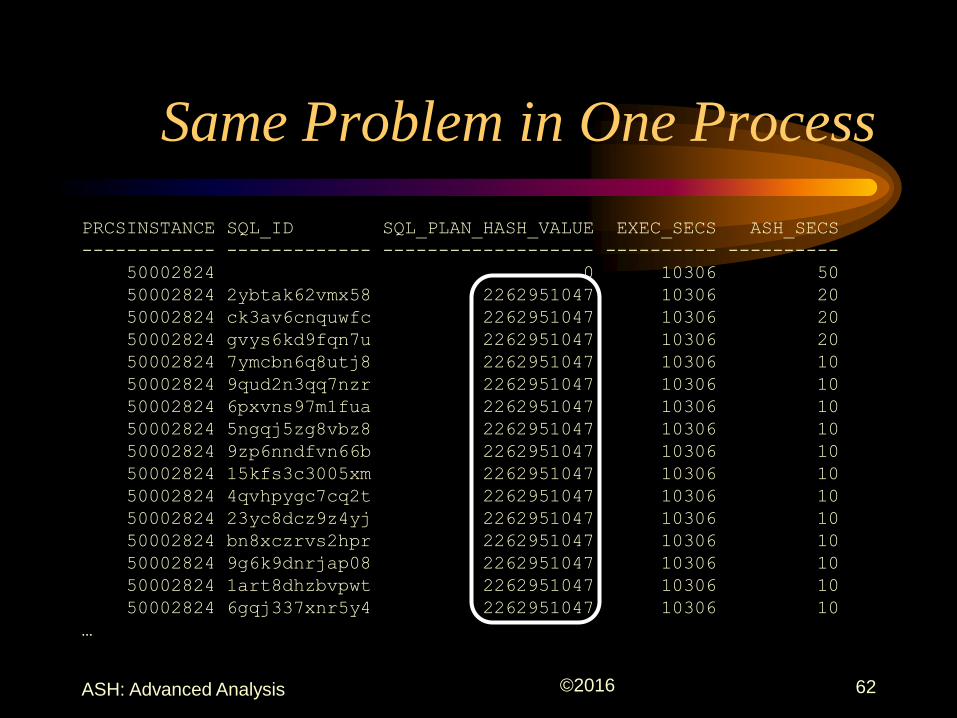
Same Problem in One Process
PRCSINSTANCE SQL_ID SQL_PLAN_HASH_VALUE EXEC_SECS ASH_SECS
------------ ------------- ------------------- ---------- ----------
50002824 0 10306 50
50002824 2ybtak62vmx58 2262951047 10306 20
50002824 ck3av6cnquwfc 2262951047 10306 20
50002824 gvys6kd9fqn7u 2262951047 10306 20
50002824 7ymcbn6q8utj8 2262951047 10306 10
50002824 9qud2n3qq7nzr 2262951047 10306 10
50002824 6pxvns97m1fua 2262951047 10306 10
50002824 5ngqj5zg8vbz8 2262951047 10306 10
50002824 9zp6nndfvn66b 2262951047 10306 10
50002824 15kfs3c3005xm 2262951047 10306 10
50002824 4qvhpygc7cq2t 2262951047 10306 10
50002824 23yc8dcz9z4yj 2262951047 10306 10
50002824 bn8xczrvs2hpr 2262951047 10306 10
50002824 9g6k9dnrjap08 2262951047 10306 10
50002824 1art8dhzbvpwt 2262951047 10306 10
50002824 6gqj337xnr5y4 2262951047 10306 10
…

ASH: Advanced Analysis ©2016 63
Aggregate by
SQL_PLAN_HASH_VALUE
PRCSINSTANCE SQL_PLAN_HASH_VALUE EXEC_SECS ASH_SECS
------------ ------------------- ---------- ----------
50002824 2262951047 10306 2300
50002824 0 10306 60
50002824 3085938243 10306 20
50002824 563410926 10306 10
50002824 1068931976 10306 10

ASH: Advanced Analysis ©2016 64
Can you find the SQL in AWR?
• Now Find the SQL with that plan.
• If it was captured by AWR
– Lots of parsing causes statements to be aged out
of library cache before they get stored in AWR
by a snapshot
– Only Top-n statements are captured.

ASH: Advanced Analysis ©2016 65
Can you find the SQL in AWR?
• Outer Join SQLTEXT
SELECT h.sql_id, h.sql_plan_hash_value
, SUM(10) ash_secs
, 10*COUNT(t.sql_id) awr_secs
FROM dba_hist_snapshot X
, dba_hist_active_sess_history h
LEFT OUTER JOIN dba_hist_sqltext t
ON t.sql_id = h.sql_id
WHERE …
GROUP BY h.sql_id, h.sql_plan_hash_value

ASH: Advanced Analysis ©2016 66
Can you find the SQL in AWR?
SELECT * FROM (
SELECT ROW_NUMBER() OVER (PARTITION BY x.sql_plan_hash_value
ORDER BY x.awr_secs desc) ranking
,x.sql_id, x.sql_plan_hash_value
,SUM(x.ash_secs) OVER (PARTITION BY x.sql_plan_hash_value) ash
,SUM(x.awr_secs) OVER (PARTITION BY x.sql_plan_hash_value) awr
,COUNT(DISTINCT sql_id) OVER
(PARTITION BY x.sql_plan_hash_value) sql_ids
FROM ( SELECT h.sql_id, h.sql_plan_hash_value
, SUM(10) ash_secs
, 10*COUNT(t.sql_id) awr_secs
FROM dba_hist_snapshot X
, dba_hist_active_sess_history h
LEFT OUTER JOIN dba_hist_sqltext t ON t.sql_id = h.sql_id
WHERE …
GROUP BY h.sql_id, h.sql_plan_hash_value ) x ) y
WHERE y.ranking = 1
ORDER BY tot_ash_secs desc, ranking

ASH: Advanced Analysis ©2016 67
Can you find the SQL in AWR?
SQL_PLAN TOTAL TOTAL
RNK SQL_ID HASH_VALUE ASH_SECS AWR_SECS SQL_IDS
--- ------------- ---------- -------- -------- -------
1 8mkvraydrxycn 0 38270 480 741
1 027qsfj7n71cy 1499159071 4230 4230 12
1 cxwz9m3auk4y7 1898065720 4190 4190 1983
1 9513hhu1vucxz 2044891559 3590 3590 1
1 95dx0mkjq38v5 1043916244 3450 3450 23
1. Special case. There is no plan because it’s the dbms_statsfunction. There were 74 statements, but in reality they were all totally different
2. One SQL, one plan, this is a shareable SQL_ID, or it did just execute once.
3. This is many statements with the same plan, at least 198.

ASH: Advanced Analysis ©2016 68
ASH for Single Wait Event
SELECT /*+LEADING(x h) USE_NL(h)*/
h.sql_id
, h.sql_plan_hash_value
, SUM(10) ash_secs
FROM dba_hist_snapshot x
, dba_hist_active_sess_history h
WHERE x.end_interval_time <=TO_DATE('201402010830','yyyymmddhh24mi')
AND x.begin_interval_time >=TO_DATE('201402010730','yyyymmddhh24mi')
AND h.sample_time BETWEEN TO_DATE('201401261100','yyyymmddhh24mi')
AND TO_DATE('201401261300','yyyymmddhh24mi')
AND h.SNAP_id = X.SNAP_id
AND h.dbid = x.dbid
AND h.instance_number = x.instance_number
AND h.event = 'db file sequential read'
GROUP BY h.sql_id, h.sql_plan_hash_value
ORDER BY ash_secs desc
/

ASH: Advanced Analysis ©2016 69
Statements with Highest I/O
SQL Plan
SQL_ID Hash Value ASH_SECS
------------- ---------- ----------
90pp7bcnmz68r 2961772154 2490
81gz2rtabaa8n 1919624473 2450
7hvaxp65s70qw 1051046890 1320
7fk8raq16ch0u 3950826368 890
9dzpwkff7zycg 2020614776 840
…

ASH: Advanced Analysis ©2016 70
What Kind of Single Block Read?
• For I/O wait events ASH reports
– File number
– Block number
– Object number
– Row number (from 11g)
• Only valid on DB File events.
– Invalid on other events because simply not
cleared from previous operation.

ASH: Advanced Analysis ©2016 71
Categorise Tablespaces/Data Files
CREATE TABLE dmk_data_files as
SELECT tablespace_name
, file_id
, CASE
WHEN f.tablespace_name LIKE 'SYS%' THEN 'SYSTEM'
WHEN f.tablespace_name LIKE 'UNDO%' THEN 'UNDO'
WHEN f.tablespace_name LIKE '%IDX%' THEN 'INDEX'
WHEN f.tablespace_name LIKE '%INDEX%' THEN 'INDEX'
ELSE 'TABLE'
END AS tablespace_type
FROM dba_data_files f
ORDER BY tablespace_name
/
• Working storage table performs better than DBA_DATA_FILES

ASH: Advanced Analysis ©2016 72
ASH Data by Tablespace Type
SELECT /*+LEADING(x h) USE_NL(h f)*/
f.tablespace_type
, SUM(10) ash_secs
FROM dba_hist_snapshot x
, dba_hist_active_sess_history h
, dmk_data_files f
WHERE x.end_interval_time <=TO_DATE('201402161300','yyyymmddhh24mi')
AND x.begin_interval_time
>=TO_DATE('201402161100','yyyymmddhh24mi')
AND h.sample_time BETWEEN TO_DATE('201401261100','yyyymmddhh24mi')
AND TO_DATE('201401261300','yyyymmddhh24mi')
AND h.SNAP_id = X.SNAP_id
AND h.dbid = x.dbid
AND h.instance_number = x.instance_number
AND h.event LIKE 'db file%'
AND h.p1text = 'file#'
AND h.p2text = 'block#'
AND f.file_id = h.p1
GROUP BY f.tablespace_type
ORDER BY ash_secs desc
/

ASH: Advanced Analysis ©2016 73
ASH Data by Tablespace Type
TABLES ASH_SECS
------ ----------
INDEX 30860
TABLE 26970
UNDO 1370
SYSTEM 490
• Most time spent on
index read
– Includes index
maintenance during
DML
• Not much undo, so not
much consistent read.

ASH: Advanced Analysis ©2016 74
Which Tables Account for the I/O?
• Need own copy of DBA_OBJECTS
CREATE TABLE dmk_objects
(object_id NUMBER NOT NULL
,owner VARCHAR2(30) NOT NULL
,object_name VARCHAR2(128) NOT NULL
,subobject_name VARCHAR2(30)
,PRIMARY KEY (OBJECT_ID))
/
INSERT INTO dmk_objects
SELECT object_id, owner, object_name, subobject_name
FROM dba_objects
WHERE object_type LIKE 'TABLE%'
UNION ALL
SELECT o.object_id, i.table_owner, i.table_name, o.subobject_name
FROM dba_objects o, dba_indexes i
WHERE o.object_type like 'INDEX%'
AND i.owner = o.owner
AND i.index_name = o.object_name
/

ASH: Advanced Analysis ©2016 75
Which Objects are Used?
SELECT /*+LEADING(x h) USE_NL(h)*/
o.owner, o.object_name
, SUM(10) ash_secs
FROM dba_hist_snapshot x
, dba_hist_active_sess_history h
, dmk_objects o
WHERE x.end_interval_time >= SYSDATE-7
AND x.begin_interval_time <= SYSDATE
AND h.sample_time >= SYSDATE-7
AND h.sample_time <= SYSDATE
AND h.Snap_id = X.snap_id
AND h.dbid = x.dbid
AND h.instance_number = x.instance_number
AND h.event LIKE 'db file%'
AND h.current_obj# = o.object_id
GROUP BY o.owner, o.object_name
HAVING SUM(10) >= 3600
ORDER BY ash_secs DESC

ASH: Advanced Analysis ©2016 76
Which Objects are Used?
ASH
OWNER OBJECT_NAME Secs
-------- -------------------- -------
SYSADM PS_TL_RPTD_TIME 800510
SYSADM PS_TL_PAYABLE_TIME 327280
SYSADM PS_GP_RSLT_ACUM 287870
SYSADM PS_SCH_DEFN_DTL 161690
SYSADM PS_SCH_DEFN_TBL 128070
SYSADM PS_GP_RSLT_PIN 124560
SYSADM PS_GP_PYE_PRC_STAT 92410
SYSADM PS_SCH_ADHOC_DTL 88810
…

ASH: Advanced Analysis ©2016 77
Which Processes Read This Table?
SELECT /*+LEADING(x) USE_NL(h)*/
o.owner, o.object_name
, h.module
, SUM(10) ash_secs
FROM dba_hist_snapshot x
, dba_hist_active_sess_history h
, dmk_objects o
WHERE x.end_interval_time >= SYSDATE-7
AND x.begin_interval_time <= SYSDATE
AND h.sample_time >= SYSDATE-7
AND h.sample_time <= SYSDATE
AND h.Snap_id = X.snap_id
AND h.dbid = x.dbid
AND h.instance_number = x.instance_number
AND h.event LIKE 'db file%'
AND h.current_obj# = o.object_id
AND o.object_name = 'PS_GP_RSLT_ACUM'
GROUP BY o.owner, o.object_name
, h.module
HAVING SUM(10) >= 900
ORDER BY ash_secs desc

ASH: Advanced Analysis ©2016 78
Which Processes Read This Table?
ASH
OWNER OBJECT_NAME MODULE Secs
-------- -------------------- ---------------- -------
SYSADM PS_GP_RSLT_ACUM XXX_HOL_MGMT 79680
SYSADM PS_GP_RSLT_ACUM DBMS_SCHEDULER 37810
SYSADM PS_GP_RSLT_ACUM SQL*Plus 37060
SYSADM PS_GP_RSLT_ACUM GPGBHLE 30710
SYSADM PS_GP_RSLT_ACUM GPPDPRUN 27440
SYSADM PS_GP_RSLT_ACUM XXX_AE_AB007 21440
SYSADM PS_GP_RSLT_ACUM SQL Developer 11210
SYSADM PS_GP_RSLT_ACUM GPGBEPTD 7240
SYSADM PS_GP_RSLT_ACUM XXX_CAPITA 5850
SYSADM PS_GP_RSLT_ACUM GPGB_PSLIP_X 5030
SYSADM PS_GP_RSLT_ACUM GPGB_EDI 4880
Statistics Gathering
People are writing ad-
hoc queries in SQL*Plus
Top Application Process

Who is using this index?
• CURRENT_OBJ# has been suggested as a
way to identify index usage.
– It only identifies index physical read
– So it also includes index maintenance during
DML
– Doesn’t work if the object has been rebuilt and
has a new object number
ASH: Advanced Analysis ©2016 79

SQL Plans captured by AWR
• SQL statements and plans captured during AWR snapshot
– Top N by Elapsed Time, CPU Time, Parse Calls, Shareable Memory, Version Count
• DBA_HIST_SQL_PLAN
– OBJECT_OWNER
– OBJECT_TYPE
– OBJECT_NAME
ASH: Advanced Analysis ©2016 80

Who is using this index?
• Join plans that reference index to ASH data
by SQL_PLAN_HASH_VALUE
– Do not join by SQL_ID
• Filter out
– SQL*Plus, Toad, Ad-Hoc query tools
– Statistics collection
ASH: Advanced Analysis ©2016 81

Extract ASH for statements that use
specified indexes
CREATE TABLE my_ash COMPRESS AS
WITH p AS (
SELECT DISTINCT p.plan_hash_value, p.object#
, p.object_owner, p.object_type, p.object_name
FROM dba_hist_sql_plan p
WHERE p.object_name like 'PS_PROJ_RESOURCE'
AND p.object_type LIKE 'INDEX%'
AND p.object_owner = 'SYSADM')
SELECT p.object# object_id
, p.object_owner, p.object_type, p.object_name
, h.*
FROM dba_hist_active_sess_history h
, p
WHERE h.sql_plan_hash_value = p.plan_hash_value
ASH: Advanced Analysis ©2016 82

Profile the ASH extracted
WITH h AS (
SELECT object_name
, CASE WHEN h.module IS NULL THEN REGEXP_SUBSTR(h.program,'[^.@]+',1,1)
WHEN h.module LIKE 'PSAE.%' THEN REGEXP_SUBSTR(h.module,'[^.]+',1,2)
ELSE REGEXP_SUBSTR(h.program,'[^.@]+',1,1)
END as module
, CASE WHEN h.action LIKE 'PI=%' THEN NULL
ELSE h.action
END as action
, CAST(sample_time AS DATE) sample_time
, sql_id, sql_plan_hash_value, sql_exec_id
FROM my_ash h
)
SELECT object_name, module, action
, sum(10) ash_secs
, COUNT(DISTINCT sql_plan_hash_value) sql_plans
, COUNT(DISTINCT sql_id||sql_plan_hash_value||sql_exec_id) sql_execs
, MAX(sample_time) max_sample_time
FROM h
WHERE NOT lower(module) IN('oracle','toad','sqlplus','sqlplusw')
AND NOT lower(module) LIKE 'sql%'
GROUP BY object_name, module, action
ORDER BY SUBSTR(object_name,4), object_name, ash_secs desc
ASH: Advanced Analysis ©2016 83

Profile the ASH extracted
ASH SQL SQL Last
OBJECT_NAME MODULE ACTION Secs Plans Execs Sample
------------------ -------------------- -------------------------------- ------- ----- ------ -------------------
…
PSMPROJ_RESOURCE PC_TL_TO_PC GF_PBINT_AE.XxBiEDM.Step07.S 60 2 6 18:35:18 20/08/2014
****************** -------
sum 60
PSNPROJ_RESOURCE PC_TL_TO_PC GF_PBINT_AE.CallmeA.Step26.S 6720 1 49 18:53:58 26/08/2014
PC_TL_TO_PC GF_PBINT_AE.CallmeA.Step30.S 3460 1 60 06:33:27 27/08/2014
GF_OA_CMSN GF_OA_CMSN.01INIT.Step01.S 2660 1 47 19:19:40 26/08/2014
PC_TL_TO_PC GF_PBINT_AE.CallmeA.Step06.S 1800 1 52 18:53:28 26/08/2014
PC_TL_TO_PC GF_PBINT_AE.CallmeG.Step01.S 1740 1 61 06:34:17 27/08/2014
PC_TL_TO_PC GF_PBINT_AE.CallmeA.Step02.S 1680 1 24 18:53:18 26/08/2014
PC_TL_TO_PC GF_PBINT_AE.CallmeA.Step10.S 1460 1 33 17:26:26 22/08/2014
PC_TL_TO_PC GF_PBINT_AE.CallmeA.Step08.S 920 1 26 17:26:16 22/08/2014
PC_TL_TO_PC GF_PBINT_AE.CallmeA.Step36.S 460 1 18 18:26:38 20/08/2014
PC_TL_TO_PC GF_PBINT_AE.CallmeA.Step09.S 420 1 16 06:33:07 27/08/2014
PC_PRICING GF_PBINT_AE.CallmeG.Step01.S 200 1 10 08:09:55 22/08/2014
PC_AP_TO_PC GF_PBINT_AE.CallmeH.Step00A.S 170 1 17 21:53:26 21/08/2014
PC_PRICING GF_PBINT_AE.CallmeA.Step36.S 20 1 1 08:02:46 05/08/2014
PC_PRICING GF_PBINT_AE.CallmeA.Step30.S 20 1 1 13:42:48 04/08/2014
PC_PRICING GF_PBINT_AE.CallmeA.Step06.S 20 1 1 15:58:35 28/07/2014
PC_TL_TO_PC GF_PBINT_AE.CallmeA.Pseudo.S 20 1 1 19:45:11 06/08/2014
****************** -------
sum 21770
…
ASH: Advanced Analysis ©2016 84
This index used widely. Probably
can’t drop it.
This index used lightly. Perhaps
we don’t really need it.
Indexes that do not appear are
probably not used.

Limitations of Method
• AWR doesn’t capture all SQLs– A very effective index that is only used
occasionally might not be captured.
– Results are only indicative, not absolute.
• ASH data purged after 31 days (by default)– An index only be used for annual process might not
be detected, but it might be essential for that process
– Consider establishing longer term repository, retaining perhaps 400 days.
• EM 12c Rel4 AWR Warehouse
ASH: Advanced Analysis ©2016 85

Before I can drop an index…
• Need to look at SQL found to reference it.
• Might prefer to make index invisible and
drop later if no issue.
ASH: Advanced Analysis ©2016 86

ASH: Advanced Analysis ©2016 87
AWR Data indicates locking
AWR Wait Event History
0
1000
2000
3000
4000
5000
6000
7000
8000
9000
10000
Tue 26.1.10 00:00 Tue 26.1.10 06:00 Tue 26.1.10 12:00 Tue 26.1.10 18:00
Snapshot End Time
Tim
e W
ait
ed
(s
)
enq: TX - row lock contention - Application
Database Name MHRPRD1A Instance Number 1 Host Name phror03
Time Waited
Snapshot Start Time
Event Name
Wait Class

ASH: Advanced Analysis ©2016 88
Where did we wait on a lock?
SELECT /*+LEADING(x h) USE_NL(h)*/
h.sql_id
, h.sql_plan_hash_value
, SUM(10) ash_secs
FROM dba_hist_snapshot x
, dba_hist_active_sess_history h
WHERE x.end_interval_time >=TO_DATE('201401261100','yyyymmddhh24mi')
AND x.begin_interval_time <=
TO_DATE('201401261300','yyyymmddhh24mi')
AND h.sample_time BETWEEN TO_DATE('201401261100','yyyymmddhh24mi')
AND TO_DATE('201401261300','yyyymmddhh24mi')
AND h.snap_id = x.snap_id
AND h.dbid = x.dbid
AND h.instance_number = x.instance_number
AND h.event = 'enq: TX - row lock contention'
GROUP BY h.sql_id, h.sql_plan_hash_value
ORDER BY ash_secs desc
/

ASH: Advanced Analysis ©2016 89
Where did we wait on a lock?
SQL Plan
SQL_ID Hash Value ASH_SECS
------------- ---------- ----------
7qxdrwcn4yzhh 3723363341 26030
652mx4tffq415 1888029394 11230
c9jjtvk0qf649 3605988889 6090
artqgxug4z0f1 8450529 240
gtj7zuzy2b4g6 2565837323 100

ASH: Advanced Analysis ©2016 90
Statements Blocked by TX Locks
SQL_ID 7qxdrwcn4yzhh
--------------------
UPDATE PSIBQUEUEINST SET QUEUESEQID=QUEUESEQID+:1
WHERE QUEUENAME=:2
SQL_ID 652mx4tffq415
--------------------
UPDATE PSAPMSGPUBSYNC SET LASTUPDDTTM=SYSDATE
WHERE QUEUENAME=:1
SQL_ID c9jjtvk0qf649
--------------------
UPDATE PSAPMSGSUBCSYNC SET LASTUPDDTTM=SYSDATE
WHERE QUEUENAME=:1

ASH: Advanced Analysis ©2016 91
The real question about locking:
• What is the session that is holding the lock doing while it is holding the lock?
– and can I do something about that?
• Home-made sequences are not scalable. Should really be using an Oracle Sequence.
– Not possible in a PeopleSoft Application

ASH: Advanced Analysis ©2016 92
Resolve the Lock Chain
• Navigating the lock
chain works across
RAC instances from
11g.
• There may not be any
ASH data for session
C because it is not
active on the database.
Session ASESSION_ID
SESSION_SERIAL#
BLOCKING_SESSION
BLOCKING_SESSION_SERIAL#
Session CSESSION_ID
SESSION_SERIAL#
Session BSESSION_ID
SESSION_SERIAL#
BLOCKING_SESSION
BLOCKING_SESSION_SERIAL#

ASH: Advanced Analysis ©2016 93
Extract ASH data for period in
question
CREATE TABLE my_ash AS
SELECT /*+LEADING(x) USE_NL(h)*/ h.*
FROM dba_hist_snapshot x
, dba_hist_active_sess_history h
WHERE x.end_interval_time >=
TO_DATE('201401261100','yyyymmddhh24mi')
AND x.begin_interval_time <=
TO_DATE('201401261300','yyyymmddhh24mi')
AND h.sample_time BETWEEN TO_DATE('201401261100','yyyymmddhh24mi')
AND TO_DATE('201401261300','yyyymmddhh24mi')
AND h.snap_id = X.snap_id
AND h.dbid = x.dbid
AND h.instance_number = x.instance_number;
CREATE UNIQUE INDEX my_ash ON my_ash (dbid, instance_number, snap_id, sample_id, session_id, sample_time, session_serial#) COMPRESS 4;
CREATE INDEX my_ash2 ON my_ash (event, dbid, instance_number, snap_id) COMPRESS 3;

ASH: Advanced Analysis ©2016 94
What are the blockers doing?
(on a single instance database)
SELECT /*+LEADING(x w) USE_NL(h w)*/
h.sql_id
, h.sql_plan_hash_value
, SUM(10) ash_secs
FROM my_ash w
LEFT OUTER JOIN my_ash h
ON h.snap_id = w.snap_id
AND h.dbid = w.dbid
AND h.instance_number = w.instance_number
AND h.sample_id = w.sample_id
AND h.sample_time = w.sample_time
AND h.session_id = w.blocking_session
AND h.session_serial# = w.blocking_session_serial#
WHERE w.event = 'enq: TX - row lock contention'
GROUP BY h.sql_id, h.sql_plan_hash_value
ORDER BY ash_secs desc
/

ASH: Advanced Analysis ©2016 95
What are the blockers doing?
(works on RAC)
WITH h AS (
SELECT /*+LEADING(x w) USE_NL(h w)*/
CASE WHEN h.dbid IS NULL THEN 'idle holder'
WHEN h.event IS NULL THEN 'CPU + CPU wait'
ELSE h.event END as event
, h.module, h.sql_id, h.sql_plan_hash_value
FROM my_ash w
LEFT OUTER JOIN my_ash h
ON h.snap_id = w.snap_id
AND h.dbid = w.dbid
AND h.session_id = w.blocking_session
AND h.session_serial# = w.blocking_session_serial#
AND h.instance_number = w.blocking_inst_id
AND (h.sample_id = w.sample_id OR w.blocking_inst_id != w.instance_number)
AND h.sample_time >= w.sample_time-5/86400
AND h.sample_time < w.sample_time+5/86400
WHERE w.blocking_Session_status = 'VALID')
SELECT h.event, h.module, h.sql_id, h.sql_plan_hash_value, SUM(10) ash_secs
FROM h
GROUP BY h.event, h.module,
h.sql_id, h.sql_plan_hash_value
ORDER BY ash_secs DESC

ASH: Advanced Analysis ©2016 96
What are the blocking sessions
doing?
SQL_ID SQL_PLAN_HASH_VALUE ASH_SECS
------------- ------------------- ----------
292101
5st32un4a2y92 2494504609 106702
652mx4tffq415 1888029394 7030
artqgxug4z0f1 8450529 580
7qxdrwcn4yzhh 3723363341 270
1. This SQL_ID is blank. May not be able to find ASH sample for blocking session because it is idle – busy on the client not the database.
2. This statement is running while the session holds a lock that is blocking another session.

ASH: Advanced Analysis ©2016 97
Execution Plan captured by AWR:
Correct Plan, Old Costs, Old Binds
• DISPLAY_AWR()SQL_ID 5st32un4a2y92
--------------------
SELECT 'X' FROM PS_CDM_LIST WHERE CONTENTID = :1
Plan hash value: 2494504609
------------------------------------------------------------------------------------
| Id | Operation | Name | Rows | Bytes | Cost (%CPU)| Time |
------------------------------------------------------------------------------------
| 0 | SELECT STATEMENT | | | | 22 (100)| |
| 1 | INDEX FAST FULL SCAN| PS_CDM_LIST | 1 | 5 | 22 (10)| 00:00:01 |
------------------------------------------------------------------------------------
Query Block Name / Object Alias (identified by operation id):
-------------------------------------------------------------
1 - SEL$1 / PS_CDM_LIST@SEL$1
Peeked Binds (identified by position):
--------------------------------------
1 - :1 (NUMBER): 17776

ASH: Advanced Analysis ©2016 98
Fresh Execution Plan generated by
execute explain plan
• Note increase of cost of full scan.
Plan hash value: 2494504609
------------------------------------------------------------------------------------
| Id | Operation | Name | Rows | Bytes | Cost (%CPU)| Time |
------------------------------------------------------------------------------------
| 0 | SELECT STATEMENT | | 1 | 6 | 3178 (9)| 00:00:05 |
|* 1 | INDEX FAST FULL SCAN| PS_CDM_LIST | 1 | 6 | 3178 (9)| 00:00:05 |
------------------------------------------------------------------------------------
Predicate Information (identified by operation id):
---------------------------------------------------
1 - filter("CONTENTID"=TO_NUMBER(:1))

ASH: Advanced Analysis ©2016 100
Did My Execution Plan Change?
• Can see change in execution plan and performance– (same SQL, different literals, same force matching
signature)
SQL_PLAN
PRCSINSTANCE BEGINDTTM SQL_ID HASH_VALUE EXEC_SECS ASH_SECS
------------ ------------------- ------------- ---------- --------- ---------
1964975 08:30:52 22/01/2010 46smbgcfcrb8d 2602481067 20379 20080
1965250 09:08:51 22/01/2010 fpftdx2405zyq 2602481067 20983 20690
1968443 16:42:51 22/01/2010 3rxad5z3ccusv 3398716340 105 80
1968469 16:47:21 22/01/2010 3rxad5z3ccusv 3398716340 90 70
1968485 16:50:19 22/01/2010 3rxad5z3ccusv 3398716340 62 40
1968698 17:40:01 22/01/2010 0ku8f514k3nt0 3398716340 76 50
1968866 18:19:19 22/01/2010 cbmyvpsxzyf5n 3398716340 139 120
1968966 18:34:24 22/01/2010 5jb1sgmjc7436 3398716340 187 170

Temporary Tablespace Usage
SELECT /*+leading(r x h) use_nl(h)*/
h.sql_id
, h.sql_plan_hash_value
, COUNT(DISTINCT sql_exec_id) num_execs
, SUM(10) ash_secs
, 10*COUNT(DISTINCT sample_id) elap_secs
, ROUND(MAX(temp_space_allocated)/1024/1024,0) tempMb
, COUNT(distinct r.prcsinstance) PIs
FROM dba_hist_snapshot x
, dba_hist_active_sess_history h
, sysadm.psprcsrqst r
WHERE …
ORDER BY ash_secs DESC
ASH: Advanced Analysis ©2016 101

Temporary Tablespace Usage
• Can see temporary usage of individual SQL statements
SQL_ID SQL_PLAN_HASH_VALUE NUM_EXECS ASH_SECS ELAP_SECS TEMPMB PIS
------------- ------------------- ---------- ---------- ---------- ---------- ----------
a47fb0x1b23jn 483167840 3 6280 910 132 3
cbw2bztjyztnq 544286790 4 5920 390 4
fcrxxp8f0c8cg 2119221636 2 4480 280 2
8h7ga9g761naj 4127129594 1 3980 3980 1
8cypfzadbub4k 4127129594 1 3450 3450 1
3gz46jhw7b5x8 3643021188 8 3190 200 4
a47fb0x1b23jn 3805993318 1 2610 1120 132 1
dxqkbuynhqk09 2119221636 1 2240 140 1
c75jcr5s71s2h 2119221636 1 2240 140 1
ASH: Advanced Analysis ©2016 102

ASH: Advanced Analysis ©2016 103
Effect of Plan Stability
• Three scenarios
1. Large payroll – collecting profiles
2. Small payroll – no profiles
3. Small payroll – with profiles applied

ASH: Advanced Analysis ©2016 104
Effect of Plan Stability
SELECT /*+ LEADING(@q1 r1@q1 x1@q1 h1@q1) USE_NL(h1@q1)
LEADING(@q2 r2@q2 x2@q2 h2@q2) USE_NL(h2@q2)
LEADING(@q3 r3@q3 x3@q3 h3@q3) USE_NL(h3@q3) */
q1.sql_id
, q1.sql_plan_hash_value, q1.ash_secs
, DECODE(q1.sql_plan_hash_value,q2.sql_plan_hash_value,'**SAME**',
q2.sql_plan_hash_value) sql_plan_hash_value2, q2.ash_secs
, DECODE(q1.sql_plan_hash_value,q3.sql_plan_hash_value,'**SAME**',
q3.sql_plan_hash_value) sql_plan_hash_value3, q3.ash_secs
FROM (
...
) Q1
LEFT OUTER JOIN (
...
) Q2 ON q1.sql_id = q2.sql_id
INNER JOIN (
...
) Q3 ON q1.sql_id = q3.sql_id
ORDER BY q3.ash_secs desc, q1.sql_id
/
Usual Query in
each of three
in-line views

ASH: Advanced Analysis ©2016 105
Effect of Plan Stability
SQL_ID SCENARIO 1 ASH_SECS SCENARIO 2 ASH_SECS SCENARIO 3 ASH_SECS
------------- ---------- -------- ---------- -------- ---------- --------
4uzmzh74rdrnz 2514155560 280 3829487612 >28750 **SAME** 50231
4n482cm7r9qyn 1595742310 680 869376931 140 **SAME** 8892
2f66y2u54ru1v 1145975676 630 **SAME** 531
1n2dfvb3jrn2m 1293172177 150 **SAME** 150
652y9682bqqvp 3325291917 30 **SAME** 110
d8gxmqp2zydta 1716202706 10 678016679 10 **SAME** 32
2np47twhd5nga 3496258537 10 **SAME** 27
4ru0618dswz3y 2621940820 10 539127764 223
4ru0618dswz3y 539127764 100 **SAME** 22
4ru0618dswz3y 3325291917 10 539127764 22
4ru0618dswz3y 1403673054 110 539127764 22
gnnu2hfkjm2yd 1559321680 80 **SAME** 19
1. Better with profile, but not great, but it did run
2. A little worse
3. 4 execution plans, now just 1, much better.

ASH: Advanced Analysis ©2016 110
How Many Executions (from 11g)
SELECT /*+LEADING(x h) USE_NL(h)*/ h.program
, h.sql_id, h.sql_plan_hash_value
, SUM(10) ash_secs
, COUNT(DISTINCT h.sql_exec_id) execs
, COUNT(DISTINCT xid) XIDs
FROM DBA_HIST_SNAPSHOT x
, DBA_HIST_ACTIVE_SESS_HISTORY h
WHERE X.END_INTERVAL_TIME >= …
AND x.begin_interval_time <= …
AND h.sample_TIME >= …
AND h.sample_time <= …
AND h.SNAP_id = X.SNAP_id
AND h.dbid = x.dbid
AND h.instance_number = x.instance_number
GROUP BY h.program, h.sql_id, h.sql_plan_hash_value
ORDER BY ash_secs desc
/

ASH: Advanced Analysis ©2016 111
How Many Executions?
SQL Plan ASH
PROGRAM SQL_ID Hash Value Secs EXECS XIDS USERS
----------- ------------- ---------- ------ ------- ----- ------
t_async.exe 7q90ra0vmd9xx 2723153562 3020 297 0 20
t_async.exe 6mw25bgbh1stj 1229059401 320 32 0 17
…
• Samples ≈ Executions
– Based on DBA_HIST_ACTIVE_SESS_HISTORY
– 1 sample / 10 seconds.
– Each sample is worth 10 seconds.
– Probably underestimates number of executions.

SQL_ID –v-
TOP_LEVEL_SQL_ID
SELECT /*+leading(r q x h) use_nl(h)*/
NULLIF(h.top_level_sql_id, h.sql_id) top_level_sql_id
, h.sql_id
...
FROM dba_hist_snapshot x
, dba_hist_active_sess_history h
...
ASH: Advanced Analysis ©2016 113

SQL_ID –v-
TOP_LEVEL_SQL_ID
TOP_LEVEL_SQL SQL_ID Hash Value SQL_IDS PLAN_EXECS PLAN_ASH_SECS
------------- ------------- ---------- ---------- ---------- -------------
0 0 0 210
6np8gdbrmj8s4 2609910643 8 12 160
105xa4pfkv2jz 1dtnz2z7ujv23 3901024798 2 14 140
3m3ubmf7529mh 2188542943 2 13 140
g21xv51r09w4j 2905535923 1 10 100
ASH: Advanced Analysis ©2016 114

ASH: Advanced Analysis ©2016 115
Things That Can Go Wrong
• DISPLAY_AWR
– Correct plan, old costs & binds
– ORA-6502 – very large SQL
– ORA-44002 – short-lived objects(?)
– ORA-1422 – duplicate SQL from cloning
• Statement not in Library Cache
– Only Some Statements in Library Cache
• Lots of short-lived non-shareable SQL

ASH: Advanced Analysis ©2016 116
Statement not in Library Cache
SELECT * FROM
table(dbms_xplan.display_cursor('gpdwr389mg61h'
,0,'ADVANCED'));
PLAN_TABLE_OUTPUT
-----------------------------------------------
SQL_ID: gpdwr389mg61h, child number: 0 cannot
be found

ASH: Advanced Analysis ©2016 117
Statements not in AWR Repository
SQL Plan
RANKING SQL_ID Hash Value TOT_ASH_SECS TOT_AWR_SECS SQL_IDS
---------- ------------- ---------- ------------ ------------ ----------
1 1wfhpn9k2x3hq 0 7960 4600 13
1 2wsan9j1pk3j2 1061502179 4230 4230 1
1 bnxddum0rrvyh 918066299 2640 1200 179
1 02cymzmyt4mdh 508527075 2070 0 45
1 5m0xbf7vn8490 2783301143 1700 0 49
1 0jfp0g054cb3n 4135405048 1500 0 47
1 11bygm2nyqh0s 3700906241 1370 0 27
1 6qg99cfg26kwb 3058602782 1300 1300 1
• 207 samples, representing 2070 seconds of SQL
• 45 distinct SQL_IDs, we don’t know how many executions– probably one per SQL_ID.
• Often associated with non-shareable SQL

ASH: Advanced Analysis ©2016 118
Lots of Short-lived SQL Statements
SQL_PLAN
PRCSINSTANCE NUM_SQL_ID HASH_VALUE EXEC_SECS ASH_SECS
------------ ---------- ---------- --------- ---------
50007687 169 953836181 3170 1690
50007687 50 807301148 3170 500
50007687 22 4034059499 3170 220
50007687 14 2504475139 3170 140
50007687 2 0 3170 70
50007687 1 1309703960 3170 20
50007687 1 3230852326 3170 10
…
169 SQLs 1690 Secs• Probably more than 169 statements that took about
1690 seconds, but we only sampled 169.

ASH: Advanced Analysis ©2016 119
Application Reports Lots of
Compiles

ASH: Advanced Analysis ©2016 120
ORA-06502
• This seems to be associated with very large SQL statements
SQL_ID 9vnan5kqsh1aq
--------------------
An uncaught error happened in prepare_sql_statement : ORA-06502: PL/SQL: numeric or value error
Plan hash value: 2262951047
---------------------------------------------------------------------------------------------------------------
| Id | Operation | Name | Rows | Bytes | Cost (%CPU)| Time |
---------------------------------------------------------------------------------------------------------------
| 0 | SELECT STATEMENT | | | | 1 (100)| |
| 1 | HASH GROUP BY | | 1 | 164 | 1 (100)| 00:00:01 |
…

ASH: Advanced Analysis ©2016 121
ORA-44002
• I have seen this with Global Temporary
Tables and with direct path mode (the
APPEND hint).
PLAN_TABLE_OUTPUT
------------------------------------------------------
ERROR: cannot get definition for table 'BZTNCMUX31XP5'
ORA-44002: invalid object name

ASH: Advanced Analysis ©2016 122
ORA-01422
• This happens on a database that has been cloned, often from production to test.– Consider recreating AWR repository on
clone?
An uncaught error happened in prepare_sql_statement : ORA-01422: exact fetch returns more than requested number of rows

ASH: Advanced Analysis ©2016 123
ORA-01422
• Workaround
DELETE FROM sys.wrh$_sqltext t1
WHERE t1.dbid != (
SELECT d.dbid FROM v$database d)
AND EXISTS(
SELECT 'x'
FROM sys.wrh$_sqltext t2
WHERE t2.dbid = (
SELECT d.dbid FROM v$database d)
AND t2.sql_id = t1.sql_id)

ASH: Advanced Analysis ©2016 124
Conclusion
• ASH data
– Consider longer term retention in a central
AWR repository
• Application Instrumentation is essential
• Lots of ways to query the data
– Be imaginative!
• Understand the pitfalls.

Questions?

ASH: Advanced Analysis ©2016 126

Questions?

ASH: Advanced Analysis ©2016 128
Conclusion
• ASH data
– Consider longer term retention in a central
AWR repository
• Application Instrumentation is essential
• Lots of ways to query the data
– Be imaginative!
• Understand the pitfalls.