Active NOX Control of Cogen Gas Turbine Exhaust using a ... · INTRODUCTION Cogeneration power...
13
Active NO X Control of Cogen Gas Turbine Exhaust using a Nonlinear Feed Forward with Cascade Architecture Joseph W. Burns 1 and Douglas J. Cooper 2 1. Department of Mechanical Engineering 2. Department of Chemical, Materials and Biomolecular Engineering University of Connecticut, Storrs, CT 06269 KEYWORDS NO X control, cogeneration, gas turbine, model based control, feed forward, cascade ABSTRACT Presented is a model based strategy for controlling the NO X concentration of natural gas turbine emissions in a cogeneration power plant. The strategy addresses a typical cogeneration configuration where NO X is removed from turbine exhaust via Selective Catalytic Reduction (SCR). A case study of its application to three 7 MW Solar Taurus TM 70 turbines with lean, premixed combustion is presented. The units are equipped with Rentech HRSGs, iron zeolite SCR catalysts and cool, dry Continuous Emissions Monitoring Systems (CEMS). The systems provide 30 second average NO X concentration measurements updated every 10 seconds. A model based control logic structure is proposed, as well as a method of plant-specific deployment. The resulting logic is simple, intuitive and highly effective. The gas turbine load at a cogeneration plant constantly fluctuates to satisfy a site’s instantaneous power demand. NO X production can sharply fluctuate as a result. NO X reduction is achieved by reacting exhaust NO X with ammonia in the presence of an SCR catalyst. Manipulation of ammonia flow to the catalyst provides a means of adjusting the concentration of NO X emitted to the atmosphere. The experimental data presented in this work shows that NO X concentration can be reasonably controlled with a NOx to ammonia flow rate to ammonia valve position cascade architecture. However, the cascade feedback cannot adequately address disturbances to NO X concentration caused by rapid adjustments in turbine load. A feed forward controller based on turbine load is shown to provide excellent dynamic support to the feedback controller in mitigating the disturbance. A regression of ammonia flow vs. turbine load data is used to establish a static, nonlinear relationship for the feed forward controller. The NO X control strategy presented in this paper is well suited for cogen application. Data presented in this work demonstrates that it provides excellent performance while retaining simplicity. Parameter adjustments are intuitive and based on straightforward performance observations. The primary disturbance is rejected without the requirement of additional sensors, and feedback effectively manages slower deviations. Presented at 54th ISA POWID Symposium, 5-10 June 2011, Charlotte, North Carolina, www.isa.org. Copyright 2011 ISA. All Rights Reserved.
Transcript of Active NOX Control of Cogen Gas Turbine Exhaust using a ... · INTRODUCTION Cogeneration power...

Active NOX Control of Cogen Gas Turbine Exhaust using a Nonlinear Feed Forward with Cascade Architecture
Joseph W. Burns1 and Douglas J. Cooper2
1. Department of Mechanical Engineering 2. Department of Chemical, Materials and Biomolecular Engineering
University of Connecticut, Storrs, CT 06269
KEYWORDS NOX control, cogeneration, gas turbine, model based control, feed forward, cascade ABSTRACT Presented is a model based strategy for controlling the NOX concentration of natural gas turbine emissions in a cogeneration power plant. The strategy addresses a typical cogeneration configuration where NOX is removed from turbine exhaust via Selective Catalytic Reduction (SCR). A case study of its application to three 7 MW Solar TaurusTM 70 turbines with lean, premixed combustion is presented. The units are equipped with Rentech HRSGs, iron zeolite SCR catalysts and cool, dry Continuous Emissions Monitoring Systems (CEMS). The systems provide 30 second average NOX concentration measurements updated every 10 seconds. A model based control logic structure is proposed, as well as a method of plant-specific deployment. The resulting logic is simple, intuitive and highly effective. The gas turbine load at a cogeneration plant constantly fluctuates to satisfy a site’s instantaneous power demand. NOX production can sharply fluctuate as a result. NOX reduction is achieved by reacting exhaust NOX with ammonia in the presence of an SCR catalyst. Manipulation of ammonia flow to the catalyst provides a means of adjusting the concentration of NOX emitted to the atmosphere. The experimental data presented in this work shows that NOX concentration can be reasonably controlled with a NOx to ammonia flow rate to ammonia valve position cascade architecture. However, the cascade feedback cannot adequately address disturbances to NOX concentration caused by rapid adjustments in turbine load. A feed forward controller based on turbine load is shown to provide excellent dynamic support to the feedback controller in mitigating the disturbance. A regression of ammonia flow vs. turbine load data is used to establish a static, nonlinear relationship for the feed forward controller. The NOX control strategy presented in this paper is well suited for cogen application. Data presented in this work demonstrates that it provides excellent performance while retaining simplicity. Parameter adjustments are intuitive and based on straightforward performance observations. The primary disturbance is rejected without the requirement of additional sensors, and feedback effectively manages slower deviations.
Presented at 54th ISA POWID Symposium, 5-10 June 2011, Charlotte, North Carolina, www.isa.org.
Copyright 2011 ISA. All Rights Reserved.

INTRODUCTION Cogeneration power plants tend to be small in nature. Their competitiveness is derived by balancing a site’s heating needs with power production. Despite a smaller size, the complexity of a cogen plant is often greater than standard power plants. The small scale output and full scale complexity of a cogen plant demands simplicity in operations and maintenance. Control logic simplicity is particularly important. A vast collection of customized control logic directs a plant’s automated systems. The logic must be maintained along with ever changing processes, demands and environments. Simplicity is essential to understand and effectively manage the evolution. The University of Connecticut’s cogeneration plant operates three 7 MW Solar TaurusTM 70 natural gas turbines with lean, premixed combustion. The turbines drive generators to produce electricity. The turbine and generator units are collectively referred to as Combustion Turbine Generators (CTGs). Each unit is connected to a Rentech Heat Recovery Steam Generator (HRSG) which captures waste heat from combustion turbine exhaust to produce steam for the campus’s heating and cooling needs. The HRSGs also contain natural gas duct burners which are fired when additional steam is required. Downstream of the heat exchangers, the HRSGs contain integrated iron zeolite NOX catalysts and ammonia injection systems. After being dosed with ammonia vapor, the exhaust passes through a catalyst grid where NOX reduction takes place. The exhaust gas continues up through the stack where it is sampled by a Continuous Emissions Monitoring System (CEMS) before being released into the atmosphere. A diagram of UConn’s combustion and NOX reduction processes is provided in Figure 1.
Figure 1: Diagram of UConn’s Combustion and NOx Reduction Processes
Presented at 54th ISA POWID Symposium, 5-10 June 2011, Charlotte, North Carolina, www.isa.org.
Copyright 2011 ISA. All Rights Reserved.

Selective catalytic reduction is accomplished by reacting ammonia with the NOX contained in exhaust gases in the presence of a catalyst. SCR of NOX is achieved based on the following reactions [1]: 4NH3+4NO +O2→4N2+6H2O (1) 2NH3+NO+NO2→2N2+3H2O (2) 8NH3+6NO2→7N2+12H2O (3) Excess oxygen is available in lean burning natural gas turbine exhaust and >90% of NOX in the untreated exhaust generally consists NO [1]. Reaction (1) dominates the overall NOX reduction in these conditions. The objective of NOX control is to adjust the rate of this reaction in order to maintain a specific concentration of NOX exiting the stack. This balances two objectives: to emit a low level of NOX while also keeping ammonia usage and emissions low. Variables that affect NOX production and reduction rates include: CTG load, fuel flow rate, Air/Fuel ratio, fuel mixing and combustion, inlet air temperature, pressure and humidity [2], duct burner firing rate, catalyst temperature, catalyst condition, and ammonia surface concentration and distribution over the catalyst. From a control perspective, only some of these variables must be considered. The surface ammonia concentration of the catalyst is the most important variable affecting NOX because it provides a means to control NOX emissions to the atmosphere. Increasing the level of ammonia on the catalyst increases the rate of the NOX reduction reaction, and reduces the concentration of NOX that is emitted to the atmosphere. Ammonia concentration is not measured in UConn’s plant, so ammonia flow rate to the catalyst must be considered in its place. A number of CTG operating variables impact NOX, but the CTG internal controls are such that the variables are correlated. At any given loading, the CTG operating variables are controlled to prescribed operating levels. Therefore, the effect of the CTG operating variables on NOX production can be described simply as a function of CTG load. CTG fuel flow rate is used to indicate CTG load throughout this study. The CTG load at UConn’s cogeneration plant constantly fluctuates to satisfy the instantaneous power requirements of the campus. A CTG is typically brought online and offline everyday which causes large load swings in the other two CTGs twice daily. These rapid changes in the CTG load induce a strong and rapid NOX response that is damaging to NOX control performance. Other variables affect NOX production and reduction, including ambient air conditions, catalyst temperature and condition, and duct burner firing rate. These variables do not require special consideration because they only induce a weak NOX response or they change very slowly during normal plant operation. The impact on NOX emissions due to changes in these variables can be adequately addressed by feedback control.
Presented at 54th ISA POWID Symposium, 5-10 June 2011, Charlotte, North Carolina, www.isa.org.
Copyright 2011 ISA. All Rights Reserved.

Sensors are available at UConn’s plant that can be used to examine the input and output relationships of the NOX processes. The sensors, shown in Figure 1, include: a combustion turbine fuel flow rate sensor, an ammonia flow rate sensor, and a CEMS unit that provides NOX concentration data for the flue gas after it has been treated by SCR. NH3 → NOX Process NOX emissions can be adjusted by changing the ammonia flow rate to the catalyst. Increasing the ammonia flow rate increases the rate of the NOX reduction reaction. Figure 2 shows dynamic response data showing the effect of ammonia flow rate on NOX concentration for UConn’s unit #2.
Figure 2: Unit #2 NOX Concentration Response to steps in Ammonia Flow Rate
The exit NOX concentration data of Figure 2 is taken at time when the major disturbance, the CTG fuel flow, is held constant. On all three of UConn’s units, step tests similar to the ones of Figure 2 consistently show that the exit NOX concentration reaches a steady state given a constant ammonia flow rate. This indicates that the process is self-regulating. Furthermore, it is observed that the ammonia flow rate’s impact on the NOX concentration process is reverse-acting and nonlinear. Valve → NH3 Process The next component of the NOX system that needs to be examined is the ammonia flow rate process. The ammonia flow control valve, shown in Figure 1, can be adjusted to manipulate ammonia flow rate. Dynamic response data showing the effect of ammonia flow control valve position on ammonia flow rate for UConn’s unit #2 is presented in Figure 3.
Presented at 54th ISA POWID Symposium, 5-10 June 2011, Charlotte, North Carolina, www.isa.org.
Copyright 2011 ISA. All Rights Reserved.

Figure 3: Unit #2 NH3 Flow Rate Response to steps in NH3 Flow Control Valve Position
The ammonia flow rate data of Figure 3 is taken at time when the upstream ammonia pressure, the main disturbance to the ammonia flow rate process, is constant. The ammonia flow rate process is also self-regulating on all three of UConn’s units. It is observed that the impact of the ammonia flow control valve position on the ammonia flow rate process is direct-acting and nonlinear. CTG → NOX Disturbance CTG load changes have a strong impact on NOX production. CTG load is the primary disturbance to the NOX concentration process. Throughout this paper CTG fuel flow rate is used as an indicator of CTG load. Dynamic response data showing the effect of CTG fuel flow on NOX concentration for UConn’s unit #2 is presented in Figure 4.
Figure 4: Unit #2 NOX Concentration Response to steps in CTG Fuel Flow Rate
The exit NOX concentration data of Figure 4 is taken at time when the ammonia flow rate is held constant. On all three of UConn’s units, step tests similar to the ones of Figure 4 consistently show
Presented at 54th ISA POWID Symposium, 5-10 June 2011, Charlotte, North Carolina, www.isa.org.
Copyright 2011 ISA. All Rights Reserved.

that the exit NOX concentration reaches a steady state given a constant CTG fuel flow rate. This indicates that the process is self-regulating. Furthermore, it is observed that the impact of CTG fuel flow rate on NOX concentration process is direct-acting and nonlinear. METHODOLOGY The University of Connecticut’s environmental objectives require that the NOX concentration of the exhaust gas emitted to the atmosphere is controlled to 1.8 Parts Per Million (PPM). In order to satisfy the control objective with the NOX reduction system that is in place at UConn, the correct amount of ammonia must be injected onto the catalyst at the right time. The problem can be resolved into two components: determining the proper ammonia flow rate to the catalyst, and maintaining that flow rate. The NOX control methodology of this paper employs an exit NOX concentration to ammonia flow rate to ammonia valve position cascade architecture. A diagram of the NOX processes and the proposed control structure is presented in Figure 5.
Figure 5: Diagram of Exit NOX Concentration Control Scheme
This structure uses a NOX feedback controller (NC) to correct deviations in the NOX concentration process variable (PV) by adjusting an ammonia flow rate set point (SP). The cascade uses another feedback loop to ensure the ammonia flow rate set point is tracked by adjusting the ammonia control
Presented at 54th ISA POWID Symposium, 5-10 June 2011, Charlotte, North Carolina, www.isa.org.
Copyright 2011 ISA. All Rights Reserved.

valve. PI control algorithms are used in both controllers to reject disturbances without offset. A feed forward controller provides an estimate of the required ammonia flow rate set point based on the CTG fuel flow (f(CTG)). The NOX feedback controller refines the estimate to achieve the desired NOX concentration. Several parameters are required for the control structure to function. These parameters are specific to the system and should be derived from plant data. Fine tuning can be done according to performance observations and the parameters should be maintained as the plant evolves. The following parameters are required for the NOX control algorithm:
1) Proportional and integral tuning values for the ammonia flow controller, KC,NH3 and KI,NH3 2) Proportional and integral tuning values for the NOX feedback controller, KC,NOX and KI,NOX 3) Predicted ammonia flow rate as a function of CTG fuel flow for the NOX feed forward
controller, f(CTG) A control block diagram of the NOX control algorithm with the required parameters is provided in Figure 6.
Figure 6: NOX Concentration Control Block Diagram
The self-regulating NH3→NOx and Valve→NH3 processes can be reasonably approximated by First Order Plus Dead Time (FOPDT) dynamic models. Controllers for these processes can be tuned using the following methodology [3]:
1) Establish the design level of operation (DLO), defined as the expected values for set point and major disturbances during normal operation
2) Bump the process and collect controller output (CO) to process variable (PV) dynamic process data around this design level
3) Approximate the process data behavior with a FOPDT dynamic model 4) Use the model parameters from step 3 in IMC tuning correlations to tune the controller.
Presented at 54th ISA POWID Symposium, 5-10 June 2011, Charlotte, North Carolina, www.isa.org.
Copyright 2011 ISA. All Rights Reserved.
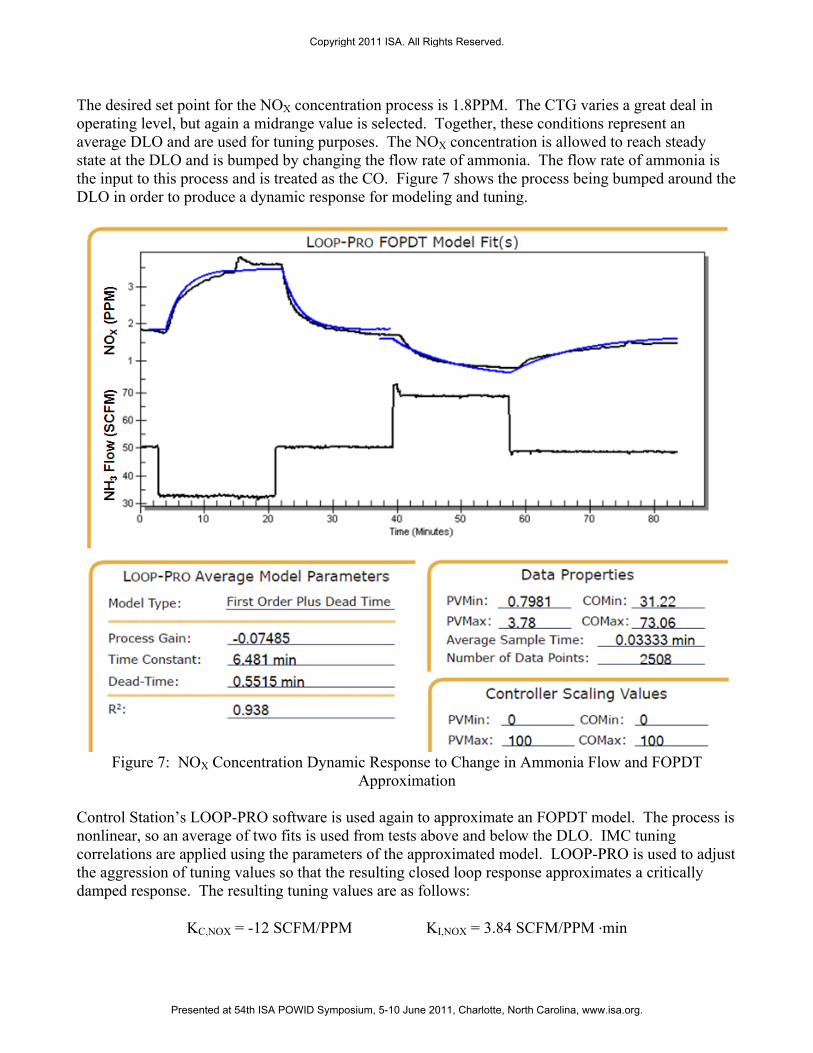
The desired set point for the NOX concentration process is 1.8PPM. The CTG varies a great deal in operating level, but again a midrange value is selected. Together, these conditions represent an average DLO and are used for tuning purposes. The NOX concentration is allowed to reach steady state at the DLO and is bumped by changing the flow rate of ammonia. The flow rate of ammonia is the input to this process and is treated as the CO. Figure 7 shows the process being bumped around the DLO in order to produce a dynamic response for modeling and tuning.
Figure 7: NOX Concentration Dynamic Response to Change in Ammonia Flow and FOPDT
Approximation
Control Station’s LOOP-PRO software is used again to approximate an FOPDT model. The process is nonlinear, so an average of two fits is used from tests above and below the DLO. IMC tuning correlations are applied using the parameters of the approximated model. LOOP-PRO is used to adjust the aggression of tuning values so that the resulting closed loop response approximates a critically damped response. The resulting tuning values are as follows:
KC,NOX = -12 SCFM/PPM KI,NOX = 3.84 SCFM/PPM ∙min
Presented at 54th ISA POWID Symposium, 5-10 June 2011, Charlotte, North Carolina, www.isa.org.
Copyright 2011 ISA. All Rights Reserved.

For the ammonia flow rate process, the DLO includes a wide range flow rates. Depending on the CTG load, the expected ammonia flow rate could be anywhere from 5 Standard Cubic Feet per Minute (SCFM) to 90 SCFM. A mid-range value, approximately 40 SCFM, is selected to be the DLO for tuning purposes. Barring any major nonlinearity in the ammonia flow rate process, tuning values derived at this DLO should provide adequate control throughout the expected range. The ammonia flow rate is allowed to settle and then it is bumped by changing the controller output to the valve. Figure 8 shows the process being bumped in this range.
Figure 8: Ammonia Flow Dynamic Response to Change in Valve CO and FOPDT Approximation
Figure 8 also shows a FOPDT approximation to the process data, generated by Control Station’s LOOP-PRO software. IMC tuning correlations are applied using the parameters of the approximated model. LOOP-PRO is used to adjust the aggression of tuning values so that the resulting closed loop response approximates a critically damped response. The resulting tuning values are as follows:
KC,NH3 = 0.11 %/SCFM KI,NH3 = 3.8 %/SCFM∙min
Presented at 54th ISA POWID Symposium, 5-10 June 2011, Charlotte, North Carolina, www.isa.org.
Copyright 2011 ISA. All Rights Reserved.

The third parameter required for the control structure is the function SPNH3,Feed Forward = f(CTG). The ammonia flow rates, SPNH3,Feed Forward, are the typical values that result in an exit NOX concentration of 1.8 PPM at given steady state CTG fuel flow rates. The CTG load is the dominant variable that determines the magnitude of the ammonia flow rate that is required to reduce exit NOX concentration to 1.8PPM. However, as previously stated, there are a number of other factors that affect NOX production and reduction, so the actual ammonia flow rate that is required at a given fuel flow varies. In order to estimate the function, the units are placed in automatic control. The cascade controller, tuned in the previous steps, uses feedback to reasonably control the exit NOX concentration. The units are allowed to run in this mode for a long period of time in order to capture data that will provide the basis for the feed forward function. This data should represent a full range of normal operating conditions of the system. The data should be filtered so that only instances when NOX concentration is near the set point are considered. For this project, instances when the NOX concentration is between 1.7PPM and 1.9PPM are considered; the rest of the data is filtered out. We can correlate the flow rate of ammonia to the CTG fuel flow rate during these times. Figure 9 shows a plot of ammonia flow rates vs. CTG fuel flow rates for this data.
Figure 9: Ammonia Flow Rates vs. CTG Fuel Flow and Polynomial Regression for UConn’s Unit #2
The control structure’s feed forward function, SPNH3,Feed Forward = f(CTG), is the regression equation of Figure 9. The slope of the ammonia flow rate vs. CTG fuel flow is much greater at the high end of the CTG operating range, so a nonlinear regression function is necessary. The function is static so it neglects the relative dynamics of the NH3→NOx process and the CTG→NOX disturbance. This could lead to diminished performance. With the feed forward in place, CTG step tests can be performed to determine if the function is too weak or too aggressive. If the ammonia response is too aggressive the slope of the feed forward function should be reduced and vice versa.
Presented at 54th ISA POWID Symposium, 5-10 June 2011, Charlotte, North Carolina, www.isa.org.
Copyright 2011 ISA. All Rights Reserved.

RESULTS The tuned ammonia flow rate control loop is put in automatic to test its set point tracking performance. A plot of closed loop set point step responses is provided in Figure 10. The plot shows that the ammonia flow rate set point is tracked with no overshoot and a settling time of approximately 1.5 minutes.
Figure 10: Tuned Ammonia Flow Rate Set Point Tracking on UConn’s Unit #2
With the ammonia flow rate setpoint tracking loop in automatic, the tuned NOX feedback loop is put in automatic to test its disturbance rejection performance. A plot of closed loop CTG step responses is provided in Figure 11. The NOX disturbances are corrected with no overshoot and the observed settling time of each event is approximately 15 minutes.
Figure 11: CTG Steps with Tuned NOX Disturbance Rejection (no Feed Forward) on UConn’s Unit #2
Presented at 54th ISA POWID Symposium, 5-10 June 2011, Charlotte, North Carolina, www.isa.org.
Copyright 2011 ISA. All Rights Reserved.

The feed forward function is added to cascade feedback structure to test the overall CTG disturbance rejection performance. A plot of CTG step responses using the combined feed forward with feedback trim to ammonia flowrate cascade is provided in Figure 12. The NOX disturbances are corrected with minimal overshoot. Yhe observed settling time of each event is approximately 8 minutes. The ammonia flow rate slightly lags the ammonia setpoint but its response is still very fast when compared to the NOX process.
Figure 12: CTG Steps with Tuned NOX Disturbance Rejection and Feed Forward on UConn’s Unit #2 CONCLUSIONS The tuned NOX control cascade and feed forward provides dependable NOX control for UConn’s three CTG/HRSG units. The conservative tuning values selected for the feedback loops provide disturbance rejection with negligible overshoot, and a stability margin that will protect the loop’s stability against nonlinearities and changes in the processes. While conservative tuning values deliver robust stability, they also result in slower disturbance rejection. The addition of the feed forward function improves the disturbance rejection performance of the structure, reducing the settling time of the main disturbance by almost 50%. This dramatically reduces the standard deviation of emissions NOX concentration during normal cogen operation.
Presented at 54th ISA POWID Symposium, 5-10 June 2011, Charlotte, North Carolina, www.isa.org.
Copyright 2011 ISA. All Rights Reserved.

The control methodology provides favorable NOX control performance and robust stability, and it’s also user friendly. Cascade and feed forward are industry standard tools, whereas other NOX control strategies can require messy logic and physical models. The parameters used in the control structure are calculated from simple plant tests. Commercially available software such as LOOP PRO enables an engineer to complete the four step tuning process in minutes, and with a high level of confidence. Finally, no additional sensors are required beyond what is generally already available in cogeneration configurations. The structure successfully meets the UConn Cogeneration Plant’s operational and environmental objectives. This methodology is recommended for similar configurations because it is effective and because it can easily and confidently be deployed and maintained. REFERENCES [1] Forzatti, Pio, “Present Status and Perspectives in De-NOX SCR Catalysis,” Applied Catalysis
A: General 222, p. 221, 2001. [2] Pavri, Roointon and Moore, Gerald D., “Gas Turbine Emissions and Control,” p. 2, 2001. [3] D.J. Cooper, http://www.controlguru.com
Presented at 54th ISA POWID Symposium, 5-10 June 2011, Charlotte, North Carolina, www.isa.org.
Copyright 2011 ISA. All Rights Reserved.