ACTIVE Net Insights user guide · Permission and Category Level Permission. ... your ACTIVE Net...
51
ACTIVE Net Insights user guide (v5.9) Version Date 5.9 July 10, 2018 5.8 June 18, 2018 5.7 May 2, 2018 5.6 April 9, 2018 5.5 March 20, 2018
Transcript of ACTIVE Net Insights user guide · Permission and Category Level Permission. ... your ACTIVE Net...

ACTIVE Net Insights user guide (v5.9)
Version Date
5.9 July 10, 2018
5.8 June 18, 2018
5.7 May 2, 2018
5.6 April 9, 2018
5.5 March 20, 2018

Page 2 of 51
ACTIVE Network, LLC
© 2018 Active Network, LLC, and/or its affiliates and licensors. All rights reserved.
No part of this publication may be reproduced, transmitted, transcribed, stored in
a retrieval system, or translated into any computer language, in any form or by
any means, electronic, mechanical, magnetic, optical, chemical, manual, or
otherwise, without prior written permission. You have limited permission to make
hard copy or other reproductions of any machine-readable documentation for
your own use, provided that each such reproduction shall carry this copyright
notice. No other rights under copyright are granted without prior written
permission. The document is not intended for production and is furnished "as is"
without warranty of any kind. All warranties on this document are hereby
disclaimed including the warranties of merchantability and fitness for a particular
purpose.
ACTIVE Network, LLC
Dallas Corporate Office
717 N. Harwood Street, Suite 2500
Dallas, Texas 75201
About ACTIVE Network, LLC
ACTIVE Network, LLC is a technology and media company that helps millions of
people find and register for things to do and helps organizations increase
participation in their activities and events.
For more information about ACTIVE Network, LLC products and services, please
visit ACTIVEnetwork.com.
If you have any questions about this document, please contact the ACTIVE Net
Support team using the information below.
Phone: 1-800-663-4991
Email: [email protected]
Website: http://support.activenetwork.com/activenet

Page 3 of 51
Table of contents
Overview ................................................................................................................................................ 4
Signing in and out of ACTIVE Net Insights ...................................................................................... 5
Access control requirement ............................................................................................................................ 6
Folders structure .................................................................................................................................................. 7
ACTIVE Net Insights pages.................................................................................................................. 9
Overall layout ........................................................................................................................................................ 9
Top menu bar ....................................................................................................................................................... 9
Homepage .......................................................................................................................................................... 10
Interactive reporting ..........................................................................................................................11
Overall layout ..................................................................................................................................................... 11
Running a report .............................................................................................................................................. 13
Using input controls/parameters ............................................................................................................... 14
Using interactive reports ............................................................................................................................... 17
Saving or exporting a report ....................................................................................................................... 29
Scheduling a report ......................................................................................................................................... 32
Ad Hoc reporting ................................................................................................................................39
Overall layout ..................................................................................................................................................... 39
Creating an ad hoc view ................................................................................................................................ 42
Opening an existing ad hoc view .............................................................................................................. 44
Saving an ad hoc view .................................................................................................................................... 45
Saving an ad hoc view and creating a report ....................................................................................... 45
Exporting an ad hoc view .............................................................................................................................. 46
Creating an ad hoc report from an existing ad hoc view ................................................................. 47
Using integrative reports .............................................................................................................................. 47
Saving or exporting a report ....................................................................................................................... 48
Frequently Asked Questions .............................................................................................................51

Page 4 of 51
Overview
ACTIVE Net now includes a new interactive reporting portal called ACTIVE Net
Insights, where you can run standard reports and modify them to match your
own preferences. You can customize these reports by formatting, filtering, and
sorting data in individual report columns. You can then save your customizations
so that you can easily view them again in the future.
In addition to customizing how report data displays, you can use ACTIVE Net
Insights to easily view the customers and transactions that make up the totals in
your reports. Reports in this environment load more quickly and they easily
export in raw format for a spreadsheet.
Note: ACTIVE Net Insights is not supported for use with Internet Explorer 8, 9 and
10.

Page 5 of 51
Signing in and out of ACTIVE Net Insights
To sign in to ACTIVE Net Insights:
In ACTIVE Net, go to Reports > ACTIVE Net Insights. You will be
automatically signed in to ACTIVE Net Insights.
To sign out of ACTIVE Net Insights:
In the top right of the ACTIVE Net Insights page, click Log Out.

Page 6 of 51
Access control requirement
The new access security system for ACTIVE Net Insights consists of Global
Permission and Category Level Permission.
Global Permission
Before you can sign in to ACTIVE Net Insights, your ACTIVE Net user
account must have the new Reports: ACTIVE Net Insights system user
profile function option.
Note: The Reports: ACTIVE Net Insights permission allows access to
reporting for all sites in ACTIVE Net Insights. Do not assign this
permission to any site-specific users who are not already permitted to
run multi-site reports in ACTIVE Net.
Assign the Reports: ACTIVE Net Insights permission with Full Access:
1. Go to Administration > System Settings > System User
Profiles.
2. Select the system user profile that you want to modify.
3. Choose one of the following:
▪ If you want users to be able to save changes and
customizations that they make to reports in ACTIVE
Net Insights and to create report schedules:
a. In the Function Options section, highlight the
Reports: ACTIVE Net Insights option.
b. Move this option to the Full Access list.
▪ If you want user to be able to sign in to ACTIVE Net
Insights and run reports there but you do not want
them to be able to save new reports:
a. In the Function Options section, highlight the
Reports: ACTIVE Net Insights option.
b. Move this option to the Read Only Access list.
4. Click Save.
Global
Permission
Category Level
Permission

Page 7 of 51
Category Level Permission
System users with Category Level Permission can view corresponding
public folders in ACTIVE Net Insights.
Location: Administration Home > System Settings > System User
Profiles
To create or modify a system user profile and assign the folders, execute
the following steps.
1. Go to Administration > System Settings > System User
Profiles.
2. Create a new profile or select the system user profile that you
want to modify. Make sure the Reports: ACTIVE Net Insights
permission is Full Access or Read Only Access.
3. Under the ACTIVE Net Insights - Folders section, multi-select
the required folder(s) from the Available Folders box and click
the » button to add public folders to the Authorized Folders
box.
4. Click Save.
Folders structure
ACTIVE Net Insights consists of Public folder and Saved Content folder.

Page 8 of 51
Public Folder
System users with Category Level Permission can view corresponding
public folders in ACTIVE Net Insights.
Saved content Folder
Saved content Folders consists of Personal folder and Shared folder.
Note: Organization folder – it is a public folder that contains
temporary system files.
• Personal folder – Personal folder is automatically created when a
user with Reports: ACTIVE Net Insights permission as full access
logs into ACTIVE Net Insights for the first time and the user can
edit, save and delete content to the personal folder.
Note: Users with Read Only permission do not have a personal
folder.
• Shared folder – Shared folder is a public folder for all the users in
the organization.
Users with Reports: ACTIVE Net Insights permission as full
access can save the reports to the Shared folder and save reports
from the Shared folder to their Personal folder.
ACTIVE Net Administrator users who have access to ACTIVE Net
Insights can delete the content in the Shared folder and save
content to other user’s personal folder.

Page 9 of 51
ACTIVE Net Insights pages
Overall layout
ACTIVE Net Insights reporting platform contains the following areas:
o Top menu bar – It includes navigation options, help and login.
o Report area
• For interactive reporting layout, see Overall layout.
• For ad hoc reporting layout, see Overall layout.
Top menu bar
The menu bar at the top of ACTIVE Net Insights includes the following elements:
o Home – Go to the Home page.
o View
• Go to View > Repository to browse for reports by
category.
• Go to View > Messages to view the messages from the
ACTIVE Net insights.
o Create
• Go to Create > Ad hoc view to create an ad hoc view using domains.
• Go to Create > Report to create a report using
templates.

Page 10 of 51
Homepage
The homepage includes the following elements:
o Announcements – what’s new in Insights
o Learning Resources – how-to documents
o Recently Viewed Items – recently viewed reports and views

Page 11 of 51
Interactive reporting
Overall layout
Repository page
To see the Repository page, go to View > Repository on the top menu
bar.
The Repository page displays your organization’s reports within the
folders that are used to organize them. You can use the folder tree on
the left side of the page to browse your reports by category. Use the
Repository page to browse your reports when you know the type or
category of report that you want to run.
Once you have selected a category on the left site of the page, click the
name of a report in the main part of the page to run that report.
Report page
To see the report page, run any report in ACTIVE Net Insights.
The report page includes the following elements:
• Refresh – Refresh the report with the latest data.

Page 12 of 51
• Page controls – Enter a page
number or use the navigation buttons to go to a specific page in
the report.
Note: Page controls only display if your report spans multiple
pages.
• Zoom controls – Use the +/- buttons or the
dropdown list to specify how large you want the report to display
on the page.
• Search controls – Enter text to search
for in the report, and use the arrow buttons to navigate forward
and back through search results.
• Back – Click Back to go back to whatever page you ran
this report from.
• Save – Save the customizations you have made to a new
report so that you can easily access them again in the future.
Note: If your ACTIVE Net user account does not have Full
Access to the Reports: ACTIVE Net Insights system user
profile function option, then you cannot save report
customizations.
• Export – Export the data in this report to a file that you can
open in an external application.
• Undo/redo controls – Undo your most recent
report action, or redo an action you have just undone.
• Options – Modify this report’s input controls so that you can
change the filters being used to narrow down report data.

Page 13 of 51
Running a report
To run a report:
1. On the Repository page, click the name of the report that you
want to run.
2. In the Input Controls window, enter any dates or other filters
that you want to use to narrow down the data in the report.
3. Click OK.
4. The report output appears.

Page 14 of 51
Using input controls/parameters
To run a report, click the report name. An Input Controls window appears where
you can filter the data to appear in the report.
Each interactive report enables users to explore maximum 13 months of data
across all applicable sites through a simple and intuitive web browser interface.
To run reports without time limitation, use Ad hoc report to build robust reports
and export to various formats for deeper data exploration and mining.
To enter input controls:
1. In the Input Controls window, if a date range is required, in the
Start Range and End Range fields either click the icon to
select a date or enter a date offset expression.
The date offset expression is applied to the current date and
consists of a period +/- count:
Assume today is Aug 4, 2015 then:

Page 15 of 51
Day+1 = Aug 5, 2015
Week-1 = July 26 (Week starts on Sunday.)
Month-2 = June 1, 2015 (First day of June)
Quarter-1 = April 1, 2015 (First day of the second quarter)
Year-3 = Jan 1, 2012 (First day of 2015)
If you enter Start Range and End Range like the screenshot
above, the time range is June.
2. In the Input Controls window, specify any other necessary filters
that you want to use in your report.
Note: If you do not want to narrow down a particular filter, then
click All for that filter. For example, if the Input Controls window
includes a Site filter and you do not want to filter the report to
only show a specific site, then click All.
Choose one of the following:
▪ To run the report using the filters you have selected
and leave the Input Controls window open so that
you can make further modifications once the data
displays, click Apply.
▪ To run the report using the filters you have selected
and close the Input Controls window for now, click
OK.
▪ To remove any filters that you have entered and
return the Input Controls window to its default
state, click Reset.
▪ To close the Input Controls window without
running the report, click Cancel.
The dropdown list at the top left of the Input Controls window only displays if
you have saved a set of input controls in the past. To use input controls that have
been previously saved:

Page 16 of 51
1. In the Input Controls window, select a saved set of filters from
the list at the top left of the window.
2. Make any necessary modifications to the saved filters.
3. Click OK.
To change the input controls for a report after you have already run it:
• Click the Input Controls button at the top right of the page.

Page 17 of 51
Using interactive reports
Formatting columns
To format a column:
1. Click any column to highlight it.
2. At the top of the column, hover over the first button.
3. Click Formatting.
The Format column window appears.

Page 18 of 51
4. In the Format column window, select the part of the column
that you want to modify in the Apply to list.
5. Specify any formatting information that you want to apply to
this part of the column.
6. If the part of the column that you want to format includes
numbers, select a Format pattern to use as a template when
formatting these numbers.
7. Click OK.

Page 19 of 51
Conditional formatting
You can format the numbers in a column in different ways depending on
the value of those numbers. Use conditional formatting if you want to
call attention to specific values in your columns.
For example: If you want to call attention to memberships that have
more than 50 members, then you can highlight numbers greater than 50
in red.
To format a column conditionally:
1. Click any column to highlight it.
2. At the top of the column, hover over the first button.
3. Click Formatting.
The Format column window appears.
4. Click Conditional Formatting.

Page 20 of 51
5. In the Apply to list, select the part of this column that you
want to format conditionally.
6. In the Conditions List section, click Add.
7. In the Operator column, select a comparison that you want to
apply to the values in this column.
For example: If you want to highlight any numbers greater
than 50 in red, select Greater than.
8. In the Condition column, enter a value that you want to
compare the values in this column against.
For example: If you want to highlight any numbers greater
than 50 in red, enter 50.
9. In the Format column, specify any formatting that you want to
apply to the values in this column if the condition to the left is
true.
For example: If you want to highlight any numbers greater
than 50 in red, specify red as the font color.

Page 21 of 51
10. If you want to add any further conditional formatting to this
column, repeat steps 6-9.
11. Click OK.
Your conditional formatting is applied to this column. In this example, all
numbers in detail rows greater than 50 are now red.

Page 22 of 51
Hiding and showing columns
To hide a column:
1. Click any column to highlight it.
2. At the top of the column, hover over the first button.
3. Click Hide column.
4. The column disappears.
If you have hidden a column and want to show it again:
1. Click any column to highlight it. This can be any column in the
report that is still visible.

Page 23 of 51
2. At the top of the column, hover over the first button.
3. Hover over Show columns.
4. Select the hidden column that you want to show.
The column reappears.
Filtering columns
To filter the report based on a specific column:
1. Click any column to highlight it.
2. At the top of the column, click the second button.
The Filter column window appears.
3. In the Filter column window, click Show only rows where.

Page 24 of 51
4. Choose a comparison that you want to make in your column
filter.
5. Enter text or a number that you will use to compare this
column to in your column filter.
For example: If you only want to show rows where the value
in this column is greater than 5, select Greater than from the
dropdown list and enter 5.
6. Click OK.
The report data is filtered. The filter icon appears next to the
column header to indicate that this column has a filter applied
to it.

Page 25 of 51
Sorting columns
To sort report data based on a specific column:
1. Click the column that you want to sort by to highlight it.
2. At the top of the column, click either the up arrow or the down
arrow to sort the column in either ascending or descending
order.
The report data is sorted. The sort icon appears next to the column
header to indicate that this column has a filter applied to it.

Page 26 of 51
Resizing and moving columns
To resize a column:
1. Click to highlight the column that you want to resize.
2. Hover over the dotted border to the right of the column.
3. The mouse pointer changes to a double arrow.
4. Drag the dotted border to the left or right to resize the
column.
To move a column:
1. Click to highlight the column that you want to move.
2. Click in the column and drag it to a new location.
3. When the dotted border is in the position that you want,
release the mouse.
4. The column moves to the position that you indicated.

Page 27 of 51
Undoing and redoing report actions
Use the three undo/redo buttons to undo and redo actions that you have
performed on your report.
To undo an action that you have just performed on a report:
⚫ Click the Undo button.
To redo an action that you have just undone with the Undo button:
⚫ Click the Redo button.
To undo all actions that you have performed and return to the initial
report state:
⚫ Click the Undo All button.

Page 28 of 51
Rerunning the report
If you want to change the filters and rerun the report, click the
icon.
The input controls window appears. You can enter the filters and run the
report again.

Page 29 of 51
Saving or exporting a report
Saving a report
Once you have made modifications to an existing report, you can save it
so that you can quickly run it again in the future with all the same
formatting, sorting, and filtering.
Note: If your ACTIVE Net user account does not have Full Access to the
Reports: ACTIVE Net Insights system user profile function option, then
you cannot save report modifications.
To save a report:
1. Hover your mouse over the Save menu at the top of the
report page.
2. Click Save As.
3. Enter a unique Name for your custom report.
4. Enter an optional Description.
5. Select a location to save your custom report.
6. Click Save.

Page 30 of 51
Exporting a report
You can export the data in your report to several different file types. To
export a report:
1. Hover your mouse over the Export menu at the top of
the report page.
2. Click the type of file that you want to export the report to:
▪ To export to a PDF file, click As PDF. You will not be
able to manipulate data when it is displayed in PDF
form.
▪ To export to an XLS spreadsheet file, click As Excel.
You will be able to manipulate your data in Excel the
same way you can with other spreadsheets.

Page 31 of 51
▪ To export to a CSV (comma-separated values) file,
click As CSV. You can import this file into
spreadsheet or other compatible software.
▪ To export to an XLSX spreadsheet file, click As XLSX.
This file type corresponds to newer versions of Excel.

Page 32 of 51
Scheduling a report
Creating a schedule for a report
Note: If your ACTIVE Net user account does not have Full Access to the
Reports: ACTIVE Net Insights system user profile function option, then
you cannot create and save report schedules.
To schedule a report to run automatically at a future time:
1. On the Repository page, navigate to the folder where your
report is located, so that its title displays on the page.
2. Right-click the report’s title and click Schedule.
3. On the Scheduled Jobs page, click Create Schedule.
Page 33 of 51
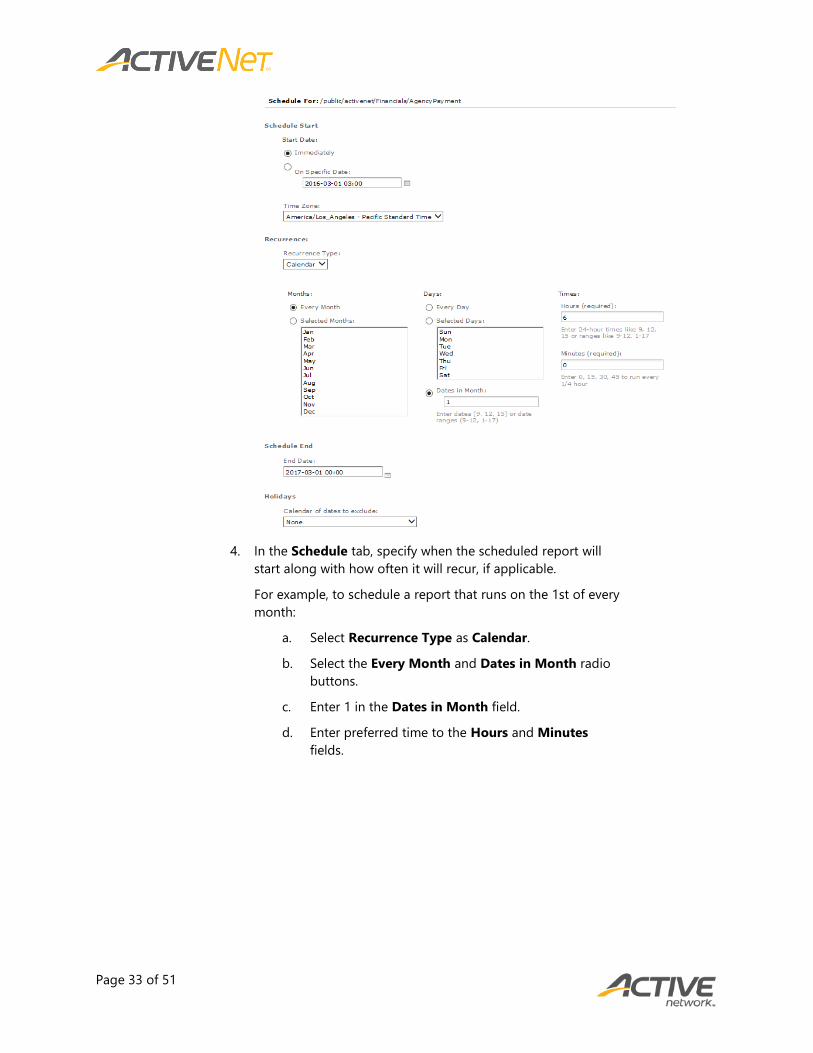
4. In the Schedule tab, specify when the scheduled report will
start along with how often it will recur, if applicable.
For example, to schedule a report that runs on the 1st of every
month:
a. Select Recurrence Type as Calendar.
b. Select the Every Month and Dates in Month radio
buttons.
c. Enter 1 in the Dates in Month field.
d. Enter preferred time to the Hours and Minutes
fields.

Page 34 of 51
5. In the Parameters tab, specify any Input Controls that you
want to use for the scheduled report. For more information
about input controls, see Using input controls/parameters.
For example, to schedule a report that provides results for the
previous month, enter MONTH-1 in the Start Date field and
MONTH in the End Date field.

Page 35 of 51
6. In the Output Options tab, select an output file format and
enter a name for the report file that will be created during the
schedule.
7. Enter an Output Destination to specify where you want the
file to be exported to.
Note: If you select Output To Repository, then click Browse
and save your scheduled report to your personal folder.
To schedule outputting a report to an FTP server, enter the
FTP server as the output destination.
▪ Server Address: The IP address of the organization’s FTP
server.

Page 36 of 51
▪ Port: The port number of the FTP server (defaults to port
21). Ensure that port 21 is open on the FTP server.
▪ Transfer Protocol: The FTP server transfer protocol.
▪ Directory: The directory to store the output report.
▪ Username/password: The FTP server login username
and password.
▪ SSH Key Authentication: If the organization’s FTP server
requires SSH, the SSH Key must be stored on the Insights
portal. To use this function, submit a request to the
ACTIVE Net support team.
▪ Path to SSH Private Key: the path to locate the SSH
private key file.
▪ SSH Key Passphrase (optional): enter a passphrase to
use to the SSH Private Key.
8. In the Notifications tab, specify email addresses where you
want the scheduled report to be sent.
9. Click Save.
10. In the Save As window, enter a name for this scheduled job.
11. Click Save.

Page 37 of 51
Editing or deleting an existing schedule for a report
Note: If your ACTIVE Net user account does not have Full Access to the
Reports: ACTIVE Net Insights system user profile function option, then
you cannot edit or delete report schedules.
To edit or delete the schedule for a report:
1. Choose one of the following:
a. On the Repository page, navigate to the folder where
your report is located, so that its title displays on the
page. Click the Schedule Report icon to the left of
a report’s name.
b. Go to View > Schedules and search for the report
schedule.
2. On the Scheduled Jobs page, choose one of the following:
3. To edit an existing schedule, click the pencil icon at the
right of a scheduled job.
4. To delete an existing scheduled job, click the (X button) to
the right of a scheduled job.
5. To temporarily disable a scheduled job without deleting its
information, clear the Enabled box at the right of a scheduled
job.

Page 38 of 51
Running scheduled jobs now
Note: If your ACTIVE Net user account does not have Full Access to the
Reports: ACTIVE Net Insights system user profile function option, then
you cannot edit or delete report schedules.
To run the scheduled jobs for a report right now instead of waiting for
the scheduled time, click Run Now on the Scheduled Jobs page. You
can use the Run Now button to test out your scheduled report and make
sure it works as planned prior to the actual scheduled time.

Page 39 of 51
Ad Hoc reporting
Ad hoc reporting is recommended to be used by Advanced / Power users.
Overall layout
The Ad Hoc Editor page
The Ad Hoc Editor is the page in ACTIVE Net Insights where you can
view, edit, and save ad hoc views as tables, charts, and crosstabs.
The Ad Hoc editor contains the following areas:
1. Data Selection panel: Lists the fields that you have chosen to be
available in your ad hoc view. The Fields section includes non-
numerical data, while the Measures section includes numerical
data.
Click the button to the left of the heading in the Data
Selection area to hide or display the Data Selection area.
2. Filters panel: Lists the filters that are currently being applied to
the information in your ad hoc view.
Click the button to the left of the heading in the Filters area
to hide or display the Filters area.
3. Toolbar: Includes buttons and lists to manage your ad hoc view
and specify how it displays.

Page 40 of 51
a. Display: Toggle between design and display
modes.
b. Save: Save your ad hoc view as a view and/or as a
report.
c. Export: Export your ad hoc view as a report to one
of several available formats.
d. Undo: Undo your most recent action.
e. Redo: Redo an action that you have just undone
using the Undo button.
f. Undo All: Undo all of your actions for this ad hoc
view and go back to the last state that was saved.
g. Switch Group: Switch columns and rows. The data
in the ad hoc view will remain the same, but it will be
reoriented so that columns become rows and rows
become columns.
h. Sort: Sort one or more columns in the ad hoc view.
i. Input Controls: Open the Input Controls window
for this ad hoc view.
j. Page Properties: Choose whether to display the
title bar and/or layout band.
k. SQL Query: View the SQL query behind this ad hoc
view.
4. Layout band: Displays the fields that are currently being used to
display information in your ad hoc view.
5. Canvas area: Displays your ad hoc view itself.

Page 41 of 51
Report page
To see the report page, run any ad hoc report in ACTIVE Net Insights.
The report page includes the following elements:
• Refresh – Refresh the report with the latest data.
• Page controls – Enter a page
number or use the navigation buttons to go to a specific page in
the report.
Note: Page controls only display if your report spans multiple
pages.
• Zoom controls – Use the +/- buttons or the
dropdown list to specify how large you want the report to display
on the page.
• Search controls – Enter text to search
for in the report, and use the arrow buttons to navigate forward
and back through search results.
• Back – Click Back to go back to whatever page you ran
this report from.
• Save – Save the customizations you have made to a new
report so that you can easily access them again in the future.
Note: If your ACTIVE Net user account does not have Full
Access to the Reports: ACTIVE Net Insights system user
profile function option, then you cannot save report
customizations.
• Export – Export the data in this report to a file that you can
open in an external application.
• Undo/redo controls – Undo your most recent
report action, or redo an action you have just undone.
• Options – Modify this report’s input controls so that you can
change the filters being used to narrow down report data.

Page 42 of 51
Creating an ad hoc view
An ad hoc view is different from a regular report. Instead, it is a kind of template
that specifies which data and layout to use for reports that are based on this
view.
You can use an ad hoc view to create your own reports from scratch, but you can
also use it on its own to preview your data dynamically. Use ad hoc views to
create tables, charts, and crosstabs based on the data that you choose to include
in the view.
A domain contains a group of related fields that you can choose to include in
your ad hoc view. It is not possible to include information in your ad hoc view
unless that information is a part of the domain that you have selected for the
view.
For the details for the domains, see the ACTIVE Net Insights ad hoc reports user
guide.
To create an ad hoc view:
1. Go to Create > Ad Hoc View.
2. In the Select Data window, select a domain to use.
3. Click Choose Data….

Page 43 of 51
4. On the Data Chooser page, select the fields in this domain that
you want to be available for your ad hoc view to use, and move
them from the Source list to the Selected Fields list. Use the Ctrl
and Shift keys to select multiple fields.
Note: To select all available fields for your ad hoc view, click the
(double arrow) button.
5. Click OK.
6. The Ad Hoc Editor appears, with the fields that you selected
listed in the panel on the left.
For how to create a table, chart and crosstab in ad hoc views, see
the ACTIVE Net Insights ad hoc reports user guide.

Page 44 of 51
Opening an existing ad hoc view
To open an ad hoc view that you have already saved:
1. Go to View > Repository.
2. Click the folder for your organization.
3. A list of your organization’s saved reports and ad hoc views
appears.
4. Click the name of the ad hoc view that you want to open.
Note: If you edit an ad hoc view that already has reports associated with
it, then those reports will pick up any changes that you make to the ad
hoc view that they are based on.

Page 45 of 51
Saving an ad hoc view
To save your ad hoc view so that you can return to it in the future:
1. Hover over the Save button.
2. Click Save Ad Hoc View As.
3. Enter a name for your ad hoc view in the Data View Name box.
4. Enter an optional description for your ad hoc view in the Data
view Description box.
5. Specify a location to save your ad hoc view.
6. Click Save.
Saving an ad hoc view and creating a report
To create a report from your saved ad hoc view:
1. Hover over the Save button.
2. Click Save Ad Hoc View and Create Report.
3. In the Save Ad Hoc View and Create Report window:
a. Enter the Report Name.
b. Enter an optional Report Description.
c. Specify the location where you want to save this report.
d. Click Save.

Page 46 of 51
Exporting an ad hoc view
To export your ad hoc view to external systems:
1. Hover over the Export button.
2. Select the format to export your ad hoc view

Page 47 of 51
Creating an ad hoc report from an existing ad hoc view
Ad hoc Report based on an ad hoc view is similar to interactive reports. They are
interactive and personalized versions can be saved.
Before you run an ad hoc report, make sure you have created an ad hoc view.
To create an ad hoc report:
1. Go to Create > Report.
2. Select an ad hoc view from the customized folder.
3. Select the Report Template.
4. Click OK.
Using integrative reports
Refer to Using interactive reports for interactive reporting.

Page 48 of 51
Saving or exporting a report
Saving a report
You can save the report so that you can quickly run it again in the future
with all the same formatting, sorting, and filtering.
Note: If your ACTIVE Net user account does not have Full Access to the
Reports: ACTIVE Net Insights system user profile function option, then
you cannot save report modifications.
To save a report:
1. Hover your mouse over the Save menu at the top of the
report page.
2. Click Save As. The Save As window appears.
3. Enter a unique Name for your custom report.
4. Enter an optional Description.
5. Select a location to save your custom report.
6. Click Save.

Page 49 of 51
Exporting a report
You can export the data in your report to several different file types. To
export a report:
1. Hover your mouse over the Export menu at the top of
the report page.
2. Click the type of file that you want to export the report to:
▪ To export to a PDF file, click As PDF. You will not be
able to manipulate data when it is displayed in PDF
form.
▪ To export to an XLS spreadsheet file, click As Excel.
You will be able to manipulate your data in Excel the
same way you can with other spreadsheets.

Page 50 of 51
▪ To export to a CSV (comma-separated values) file,
click As CSV. You can import this file into
spreadsheet or other compatible software.
▪ To export to an XLSX spreadsheet file, click As XLSX.
This file type corresponds to newer versions of Excel.

Page 51 of 51
Frequently Asked Questions
1. Q: How much data does the interactive report display?
A: Each interactive report enables users to explore max 31 days or 1 month
of data for a single site through a simple and intuitive web browser interface.
2. Q: How much data can the report scheduler generate?
A: The report scheduling can return up to 1 year of data across all selected
sites. Please refer to the Scheduling a report section on how to use the
scheduler.
3. Q: Why does my selection filters reset when I attempt to drilldown into the
interactive report?
A: They may occur if the number of filters you have selected requires a URL
that exceeds Internet Explorer’s maximum URL length of 2083 characters.
4. Q: Why are the data refreshed time and report generated time different?
A: The Data refreshed time and the Report Generated time are based on
different time zones when generated on the output page for a report. In
some cases, the Next Run time on the Scheduled Jobs page may display in
a different time zone from the time it was originally entered on the New
Schedule page.
5. Q: Why do I get an error message when I schedule a report using .xls output?
A: You may encounter errors if scheduled .xls reports contain more than
65,000 rows, because .xls files can only display a maximum of 65,000 rows of
data. We recommend you output scheduled reports using .xlsx file format to
avoid this error message.
6. Q: Why cannot I schedule a report and save to the shared folder?
A: You cannot schedule a report or run in background and save it to the
Shared Folder if the overwrite files check box is not selected.