Active Lifestyle Sector - D. A. Davidson & Co.davidsoncompanies.com/advertising/ECM/IB... · 2016,...
16
Strictly Private & Confidential Active Lifestyle Sector Quarterly Review | Spring 2016 Merger, acquisition, and valuation trends in the public and private active lifestyle markets BALTIMORE – CHICAGO – DENVER – GREAT FALLS – ORANGE COUNTY – PORTLAND – SALT LAKE CITY – SEATTLE
Transcript of Active Lifestyle Sector - D. A. Davidson & Co.davidsoncompanies.com/advertising/ECM/IB... · 2016,...

Strictly Private & Confidential
Active Lifestyle Sector Quarterly Review | Spring 2016 Merger, acquisition, and valuation trends in the public
and private active lifestyle markets
BALTIMORE – CHICAGO – DENVER – GREAT FALLS – ORANGE COUNTY – PORTLAND – SALT LAKE CITY – SEATTLE

Private and Confidential | 2 www.davidsoncompanies.com/ecm/ Page 2
DAVIDSON TEAM
Active Lifestyle Execution Team
Mike Smith Managing Director, Co-Head of Active Lifestyle Investment Banking
(206) 903-8679 [email protected]
Jason Lippenberger Vice President Investment Banking
(206) 903-8672 [email protected]
Nathan Neubauer Analyst Investment Banking
(206) 903-8675 [email protected]
Kirk Swanson Analyst Investment Banking
(206) 903-8676 [email protected]
Private Equity Coverage Bryan Cummings Managing Director, Head of Private
Equity Coverage
(714) 850-8339 [email protected]
Brien Rowe Managing Director, Co-Head of Active Lifestyle Investment Banking
(714) 850-8335 [email protected]
Raya Raphael Analyst Investment Banking
(714) 850-8353 [email protected]
Jacqueline Millen Associate, Private Equity Coverage
(714) 850-8336 [email protected]
Selected Transactions
Sell-Side Advisor
has been acquired by
Sell-Side Advisor*
has been acquired by
has entered a strategic
partnership with
Sell-Side Advisor
Co-Manager
$1.0 billion
Secondary Offering
Sell-Side Advisor*
has been acquired by
Shanghai Acquisition
Corporation
Sell-Side Advisor
has been acquired by
Kanders & Company
Sell-Side Advisor
has been acquired by
Co-Manager
$126.5 million
Secondary Offering
Sell-Side Advisor
has been acquired by
Sell-Side Advisor
has been acquired by
Sell-Side Advisor*
has been acquired by
Sell-Side Advisor
has been acquired by
Sell-Side Advisor*
has completed a
recapitalization with
Sell-Side Advisor*
has completed a
recapitalization with
Buy-Side Advisor*
together with
Acquired
Fox Head, Inc.
* Transactions completed by current D.A. Davidson professional prior to joining the firm.
Sell-Side Advisor
have been acquired by
Private Investors
Buy-Side Advisor
has acquired
Co-Manager
$132.1 million
Initial Public Offering
has been acquired by
Sell-Side Advisor
a portfolio company of
Co-Manager
$76.6 million
Secondary Offering
Private and Confidential | 3 www.davidsoncompanies.com/ecm/ Page 3
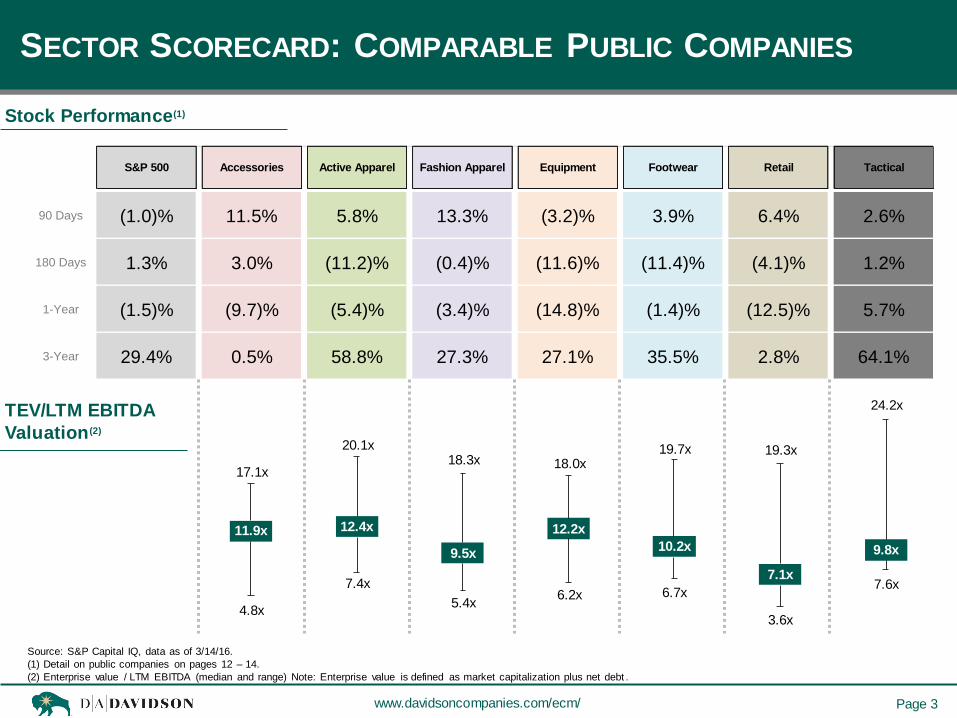
SECTOR SCORECARD: COMPARABLE PUBLIC COMPANIES
Stock Performance(1)
TEV/LTM EBITDA
Valuation(2)
Source: S&P Capital IQ, data as of 3/14/16.
(1) Detail on public companies on pages 12 – 14.
(2) Enterprise value / LTM EBITDA (median and range) Note: Enterprise value is defined as market capitalization plus net debt .
17.1x
4.8x
11.9x
6.6x
20.1x
7.4x
12.4x
18.3x
5.4x
9.5x
18.0x
6.2x
12.2x
19.7x
6.7x
10.2x
19.3x
3.6x
7.1x
24.2x
7.6x
9.8x
S&P 500 Accessories Active Apparel Fashion Apparel Equipment Footwear Retail Tactical
90 Days (1.0)% 11.5% 5.8% 13.3% (3.2)% 3.9% 6.4% 2.6%
180 Days 1.3% 3.0% (11.2)% (0.4)% (11.6)% (11.4)% (4.1)% 1.2%
1-Year (1.5)% (9.7)% (5.4)% (3.4)% (14.8)% (1.4)% (12.5)% 5.7%
3-Year 29.4% 0.5% 58.8% 27.3% 27.1% 35.5% 2.8% 64.1%

Private and Confidential | 4 www.davidsoncompanies.com/ecm/ Page 4
CURRENT EVENT INSIGHTS & COMMENTARY
Active Lifestyle stocks appreciate in February, beating the S&P 500(1) – On average, Active Lifestyle stocks increased 3.5% in February,
beating both the S&P 500, which decreased 0.4%, and the S&P 500 Consumer Index, which rose 0.2%. Year-to-date, Active Lifestyle stocks
are up 0.8%, outperforming both the S&P 500 (-5.5%), and the broader Consumer Index (-5.1%). On a 12 month rolling basis, the
Active Lifestyle space has declined 7.2% on average, outpacing the S&P 500’s 8.2% loss, but trailing the S&P 500 Consumer Index’s
1.9% decline.
The retail landscape is rapidly evolving and forward looking retailers are the winners – Retailers will continue to adopt and deploy new
technology in order to remain competitive. Cloud technology will be one of the technologies that retailers will embrace in the coming few years.
Additionally, the Internet of Things (IoT) is set to disrupt the retail industry even further by enabling the collection and analysis of data. This
technology will equip retailers with a powerful tool that will allow them to create, collect, and act upon new sorts of data, giving them the
opportunity to alter future action in valuable ways.
Currency translation headwinds remain, but paused in February – During the month of February, the USD appreciated against the GBP
(+3.0%) and EUR (+0.1%), and depreciated against the AUD (-1.0%), CAD (-3.3%), and JPY (-6.8%). The strong dollar is boosting U.S.
consumers' purchasing power, yet exerting pressure on the sales of companies who export, manufacture overseas, or sell to large multinational
companies.
Macroeconomic pressures hit luxury stores in the U.S. – A volatile stock market, weak global growth, and a stronger U.S. dollar have
hampered luxury stores’ sales. As the new year begins, the U.S. dollar continues to appreciate against major currencies, discouraging
foreigners from visiting and spending in the United States. Additionally, China’s slowdown has also adversely affected luxury stores’ sales.
According to China Daily, consumers in China spent $116.8 billion (or 46% of the global volume of high-end goods) on luxury goods abroad in
2015. With a less than ideal start to 2016 for the U.S. stock market and continued volatility in the Chinese stock market, luxury
retailers will be challenged in the year ahead.
(1) Active Lifestyle space based on D.A. Davidson research coverage: BDE, CAB, COLM, ELY, FOXF, GIL, HBI, JAH, LULU, NKE, NLS , PSG, SKUL, SPWH, UA, VFC, WWW. Data as of 3/1/16.
Source: D.A. Davidson Equity Research, Women’s Wear Daily, Deloitte, China Daily.
Industry Insights

Private and Confidential | 5 www.davidsoncompanies.com/ecm/ Page 5
INDUSTRY INSIGHT & TRENDS: OVERVIEW
Middle market M&A continues improvement – Middle market M&A activity increased for the third consecutive quarter, with the
number of transactions and dollar volume rising 8.6% and 7.3%, respectively, in Q4 2015 versus Q3 2015. However, middle
market M&A activity for 2015 is down significantly from 2014 - dollar volume is down 25.6% and overall transactions are down
32.3%.
Consumer M&A beating overall market – While overall middle market M&A activity has dropped significantly in 2015 compared to
2014, middle market consumer M&A activity has only dipped slightly. Deal count is down 9.9% and dollar volume is down 5.5%
in 2015 compared to 2014.
Leisure Products industry outperforms – Leisure Products has been one of the best performing industries since the start of the
2016, up 18.8%. The YTD worst performing industries include Real Estate Management and Development, Biotechnology, and
Banks.
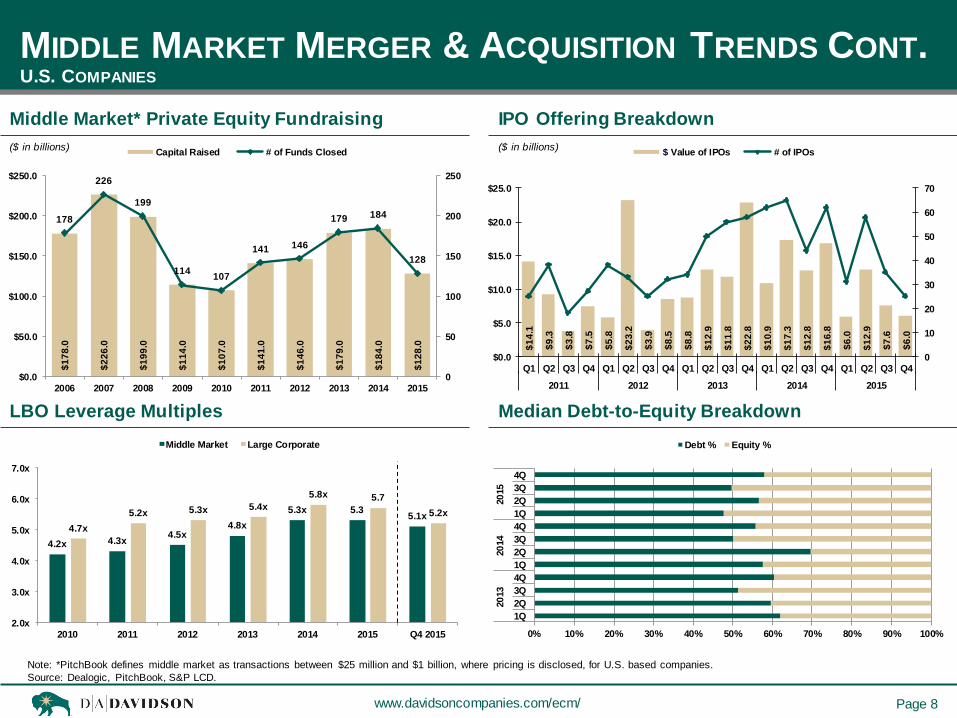
IPO market lost momentum – Continued volatility in the equity markets resulted in a significant slowdown in public offering activity,
with the IPO market experiencing the steepest declines. In 2014 $57.8 billion was raised through 233 IPOs, compared to 2015
where these figures dropped to $32.5 billion raised through 149 IPOs.
Major indices continue struggle – Tepid economic data and company earnings coupled with commodity price fluctuations
contributed to further volatility in the U.S. equity markets. YTD as of March 14, 2016 the S&P 500 Index and the Russell 2000 Index
are down 1.2% and 4.5%, respectively.
Debt and equity levels – The debt proportion of deals completed during the final quarter of 2015 was 58.0%, a significant jump
compared to the 49.7% figure clocked in 3Q and exceeding any other quarter of the year. This reinforces the point that dealmakers
are still willing to pay premiums for certain transactions, as well as the availability of debt higher up in the quality spectrum.
Leverage for large deals challenging – Industry conversations suggest debt syndication is down, which makes financing for large
deals more challenging. Middle market transactions are less affected.
Note: Middle-market defined as transactions between $10 and $500 million where pricing is disclosed.
Source: D.A. Davidson “DealMaker” Report, PitchBook, S&P Capital IQ.
M&A and Public Offering Trends

Private and Confidential | 6 www.davidsoncompanies.com/ecm/ Page 6
INDUSTRY INSIGHT & TRENDS: OVERVIEW
Gross Domestic Product – U.S. real GDP grew 0.2% quarter-over-quarter, from $16.41 trillion in the third quarter of 2015 to $16.45
trillion in the fourth quarter of 2015. U.S. GDP is forecasted to grow by 2.8% in 2016, compared to 2.7% in 2015. The World Bank
expects the world economy to grow by 3.3% in 2016, and expects global economic growth to be 3.2% in 2017.
Inflation – The CPI decreased 0.6% quarter-over-quarter, from 237.9 in September 2015 to 236.5 in December 2015. However, the CPI
increased slightly to 236.9 in January 2016 from 236.5 in December 2015. Through the 12 months ended January 2016, U.S.
inflation was 1.4% and U.S. core inflation (less food and energy) was 2.2%. Both inflation and core inflation have increased quarter-over-
quarter from 0.0% in September to 0.7% in December, and from 1.9% in September to 2.1% in December, respectively.
Consumer – Americans’ average self-reported daily spending declined 18.2% to $81 in January 2016, down from $99 in
December 2015. This decline is typical of the post-holiday spending patterns. This year’s average January spending ties with January
2015 for the highest average for the month since January 2008. Consumer confidence dropped from 97.2 in January to 92.2 in
February. This represents a 6% decrease month-over-month.
Same Store Sales – Total U.S. retail same-store sales were down 1.4% year-over-year, from December 2014 to December 2015.
However, same store sales for U.S. apparel retailers(1) increased over the same period by 6.7%.
Retail Sales – U.S. retail sales declined 0.1% in December 2015 from November 2015, following a 0.4% rise in the previous period. This
was mainly due to softer winter sales. Month-over-month, retail sales remained flat at 0.2% from December 2015 to January 2016.
E-Commerce Sales – U.S. retail e-commerce sales for the fourth quarter of 2015 were $89.1 billion, which represent an increase of
2.1% from the third quarter of 2015. Fourth quarter 2015 e-commerce retail sales increased 14.7% from fourth quarter 2014, while
total retail sales increased 1.3% over the same period. E-commerce sales in the fourth quarter of 2015 accounted for 7.5% of total
retail sales.
Price Trends – U.S. apparel CPI has declined 4.5% quarter-over-quarter, from 128.5 in September 2015 to 122.8 in December 2015 and
0.8% month-over-month, from 122.8 in December 2015 to 121.9 in January 2016. Year-over-year, apparel CPI has declined 0.5%.
Macroeconomic Trends
Microeconomic Trends
(1) U.S. apparel retailers include Gap, Banana Republic, Old Navy, L Brands, Victoria's Secret, Bath & Body Works, Stein Mart, and Cato Corp. Date as of 1/7/16.
Source: S&P Capital IQ, World Bank, Bureau of Labor Statistics, Gallup, Trading Economics.

Private and Confidential | 7 www.davidsoncompanies.com/ecm/ Page 7
$6.0
$4.1 $4.3
$2.5
$5.6
$3.3
$6.1
$2.8
$6.5
$2.1
$4.6
$5.3
$4.5
$3.8
$8.2
$2.1
$0.0
$1.0
$2.0
$3.0
$4.0
$5.0
$6.0
$7.0
$8.0
$9.0
Consumer Energy &Utilities
Financials Healthcare Industrials& Materials
Real Estate Technology& Telecom
Other
Q4 2014 Q4 2015
Middle Market Consumer M&A Deal Activity
Middle Market M&A Transactions
MIDDLE MARKET MERGER & ACQUISITION TRENDS
Middle Market M&A by Industry
Middle Market Consumer EV/EBITDA Multiples
U.S. COMPANIES
Note: Middle-market defined as transactions between $10 and $500 million where pricing is disclosed. Deals in this report are for announced transactions in the quarter of interest involving U.S. based companies. Source: S&P Capital IQ.
($ in billions) ($ in billions)
($ in billions)
$3
4.4
$4
2.6
$3
9.1
$5
0.8
$2
9.0
$3
7.9
$4
5.0
$5
2.6
$4
0.0
$5
2.3
$3
7.4
$3
4.7
$2
5.0
$2
5.6
$3
4.6
$3
7.1
461
541 588
678
438
513
655 680
567
680
365 337
283 312
347 377
0
100
200
300
400
500
600
700
$0.0
$10.0
$20.0
$30.0
$40.0
$50.0
$60.0
Q1 Q2 Q3 Q4 Q1 Q2 Q3 Q4 Q1 Q2 Q3 Q4 Q1 Q2 Q3 Q4
2012 2013 2014 2015
Volume ($B) Deal Count
11.3x
12.7x
9.1x
13.1x 13.6x
9.3x
0.0x
2.0x
4.0x
6.0x
8.0x
10.0x
12.0x
14.0x
16.0x
2010 2011 2012 2013 2014 2015
$2
2.5
$2
7.9
$3
0.7
$2
8.8
$3
1.4
$2
9.7
308
347 366 376
393
354
0
100
200
300
400
500
$10.0
$15.0
$20.0
$25.0
$30.0
$35.0
2010 2011 2012 2013 2014 2015
Volume ($B) Deal Count
Private and Confidential | 8 www.davidsoncompanies.com/ecm/ Page 8
4.2x 4.3x 4.5x
4.8x
5.3x 5.3 5.1x
4.7x
5.2x 5.3x 5.4x
5.8x 5.7
5.2x
2.0x
3.0x
4.0x
5.0x
6.0x
7.0x
2010 2011 2012 2013 2014 2015 Q4 2015
Middle Market Large Corporate
$1
4.1
$9
.3
$3
.8
$7
.5
$5
.8
$2
3.2
$3
.9
$8
.5
$8
.8
$1
2.9
$1
1.8
$2
2.8
$1
0.9
$1
7.3
$1
2.8
$1
6.8
$6
.0
$1
2.9
$7
.6
$6
.0
0
10
20
30
40
50
60
70
$0.0
$5.0
$10.0
$15.0
$20.0
$25.0
Q1 Q2 Q3 Q4 Q1 Q2 Q3 Q4 Q1 Q2 Q3 Q4 Q1 Q2 Q3 Q4 Q1 Q2 Q3 Q4
2011 2012 2013 2014 2015
$ Value of IPOs # of IPOs
$1
78
.0
$2
26
.0
$1
99
.0
$1
14
.0
$1
07
.0
$1
41
.0
$1
46
.0
$1
79
.0
$1
84
.0
$1
28
.0
178
226
199
114 107
141 146
179 184
128
0
50
100
150
200
250
$0.0
$50.0
$100.0
$150.0
$200.0
$250.0
2006 2007 2008 2009 2010 2011 2012 2013 2014 2015
Capital Raised # of Funds Closed
LBO Leverage Multiples
Middle Market* Private Equity Fundraising
MIDDLE MARKET MERGER & ACQUISITION TRENDS CONT.
IPO Offering Breakdown
Median Debt-to-Equity Breakdown
U.S. COMPANIES
Note: *PitchBook defines middle market as transactions between $25 million and $1 billion, where pricing is disclosed, for U.S. based companies.
Source: Dealogic, PitchBook, S&P LCD.
($ in billions)
0% 10% 20% 30% 40% 50% 60% 70% 80% 90% 100%
1Q
2Q
3Q
4Q
1Q
2Q
3Q
4Q
1Q
2Q
3Q
4Q
20
13
20
14
20
15
Debt % Equity %
($ in billions)

Private and Confidential | 9 www.davidsoncompanies.com/ecm/ Page 9
MERGER & ACQUISITION SELECTED TRANSACTIONS
Seattle, WA Confidential
Develops and produces apparel,
outerwear, headwear and handwear
products for outdoor activities
Union Bay Capital Partners has finalized the sale of POW Gloves, Holden
Outerwear, and Spacecraft Collective, three brands under the POW
Holdings umbrella, to various buyers
D.A. Davidson & Co. acted as exclusive sell-side financial advisor to
POW Holdings in this transaction
Minnetonka, MN Sharon Hill, PA
El Paso, TX Bend, OR
The company offers hydration vests,
belts, handhelds, bottles, running
packs
Acquisition provides Shock Doctor and McDavid channel growth within
run specialty retailers
United Sports Brands is majority-owned by investment firm Bregal
Partners
D.A. Davidson & Co. acted as exclusive sell-side financial advisor to
NATHAN Sports in this transaction
Manufactures double wall vacuum
insulated stainless steel water bottles
The purchase price is expected to be approximately $210 million in cash,
implying a pre-synergy multiple of approximately 11.5x projected calendar
year 2016 adjusted EBITDA
Hydro Flask has more than quadrupled in size since the beginning of
calendar year 2014, grew over 50% in calendar year 2015, and has been
the key driver behind the majority of the growth of the category itself
Source: S&P Capital IQ, SportsOneSource.
Tustin, CA Midvale, UT
Provides battery cases, battery and
storage products, universal batteries,
belt clips, docks, and cables and
adapters
Transaction was announced at $105.0 million
Mophie CEO Daniel Huang and COO Shawn Dougherty will maintain their
current responsibilities and will report directly to ZAGG CEO Randy Hales
D.A. Davidson & Co. acted as exclusive buy-side financial advisor to
ZAGG in this transaction
Target Acquirer Target Description Deal Notes
RECENT M&A DEAL ACTIVITY
London, UK London, UK
Operates as a retailer of luxury shoes
and accessories for men, women, and
kids
Transaction was announced at £245.0 million, resulting in a multiple of
8.2x last year’s earnings
Kurt Geiger, which operates in 80 countries and employs 1,700 people,
had sales of £260 million in 2014
The sale represents another step in the break-up of Jones Group, a
sprawling US fashion group, by Sycamore Partners
Separate Private
Investors

Private and Confidential | 10 www.davidsoncompanies.com/ecm/ Page 10
MERGER & ACQUISITION SELECTED TRANSACTIONS
Brooklyn Park, MN Vancouver, WA
Manufactures fitness equipment,
including standing, recumbent, and
lateral elliptical machines; and zero
runner equipment
Transaction was announced at approximately $115.0 million
The acquisition funded with a combinations of cash on hand and from
proceeds of a new $80 million term loan
The transaction adds a leading fitness brand, unique products and
technologies, broadens distribution and deepens Nautilus’ talent pool
Sante Fe Springs, CA San Diego, CA
Atlanta, GA Boca Raton, FL
Designs and manufactures protective
gear, including helmets, kneepads,
gloves, armpads, and ankle braces for
skateboarding, biking, BMX,
watersports, and other extreme
sporting activities
Pro-Tec is the first major acquisition since Transom Capital Group has
been at the helm of Bravo Sports
Pro-Tec will be moving day-to-day operations to Bravo Sports’ South
Orange County campus
Other Bravo Sports action sports brands include SixSixOne and ONE
Industries
Designs, manufactures, markets, and
distributes consumer products
worldwide
Transaction was announced at approximately $13.2 billion, or 2.1x LTM
revenue and 20.0x LTM EBITDA multiple
Substantial revenue synergies and $500 million cost synergies over four
years
New company to be called Newell Brands
Source: S&P Capital IQ, SportsOneSource.
Scotts Valley, CA Clearfield, UT
Engages in the design, development,
and marketing of branded sports
equipment, protective products, and
related accessories worldwide
Transaction was announced at $400.0 million, resulting in a effective
multiple of approximately 10x the expected calendar year 2016 EBITDA
The Bell, Giro, C-Preme and Blackburn brands will be integrated into
Vista's Outdoor Products segment
The acquisition of BRG Sports’ Action Sports division will include more
than 600 employees
Target Acquirer Target Description Deal Notes
RECENT M&A DEAL ACTIVITY
Ontario, CA Buffalo, NY
Operates as a retailer and distributor
of equipment, tactical gear and
uniforms for law enforcement and
public safety professionals
With the acquisition of United Uniform, Safariland enhances its position
as a leading global provider of safety and survivability products
Safariland has expanded its geographic footprint to 11 retail stores,
establishing itself as the premier provider of law enforcement equipment
to institutions and retail customers in the Eastern U.S.
Transaction is Safariland Group’s third acquisition since January 2015
Action Sports Division

Private and Confidential | 11 www.davidsoncompanies.com/ecm/ Page 11
MERGER & ACQUISITION SELECTED TRANSACTIONS
New York City, NY Toronto, ON
Online, membership-based retailer of
luxury goods, such as fashion
apparel, home décor, footwear,
jewelry, and handbags
Represents Hudson Bay’s ongoing focus on advancing its all-channel
model while continuing to grow its off-price business
Hudson Bay expects Gilt to contribute approximately $40 million of
adjusted EBITDA by FY 2017
Transaction funded with cash on hand
Lake Forest, IL Medway, MA
Columbus, OH San Diego, CA
Developer and manufacturer of
strength, cardiovascular, and fitness
equipment products
Acquisition made as part of efforts to double Brunswick Fitness segment
revenue by 2020
Addition of premium brand will provide broader product portfolio, growth
synergies, and cost reduction efficiencies
Retailer of shoes for women, men,
and children
Acquisition made to expand online presence while growing international
business
Ebuys will operate as a distinct business within DSW and will continue to
be led by its chief executive, David Duong
Source: S&P Capital IQ, SportsOneSource.
Newport Beach, CA Aliso Viejo, CA
Develops and manufactures polarized
eyewear products for athletes ranging
from sailing to golf, and from baseball
to fishing
Kaenon will remain a separate entity, led by its Co-Founder and President
Darren Rosenberg
Kaenon designs its products in Orange County and manufactures them in
Italy
Target Target Description Deal Notes
RECENT M&A DEAL ACTIVITY
New York, NY New York, NY
Manufactures and distributes designer
footwear and bags for men and
women
Transaction was announced at approximately $574.0 million or 1.8x LTM
revenue multiple
The largest acquisition ever made by Coach
Acquisition is part of an effort to revamp the Coach’s image amid
declining sales and increased competition
Acquirer

Private and Confidential | 12 www.davidsoncompanies.com/ecm/ Page 12
PUBLIC EQUITY OFFERINGS SELECTED TRANSACTIONS
Source: Dealogic, S&P Capital IQ.
RECENT EQUITY OFFERING ACTIVITY
Belleville, WI
William Blair; Baird; Raymond James; BMO Capital Markets
Offer Date Deal Type Issuer Underwriters Gross Proceeds
$80.0mm Initial Public
Offering 11-19-15
Boca Raton, FL
$490.0mm Follow-On
Offering 10-15-15
$76.6mm Follow-On
Offering 9-24-15
$248.4mm Initial Public
Offering 8-5-15
$1.0bn Follow-On
Offering 7-16-15
Barclays; Credit Suisse; UBS Investment Bank; RBC Capital
Markets; SunTrust Robinson Humphrey; Wells Fargo
Securities; Deutsche Bank Securities; Citigroup; CJS
Securities; BTIG; Raymond James; D.A. Davidson & Co.;
KeyBanc Capital Markets
Credit Suisse; Goldman, Sachs & Co.; Baird; William Blair;
Piper Jaffray; Wells Fargo Securities; D.A. Davidson & Co.;
Sterne Agee CRT
J.P. Morgan; BofA Merrill Lynch; Jefferies; Credit Suisse;
Guggenheim Securities; Baird; William Blair; Piper Jaffray;
Cowen and Company
Barclays; Credit Suisse; UBS Investment Bank; RBC Capital
Markets; SunTrust Robinson Humphrey; Wells Fargo
Securities; Citigroup; CJS Securities; Deutsche Bank
Securities; Jefferies; William Blair; BTIG; D.A. Davidson &
Co.; KeyBanc Capital Markets; Raymond James
Midvale, UT
Newington, NH
Boca Raton, FL
Private and Confidential | 13 www.davidsoncompanies.com/ecm/ Page 13
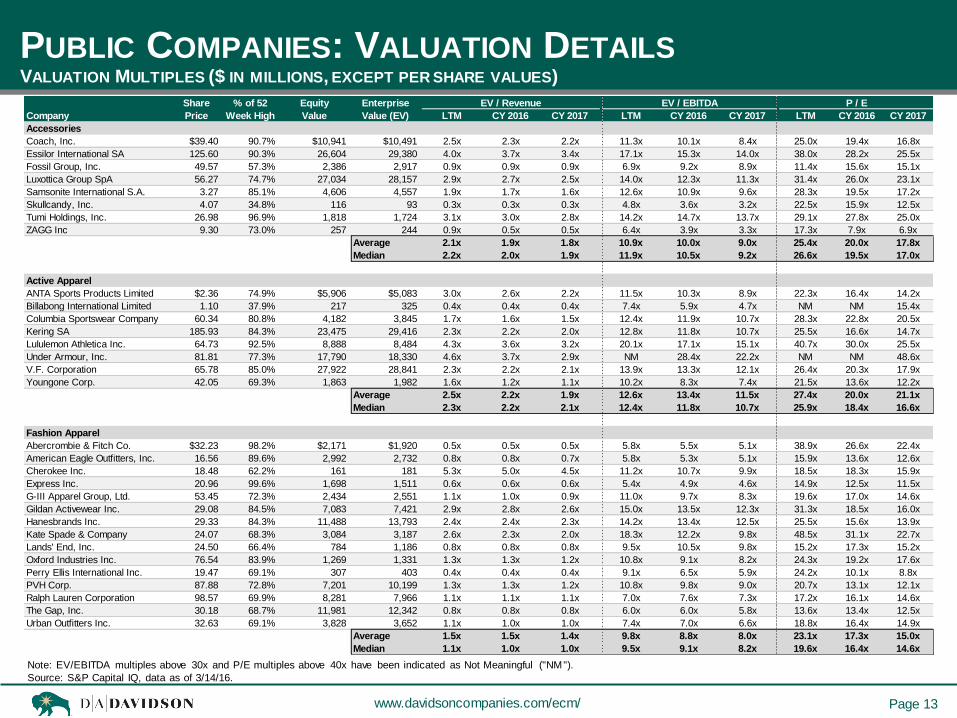
Accessories
Coach, Inc. $39.40 90.7% $10,941 $10,491 2.5x 2.3x 2.2x 11.3x 10.1x 8.4x 25.0x 19.4x 16.8x
Essilor International SA 125.60 90.3% 26,604 29,380 4.0x 3.7x 3.4x 17.1x 15.3x 14.0x 38.0x 28.2x 25.5x
Fossil Group, Inc. 49.57 57.3% 2,386 2,917 0.9x 0.9x 0.9x 6.9x 9.2x 8.9x 11.4x 15.6x 15.1x
Luxottica Group SpA 56.27 74.7% 27,034 28,157 2.9x 2.7x 2.5x 14.0x 12.3x 11.3x 31.4x 26.0x 23.1x
Samsonite International S.A. 3.27 85.1% 4,606 4,557 1.9x 1.7x 1.6x 12.6x 10.9x 9.6x 28.3x 19.5x 17.2x
Skullcandy, Inc. 4.07 34.8% 116 93 0.3x 0.3x 0.3x 4.8x 3.6x 3.2x 22.5x 15.9x 12.5x
Tumi Holdings, Inc. 26.98 96.9% 1,818 1,724 3.1x 3.0x 2.8x 14.2x 14.7x 13.7x 29.1x 27.8x 25.0x
ZAGG Inc 9.30 73.0% 257 244 0.9x 0.5x 0.5x 6.4x 3.9x 3.3x 17.3x 7.9x 6.9x
Average 2.1x 1.9x 1.8x 10.9x 10.0x 9.0x 25.4x 20.0x 17.8x
Median 2.2x 2.0x 1.9x 11.9x 10.5x 9.2x 26.6x 19.5x 17.0x
Active Apparel
ANTA Sports Products Limited $2.36 74.9% $5,906 $5,083 3.0x 2.6x 2.2x 11.5x 10.3x 8.9x 22.3x 16.4x 14.2x
Billabong International Limited 1.10 37.9% 217 325 0.4x 0.4x 0.4x 7.4x 5.9x 4.7x NM NM 15.4x
Columbia Sportswear Company 60.34 80.8% 4,182 3,845 1.7x 1.6x 1.5x 12.4x 11.9x 10.7x 28.3x 22.8x 20.5x
Kering SA 185.93 84.3% 23,475 29,416 2.3x 2.2x 2.0x 12.8x 11.8x 10.7x 25.5x 16.6x 14.7x
Lululemon Athletica Inc. 64.73 92.5% 8,888 8,484 4.3x 3.6x 3.2x 20.1x 17.1x 15.1x 40.7x 30.0x 25.5x
Under Armour, Inc. 81.81 77.3% 17,790 18,330 4.6x 3.7x 2.9x NM 28.4x 22.2x NM NM 48.6x
V.F. Corporation 65.78 85.0% 27,922 28,841 2.3x 2.2x 2.1x 13.9x 13.3x 12.1x 26.4x 20.3x 17.9x
Youngone Corp. 42.05 69.3% 1,863 1,982 1.6x 1.2x 1.1x 10.2x 8.3x 7.4x 21.5x 13.6x 12.2x
Average 2.5x 2.2x 1.9x 12.6x 13.4x 11.5x 27.4x 20.0x 21.1x
Median 2.3x 2.2x 2.1x 12.4x 11.8x 10.7x 25.9x 18.4x 16.6x
Fashion Apparel
Abercrombie & Fitch Co. $32.23 98.2% $2,171 $1,920 0.5x 0.5x 0.5x 5.8x 5.5x 5.1x 38.9x 26.6x 22.4x
American Eagle Outfitters, Inc. 16.56 89.6% 2,992 2,732 0.8x 0.8x 0.7x 5.8x 5.3x 5.1x 15.9x 13.6x 12.6x
Cherokee Inc. 18.48 62.2% 161 181 5.3x 5.0x 4.5x 11.2x 10.7x 9.9x 18.5x 18.3x 15.9x
Express Inc. 20.96 99.6% 1,698 1,511 0.6x 0.6x 0.6x 5.4x 4.9x 4.6x 14.9x 12.5x 11.5x
G-III Apparel Group, Ltd. 53.45 72.3% 2,434 2,551 1.1x 1.0x 0.9x 11.0x 9.7x 8.3x 19.6x 17.0x 14.6x
Gildan Activewear Inc. 29.08 84.5% 7,083 7,421 2.9x 2.8x 2.6x 15.0x 13.5x 12.3x 31.3x 18.5x 16.0x
Hanesbrands Inc. 29.33 84.3% 11,488 13,793 2.4x 2.4x 2.3x 14.2x 13.4x 12.5x 25.5x 15.6x 13.9x
Kate Spade & Company 24.07 68.3% 3,084 3,187 2.6x 2.3x 2.0x 18.3x 12.2x 9.8x 48.5x 31.1x 22.7x
Lands' End, Inc. 24.50 66.4% 784 1,186 0.8x 0.8x 0.8x 9.5x 10.5x 9.8x 15.2x 17.3x 15.2x
Oxford Industries Inc. 76.54 83.9% 1,269 1,331 1.3x 1.3x 1.2x 10.8x 9.1x 8.2x 24.3x 19.2x 17.6x
Perry Ellis International Inc. 19.47 69.1% 307 403 0.4x 0.4x 0.4x 9.1x 6.5x 5.9x 24.2x 10.1x 8.8x
PVH Corp. 87.88 72.8% 7,201 10,199 1.3x 1.3x 1.2x 10.8x 9.8x 9.0x 20.7x 13.1x 12.1x
Ralph Lauren Corporation 98.57 69.9% 8,281 7,966 1.1x 1.1x 1.1x 7.0x 7.6x 7.3x 17.2x 16.1x 14.6x
The Gap, Inc. 30.18 68.7% 11,981 12,342 0.8x 0.8x 0.8x 6.0x 6.0x 5.8x 13.6x 13.4x 12.5x
Urban Outfitters Inc. 32.63 69.1% 3,828 3,652 1.1x 1.0x 1.0x 7.4x 7.0x 6.6x 18.8x 16.4x 14.9x
Average 1.5x 1.5x 1.4x 9.8x 8.8x 8.0x 23.1x 17.3x 15.0x
Median 1.1x 1.0x 1.0x 9.5x 9.1x 8.2x 19.6x 16.4x 14.6x
PUBLIC COMPANIES: VALUATION DETAILS
Note: EV/EBITDA multiples above 30x and P/E multiples above 40x have been indicated as Not Meaningful ("NM").
Source: S&P Capital IQ, data as of 3/14/16.
VALUATION MULTIPLES ($ IN MILLIONS, EXCEPT PER SHARE VALUES)
Share % of 52 Equity Enterprise EV / Revenue EV / EBITDA P / E
Company Price Week High Value Value (EV) LTM CY 2016 CY 2017 LTM CY 2016 CY 2017 LTM CY 2016 CY 2017
Private and Confidential | 14 www.davidsoncompanies.com/ecm/ Page 14
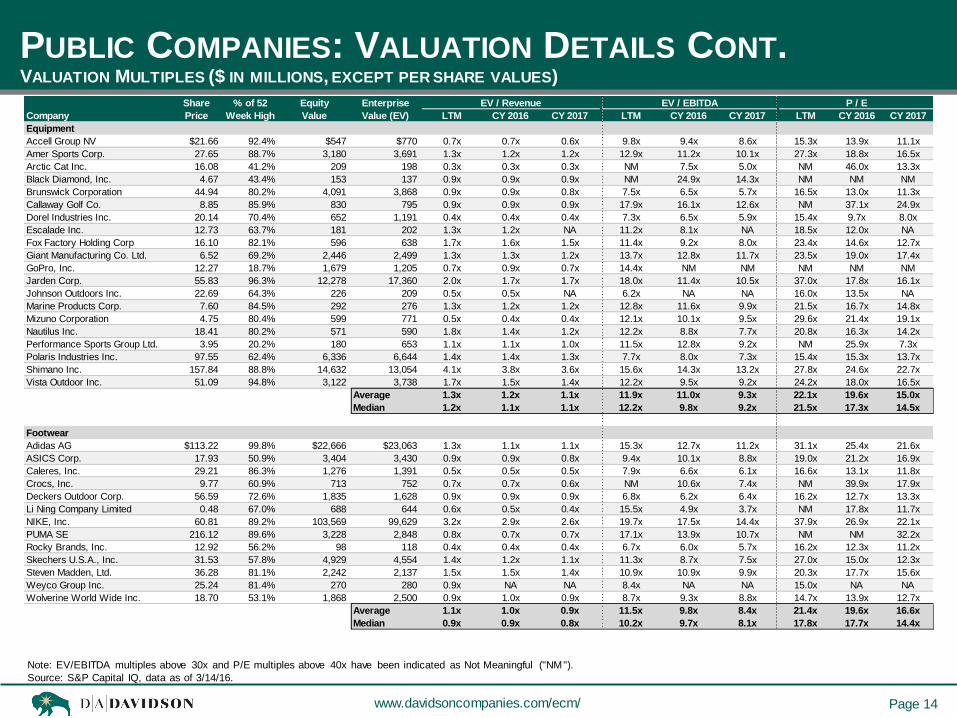
Equipment
Accell Group NV $21.66 92.4% $547 $770 0.7x 0.7x 0.6x 9.8x 9.4x 8.6x 15.3x 13.9x 11.1x
Amer Sports Corp. 27.65 88.7% 3,180 3,691 1.3x 1.2x 1.2x 12.9x 11.2x 10.1x 27.3x 18.8x 16.5x
Arctic Cat Inc. 16.08 41.2% 209 198 0.3x 0.3x 0.3x NM 7.5x 5.0x NM 46.0x 13.3x
Black Diamond, Inc. 4.67 43.4% 153 137 0.9x 0.9x 0.9x NM 24.9x 14.3x NM NM NM
Brunswick Corporation 44.94 80.2% 4,091 3,868 0.9x 0.9x 0.8x 7.5x 6.5x 5.7x 16.5x 13.0x 11.3x
Callaway Golf Co. 8.85 85.9% 830 795 0.9x 0.9x 0.9x 17.9x 16.1x 12.6x NM 37.1x 24.9x
Dorel Industries Inc. 20.14 70.4% 652 1,191 0.4x 0.4x 0.4x 7.3x 6.5x 5.9x 15.4x 9.7x 8.0x
Escalade Inc. 12.73 63.7% 181 202 1.3x 1.2x NA 11.2x 8.1x NA 18.5x 12.0x NA
Fox Factory Holding Corp 16.10 82.1% 596 638 1.7x 1.6x 1.5x 11.4x 9.2x 8.0x 23.4x 14.6x 12.7x
Giant Manufacturing Co. Ltd. 6.52 69.2% 2,446 2,499 1.3x 1.3x 1.2x 13.7x 12.8x 11.7x 23.5x 19.0x 17.4x
GoPro, Inc. 12.27 18.7% 1,679 1,205 0.7x 0.9x 0.7x 14.4x NM NM NM NM NM
Jarden Corp. 55.83 96.3% 12,278 17,360 2.0x 1.7x 1.7x 18.0x 11.4x 10.5x 37.0x 17.8x 16.1x
Johnson Outdoors Inc. 22.69 64.3% 226 209 0.5x 0.5x NA 6.2x NA NA 16.0x 13.5x NA
Marine Products Corp. 7.60 84.5% 292 276 1.3x 1.2x 1.2x 12.8x 11.6x 9.9x 21.5x 16.7x 14.8x
Mizuno Corporation 4.75 80.4% 599 771 0.5x 0.4x 0.4x 12.1x 10.1x 9.5x 29.6x 21.4x 19.1x
Nautilus Inc. 18.41 80.2% 571 590 1.8x 1.4x 1.2x 12.2x 8.8x 7.7x 20.8x 16.3x 14.2x
Performance Sports Group Ltd. 3.95 20.2% 180 653 1.1x 1.1x 1.0x 11.5x 12.8x 9.2x NM 25.9x 7.3x
Polaris Industries Inc. 97.55 62.4% 6,336 6,644 1.4x 1.4x 1.3x 7.7x 8.0x 7.3x 15.4x 15.3x 13.7x
Shimano Inc. 157.84 88.8% 14,632 13,054 4.1x 3.8x 3.6x 15.6x 14.3x 13.2x 27.8x 24.6x 22.7x
Vista Outdoor Inc. 51.09 94.8% 3,122 3,738 1.7x 1.5x 1.4x 12.2x 9.5x 9.2x 24.2x 18.0x 16.5x
Average 1.3x 1.2x 1.1x 11.9x 11.0x 9.3x 22.1x 19.6x 15.0x
Median 1.2x 1.1x 1.1x 12.2x 9.8x 9.2x 21.5x 17.3x 14.5x
Footwear
Adidas AG $113.22 99.8% $22,666 $23,063 1.3x 1.1x 1.1x 15.3x 12.7x 11.2x 31.1x 25.4x 21.6x
ASICS Corp. 17.93 50.9% 3,404 3,430 0.9x 0.9x 0.8x 9.4x 10.1x 8.8x 19.0x 21.2x 16.9x
Caleres, Inc. 29.21 86.3% 1,276 1,391 0.5x 0.5x 0.5x 7.9x 6.6x 6.1x 16.6x 13.1x 11.8x
Crocs, Inc. 9.77 60.9% 713 752 0.7x 0.7x 0.6x NM 10.6x 7.4x NM 39.9x 17.9x
Deckers Outdoor Corp. 56.59 72.6% 1,835 1,628 0.9x 0.9x 0.9x 6.8x 6.2x 6.4x 16.2x 12.7x 13.3x
Li Ning Company Limited 0.48 67.0% 688 644 0.6x 0.5x 0.4x 15.5x 4.9x 3.7x NM 17.8x 11.7x
NIKE, Inc. 60.81 89.2% 103,569 99,629 3.2x 2.9x 2.6x 19.7x 17.5x 14.4x 37.9x 26.9x 22.1x
PUMA SE 216.12 89.6% 3,228 2,848 0.8x 0.7x 0.7x 17.1x 13.9x 10.7x NM NM 32.2x
Rocky Brands, Inc. 12.92 56.2% 98 118 0.4x 0.4x 0.4x 6.7x 6.0x 5.7x 16.2x 12.3x 11.2x
Skechers U.S.A., Inc. 31.53 57.8% 4,929 4,554 1.4x 1.2x 1.1x 11.3x 8.7x 7.5x 27.0x 15.0x 12.3x
Steven Madden, Ltd. 36.28 81.1% 2,242 2,137 1.5x 1.5x 1.4x 10.9x 10.9x 9.9x 20.3x 17.7x 15.6x
Weyco Group Inc. 25.24 81.4% 270 280 0.9x NA NA 8.4x NA NA 15.0x NA NA
Wolverine World Wide Inc. 18.70 53.1% 1,868 2,500 0.9x 1.0x 0.9x 8.7x 9.3x 8.8x 14.7x 13.9x 12.7x
Average 1.1x 1.0x 0.9x 11.5x 9.8x 8.4x 21.4x 19.6x 16.6x
Median 0.9x 0.9x 0.8x 10.2x 9.7x 8.1x 17.8x 17.7x 14.4x
PUBLIC COMPANIES: VALUATION DETAILS CONT.
Note: EV/EBITDA multiples above 30x and P/E multiples above 40x have been indicated as Not Meaningful ("NM").
Source: S&P Capital IQ, data as of 3/14/16.
VALUATION MULTIPLES ($ IN MILLIONS, EXCEPT PER SHARE VALUES)
Share % of 52 Equity Enterprise EV / Revenue EV / EBITDA P / E
Company Price Week High Value Value (EV) LTM CY 2016 CY 2017 LTM CY 2016 CY 2017 LTM CY 2016 CY 2017

Private and Confidential | 15 www.davidsoncompanies.com/ecm/ Page 15
Retail
Amazon.com, Inc. $573.37 82.3% $269,967 $267,706 2.5x 2.1x 1.7x NM 18.8x 14.2x NM NM NM
ASOS Plc 45.33 74.3% 3,763 3,592 2.0x 1.8x 1.4x NM 27.4x 21.0x NM NM NM
Big 5 Sporting Goods Corp. 11.41 73.8% 250 302 0.3x 0.3x 0.3x 6.4x 6.4x 5.9x 15.6x 16.7x 13.3x
Cabela's Incorporated 48.22 81.9% 3,270 7,867 2.0x 1.9x 1.8x 17.3x 15.6x 14.4x 17.7x 15.1x 13.6x
Dick's Sporting Goods Inc. 46.71 77.4% 5,371 5,258 0.7x 0.7x 0.6x 7.1x 7.0x 6.2x 16.2x 15.7x 13.4x
eBay Inc. 24.28 36.4% 28,619 29,267 3.4x 3.4x 3.2x 9.9x 8.5x 7.9x 21.5x 13.0x 11.8x
Finish Line Inc. 18.45 63.5% 818 763 0.4x 0.4x 0.4x 5.7x 4.8x 4.6x 14.5x 11.7x 10.6x
Foot Locker, Inc. 64.28 83.2% 8,823 7,932 1.1x 1.0x 1.0x 7.3x 6.7x 6.3x 15.4x 13.5x 12.2x
Gaiam Inc. 5.81 75.0% 142 127 0.7x 0.6x NA 16.4x 6.1x NA NM 16.6x NA
Genesco Inc. 65.96 89.7% 1,457 1,436 0.5x 0.5x 0.5x 6.0x 5.8x 5.3x 15.5x 13.4x 12.1x
Hibbett Sports, Inc. 35.72 64.1% 814 782 0.8x 0.8x 0.7x 6.1x 6.0x 5.7x 12.3x 11.9x 11.2x
Overstock.com Inc. 14.79 57.0% 374 218 0.1x NA NA 19.3x NA NA NM NA NA
Pacific Sunwear of California Inc. 0.15 5.0% 11 131 0.2x 0.2x 0.2x NM NA NA NM NM NM
Sportsman's Warehouse 13.11 87.9% 551 776 1.1x 0.9x 0.9x 13.8x 8.7x 8.2x 34.6x 17.5x 14.2x
Tilly's, Inc. 8.29 48.8% 236 162 0.3x 0.3x 0.3x 3.6x 3.9x 4.3x 16.7x 21.1x 20.6x
Wayfair Inc. 42.87 75.4% 3,617 3,231 1.4x 1.0x 0.7x NM NM NM NM NM NM
West Marine Inc. 9.17 82.8% 227 179 0.3x 0.2x 0.2x 6.3x 4.8x NA NM 26.6x 14.1x
Winmark Corp. 99.15 91.6% 407 473 6.8x NA NA 12.6x NA NA 20.9x NA NA
Zumiez, Inc. 19.70 48.5% 506 431 0.5x 0.5x 0.5x 5.6x 6.1x 5.4x 19.0x 19.0x 15.8x
Average 1.3x 1.0x 0.9x 9.6x 9.1x 8.4x 18.3x 16.3x 13.6x
Median 0.7x 0.7x 0.7x 7.1x 6.4x 6.2x 16.5x 15.7x 13.3x
Tactical
BAE Systems plc $7.12 90.6% $22,553 $24,533 1.0x 0.9x 0.9x 9.0x 8.1x 7.7x 23.3x 12.5x 11.8x
The Boeing Company 126.34 81.0% 83,701 81,713 0.9x 0.9x 0.8x 9.1x 7.8x 7.5x 19.2x 14.9x 13.5x
Cobham plc 3.06 65.5% 3,470 5,200 1.7x 1.8x 1.7x 8.4x 9.2x 8.5x 32.2x 11.5x 10.4x
General Dynamics Corporation 134.21 87.3% 41,761 42,375 1.3x 1.3x 1.3x 9.1x 9.0x 8.7x 17.1x 14.3x 13.3x
Honeywell International Inc. 108.51 97.0% 82,612 87,570 2.3x 2.2x 2.1x 11.4x 10.4x 9.7x 21.2x 16.4x 15.0x
Lockheed Martin Corporation 216.60 95.0% 66,169 80,340 1.7x 1.6x 1.6x 12.8x 11.6x 10.7x 20.3x 18.4x 15.8x
MSA Safety Incorporated 46.81 85.8% 1,749 2,114 1.9x 1.8x 1.7x 12.0x 10.5x 10.0x 20.4x 17.3x 15.6x
Orbital ATK, Inc. 78.26 82.4% 4,604 5,950 1.5x 1.3x 1.2x 13.7x 8.5x 7.8x 33.6x 14.5x 12.7x
Oshkosh Corporation 37.23 66.9% 2,722 3,674 0.6x 0.6x 0.6x 7.6x 8.4x 7.5x 15.7x 15.6x 12.3x
Smith & Wesson 28.37 99.0% 1,563 1,632 2.4x 2.2x 2.3x 9.1x 8.3x 8.7x 20.1x 16.4x NA
Sturm, Ruger & Co. Inc. 74.66 97.8% 1,415 1,345 2.4x 2.3x 2.2x 10.5x 8.6x 8.3x 24.1x 18.8x 18.0x
TASER International Inc. 19.33 53.8% 1,038 928 4.7x 4.0x 3.2x 24.2x NM 17.8x NM NM 29.9x
Average 1.9x 1.7x 1.6x 11.4x 9.1x 9.4x 22.5x 15.5x 15.3x
Median 1.7x 1.7x 1.6x 9.8x 8.6x 8.6x 20.4x 15.6x 13.5x
Agg. Average 1.5x 1.4x 1.3x 11.0x 10.0x 9.0x 22.4x 18.2x 15.9x
Agg. Median 1.1x 1.1x 1.1x 10.9x 9.2x 8.6x 20.7x 16.5x 14.6x
PUBLIC COMPANIES: VALUATION DETAILS CONT.
* Aggregate average and median of all 7 public equity comparables groups.
Note: EV/EBITDA multiples above 30x and P/E multiples above 40x have been indicated as Not Meaningful ("NM").
Source: S&P Capital IQ, data as of 3/14/16.
*
*
VALUATION MULTIPLES ($ IN MILLIONS, EXCEPT PER SHARE VALUES)
Share % of 52 Equity Enterprise EV / Revenue EV / EBITDA P / E
Company Price Week High Value Value (EV) LTM CY 2016 CY 2017 LTM CY 2016 CY 2017 LTM CY 2016 CY 2017

Private and Confidential | 16 www.davidsoncompanies.com/ecm/ Page 16
ABOUT D.A. DAVIDSON & CO.
D.A. DAVIDSON & CO.
INVESTMENT BANKING OFFICE LOCATIONS
Baltimore 111 S. Calvert Street, Suite 2830
Baltimore, Maryland 21202
(443) 610-6217
Chicago 30 N. LaSalle, Suite 1600
Chicago, Illinois 60602
(312) 525-2777
Denver 1550 Market Street, Suite 300
Denver, Colorado 80202
(303) 571-6100
Great Falls 8 Third Street North
Great Falls, Montana 59401
(406) 268-3029
Orange County 611 Anton Boulevard, Suite 600
Costa Mesa, California 92626
(714) 327-8800
Portland Two Centerpointe, Suite 450
Lake Oswego, Oregon 97035
(503) 603-3060
Salt Lake City 110 S. Regent Street, Suite 410
Salt Lake City, Utah 84111
(801) 333-3123
Seattle 701 5th Ave. Suite 4050
Seattle, Washington 98104
(206) 903-8669
This material is for your information, and w e are not soliciting any action based
upon it. This material should not be read as advice or recommendations. It has
not been prepared taking into account any person’s particular objectives or
needs. Any person should consider w hether the information is appropriate to
their needs or seek advice before making a decision based on this information.
The material is based upon information that w e consider reliable, but w e do not
represent that it is accurate or complete, and it should not be relied upon as
such. Opinions expressed, unless otherw ise indicated, are our current opinions
as of the date appearing on this material only. No part of this material may be
copied, photocopied or duplicated in any form by any means or redistributed
w ithout D.A. Davidson & Co.’s prior w ritten consent.
D.A. Davidson & Co.'s Investment Banking Group is dedicated to helping
its clients achieve their strategic and financial objectives, while maximizing
stakeholder value. With highly experienced investment banking
professionals, we bring world class skills and senior-level attention to every
transaction. D.A. Davidson’s Active Lifestyle Group is dedicated to
delivering these services to companies in the following sectors:
Accessories, Active Apparel, Fashion Apparel, Equipment, Footwear,
Retail, and Tactical.
For more information visit www.davidsoncompanies.com/ecm.
About D.A. Davidson Investment Banking
About D.A. Davidson Companies
Founded in 1935, D.A. Davidson Companies has approximately $41.5
billion in assets under management and administration and employs over
1,300 people across 24 states. D.A. Davidson & Co.’s Investment Banking
group provides full-service underwriting and advisory services for
corporations and institutions globally, including public offerings, mergers
and acquisitions, and private placements. D.A. Davidson & Co.’s full-
service platform allows investment banking clients to benefit from the firm’s
capital market capabilities, including research, corporate services, and
institutional sales and trading. D.A. Davidson & Co. is a member of SIPC.