ACTION PLAN - Austin, Texas€¦ · budget process to support the Action Planimplementation. The...
38
ACTION PLAN Roadmap for Building a Better Austin P R I D E ublic Service & Engagement iversity & Inclusion thics & Integrity nnovation & Sustainability esponsibility & Accountability Development Services Department (DSD) Planning and Zoning Department (PAZ)
Transcript of ACTION PLAN - Austin, Texas€¦ · budget process to support the Action Planimplementation. The...

ACTION PLANRoadmap for Building
a Better Austin
PRIDE
ublic Service & Engagement
iversity &Inclusion
thics &Integrity
nnovation &Sustainability
esponsibility & Accountability
Development Services Department (DSD) Planning and Zoning Department (PAZ)

Contents
Letter to Mayor and City Council 3 Overview 4
1. Action Plan 4 2. Immediate Action 5 3. Critical Touch Points to be Addressed 5
Framing the Issues to be Solved 6
1. Solving the Issues – Priority Areas 7 Roadmap for Implementation and Success 8
1. Financial Resources Required for Implementation 8 2. Goals to be Achieved within Each Priority Area 9 3. Using the City’s Open Data Portal to Post the Action Plan 10 4. Measuring Success 11
Makings of a Co-Created Action Plan 12
1. Culture Shift 12
Management and Communications 13 Stakeholders and Customers 15
Technology Improvements and Integration 16 Development Activity Data 18
1. Commercial Development Applications 19 2. Multifamily Residential Applications 20 3. Single Family Residential Applications 21 4. Residential Remodel and Addition Applications 22 5. Commercial Remodel and Addition Applications 23 6. Planning/Development Review Employees 24 7. Comparing Austin’s Complex and Expansive Development 25 8. Comparing Austin’s Permitted Housing Units to Other Cities 29
The Intersection of Austin’s Economic Growth and the Development Process 30
1. Small Businesses 33 Council Resolution 20150402-014 35

3
July 10, 2015 Mayor and City Council, This Action Plan is respectfully submitted in accordance with City Council Resolution No. 20150402-014 directing the Development Services Department (DSD) and the Planning and Zoning Department (PAZ) to develop a detailed response to the finalized Zucker Report and a recommended implementation plan. The Action Plan will span two years, which is in alignment with the Zucker Report, and contains specific steps to be taken, timelines, individuals responsible for implementing various recommendations, and budget implications. DSD and PAZ commit to undertaking the necessary department policy changes that will result in more effective service delivery to our diverse and growing community. Where necessary, financial resources will be requested through the annual budget process to support the Action Plan implementation.
The improvements to customer service are not taken lightly. The priorities of DSD and PAZ management will be to take every step necessary to meet and exceed our obligations to customers and stakeholders and to ensure the highest quality of service is provided. This includes ensuring that customer phone calls and emails are returned and acknowledged promptly. DSD and PAZ management commit to improving the engagement and outreach to customers, neighborhoods, the environmental community, small businesses, and stakeholders.
Due to the volume of information, the Action Plan will be posted on the City’s Open Data Portal, which provides for greater transparency and accessibility of the information. An update on the progress of changes will be posted to the Open Data Portal every 60 days and will include the same level of detail. Links to the Action Plan and Zucker Report can be found at www.austintexas.gov\roadmap.
DSD and PAZ management are eager to begin working with staff to implement the recommendations in accordance with the Action Plan. Staff feedback led to approximately 50% of the recommendations within the Zucker Report. Through design sessions held in May and June, DSD and PAZ employees provided additional feedback on specific steps needed to implement the recommendations.
Sincerely,
Gregory I. Guernsey, AICP, Director Planning and Zoning Department
J. Rodney Gonzales, Director Development Services Department

4
Overview Austin is at a crossroads of significant job, population, and physical growth vexed against an inadequate planning and development services system and a cumbersome and conflicting code of regulations. The planning and development services system that is required is one that provides the resources to support service delivery, engages stakeholders and the community, aims to provide excellent customer service, embraces technology to create efficiencies and allow for the flow of data, and measures performance as a means to ensure accountability and continuous improvements. A well-running planning and development services system coupled with a code that provides certainty and clarity allows for quality development in preferred growth areas to be achieved. However, Austin’s code is lacking in many areas, and a recent diagnosis concluded that the code is overly complicated, not well coordinated, and fraught with ineffective base zoning districts.
There are ongoing efforts to bring about improvements to the development services system, and the CodeNEXT initiative is well underway to revise the City’s code. In 2014, it became clear that external assistance was needed to provide a comprehensive look at the planning and development services system. The assessment, also termed the Zucker Report, has been delivered, and the outcome is 462 recommendations ranging from the purchase of Adobe Creative Suite software to changing the form of budgeting needed to sustain positive changes. Many of the recommendations are directed toward functions and responsibilities of the Development Services Department (DSD); therefore, many responses within this Action Plan are from DSD.
This Action Plan provides a detailed response to implementing the agreed-upon recommendations from the Zucker Report. It is a roadmap that is supported by employee-driven input to achieve implementation. The Action Plan follows the seven (7) priority areas of the report recommendations, which are as follows:
Finance Technology Management and Communication Staffing Partner Departments Project Managers/Processes Performance Standards
Action Plan
DSD and the Planning and Zoning Department (PAZ) commit to making the short-and long-term improvements and policy changes identified in the Action Plan. There is a strong focus on investing in the DSD and PAZ workforce and providing them the tools, training, empowerment, and inspiration to provide our customers and residents with superior service. The end result to be achieved is improved quality, speed, certainty,

5
customer service satisfaction, policies, performance monitoring, and engagement with the community.
Immediate Action
As a means to expedite reform, the Planning and Development Review Department (PDRD) was split into two separate departments, the Development Services Department (DSD) and the Planning and Zoning Department (PAZ). The separation of divisions and functions is delineated in the table below. The support services functions such as finance, human resources, and information technology will remain within DSD and will provide support to both DSD and PAZ.
Table 1: Reorganization of the Planning and Development Review Department
Development Services Department Planning and Zoning Department Development Assistance Center CodeNEXT Initiative Permit Center Comprehensive Planning Land Use Review Zoning Commercial Building Review Annexation Residential Plan Review Urban Design Building Inspections Demographics Site and Subdivision Inspections Historic Preservation
DSD and PAZ provide critically important services to the community and also serve as an important resource. As such, both DSD and PAZ will seek to build stronger partnerships with key departments, stakeholders, and inter-local and governmental agencies to accelerate collaboration and innovation on shared commitments for more efficient service delivery.
Critical Touch Points to be Addressed
As mentioned above, the Action Plan is segregated into seven (7) priority areas. Within these areas, recommendations will be implemented to address items such as customer service, the use of technology, the quality of plan reviews, customer wait times for permits and reviews, and the quality of inspections. These critical areas require specific and immediate attention and primarily fall within the purview of DSD. In many cases, the Zucker Report indicated a significant amount of financial resources are needed issues within the priority areas. The majority of financial resources were recommended to increase the number of staff positions, training, the use of contractors, and the use of temporaries and overtime. The request for financial resources to support the implementation will be presented within the Action Plan.

6
Framing the Issues to be Solved Throughout the review of the Zucker Report and the development of the Action Plan, recurring themes emerged. Major issues include:
DSD and PAZ need to improve all matters that influence customer service. These areas cover engagement, service delivery, culture, responding to phone calls and emails, and much more.
Austin’s burgeoning volume of development activity (as illustrated later in Figures 1-8) creates a significant demand on available resources, and a permanent solution for staffing that ebbs and flows with development activity needs to be created. Due to a lack of staff resources, performance standards, especially those related to timely reviews, are not being achieved.
New technology tools are required for customers such as electronic plan review, online payments, and online permitting for trade permits.
Internal and external communications are lacking. The result is dissatisfaction among employees, customers, and stakeholders. Significant efforts to improve communication are in order.
Employees require access to training and leadership opportunities. The lack of attention in these areas has had detrimental effects on performance and morale.
The implementation and accountability for adhering to performance standards requires a prerequisite training program that teaches consistency of reviews and inspections and establishes expectations
Customer service training is necessary for DSD and PAZ employees, including training on customer interactions that lead to the creation of a culture of service.
Staff should to be empowered for decision-making in order to assist customers. The City’s organizational values of P.R.I.D.E. need to be built into training and
recognition programs and into the operating systems of DSD and PAZ. The P.R.I.D.E. acronym stands for the following: • Public Service and Engagement • Responsibility and Accountability • Innovation and Sustainability • Diversity and Inclusion • Ethics and Integrity
In order to achieve complete success for a well-run development process, the City’s code must be amended to eliminate complexities and inconsistencies.
There are at least 12 City departments involved in the development review and inspection process for which no recommendations to improve timeliness were made within the Zucker Report. However, the recommendation to hire a consultant to analyze the reviews and inspections of all departments will be implemented. The goal for the consultant will be to identify efficiencies and identify organizational solutions that will improve the coordination and timeliness of reviews and inspections.

7
Solving the Issues – Priority Areas
The issues that exist in key priority areas within DSD and PAZ will be solved. The Action Plan is deliberative to match requests for financial resources with the time required for implementation. Issues such as backlogs, long wait times, inconsistent reviews and inspections, ineffective customer service are targeted for correction. Below are some of the actions that will be undertaken.
• Create standard operating procedures and policies • Implement a training program • Open the communication channels with employees,
customers, and stakeholders • Increase outreach • Revamp the website and educational material • Engage the workforce in problem solving
Management and Communications
• Use metrics to determine appropriate staff levels • Develop a protocol for using contractors Staffing
• Structure fees to be in line with cost of service Finances
• Reinforce the one-stop shop model • Develop Memoranda of Understanding between
departments Partner Departments
• Implement timely upgrades to AMANDA software • Embrace the use of technology to gain efficiencies Technology
• Use proper performance measures • Set reasonable timelines and due dates • Use the training program to set expectations and
accountability for meeting standards
Performance Standards

8
Roadmap for Implementation and Success The Action Plan specifies implementation steps that align with recommendations from the Zucker Report and the seven (7) priority areas. DSD and PAZ will use this Action Plan as a guide to implement the various action steps. By referring to this common roadmap, DSD and PAZ managers and employees can be better aligned to embrace the goals consistently.
Financial Resources Required for Implementation
Of the 462 recommendations, 55 require financial resources to implement. The Zucker Report calls for one-time expenses totaling $2.7 million and a commitment to annual on-going expenses totaling $2.6 million. There are 23 positions called for in the Zucker Report to address customer service and response times. DSD has identified 15 positions that are required to address issues related to staffing for customer service, staffing for heritage tree reviews/inspections, administrative support for review/inspection teams, and department support for human resources and accounting/finance. DSD has submitted its FY 2015/16 budget request for positions and one-time expenses related to the first-year implementation of the Action Plan. As implementation progresses, DSD will identify new efficiencies gained through technology projects, such as online permitting, and through an examination of current business practices. In both cases, the remaining financial resources for the second-year implementation may be amended to reflect efficiencies that are gained.
Priority Areas
Finance Management
and Communica-
tions
Partner Departments
Performance Standards Technology Staffing
Project Managers/ Processes

9
Goals to be Achieved within Each Priority Area
At the heart of the changes called for in the Action Plan, there are goals that are desired. Individually, the changes represent an improvement to specific service delivery issues, but collectively, the changes will bring about a shift toward a customer-focused culture. Below are the overarching goals to be achieved within each priority area. The Action Plan will lead to accomplishment of these goals.
Finance DSD will work toward segregating its revenues and costs from the General Fund.
DSD will have an organizational mindset toward operating as an Enterprise Fund, whereby costs for services must be fully recouped and fee revenues are used only for development functions. DSD will continuously seek process improvements and efficiencies to reduce permanent costs.
As the economy shifts, demands for services will shift. As an Enterprise Fund, DSD will create a reserve account to support core functions and service levels in times of development downturn.
Management & Communication DSD and PAZ management will employ a comprehensive strategy to address
stakeholder and employee concerns, to create a customer service focus, and to provide clear and effective direction from management.
There will be increased communication with employees regarding DSD and PAZ activities, training resources, budget and other department issues.
DSD and PAZ management will communicate the City’s P.R.I.D.E. values and embed the values in employee recognition programs. DSD and PAZ management will contribute toward the City’s goal of becoming the most livable and best-managed City.
Partner Departments There will be better coordination and delineation of responsibilities of DSD, PAZ, and
other City departments in order to assure reviews and inspections are completed timely and comprehensively.
A review and analysis of the interrelationship between DSD, PAZ, and other City departments will be completed to identify efficiencies and clarify roles.
Performance Standards DSD and PAZ will identify performance measures that will present an accurate
measure of reviews and inspections. DSD and PAZ management will use performance measures for accountability and to
identify resources needed to meet performance goals.

10
Technology DSD and PAZ will increase the use of technology tools for customers such as online
systems for payments, application filing and plan submittal. New geospatial tools will be implemented to support the review process and to make
geographic information readily available for customers and stakeholders. The existing database, AMANDA, will be upgraded to the latest version. And, in the
long term, DSD and partner departments will compare and explore other enterprise solutions.
Staffing DSD will use a mix of temporary staff, overtime, and potentially contractors to
address backlog, shorten review timelines, and decrease customer wait-times. This mix of staffing resources is more flexible to endure periods of economic downturn.
DSD will develop a formal staff training program that focuses on customer service and technical aspects for reviews and inspections. Once the City’s code is rewritten, the training program will focus on educating staff regarding the new code.
Project Managers/Processes The development process will be well coordinated and have clear lines of roles and
responsibilities for all departments involved in the process. The interrelationship of all departments involved in the development process will be
reviewed and analyzed to streamline the process and make it more efficient.
Using the City’s Open Data Portal to Post the Action Plan
The Action Plan will be posted to the City’s Open Data Portal. Using this method of information sharing and reporting allows for greater transparency and accountability to the public. The data within the Action Plan will be searchable and can be exported to various formats. A sample layout of the data is shown in the format shown below:
Priority Area
Work Group
Staff Contact Name
Zucker Report Recommendation
and Number
Department Recommendation and Action Steps
Start/End Date
Financial Considerations
One-Time or On-Going Expense
In addition, posting the Action Plan on the Open Data Portal aligns with the City’s Open Data Initiative 2.0. Every 60 days, progress updates will be refreshed into the data portal. Historical data files will reside on the DSD website and can also be accessed from the PAZ website.

11
Measuring Success
This Action Plan guides the implementation of all agreed-upon recommendations from the Zucker Report. The Action Plan will be reviewed at least annually to determine if adjustments need to be made to the timeline and whether completed actions have been effective. A major focus of the Action Plan incorporates changes to strengthen the culture of customer service and to provide a positive experience for customers. The effect of these changes will be measured through the following:
On-going assessments based on customer feedback utilizing online customer service surveys and survey cards
External online suggestion tool that allows for customers and stakeholders to continually submit process improvements
360-degree tool for supervisors and managers with a focus on personal development
Internal online suggestion tool that allows employees to continually submit DSD and PAZ policy and procedure improvements
There are 47 specific recommendations with regard to performance standards. Many of the current performance standards gauge the number of plan reviews and permit applications, and the percentage of reviews and applications reviewed on time. As pointed out in the Zucker Report, there are many performance standards that need to be modified. Those modifications will be completed as part of the changes to DSD policies and procedures.

12
Makings of a Co-Created Action Plan
Culture Shift
Employee feedback was extensive and is reflected throughout the Zucker Report. A good portion of the employee comments pointed to management and communication issues that deter from providing quality customer service. In a conscious effort to begin a culture of employee engagement and communication, the Action Plan was designed using a strategic co-creation approach. Fifteen (15) volunteer employee-only design sessions were conducted during May and June 2015, covering all seven (7) priority areas. Approximately 1/6th of the non-management workforce volunteered to participate.
The co-creation approach allowed inclusion of valuable insights from employees and also provided staff more insight and participation into department policies and procedures. And, bringing employees into the creation of the Action Plan is needed because all DSD and PAZ employees will perform the implementation. Additionally, many of the recommendations in the Zucker Report call for a customer-centric approach, which will be provided directly by employees.
DSD and PAZ management commit to a culture of inclusion and engagement with employees. This is a critical step for bringing about a culture shift whereby employees engage with customers, neighborhoods, and stakeholders to provide the highest quality of service.

13
Management and Communications The Planning and Development Review Department split into DSD and PAZ will allow a greater focus and attention to be paid toward the delivery of development services and toward the CodeNEXT code revision project. There are over 100 recommendations from the Zucker Report under the priority area of Management and Communications, the most of any priority area within the assessment.
The Management and Communications priority area is central to all other priority areas of Finance, Performance Standards, Technology, Staffing, Project Manager/Processes, and Interrelation with other Departments. Recommendations such as returning phone calls the same day, strengthening relations with neighborhoods, and changing the culture to one that is focused on the customer and problem solving must be addressed by DSD and PAZ management.
As identified within the Zucker Report, the former PDRD lacked strategic planning and management in the department. Employee responses to surveys indicated concerns with the various aspects of department management. Key to the responses is that employees do not believe there is a coordinated development review and plan reviewing process. And, employees do not believe there is good teamwork and communications between the different departments, divisions, or organizations conducting development review, plan reviewing, and inspection. The task ahead for DSD and PAZ is clear, and management teams from DSD and PAZ will lead efforts to:
Implement this Action Plan which will lead to improvements in processes Improve communications within respective departments and between departments Bridge the trust with the neighborhoods and respect the concerns and issues raised Respond to the time commitments to the development community and deliver quality
customer service Complete and implement the CodeNEXT code revisions
A recommendation within the Zucker Report is to utilize a 360-degree tool for all managers and supervisors. This will be implemented as a 360-degree development tool, and it will be done in a manner that promotes trust, confidentiality, and strong communication. The goal will be to identify skills and competencies that require more development and to provide the training and coaching resources where needed. The approach to the 360-degree tool will be to:
Involve key internal stakeholders in the development of the 360-degree tool including staff, peers, supervisors, and managers
Provide ample communication Ensure confidentiality Provide feedback
14
Communication with external stakeholders will also need to be improved. This means improvement to the website which has become the key portal of disseminating information externally. And, this also means improving our written communication, including handouts, wayfinding, and signage.
Communication includes engaging with neighborhoods and stakeholders. By actively getting out of the department and participating in meetings and discussions. Relying on customers, residents, businesses, tradespeople, architects, engineers, developers to come to City offices for conversations is not an effective way to implement this Action Plan. DSD and PAZ staff will get out of City offices and get information and updates out to customers and stakeholders.

15
Stakeholders and Customers It is clear from stakeholder responses that much improvement is desired to improve processes and to rebuild trust. Stakeholder comments are contained in Appendix F (by stakeholder group) of the Zucker Report and cover a range of topics. Within Appendix I of the report, the stakeholder comments are grouped by subject matter. This section provides a good indication of the subjects that are of most concern for stakeholders. Subjects of most concern were code, inspections, neighborhood plans, process, site plans, subdivisions, and staff. Many of these comments led to various recommendations, and staff has provided actionable steps to implement the recommendations.
Customers were separately surveyed as part of the assessment. Of 1,950 emails that successfully reached customers, 310 responses were received. Overall, the survey responses were not favorable, and 142 suggestions for improvement were sent in by survey respondents. As with stakeholder comments, customer responses were used to formulate recommendations. And, the staff has provided actionable steps to implement the recommendations.
DSD primarily delivers services in the form of plan reviews, permit application processing, and inspections. In this regard, the department will focus on delivering the best customer service. DSD will develop a customer-centric program that incorporates standards and expectations, customer service training, outreach and education, complaint resolution, phone and email responses, and reward and recognition for acknowledging and reinforcing excellent customer service. The goals will be:
Accessible: Ensure that customers can easily access staff Timely: Ensure that customer expectations are met in the time that is committed Fair, Efficient, and Certain: Ensure that customers receive prompt, courteous, fair,
correct, and professional service Knowledgeable: Provide accurate, complete, and objective information on time Communicative: Improve communication within the department and among other
departments and externally to inform and educate the customer Resourceful: Provide the customer with as much information as possible so that the
customer can be well informed of all options
16
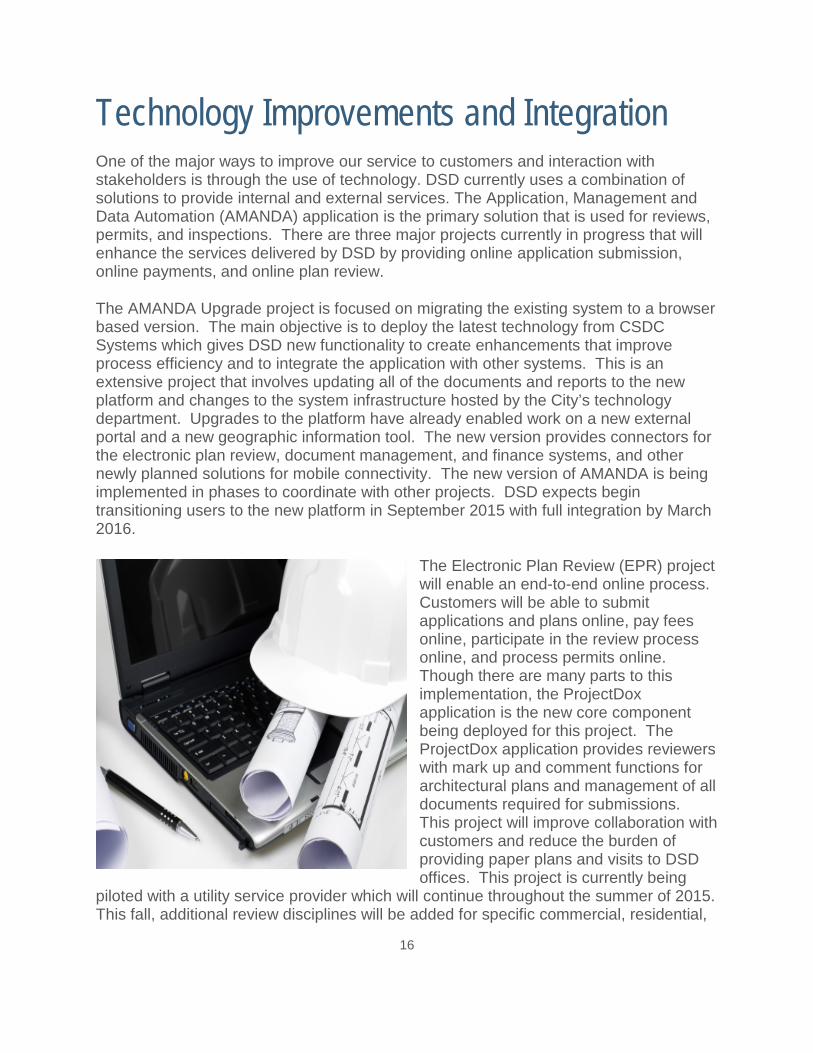
Technology Improvements and Integration One of the major ways to improve our service to customers and interaction with stakeholders is through the use of technology. DSD currently uses a combination of solutions to provide internal and external services. The Application, Management and Data Automation (AMANDA) application is the primary solution that is used for reviews, permits, and inspections. There are three major projects currently in progress that will enhance the services delivered by DSD by providing online application submission, online payments, and online plan review.
The AMANDA Upgrade project is focused on migrating the existing system to a browser based version. The main objective is to deploy the latest technology from CSDC Systems which gives DSD new functionality to create enhancements that improve process efficiency and to integrate the application with other systems. This is an extensive project that involves updating all of the documents and reports to the new platform and changes to the system infrastructure hosted by the City’s technology department. Upgrades to the platform have already enabled work on a new external portal and a new geographic information tool. The new version provides connectors for the electronic plan review, document management, and finance systems, and other newly planned solutions for mobile connectivity. The new version of AMANDA is being implemented in phases to coordinate with other projects. DSD expects begin transitioning users to the new platform in September 2015 with full integration by March 2016.
The Electronic Plan Review (EPR) project will enable an end-to-end online process. Customers will be able to submit applications and plans online, pay fees online, participate in the review process online, and process permits online. Though there are many parts to this implementation, the ProjectDox application is the new core component being deployed for this project. The ProjectDox application provides reviewers with mark up and comment functions for architectural plans and management of all documents required for submissions. This project will improve collaboration with customers and reduce the burden of providing paper plans and visits to DSD offices. This project is currently being
piloted with a utility service provider which will continue throughout the summer of 2015. This fall, additional review disciplines will be added for specific commercial, residential,

17
and land use applications. The full implementation of EPR is scheduled for completion by mid-year 2016.
The AMANDA Portal II project will bring a majority of DSD’s business online. The new portal platform supports online application and online payment for credit cards and electronic check. It is the interface for electronic plan review, issuing permits electronically, and scheduling inspections online. The new platform is mobile friendly so many of the features will be available for phones, pads and tablets with internet capability. The first phase of the project, to be completed at the end of the summer of 2015, will replace the old website and replace escrow payment with credit card and electronic checks. The next phases of the project will complement the EPR project for each application type being enabled for electronic review. Standalone permits will be added as options over the next year as well. The majority of DSD business is anticipated to be online by the middle of 2016 in conjunction with EPR and the AMANDA Upgrade.
DSD uses other technology solutions to support other aspects of the business to manage day-to-day operations or to complement the use of the AMANDA application. The Customer Wait Tracking System helps manage the queues in the Permit Center, Development Assistance Center, and Plan Review. The system was enhanced a couple of years ago to support SMS texting which provides notification of position in the queue. Customers can check-in with staff to provide a contact number and then leave to conduct other business until DSD staff is available to serve their business needs. The RightFax application is used to streamline the processing of permit requests that are faxed by some applicants. Citrix is used to provide full AMANDA functionality in the field for inspection staff. And for customers that do not have internet access, the Interactive Voice Response (IVR) automated phone attendant can be used to schedule and cancel inspections.
A project to deploy the MicroStrategy business intelligence (BI) tool began in 2014. The tool is now being used to provide performance dashboards to DSD supervisors and management. The dashboards provide timely information on the status of cases and review backlogs so that DSD management can quickly adjust work to available staff.
Implementation of two new geospatial technology solutions, ArcGIS Online and Geocortex, by the DSD GIS staff supports the geospatial needs of all the projects. Other GIS tools are utilized to provide management and mapping of data for Imagine Austin, Neighborhood Planning, and the CodeNEXT code revisions.
DSD continues to identify areas where technology can provide improvements. Future projects and solutions will bring enhanced customer service through the use of kiosks and online support tools. Other new tools are being developed to improve the accessibility and communication between field staff and customers. And, the expansion of data placed online through the Data Portal project will provide more information quicker to the citizens.

18
Development Activity Data The last two sections of the Action Plan contain economic and development activity data. The information illustrates the impact of Austin’s growing economy and provides background as to how long the economic growth will continue at the current level. Figures 1-5 depict development applications submitted to the City of Austin over the last 25 years. Building Permits are used as a measure of the waves of development that Austin has seen over that time. The economic boom-and-bust cycles over that period can be clearly seen from the highs and lows seen in the graphs.
Currently, the land development process can start with a zoning change, followed by a subdivision and/or a site plan review application. This process can involve time frames that can vary in length from a few months to a few years depending on the scale and complexity of the project. The building permit represents the final phase of the development process, initiated once the project has received entitlement, after going through a complex regulatory process. Some complex projects such as the Circuit of the Americas project do not fully reflect the complexity and scale of the projects as these projects cannot be measured in terms of units or square footage built.
Additionally, not all building permits/projects are fully built out or constructed. It is assumed for the purpose of this report that the development was built out, which might not be the case for all the permits. It is also assumed that the information reported by the developers and/or retrieved by different data sources is accurate and complete.
Data Sources: The data was compiled by the Development Services Department IT Team and the source information spans 25 years. The data serves to provide a broad overview of development trends over the last quarter-century. Data sources include:
Data from 1990 through 2006 for Figure 1 was retrieved from the Permitting, Inspection, Enforcement, and Review (PIER) database and City of Austin Geographic Information Systems (GIS) datasets.
Data from 1990 through 1996 for Figures 2 and 3 was retrieved from “Growth Watch – Monitoring Austin’s Growth and Redevelopment, Fourth Quarter 1996,” a publication of the Department of Planning, Environmental and Conservation Services, City of Austin, published in January 1997.
Data from 1997 through 2006 for Figures 2 and 3 was mined by issued date and retrieved from the Permitting, Inspection, Enforcement, and Review (PIER) database and City of Austin GIS datasets.
Data from 2007 through 2014 for Figures 1-5 was retrieved from AMANDA, which was managed by the Watershed Protection and Development Department and Planning and Development Review Department.
Data for Figures 4 and 5 was mined by the application date and retrieved from “Building Plan Application Submittal Report” and “Development Tracking Data”.

19
Figure 1: Commercial Development Applications
Figure 1 shows the commercial development applications submitted to the City of Austin from 1990 through 2014, measured in terms of square footage.
Commercial development, as measured in the chart above, includes manufacturing facilities, warehouses, research facilities, schools, hospitals, rehabilitation facilities, hotels and motels; service stations and repair garages; stores and customer service buildings; and other retail uses. The chart shows a clear spike in the number of commercial permits issued (after 2010) for notable projects, including the JW Marriott, the Westin, and the Holiday Inn Express hotels and other notable projects such as Southpark Meadows; Shops at the Arbor Walk; Chinatown Center; and The Domain, which has continued to add space since 2006.

20
Figure 2: Multifamily Residential Applications
Figure 2 shows the multifamily residential development applications submitted to the City of Austin from 1990 through 2014, measured in terms of number of units.
The last few years have seen significant upturn in Austin’s multifamily market noted by the last spike on the chart above. Due to Austin’s strong economy and rapidly increasing population, the multifamily market continues to show vigorous growth. Multifamily projects can range from the traditional garden apartment complexes in suburban areas to smaller infill projects in the urban core, to high-rise residential developments, generally in the central business district. Parts of the city impacted by the vibrant multifamily development of the past few years include Downtown Austin, West Campus, The Domain, the South Lamar corridor, Burnet Corridor, Riverside Drive, Southpark Meadows and Lakeline Mall.

21
Figure 3: Single Family Residential Applications
Figure 3 shows the single family residential development applications submitted to the City of Austin from 1990 through 2014, measured in terms of number of units.
Austin’s single family market has two main contributors, the subdivisions which are usually on the periphery and the infill/redevelopment occurring in the urban core. Together the two streams contribute a steadier supply of residential permits issued under a complex land development code. Some of the major projects that contributed to single-family residential unit supply include Avery Ranch, Northtown MUD, Pioneer Crossing, Harris Branch PUD and the Robert Mueller Municipal Airport development.

22
Figure 4: Residential Remodel and Addition Applications
Figure 4 shows the residential remodel and addition applications submitted to the City of Austin from 2000 through 2014, measured in terms of number of permits.
23
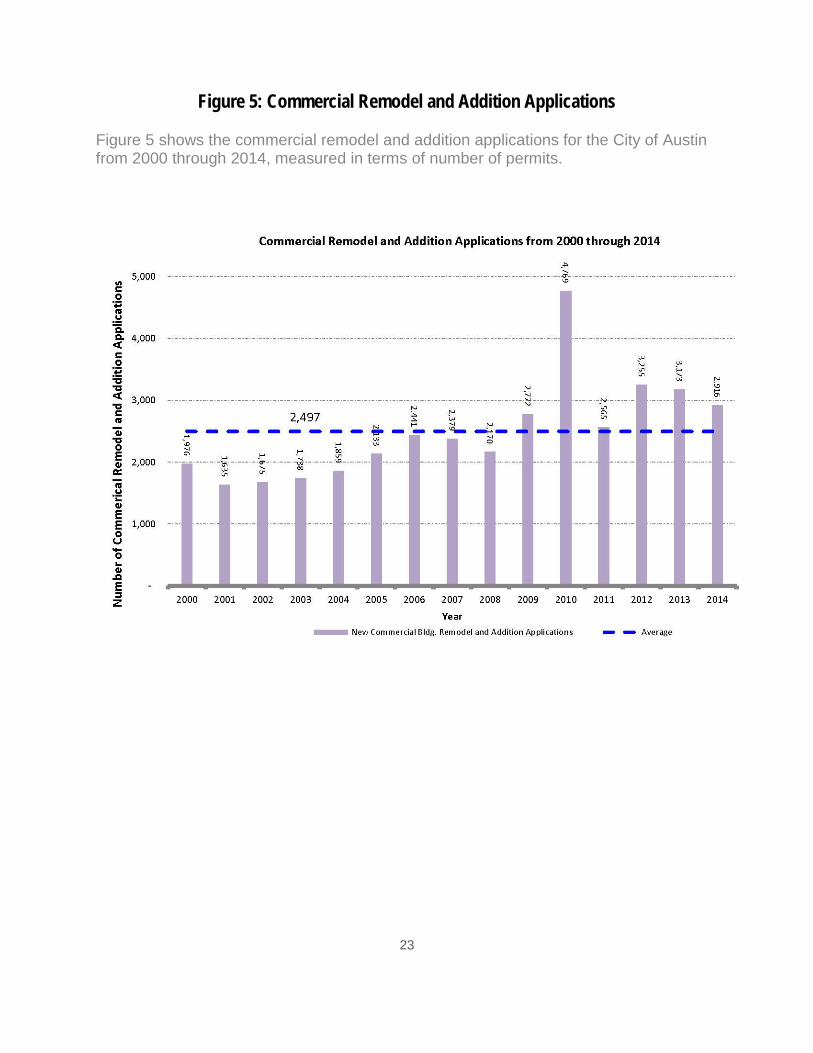
Figure 5: Commercial Remodel and Addition Applications
Figure 5 shows the commercial remodel and addition applications for the City of Austin from 2000 through 2014, measured in terms of number of permits.
24
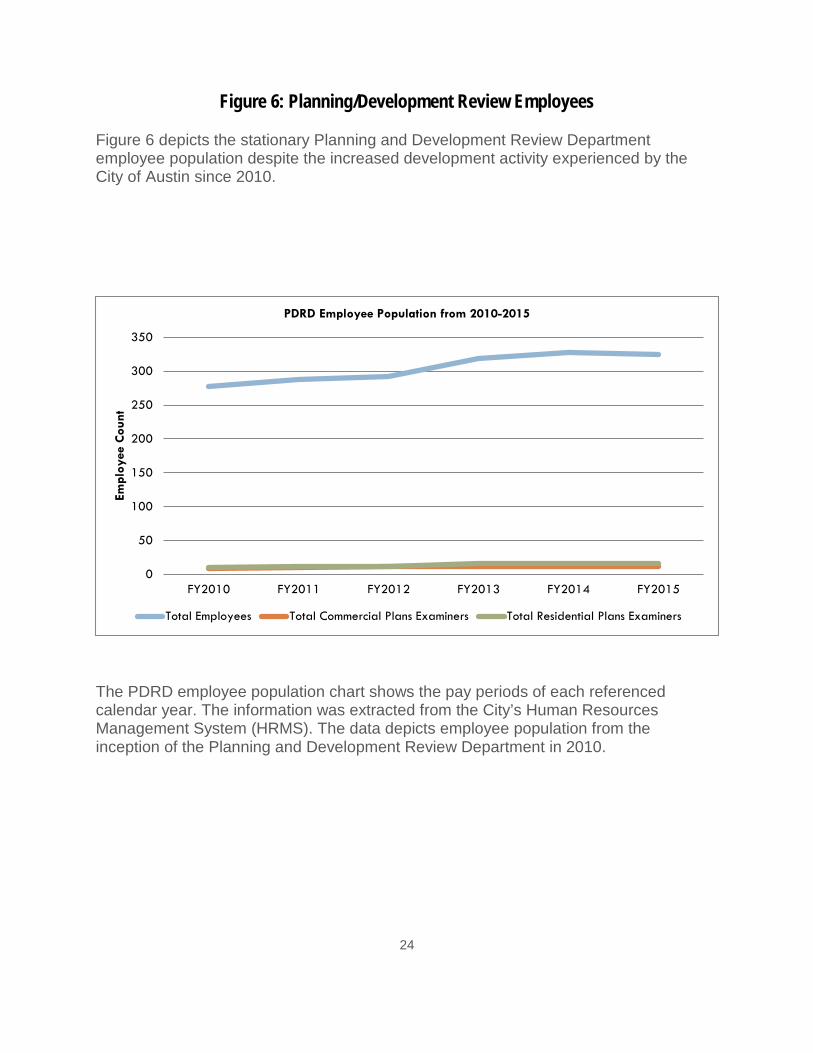
Figure 6: Planning/Development Review Employees
Figure 6 depicts the stationary Planning and Development Review Department employee population despite the increased development activity experienced by the City of Austin since 2010.
The PDRD employee population chart shows the pay periods of each referenced calendar year. The information was extracted from the City’s Human Resources Management System (HRMS). The data depicts employee population from the inception of the Planning and Development Review Department in 2010.
0
50
100
150
200
250
300
350
FY2010 FY2011 FY2012 FY2013 FY2014 FY2015
Empl
oyee
Cou
nt
PDRD Employee Population from 2010-2015
Total Employees Total Commercial Plans Examiners Total Residential Plans Examiners
25
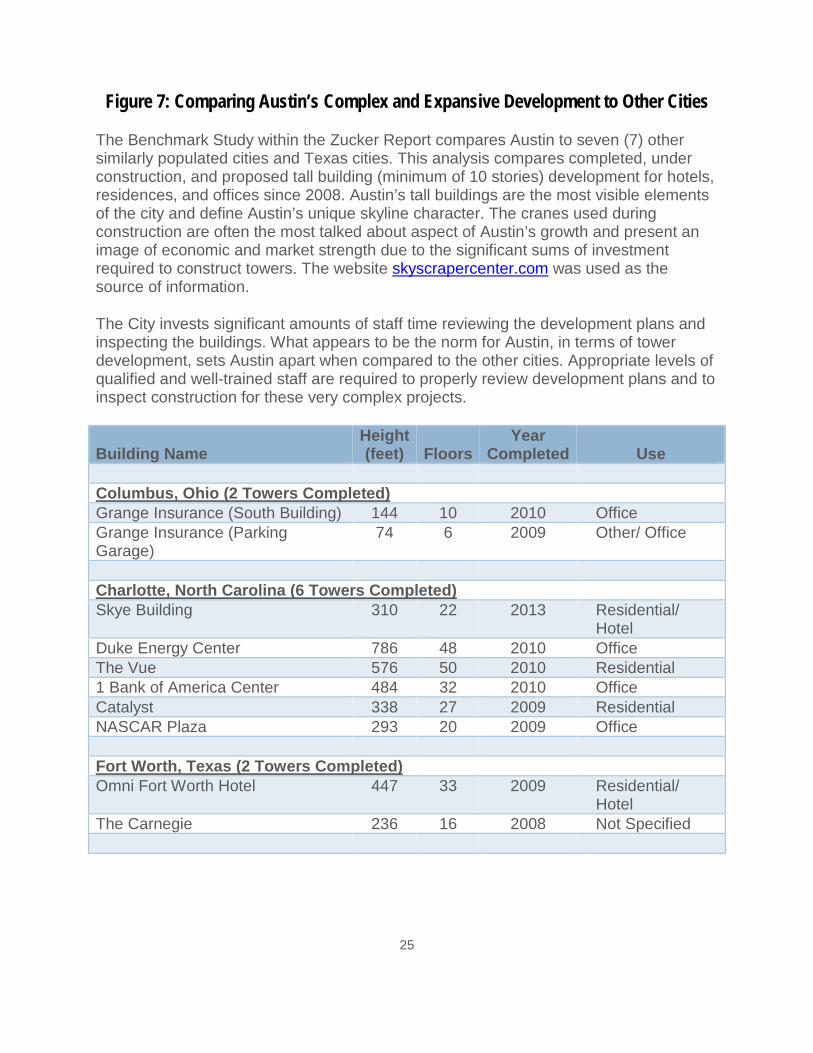
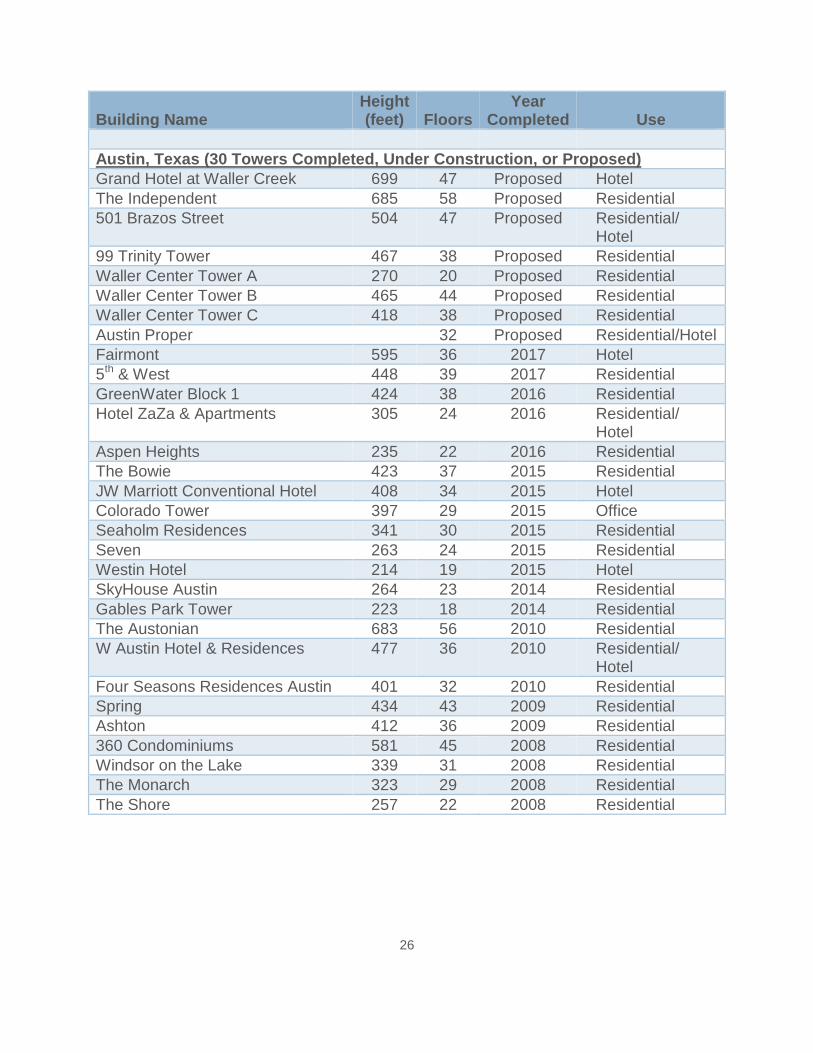
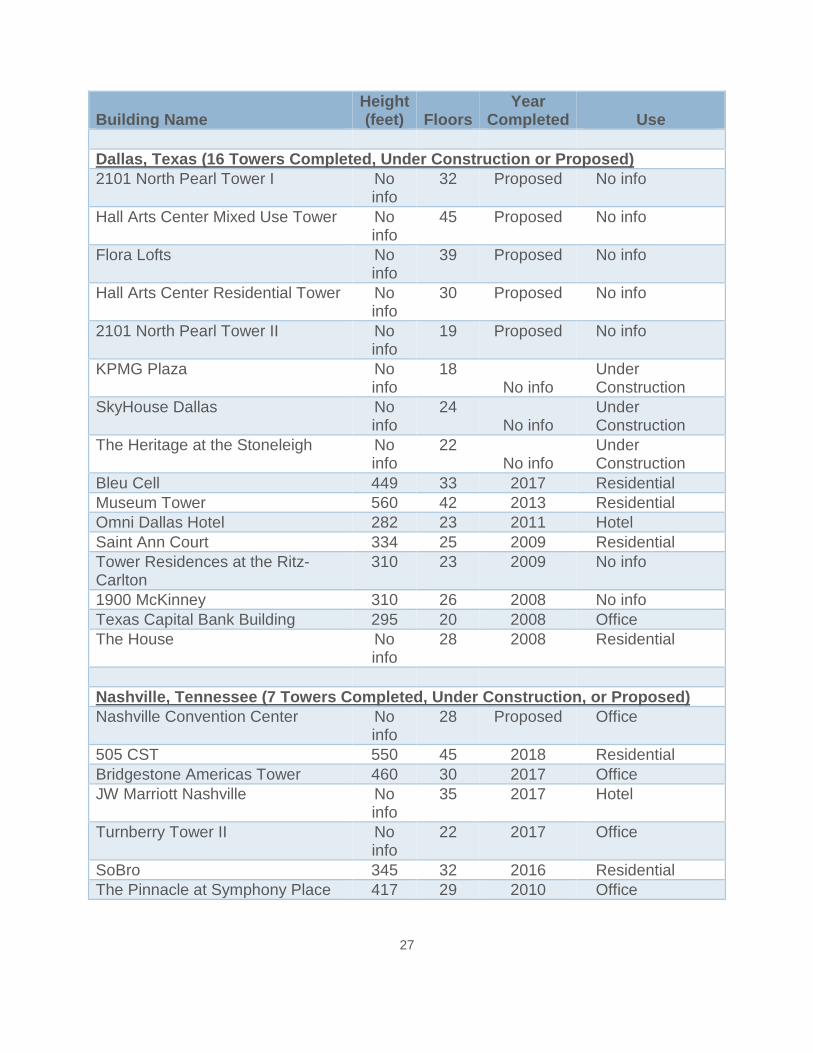
Figure 7: Comparing Austin’s Complex and Expansive Development to Other Cities
The Benchmark Study within the Zucker Report compares Austin to seven (7) other similarly populated cities and Texas cities. This analysis compares completed, under construction, and proposed tall building (minimum of 10 stories) development for hotels, residences, and offices since 2008. Austin’s tall buildings are the most visible elements of the city and define Austin’s unique skyline character. The cranes used during construction are often the most talked about aspect of Austin’s growth and present an image of economic and market strength due to the significant sums of investment required to construct towers. The website skyscrapercenter.com was used as the source of information.
The City invests significant amounts of staff time reviewing the development plans and inspecting the buildings. What appears to be the norm for Austin, in terms of tower development, sets Austin apart when compared to the other cities. Appropriate levels of qualified and well-trained staff are required to properly review development plans and to inspect construction for these very complex projects.
Building Name Height (feet) Floors
Year Completed Use
Columbus, Ohio (2 Towers Completed) Grange Insurance (South Building) 144 10 2010 Office Grange Insurance (Parking Garage)
74 6 2009 Other/ Office
Charlotte, North Carolina (6 Towers Completed) Skye Building 310 22 2013 Residential/
Hotel Duke Energy Center 786 48 2010 Office The Vue 576 50 2010 Residential 1 Bank of America Center 484 32 2010 Office Catalyst 338 27 2009 Residential NASCAR Plaza 293 20 2009 Office Fort Worth, Texas (2 Towers Completed) Omni Fort Worth Hotel 447 33 2009 Residential/
Hotel The Carnegie 236 16 2008 Not Specified
26
Building Name Height (feet) Floors
Year Completed Use
Austin, Texas (30 Towers Completed, Under Construction, or Proposed) Grand Hotel at Waller Creek 699 47 Proposed Hotel The Independent 685 58 Proposed Residential 501 Brazos Street 504 47 Proposed Residential/
Hotel 99 Trinity Tower 467 38 Proposed Residential Waller Center Tower A 270 20 Proposed Residential Waller Center Tower B 465 44 Proposed Residential Waller Center Tower C 418 38 Proposed Residential Austin Proper 32 Proposed Residential/Hotel Fairmont 595 36 2017 Hotel 5th & West 448 39 2017 Residential GreenWater Block 1 424 38 2016 Residential Hotel ZaZa & Apartments 305 24 2016 Residential/
Hotel Aspen Heights 235 22 2016 Residential The Bowie 423 37 2015 Residential JW Marriott Conventional Hotel 408 34 2015 Hotel Colorado Tower 397 29 2015 Office Seaholm Residences 341 30 2015 Residential Seven 263 24 2015 Residential Westin Hotel 214 19 2015 Hotel SkyHouse Austin 264 23 2014 Residential Gables Park Tower 223 18 2014 Residential The Austonian 683 56 2010 Residential W Austin Hotel & Residences 477 36 2010 Residential/
Hotel Four Seasons Residences Austin 401 32 2010 Residential Spring 434 43 2009 Residential Ashton 412 36 2009 Residential 360 Condominiums 581 45 2008 Residential Windsor on the Lake 339 31 2008 Residential The Monarch 323 29 2008 Residential The Shore 257 22 2008 Residential
27
Building Name Height (feet) Floors
Year Completed Use
Dallas, Texas (16 Towers Completed, Under Construction or Proposed) 2101 North Pearl Tower I No
info 32 Proposed No info
Hall Arts Center Mixed Use Tower No info
45 Proposed No info
Flora Lofts No info
39 Proposed No info
Hall Arts Center Residential Tower No info
30 Proposed No info
2101 North Pearl Tower II No info
19 Proposed No info
KPMG Plaza No info
18 No info
Under Construction
SkyHouse Dallas No info
24 No info
Under Construction
The Heritage at the Stoneleigh No info
22 No info
Under Construction
Bleu Cell 449 33 2017 Residential Museum Tower 560 42 2013 Residential Omni Dallas Hotel 282 23 2011 Hotel Saint Ann Court 334 25 2009 Residential Tower Residences at the Ritz-Carlton
310 23 2009 No info
1900 McKinney 310 26 2008 No info Texas Capital Bank Building 295 20 2008 Office The House No
info 28 2008 Residential
Nashville, Tennessee (7 Towers Completed, Under Construction, or Proposed) Nashville Convention Center No
info 28 Proposed Office
505 CST 550 45 2018 Residential Bridgestone Americas Tower 460 30 2017 Office JW Marriott Nashville No
info 35 2017 Hotel
Turnberry Tower II No info
22 2017 Office
SoBro 345 32 2016 Residential The Pinnacle at Symphony Place 417 29 2010 Office

28
Building Name Height (feet) Floors
Year Completed Use
Portland, Oregon (7 Towers Completed, Under Construction or Proposed) Block 15 340 28 Proposed Residential Hassalo on Eighth 250 21 Proposed Residential Block 67 No
info 21 2016 Residential/
Retail Park Avenue West 515 30 2015 Residential/
Office Edith Green-Wendell Wyatt Building
361 18 2013 Office
Mirabella 325 30 2010 Residential The Ardea 325 30 2008 Residential San Antonio, Texas (3 Towers Completed) Broadway San Antonio 279 20 2010 No info Grand Hyatt San Antonio 424 34 2008 Office/ Hotel Vidorra I 292 25 2008 No info

29
Figure 8: Comparing Austin’s Permitted Housing Units to Other Cities
The information below provides a comparative analysis from 2010 through 2014 of single family and multifamily permitted activity. Austin is compared once again to the cities within the Benchmark Study. The source of information is the United States (U.S.) Census Bureau Building Permits Survey website www.census.gov/construction/bps/. The supply of housing units being constructed in Austin correlates to the demand for housing by Austin’s existing and new residents, and new permit applications will continue to be submitted so long as the demand exists for housing within the city. The population data is as of July 1, 2014, and the source is the U.S. Census Bureau Population and Housing Unit Estimates website www.census.gov/popest/.
Austin Columbus Dallas Fort Worth Portland San Antonio
Population 912,791 835,957 1,281,047 812,238 619,360 1,436,697 Single Family 11,289 3,600 4,778 14,343 3,085 10,199 Multifamily 27,149 12,802 24,931 8,583 10,448 9,844 Totals 38,438 16,402 29,709 22,926 13,533 20,043

30
The Intersection of Austin’s Economic Growth and the Development Process Austin’s economic growth is connected to its increased population from in-migration. And as a city that has a reputation of being cool and hip with a vibrant music, food, and tech scene, Austin appeals to many young people, especially millennials. With an in-migration population that exceeds the number of people leaving Austin, the supply of housing for our new neighbors has not kept up with the demand.
Whether or not substantial population increase is a good or bad thing is a long-running source of debate in Austin. Regardless, there still remains a demand for housing units, and the City’s development process has been pointed to as a broken system that impedes the flow of housing unit supply into the Austin housing market. Given the axiom that limited supply in the face of high demand causes spikes in pricing, the development process is deemed a culprit of the price spikes. Improvements need to be made to meet the time commitments of the development process, and the Zucker Report has identified recommendations that can improve the timelines and processes when implemented.
The current lack of supply in the housing market is also rooted in the 2008 financial crisis and the lack of development financing for multifamily projects. Multifamily projects suffered a high vacancy rate and projects succumbed to foreclosure during the 2008 recession. The current housing shortage due to population growth demands was forecasted in 2010 by local realtor Blake Taylor. From Taylor’s perspective, construction was 30% below population growth demands. Taylor’s prediction of housing shortage within five (5) years also led him to conclude that pricing increases would ensue. (Source: “Will there be a Bottle Neck in Austin?”; The Advisor published by Taylor Real Estate, Volume III, Fall 2010).
Figure 2, which is shown later in this Action Plan, provides a historical perspective of permit applications for multifamily units from 1990 through 2014. During that time period, an average of 3,534 annual permit applications for multifamily units were received. Peak periods can be traced back to the years in which the Austin economy expanded. And, declines in permit applications are linked to periods of recession. The
Photo Credit 1: Michael Knox

31
table below shows a snapshot of the data. Austin experienced a below-average period of multifamily units permit applications (2009-2011) that can be attributed to the 2008 recession and lack of development financing. And, the more recent above-average period (2012-present) is attributed to Austin’s growth as well as a nationwide shift from home ownership to rental.
Table 2: Multifamily Units Permitted in Austin (2009-2010)
Year
Multifamily Residential
Applications Measured in Units
Amount (Below) or Above Average
Percentage (Decrease) or Increase from
Average 2009 843 (2,691) (76.1%) 2010 797 (2,736) (77.4%) 2011 2,157 (1,375) (39.0%) 2012 5,762 2,231 63.0% 2013 7,938 4,408 124.6% 2104 6,289 2,760 78.0%
A recent article in the Austin Business Journal suggests that the number of millennials attracted to Austin is connected to the surge in multifamily development. The source for the article is “Second-Tier Cities: A Millennial Migration”, published by Bloomberg Brief on June 1, 2015. Austin’s millennial population increased by 26% from 2000 to 2014 and is suggested as a strong source of the recent multifamily development boom. The article also suggests that lenders are reducing their debt yield requirements for multifamily projects in boom cities like Austin. (Source: “Austin’s millennial boom has huge impact on multifamily development”; Austin Business Journal, June 10, 2015)
Austin’s above-average volumes of applications for multifamily units are being permitted; however, peak efficiency has been reached as indicated by the persistent backlog. The matter of enforcing timelines for reviewing permit applications should always exist, but it does not solve for the fact that the number of applications submitted to the system cannot be controlled. If the volume of applications were to resume to average levels, the backlog would not exist. The development process would then return to “business as normal”. However, the volume of applications has not slowed down, and the rate of activity appears to be the new normal for at least the immediate future.
As indicated on page 11 of the Zucker Report, “There are also major backlogs of permits, in residential, commercial and site plan reviews. These cannot be solved with existing staffing.” The backlog, as we know it, is a symptom of both an above-average level of activity and staffing levels that are not calibrated for the high volume.
If Austin’s growth were to be limited to a single sector, such as multifamily, staffing could be shifted to focus on the high growth sector. However, Austin is experiencing exuberant growth in all sectors of its economy, including single-family homes,

32
residential remodels and additions, and commercial remodels and additions. Figures 3 through 6 within this Action Plan provide a glimpse of the growth in each of these sectors.
A unique aspect of Austin’s growth is the added layer of tall building development for residential, hotel, and office use. This complex development requires a higher level of review and more time to process than a standard single floor development. Since 2008, the City has permitted the construction of 22 tall buildings, ranging from 18 floors to 56 floors, for a combined total of 703 floors. Another eight (8) tall buildings are currently being planned ranging from 20 floors to 58 floors. (See Figure 7 in the Action Plan for a full listing of tower development.)
The new tower development is in keeping with the City’s 2006 goal to have 25,000 residents living in Downtown Austin and to revitalize downtown from the despondent days of the 80’s and 90’s. Much attention was provided to fitting in the residential buildings to support this 5x resident growth. But, no one could have forecasted the phenomenal and quick response to the City’s goal and that the burgeoning growth would compete for resources to support the reviews of other housing and commercial development outside of downtown.
And, our city has become a popular destination for many travelers either on a personal trip or coming to Austin for business. The increasing number of festivals and events in Austin continues to fuel Austin’s popularity as a place to visit. Austin’s hotel occupancy for the first quarter of 2015 was 76.4% and revenue per available room was over $103. The hotel development industry views Austin as a sizzling hot hotel market and one that is receiving substantial attention and investment. Between projects recently completed and those in the pipeline, an additional 4,000 hotel rooms will be added to Downtown Austin. This compares to 1,000 rooms being added to downtown Dallas and slightly less than 2,000 in downtown Houston, which will host the 2017 Super Bowl. (Source: “Texas Hotel Trends: Austin’s HOT, Cities want Convention Hotels, and Modular is Back”; Virtual Builders Exchange, June 3, 2015). The dramatic increase in hotel development is yet one more growth area that competes with the housing market for permit application review.
Photo Credit 2: Nick Simonite

33
The question on many minds is not only how can Austin’s rapid growth be supported but also when it might level off. The answer for predicting when growth will subside is connected to Austin’s forecasted population increase. In January 2015, the Urban Institute released its report of low, average, and high population forecasts for the country’s metropolitan regions. Under the average scenario, the Austin area will grow from 1.8 million people in 2010 to 2.8 million people in 2030, a 55% increase. On the high end, the Austin area will grow to 3.2 million people in 2030, an 81.7% increase. (Source: “Scenarios for Regional Growth from 2010 to 2030”; Urban Institute, January, 2015).
Annually, the Urban Land Institute, in conjunction with Price Waterhouse Coopers, publishes its “Emerging Trends in Real Estate”. The publication serves to provide an outlook on real estate investment and development trends and ranks metropolitan areas according to investment, development, and homebuilding activity. Austin edged out San Francisco for the No. 2 spot indicating confidence in the growth of the Austin real estate market. (Source: “Emerging Trends in Real Estate; Urban Land Institute, 2015).
In terms of job creation, economists are convinced that the recent decline in oil and gas prices will not affect Austin’s job growth. In the past year, Austin area employers added 32,000 jobs to the local economy, an increase of 3.5%. In May 2015, Austin area employers added 6,800 jobs. (Source: “Austin job growth surges as Texas starts to shake energy sector’s chill”; Dan Zehr, Austin American-Statesman, June 19, 2015). Another signal of Austin’s continued economic growth surge is the return of the Downtown condo market. Recently, it was reported that 90% of the 370 condo units have been reserved for the planned 58-story Independent residential tower. The developers began taking deposits of $5,000 and $10,000 on June 5, 2015 for units that will range in price from the mid-$300,000s to more than $3 million. (Source: “90 percent of units already spoken for at 58-story Austin tower”; Shonda Novak, Austin American-Statesman, June 19, 2015).
To say that resources are needed to support Austin’s continued growth in all development sectors is an understatement. And, the attention to the development process system for reviewing, permitting, and inspecting the ensuing construction will be provided. A combination of new resources and active management will ensure that timelines for review and inspection are met and that City codes and regulations are consistently followed.
Small Businesses
Although the Zucker Report did not address small business, Council’s resolution requested information on how small businesses would be engaged. Small businesses play a large role in the Austin community and economy. They support families through jobs and provide valued goods and services to neighborhoods. Rules, regulations, and processes present challenges to small businesses in that they have little time and resources to spare for such matters. Rules and regulations are in place for very good

34
reasons such as protecting the health, safety, and welfare of the general public, and good customer service dictates that we should help small businesses understand and navigate through the development process. Many cities such as Chicago, New York, Cincinnati, Denver, Boston, San Francisco, and Seattle are implementing measures to assist small businesses with permitting and inspections. Efforts include:
Mapping of processes to inform small businesses of the process Neighborhood small business growth strategies to foster neighborhood engagement
with the local small business community Co-location of resources, processes, and staff to provide one site for small business
needs Outreach to inform small businesses of rules, regulations, and processes Streamlining of the appeals process for small businesses
DSD will participate in and develop small business education programs, in conjunction with the Economic Development Department, chambers of commerce, local business associations, and local merchants associations, to assist small businesses with navigating and getting through the development process in a timely manner. Additionally, there are grant opportunities that exist through the Small Business Administration (SBA) for which DSD can participate with a local partner.

35
Council Resolution
36
37

38