Action and content based Community Detection in Social Networks
22
Action and Content Based Community Detection in Social Networks Prabhsimran Singh Baweja Prakhar Sharma Ritesh Modi Vaishali Pal Mentored By: Prateek Mehta
-
Upload
ritesh11 -
Category
Data & Analytics
-
view
24 -
download
1
Transcript of Action and content based Community Detection in Social Networks

Action and Content Based Community Detection in Social Networks
Prabhsimran Singh Baweja
Prakhar Sharma
Ritesh Modi
Vaishali Pal
Mentored By: Prateek Mehta
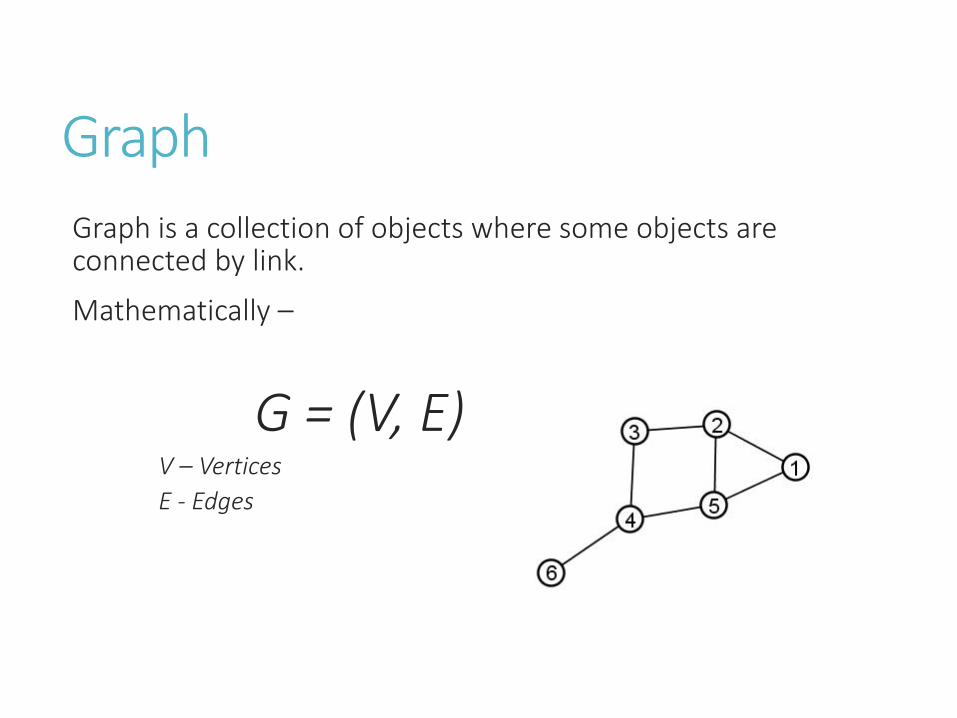
Graph
Graph is a collection of objects where some objects are connected by link.
Mathematically –
G = (V, E)V – Vertices
E - Edges

MotivationSocial network analysis focuses on mining hidden semantics in a setting involving interacting agents. Collaboration between them defines same kind of behavior.
Our motivation is to use edge attribute weights along with the links to find communities.
Entities are modeled as vertices, edges capture the relationship between them.

Community
A community is a collection objects/people sharing the same interests or having same characteristics.
E.g., People liking Jazz music might belong to one community and the people like Folk might belong to the other.

Community DetectionCommunity detection is the task of extracting densely-knit groups within the network.
Unsupervised learning problem, addressed using analysis of linkage, node attributes, etc.
Given: G = (V, E)
Output: C1, C2, ..., Ck ,
Ci ∩ Cj = φ , ∀i ≠ j , ∪ Ci = V
1≤i≤k
Communities represent a coarse grained view of the network, can be mapped to the functional units of the network.
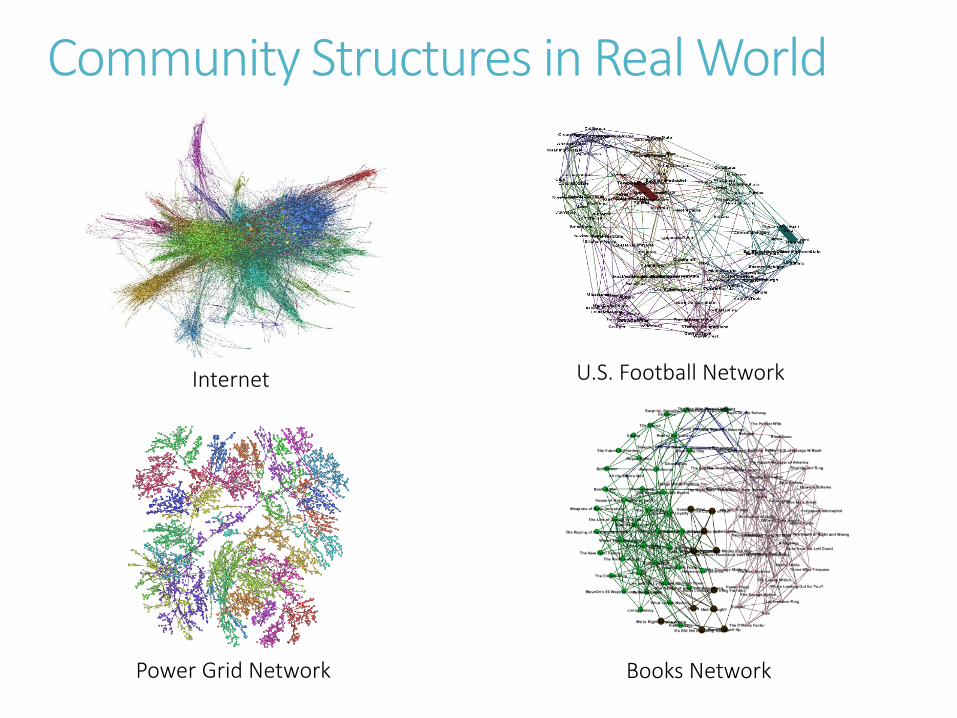
Community Structures in Real World
Internet U.S. Football Network
Power Grid Network Books Network

Modeling Communities as Graphs
Notion of communities is often defined as a graph structure, G = (V,E), representing set of objects E, and their linkages V.
Given a graph, a community is defined as collection of nodes that are more densely connected to each other than to the other nodes in the network.

Multiple Communities

State-of-the-artModularity
Measure of denseness of connections between nodes of same module and sparse connections between different modules.
Higher Modularity, well defined compact communities.
Modularity Maximization
A(i,j): Observed number of intra-community edges
KiKj / 2m : expected no. of edges between i and j if placed randomly

Modularity MaximizationEfficient Solution – Louvain Algorithm
Initially each node belongs to its own community
We go through each node and assign them to its neighbours community as long as its leads to increase in modularity.
This is followed until modularity cannot be maximized further
Vincent D. Blondel, Jean-Loup Guillaume, Renaud Lambiotte and Etienne Lefebvre: Fast unfolding of communities in large networks

• Edge Weights between community nodes are defined by the number of inter-community edges.
• Folding ensures rapid decrease in the number of nodes that need to be examined and thus enables large-scale application of the method.
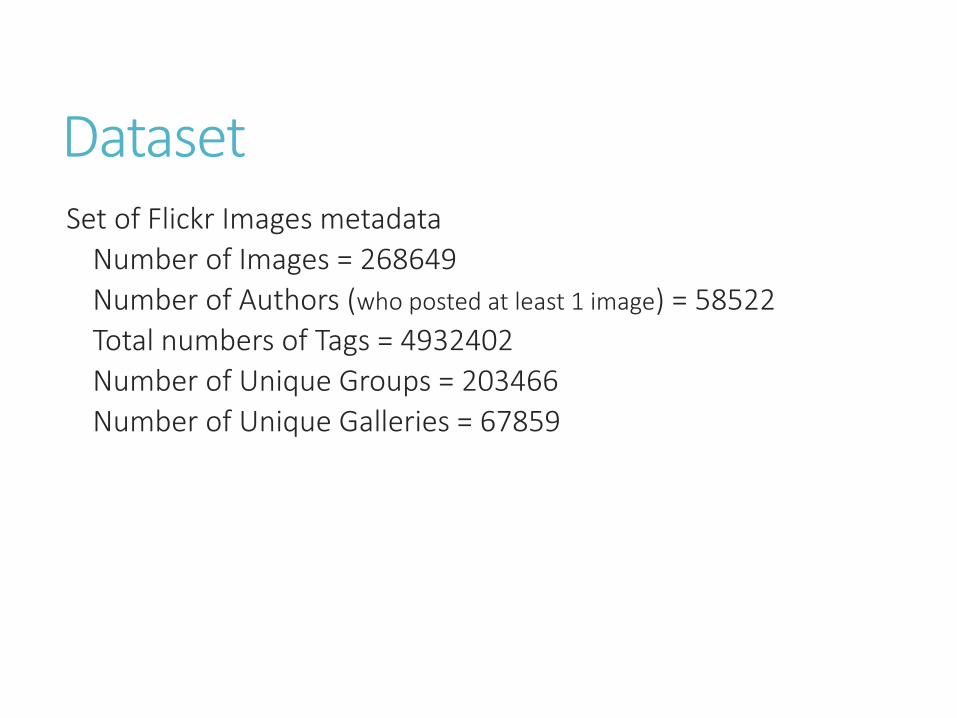
DatasetSet of Flickr Images metadata
Number of Images = 268649
Number of Authors (who posted at least 1 image) = 58522
Total numbers of Tags = 4932402
Number of Unique Groups = 203466
Number of Unique Galleries = 67859

Dataset DescriptionGraph |V| |E| Characteristics (each pair of author)
Edges formed between authors who used same tag(s)
58522 1491950 • Cosine Similarity b/w tags used• Group Contribution and Popularity
Distribution• Gallery Contribution and Popularity
Distribution
Edges formed between authors who share comments
589461 6012634 • Jaccard Similarity for comments shared• Group Contribution and Popularity
Distribution• Gallery Contribution and Popularity
Distribution
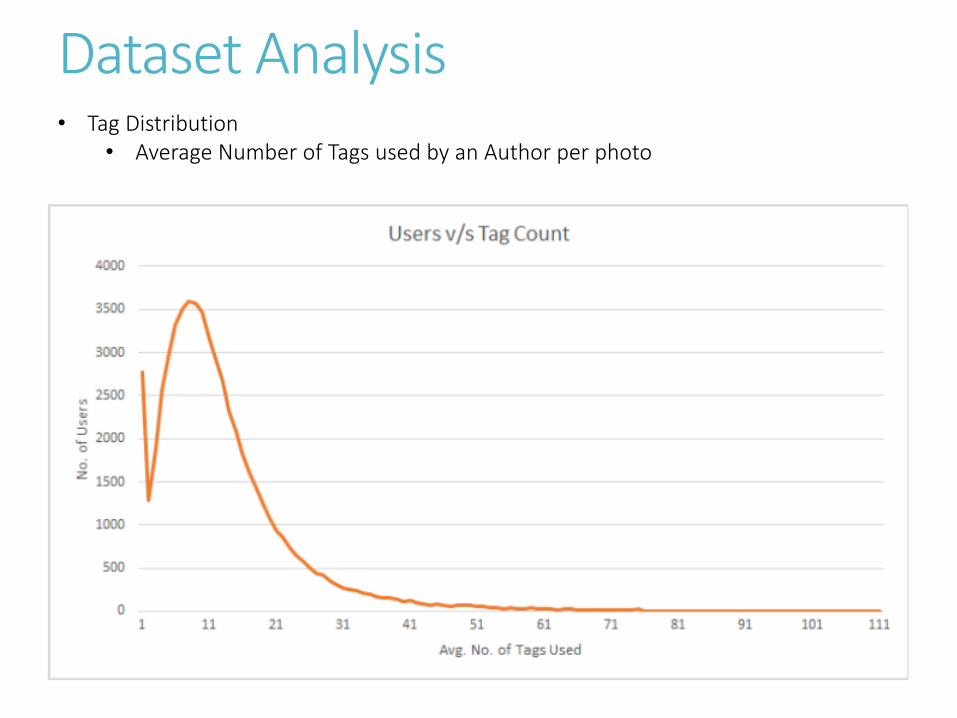
Dataset Analysis• Tag Distribution
• Average Number of Tags used by an Author per photo

• Photo Distribution• Number of Authors versus number of photos posted by them• Logarithmic scale for Y-Axis values
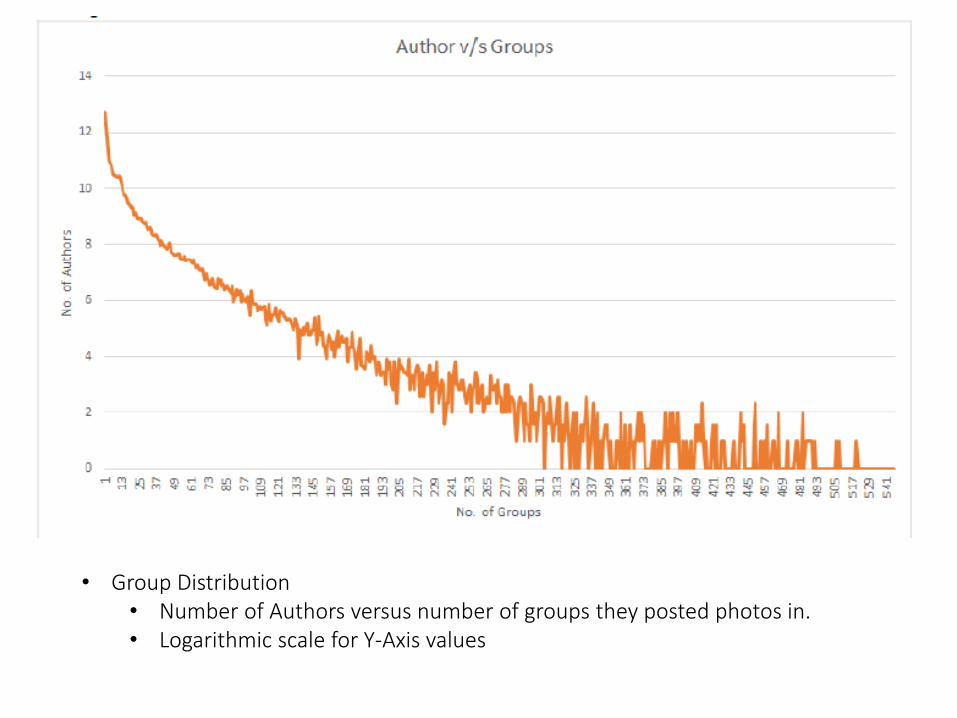
• Group Distribution• Number of Authors versus number of groups they posted photos in.• Logarithmic scale for Y-Axis values
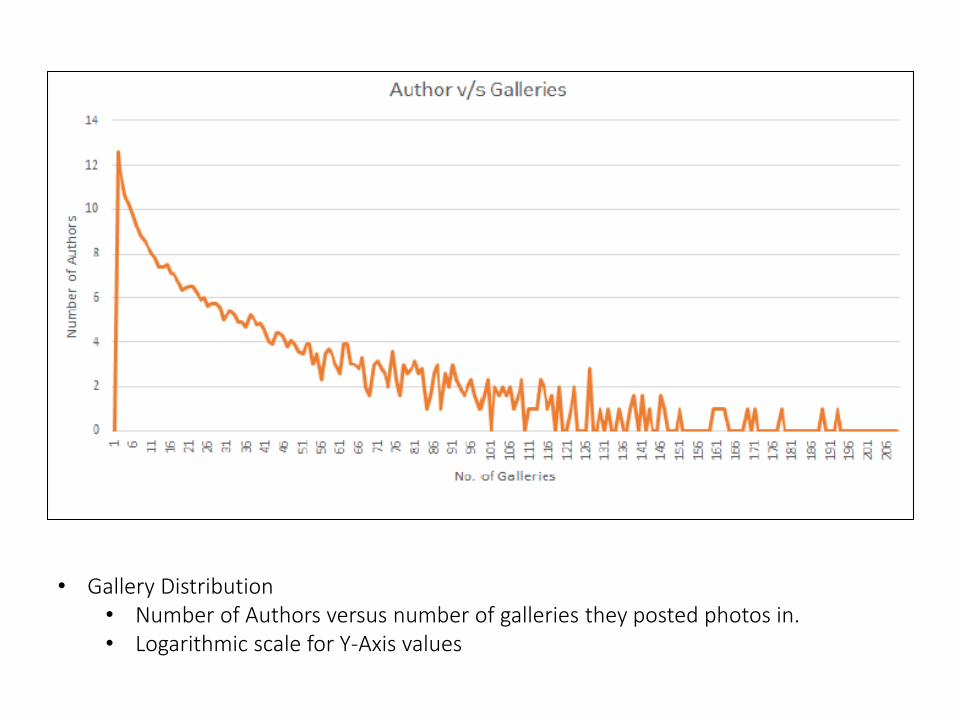
• Gallery Distribution• Number of Authors versus number of galleries they posted photos in.• Logarithmic scale for Y-Axis values

Formulae
Jaccard Similarity
J(A,B) = 𝑃(𝐴∩𝐵)
𝑃(𝐴∪𝐵)
Symmetrised KL Divergence
where
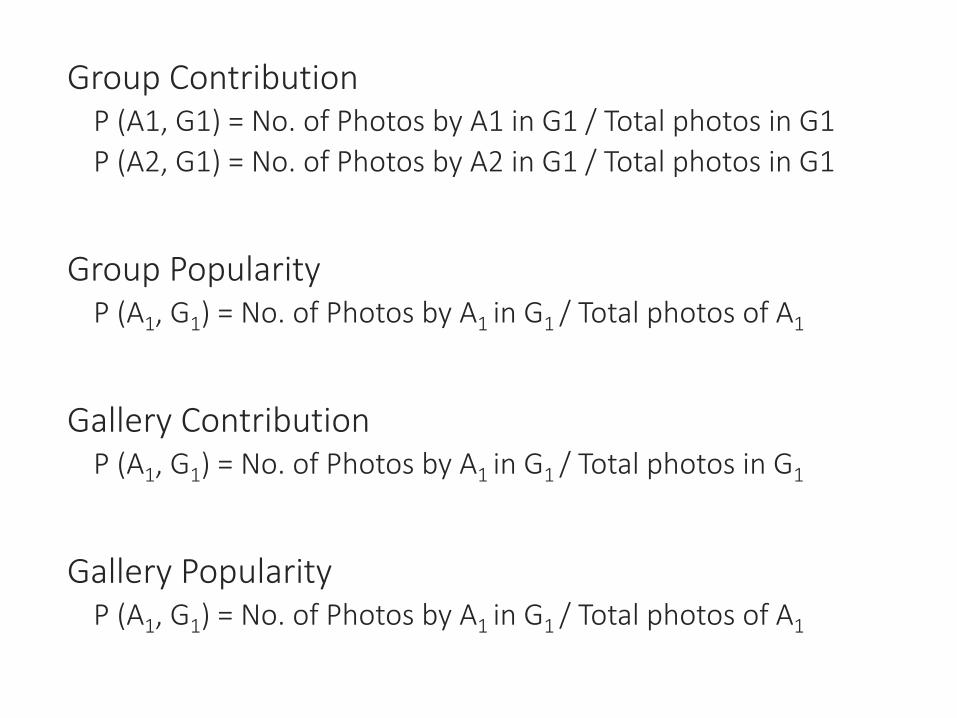
Group ContributionP (A1, G1) = No. of Photos by A1 in G1 / Total photos in G1
P (A2, G1) = No. of Photos by A2 in G1 / Total photos in G1
Group PopularityP (A1, G1) = No. of Photos by A1 in G1 / Total photos of A1
Gallery ContributionP (A1, G1) = No. of Photos by A1 in G1 / Total photos in G1
Gallery PopularityP (A1, G1) = No. of Photos by A1 in G1 / Total photos of A1

ResultsGraph Modularity Number of Communities
Edges formed between authors who used same tag(s) (Weighted) (Cosine Similarity)
0.6432 80
Edges formed between authors who used same tag(s) (Weighted) (Jaccard Index)
0.5723 1904
Edges formed between authors who used same tag(s) (Unweighted)
0.6092 7
Edges formed between authors who share comments (Weighted)
0.4306 1092
Edges formed between authors who share comments (Unweighted)
0.3372 1087
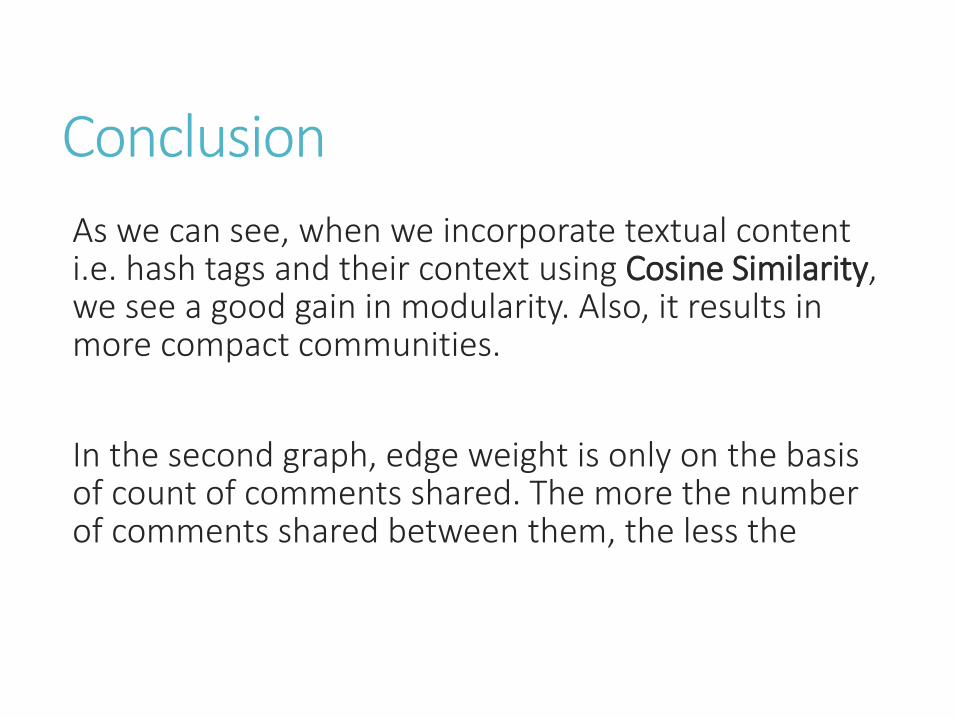
Conclusion
As we can see, when we incorporate textual content i.e. hash tags and their context using Cosine Similarity, we see a good gain in modularity. Also, it results in more compact communities.
In the second graph, edge weight is only on the basis of count of comments shared. The more the number of comments shared between them, the less the

Future Work
After successful identification of communities, we can also find most influential author for each communities. With this information, while someone is posting new images, he can use the tags used the author or even can mention the author. Since, the author is the most famous person, the image is likely to get more hits.


![Community detection in social networks[1]](https://static.fdocuments.us/doc/165x107/53ffb3738d7f724c088b479c/community-detection-in-social-networks1.jpg)