Actinide Integral Measurements on FCA for Evaluating and ...
40
NEACRP-A- 6q Actinide Integral Measurements on FCA for Evaluating and Improving Their Cross Section Data T. Mukaiyama, M. Obu, M. Nakano, S. Okajima, T. Koakutsu Japan Atomic Energy Research Institute Tokai, Ibaraki, Japan Actinide integral measurements were conducted in eight FCA assemblies to test the fission and capture cross sections of higher actinides. The assemblies built for this purpose cover the systematic change of the neutron spectrum shape. The integral data measured are (1) the central fission rate ratio of Np-237, Pu-238, Pu-239, Pu- 242, Am-241, Am-243 and Cm-244 relative to the fission in U-235, and (2) the central sample worths of Np-237, Pu-238, Pu-240, Am-241 and Am-243. The experimental procedures and results of the measurements are presented. The implications of the comparison between the integral data which contain the systematic; information of the neutron energy and the calculated values using the JENDL-2 and the ENDF/B data are discussed. 071500’ ‘i
Transcript of Actinide Integral Measurements on FCA for Evaluating and ...

NEACRP-A- 6q
Actinide Integral Measurements on FCA for Evaluating and Improving Their Cross Section Data
T. Mukaiyama, M. Obu, M. Nakano, S. Okajima, T. Koakutsu
Japan Atomic Energy Research Institute Tokai, Ibaraki, Japan
Actinide integral measurements were conducted in eight FCA assemblies to test the fission and capture cross sections of higher actinides. The assemblies built for this purpose cover the systematic change of the neutron spectrum shape. The integral data measured are (1) the central fission rate ratio of Np-237, Pu-238, Pu-239, Pu- 242, Am-241, Am-243 and Cm-244 relative to the fission in U-235, and (2) the central sample worths of Np-237, Pu-238, Pu-240, Am-241 and Am-243.
The experimental procedures and results of the measurements are presented. The implications of the comparison between the integral data which contain the systematic; information of the neutron energy and the calculated values using the JENDL-2 and the ENDF/B data are discussed.
071500’ ‘i

t.
0
l
1. Introduction
Among the radioactive wastes from the reprocessing plants, most of fission products decay to innocuous hazards levels in. a few centuries. After this period the radiological hazards of the actinides continue for millions of years. In order to alleviate the long-term risks, it has been proposed to recycle the actinides in fission reactors and to transmute them to nuclides with shorter half-lives. To recycle the actinides for transmutation, .they must first be separated from the wastes (partitioning). Confinement in a repository of actinide- depleted waste and of fission products from actinides transmuted may only need to be assured for 1000 years.
This actinide Partitioning and Transmutation concept will close the backend of the nuclear fuel cycle. This concept is shown in Fig.1 as the double stratanuclear fuel cycle. From the neutron economy point of view, the actinide recycle concept may be acceptable especially with the fast reactors because the most of actinides possess appreciable fission cross sections in high energy region. In this context, we proposed the Actinide Burning Fast Reactor as a candidate of actinide transmutations system.1),2)p3)
The assessment of the actinide recycle requires the reliable fission and capture cross sections of actinides over the whole energy spectrum of potential recyling system. Also many of the factors which effect the ex-core portion of the fuel cycle depend on the knowledge of build up of actinide nuclides. These nuclides influence the characteristics of the spent and recycled fuel through their contributions to neutron heating and source strength as well as to the long-termhazard of the reactor waste.
1

2. Status of actinides cross section data
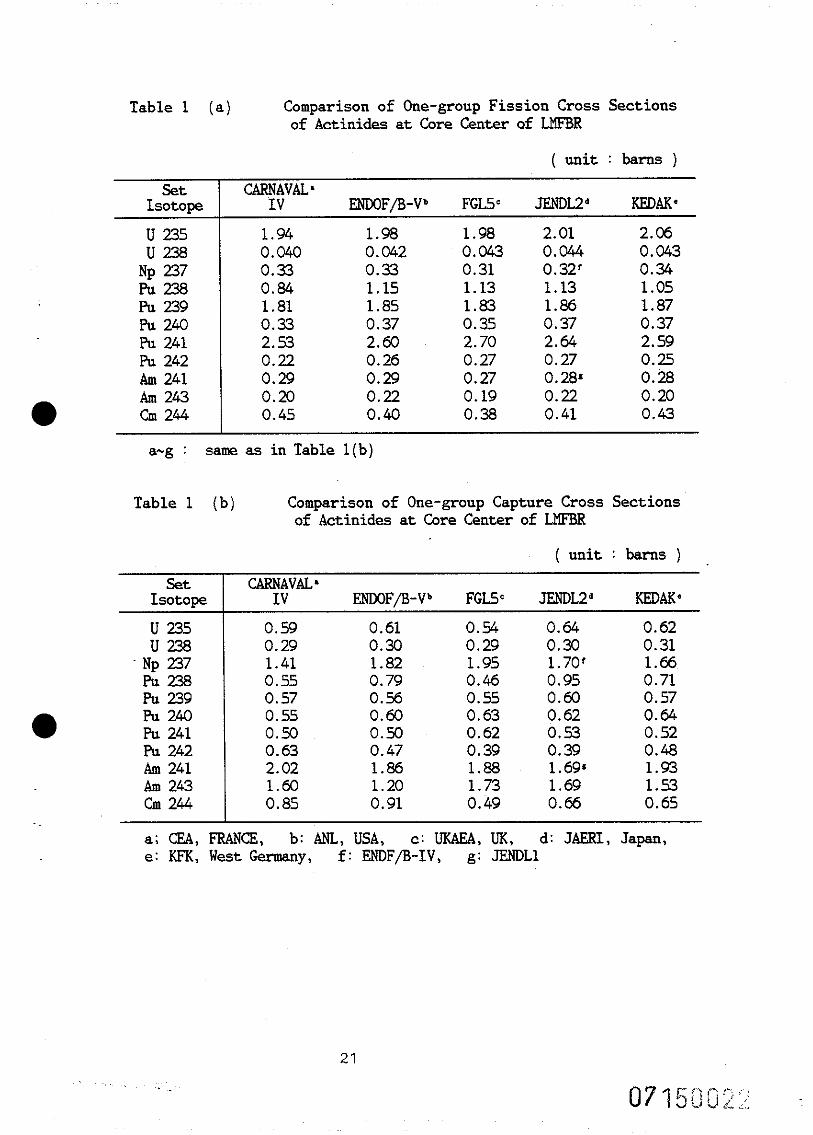
The status of actinide cross section data is much less satisfactory. In Table 1, various one-group cross section sets of major actinides are shown. The original of this table was edited by NEACRP for inter-comparison of fuel burn-up calculation for LMFBRh). These sets were obtained at several organization of member states of NEACRP by collapsing their latest evaluated data library using the core center neutron spectrum of NEACRP LMFBR bench mark model.,
.
As can be seen in Table 1, discrepancies among a different libraries are generally large in the capture cross section. At present, however, available variety of independent measurements of differential cross sections is rather limited, then the same differential measurements might be used for providing different evaluated cross section libraries in defferent organizations. In such case, errors may be much larger than those tha-t can be estimated from the discrepancies seen in the table. They, therefore, have to be tested against actual fast reactor experiments.
In these contexts, the intergral experiments were conducted on the fast critical facility FCA to evaluate and modify actinide nuclear data. 1),5),6),7) me
3. Integral measurements of actinide using FCA
Experiences on cross section evaluation studies suggest that the improvement of accuracy of nuclear data is most efficiently achieved by the combination use of differential and integral measurements. In contrast with differential measurements, integral measurements are very accurate, but the information with respect to energy dependence is rather less straightforward. Therefore, the choice of appropriate variety of neutron spectra where
2

integral measurements are taken place is most important for a successful improvement of cross section data.
Integral data which had been used for improving cross section of conventional material were mainly criticality and reaction rate ratio. However, most of actinide are highly radioactive and difficult to obtain pure materials enough to carry out critical experiment. Therefore, the
; ,.. realistic integral experiments which can provide comparisons of measurement versus calculation and hence are useful as benchmarks for data testing are, reactor irradiation experiments, sample perturbation measurements
a and reaction rate measurements.
The reactor irradiation experiments combined with radiochemical techniques for measuring higher actinide production rates have been performed in EBR-118), PFR as US-UK joint experimentq) and ZEBRA"). At CFRMF, capture and fission integral cross sections have been measured with a fission chamber and activation technique 11). Most of these experiments have been carried out under the inherent neutron spectrum of their reactor. These integral data, therefore, can provide only one point comparison of measurement versus calculation as far as neutron energy is concerned.
On the other hand, at FCA, seven uranium-fuelled
l assemblies and one plutonium-fuelled assembly were built so as to cover the wide range of spectrum shift. Sample reactivity worth measurements and fission rate ratio measurements for actinide nuclides were carried out on these assemblies. These measurements can hence provide eight integral data points along the neutron energy axis for each actinide samples measured.
3.1 Selection of standard neutron spectrum assemblies 4)
The factors considered for selecting assemblies were the followings, 1) simple core configuration in its

material composition and geometry using material of which cross section data are accurately known for :reliable neutron spectrum calculation, 2) small critical mass considering perturbation measurements of small actinide sample up to 2Og, 3) small temperature drift during perturbation measurements and 4) systematic neutron spectrum shift.
Under these guidelines, the series of uranium- ‘
fuelled assemblies FCA IX-I, -2, -3, -4, -5, -6 and -7 were built. The measurements were also conducted in the plutonium-fuelled assembly FCA X-l which was the physics mockup of the experimental fast reactor "JOYO" Mark II. a
The assemblies IX-1 to IX-6 were composed with 93% enriched metal uranium and diluent material of graphite or stainless steel for adjusting neutron spectrum in lower energy region or in higher energy region, respectively. The assembly IX-7 was composed with 20% enriched metal uranium. Atomic number density and the dimension of these assemblies are shown in Table 2.
The core cell patterns were designed to be :symmetric within one-drawer unit cell so as to make calculation models simple, except for the assembly X-I. The plate arrangements of unit cells are illustrated in Fig.2.
Each core is a quasi-cylindrical in geometry and is surrounded axially and radially by a depleted metal l uranium reflector of more than 30cm thikness to prevent room return neutron.
Calculated neutron spectra at the center of some of these assemblies are shown in Fig.3. Neutron spectrum is soft in the assembly IX-1 and becomes harder for an assembly of later number. Energy break down of B-10 (n, d) r'eaction at the core center is shown in Fig.4 in order to make spectrum shift more visible. The mean energies of B-lO(n,d ) reaction are about 2keV, 4OkeV and 150keV for the assembly IX-I, IX-3 and 1X-6, respectively. This change in the mean energies indicates
G
the systematic shift of neutron spectra.
i
3.2 Measurements of reactor physics parameters of the 5) assemblies
At each assembly, Keff, fission rates and sample worths of convetional materials were measured. Fission rates of U-235, U-238, Np-237 and Pu-239 were measured at the core center by using absolutely calibrated micro fission-chambers. The wall of pencil type chambers is made of aluminum and its dimension is bmmin diameter and 32mm in effective length. The fission-chamber was installed through a 20-mm-diam hole in the plate material along a radius 25.4mm from the axial midplane.
Sample worths of conventional~materials were measured by plate substitution or plate removal in the central cell. Descriptions of plate samples used for reactivity measurements are given in Table 3. The reactivity of sample perturbation was measured by the change in the calibrated control-rod positions to hold the reactor power constant when a sample was substituted or removed. The Tomlinson delayed-neutron data was used to convert the positive period measured to the absolute reactivity unit of Ak/k.
The measured fission rate ratios of U-238/U-235, Pu- 239/U-235 and sample worth ratio of natural B4C/93% enriched Uranium are shown in Fig. 5 to demonstrate the systematic neutron spectrum shift within the selected assemblies.
3.3 Fission rate ratio measurements')
The fission rates of the higher actinides were measured to provide a basis for the improvement of the fission cross section data. To achieve this, fission chambers were used to measure the Np-237, Pu-238, Pu-

20, h-241, Am-243 and Cm-244 fission rates relative to fission in U-235 at the core center of the FCA IX series assemblies and the Assembly X-l. The Pu-239 fission rate was also measured in these assemblies to check the measurements.
(I) Fission chambers The prallel-plate type fission-chamber was developed
for these measurements. The chamber is made of stainless steel and the separated isotope is electro-desposited on a platinum foil of cathod.
i
A chamber is filled with a mixture gas of 97% Ar and l 3% N2 at one atmosphere. The structure and dimensions of a chamber is illustrated in Fig. 6.
Absolute calibration of the deposits was achieved by oc- spectrometry using a sillicon surface barrier detector. The resolution of alpha - specrometry for deposited actinides was 14-18 KeV, depending on the deposited mass. The experimental error for deposited mass determination of principle isotopes was 0.5%, except for Cm-244, and 1.0% for Cm-244.
The deposited mass was adjusted to provide adequate fission rate at an adequate reactor power level in FCA, namely up to several ten watts. However, for isotopes with high alpha-specific activities such as Pu-238, Am- a 241 and Cm-244, the deposites was limitted to less than lO,ng for not incurring excessive alpha pulse pile-up.
The half-life data.used to deposite masses are shown in Table 4. The isotopic content of each chamber is given in Table 5. The fission pulse height spectrum of Cm-244 fission chamber is illustrated in Fig 7. The good separation of fission pulse from alpha pile-up pulse can be observed in this figure. The uncertainties of pulse counts due to "extrapolation-to-zero" is not significant because the fractions of "extrapolation-to-zero" counts to the total fission counts were 0.9% and 1.4% for Pu-238
6

and Am-241 chambers, respectively, and 0.3-0.7% for other chambers.
(2) Experimental procedure The fission chambers were accomodated in the central
fuel drawer. The arrangment is illsutrated in Fig. 8. During the measurements, the reactor power was
monitored by the two conventional fission chambers. The reactor power was 10 to 40 watts depending on the fission rates except for Cm-244 chamber. The total fission
counts of 1.5 x 10⁴ - 1.0 x IO5 were accumulated. For Cm-244 chamber, the reactor power was 200 watts to reduce the fraction of Cm-244 spontaneous fission background. This fraction to total counts was 20%.
(3) Corrections and Uncertainties The results are summarized in Table 8 as the fission
rate ratios relative to U-235 fission. The results of each isotope measurement was corrected for fission in impurity isotopes, so that the results quotated are the fission rates for the principle isotopes alone. The estimated contribution of impurity isotopes to fission in each chamber are given in Table 6 for the measurements in the soft spectrum (Assembly IX-I) and in the hard spectrum (Assembly 1X-6).
The correction for self-absorption of fission fragments was negligible because the layers of elctro- deposited mass were very thin in these chambers. The background correction for Cm-244 spontanious fission was obtained by the out-core measurement.
The correction for flux perturbation caused by the introduction of cavity and the stainless steel chamber was measured by using the aluminum pencil-type micro fission chambers of U-235 and Np-237. The fission rates of these chambers were measured by changing the cavity size and by adding the stainless steel plate around the

chambers. The correction factors for the arrangements illustrated in Fig. 8 were estimated by interpolating these results. These factors are given in Table 7. The calculation Of 70 group PlS16 in one-dimensional spherical1 shell geometry predicts the measured correction factor within experimental errors.
The total uncertainties of the fission rate measurements were about+- 2%, except for Cm-244. The uncertainty in Cm-244 fission rate measurements was about 14% due to relatively large uncertainty in deposit
determination.
(4) Results The results of the measurements for the fission rate
ratios of Np-237, Pu-238, Pu-242, Am-241, Am-243 and Cm- 244 relative to the fission in U-235 are summarised in Table 8.
3.4 Sample perturbation measurements7)
The integral data which can be used for the evaluation of the capture cross sections of higher actinides are the capture reaction rates and the sample reactivity worths combined with the fission rates. The capture reaction rates measurements provide .a direct basis for the improvement of the capture cross sections. However, to permit an accurate determination of the isotopic ratio, a relatively long irradiation time or a high power irradiation is required to produce a sufficient quantity of the capture products. Therefore, these measurements are usually not adequate in the fast critical facilities.
In the fast critical facility such as FCA, the core material composition can be easily changed to obtain various shapes of neutron spectra and the integral data measured in these circumstances can provide more
8

systematic information about neutron energy dependency than the data obtained in the reactors can provide.
Sample perturabtion measurements were carried out for the isolated actinide nuclides of Np-237, Pu-238, Pu- 240, Am-241 and Am-243. These samples were prepared at Oak Ridge National Laboratory in 1980. The Am-243 sample is very expensive (two million US$ for 2Og) but fortunately we could borrow from the United States Department of Energy.
(1) Actinide samples used for the perturbation measurements
The sample materials, usually about 15 grams in weight for Pu samples and 20 grams for the other samples, were loosely packed oxide powders sealed in double cylindrical stainless-steel capsules. To protect against hazards which might be caused by a failure of an inner capsule, an inner capsule is inserted in an outer capsule. The structure and the dimension of the capsule is illustrated in Fig. 9. In Table 9, are given the oxide powder, and actinide weight, spacer and capsule weight and length. The atomic composition of actinides is given in Table 10. These data were provided by ORNL.
(2) Experimental procedure The samples were introduced into the core center
through the stainless-steel tube which penetrate radially the assembly. The radial channel is created to accomade the tube by using plates containing holes. The wall thickness of the tube is 0.5 mm and the innerer diameter is 17.0 mm. The tube was installed along a radius 25.4 mm from the axial midplane.
The alpha-decay heat from the samples are removed by forced air flow through the gap between a sample capsule surface and the tube.
The reactivity of the perturbation introduced by a
9

sample was measured by the technique that involves oscillation of a sample to eliminate the reactivity drift problem caused by temperature drift or the very small position change (order of few ten microns) of the movable side of the half assembly even after two halves of the assembly are closed.
The calibrated auto control-rod holds the reactor power constant while a sample is oscillated. The auto control-rod position is recorded repeatedly when a sample is outside the assembly (the reference status) while a sample is oscillated. The change of the autorod position provides the reactivity drift in time. The sample reactivity relative to the reference status is then related to the autorod position change between a sample placed at the location of interest and the interporated reference status at the same time.
The same measurements were repeated for the empty capsule. The reactivity defferences between of the sample and of the empty capsule both relative to the reference gives the reactivity of the content, namely actinide powder.
(3) Corrections and uncertainties The accuracy of measurements depends on the auto
control rod position change with which the reactor power is to be held constant. The uncertainty of the position change was f: 0.02 mm (IP), this corresponds to 3.2-9.5 x 10m7 Ak/k in these assemblies for the actinide integral measurements.
The measured reactivity worths of oxide powder, which is described in the previous section, consist of worths of the priciple isotope, oxygen and of impurities.
The oxygen worths were measured by using the depleted uranium oxide sample contained in a cylindrical stainless steel capsule, a 93% enriched metal uranium plate and a natural metal uranium. An aluminum plate and
10

an alumina (A1203) plate were also used to measure oxygen worths. Both values of oxygen worth measurements agreed within the experimental errors.
As is shown in Table 10, the impurities can be classified into two groups, namely, actinides other than the principle isotope and the medium mass number elements
(Fe, Cr, Ni, P, Si, Zn, etc.). The total quantity of the 2nd group impurities is less than 1500 ppm of oxide powder and the worth contribution of these impurities was assumbed as equivalent with the worth contribution of the same weigh stainless steel.
For the first class impurities, measured worths were used to correct impurity worths of Np-237, Pu-238, Pu-239 and Pu-240, For the correction of the worths of Th-232, U-234, Pu-241, Pu-242 and Cm-244 as the impurities, the calculated worths were used. For this calculation, ENDF/B-V or in case that it is not available, B-IV data were used.
(4) Results The results for the actinide sample reactivity
measurements are given in Table 11. The values shown are the central reactivity worths of actinides relative to Pu-239 worths which are measured using the plate sample of Pu as described in the section 3.2 of this report.
The quoted errors are ?r~@ and represent the result of the error propagation for the correction of reactivity worths of capsule, spacer, oxygen and impurities. The errors of isotopic and impurity assays were not provided by ORNL and hence the quoted errors in Table 10 do not include the errors in the isotopic composition.
The Pu-239 worths measured by using the Pu-239 metal plate sample are also given in this table for the comparison.
In Fig. 10, the measured sample worth ratios of Np- 237, Pu-238, Pu-240, Am-241 and Am-243 relative to the
11

sample worth of Pu-239 is shown. The corrections of oxygen worths are quite Ylarge for
samples of which worths are close to null, such as Np- 237, Am-241 and Am-243 in the assemblies 1X-3,1!+ and X-l.
The second largest corrections are for the Pu-239 impurity in Pu-238 and Pu-240 samples. The Pu-239 contributions are 14-19% of Pu-238 sample and 1.4-3.0% of
~~-240 sample.
L. The data and method for the neutron fields calculation
The integral measurements provide the data basis for testing cross sections through comparison of the integral data between measured and calculated. For this purpose, the useful interpretation of integral measurements depends on the accuracy of calculation of the neutron fields in which the integral data were obtained as well as on the accuracy of the measurements. In an effort to check the accuracy of the neutron fields description, the extensive series of measurements as described in the section 3.2 of this report and calculations was performed.
4.1 Eigenvalue calculation
The basic nuclear data are processed by the GXS 2K/SP-2000/COLLAP2K1") codes. GXS2K reformats the basic data into libraries for SP-2000. SP-2000 is an infinite slab geometry 1950 energy group collision probability code which is used to calculate a fine group fundamental- mode spectrum and to produce a broad group, cell- averaged, self-shielded cross section.
The resultant broad group cross sections are used in the two-dimensional Pl transport calculation using S4 approximation for the R-Z model of "as-built" critical configuration. Real and adjoint flux obtained are kept for the reaction rates and the sample worths calculation.
12

In the series of calculations, the JENDL-2 library was used as the basic nuclear data. The resultant 20 broad group cross sections were used in the eigenvalue calculation, the reaction'rate calculation and in the first-order perturbation for the sample worths of conventional materials.
The eigenvalues were also calculated with the AGLI-2 library 13). The AGLI-2 is the adjusted 1950 energy group library. The original source data were taken from JAERI- Fast set14)~ and UK Nuclear Data File 15) and were adjusted using sixty six integral data, namely, thirty one eiganvalues, twenty nine reaction rate ratios and six sample worth ratios.")
The experimental eigenvalues and the ratios of calculated to experimental eigenvalues (C/E s) are shown in Table 12. In the calculation S4 approximation was used. S8 and S16 calculations were also performed to extrapolate Sa calculation. The Sm approximation gives O.2-0.3% smaller eigenvalues than P1S4 approximation. The range of C/E values for JENDL-2 calculation is from 1.0044 to 1.0104. The mean +_the standard deviation is 1.0078 L 0.0021. The mean value is 1.005 when Sa approximation is used.
When the AGLI-2 data is used, the discrepancy between C- and E- values are large for the assemblies IX-
4, 1X-5, 1x-6 where the stainless steel content is high. These discrepancies are caused by the following fact : The U-238 fission rate ratios relative to U-235 measured in ZPR-3 were used in the adjustment. The corrections of +8% were recommended to apply to the fission rate ratios measured using the stainless steel fission chambers 17).
These corrections are found to be incorrect. Except for the assemblies IX-&, 5 and 6 which
contain stainless steel diluent, the AGLI-2 calculation agrees with the experiment eigenvalues quite well.
13

L.2 Fission rate ratios calculation
In Table 13, experimental and C/E values of fission rate ratios relative to U-235 fission are given. For the calculation, the central flux and the cross sections of uniformly distributed detector within the cell are used.
With the JENDEL-2 calculation, C- and E- values agree quite well for Pu-239 and Np-237 fission and for the U-238 fission, the calculation overestimates averagely by 7%.
In the AGLI-2 calculation, the C/E discrepancies are l relatively large in stainless steel diluted assemblies (1X-4,5) and 20% enriched uranium assembly (1X-7) for the U-238 and Np-237 fission. For the Pu-239 fission, C- and E- values agree well except for the Assembly 1X-7.
4.3 Plate sample reactivity worth calculation
The plate sample worth experiments are computed using first-order perturbation theory with the super cell cross sections for the.perturbed cell. The perturbed super cell cross sections are generated using the SP-2000 code for the cell containning a sample plate in it. The summary of the experimental and C/E values for the central plate reactivity worths for 93% enriched uranium and 92% fissile plutonium plates is given in Table 12.
For both samples, the spectrum dependency of C/E is similar in the JENDL-2 calculation. In the ,JENDEL-2 calculation, the range of C/Es is from 0.94 to 1.05 except for the assemblies IX-1 and -7. In the AGLI-2 calculation, the discrepancies are large in the stainless steel diluted case (Assembly IX-41 as are the cases for the eigenvalues and fission rate ratios of the threshold fission nucleids and also the discrepancies are large in the assemblies IX-l and -7.
14
4.4 Discussion for the neutron field calculation
The analysis procedure using SP-2000/two-dimentional transport calculation provide the reasonably accurate shape of the neutron spectra when the JENDL-2 data is used. On the other hand, there exists some deficiency in the AGLI-2 data to calculate the neutron spectra in the heigher energy region for the assemblies of the high
content of stainless steel. Therefore, the JENDL-2 data are to be used as the
basic nuclear data for the analysis of the higher actinide integral experiments.
The large discrepancies of C/E values for sample worths in the assemblies IX-l and -7 may be caused either by the reactivity scale conversion or by the improper spectrum calculation for the very soft spectrum system or for the system which contains large quantity of U-238. The further analysis on this point is required.
5. Higher actinides C/E values for central fission rate ratios and sample reactivity worths
The JENDL-2 and ENDF/B-V data of higher actinides were evaluated by comparing the experimental and calculated values of the central fission rate ratios and the sample reactivity worths. For Pu-239 and Pu-240, the ENDF/B-V data are not available, therefore, the ENDF/B-IV data are used.
5.1 Central fission rate ratios
For those nuclides which are contained as the core material, such as U-235 in allofthe assemblies, and for Pu-239 and Pu-240 in the assembly X-l, the self-shielded, 20 energy group cross sections are already obtained for
15
the neutron field calculation in the JENDL-2 calculation. The self-shielded broad group cross sections of U-235, Pu-239 and Pu-240 in these assemblies are collapsed from 1950 group data using the fundamental-mode spectrum of SP-2000 caculation for the ENDFIB-V by COLLAP 2K code.
For other exotic nuclides which are not contained in the core material, infinitely-diluted 20 group cross sections are collapsed using 1950 group fundamental-mode spectrum.
These cross sections are combined with the :real flux computed by P?S,,+ calculation for RZ model using the JENDL-2 data.
The summary of C/E values of the central fission rate ratios relative to the fission in U-235 is given in Table 14.
5.2 Central sample worths
The real and adjo int fluxes obtained for the unperturbed neutron field calculation are used. The broad group, effective macroscopic cross sections for the perturbed case are generated or collapsed from 1950
energy group data. The central sample wo:rihs are computed using the first-order perturbation theory combinning above-mentioned fluxes and the cross sections.
The experimental values are given in Table 11 and C/E values of worth ratio relative to Pu-239 worth of the same weight are given in Table 15. The Pu-239 worths are measured using plate samples. In this table, is given the U-235 worth ratios which are derived from the plate sample worths of 93% enriched uranium and natural uranium, for comparison.
5.3 Discussion of the actinide integral data (1) Fission rate ratios
For Np-237 of JENDL-2, Pu-238 of both JENDL-2 and

ENDF/B-V) and for Pu-239 of both data, calculated values
agree with the experimental values within experimental
errors except for Pu-238 in the assembly 1X-2. The
discrepancies between C- and E- values are quite large for Pu-238 fission in the assembly IX-2 for both JENDL-2 and ENDF/%-V. There might be a chance of exceptionally large error in the measurement.
The calculations give 4 to 6% larger vlues than the experiments for Np-237 of ENDFIB-V, Am-241 of both data. For Pu-242 fission, the calculation gives 10% larger values. For Am-243 fission, the JENDL-2 data give
l averagely 14% larger fission rate than the experiments, and ENDFIB-V data gives 10% larger values. For the Cm- 244 fission rate, the dicrepancies between calculation and experiments are averagely 7% and 9% for JENDL-2 data and ENDFIB-V data, respectively.
As a whole, there is no spectrum dependency in the discrepancies between calculated and experimental fission rate ratios and the calculation gives generally larger values except for Np-237 of the JENDL-2 data. (2) Sample worths
In some cases, C/E comparison is not adequate because of very small reactivity worths. For these cases, C-E values are given instead of C/E values.
The agreement between the calculation and the experiments are satisfactory for U-235 worth relative to the Pu-239 worth.
Generally, the calculation using the ENDF/% data gives larger discrepancies from the experimental worth values~ than the calculation using the JENDL-2 data. However, for Pu-240 worths, both of the JENDL-2 and the ENDF/%-IV data give very small worth ratios.
Comparing the discrepancies of C- and E- values in the fission rate ratios and those in the sample worths, it is apparent that the significant modification of the capture cross sections in these actinides are necessary.
17
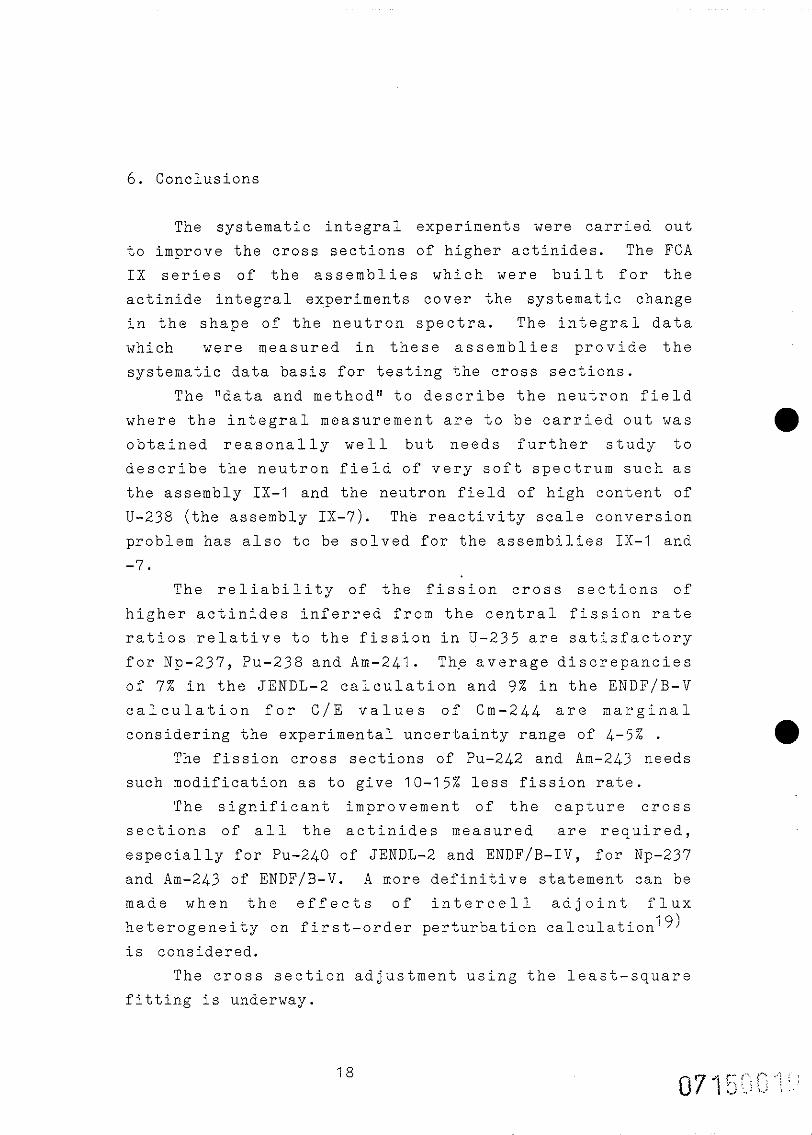
6. Conclusions
The systematic integral experiments were carried out to improve the cross sections of higher actinides. The FCA IX series of the assemblies which were built for the actinide integral experiments cover the systematic change in the shape of the neutron spectra. The integral data which were measured in these assemblies provide the systematic data basis for testing the cross sections.
The "data and method I' to describe the neutron field where the integral measurement are to be carried out was l obtained reasonally well but needs further study to describe the neutron field of very soft spectrum such as the assembly IX-I and the neutron field of high content of U-238 (the assembly 1X-7). The reactivity scale conversion problem has also to be solved for the assembilies IX-1 and -7.
The reliability of the fission cross sections of higher actinides inferred from the central fission rate ratios relative to the fission in U-235 are satisfactory for Np-237, Pu-238 and Am-241. The average discrepancies of 7% in the JENDL-2 calculation and 9% in the ENDF/B-V calculation for C/E values of Cm-24L are marginal considering the experimental uncertainty range of 4.-5% .
The fission cross sections of Pu-24.2 and Am-243 needs such modification as to give IO-15% less fission ra.te.
The significant improvement of the capture cross sections of all the actinides measured are required, especially for Pu-240 of JENDL-2 and ENDF/B-IV, for Np-237 and Am-243 of ENDFIB-V. A more definitive statement can be made when the effects of intercell adjoint flux heterogeneity on first-order perturbation calculation 19)
is considered. The cross section adjustment using the leas-t-square
fitting is underway.
ia

Acknowledgements
The part of this program~me was carried out under the contract between JAERI and the United States Department of Energy. K. Koyama was the member of this programme in the
early stage. The authors are gratefully indeted to H.
Kuroi and H. Yoshida for their valuable discussions. Thanks are also expended to FCA staffs for their support in the experimental and analytical work.
References
’ 1)
2)
3)
4)
' 5)
-. 6)
7)
8)
T. Mukaiyama, H. Nitani, K. Koyama, M. Obu, H. Kuroi, "Evaluation of actinide cross sections by integral experiments", Nuclear Cross Sections for Techonology
(P rot. Int. Conf. Knoxville, 19791, NBS SP 594 (Washington, 1980). H. Murata, H. Kuroi, "A proposed concept on actinide waste transmutation", A perspective on adaptive nuclear energy evolution, towards a world of neutron abundance, IIASA Workshop (Laxemburg, May, 1981). H. Murata, T. Mudaiyama, Atomkernenergie-Kerntechnik,
45(l), 23(1984). "NEACRP LMFBR Benchmark Calculation, Intercomparison for Fuel Burn-up". M. Nakano, et al., "Actinide Integral Experiments at FCA - Selection of Standard Cores and Their Characteristics -I', JAERI-M 82-114, 53(1982). M. Obu, et al., "Actinide Integral Experiments at FCA, - A Measurement of Actinide Fission Rate Ratios - 11 ibid., 60. T. Mukaiyama, et al., "Actinide Integral Experiments at FCA - Actinide Sample Worth Measurements - , ibid. 57. D. Gilai, et al., "Experimental and Caculational Analysis of Actinide Samples Irradiated in EBR-II", ORNL-5791 (1982).
19

9) T. Quinby, et al., "Preparation of Actinide Specimens for the US/UK Joint Experiment in the ,Dounreay Prototype Fast Reactor", ORNL-5858 (1982)
IO) J. Sanders, et al., "Some Aspects of Fast Reactor Operation Studies in ZEBRA", Fast Reactor Phy:iscs 1979
(P rot. 1nt. Sump. Aix-en-Provence, 1979)) IAEA-SM- 2&k/38 (Vienna, 1980).
11) R. Anderl, et al., "INEL Integral Data-Testing Report for ENDF/B-V Dosimeter Cross Sections", EGG-PHYS-5608
(1981). 12) H. Kuroi, T. Tone, "SP-2000 Program for Calculating
Fine Group Neutron Specturm in Multi-region Cell and Effective Broad Group Constants", JAERI 1240 (1975).
13) H. Kuroi, T. Tone, "Cross Section Data and Specifications of AGLI/O for Fast Reactor Analysis", JAERI 1230 (1972).
14) s. Katsuragi, et al, "JAERI Fast Reactor Group Constants Systems", JAERI 1195 and JAERI 1199 (1970).
15) S. Norton, J. S. Story, AEEW-M-802 (1967). 16) H. Kuroi, private communication. 17) P.F.Palmedo, "Compilation of Fast Reactor
Experiments", BNL 15746 (1971). 18) L.Tomlinson,"Delayed Neutrons from Fission",AERE-R
6993 (1972). 19) K.S.Smith," Nucl. Sci. Tech.,a,&51(1982).
l
l
20
l
l
-.
Table 1 (a) Comparison of One-group Fission Cross Sections of Actinides at Core Center of LMFBR
( unit : barns )
set CARNAVAL' Isotope IV F.NDOF/B+ FGEP JENDL2d KEDAK*
u 235 U238
Np 237 Pu23 Pu 239 Pu 240 F’u 241 Pu 242 Am 241 Am 243 Cm 244
1.94 0.040 0.33 0.84 1.81 0.33 2.53 0.22 0.29 0.20 0.45
1.98 0.042 0.3 1.15 1.85 0.37 2.60 0.26 0.29 0.22 0.40
1.98 2.01 0.043 0.044 0.31 0.32' 1.13 1.13 1.83 1.86 0.35 0.37 2.70 2.64 0.27 0.27 0.27 0.28~ 0.19 0.22 0.38 0.41
2.06 0.043 0.34 1.05 1.87 0.37 2.59 0.25 0.28 0.20 0.43
a-g : same as in Table l(b)
Table 1 (b) Comparison of One-group Capture Cross Sections of Actinides at Core Center of LMFBR
( unit : barns )
set CARNAVAL' Isotooe IV FNGOFIB-Vb FGL5c JFNDL2d KEDAK'
u 235 U238
'Np 237 Pu23a Pu 239 Pu 240 F’u 241 Pu 242 Am 241 Am 243 cm 244
0.59 0.29 1.41 0.55 0.57 0.55 0.50 0.63 2.02 1.60 0.85
0.61 0.30 1.82 0.79 0.56 0.60 0.50 0.47 1.86 1.20 0.91
0.54 0.64 0.29 0.30 1.95 1.70' 0.46 0.95 0.55 0.60 0.63 0.62 0.62 0.53 0.39 0.39 1.88 1.69s 1.73 1.69 0.49 0.65
0.62 0.31 1.66 0.71 0.57 0.64 0.52 0.48 1.93 1.53 0.65
a; CEA, FRANCE, b: ANL, USA, c: UKAEA, UK, d: JAERI,Japan, e: KFK, West Germany, f: ENDF,'B-IV, g: JENDLl
21

Nuclide
U-235 U-238
Pu-239 h-240 PI-241
C 0 Na Al Cl- Fe Ni
-__
F Table 2(a) Atomic Number Density of FCA M and X-l Assemblies
( x 1o2p atoms/cm5 1
M-l M-2
0.2260 0.4521 0.0171 0.0342
6.89 6.43
0.183 0.183 0.665 0.665 0.080 0.080
T
L
M-3 M-4 M-5 IX-6 M-7
0.6781 0.4521 0.6781 0.6781 0.7840 0.0513 0.0342 0.0513 0.0513 3.112
5.97
0.183 1.391 1.305 0.456 0.183 0.665 5.051 4.738 1.675 0.665 0.080 0.591 0.555 0.406 0.080
* Data on April. 1984.
Table 2(b) Dimansions of FCA M and X-l Assemblies
Assembly M-l M-2 M-3 M-4
Core dimension Radius(cm) L.. zn. .._ 75 23.10 17.89 27.59 Height(cm) 60.96 40.64 35.56 50.80 Volu4 Q ) 176.5 68.13 35.76 121.5
Blanket Radial(cm) 31.23 35.08 39.62 32.48 thickness Axial (cm) 35.56 35.56 35.56 35.56
a
I I
x-1
0.0740 0.5207 0.2094 0.0184 0.0010*
1.283 0.766 0.576 0.367 1.356 0.169
Blanket
0.0084 4.018
0.183 0.665 0.080
M-5 M-6 M-7 X-l
20.42 22.89 17.34 28.63 40.64 40.64 35.54 50.80 53.24 66.84 33.59 130.8
a

Table 3 Plate Samples Used for Sample Reactinity Worth Measurements
I . I , Sample Rai? Cgv
93X EU u-235 77- 92.89
Its Weight k) Dimensions
238 .11 Y,E 50.8 x 50.8 x 1.59m' x 2 plates
92% Pu F$-;;9 Pp;o Ply; h6F,,. 50.8 x 50.8 x 1.59m' x 2 plates
* Data on the 1st January, 1973.
Table 4
Isotope
U - 232 IJ - 234 U - 235 U - 236 U - 238
Np - 237 Pu - 238 Pu - 239 Pu - 240 Pu - 241 Pu - 242 Am - 241
2 I ;gl
Cm - 242 Cm - 243 Cm - 244 Cm - 245 Cm - 246
* IT : ** T :
Half-Lives of Decay used to determine Deposit Masses of Actinide Fission chambers
Half-Life ( years ) ?ecay Mode Reference
a a a a a a a a a a a a iz a b
i b b
a b a a IT* 14.1 a a 7.38 R+3 : . ;,; g a a 162.8 ( days ) k 0.25 % a T** 28.5 f 0.7 % a a 18.11 f 0.1 91 a a 8500 +. 1.2 % a a 4.73 E+3 f 2.1 % a
Isometric transition. Total half-life for a-emission and orbital electron capture.
70.0 f 1.4 % 2.446 E+5 f 0.3 % 7.038 E+8 rt 0.1 % 2.342 E+7 i 0.2 % 4.468 E+9 f 0.1 % 2.14 E+6 f 0.5 %
87.74 f 0.1 % 2.411 E+4 f 0.1 % 6.537 E+3 k 0.15 %
14.4 f 1.4 % 3.76 E+5 zt 0.5 %
432.6 * 0.14 %
(a) INDC (RDS)-121/RE, IAEA (1980) (b) IRK (NDS)-139/K IAEA (1982)
23
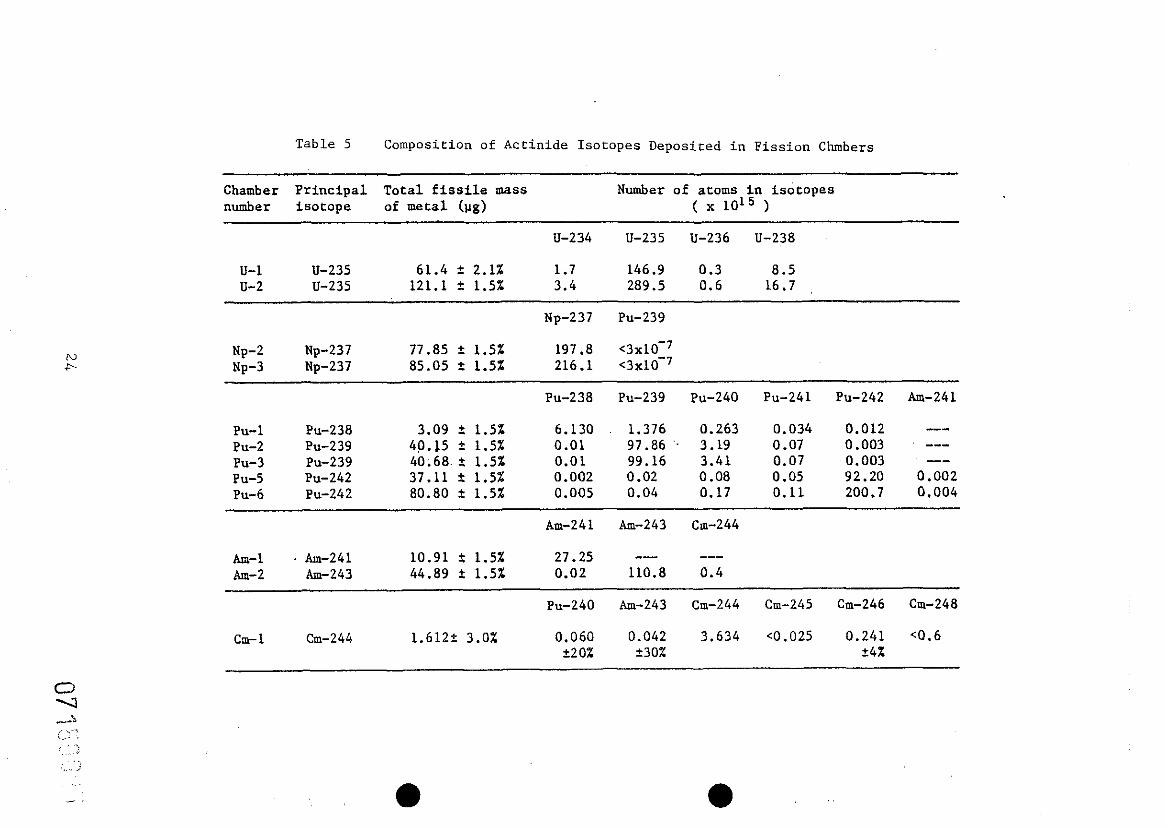
Table 5 Composition of Actinide Isotopes Deposited in Fission Chmbers
Chamber Principal Total fissile mass Number of atoms in isotopes number isotope of metal olg) ( x ml5 )
U-234 U-235 U-236 U-238
U-l U-235 61.4 + 2.1% 1.7 146.9 0.3 8.5 u-2 U-235 121.1 * 1.5% 3.4 289.5 0.6 16.7
Np-237 Pu-239
Np-2 Np-237 77.85 ?: 1.5% 197.8 <3x10⁻⁷ Np-3 Np-237 85.05 2 1.5% 216.1 <3x10⁻⁷
Pu-238 Pu-239 PO-240 Pu-241 Pu-242 An-241
Pu-l Pu-238 3.09 + 1.5% 6.130 1.376 0.263 0.034 0.012 -- Pu-2 Pu-239 40.15 f 1.5% 0.01 97.86 '. 3.19 0.07 0.003 --- Pu-3 Pu-239 40.68.2 1.5% 0.01 99.16 3.41 0.07 0.003 -- Pu-5 Pu-242 37.11 t 1.5% 0.002 0.02 0.08 0.05 92.20 0.002 Pu-6 Pu-242 80.80 + 1.5% 0.005 0.04 0.17 0.11 200.7 0.004
- Am-241 Am-243 Cm-244
Am-l . Am-241 10.91 t 1.5% 27.25 -- --- Am-2 Am-243 44.89 5 1.5% 0.02 110.8 0.4
Pu-240 Am-243 cm-244 Cm-245 Cm-246 Cm-248
cm-1 Cm-244 1.6129 3.0% 0.060 0.042 3.634 co.025 0.241 ~0.6 t20'X ?30% +4x
‘, a

Table 6 Contributions of Impurity Isotopes to Total Fission Rate in Soft (Assembly IX-l) and Hard (Assembly 1X-6) Spectra Cores
Principal isotope Assembly Percent contributions from each in chamber isotope (%I
U-234 U-235 U-238
U-235 IX-1 0.2 99.6 0.2 IX-6 '0.7 98.8 0.5
Pu-238 Pu-239 Pu-240 Pu-241 P&-a2
Pu-238 IX-1 70.7 27:3 1.2 ,0.8 - IX-6 78.5 19.3 1.7 0.5 co.1
Pu-239 IX-1 - 99.2 0.7 0.1, -- IX-6 - 98.4 1.5 0.1 --
Pu-242 IX-1 -- 0.1 0.1 0.5 99.3 IX-6 - 0.1 0.1 0.1 99.7
Pu-240 Am-243 Cm-244 Cm-246
Am-243 IX-1 - 99.4 0.6 -- Ix-6 - 99.4 0.6 -
Cm-244 IX-L 3.3 0.6 89.9 6.1 1x-6 5.3 0.7. 87.9 6.1
Table 7 Correction Factors for Fission Chamber Cavity
Assembly Correction factor '
IX-1 1.02 t 1% xx-2 1.02 + 1% IX-3 1.02 + 1% IX-4 1.00 ? 1% IX-5 1.00 + 1% IX-6 1.02 k 1% IX-7 1.02 t 1% X-l 1.02 + 1%
25
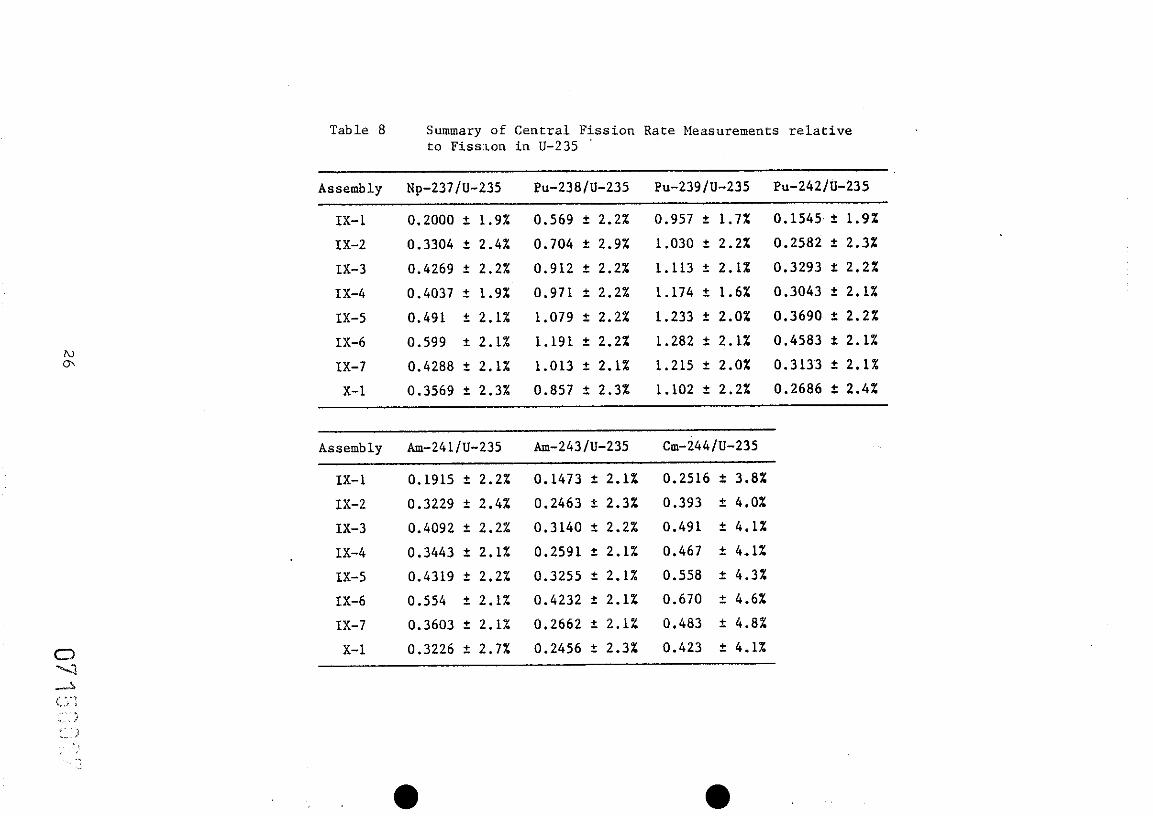
Table 8 Summary of Central Fission Rate Measurements relative to Fiss:mn in U-235
Assembly Np-237/U-235 Pu-238/U-235 Pu-239/u-235 Pu-242/U-235
IX-1 0.2000 + 1.9% 0.569 i 2.2% 0.957 t 1.7% 0.1545.t 1.9% IX-2 0.3304 + 2.4% 0.704 r 2.9% 1.030 + 2.2% 0.2582 z 2.3% IX-3 0.4269 -f 2.2% 0.912 r 2.2% 1.113 k 2.1% 0.3293 + 2.2% IX-4 0.4037 ?: 1.9% 0.971 t 2.2x 1.174 + 1.6% 0.3043 + 2.1% IX-5 0.491 f 2.1% 1.079 i 2.2% 1.233 + 2.0% 0.3690 t 2.2% 1X-6 0.599 +- 2.1% 1.191 r 2.2% 1.282 i 2.1% 0.4583 i 2.1% IX-7 0.4288 t 2.1% 1.013 + 2.1% 1.215 + 2.0% 0.313~3 + 2.1%
X-l 0.3569 t 2.3% 0.857 i 2.3% 1.102 t 2.2% 0.2686 ?; 2.4%
Assembly Am-241/U-235 Am-243/U-235 h-244/U-235
IX-1 0.1915 + 2.2% 0.1473 r 2.1% 0.2516 + 3.8% IX-2 0.3229 2 2.4% 0.2463 + 2.3% 0.393 i 4.0% IX-3 0.4092 + 2.2% 0.3140 t 2.2% 0.491 + 4.1% IX-4 0.3443 2 2.1% 0.2591 + 2.1% 0.467 + 4.1% IX-5 0.4319 + 2.2% 0.3255 C 2.1% 0.558 + 4.3% IX-6 0.554 t 2.1% 0.4232 i 2.1% 0.670 + 4.6% IX-7 0.3603 + 2.iX 0.562 + ‘2.iz 0.483 t 4.8% X-l 0.3226 + 2.7% 0.2456 f 2.3% 0.423 + 4.1%
a a
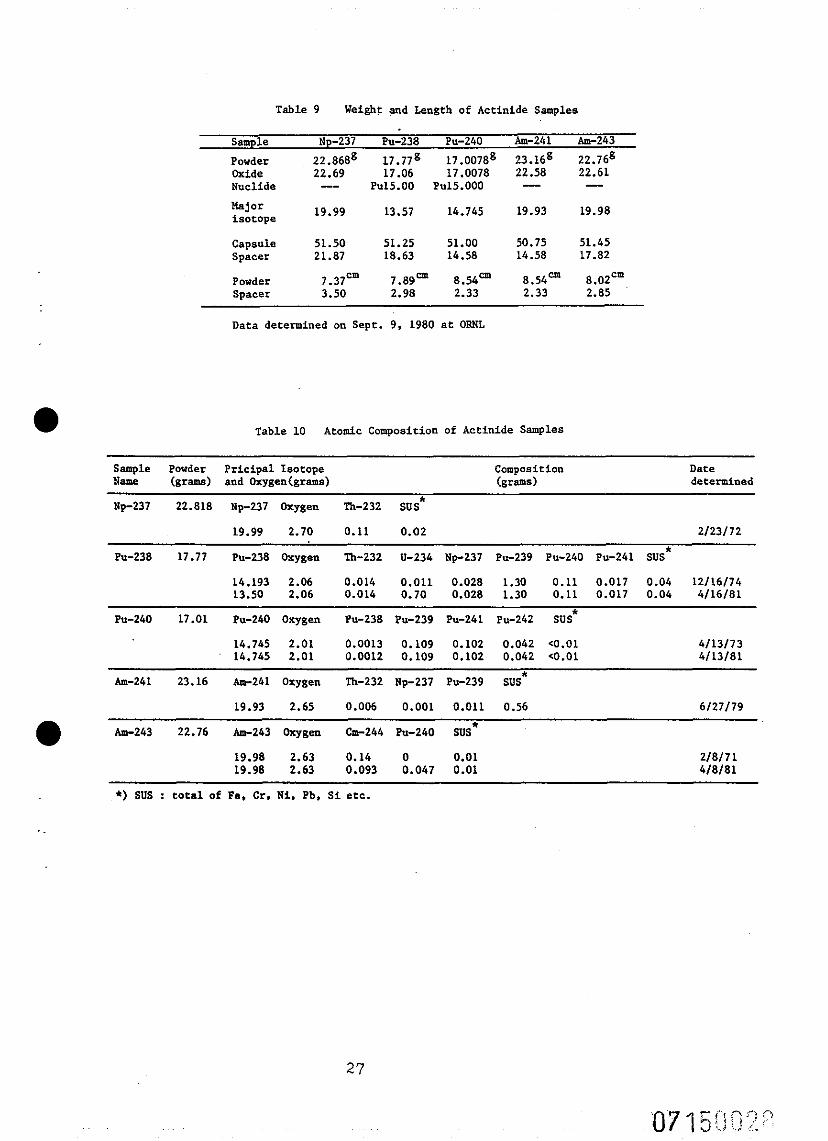
Table 9 Weight and Length of Actinide Samples
Sample Np-237 Pu-238 PP240 Am-241 Arc-243
Powder 22.868' 17.778 17.0078S 23.Xg 22.7@ Oxide 22.69 17.06 17.0078 22.58 22.61 Nucllde -- Pu15.00 P"15.000 - -
nejor isotope 19.99 13.57 14.745 19.93 19.98
Capsule 51.50 51.25 51.00 50.75 51.45 SplEX 21.87 18.63 14.58 14.58 17.82
Powder 7.37cm 7.s9= S.54cm S.54cm 8.0Zcm spacer 3.50 2.98 2.33 2.33 2.85
Data determined on Sept. 9, 1980 at ORNL
Table 10 Atomic Composition of Actinide Samples
Sample Powder Pricipal Isotope Composirion Date NZlW (grams) and O%ySen&m.) (grams) determined
Np-237 22.818 Np-237 Oxygen Th-232 sus*
19.99 2.70 0.11 0.02 2123172
Pu-238 17.77 Pu-238 Oxygen Th-232 U-234 Np-237 Pu-239 Pu-240 Pu-241 SUS*
14.193 2.06 0.014 0.011 0.028 1.30 0.11 0.017 0.04 12116174 13.50 2.06 0.014 0.70 0.028 1.30 0.11 0.017 0.04 4/16/81
Pu-240 17.01 Pu-240 Oxygen Pu-238 Pa239 Pu-241 Pu-242 sus*
14.745 2.01 0.0013 0.109 0.102 0.042 CO.01 14.745 2.01 0.0012 0.109 0.102 0.042 co.01
Am-241 23.16 Am-241 Oxygen Th-232 Np-237 Pu-239 sus*
19.93 2.65 0.006 0.001 0.011 0.56 6127179
Am-243 22.76 Am-243 Oxygen Cm-244 PI,-240 sus"
19.98 2.63 0.14 0 0.01 2/S/71 19.98 2.63 0.093 0.047 0.01 4/S/81
*) sus : total of Fe. Cr. Ni. Pb, Si etc.
27
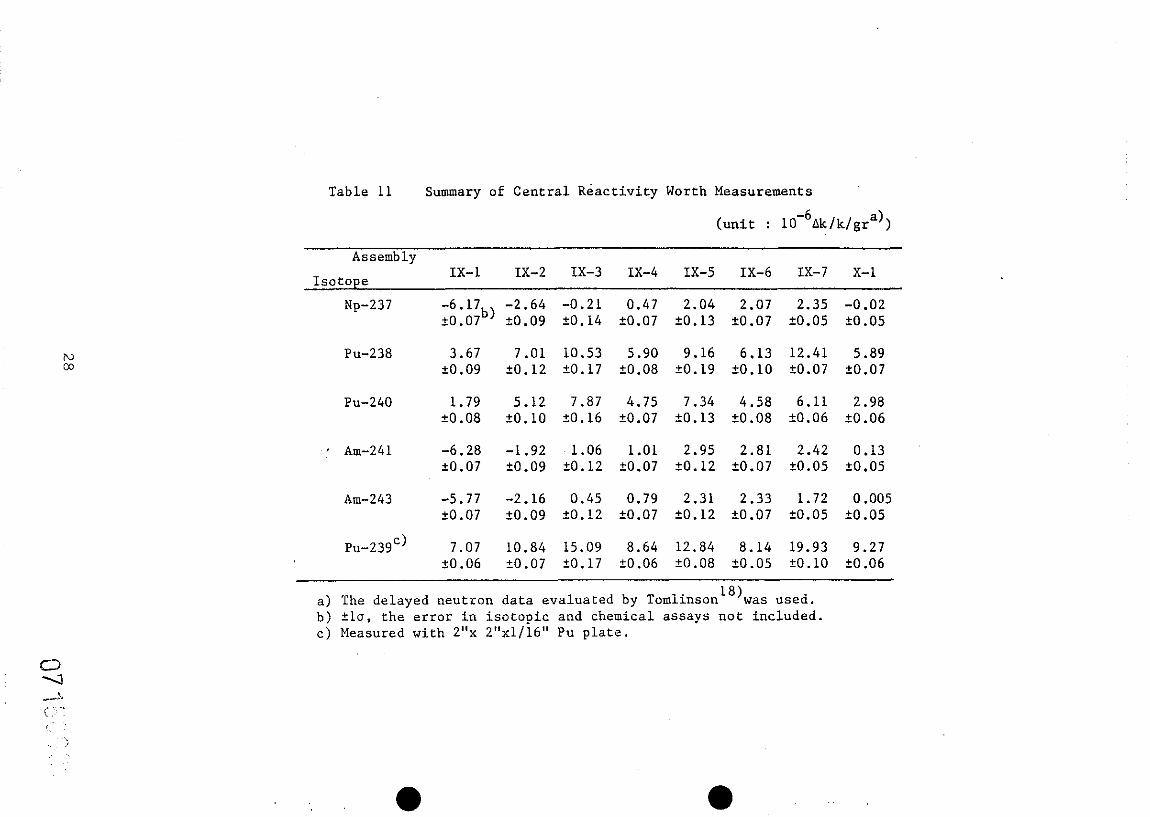
Table 11 Summary of Central R&activity Worth Measurements
(unit : 10-6Ak/k/gra))
Assembly Isotope IX-1 IX-2 IX-3 IX-4 IX-5 IX-6 IX-7 X-l
Np-237 -2.64 -0.21 0.47 2.04 2.07 2.35 -0.02 to.09 to.14 to.07 to.13 +0.07 to.05 to.05
Pu-238 3.67 7.01 10.53 5.90 9.16 6.13 12.41 5.89 to.09 to.12 +0.17 to.08 20.19 50.10 to.07 to.07
Pu-240 1.79 5.12 7.87 4.75 7.34 4.58 6.11 2.98 to.08 to.10 20.16 to.07 to.13 ~0.08 ~0.06 20.06
, Am-241 -6.28 -1.92 '1.06 1.01 2.95 2.81 2.42 0.13 to.07 to.09 to.12 20.07 to.12 20.07 to.05 to.05
Am-243 -5.77 to.07
-2.16 to.09
0.79 2.31 2.33 1.72 0.005 io.07 to.12 to.07 to.05 $0.05
pu-23gc) 7.07 ~0.06
10.84 20.07
0.45 to.12
15.09 20.17
8.64 12.84 8.14 19.93 9.27 to.06 to.08 20.05 to.10 $0.06
a) The delayed neutron data evaluated by Tomlinson 18) was used. b) +lu, the error in isotopic and chemical assays not included. c) Measured with 2% 2"x1/16" Pu plate.
a

,’ 0 a ‘I” Table 12 Sunmary of F~~~imental and C/E Values for Eigenvalues and Central Plate Sanple Worths
b ntegrd arameter
Assembly NO.
M -1
M -2
lx -3
M -4
M -5
Jx -6
Jx -7
x -1
Mean flU
Ei
Experiment
mvalue C/E
JENDL-2 AGLI-2
P(
Experiluent (lo-*%Ak/k)
1.0077 f 0.0007 1.009 0.997 4.68 f 0.8%
1.0107fO. 0008 1.009 1.005 7.27 f 0.6%
1.0086fO. 0008 1.005 1.003 10.26 f 1.1%
1.0075 f 0.0007 1.007 1.012 5.86 f 0.7%
1.0095 f 0.0006 1.008 1.016 8.63 f 0.6%
1.0082 f 0.0006 1.004 1.008 5.55 f 0.9%
1.0095 f 0.0007 1.010 1.001 13.24 f 0.6%
1.0085 f 0.0006 1.024 1.010 6.16 f 0.7%
IJZNDJ-2 AGLI-2 JJ!NJ.n-2 AU-2
1.154
1.062
1.017
0.995
0.973
0.949
0.875
1.148 6.54 f 0.7%
1.023 9.16 f 0.5%
0.993 12.03 f 0.8%
1.096 6.91 f 0.7%
1.036 10.02 f 0.5%
0.960 6.24 f 0.9%
0.908 15.60 f 0.6%
0.943 7.97 f 0.6%
1.124
1.029
1.017
0.980
0.954
0.943
0.885
1.153
1.031 .
1.027
1.085
1.021
0.961
0.914
0.950
. 0095 ,. 0065 1.004 1.013 0.990 1.018 t 0.0059 t 0.0059 f 0.088 fO.075 fO.076 f 0.073
Gzntral Plate Sampl& Worth I
t

Table 13 T!hmary of Experimental and C/E Values for Central Fission Rate Ratio
Central Fission Rate Ratios b
ntegral ammeter h259/ UZS6 lP3*/ u236 RP”‘/ UzS5
Assembly No.
Experiment C/E Experimsnt C/E C/E
ENDL-2 AGLI-2 JENDL-2 AGLI-2 ELxperiment
JEm-2 AGLI-2
. Ix -1 0.975 f 3.3% 0.979 1.015 0.0301 f 3.6% 1.086 1.053 0.199 f 4.8% 0.995 1.050
Ix -2 1.014 f 3.1% 1.024 1.043 0.0520 f 3.Z 1.071 1.027 0.331 * 4.7% 0.985 1.030
Jx -3 1.116 f 3.2% 1.008 1.023 0.0686 f 3.4% 1.060 1.012 0.425 f 4.7% 0.981 1.024
lx -4 1.180 f 3.1% 1.022 1.042 0.0456 rt 3.5% 1.083 1.068 0.406 f 4.7% 1.010 1.111
Ix -5 1.255 f 3.1% 0.998 1.018 0.0621 f 3. 3% .l. 054 1.029 0.493 f 4.7% 0.992 1.077
IX -6 1.336 f 3.1% 0.970 0.987 0.0892 f 3.4% 1.044 1.003 0.590 f 4.6% 0.986 1.049
M -7 1.192 f 3.0% 1.037 1.057 0.0532 zk 3.3% 1.075 1.056 0.414 f 4.5% 1.014 1.109
x -1 1.059 f 3.2% 1.066 1.076 0.0497 f 3.5% 1.080 1.004 0.348 f 4.7% 0.997 1.060
Mean 1.013 1.033 1.069 1.032 0.9945 1.064 flu 10.03 fO.03 fO.015 f0.03 io. 011 fO.04
‘, a a

,’ a l “”
Table 14 C/E Values of Actinide Fission Rate Ratios relative to U-235 Fission
Assembly Data Np 237 F'n 238 No. Library U 235 U 235
Ix-l
lx-2
lx-3
M-4
lx-5
M-6
lx -7
x -1
Fu 239 U 235
F'n 242 ,u 235
Am 241 u 235
Am 243 u 235
1.145 -----__ 1.102
Cm 244 u 235
. .
JEMIL-2 0.989 --------- ENDF/B a)
-------- 1.056
1.000 ------- 1.023
1.102 ------- ‘1.085 ------- 1.083
1.031 ------ 1.055
0.997 ------- 0.999 21.118
0.987 1.092 -------- -------- 1.066 1.128
1.083 ------- 1.115
1.050 ------- 1.059
1.133 ------- 1.110
1.053 1.009 ------- -_------ 1.097 1.025
JFNDL-2 --_------ ENDF/B
JF.NDL-2 --------- ENDF/B
0.977 ------I 1.037
0.992 1.085 1.059 1.141 ----__ 1.100
1.066 --_--- 1.094
1.011 1.001 1.098 1.049 1.010
JENDL-2 --------- J.ZNDF/B
1.015 0.996 ------_ ------- 1.072 0.996
0.996 0.983 ------__ -------- 1.049 0.981
1.027 -_----- 1.020
1.016 -__----- 1.008
1.100 -------- 1.106
1.064 1.147 __----- -----__ 1.051 1.114
1.145 ------__ 1.104
1.105 ---__--- 1.119
1.097 ---__--_ 1.111
JF.NDL-2 --------- FNDF/B
0.971 -------- 1.022
0.977 1.070 1.042 1.127 ------_- 1.079
1.076 1.011 JENDL-2 ENDF/B 0.971 1.075 1.025 1.098 1.003
JFNDL-2 0.978 0.986 1.096 --------- -------- -------- -___---- FNDF/B 1.034 0.984 1.103
1.053 1.156 1.084 1.017 __------ -------- ---__--- -------- 0.963 1.126 1.107 1.009
JENDL-2 0.971 0.996 1.077 --------- -------- -------- -_------ FNDF/B 1.032 1.003 1.089
1.038 1.111 1.032 1.026 -------- -------- ---_--- -------- 1.028 1.081 1.059 1.024
a) : FINDF/B-V for Np-237, Pu-238. Am-241, Am-243 ad U-235, ENDF/L-lV for h-239 and Pu-240

Table 15 C/E Values of Actinide Sample Worth Ratios relative to Pu-239 Worth
w N
Assembly Data Np 237 Pu 238 Pu 240 Am 241 Am 243 U 235
No. Library Pu 239 Pu 239 Pu 239 Pu 239 Pu 239 Pu 239
a) M -1 JENDL 1.06 0.70 -0.73 0. 98 0. 91 1.012
--i&/i-b, --------- ---------
0. 99 0.84 -0.61 1.00 0.77 1.022
lx -2 JENDL 1.01 1.00 0.53 0.96 (0.081) 0.985 -------- ENDF/B 0. 60 1.08 0. 59 0.86 (0.262) 0.979
lx -3 JENDL (0.0209 1.07 0.69 (0.017) 1.002 _-------- -------- (O.079) ____ --__ ENDF/B (0.120) 1.12 0.74 (0.035) (0.238) 0.995
lx -4 JENDL (0. 028) 1. 08 0. 58 -------- (-0.052) (0.0004) 0.976 __-----_- -------- -------- ENDF/B (0.210) 1.12 0. 62 (-0.036) (0.137) 0.978
lx -5 JENDL 1.11 1.11 0. 67 0.77 1.11 0.967 __-----_ --__---- -----__- -------- ---__--- ENDF/B 1.57 1.15 0.70 0. 80 1. 78 0.970
M -6 JENDL 1. 06 1.12 0. 80 1.01 1.14 0.980 _-----_-- -------- -------- ENDF/B 1. 36 1.17 0. 84 1.01 1. 49 0. 991
lx -7 JENDL 1. 16 1.18 1.03 1.12 (0.051) 1.007 ENDF/B 1. 63 1. 25 1. 08 1.16 (0.156) 1.028
x -1 JENDL (0. OiOj i.03 0.8i (0. OiE) co. 042: 0.979 ENDF/B (0.079) 1.10 0.88 (0.029) (0.167) 0.994
: JENDL-2 : ENDF/B-V for Np-237. Pu-238. Am-241. Am-243 and U-235, ENDF/B-lV for Pu-239 and Pu-240 : Values in perentheses are C-E for (Cl or/and IEl < 0.1
a l

,’ a 1st Stratum of Fuel Cycle
Fuel PFaakation
Power 5tation 3000 MWT
x IO
Reprocessing Plant
1
I ” Radioactive Radioactive Waste FPs FPs 9.0 ton
11 Actinide Actinide 1.6ton
99.5 % u , Pu L
2nd Stratum of Fuel Cycle ( P-T Cycle)
Waste Disposal
Reprocessing Plant
FP 0.36t
Fig.1 Flow of Radioactive Waste per Year through Double Strata Fuel Cycle combined with Partitioning & Transmutation ;(Actinide Burning Fast Reactor)

0 Y
IX-1
I I I ,
-
c
-
L
IX-4
Fig.2
-
0
-
IX-2
IX-6
I- 5.08cm I
Plate Arrangement of Unit Cells in FCA IX Assemblies
l
IX-3

a ,.
Neutron Energy (eV 1
Fig.3 Calculated Neutron Spectra at the Center of FCA IX Assemblies
0 IX-I A IX-3 + IX-4 * IX-6

I
- IX-I ---- *x - 3 - IX-6
c- 1 7
r-2 --7 L,
-2
f--?--L! r-J :-
-J i h
0 Fig.4 Energy Breakdown of B-10 Capture Rate u at the Cater of FCA IX Assemblies -.A C.?
0.c
-F49 /F 25
W(Nat. B&VW(93%EU)(1~0k--
\a----, .H P --‘*/--LY
I I I I I I I I x x x x x x x x 7 - - - - - -
Assembiy No.
Fig.5 Central Fission Rate & Sample Worth Ratios
measured at FCA IX & X Assemblies
‘, a a

Foil with actinide Chamber body
Dimensions in mm
Fig.6 Stracture of Actinide Fission Chambers
104L 104L , , 1 1 1 I 1 1 1 I 1 1 t t I I I I I I 1 1
‘44Cm fission ‘44Cm fission chamber chamber y-events operating voltage
io3 r
- +EYtrapolated .
counts I I
0 0 1 1 I 8 I I 8 I I I I I I I 0 0 I I I I 0 0 10 10 20 30 40 50 60 20 30 40 50 60 70 70 80 80 90 90 100 100 110 110 120 120 130 130
Channel number Channel number
Fig.7 Fission Pulse Height Distribution
of Cm-244 Chambers
Q? 1 pqy 37

Cable-channel
m 93% enriched uranium consisting of half plate
l/8 in. thickness m Carbon .
a Fig. 8 Drawer Arrangement to accomodate Fission Chamber
( unit in mm 1
4.5 - 80 - 30 0.5 128.4
. . Capsule material : Stainless steel 304 L Wall thickness : 0.5 rrAm
Fig.9 Structure of Actinide Sample for Reactivity Measurements
38

l Np-237/Pu-239 0 Pu- 238/Pu-239 a Pu- 240/ Pu-239 v Am-241 / Pu-239 0 Am-243/ Pu-239
Fig.10 Central Sample Worth Ratios of Actinide measured in FCA Assemblies
39