ACTASM ANNUAL REPORT 2012 - RACS | Royal … · ACTASM ANNUAL REPORT 2012 ... 6. PROFILE OF...
36
ACTASM ANNUAL REPORT 2012 ACT Audit of Surgical Mortality
-
Upload
trinhthuan -
Category
Documents
-
view
214 -
download
0
Transcript of ACTASM ANNUAL REPORT 2012 - RACS | Royal … · ACTASM ANNUAL REPORT 2012 ... 6. PROFILE OF...

Telephone: +61 2 6285 4558
Facsimile: +61 2 6285 3366
Email: [email protected]
Address: 3/13 Napier Close Deakin ACT 2600 Australia
Web: www.surgeons.org/actasm
ACTASM ANNUAL REPORT 2012ACT Audit of Surgical Mortality

AC
TAS
M A
NN
UA
L R
EP
OR
T 2
012
2

AC
TAS
M A
NN
UA
L R
EP
OR
T 2
012
3
Contact
Royal Australasian College of Surgeons
Australian Capital Territory Audit of Surgical Mortality (ACTASM)
3/13 Napier Close
Deakin ACT 2600
Australia
Telephone: +61 2 6285 4558
Facsimile: +61 2 6285 3366
Email: [email protected]
Website: www.surgeons.org/actasm
The information contained in this annual report has been prepared under the auspices
of the Royal Australasian College of Surgeons, Australian Capital Territory Audit of
Surgical Mortality Management Committee, which is a declared quality assurance
committee under the Health Act 1997.
The information contained in this annual report has been prepared by the Royal
Australasian College of Surgeons, Australian Capital Territory Audit of Surgical Mortality
Management Committee. The Australian and New Zealand Audit of Surgical Mortality,
including the Australian Capital Territory Audit of Surgical Mortality, has protection
under the Commonwealth Qualified Privilege Scheme under Part VC of the Health
Insurance Act 1973 (Gazetted 23 August 2011).
ACTASM 2011 Annual Report designed and printed by Entegy
(www.entegy.com.au); Brisbane, Australia.

AC
TAS
M A
NN
UA
L R
EP
OR
T 2
012
4
Contents
Tables 5
Figures 5
Chairman’s reporT 6
shorTened Forms 7
exeCuTive summary 8
1. INTRODUCTION 12
1.1 Background 12
1.2 Project governance and confidentiality 12
1.3 The audit process 13
1.3.1 Notification of deaths 13
1.3.2 Methods 13
1.3.3 Providing feedback 14
1.3.4 Audit inclusion and exclusion criteria 14
1.4 Reporting conventions 14
1.4.1 Terminology 14
1.4.2 Assessor opinion 15
1.4.3 Focus of reporting 15
1.5 Data 15
1.5.1 Data Entry 15
1.5.2 Storage of Data 15
1.5.3 Data Validity 16
1.5.4 Data Analysis 16
1.5.5 Denominator 16
2. AUDIT PARTICIPATION 17
2.1 Audit numbers 17
2.2 Surgeon participation 17
2.2.1 Surgeon Participation 17
2.2.2 Assessor participation 18
2.3 Surgeon participation by specialty 18
2.4 Surgeon completion of surgical case forms 18
2.5 Hospital participation 19
2.5.1 Participating hospitals 19
2.5.2 Time in hospital before death 19
3. PATIENT PROFILE 20
3.1 Age and gender 20
3.2 Acuity of audited cases 20
3.3 Clinical Risk Profiles 20
3.3.1 ASA Rating 20
3.3.2 Patients with comorbidities 21
3.3.3 Patients with a malignancy 21
3.4 Surgeon perception of risk status 22
4. RISK MANAGEMENT STRATEGIES 23
4.1 Prophylaxis for Venous Thromboembolism (VTE) 23
4.2 Fluid management 23
4.3 Provision of critical care support to patients 24
4.4 Antibiotic regime 24
5. CAUSE OF DEATH 25
5.1 Frequency of causes of death reported in audit period 25
5.2 Establishing cause of death 25
6. PROFILE OF OPERATIVE INTERVENTION 26
6.1 Operative intervention 26
6.2 Timing of surgical episodes 26
6.3 Seniority of surgeon operating 26
6.4 Postoperative complications 27
6.5 Anaesthetic problems 27
6.6 Transfers between hospitals in the ACT and NSW 27
7. PEER REVIEW OUTCOMES 29
7.1 Surgeon retrospective review 29
7.2 Second-line assessments 29
7.3 Clinical management issues 29
7.3.1 Perceived impact of clinical management issues 30
7.4 Improvements in care 32
8. CONCLUSIONS 33
9. ACKNOWLEDGMENTS 34

AC
TAS
M A
NN
UA
L R
EP
OR
T 2
012
5
Tables
Table 1: Comparison data: ACTASM 2012 and
ANZASM 2012 10
Table 2: ASA grade definitions 21
Table 3: Overview of post-mortems performed
in the ACT 25
Table 4: Perceived impact of clinical issues
groups 31
Figures
Figure 1: Governance structure, Royal Australasian
College of Surgeons, ANZASM and
ACTASM 12
Figure 2: Regional audit governance structure,
ACTASM 13
Figure 3: ACTASM methodology 14
Figure 4: Audit status 17
Figure 5: Participating public and private
hospitals, treating surgeons and
assessors in the ACT 18
Figure 6: Surgeon agreement to participate by
speciality 18
Figure 7: Number of surgical case forms
completed by each specialty 18
Figure 8: Classification of surgeon completing
surgical case form 19
Figure 9: Time in hospital before death 19
Figure 10: Gender distribution by age
bracket 20
Figure 11: Patient deaths by specialty 20
Figure 12: Distribution of ASA grades of audited
cases 21
Figure 13: Frequency of comorbidities 21
Figure 14: Percentage of patients with
malignancy 22
Figure 15: Risk of death as perceived by treating
surgeons 22
Figure 16: Type of VTE prophylaxis used 23
Figure 17: Issues in fluid balance 23
Figure18: Appropriateness of the antibiotic
regime 24
Figure 19: Most common causes of death 25
Figure 20: Timing of emergency surgical
episodes 26
Figure 21: Seniority of operating surgeon by
operation number 26
Figure 22: Frequency of postoperative
complications 27
Figure 23: Type of issues associated with patient
transfers 28
Figure 24: Frequency and spectrum of clinical
management issues recorded per
patient as recorded by assessors 30
Figure 25: Assessors perception of areas of
clinical management that could be
improved 32
Figure 26: Surgeons perception of areas of
clinical management that could be
improved 32

AC
TAS
M A
NN
UA
L R
EP
OR
T 2
012
6
Chairman’s reportThis is the second annual report for the Australian Capital Territory Audit of Surgical Mortality (ACTASM), covering data from 1 January 2012 to 31 December 2012. We are pleased with the progress made to date, with the audit covering all the public and private hospital sites in the ACT, and surgeon participation at 99%. I would like to personally thank all surgeons for helping us to achieve this high level of participation.
We are pleased to welcome RANZCOG (Royal Australian and New Zealand College of Obstetricians and Gynaecologists) Fellows to the audit process. This is the first year they have participated in the audit and participation rates are steadily increasing.
The Australian and New Zealand College of Anaesthetists (ANZCA) have also indicated interest in joining ACTASM. A representative of ANZCA now participates in the ACTASM Management Committee, and an application for Commonwealth Qualified Privilege has been lodged with results pending.
The Royal Australasian College of Surgeons (RACS) considers that participation in clinical audit is an essential facet of continuing professional development (CPD). As such, the College Council has mandated participation in one of the state/territory audits of surgical mortality as a component of recertification. The excellent participation rates within the ACT reflect this view, and I would encourage those clinicians who do not already act as an assessor to consider this role.
Undertaking an assessment is an enriching experience. The anonymity provided by the process offers an opportunity for open and honest clinical opinion. The second-line assessment, while time consuming, is both rewarding and educational. Surgeons who have done assessments are usually thorough in completing surgical case forms as they understand what detail is needed to offer a sound picture of the surgical care provided. We encourage all surgeons to review the case notes, complete all data fields and give your assessment of the case when completing the surgical case form.
ACTASM is part of a national network of similar audits, coordinated through the College by the Australian and New Zealand Audit of Surgical Mortality (ANZASM). As such, it contributes a territory-wide overview of surgical care from within the ACT to the national dataset. Both ACTASM and ANZASM rely on the quality and completeness of the data provided on the audit forms. The current audit forms have been revised and the increasing use of Fellows Interface, the college web-based platform, has certainly streamlined the processes of data submission and assessment. I encourage my colleagues to consider using this system if they have not yet done so. I am hopeful that, eventually, surgeons may be able to fill out the surgical case forms as soon as the death occurs, further streamlining the process and enabling the surgeon to complete the form while the case is still fresh in their mind.
ANZASM made a major contribution to the plenary session on safety and quality at the 2013 Annual Scientific Congress. Some publications are already in press and others are in preparation. ACT surgical trainees looking to gain experience in research and participate in quality improvement should be encouraged to approach ACTASM to access this valuable research data source.
The ACTASM Management Committee continues to provide good advice and constructive ideas on how to monitor, analyse and report trends associated with potentially preventable surgical mortalities. Two issues have been raised about the process. The first issue is that the audit does not review morbidities. At present, it is not within the scope of the audit to include morbidities, either at territory or national level. Inclusion of morbidity would require a much larger scale audit. This issue was forwarded to ANZASM for their consideration, and although it is being reviewed, the matter is still being considered by all the ASMs. The second issue is that of verifying the data in surgical case forms. It may be prudent to consider auditing a certain percentage of surgical case forms in the future to ensure that the data entry is accurate.
I hope that this report will be of interest to all practising surgeons and, as always, I welcome feedback about the process. I would like to thank the surgical community for participating, particularly the first- and second-line assessors and the ACTASM Management Committee for their contribution at every level of the process.
I would also like to extend my thanks to the College, which supports the process, and to the Project Manager, Ms Veronica Walker for her expertise and direction in driving the project forward. I would also like to acknowledge the commitment of the ACT Health for their support, advice and financial assistance, as well as the cooperation of the quality and health information management departments in the participating
hospitals.
Dr John Tharion
Clinical Director
ACTASM

AC
TAS
M A
NN
UA
L R
EP
OR
T 2
012
7
shortened Forms
ACT Australian Capital Territory
ACTASM ACT Audit of Surgical Mortality
ANZASM Australian and New Zealand Audit of Surgical Mortality
ANZCA Australian and New Zealand College of Anaesthetists
ASA American Society of Anaesthesiologists
CHASM Collaborating Hospitals Audit of Surgical Mortality
CPD Continuing Professional Development
DVT Deep Vein Thrombosis
HDU High Dependency Unit
ICU Intensive Care Unit
NSW New South Wales
RAAS Research, Audit and Academic Surgery
RANZCOG Royal Australian and New Zealand College of Obstetricians and Gynaecologists
SCF Surgical Case Form
SET Surgical Education and Training
SLA Second-Line Assessment
VTE Venous Thromboembolism

AC
TAS
M A
NN
UA
L R
EP
OR
T 2
012
8
executive summary
background
The ACT Audit of Surgical Mortality (ACTASM) is an audit process that provides
an independent, external peer review of all surgically-related deaths within the
ACT. It is systematic, objective and confidential, and its purpose is to inform and
improve surgical practice, with the ultimate goal of improving the quality of
patient care.
ACTASM is an initiative of the Royal Australasian College of Surgeons. It is
modelled on, and contributes data to, the bi-national Australian and New
Zealand Audit of Surgical Mortality (ANZASM). The ACT Health provides funding
and support in order to facilitate the audit process within all public and private
locations in the ACT. Similar mortality audits have been established in South
Australia, Queensland, Victoria, Tasmania and the Northern Territory. New
South Wales (NSW) provides comparable data to ANZASM but is independently
managed by the Clinical Excellence Commission of NSW.
objective
The objective of the audit is a ‘peer-review of all deaths associated with surgical
care’. This includes patients that were:
• under the care of a surgeon (surgical admission), whether or not an
operation was performed, or
• under the care of a physician (medical admission), and subsequently
underwent a surgical procedure.
The audit process is designed to highlight system and process errors and trends
in deficiencies of care. It is intended as an educational rather than as a punitive
exercise.
surgeon participation
• Surgeon participation in ACTASM stands at 99% (71/72) of consultant
surgeons in the ACT.
• This is the first year to include Fellows from the Royal Australian and New
Zealand College of Obstetricians and Gynaecologists (RANZCOG). Currently
38% (8/21) participate in ACTASM, with numbers increasing steadily.
• 75% (59/79) of participating consultants are first- and/or second-line
assessors in the ACTASM process. This number includes participating
RANZCOG Fellows.
hospital participation
• All private and public hospitals within the territory participate in ACTASM.
• The majority (97%) of completed cases were public patients.
audit numbers
• 112 deaths were reported to ACTASM.
• 63 cases had completed the full audit process and were analysed in this
report.
• 33 cases had not completed the full audit (peer-review) process and were
still under review by the end of the reporting period. Data from these cases
will be captured in next year’s report.
• 16 cases were excluded from the audit (admitted for terminal care,
inappropriately attributed to surgery).

AC
TAS
M A
NN
UA
L R
EP
OR
T 2
012
9
episode of care
• The median length of stay in hospital was five days (range <1 day – 58 days).
• 33% (21/63) of patients were transferred during their period of care, either
between ACT hospitals or from NSW.
• 78% patients underwent at least one surgical procedure and 11% required
more than one operation.
• The most frequent causes of death were cardiac and respiratory failure,
bowel ischaemia or obstruction, neurological and sepsis.
Risk profile of audited cases
• 51% of cases were male, with a median age of 71.
• 49% were female, with a median age of 82.
• 90% of audited deaths occurred in patients admitted as emergencies with
acute life-threatening conditions.
• 81% of cases had at least one pre-existing significant medical condition
(comorbidity).
• 63% of patients had an American Society of Anesthesiologists (ASA) grade
of 4 or above, indicating they had a condition that was a “constant threat to
life” (See section 3.3.1).
risk management
• 85% (53/62) of cases were assessed as having had appropriate venous
thromboembolism (VTE) prophylaxis.
• 57% (36/62) of patients received care in a critical care unit. In the 42% of
cases where the patient did not go to ICU, reviewers identified that the
patient may have benefited from it in 4% (1) of cases.
• Fluid balance in the surgical patient is an ongoing challenge and 3% (2) of
cases were assessed as having had poor management of fluid balance. In
20% (12/61) of cases the fluid balance status was unknown.
peer review outcomes
• 9% (6/69) of eligible cases were referred for second-line assessment (SLA)
or case note review.
• 95% (60/63) of cases identified either no issues or minor issues in clinical
management.
• 5% (3) of cases identified an area of concern or an adverse event. Further
detail is provided in section 7.3.

AC
TAS
M A
NN
UA
L R
EP
OR
T 2
012
10
Comparison data: aCTasm 2012 and anZasm 2012
Table 1: Comparison data: ACTASM 2012 and ANZASM 2012
Area for comparison
ACTASM (Oct 2011-Dec 2011)
%
ACTASM 2012
%
ANZASM 2012
%
Surgeon Participation 99% 99% 94%
Hospital Participation: Public 100% 100% 99%
Private 100% 100% 73%
Completed cases 14 63 2,870
Issues related to inter-hospital transfers
0 24% 32%
Male and Female ratio 36% : 64% 51% : 49% 54% : 46%
Emergency Admissions 93% 90% 86%
Admitted with one or more comorbidities
79% 81% 89%
ASA >4 63% 63% 58%
VTE prophylaxis use assessed as appropriate
71% 85% 92%
Issues in fluid balance 0 3% 9%
No issues or minor issues reported
86% 95% 87%
Areas of concern or adverse events
14% 5% 13%
Note: the reporting period for the ACTASM Annual Report has changed this year to bring it in line with the national reporting period. The table above is a comparison summary of:
1. ACTASM data for the unreported period: 1 October 2011 to 31 December 2011,
2. ACTASM data: 1 January 2012 to 31 December 2012,
3. ANZASM data: 1 January 2012 to 31 December 2012
performance review
Recommendations were included in the 2011 ACTASM Annual Report. The
following are achievements in relation to these recommendations:
• An audit was undertaken of cases which went to second-line review to
determine the accuracy of the information provided on the surgical case
form against the medical notes. Results:
> No inaccurate information was found in either of the surgical case
forms reviewed.
> The narrative at question nine In the surgical case form was very
brief in both cases. A more complete account of the episode of care
may have avoided the need for a second-line review.
> Recommendation: the project manager and clinical director to
review the surgical case form for completeness prior to providing
feedback to a surgeon following a second-line review. If it is
noted that more information could have minimised the need for
a second-line review, this feedback can be provided with other
recommendations to improve completion in future cases.
• All second-line assessments were sent interstate to ensure confidentiality.
• RANZCOG members are now participating in the audit.
• ANZCA participation is moving forward, with a representative from
ANZCA currently sitting on the ACTASM management committee. An
application to extend the Commonwealth Qualified Privilege to include
the anaesthetic specialty has been lodged with results pending.

AC
TAS
M A
NN
UA
L R
EP
OR
T 2
012
11
recommendations from 2012
• Increase surgeon’s participation as assessors to 80% by the end
of 2013.
• Increase participation by RANZCOG Fellows to 80% by the end
of 2013.
• Decrease response times for surgical case forms for slow
responders (Target <45 days).At present 80% of surgical case
forms were returned by the census date. The plan is to aim for
a return rate of 95%.
• Identify potential improvements to the Fellows Interface to
make it more user friendly and thus increase its utilisation.
• Continue to contribute data to ANZASM, and to National Case
Note Review Booklets. Develop ACT Clinical Case Note Review
Booklet in collaboration with a larger state.
• Facilitate future participation of anaesthetists in ACTASM.

AC
TAS
M A
NN
UA
L R
EP
OR
T 2
012
12
1. inTroduCTion
KEY POINTS
• ACTASM is an independent peer-reviewed
audit of deaths that occur while patients
are under surgical care. The process
involves self-reporting by surgeons and
peer review by first- and second-line
assessors.
• This report covers the census period
1 January 2012 to 31 December 2012.
This report is an analysis of the 63 cases
that completed the full audit process
during the period.
• The reporting period has changed to
bring ACTASM in line with National
ANZASM reporting timelines.
• This is the first year to include fellows
from the Royal Australian and New
Zealand College of Obstetricians and
Gynaecologists (RANZCOG).
1.1 background
The ACT Audit of Surgical Mortality (ACTASM) is
an audit process that provides an independent,
external peer review of all surgically-related
deaths within the ACT. It is systematic, objective
and confidential, and its purpose is to inform and
improve surgical practice, with the ultimate goal of
improving the quality of care for patients.
ACTASM is an initiative of the Royal Australasian
College of Surgeons. It is modelled on, and
contributes data to, the bi-national Australian and
New Zealand Audit of Surgical Mortality (ANZASM).
ACT Health provides funding and support in order
to facilitate the audit process within all public
and private locations in the ACT. The ACTASM
Management Committee meets quarterly and
oversees the project. This constitutes an invaluable
foundation to the running and success of the audit
program.
ACTASM commenced collecting data in October
2010. The 2011 Annual Report reported on the
period October 2010 - September 2011. In order
to bring the reporting period in line with ANZASM,
the 2012 Annual Report includes data collected
from 1 January 2012 to 31 December 2012, with
the data not previously reported on from October
to December 2011 included in a comparison table
in the executive summary.
Only cases which have completed the audit process
and are closed are included for analysis in the
report. Due to the nature of the audit process,
some cases will not be completed by the census
date. These cases will be included in the 2013
report.
1.2 project governance and confidentiality
The governance structure of ANZASM is illustrated
in Figure 1. The regional ACTASM governance
structure is illustrated in Figure 2.
The Royal Australasian College of Surgeons
Australian Capital Territory Audit of Surgical
Mortality Management Committee has been
gazetted as a Quality Assurance Committee under
the Commonwealth Qualified Privilege Scheme
under Part VC of the Health Insurance Act 1973
(gazetted 23 August 2011).
Participation in a regional audit is now a mandatory
component of attaining Continuing Professional
Development (CPD) recertification. Participating
surgeons and assessors gain points in Category
1 of the CPD program: ‘Clinical Governance and
Evaluation of Patient Care’.
Figure 1: Governance structure, Royal Australasian College of Surgeons, ANZASM and ACTASM
ACT Health Minister College Council
ACTASM Management
Committee
ACT Participating Hospitals
ACT Health
ACT Consultant Surgeons
College Professional Development and Standards Board
Research, Audit and Academic Surgery Board
ANZASM Steering Committee
ACTASM Project Staff
Note: ANZASM: Australian and New Zealand Audit of Surgical Mortality; ACT: Australian Capital Territory; ACTASM: Australian Capital Territory Audit of Surgical Mortality.
ACTASM Project Manager
ACT Hospitals
ACT Minister for Health
And

AC
TAS
M A
NN
UA
L R
EP
OR
T 2
012
13
Figure 2: Regional audit governance structure, ACTASM
ACT Health Minister
ACT Health
ACTASM Management
Committee
ACTASM Project Manager
ACT Consultant Surgeons ACT Hospitals
ANZASM (RAAS Division,
Adelaide)
Note: ACT: Australian Capital Territory; ACTASM: Australian Capital Territory Audit of Surgical Mortality; ANZASM: Australian and New Zealand Audit of Surgical Mortality; RAAS Division: Research, Audit and Academic Surgery Division.
1.3 The audit process
1.3.1 Notificationofdeaths
ACTASM audits public and private hospital deaths
that occurred during an episode of surgical care,
whether or not the patient underwent a surgical
procedure. This can include cases where a surgeon
was involved in the management of a patient
admitted by another team, or cases transferred to
the surgeon’s care during that admission.
The medical records departments of the
participating hospitals, both public and private,
notify ACTASM of all surgically-related deaths.
Each participating hospital is aware of the inclusion
criteria of ACTASM (see 1.3.4) and reports those
deaths monthly, or as required.
1.3.2 Methods
ACTASM methodology is described below, with an
overview included in Figure 3 below.
ACTASM receives notification of a surgically-
related death (via password-protected email) from
participating hospitals. This information is entered
into a secure database and a surgical case form
(SCF) is then sent to the consultant surgeon for
completion, either via Fellows Interface or a paper
version. The SCF is a nine-page structured form,
in which the surgeon is asked to document the
details of the case, including whether there were
any clinical incidents during the care of the patient.
The consultant surgeon then returns the SCF to
the ACTASM project office.
The SCF is then coded and de-identified and sent
to a different surgeon for peer review, or first-
line assessment (FLA). The first-line assessor is
a consultant surgeon of the same specialty. The
first-line assessor determines whether the case
should undergo further assessment (second-line
assessment-SLA), which involves reviewing de-
identified medical records of the case. The first-line
assessor may also close the case at this stage. The
first-line assessor may find no clinical incidents
or may find clinical incidents which do not need
further assessment.
A primary objective of the peer-review process
is ascertaining if death was a direct result of the
disease process alone or if aspects of management
of the patient might have contributed to that
outcome. If there is a perception that the clinical
management may have contributed to death,
ANZASM specifies that these are reported against
the following criteria:
• area for consideration—where the clinician
believes an area of care could have been
improved or different, but recognises that
there may be debate about this
• area of concern—where the clinician believes
that an area of care should have been better
• adverse event—where an unintended ‘injury’
is caused by medical management, rather than
by the disease process, which is sufficiently
serious to:
> lead to prolonged hospitalisation
> lead to temporary or permanent
impairment or disability of the patient at
the time of discharge, or
> contribute to or cause death.
Cases undergo a second-line assessment if:
• an area of concern has been identified or an
adverse event is thought to have occurred
during the clinical care of the patient that warrants further investigation
• there is insufficient information on the SCF
for the assessor to reach a conclusion
• a report could usefully draw attention to
‘lessons to be learned’, either for clinicians
involved in the case, or as part of the
collated case note review booklet for wider
distribution within the surgical community.
some cases will not be completed by the census
date. These cases will be included in the 2013
report.
1.2 project governance and confidentiality
The governance structure of ANZASM is illustrated
in Figure 1. The regional ACTASM governance
structure is illustrated in Figure 2.
The Royal Australasian College of Surgeons
Australian Capital Territory Audit of Surgical
Mortality Management Committee has been
gazetted as a Quality Assurance Committee under
the Commonwealth Qualified Privilege Scheme
under Part VC of the Health Insurance Act 1973
(gazetted 23 August 2011).
Participation in a regional audit is now a mandatory
component of attaining Continuing Professional
Development (CPD) recertification. Participating
surgeons and assessors gain points in Category
1 of the CPD program: ‘Clinical Governance and
Evaluation of Patient Care’.
Figure 1: Governance structure, Royal Australasian College of Surgeons, ANZASM and ACTASM
ACT Health Minister College Council
ACTASM Management
Committee
ACT Participating Hospitals
ACT Health
ACT Consultant Surgeons
College Professional Development and Standards Board
Research, Audit and Academic Surgery Board
ANZASM Steering Committee
ACTASM Project Staff
Note: ANZASM: Australian and New Zealand Audit of Surgical Mortality; ACT: Australian Capital Territory; ACTASM: Australian Capital Territory Audit of Surgical Mortality.
ACTASM Project Manager
ACT Hospitals
ACT Minister for Health
And

AC
TAS
M A
NN
UA
L R
EP
OR
T 2
012
14
The second-line assessor is a senior consultant
surgeon of the same specialty, but not from the
same hospital as the original surgeon. The ACT
surgical community is very small and it is difficult
to ensure that a case is not identifiable at this
level. Therefore, all ACT second-line cases are sent
interstate. In order that ACT assessors receive the
educational opportunity to review second-line
cases, the other state sends one of their second-
line cases to the ACT for review.
1.3.3 Providingfeedback
ACTASM provides feedback in the following ways:
• Surgeons receive written feedback from first-
and second-line assessors (de-identified) on
their ACTASM cases.
• Hospitals participating in ACTASM may
request reports on aggregated de-identified
data relating specifically to their hospitals
and comparing them to the averages of other
hospitals.
• Annual reports and case note review booklets
are available to the surgical community on
the ACTASM website at www.surgeons.org/
actasm.
The aggregated feedback and related clinical
events in annual reports and case note review
booklets are not linked to individual patients,
surgeons or hospitals. The process is managed by
the ACTASM Project Manager, following ANZASM
guidelines, and is coordinated through a secure
database.
1.3.4 Auditinclusionandexclusioncriteria
ACTASM includes all deaths that occurred in a
participating hospital when:
• the patient was under the care of a surgeon
(surgical admission), whether or not an
operation was performed, or
• the patient was under the care of a physician
(medical admission), and subsequently
underwent a surgical procedure.
ACTASM excludes deaths when:
• the patient is admitted for terminal care, or
• the case does not fulfil either of the above
criteria.
Figure 3: ACTASM methodology
ACTASM receives notification of death
Surgical case form sent to surgeon for completion
Completed surgical case form returned to ACTASM and de-identified
First-line assessment
Second-line assessment
Feedback to surgeon
Is second-line assessment appeal required?
Yes
Yes
No
No
Case closed
Case closed
Second-line assessment
required?
Note: ACTASM: Australian Capital Territory Audit of Surgical Mortality.
1.4 reporting conventions
1.4.1 Terminology
Surgeons and assessors are asked to review the
case and to determine whether there were any
clinical incidents where care could have been
improved. These are then classified as an area of
consideration, an area of concern or an adverse
event.
• An area of consideration occurs where the
clinician believes an area of care could have
been improved or different, but recognises
that this may be an area of debate
• An area of concern is where the clinician
believes that areas of care should have been
better
NoYes
Case closed

AC
TAS
M A
NN
UA
L R
EP
OR
T 2
012
15
• An adverse event is an unintended injury
caused by medical management, rather
than by disease process, which is sufficiently
serious to lead to prolonged hospitalisation,
to temporary or permanent impairment, or
which contributes to or causes death.
The clinician is then asked to give their opinion as
to:
• Whether the incident was preventable, under
the categories:
> definitely
> probably
> probably not
> definitely not.
For this report, both the categories of ‘definitely’
and ‘probably’ are referred to as being
preventable.
• Who the incident was associated with,
categorising this information as:
> audited surgical team
> another clinical team
> hospital
> other.
• The impact of the incident on outcome, based
on whether the event:
> made no difference to outcome
> may have contributed to death
> caused the death of a patient who
would otherwise have been expected to
survive.
1.4.2 Assessor opinion
The areas for consideration, areas of concern
and adverse events contained in this report were
events ascribed to the case by the highest level
of assessment, either the first-line assessor or the
second-line assessor if the case progressed that
far. For ease of reporting, these are referred to as
‘assessors’.
The categorisation of the severity of the event, the
effect on outcome, and the team or location the
event was associated with, are the opinions of the
assessors.
1.4.3 Focusofreporting
ACTASM reports focus primarily on areas of
concern and adverse events (see 1.4.1). Areas
for consideration are excluded from this analysis
because they have minimal impact on the outcome
and are simply an indication that there were
different clinical opinions. However, areas for
consideration are included in the data collection
process to facilitate reporting of ‘less serious’
events, which is important for improving overall
patient care. It is also noteworthy that in some
areas of reporting all criteria are not mutually
exclusive and, therefore, percentages will not add
up to 100%. Some cases have no clinical incidents
reported, while others were associated with
several. In this situation, where analysis of clinical
incidents was reported by case, the most serious
incident was ascribed to the case.
1.4.4 Completenessofinformation
Numbers in parentheses in the text (n) represent
the number of cases analysed. In some surgical
case forms, not all data fields were completed by
clinicians; therefore, the total number of cases
used in different sections of the analysis varies.
Clinicians are encouraged to complete all data
fields in order to provide a complete report.
The use of Fellows Interface, the College online
platform, improves compliance by prompting the
clinician if fields are left incomplete.
1.5 data
This report covers deaths notified to ACTASM from
1 January 2012 to 31 December 2012. The census
date for this report was 4 May 2013.
ACTASM analysed areas of concern or adverse
events ascribed to each case by assessors.
Due to the audit process and the timing of
return of forms, some cases reported to ACTASM
during 2012 will, at the time of analysis, still be
undergoing review. These cases will be included in
the 2013 annual report.
1.5.1 DataEntry
Data is entered in two ways:
1. The data may be entered directly onto the
database by the clinician via Fellows Interface.
It is then checked and coded by the project
manager.
2. A hardcopy may be completed and sent to the
project manager, who transcribes the data to
the database.
Use of the Fellows Interface will eliminate
potential transcription errors, and ensure
completeness of data by prompting the clinician if
fields are left incomplete.
1.5.2 StorageofData
Data is encrypted in the database with Secure
Sockets Layer certificates. This data is sent to and
stored in a central Structured Query Language
Figure 3: ACTASM methodology
ACTASM receives notification of death
Surgical case form sent to surgeon for completion
Completed surgical case form returned to ACTASM and de-identified
First-line assessment
Second-line assessment
Feedback to surgeon
Is second-line assessment appeal required?
Yes
Yes
No
No
Case closed
Case closed
Second-line assessment
required?
Note: ACTASM: Australian Capital Territory Audit of Surgical Mortality.
1.4 reporting conventions
1.4.1 Terminology
Surgeons and assessors are asked to review the
case and to determine whether there were any
clinical incidents where care could have been
improved. These are then classified as an area of
consideration, an area of concern or an adverse
event.
• An area of consideration occurs where the
clinician believes an area of care could have
been improved or different, but recognises
that this may be an area of debate
• An area of concern is where the clinician
believes that areas of care should have been
better
NoYes
Case closed
AC
TAS
M A
NN
UA
L R
EP
OR
T 2
012
16
server database, which includes a reporting engine.
All transactions are time stamped. All changes to
audit data are recorded in an archive table enabling
a complete audit trail to be created for each case.
1.5.3 DataValidity
When indicated, information is checked against
the original SCFs and assessment forms. Medical
records departments, surgeons, the Coroner’s
Office reports and the Chairman are all resources
used by ACTASM to maintain data integrity.
1.5.4 DataAnalysis
The Project Manager and Clinical Director
independently classify all qualitative information
into groups. These groupings are then compared
and any differences discussed until consensus is
reached.
1.5.5 Denominator
The denominator used is the total number of cases
for which there is data available. It will be indicated
by (n). This will vary between questions as:
• Some questions can have multiple responses
for the same case, for example, some cases
will have no clinical incidents reported while
others may be associated with several.
• Some questions on the audit forms contain
sub-questions, which may not require
completion for all cases.
• A clinician may miss a question, or may not
answer it if they are unsure.

AC
TAS
M A
NN
UA
L R
EP
OR
T 2
012
17
2. audiT parTiCipaTion
KEY POINTS
• There were 112 surgically-related deaths
reported to ACTASM for the census
period 1 January 2012 to 31 December
2012 and 56% (63/112) of cases had
completed the full audit process.
• 100% of public and private hospitals
participate in ACTASM.
• 99% (71/72) of ACT consultant surgeons
are participating in ACTASM.
• 38% (8/21) of RANZCOG Fellows are
participating in ACTASM. This is the first
year of RANZCOG participation in the
audit and participation is growing steadily.
• 75% (59/79) of participating consultants
have agreed to be a first- and/or second-
line assessors in the audit and this number
continues to increase. This number
includes participating RANZCOG Fellows.
2.1 audit numbers
A total of 112 deaths were reported to ACTASM.
• Of the 112 cases, a total of 56% (63/112) of
cases had proceeded to and completed the
audit process. The clinical information from
these 63 deaths provides the patient profiles
described in this report and is the denominator
in all analyses pertaining to outcomes from the
audit, unless stated otherwise.
• A total of 29.5% (33) of cases had not
completed the full audit (peer-review)
process. This includes 20% (22) where forms
were not fully completed or returned by the
surgeon, 4% (5) of cases awaiting first-line
assessments and 5% (6) of cases sent for
second-line assessment.
• 14.5% (16) of cases were excluded from the
audit. Of the 16 cases which were excluded,
15 cases (13% of total) were identified as
terminal cases, where palliative measures
were instituted following initial patient
assessment. The remaining case (1% of total)
was excluded as the surgeon was identified as
not participating (i.e. locum).
• This completion rate is comparable to the
nationally reported rate of 55% (ANZASM
National Report 2012).
It should be noted that:
• The audit process relies not only on surgeons agreeing to participate, but also on their timely completion and return of surgical case and assessment forms.
• There will always be ACTASM forms pending. This reflects the continuous nature of the audit with surgeons interacting with ACTASM
on a regular basis.
Figure 4: Audit status
14.5%
29.5%
56%
Completed In progress* Excluded (Terminal care)
Note: N=112; * In progress cases are made up of surgical case forms and first- and second-line assessment forms that remain outstanding.
2.2 surgeon participation
2.2.1 SurgeonParticipation
During the period 1 January 2012 to 31 December 2012, 99% (71/72) of eligible surgeons from the Royal Australasian College of Surgeons participated in ACTASM. Nationally, the participation rate for surgeons is 94%, as at the end of 2012. Surgeons are considered to be participating when they submit an ‘Agreement to Participate’ form and they have no outstanding cases older than three months. Surgeons can opt to undertake the role of assessor using this form. An ‘Assessor Declaration’ form must also be completed before any cases are assessed.
In 2012, RANZCOG agreed to collaborate with RACS to collect gynaecologically-related mortality data within ACTASM. By the end of 2012, 38% (8/21) of eligible fellows from RANZCOG were participating and the number is steadily increasing.
The Australian and New Zealand College of Anaesthetists (ANZCA) have indicated interest
in joining ACTASM. A representative of ANZCA
now participates in the ACTASM Management

AC
TAS
M A
NN
UA
L R
EP
OR
T 2
012
18
Committee and an application for Commonwealth
Qualified Privilege has been lodged, with results
pending.
2.2.2 Assessor participation
A total of 75% (59/79) of participating consultants
have agreed to be a first- and/or second-line
assessors and this number continues to increase.
This number includes participating RANZCOG
Fellows.
Figure 5: Participating public and private hospitals, treating surgeons and assessors in the ACT
100%
80%
60%
40%
20%
0%
ACT Hosp
itals
Treatin
g FRACS
Surgeons
Treatin
g RANZCOG^
Surgeons
Assess
ors*
Perc
enta
ge P
arti
cip
atin
g
ACT: Australian Capital Territory.
* ACT assessors also review inter-state assessments.
^ RANZCOG—Royal Australian and New Zealand College of Obstetricians and Gynaecologists
2.3 surgeon participation by specialty
The specialty distribution of participating surgeons
is seen below in Figure 6. All specialties are
currently participating in ACTASM.
Figure 6: Surgeon agreement to participate by speciality
20
15
10
5
0
Speciality
Num
ber
of
Surg
eons
Orthopaedic Surg
ery
Urology
Cardioth
oracic Surgery
General Surg
ery
Neurosu
rgery
Vascular Surg
ery
Otolaryngology
Plastic Surg
ery
Paediatric Surg
ery
Note: N=71
Within the ACT, some specialties include a very
small cohort. In order to maximise the peer-review
process, assessments should be undertaken by a
surgeon who is of an equivalent area of expertise
and who has not been previously asked to provide
expert advice independently on the case (e.g.,
in a local or inter-jurisdictional clinical review
process). This is to maintain the objectiveness
and transparency of the review and protects the
identity of the treating surgeon. Therefore all
second-line and some first-line cases are assessed
interstate to ensure that both criteria are met and
the treating surgeon has the most benefit from the
peer-review component of this audit.
2.4 surgeon completion of surgical case forms
Of the 112 notifications of death reported from
the 1 January 2012 to 31 December 2012, 16 cases
were excluded due to terminal care. A total of 56%
(63/112) of cases completed the full audit cycle.
This is lower than the national rate of 80%. The
percentage of each specialty is shown in Figure 7
below. The median time taken to return a SCF was
55 days (n=91).
Figure 7: Number of surgical case forms completed by each specialty
50
40
30
20
10
0
Speciality
Num
ber
of
Surg
eons
Orthopaedic Surg
ery
Urology
Cardioth
oracic Surgery
General Surg
ery
Neurosu
rgery
Vascular Surg
ery
Otolaryngology
Obstetri
c & Gynaecology
SCF Returned
SCF Pending
Note: Number of notifications of death without excluded cases = 96.
The information collected through the SCF fields
contributes to a national dataset which presents
a clear picture of surgical care provided. In some
fields, the treating surgeon is asked for a clinical
opinion, which is crucial to the surgical picture.
These fields must be completed for the audit to
meet its core objective, namely for participants to
learn from each other. Clinical opinion strengthens
the meaning of, and gives credibility to, the
national dataset.

AC
TAS
M A
NN
UA
L R
EP
OR
T 2
012
19
The first-line assessor makes a fair determination
and provides constructive feedback based on the
SCF alone. This can cause some indecision if the
form has not been filled in completely and all the
information is not to hand.
In the audit form, the assessor is asked, ‘Was there
enough information to make a determination?’
The process directs that a case without sufficient
information should be referred for a second-
line assessment (case note review). Assessors
sometimes ask if further information could be
sought from the treating surgeon before referring
the case for a second-line review. This has been
undertaken in the ACT and has met with varying
degrees of success.
The consultant in charge of the case can delegate
the task of completing the surgical case form to
the Registrar or Fellow in charge of the case. This
provides an opportunity for reflection for the
registrar and can guide discussion of areas for
improvement when the consultant reviews the
surgical case form with the registrar. See Figure 8
for classification breakdown. No data is available
for who was completing the form for excluded
cases. The consultant retains the responsibility of
overseeing the detail of the form submitted.
Figure 8: Classification of surgeon completing surgical case form
12%
6%
84%
Consultant Service Registrar SET Trainee
Note: N=77 includes all completed surgical case forms except those cases excluded for terminal care (classification of surgeon completing SCF not indicated on excluded forms)
2.5 hospital participation
2.5.1 Participatinghospitals
All public and private hospitals within the ACT
currently participate in the audit by reporting
surgically-related deaths to ACTASM. Hospitals
in the ACT range from small private hospitals to
large public teaching hospitals. Each participating
hospital is aware of ACTASM’s inclusion criteria
(see 1.3.4) and reports those deaths through a
monthly report, or as required in smaller facilities.
In the period 1 January 2012 to 31 December
2012, all cases were notified by the two main
public hospitals. The other participating hospitals
have had no notifications during the audit period.
2.5.2 Timeinhospitalbeforedeath
The average length of stay of patients in hospital is
shown in Figure 9 below.
Figure 9: Time in hospital before death25%
20%
15%
10%
5%
0%
Length of Stay
Perc
enta
ge o
f ca
ses
6-8 days
9-11 days
<1-2 days
3-5 days
12-14 days
15-17 days
18-20 days
>20 days
Note: N=63.
Comment:
• The median length of stay in hospital was five days with a range of less than one day to 58 days. The mean length of stay was 10 days.
• 60% of patients died in the first week of admission and a further 16% in the second week (data not shown).
• The longest patient admission was 58 days, which was predominantly a medical admission
whilst awaiting fitness for surgery.

AC
TAS
M A
NN
UA
L R
EP
OR
T 2
012
20
3. paTienT proFile
KEY POINTS
• 90% of audited deaths occurred in
patients admitted as emergencies with
acute conditions.
• The median age for males was 71 years
and for females was 82 years.
• 81% of audited cases had one or more
significant comorbidities that were
reported to have contributed to the
death.
• 63% per cent of audited cases had
a recorded American Society of
Anaesthesiologists (ASA) score of 4 or
more.
• 97% were public patients.
3.1 age and gender
Sixty-three cases had completed the audit process,
and these cases were used for further analysis.
Figure 10 below details the distribution of the
sample by age group and subdivided by gender.
Figure 10: Gender distribution by age bracket
25
20
15
10
5
0
Age
Num
ber
of
Surg
eons Male
Female
0-20 21-40 41-60 61-80 81+
Note: N=63.
Comment:
• 51% (32) of cases were male and 49% (31)
were female.
• The median age of females in the sample
was 82 years versus 71 years for males: a
difference of 11 years.
• There were a higher proportion of males
under the age of 80 than females. Females
predominated in the 80+ age range.
3.2 acuity of audited cases
The ‘acuity’ status of audited cases indicated
whether patients were admitted electively
or as emergencies. There were 90% (57) of
audited deaths occurring in patients admitted as
emergencies for acute life-threatening conditions.
This is comparable to the national rate of 86%. In
78% (49) of patients had at least one operation
during their episode of care (see Section 6 for
further detail).
Figure 11: Patient deaths by specialty
60
50
40
30
20
10
0
Speciality
Cas
es (%
)
Orthopaedic Surg
ery
Cardioth
oracic Surgery
General Surg
ery
Neurosu
rgery
Vascular Surg
ery
Otolaryngology
Ophthalm
ology
Note: N=63.
Comment:
• 54% of deaths occurred within the general
surgery specialty, 24% within orthopaedic
surgery, 10% in neurosurgery, 6%
cardiothoracic, 3 % vascular surgery, and 2%
in each of ophthalmology and otolaryngology
Head and neck.
• The distribution between specialties was
appropriate to the case-mix of the individual
specialties.
3.3 Clinical Risk Profiles
This section reviews the risk profile of audited
cases. This includes the American Society of
Anaesthesiologists (ASA) status, reported
comorbidities and the treating surgeon’s
perception of risk of death. The clinical risk profile
indicates that the majority of deaths occurred in
patients with comorbidities presenting with acute
life-threatening conditions.
3.3.1 ASARating
The ASA grade is an internationally recognised
classification of perioperative risk. An ASA grade
is assigned to a preoperative patient by an
anaesthetist. In the surgical case form, the surgeon
has been asked to grade their patients using this
scale. Grade definitions can be seen in Table 2

AC
TAS
M A
NN
UA
L R
EP
OR
T 2
012
21
below. The distribution of grades within audited
cases is shown in Figure 12.
Table 2: ASA grade definitions
ASA Grade
Characteristics
1 A normal healthy patient
2 A patient with mild systemic disease
3A patient with severe systemic disease which limits activity, but is not incapacitating
4A patient with incapacitating systemic disease which a constant threat to life
5A morbid patient who is not expected to survive 24 hours, with or without an operation
6 A brain dead patient for organ donation
Figure 12: Distribution of ASA grades of audited cases
50
40
30
20
10
0
ASA 1&2 3 4 5&6
Perc
enta
ge o
f p
atie
nts
ASA Grade
Note: N=51. Grades were not available in 12 cases.
Comment:
• 63% (32/51) of cases had a recorded ASA
grade of 4 or more, as described by the
surgeon. The frequency of high ASA grades
indicates that most deaths occurred in
patients whose preoperative health was
assessed as high risk.
In the ANZASM 2010 report, ACT had a higher
percentage of cases rated ASA 1 and 2 in comparison
to other states. This was analysed by the project
manager and the results analysed by ACTASM
Management Committee. The ASA rating assigned
by the anaesthetist in cases that underwent surgery
was compared to the ASA rating given by the
surgeon in the Surgical Case Form. No significant
differences were found on comparison.
The 2012 ACT ASA ratings are in line with the
national figures from the 2012 ANZASM Report.
Across the regions the percentage of cases rated
ASA 1 & 2 varied from 8% to 20%. ACTASM will
continue to monitor this trend.
3.3.2 Patientswithcomorbidities
Surgeons were asked to identify the following
comorbidities in addition to the primary medical
(presenting) problem: cardiovascular, respiratory,
renal, hepatic, neurological, advanced malignancy,
diabetes, obesity and age (as shown in Figure
13). A patient may present with more than one
comorbidity.
Figure 13: Frequency of comorbidities
35%
30%
25%
20%
15%
10%
5%
0%
Comorbidity
Freq
uenc
y (%
)
Advanced malig
nancyRenal
Hepatic
Obesity
Diabetes
Neurological
Respira
tory
Advanced age
Other*
Cardiovascular
Note: N=51, number of comorbidities = 113. * Other comorbidities covered a wide range and included anaemia, dementia, and infection.
Comment:
• 81% (51/63) of audited cases were reported
to have one or more significant comorbidity
which was considered to have increased
the risk of death. This compares with 89%
nationally.
3.3.3 Patientswithamalignancy
Malignancy was present in 35% (22/63) of cases,
with metastatic disease present in 21% (13/63).
Surgeons considered that the malignancy
contributed to the patient’s death in 15 (24%)
cases (as shown in Figure 14).

AC
TAS
M A
NN
UA
L R
EP
OR
T 2
012
22
Figure 14: Percentage of patients with malignancy
40%
35%
30%
25%
20%
15%
10%
5%
0%
Present Metastatic Contributed to death
Patients with malignancy
Perc
enta
ge o
f p
atie
nts
wit
h m
alig
nanc
y
Note: N=62. Data not available in 2% (1) case.
3.4 surgeon perception of risk status
The treating surgeons were asked to record the
perceived risk of death of the patient at the time
of treatment and to rate the overall risk of death
(before any surgery) for each patient (as shown in
Figure 15).
Figure 15: Risk of death as perceived by treating surgeons
12%
8%
18%61%
Expected
Small Moderate Considerable
Note: n=49. This question is only asked where the patient underwent a surgical procedure
Comment:
• In 8% (4) of cases, the perceived risk was
considered small.
• In 73% (36) of cases, the perceived risk of
death was considerable or expected which
compares with 62% nationally.
• This was further evidence of the high-risk
profile suggested by the mean age, ASA score
and associated comorbidity.

AC
TAS
M A
NN
UA
L R
EP
OR
T 2
012
23
4. risK managemenT sTraTegies
KEY POINTS
• 85% (53/62) of cases, the VTE prophylaxis
provided was assessed as appropriate.
• Fluid balance in the surgical patient is an
ongoing challenge. In this series, 6% (4/63)
of cases were perceived to have had poor
management of fluid balance.
• In the majority of instances, those patients
expected to benefit from critical care
support did receive it. The review process
suggested that 4% (1) of patients who did
not receive treatment in critical care would
have benefitted from it.
4.1 prophylaxis for venous Thromboembolism (vTe)
The treating surgeon was asked to record if venous
thromboembolism (VTE) prophylaxis was given
and, if so, which form of prophylaxis was used (see
Figure16). If VTE prophylaxis was not given, the
surgeon recorded the reason it was withheld. The
assessors were asked to review whether these
decisions were appropriate.
VTE prophylaxis use was recorded in 83% (49/59)
of patients which compares with 78% nationally.
• Of the patients who did not have VTE
prophylaxis, surgeons indicated that:
> for 10% (6), it was an active decision to
withhold treatment due to the patient’s
condition
> for 12% (7), it was considered not
appropriate, and
> for 2% (1), it was not considered.
• Assessors viewed the use of VTE prophylaxis
as appropriate in 85% (53/62) of cases,
unknown in13% of cases (8/62) and not
appropriate in 2% (1/62).
There were 90 instances of use of VTE prophylaxis
in 49 cases. Figure 16 indicates the number of
patients who received VTE prophylaxis, according
to the method used.
Figure 16: Type of VTE prophylaxis used50
40
30
20
10
0
Num
ber
of
pro
phy
laxi
s gi
ven
Type of prophylaxis given
Sequential
compressi
on deviceOth
er*
Heparin (a
ny form
)
TED^ stockings
Wartf
arin
Aspirin
Note: N=90. Data not available in 4 cases. Other* agents recorded were Clexane, Clopidogrel and Heparin infusion. TED^: thromboembolic deterrent; VTE: venous thromboembolism.
4.2 Fluid management
This section and Figure 17 shows the
appropriateness of fluid balance in 63 patients.
Figure 17: Issues in fluid balance
60
50
40
30
20
10
0
Fluid balance Appropriatness
Cas
es (n
)
Assessor
Surgeon
Yes No Unknown
Note: Surgeons N= 63; Assessors n=61.
Comment:
• Surgeons reported fluid management issues in
6% (4/63) of cases. By comparison, assessors
reported fluid management issues in 3%
(2/61) of cases; however, assessors reported
feedback as ‘unknown’ in 20% (12/61) cases.
Nationally, assessors felt that 15% of cases
had issues with fluid balance and 8% were
unknown.
• The high rate of ‘unknown’ responses by the
assessors is a clear indicator that there was

AC
TAS
M A
NN
UA
L R
EP
OR
T 2
012
24
insufficient information on the surgical case
form to make a determination on this aspect
of care. Where fluid balance is not usually
an issue (e.g. neurosurgery) the treating
surgeon has not recorded it as it is not seen as
relevant. Fluid balance issues are more often
general surgical in nature.
4.3 provision of critical care support to patients
The treating surgeon was asked to record whether
or not a patient received critical care support in an
intensive care (ICU) or high dependency unit (HDU)
before or after surgery. The assessors reviewed
the appropriateness of the use of critical care
support. It was recognised that this is a subjective
assessment of needs and potential benefit.
Within the ACT, 58% (36/62) of the audit group
were admitted to the ICU and/or HDU for care
during their admission. In the 42% (26/62) of cases
where the patient did not go to critical care, the
assessor’s considered that 4% (1) would have
benefited from an admission to ICU and/or HDU.
In 81% of the cases admitted to the ICU/HDU,
surgeons were happy with the care delivered.
Where there was dissatisfaction, a number of
surgeons across different specialities felt strongly
about not being involved in the discussions, or
the decision to withdraw active treatments for
their patient and institute end-of-life care. This
lack of involvement in the change of care was
also reported as an area of consideration, as it
constituted a difference of clinical opinion. This
trend is similar across all regions.
The SCF will be revised in September 2013 to
identify the reasons why patients did not receive
critical care support. It is hoped that this will
encourage surgeons to fully complete the form
and thus ensure sufficient data for analysis in this
area of care.
4.4 antibiotic regime
Surgeons were asked if they considered the
antibiotic regime to be appropriate.
Figure18: Appropriateness of the antibiotic regime
9%
11%
79%
Yes No Not known
Note: N= 53. Data not available in 10 cases.
Comment:
• In 19% (12/63) of cases, the patient died with
a clinically significant infection. In 11% (7/63)
of cases, these infections were acquired
postoperatively, with only 2% (1/63) of cases
identified with a surgical site infection.
AC
TAS
M A
NN
UA
L R
EP
OR
T 2
012
25
5. Cause oF deaTh
KEY POINTS
• The most frequent causes of death
were cardiac and respiratory failure,
bowel ischaemia or obstruction,
neurological and sepsis.
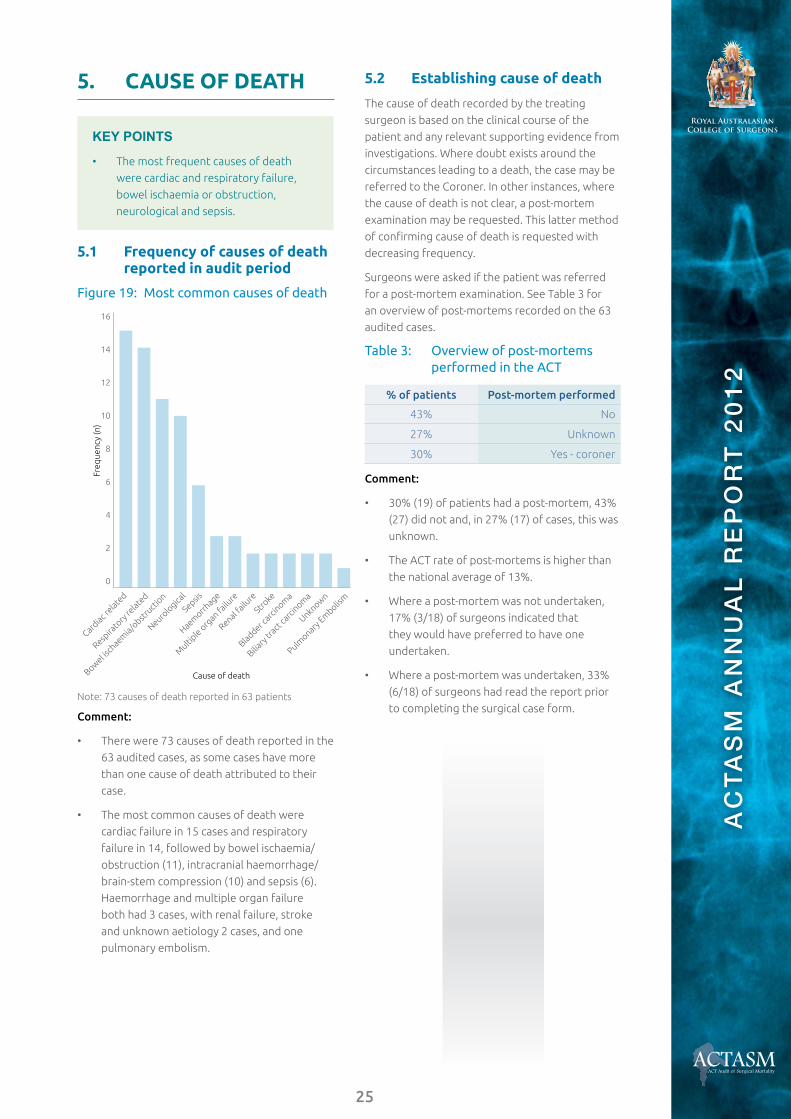
5.1 Frequency of causes of death reported in audit period
Figure 19: Most common causes of death
16
14
12
10
8
6
4
2
0
Cause of death
Freq
uenc
y (n
)
Cardiac r
elated
Neurolo
gical
Sepsis
Haemorrh
age
Multi
ple organ fa
ilure
Renal failu
re
Stroke
Bladder carc
inoma
Biliary
tract
carc
inoma
Unknown
Pulmonary
Embolis
m
Respira
tory
relate
d
Bowel isch
aemia/o
bstruct
ion
Note: 73 causes of death reported in 63 patients
Comment:
• There were 73 causes of death reported in the
63 audited cases, as some cases have more
than one cause of death attributed to their
case.
• The most common causes of death were
cardiac failure in 15 cases and respiratory
failure in 14, followed by bowel ischaemia/
obstruction (11), intracranial haemorrhage/
brain-stem compression (10) and sepsis (6).
Haemorrhage and multiple organ failure
both had 3 cases, with renal failure, stroke
and unknown aetiology 2 cases, and one
pulmonary embolism.
5.2 establishing cause of death
The cause of death recorded by the treating
surgeon is based on the clinical course of the
patient and any relevant supporting evidence from
investigations. Where doubt exists around the
circumstances leading to a death, the case may be
referred to the Coroner. In other instances, where
the cause of death is not clear, a post-mortem
examination may be requested. This latter method
of confirming cause of death is requested with
decreasing frequency.
Surgeons were asked if the patient was referred
for a post-mortem examination. See Table 3 for
an overview of post-mortems recorded on the 63
audited cases.
Table 3: Overview of post-mortems performed in the ACT
% of patients Post-mortemperformed
43% No
27% Unknown
30% Yes - coroner
Comment:
• 30% (19) of patients had a post-mortem, 43%
(27) did not and, in 27% (17) of cases, this was
unknown.
• The ACT rate of post-mortems is higher than
the national average of 13%.
• Where a post-mortem was not undertaken,
17% (3/18) of surgeons indicated that
they would have preferred to have one
undertaken.
• Where a post-mortem was undertaken, 33%
(6/18) of surgeons had read the report prior
to completing the surgical case form.

AC
TAS
M A
NN
UA
L R
EP
OR
T 2
012
26
6. proFile oF operaTive inTervenTion
KEY POINTS
• 78% (49/63) of patients had at least one
surgical procedure.
• 77% (51) of procedures were carried
out by a consultant surgeon. In other
cases, the surgery was performed by
registrars or SET trainees, usually in the
presence of a consultant.
• The most common postoperative
complications recorded were aspiration/
pneumonia and cardiac failure.
6.1 operative intervention
78% (49/63) of patients had at least one surgical
procedure during their admission compared with
78% nationally. 11% (7/63) of patients had more
than one operation, with the highest number
of procedures on a single patient being five.
Nationally, 28% of patients had more than one
operation.
• Where an operation was not performed, the
surgeon was asked why. In some cases, there
were multiple reasons given. Overall, in 16%
(10) of cases, the surgeon reported an active
decision not to operate. In 5% (3) of cases,
the patient refused treatment. In a further
5% (3) of cases, there was a decision to limit
treatment, and in 3% (2) of cases, it was not a
surgical problem.
• There were no cases where the procedure was
abandoned upon finding a terminal situation.
6.2 Timing of surgical episodes
The critical nature of a patient’s condition
determines the timing for surgery. Of all operative
episodes in the audit period, 87% (54) were
classified as emergencies, including, 73% (45) who
went to surgery within 24 hours of admission. The
timing of emergency surgical episodes is shown in
Figure 20 below.
Figure 20: Timing of emergency surgical episodes
50
40
30
20
10
0
Cas
es (%
)
Operative urgency by status
Immediate
(less
than 2 hours)
Emergency
(less
than 2 hours)
Scheduled emergency
(Over 2
4 hours post
admission) Electiv
e
Note: N=62; Data not available in 1 case.
6.3 seniority of surgeon operating
The clinician completing the SCF has to record
the seniority of the surgeon who performed the
surgery (as shown in Figure 21 below).
Figure 21: Seniority of operating surgeon by operation number
100
90
80
70
60
50
40
30
20
10
0
Cas
es (%
)
All operations
1st Operation
Subsequent operations
Consultant SET Trainee Registrar
SET: Surgical Education and Training
Note: A total of 66 procedures were performed on 49 patients.
Comment:
• In all operations performed, 77% (51/66) of
procedures were performed by a consultant
surgeon or Fellow, 14% (9/66) of procedures

AC
TAS
M A
NN
UA
L R
EP
OR
T 2
012
27
were performed by the SET and the remaining
9% (6/66) by the registrar.
• In the first operation for each patient, 71%
(35/49) were performed by a consultant
surgeon or Fellow, 16% (8/49) by the SET and
10% (5/49) by a registrar (not indicated in one
case).
• In the 18 subsequent operations, 88% (16/18)
were performed by a consultant surgeon or
Fellow, 6% (1/18) by the SET and 6% (1/18) by
a registrar.
• No operations in the audit group were
undertaken by an international medical
graduate (IMG) or general practitioner.
• All surgical procedures were attended by an
anaesthetist.
6.4 postoperative complications
Surgeons were asked to report on definable
postoperative complications. The following chart
shows the complications experienced and the
numbers of cases involved (see Figure 22).
Figure 22: Frequency of postoperative complications
20
18
16
14
12
10
8
6
4
2
0
Tissue isc
haemia
Wound bre
akdown
Renal failu
re
Procedure
relate
d sepsis
Postoperativ
e bleeding
Pulmonary embolis
Liver failu
re
Multi org
an failu
re
Cerebro
vascular accident
Respira
tory/asp
iratio
n
Cardiac fa
ilure
Complication
Cas
es (%
)
Note: N=37 complications in 20 cases.
Comment
• 32% (20) of patients had at least one
postoperative complication which compares
with 33% nationally.
• The most common postoperative
complications were aspiration/respiratory
issues and cardiac failure.
• 11% (7) of patients had an unplanned
return to theatre which compared with 16%
nationally.
6.5 anaesthetic problems
Surgeons were asked whether there was a problem
with the anaesthetic component of the surgery.
In 94% (46/49) of cases reported no anaesthetic
issues. There were no cases in which surgeons felt
that there definitely was an anaesthetic problem;
however, in 6% (3/49) of cases, the surgeon
indicated that there was possibly an anaesthetic
problem. This compares with national figures
where 6% reported that there was definitely or
possibly an anaesthetic problem.
ANZCA have indicated an interest in participating
in the audit process in the future, which will enable
these cases to be referred to an anaesthetist for
review.
6.6 Transfers between hospitals in the aCT and nsW
Twenty-one out of 63 (33%) patients were
transferred between hospitals during their episode
of care, both from other hospitals within the
ACT and interstate from NSW. No patients were
transferred from an ACT private hospital to an ACT
public hospital during their care.
Cases in ACTASM include those patients
transferred from interstate where there is no
jurisdiction to obtain the associated case notes and
information. Therefore, should an assessor decide
that the interstate area of care could provide an
opportunity for lessons to be learned, the case is
referred to the Collaborating Hospitals Audit of
Surgical Mortality (CHASM) managed in NSW by the
Clinical Excellence Commission. This ensures that
appropriate agreement has been given, right to
reply is offered and the lessons learned reach the
required destinations to promote improvements in
patient care.
As a measure of the quality of the ‘clinical
handover’ between hospitals, surgeons are
asked to report on any delays or problems, the
appropriateness of the transfer, appropriateness
of the level of care delivered, and if sufficient
information was provided in the handover
documentation.
Surgeons are asked to record any issues associated
with the transfer of patients between hospitals
(see Figure 23).

AC
TAS
M A
NN
UA
L R
EP
OR
T 2
012
28
Figure 23: Type of issues associated with patient transfers
18
16
14
12
10
8
6
4
2
0
Tran
sfer
issu
es (%
)
Inappropria
te le
vel
of care
Insuffi
cient clin
ical
documentation
Transfer D
elay
Problems d
uring
transfe
r
Note: N=8 issues in 21 transfers.
Comment:
• 33% (21/63) of patients were transferred
during their episode of care compared with
28% nationally.
• Eight issues in total of five patients were
raised in relation to the transfer. In some
cases, there was criticism of more than
one aspect of the transfer. Thus, 24% of
transferred patients had some form of
transfer issue. This figure is less than the
nationally reported rate of 37%.
• The most frequent issues raised were transfer
delay (17%), inappropriate level of care and
insufficient clinical documentation (both at
11%), and problems during the actual transfer
(5%).

AC
TAS
M A
NN
UA
L R
EP
OR
T 2
012
29
7. peer revieW ouTComes
KEY POINTS
• In 13% (8) of cases surgeons indicated
they would change some aspect of
clinical care on review.
• In 95% (60/63) of cases, assessors
identified either no issues or minor
issues in clinical management.
• In 5% (3/63) of cases, assessors
identified an area of concern or an
adverse event.
• Overall, assessors identified 16 areas
for clinical improvement in 12 cases,
including a change in surgical approach
(6%) and issues with preoperative
transfer (5%).
7.1 surgeon retrospective review
During the peer review process, surgeons
are asked to critically review the case and ask
themselves: ‘In retrospect, would you have done
anything differently?’ In14% (9/63) of cases,
surgeons indicated that they would have done
something differently, although it was identified
that this may not have made a difference to the
outcome. Surgeons’ answers were grouped by
meaning. The most common responses were:
• change the technique or the operation (n=5)
• earlier intervention (n=2)
• earlier transfer and optimisation (n=1)
• reoperate (n=1).
7.2 second-line assessments
The peer-review process is a retrospective
examination of the clinical management of
patients who died whilst under the care of a
surgeon. All assessors (first- and second-line)
must decide if the death was a direct result of
the disease process alone or if aspects of the
management of the patient may have contributed
to the outcome.
The first-line assessor decides if the treating
surgeon has provided enough information to
allow them to reach an informed decision on the
appropriateness of management of the case. If
inadequate information was provided, the first-line
assessor requests a second-line case note review.
Other triggers for requesting SLA are:
• where a more detailed review of the case
could better clarify events leading up to death
and any lessons emanating from the case
under review
• where death was unexpected, for example, in
a young, fit patient with benign disease or in a
day surgery case.
A total of 69 cases had first-line assessments
completed in the audit period; six were referred
for second-line review; however, these were
not completed by the census date. They will be
reported on in the 2013 annual report.
7.3 Clinical management issues
A primary objective of the peer-review process
is determining if death was a direct result of
clinical management issues. There are two
possible outcomes: either the death was a direct
outcome of the disease process and the clinical
management had no impact, or there was a
perception that aspects of patient management
may have contributed to the death of the patient
(See Figure 24).
In making an assessment of contributing factors,
the assessor can choose three options:
• Area of consideration: where the assessor
believes an area of care could have been
improved or different but recognises the
issue is perhaps debatable. It represents a
suggestion regarding treatment options or a
minor criticism.
• Area of concern: where the assessor believes
that an area of care should have been better.
• Adverse event: an unintended injury or event
that was caused by the medical management
of the patient rather than by the disease
process and which was sufficiently serious
to lead to prolonged hospitalisation, or to
temporary or permanent impairment or
disability of the patient, or which contributed
to or caused death.
In addition, there are predetermined outcomes
classified as an adverse event (e.g., anastomotic
leak and pulmonary embolus). It must be
emphasised that an adverse event does not
imply negligence as some adverse events will
occur even with the best of care. For example, a
fatal pulmonary embolism can occur even with
the use of the best deep vein thrombosis (DVT)
prophylaxis. It also must be emphasised that an
adverse event is not necessarily preventable and
may not contribute to the death of the patient.

AC
TAS
M A
NN
UA
L R
EP
OR
T 2
012
30
Figure 24: Frequency and spectrum of clinical management issues recorded per patient as recorded by assessors
90
80
70
60
50
40
30
20
10
0
Spectrum of clinical management issues
Cas
es (%
)
Consideratio
n
Concern
No issues
Adverse event
Note: N= 67 events associated with 63 cases
Comment:
• In 81% (51) of cases, no issues of clinical
management were identified. When this is
combined with areas of consideration (13
instances in 9 cases), 95% (60) of cases had no
or minor criticism. Nationally, these figures
were 74% and 88% respectively.
• If an assessor flags an area of concern or
adverse event, this implies a greater degree of
criticism of clinical management. In this series,
this occurred in 5% (3) of audited deaths
compared with 13% of cases nationally.
7.3.1 Perceivedimpactofclinicalmanagementissues
First- and second-line assessors have to indicate:
1. what impact any perceived issues of patient
management might have had on the clinical
outcome, and
2. whether or not these issues were preventable.
First- and second-line assessors may identify more
than one issue of clinical management in each
patient under review. It is important, therefore,
that the impact of any of these criticisms on
an individual patient’s outcome is analysed
and compared. In the tables below, all patients
associated with an area of consideration, concern
or adverse event are represented. Tables in
this section show data that are patient-focused
rather than incident-focused. Table 4 looks at the
preventability and outcomes for the clinical issues
reported.

AC
TAS
M A
NN
UA
L R
EP
OR
T 2
012
31
Note: some cases have more than one clinical management issue and the most serious incident is used for each case N=67 events associated with 63 cases.
Comment:
In total, 16 clinical incidents were identified, with 5% (3) of all cases reporting incidents viewed as serious.
• One of these cases was attributed to care received in a regional hospital prior to transfer. This information has been forwarded to CHASM for review.
• One case was attributed to another clinical team within the hospital. Deidentified feedback has been provided.
• One case was associated with the audited surgical team. The assessor viewed the issue as “probably not preventable”. It was related to multiple associated co-morbidities where treatment of one condition led to deterioration of another.
Another seven issues were considered by assessors to have either ‘probably caused the death’ or which ‘may have contributed to death’ in six patients. All were reported as areas of consideration, that is, the assessor believed an area of care could have been improved or different but recognised that this was an area of debate. Of these cases:
• A further 3 issues were related to treatment at a regional hospital prior to transfer.
• 1 issue was associated with another clinical team within the hospital.
• 1 was related to preoperative assessment
• 2 were related to the individual patients
condition.
Table 4: Perceived impact of clinical issues groups as recorded by assessors
ClinicalIncidents TotalOccurrences(n=63) %ofAuditedSeries
No clinical management issues perceived
51 81%
Clinical management issues perceived
16 issues in 12 cases 19%
Degree of criticism expressed
Clinical management issues (n=16)
NOTE: some cases have more than one clinical management issue
% of Audited Series
NOTE: some cases have more than one clinical management issue
Area of Consideration 13 issues in 9 cases 14%
Area of Concern 2 3%
Adverse Event 1 2%
Data not available 0 0
Perceived impact on outcome
Clinical management issues (n=16) % of Audited Series
Note: some cases have more than one clinical management issue. % is most serious
incident for each case
Did not affect outcome 6 6%
May have contributed to death
5 5%
Probably caused death 5 8%
Data not available 0 0
Preventability of incidents Clinical management issues (n=16) % of Audited Series
Note: some cases have more than one clinical management issue. % is most serious
incident for each case
Definitely preventable 0 0
Probably preventable 6 6%
Probably not preventable 8 10%
Definitely not preventable 1 2%
Data not available 1 2%
Attribution to clinical specialty
Clinical management issues (n=17)
NOTE: In one case an issue was attributed to two causes
% of Audited Series
Note: some cases have more than one clinical management issue. % is most serious
incident for each case
Audited team 8 13%
Another clinical team 5 8%
Hospital Issue 1 2%
Other 3 3%
Data not available 0 0

AC
TAS
M A
NN
UA
L R
EP
OR
T 2
012
32
All surgeons receive individualised feedback on
their cases, including comments from assessors
regarding issues raised, alternative opinions
on treatment options and suggested areas for
improvement.
7.4 improvements in care
Assessors view of improvements in care
Assessors identified areas of management that
they thought could be improved. These included
preoperative care, the decision to operate,
choice of operation and the intraoperative and
postoperative management (see Figure 25).
Figure 25: Assessors perception of areas of clinical management that could be improved
40
35
30
25
20
15
10
5
0
Perc
enta
ge o
f ca
ses
(%)
Management improvement area
Operation Choice
Operation Tim
ing
Intraoperativ
e
Surgeon’s E
xperience
Postoperativ
e
Pre O
perative
Opertion D
ecision
Note: 16 issues identified in 12 patients.
Comment:
• In 13% (2) of the issues raised, assessors
considered there could have been
improvement in preoperative care. These
were related to preoperative investigation
and delay in referral to surgical team.
• In 25% (4) of the issues raised, assessors
considered there could be a change in surgical
approach. This individualised feedback was
provided to the surgeon involved. In one
case (2%), the assessor considered that the
consultant surgeon should have provided
earlier decision making support to junior staff.
• 6% (1) of issues had a delay related to the
patient.
• 6% (1) of issues were related to surgeons
experience level.
• 19% (3) of issues raised were in preoperative
transfer (discussed further at 6.6).
• The 19% (3) issues relating to postoperative
care all occurred in the same patient. This was
related to treatment of the individual patient’s
multiple comorbidities, and this feedback has
been provided to the surgeon involved.
• The 13% (2) ‘Other’ issues raised were related
to a clinical team other than the audited team.
Surgeonsviewofimprovementsincare
Surgeons were asked “In retrospect, would you
have done anything differently?” In eight of the 63
cases (13%), surgeons considered that if faced with
the same situation, they would have changed their
management of patient care. This emphasises the
value of the reflection-on-practice aspect of the
audit, providing the surgeon with a focus to review
each patient’s episode of care and to identify
opportunities for improvements in patient care
(see Figure 26).
Figure 26: Surgeons perception of areas of clinical management that could be improved
6
5
4
3
2
1
0
Areas for Clinical Management Improvement
Cas
es (%
)
Preoperativ
e Care
Choice of operatio
n
Surgical S
upervision
Comment:
• In 3% (2/63) of cases, the surgeon would have
changed preoperative care. In one case, earlier
patient optimisation and surgery, and in the
other, repeat diagnostic intervention.
• In 8% (5/63) of cases, the surgeon would have
used a different surgical approach.
• In 2% (1/63) of cases, the surgeon felt he
or she would provide closer supervision in
surgical decision-making.
AC
TAS
M A
NN
UA
L R
EP
OR
T 2
012
33
8. ConClusions
This is the second annual report for ACTASM.
• The majority of patients in the audit were
emergency admissions, with at least one co-
morbidity.
• The ASA rating of 4 or greater increased
from 52% last year to 63% this year, which
is comparable to the national average.
This result confirms the ACT Management
Committee view that the 2010 data may have
been skewed due to small numbers in the
initial year of data collection. This trend will
again be reviewed in the 2013 report.
• 85% (53/62) of cases were assessed as having
had appropriate venous thromboembolism
(VTE) prophylaxis. In only one case did the
assessor believe that the VTE prophylaxis was
not appropriate, with 13% unknown.
• 57% (36/63) of patients received care in a
critical care unit. In the 42% cases where the
patient did not go to ICU, reviewers identified
that the patient may have benefited from it in
one (4%) case.
• Fluid balance in the surgical patient is an
ongoing challenge. In this series, 3% (2)
of cases were perceived to have had poor
management of fluid balance. In 20% (12)
of cases, the assessor felt the fluid balance
status was unknown.
• In 13% (8) of cases surgeons indicated they
would change some aspect of clinical care on
review.
• In the majority of cases, assessors believed
that the patient had received appropriate
care, with 95% having either no issues, or
minor issues in clinical management.
• In 5% (3) of cases, assessors identified an area
of concern or an adverse event. This compares
favourably with nationally reported figure of
13%.
• Assessors identified 16 areas for clinical
improvements in 12 cases, including a change
in surgical approach (6%) and issues with
preoperative transfer (5%).
• Participation rate among surgeons and
hospitals in the ACT continues to be high, at
99% and 100% respectively.
• RANZCOG commenced participation in the
audit this year.
aims For 2013:
• Increase surgeons participation as assessors to
80% by the end of 2013.
• Increase participation by RANZCOG fellows to
90% by the end of 2013.
• Decrease response times for surgical case
forms for outliers. Target of less than 45 days.
• Identify improvements to the Fellows
Interface to make it more user friendly, to
increase its utilisation.
• Continue to contribute data to ANZASM and
National Case Note Review Booklets. Develop
ACT Clinical Case Note Review Booklet in
collaboration with a larger state.
• Include participation of anaethetists in
ACTASM.

AC
TAS
M A
NN
UA
L R
EP
OR
T 2
012
34
9. aCKnoWledgmenTs
The Australian Capital Territory Audit of Surgical
Mortality acknowledges the support and assistance
of many individuals and institutions that have helped
in the continuation and development of this project,
including:
• all participating surgeons
• all first-line assessors
• all second-line assessors
• medical records, safety and quality and risk
management departments in all participating
hospitals
• ACT Health for funding and ongoing support, in
particular Sonia Hogan for advice and editing
• the state Project Managers, in particular Sasha
Stewart from the South Australian Audit of
Perioperative Mortality for assistance with data
preparation for this report
• the Royal Australasian College of Surgeons,
Division of Research, Audit & Academic Surgery
staff, particularly
> Professor Guy Maddern
Chair, ANZASM Steering Committee
> A/Prof Wendy Babidge
Director, RAAS Division
> Mr Gordon Guy
ANZASM Manager
actasm management committee membership
Dr John Tharion Clinical Director, ACTASM,
Australasian Society of Cardiac &
Thoracic Surgeon
Dr Alexander Burns Australian Orthopaedic
Association
Dr Phillip Jeans General Surgeons Australia
Dr Tuan Pham Australian & New Zealand Society
of Otolaryngology Head & Neck
Surgery
Dr David McDowell Neurosurgical Society of
Australasia
Dr Chandra Patel Plastic surgeon
Dr David Hardman Vascular surgeon
Dr Morris Mulcahy Urological Society of Australia
and New Zealand
Dr Stephen Robson Royal Australian and New
Zealand College of Obstetricians
and Gynaecologists
Dr Carmel McInerney Australian and New Zealand
College of Anaesthetists
Ms Libby Trickett ACT Government, Health
Directorate Representative
Ms Veronica Walker Project Manager


Telephone: +61 2 6285 4558
Facsimile: +61 2 6285 3366
Email: [email protected]
Address: 3/13 Napier Close Deakin ACT 2600 Australia
Web: www.surgeons.org/actasm
ACTASM ANNUAL REPORT 2012ACT Audit of Surgical Mortality