ACTA UNIVERSITATIS PALACKIANAE OLOMUCENSIS GYMNICA …
70
ACTA UNIVERSITATIS PALACKIANAE OLOMUCENSIS GYMNICA Vol. 38 No. 1
Transcript of ACTA UNIVERSITATIS PALACKIANAE OLOMUCENSIS GYMNICA …

ACTAUNIVERSITATIS PALACKIANAE OLOMUCENSIS
GYMNICA
Vol. 38No. 1

Editor in Chief
doc. MUDr. Pavel Stejskal, CSc. Faculty of Physical Culture Palacký University, Olomouc, Czech Republic
Managing Editor
doc. PhDr. Vlasta Karásková, CSc. Faculty of Physical Culture Palacký University, Olomouc, Czech Republic
Editorial Board
prof. Dr. Joăo M. S. C. Abrantes Faculty of Human Movement, Technical University, Lisbon, Portugal
prof. Dr. Herman Van Coppenolle Faculty of Physical Education and Physiotherapy Katholic University, Leuven, Belgium
prof. PhDr. Karel Frömel, DrSc. Faculty of Physical Culture Palacký University, Olomouc, Czech Republic
prof. MUDr. Dušan Hamár, CSc. Faculty of Physical Education and Sports Comenius University, Bratislava, Slovak Republic
prof. Dr. Peter Hirtz Ernst-Moritz-Arndt University, Greifswald, Germany
prof. PhDr. Bohuslav Hodaň, CSc. Faculty of Physical Culture Palacký University, Olomouc, Czech Republic
doc. RNDr. Miroslav Janura, Dr. Faculty of Physical Culture Palacký University, Olomouc, Czech Republic
prof. Dr. Bojan Jošt Faculty of Sport, University of Ljubljana, Slovenia
prof. Dr. hab. Stanisław Kowalik University School of Physical Education, Poznan, Poland
Dr. Elisabeth Mattos University of Sao Paulo, Sao Paulo, Brazil
prof. PhDr. Karel Měkota, CSc. Faculty of Physical Culture Palacký University, Olomouc, Czech Republic
doc. PhDr. Jiří Novosad, CSc. Faculty of Physical Culture Palacký University, Olomouc, Czech Republic
prof. MUDr. Jaroslav Opavský, CSc. Faculty of Physical Culture Palacký University, Olomouc, Czech Republic
prof. Dr. hab. Joachim Raczek Academy of Physical Education, Katowice, Poland
prof. RNDr. Jarmila Riegerová, CSc. Faculty of Physical Culture Palacký University, Olomouc, Czech Republic
prof. James F. Sallis, Ph.D. San Diego State University, San Diego, USA
prof. PhDr. Hana Válková, CSc. Faculty of Physical Culture Palacký University, Olomouc, Czech Republic
prof. PhDr. František Vaverka, CSc. Faculty of Physical Culture Palacký University, Olomouc, Czech Republic

ACTA UNIVERSITATIS PALACKIANAE OLOMUCENSIS
GYMNICA
Vol. 38No. 1
PALACKÝ UNIVERSITY OLOMOUC
2008

All contributions were reviewed anonymously.
Všechny příspěvky byly recenzovány anonymně.
The authors take response for contents and correctness of their texts.
Autoři odpovídají za obsah a jazykovou správnost prací.
Electronic form available on address: http://www.gymnica.upol.cz
Elektronická podoba (časopisu) je k dispozici na adrese: http://www.gymnica.upol.cz
© Vlasta Karásková, 2008
ISSN 1212-1185

Acta Univ. Palacki. Olomuc., Gymn. 2008, vol. 38, no. 1 5
CONTENTS
Relationship between sports activity, smoking and alcohol and marijuana abuse in elementary school childrenin SloveniaVeronika Lucija Kropej, Mateja Videmšek, Rado Pišot .......................................................................................................... 7
Overweight and obesity trends in Slovenian boys from 1991 to 2006Marjeta Kovač, Bojan Leskošek, Janko Strel ....................................................................................................................... 17
Posture analysis using position detector DTP2 in senescent women after the applicationof a targeted exercise programJarmila Riegerová, Jakub Krejčí, Petr Kolisko, Miroslava Přidalová ................................................................................... 27
The height of the longitudinal foot arch assessed by Chippaux-Šmiřák index in the compensatedand uncompensated foot types according to RootIvan Vařeka, Renata Vařeková .............................................................................................................................................. 35
The significance of sensorimotor response components and EMG signals depending on stimuli type in fencingZbigniew Borysiuk ................................................................................................................................................................. 43
Load intensity in volleyball game like drillsMichal Lehnert, Pavel Stejskal, Pavel Háp, Miroslav Vavák ................................................................................................ 53
An example of an e-learning community for lifelong learning by physical education teachersMatej Majerič, Milan Žvan, Marko Kolenc .......................................................................................................................... 59
OBSAH
Vztah mezi sportovní aktivitou, kouřením a užíváním alkoholu a marihuany u dětí na základních školáchve SlovinskuVeronika Lucija Kropej, Mateja Videmšek, Rado Pišot .......................................................................................................... 7
Tendence k nadváze a obezitě u slovinských chlapců v letech 1991–2006Marjeta Kovač, Bojan Leskošek, Janko Strel ....................................................................................................................... 17
Analýza postury polohovým snímačem DTP2 u žen ve věku senescence po aplikaci cílenéhocvičebního programuJarmila Riegerová, Jakub Krejčí, Petr Kolisko, Miroslava Přidalová ................................................................................... 27
Výška podélné nožní klenby stanovená metodou Chippaux-Šmiřák u kompenzovanýcha nekompenzovaných typů nohy dle RootaIvan Vařeka, Renata Vařeková .............................................................................................................................................. 35
Význam komponentů senzorimotorické responze a EMG signálů v závislosti na typu stimulů při šermuZbigniew Borysiuk ................................................................................................................................................................. 43
Intenzita zatížení při herních cvičeních ve volejbaluMichal Lehnert, Pavel Stejskal, Pavel Háp, Miroslav Vavák ................................................................................................ 53
Příklad e-learningové komunity v celoživotním vzdělávání učitelů tělesné výchovyMatej Majerič, Milan Žvan, Marko Kolenc .......................................................................................................................... 59


Acta Univ. Palacki. Olomuc., Gymn. 2008, vol. 38, no. 1 7
RELATIONSHIP BETWEEN SPORTS ACTIVITY, SMOKING AND ALCOHOLAND MARIJUANA ABUSE IN ELEMENTARY SCHOOL CHILDREN IN SLOVENIA
Veronika Lucija Kropej*, Mateja Videmšek**, Rado Pišot*, ***
*Institute for Kinesiology Research at the Science and Research Centre of Koper, University of Primorska, Koper, Slovenia**Faculty of Sport, University of Ljubljana, Ljubljana, Slovenia***Faculty of Education, University of Primorska, Koper, Slovenia
Submitted in June, 2007
Prevention is the most effective remedy against drug abuse. On the one hand, physical activity triggers a series of factors which compel us to adopt healthy dietary behaviours and, on the other, it constitutes drug abuse prevention, as it is itself a kind of body and mind stimulant. The research at hand aims at establishing the degree of familiarity with and abuse of narcotic drugs (such as, for instance, cigarettes, alcohol and marijuana) in pupils in relation to the frequency of their engagement in sports activities. The sample comprised 748 children, 194 male and 189 female fourth graders (with an average age of 10 years ± 5 months) and 201 male and 164 female seventh graders (with an average age of 13 years ± 4 months). The indicated data were obtained within the framework of the project “Physical/sports activity for health” carried out by the Institute for Kinesiology Research at the Science and Research Centre of Ko-per, University of Primorska, Slovenia. We have applied the IPAQ survey instrument (International Physical Activity Questionnaire), which we had tailored somewhat to the age and specific features of respondents. For the purposes of establishing the relationship between non numeric variables, we have applied correspondence analysis. For numeric variables, we have applied the analysis of variance and the independent samples t-test. All hypotheses were verified at the 5% statistical risk level (p = 0.05). The results attested to a statistically significant relationship between sports activ-ity, smoking and alcohol and marijuana abuse in pupils. The fact is that the drug abuse problem cannot be remedied in its entirety, but we could, however, alleviate it substantially. One of the most relevant factors in decreasing drug abuse is therefore also the engagement of youth in appropriate sports activities (during leisure time, in particular), which should be directed and planned accordingly by parents and teachers.
Keywords: Sports activity, smoking, alcohol, marijuana, children.
INTRODUCTION
Sports activity is an important means to achieving healthy dietary behaviour, as it exerts significant posi-tive effects on physical and mental health. Movement or physical activity triggers a series of factors which compel us to adopt healthy dietary behaviours and constitutes drug abuse prevention, as it is itself a kind of body and mind stimulant. Lack of physical activity constitutes an obvious health risk factor, closely related to the emer-gence of numerous diseases affecting both human body and human well-being.
Alcohol, tobacco, LSD, cocaine, heroin, inhalants, marijuana, and similar substances rank among the most harmful narcotic drugs. All drugs, including less harmful substances, such as coffee (caffeine) and true tea (teine), are psychoactive or psychotropic substances, which in fact means that they affect the nervous system. Frequent exposure to drug effects results in neuroadap-tation or adaptation of the nervous system (Čebašek--Travnik, 2004). The said adaptation is related to drug
seeking behaviour and the development of drug toler-ance. In principle, it holds true that the younger the organism when it first encounters drugs (nicotine, for in-stance) the faster it will become dependent or addicted (Stergar, 2004).
One should look for reasons for drug abuse in the interdependent triangle adolescent – environment – drugs. It is rather important whether an individual is an explorer or a timid person, whether or not he or she is risk driven. An important role in determining the risk of an individual becoming a regular smoker, habitual alcoholic, and the like, is played by genes (Madden, Bu-cholz, Martin, & Heath, 2000; Bierut, Schuckit, Hessel-brock, & Reich, 2000). Namely, epidemiological studies (Anthony & Echeagaray-Wagner, 2000) have confirmed the existence of hereditary factors related to the misuse of a respective drug.
A powerful catalytic effect in the development of drug addiction (to nicotine, alcohol, cannabis, and similar) is exerted by the environmental factors which allow for and maintain addictive behaviour. It is of great

8 Acta Univ. Palacki. Olomuc., Gymn. 2008, vol. 38, no. 1
consequence whether or not an individual is born into a family where, for instance, tobacco is an every day fact of life (Stergar, 2004). Also ranking among the environ-mental factors are the low prices of and easy access to tobacco products and alcohol, further, smoking as an acceptable form of behaviour (among the young, in par-ticular), and non compliance with legislation governing smoking reduction (Čebašek-Travnik, 2004). According to the researchers’ opinion, traumatic events and stress-ful experience also contribute to the development of dependence or addiction (Little, 2000).
The consumption of any drug on a regular basis may lead to the consumption of any other drug. Alcoholism is ten times more frequent in smokers than in non smok-ers. Researchers have found also that alcoholics are fre-quently smokers, and vice versa (Istvan & Matarazzo, 1984; Glassman, 1990). In part, the causes there of are also genetic, however, thus far, it has not been discov-ered why does there exist a genetic connection between smoking and alcohol dependence (Madden, Bucholz, Martin, & Heath, 2000).
The World Health Organization has published the list of ten selected risk factors (WHO, 2002). It is evi-dent there from that tobacco ranks first among the said risk factors, alcohol third and illicit drugs eighth.
If we consider the problem from the point of view of multiplicity, we see that the process of development into a nicotine addict takes the shape of a funnel. All children go through the initiation phase. A somewhat smaller number of children light their first cigarette and thus overstep the line that separates the inexperienced from the experienced. Fewer children persevere and continue with their smoking excursions. An even lesser number of adolescents persist further and continue practising smoking and only the smallest number of chil-dren turn into nicotine dependents (Stergar, 2004). The speed with which an individual drug takes effect deter-mines the intensity of its potential for the development of dependence or addiction. Drinking or alcohol con-sumption affects the activity of opioid peptides, which consequently enhances the feeling of pleasure (Roberts, McDonald, Heyser, Kieffer, Matthes, Koob, & Gold, 2000). In addition to activating opioid peptides, alco-hol consumption activates a specific serotonin receptor (responsible for regulation and control of mood, sleep, body temperature, appetite, etc.) which stimulates the activity of dopamine in the brain (a pleasure causing key element in the development of alcohol dependence) and thus contributes to the feeling of pleasure. Other drugs (marijuana, cocaine, morphine) have similar effects on the human organism. The consumption of alcohol and other drugs results also in altered mental disposition (anxiety, depression, drug craving). The intensity of psychological disturbances can be greater than that of physiological ones and the symptoms there of last longer than the physiological symptoms, there by increasing
the motivation for the reabuse of drugs (National Insti-tute on Alcohol Abuse and Alcoholism, 2000).
Prevention is the most effective means of fighting drug abuse. In principle, it holds true that people who do not start taking drugs prior to the age of 25 will not have any serious problems in combating them later on in their lives (Hanson, 2002). National Institute on Drug Abuse, is of the opinion that in terms of drug abuse pre-vention there exist the so called risk and protective fac-tors (Cire, 2002). The following are protective factors: strong and positive ties, parent control over the activi-ties engaged in by children and their peers, clear rules applicable within the family, inclusion of parents in the lives of their children, school performance, strong ties between institutions (e. g. between school and religious organizations), and knowledge of principles regarding drug abuse. As for the risk factors, the following fall within the group: chaotic domestic environment (par-ents taking stimulants or parents suffering from mental illnesses), ineffective parenting or upbringing (in cases of problematic children, in particular), lack of ties be-tween parents and children, inappropriate timid and ag-gressive behaviour in school, poor school performance, poor ability to establish contacts and poor social skills, socializing with peers inclined to deviant behaviour, and witnessing of drug use approval by family, school, working environment, peers and the broader social en-vironment.
This research is aimed at establishing the degree of familiarity with and abuse of narcotic drugs (such as, for instance, cigarettes, alcohol and marijuana) of and by pupils in relation to the frequency of their engagement in sports activities.
METHODS
ParticipantsThe sample of respondents was intentionally selected,
namely, in such a manner as to cover as wide a spectrum of geographical areas in Slovenia as possible (stratified sampling). The sample comprised 748 children, 194 male and 189 female fourth graders (with an average age of 10 years ± 5 months) and 201 male, 164 female seventh graders (with an average of 13 years ± 4 months). The indicated research data were obtained within the frame-work of the target research project “Physical/sports activity for health” carried out by the Institute for Kine-siology Research at the Science and Research Centre of Koper, University of Primorska, Slovenia.
InstrumentsWe have applied the IPAQ survey instrument (In-
ternational Physical Activity Questionnaire), which we had tailored somewhat to the age and specific features of respondents. The questionnaire contained 26 questions

Acta Univ. Palacki. Olomuc., Gymn. 2008, vol. 38, no. 1 9
relating to smoking, alcohol and drugs as well as a set of questions relating to a child’s physical/sports activ-ity. The answers to the questions were provided by the children. Prior to and following the completion of the questionnaire, the assistants provided help to the chil-dren by guiding them through individual questions.
ProcedureWe have processed the data with the use of the sta-
tistical computer programme SPSS (Statistical Package for the Social Sciences), version 13.0. For numeric vari-ables, we have applied, on the one hand, the method for verifying the assumption as to the difference between two arithmetic means (two groups) and, on the other, the analysis of variance (several groups), i. e. in addi-tion to the basic statistics of variables. For the purposes of establishing the relationship between non numeric variables, we have applied correspondence analysis. All hypotheses were verified at the 5% statistical risk level (p = 0.05).
RESULTS
SmokingThe results have shown that children of this age
group smoke very rarely. Namely, only a minimum share of children stated that they smoke occasionally (1%) or regularly (0.1%). We have established no sig-nificant gender and age differences between pupils with regard to the frequency of smoking. The results attested to a statistically significant relationship between sports activity and pupils’ smoking habits.
It is evident from Fig. 1 that among the non smoking children attending the fourth and the seventh grades of primary school there are 55% of children who engage in sports activities frequently, 40% of those who engage in sports activities occasionally, and 5% of those who never engage in sports activities. Among children who smoke occasionally, all are frequently physically active. Among children who smoke regularly, 25% engage in sports activities frequently and 25% occasionally and there are as many as 50% of those who never engage in sports activities. Regarding the fact that there is in-significant number of subjects in the group of children who smoke frequently, it is not possible to come to any objective conclusion about the sports activity of these children.
We have established a statistically significant rela-tionship also between the smoking habits of 13 year olds and the frequency of their engagement in sports activities with friends (p = 0.022).
It is evident from Fig. 2 that among the non smoking seventh graders there are 38% of children who frequent-ly engage in sports activities with their friends, 47% of those who engage in sports activities occasionally, and
15% of those who never engage in sports activities. Among children who smoke regularly, none engages in sports activities with friends frequently or occasionally. All 100% declared they never engage in sports activities with friends.
Similar findings were established by Videmšek et al. (2002), namely girls who smoke only on special occa-sions engage in sports activities more frequently than girls who smoke all the time. The findings show that pupils from non smoking families generally engage in sports activities more frequently than pupils from smok-ing families. Ažman (2004) established that individuals who have smoked on several occasions engage in sports activities less frequently (67.1%) than those who have not (78.5%).
AlcoholThe majority of children have already tried alcoholic
beverages (71% of seventh graders and 55% of fourth graders); in terms of statistical significance, a greater number of seventh graders than fourth graders have tried alcohol (p = 0.000). We have established that a greater number of boys (67%) than girls (58%) have tried alcohol (p = 0.014).
Among the fourth graders, 2% drink alcohol every day and as much as 7% at weekends. Among the seventh graders, nobody drinks alcohol on a daily basis and 4% drink alcohol at weekends. It was rather interesting to find that children drink alcohol most often in a domestic environment (82%), while 13% of children drink in the company of their friends and 5% of them alone without any company what so ever.
It is evident from Fig. 3 that, on average, children who have never tried alcohol spend daily more time walking (41 min/day) than children who have already tried alcohol (34 min/day); these differences are sta-tistically significant (p = 0.02), even more so in fourth graders (p = 0.028).
MarijuanaWe have established that 3% of children aged 10 and
13 have already tried drugs and that 0.2% of children have tried it on several occasions. We have established no statistically significant differences according to age and sex. Research results have shown a statistically sig-nificant relationship between drug use and engagement in sports activities.
It is evident from Fig. 4 that among children who have never tried drugs, 55% engage in sports activities frequently, 40% occasionally and 5% never. Among children who have tried drugs on a single occasion the majority (70%) engages in sports activities frequently, 30% occasionally and 0% never. However, regarding the small number of subjects in the group of children who take drugs frequently, these results can be spurious.
10 Acta Univ. Palacki. Olomuc., Gymn. 2008, vol. 38, no. 1
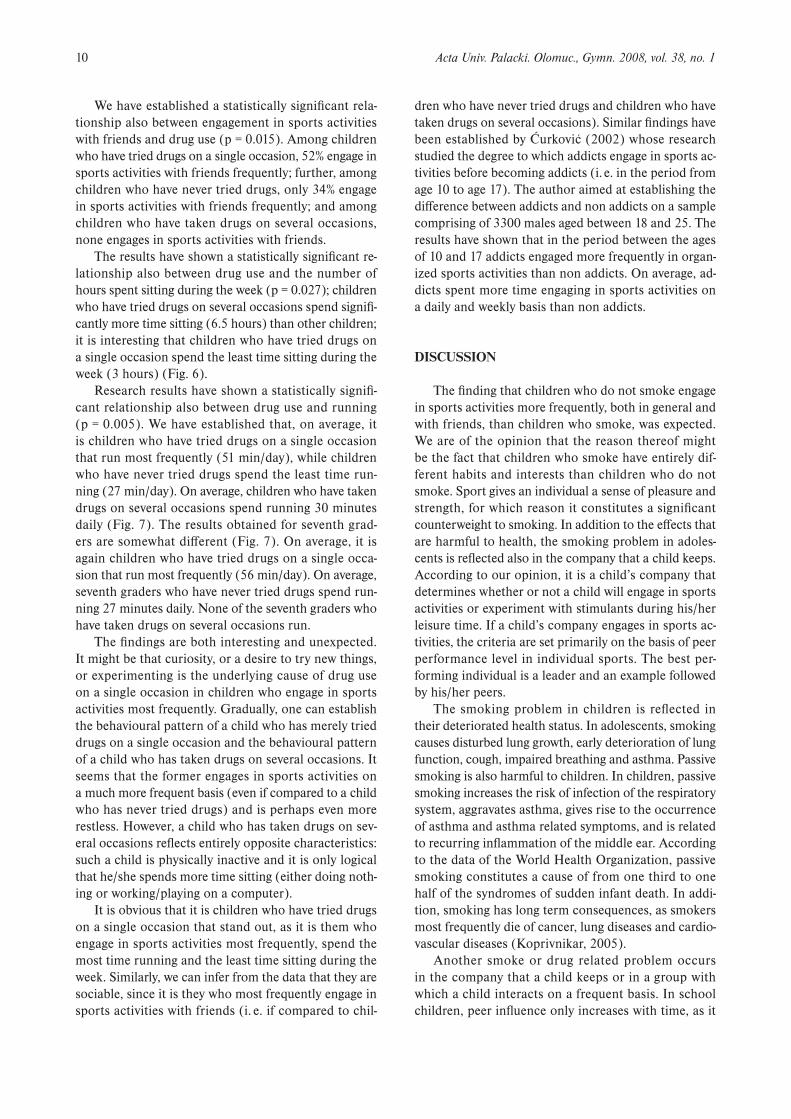
We have established a statistically significant rela-tionship also between engagement in sports activities with friends and drug use (p = 0.015). Among children who have tried drugs on a single occasion, 52% engage in sports activities with friends frequently; further, among children who have never tried drugs, only 34% engage in sports activities with friends frequently; and among children who have taken drugs on several occasions, none engages in sports activities with friends.
The results have shown a statistically significant re-lationship also between drug use and the number of hours spent sitting during the week (p = 0.027); children who have tried drugs on several occasions spend signifi-cantly more time sitting (6.5 hours) than other children; it is interesting that children who have tried drugs on a single occasion spend the least time sitting during the week (3 hours) (Fig. 6).
Research results have shown a statistically signifi-cant relationship also between drug use and running (p = 0.005). We have established that, on average, it is children who have tried drugs on a single occasion that run most frequently (51 min/day), while children who have never tried drugs spend the least time run-ning (27 min/day). On average, children who have taken drugs on several occasions spend running 30 minutes daily (Fig. 7). The results obtained for seventh grad-ers are somewhat different (Fig. 7). On average, it is again children who have tried drugs on a single occa-sion that run most frequently (56 min/day). On average, seventh graders who have never tried drugs spend run-ning 27 minutes daily. None of the seventh graders who have taken drugs on several occasions run.
The findings are both interesting and unexpected. It might be that curiosity, or a desire to try new things, or experimenting is the underlying cause of drug use on a single occasion in children who engage in sports activities most frequently. Gradually, one can establish the behavioural pattern of a child who has merely tried drugs on a single occasion and the behavioural pattern of a child who has taken drugs on several occasions. It seems that the former engages in sports activities on a much more frequent basis (even if compared to a child who has never tried drugs) and is perhaps even more restless. However, a child who has taken drugs on sev-eral occasions reflects entirely opposite characteristics: such a child is physically inactive and it is only logical that he/she spends more time sitting (either doing noth-ing or working/playing on a computer).
It is obvious that it is children who have tried drugs on a single occasion that stand out, as it is them who engage in sports activities most frequently, spend the most time running and the least time sitting during the week. Similarly, we can infer from the data that they are sociable, since it is they who most frequently engage in sports activities with friends (i. e. if compared to chil-
dren who have never tried drugs and children who have taken drugs on several occasions). Similar findings have been established by Ćurković (2002) whose research studied the degree to which addicts engage in sports ac-tivities before becoming addicts (i. e. in the period from age 10 to age 17). The author aimed at establishing the difference between addicts and non addicts on a sample comprising of 3300 males aged between 18 and 25. The results have shown that in the period between the ages of 10 and 17 addicts engaged more frequently in organ-ized sports activities than non addicts. On average, ad-dicts spent more time engaging in sports activities on a daily and weekly basis than non addicts.
DISCUSSION
The finding that children who do not smoke engage in sports activities more frequently, both in general and with friends, than children who smoke, was expected. We are of the opinion that the reason thereof might be the fact that children who smoke have entirely dif-ferent habits and interests than children who do not smoke. Sport gives an individual a sense of pleasure and strength, for which reason it constitutes a significant counterweight to smoking. In addition to the effects that are harmful to health, the smoking problem in adoles-cents is reflected also in the company that a child keeps. According to our opinion, it is a child’s company that determines whether or not a child will engage in sports activities or experiment with stimulants during his/her leisure time. If a child’s company engages in sports ac-tivities, the criteria are set primarily on the basis of peer performance level in individual sports. The best per-forming individual is a leader and an example followed by his/her peers.
The smoking problem in children is reflected in their deteriorated health status. In adolescents, smoking causes disturbed lung growth, early deterioration of lung function, cough, impaired breathing and asthma. Passive smoking is also harmful to children. In children, passive smoking increases the risk of infection of the respiratory system, aggravates asthma, gives rise to the occurrence of asthma and asthma related symptoms, and is related to recurring inflammation of the middle ear. According to the data of the World Health Organization, passive smoking constitutes a cause of from one third to one half of the syndromes of sudden infant death. In addi-tion, smoking has long term consequences, as smokers most frequently die of cancer, lung diseases and cardio-vascular diseases (Koprivnikar, 2005).
Another smoke or drug related problem occurs in the company that a child keeps or in a group with which a child interacts on a frequent basis. In school children, peer influence only increases with time, as it

Acta Univ. Palacki. Olomuc., Gymn. 2008, vol. 38, no. 1 11
0102030405060708090
100
ton odeko
msek o
ms yllanoisacco
ekoms
ylt ne uqerfton odeko
mseko
ms yllanoisacco
ekoms
ylt neuqe rfton odeko
mseko
ms yllanoisacco
ekoms
yltneuqe rf
4th and 7th
grade7th grade 4th grade
p = 0.00 χ2= 23.17 / p = 0.00 χ2 = 14.4 / p = 0.03 χ2 = 10.5
ni% often engage in sports
sometimes engage in sports
never engage in sports
Fig. 1Frequency of engagement in physical/sports activity in relation to smoking
Fig. 2Frequency of engagement in sports activities by seventh-graders with their friends in relation to smoking
Fig. 3Walking habits in relation to alcohol consumption
0102030405060708090
100
do not smoke smokeoccasionally
smokefrequently
p = 0.02 χ2 = 11.46
ni%
often engage in sports
sometimes engage insports
never engage in sports
05
1015202530354045
I triedalcohol
I did nottry
alcohol
I triedalcohol
I did nottry
alcohol
4th and 7th grade 4th grade
p = 0.02 F = 5.42 / p = 0.03 F = 4.87
walking (min/day)
min
/day

12 Acta Univ. Palacki. Olomuc., Gymn. 2008, vol. 38, no. 1
Fig. 4Engagement in sports activity in relation to drug use
Fig. 5Engagement in sports activity with friends in relation to drug use
Fig. 6Number of hours spent sitting during the week in relation to drug use
0102030405060708090
100
often engage insports
sometimesengage in sports
never engage insports
p = 0.03 χ2 = 10.5
ni%
I did not try drugs
yes, I tried drugs once
yes, I took drugs frequently
0102030405060708090
100
I did not trydrugs
yes, I trieddrugs once
yes, I tookdrugs
frequently
p = 0.01 χ2 = 12.33
ni%
often engage in sports
sometimes engage in sports
never engage in sports
01234567
I did not try drugs Yes, I tried drugsonce
Yes, I took drugsfrequently
p = 0.027 F = 3.63
hour
s/da
y
number of hours spent sittingduring the week
is extremely important for children to be part of a group that accepts them as equals (but in turn demands from them to abide by its specific principles and rules). If it is a question of a smoking group, a child will light his/her first cigarette sooner or later. However, at that point, the problems only begin, since such a group will not content itself with smoking, but will, almost simultane-ously, indulge also in more harmful substances. At this point, we should stress that it is not a golden rule that every group succumbs to drugs sooner or later; however, it is a general rule that every group has its own specific
set of rules or principles and should an individual fail to abide by them or observe them, the group will, without fail, exclude such an individual from its midst (Bierman, Smooth, & Aumiller, 1993; Coie, 1990). The criteria for the formation or separation of groups are different, e. g. sporting interests, academic interests, racial characteris-tics, social status, drug abuse and delinquency (Brown, Mounts, Lamborn, & Steinberg, 1993; Eckert, 1989; Schofield, 1981).
The school system does prohibit smoking in school, but it has no influence whatsoever during the time

Acta Univ. Palacki. Olomuc., Gymn. 2008, vol. 38, no. 1 13
a child spends outside school. After the classes, a child is left to his/her own devices and decides himself/herself what he/she will do during leisure time. For this very reason, educators, both parents and teachers, should mo-tivate and encourage children to participate in various organized special interest activities. A teacher should serve as an example to children and provide them with support. Regretfully, though, more and more teachers break the rules and, which is even worse, in front of the children. The research carried out by Videmšek et al. (2002) has established that there are more than 15% of primary school gym teachers whom the pupils know to be smokers. Gym teachers are undoubtedly the very persons who should serve as an example to children, as an embodiment of a healthy lifestyle.
The research has shown that children who have not tried alcohol spend more time walking daily than chil-dren who have already tried alcohol. The finding that children who do not drink alcohol spend more time walking is not surprising; most likely, they are also more active in general. Why does a child start drinking alco-hol? The reasons thereof could be found in the company that forces a child to drink alcohol or the environment that fails to provide a child with the possibilities to en-gage in healthy play, sports and pastime. They may be found in the domestic environment itself. It may be that a child drinks only occasionally, but it may also be that the overall picture is much more terrifying. Children who are witnesses to alcoholism bear the consequences thereof on their shoulders if they are not provided with proper support and guidance by someone else.
According to the opinion of Karpljuk et al. (2003), alcoholism in the family causes disputes and forces chil-dren to witness verbal and physical violence between parents, for which reason they are confused and often feel torn between the two parents to whom they are emo-tionally attached. As they miss the feeling of safety and
security which normally stems from the love between parents and a steady home, their emotional development cannot follow a normal course. Razboršek and Krištof (1988) believes that behavioural disturbances, or the so called lack of discipline syndrome, can be perceived in the majority of children of alcoholics. Such children are disobedient, rebellious and mendacious and they tend to skip school and run away from home, and so on. They fail to develop basic work habits and a sense of order, while their disturbing behaviour and people’s reaction to it are causes of great concern. When a child is no longer able to cope with the pressures of the social en-vironment, he/she starts coping with distress in his/her own way. It all begins with simple evasion or withdrawal, roving and/or pilferage. A child’s school performance deteriorates and inappropriate behaviour in school becomes ever more frequent. As the school no longer tolerates such behaviour, parents exert an even greater pressure on their child and thus the tragedy continues. A child moves on from petty to grand larceny, prostitu-tion and/or drugs. Rugelj (2000) believes that such ado-lescents see the solution to their problems in alcoholic stupor. However, as stupors, irrespective of their kind, never solve anything and only postpone the problems, the hurt and to stupor accustomed adolescents are, so to speak, again forced to drown their distress in alcohol. Regular intoxication is no longer a mere condition for the development of alcoholism, but also a very certain and obvious sign that such people are already alcoholics, even though in the early period of alcoholism.
The aim of our research was also to establish wheth-er or not there exists a relationship between a child’s engagement in sports activities and drug consumption. If we summarize the findings, we can say that children who have tried drugs (e. g. marijuana) on a single oc-casion engage in sports activities more frequently than children who have never taken any drugs. One of the
Fig. 7Running in relation to drug use
0
1020
30
4050
60
ton did Isgurd yrt
dei rt I ,se Ysgurde cno
koot I , seYs gur d
yltneuqerf
to n di d Isgurd yrt
deirt I ,seYsgurdecno
koot I ,seYsgur d
yl tneuqerf
4th and 7th grade 7th grade
p = 0.00 F = 5.43 / p = 0.02 F = 3.96
Average number of min/dayspent running
min
/day

14 Acta Univ. Palacki. Olomuc., Gymn. 2008, vol. 38, no. 1
reasons thereof may be that more active and vivacious children tend to be fascinated by new things in their lives, one of them being drugs. However, we are of the opinion that such experimenting stems only from curiosity, for which reason it does not lead to addic-tion. We should emphasize that our analysis showed only a minimum share of children who have tried drugs on a single occasion (3%), while 0.2% of children have taken drugs on several occasions. Other children have had no experience with drugs.
We believe that a lively and curious child is more likely to try drugs if presented with an opportunity than a less vivacious and less inquisitive child. We have found that children who have tried drugs on a single occasion engage in sports activities more frequently than other children. This fact points to the finding that such chil-dren run more and sit less during the week than other children. For this reason, we suppose that their energy levels are higher. The finding that children who have tried drugs on a single occasion engage more frequently in sports activities with their friends attests to their so-ciable character. They crave the company of their peers. Quite to the contrary, among children who have taken drugs on several occasions (0.2% within the framework of our research), none engages in sports activities with friends. This means that drug abuse leads to asocial behaviour. However, in our opinion, the use of drugs on a single occasion stems from childish curiosity which, in most cases, has no consequences. This assumption was confirmed also by the research carried out by Videmšek et al. (2000). Although the research (Videmšek et al., 2006) which studied the relationship between drug abuse (alcohol, cigarettes, marijuana) and frequency of engaging in sports activities by 14 year olds failed to establish a statistically significant relationship, it never-theless emphasizes that the provision of adequate physi-cal/sports activities constitutes one of the most decisive factors in reducing drug abuse.
The young are impressionable and as they learn through imitation, they often imitate the example of teachers, representatives of the environment in which a child lives and grows up. However, it is not only school teachers and parents who embody the said environment, but older peers and advertisements in (mass) media as well. In the majority of developed countries, the promo-tion of cigarettes and alcohol is either prohibited or very limited. The television and film industries are the only two media where the tobacco industry can still advertise and promote its products. The world of fashion and film exerts a significant influence on a great mass of peo-ple all around the globe. Studies have shown that after seeing a film in which famous stars smoke cigarettes, American teenagers are 2.5 times more likely to start smoking (Institute of Public Health Kranj, 2005). This finding is thoroughly exploited by the tobacco industry which has chosen the most widespread medium, i. e.
the world of film and fashion, with a view to reaching potential smokers.
CONCLUSION
The main findings of the research were that children who do not smoke engage in sports activities more fre-quently, both in general and with friends, than children who smoke. The second finding was that children who have not tried alcohol spend more time walking daily than children who have already tried alcohol. The last finding was that children who have tried marijuana on a single occasion engage in sports activities more fre-quently than children who have never taken any drugs. One of the reasons thereof may be that more active and vivacious children tend to be fascinated by new things in their lives, one of them being drugs. However, we are of the opinion that such experimenting stems only from cu-riosity, for which reason it does not lead to addiction.
Although dissuasion, prevention and prohibition in the area of drug abuse undoubtedly constitute the measures which might contribute to the decrease in these vicious habits, we believe that the young could be dissuaded from drug abuse mainly by a well organized quality lifestyle. Individuals with steady employment most likely satisfy their needs by engaging in activities that correspond to their wants, for which reason they do not feel such a great need for various “substitutes”. The fact is that the drug abuse problem cannot be remedied in its entirety, but we could, however, alleviate it sub-stantially. One of the most relevant factors in decreasing drug abuse is therefore also the engagement of youth in appropriate sports activities, during leisure time, in particular, which should be directed and planned ac-cordingly by parents and teachers alike.
REFERENCES
Anthony, J. C., & Echeagaray-Wagner, F. (2000). Epi-demiologic analysis of alcohol and tobacco use. Pat-terns of cooccurring consumption and dependence in the United States. Alcohol Research & Health, 24(4), 201–208.
Ažman, D. (2004). Kajenje in šport v prostem času pri osnovnošolcih in srednješolcih. In R. Pišot, V. Štem-berger, J. Zurc, & Obid, A. (Eds.), Otrok v gibanju: Zbornik izvlečkov in prispevkov: 3. mednarodni sim-pozij (pp. 44–45). Koper: Univerza na Primorskem, Znanstveno-raziskovalno središče.
Bierman, K. L., Smoot, D. L., & Aumiller, K. (1993). Characteristics of aggressive rejected, aggressive (non rejected), and rejected (non aggressive) boys. Child Development, 64, 139–151.

Acta Univ. Palacki. Olomuc., Gymn. 2008, vol. 38, no. 1 15
Bierut, L. J., Schuckit, M. A., Hesselbrock, V., & Reich, T. (2000). Cooccurring risk factors for alcohol de-pendence and habitual smoking: Results from the collaborative study on the genetics of alcoholism. Alcohol Research & Health, 24(4), 233–241.
Brown, B. B., Mounts, N., Lamborn, S. D., & Stein-berg, L. (1993). Parenting practices and peer group affiliation in adolescence. Child Development, 64, 467–482.
Cire, B. (2002). NIDA Conference reviews advances in prevention science, announces new national research initiative. NIDAnotes, 16(6), 44–46.
Čebašek-Travnik, Z. (2004). Kajenje kot bolezen od-visnosti. Vita. Strokovna zdravstveno vzgojna revija. Psihiatrična klinika Ljubljana. Retrieved 4. 5. 2005 from the World Wide Web: http://www.revija-vita.com/Vita_43/Kajenje_kot_bolezen_odvisnosti/ka-jenje_kot_bolezen_odvisnosti.html
Coie, J. D. (1990). Toward a theory of peer rejection. In S. R. Asher & J. D. Coie (Eds.), Peer rejection in childhood (pp. 365–401). Cambridge, England: Cambridge University Press.
Eckert, P. (1989). Jocks and burnouts: Social categories and identity in the high school. New York: Teachers College Press.
Glassman, A. H., Helzer, J. E., Covey, L. S., Cott-ler, L. B., Stetner, F., Tip, J. E., & Johnson, J. (1990). Smoking, smoking cessation, and major depression. Journal of the American Medical Association, 264, 1546–1549.
Hanson, G. R. (2002). New vistas in drug abuse preven-tion. NIDAnotes, 16(6), 42–43.
Institute of Public Health Kranj. (2005). 31. maj 2003: svetovni dan brez tobaka. Retrieved 11. 8. 2005 from the World Wide Web: http://www.gov.si/zzvkr/de-javnosti_zdravstvena_vzgoja_zdr_aktivnosti.htm#brez_tobaka
Istvan, J., & Matarazzo, J. D. (1984). Tobacco, alcohol and caffeine use: A review of their interrelationships. Psychological Bulletin, 95, 301–326.
Karpljuk, D., Videmšek, M., & Zajc, M. (2003). Mož-nost povezovanja športnih in zdravstvenih vsebinv osnovni šoli. Ljublana: Univerza v Ljubljani, Fakul-teta za šport.
Koprivnikar, H. (2005). Posledice kajenja in ukrepi za zmanjševanje kajenja. Retrieved 10. 8. 2005 from the World Wide Web: http://www.ivz.si/ivz/aktual-no/novica.php?ivz_id=249
Little, H. J. (2000). Behavioural mechanisms underly-ing the link between smoking and drinking. Alcohol Research & Health, 24(4), 215–224.
Madden, P. A. F., Bucholz, K. K., Martin, N. G., & Heath, A. C. (2000). Smoking and the genetic contribution to alcohol dependence risk. Alcohol Research & Health, 24(4), 209–214.
National Institute on Alcohol Abuse and Alcoholism (2000). Alcohol, the brain, and behaviour: Mecha-nisms of addiction. Alcohol Research & Health 24(1), 12–16.
Razboršek, V., & Krištof, M. (1988). Kaj vem o alko-holizmu in drugih zasvojenostih. Ljubljana: Delav-ska enotnost.
Roberts, A. J., McDonald, J. S., Heyser, C. J., Kieffer, B. L., Matthes, H. W. D., Koob, G. F., & Gold, L. H. (2000). Opioid receptor knockout mice do not self-administer alcohol. Journal of Pharmacology and Experimental Therapeutics, 293(3), 1002–1008.
Rugelj, J. (2000). Pot samouresničevanja. Ljubljana: Sa-mozaložba Slovensko društvo terapevtov za alkoho-lizem, droge, odvisnosti in pomoč ljudem v stiski.
Schofield, J. W. (1981). Complementary and conflicting identities: Images and interaction in an interracial school. In S. R. Asher & J. M. Gottman (Eds.), The development of children’s friendships (pp. 53–90). Cambridge, England: Cambridge University Press.
Stergar, E. (2004). (Ne)kajenje med mladimi je velik problem. Vita: Strokovna zdravstveno vzgojna revija. Retrieved 30. 4. 2005 from the World Wide Web: http://www.revija-vita.com/Vita_43/_Ne_kajenje_med_mladimi_je_vel/_ne_kajenje_med_mladimi_je_vel.html
Videmšek, M., Karpljuk, D., & Debeljak, D. (2000). Sport activities and the smoking habits of the 14 year old male and female. International journal of physical education, 37(1), 29–34.
Videmšek, M., Rešetar, V., Karpljuk, D., Štihec, J., Kondrič, M., & Furjan-Mandić, G. (2002). Smoking habits and sport. In D. Milanović & F. Prot (Eds.), 3rd International scientific conference Kinesiology new perspectives: proceedings book (pp. 175–178). Zagreb: Faculty of kinesiology, University of Zagreb.
Videmšek, M., Skubic, M., Karpljuk, D., & Štihec, J. (2006). Correlation between sport activity and drug taking among 14 year old primary school male and female pupils in Slovenia. Acta Universitatis Palackia-nae Olomucensis. Gymnica, 36(1), 7–14.
World health organization (2002). The world health re-port 2002: Reducing risks, promoting a healthy life.
VZTAH MEZI SPORTOVNÍ AKTIVITOU, KOUŘENÍM A UŽÍVÁNÍM ALKOHOLU
A MARIHUANY U DĚTÍNA ZÁKLADNÍCH ŠKOLÁCH VE SLOVINSKU
(Souhrn anglického textu)
Prevence představuje nejúčinnější prostředek proti užívání drog. Na jedné straně vytváří tělesná aktivita řa-du faktorů, které vedou k přijetí zdravých stravovacích návyků, na druhé straně představuje prevenci užívání

16 Acta Univ. Palacki. Olomuc., Gymn. 2008, vol. 38, no. 1
drog, protože sama o sobě určitým způsobem stimuluje tělo i mysl. Cílem provedeného výzkumu bylo stanovit stupeň obeznámenosti s návykovými látkami a jejich užíváním (například cigarety, alkohol a marihuana) u dětí ve vztahu k frekvenci jejich zapojení do sportov-ních aktivit. Vzorek obsahoval 748 dětí, z čehož bylo 194 žáků a 189 žákyň čtvrtých tříd (jejichž průměrný věk byl 10 let ± 5 měsíců), a 201 žáků a 164 žákyň sed-mých tříd (jejichž průměrný věk byl 13 let ± 4 měsíce). Uvedené údaje byly získány v rámci projektu „Tělesná/sportovní aktivita pro zdraví“ probíhajícího v Ústavu kinesiologického výzkumu ve Vědeckém a výzkumném středisku Primorske univerzity ve slovinském Koperu. Použili jsme dotazník IPAQ (International Physical Ac-tivity Questionnaire), který jsme poněkud upravili pro věk a specifické vlastnosti respondentů. Pro stanovení vztahu mezi nečíselnými proměnnými jsme použili kore-spondenční analýzu. Pro číselné proměnné jsme použili analýzu variance a t-testy nezávislých vzorků. Všechny hypotézy byly ověřovány s 5% statistickou úrovní ri-zika (p = 0,05). Výsledky potvrdily u žáků statisticky významný vztah mezi sportovní aktivitou, kouřením a užíváním alkoholu a marihuany. Faktem je, že i když problém užívání drog nemůže být zcela odstraněn, moh-li bychom ho zásadním způsobem redukovat. Jedním z nejdůležitějších faktorů pro snižování užívání drog je proto rovněž zapojení mládeže do vhodných sportov-ních aktivit (zvláště ve volném čase), což by mělo být řízeno a plánováno rodiči a učiteli.
Klíčová slova: sportovní aktivita, kouření, alkohol, mari-huana, děti.
Veronika L. Kropej, Ph.D.
Education and previous work experienceShe defended her Ph.D. thesis at University of Ljublja-na, Faculty of Sports. Now she works at the Institute for kinesiology research at the Science and research centre of Koper, Slovenia. Her research activities are focused on: kinesiology, environment impact (motor/sport ac-tivity, factors of healthy living) on the child’s holistic (biological, psychological and social) development. First-line publicationsKropej, V. L., & Videmšek, M. (2002). Parents and
sport activity of their preschool children. Kinesiolo-gia Slovenica, 8(1), 19–24.
Kropej, V. L., Škof, B., Milić, R., & Pišot, R. (2005). The factors associated with achievement of VO
2 plateau
in trained boys. Annales Series Historiae Naturalis, 15(1), 137–142.
Kropej, V. L., Škof, B., & Milić, R. (2005). The influence of aerobic and anaerobic characteristics of children of different age on achievement of VO
2 plateau. Bio-
logy of Sport, 22(1), 67–79.Pišot, R., & Kropej, V. L. (2006). Correlation between
percived quality of life and healthy environment in youth. Facta Universitatis. Series, Physical education and Sport, 4(2), 115–123.
Kropej, V. L. (2002). Sport activity of preschool children and family environment. In R. Pišot, V. Štemberger, F. Krpač, & T. Filipčič (Ed.), Otrok v gibanju: Zbornik prispevkov – proceedings (pp. 133–138). Ljubljana: Pedagoška fakulteta.
Pišot, R., & Kropej, V. L. (2005). Relations between physical activity, life style and life quality indices of children and youth. In J. Novotný (Ed.), Sport a kvalita života: sborník článků a abstrakt meziná-rodní konference konané v Brně (pp. 1–16). Brno: Masarykova univerzita.
Kropej, V. L., Pišot, R., & Šimunič, B. (2005). Where do children get information about healthy lifestyle? In D. Milanović & F. Prot (Ed.), 4th International scientific conference on kinesiology (pp. 297–300). Croatia, Zagreb: Faculty of Kinesiology, University of Zagreb.
University of Primorska
Science and researchcentre of Koper
Garibaldijeva 1
6000 Koper
Slovenia

Acta Univ. Palacki. Olomuc., Gymn. 2008, vol. 38, no. 1 17
OVERWEIGHT AND OBESITY TRENDS IN SLOVENIAN BOYS FROM 1991 TO 2006
Marjeta Kovač, Bojan Leskošek, Janko Strel
Faculty of Sport, University of Ljubljana, Ljubljana, Slovenia
Submitted in October, 2007
The study examined a group of overweight and obese Slovenian boys aged seven to eighteen with the use of an annually repeated cross sectional study. The study lasted from 1991 to 2006 and was based on the body mass index according to the IOTF norms. The results show that the proportion of overweight boys in this period increased by 40% (from 13.5% to 18.8%), whereas the proportion of obese boys more than doubled (from 2.8% to 6.1%). The prevalence of overweight and obesity is highest in childhood and early adolescence since it is more than twice as high than at the age of eighteen. Trends and the prevalence of obesity and overweight are similar to those in other countries and in compliance with Slovenia’s geographical position in Europe. In recent years, it has been noticed that the 11 to 13 years age group represents the largest proportion of overweight boys. This is a year earlier than seen with past results; the numbers start to decrease after the age of 13. It is interesting to note that the age category with the biggest propor-tion of overweight boys describes the physically most active population, which is exposed to three hours of physical education per week under the guidance of specialist teachers. In addition, boys of this age most often participate in extracurricular sports activities. This anomaly of the BMI distribution found on the studied population is also charac-teristic of other populations. It can be concluded that excessive weight in this age period is more a result of physical development and less of external conditions; in other words, the reference values of the IOTF for this specific age group are not particularly suitable.
Keywords: Body mass index, overweight, obesity, boys, Slovenia.
INTRODUCTION
The lifestyle of young people at the present time usu-ally consists of passive and unvarying mental activity and unhealthy habits which, among others, alarmingly include a sedentary lifestyle and unsuitable eating hab-its.
Various modern media are changing the behavioural patterns of young people, who enjoy fleeting entertain-ment in multicinema complexes or in front of TV and computer screens. The personal contacts of young peo-ple are being transferred to the virtual world of the in-ternet; their desire for sensations and unusual scenarios is being fulfilled by viewing reality shows. In the study “Health behaviour in school aged children” (HBSC) Slovenian researchers have found that the number of hours young people in Slovenia spend in front of a com-puter has grown enormously in the last five years. In contrast, the time spent with friends has decreased, con-sequently resulting in the reduced communication and social competency of young people (Jeriček, 2007).
It is a common practice for children to go to school after having had a very poor breakfast or without eat-ing one at all; further, fast food and sweet carbonated drinks are often consumed (Blenkuš, 2001). At week-ends many young people enjoy themselves at parties
where alcohol, cigarettes and drugs are nothing unusual (Jurak, 2006).
Unsuitable eating habits and a lack of movement re-sult in overweight and obesity that are reaching epidem-ic proportions in the developed world (James, 2004). Excessive weight is becoming one of the most common diseases of children, according to experts of the World Health Organisation. In 2003, the WHO reported more than 1 billion overweight people globally, with at least 300 million of them being obese (WHO, 2003). Out of this population, 17.6 million were children under the age of five. Over the last decade the prevalence of obesity in western and westernising countries has more than doubled (James, 2004). It is estimated that 400,000 extra children are becoming overweight or obese each year in the population of the new European commu-nity. In Canada, Australia and parts of Europe 1% of all children are becoming overweight each year; 25% of children in the USA are overweight and 11% are obese (Lobstein, Baur, & Uauy, 2004). The WHO data for Europe for 2004 show that in the 13 to 15 year old population 12% of boys and 7% of girls were overweight and 2% of boys and 1% of girls were obese (Andersen, Froberg, Kristensen, & Mǿller, 2007).
About 70% of obese adolescents grow up to become obese adults (Parsons, Power, Logan, & Summerbell,

18 Acta Univ. Palacki. Olomuc., Gymn. 2008, vol. 38, no. 1
1999). Obese children under three years of age without obese parents are at a low risk of obesity in their adult-hood but, among older children, obesity is an increas-ingly important predictor of adult obesity regardless of whether one’s parents are obese (Whitaker, Wright, Pepe, Seidel, & Dietz, 1997).
There are several consequences of obesity. Along with increased mortality, obesity is a risk factor for a range of chronic diseases such as Type 2 (adult on-set) diabetes, coronary heart disease, some types of can-cer, osteoarthritis and back pain (Andersen, Froberg, Kristensen, & Mǿller, 2007). Some childhood obesity consequences – hyperinsulinaemia, poor glucose toler-ance and a raised risk of Type 2 diabetes, hypertension, sleep apnoea, social exclusion and depression – onset already in childhood, while other obesity epidemic dis-eases emerge in adulthood (Lobstein, Baur, & Uauy, 2004).
There are also social and psychological conse-quences – including stigmatisation, discrimination and prejudice. Researches have linked obesity with a low self image, low self confidence and depression (Cash, 2002; Goni & Zulaka, 2000; Lobstein, Baur, & Uauy, 2004).
The mechanism of obesity development is not fully understood and is believed to be a disorder with multi-ple causes. Genetic factors influence the susceptibility of a given child to an obesity conducive environment. However, environmental factors, lifestyle preferences and the cultural environment seem to play big roles in the rising prevalence of obesity worldwide. It is con-firmed that obesity occurs when energy intake exceeds energy expenditure, suggesting a proper diet and physi-cal activity are the key strategy for controlling the cur-rent epidemic of obesity (Dehghan, Akhtar-Danesh, & Merchant, 2005).
There is a wide variety of definitions of child obesity and no commonly accepted standard has yet emerged. Although less sensitive than skin fold thickness, the body mass index (weight/height2) is widely used in adult popu-lations and a cut off point of 25 kg/m2 and 30 kg/m2 is recognised internationally as a definition of adult over-weight and obesity (Malina & Katzmarzyk, 1999). The International Obesity Task Force (IOTF) proposed age and sex specific cut off points from 2–18 years which are internationally based and should help provide inter-nationally comparable prevalence rates of overweight and obesity in children (Cole, Bellizzi, Flegal, & Dietz, 2000).
A number of studies on the prevalence of obes-ity in European children and adolescents in different years after 1990 was reviewed by Lobstein, Baur and Uauy (2004) and Brettschneider and Naul (2004). The prevalence (percentage) of overweight (including obese) children aged around 7–11 years using the IOTF cut off points was especially high in southern Europe (Italy 36%, Spain 34%, Greece 31%), and substantially lower in
northern Europe (Holland 12%, Denmark 15%, Germa-ny 16%). Among adolescents aged around 14–17 years, the prevalence ranged from below 10% (Slovakia, Czech Republic, Russia) to above 20% in some southern coun-tries (Cyprus 23%, Greece 22%, Spain 21%). There are differences between boys and girls, e. g. in Great Britain the prevalence of excessive weight and obesity in 5 to 10 year olds from 1984 to 2002–2003 is much higher in girls (Stomatakis et al., 2005), whereas the WHO data (Andersen, Froberg, Kristensen, & Mǿller, 2007) show that the proportion of 13 to 15 year old overweight boys is significantly larger than that of their girl coun-terparts in all but one country. Similarly, the proportion of obese boys is larger than that of girls in the majority of countries. The biggest differences between genders are noticed in Mediterranean countries such as Spain, Italy, Portugal, Greece and Malta. With adults, the pro-portion of overweight European women (with a BMI above 30) is between 10 to 25% which is slightly more than the proportion of overweight men (10 to 20%) (An-dersen, Froberg, Kristensen, & Mǿller, 2007). Authors also warn about the poor effect of interventional actions designed to reduce excessive weight in adults; therefore, it is even more important for countries to establish ef-ficient strategies for decreasing the excessive weight of young people.
For Slovenia, according to the IOTF cut off points, the prevalence of excessive weight among five year old children in 2004 was 12.5% and 16.7% for boys and girls, respectively. The obesity criteria are fulfilled by 4.1% of boys and 4.7% of girls. Among adolescents, be-tween the years 2003–2005, 18.9% of boys and 16.7% of girls were overweight and 3.5% of boys and 3.4% of girls were obese (Avbelj et al., 2005). The percentage of 7 to 19 year old overweight and obese girls and boys, as shown in cross sectional (Bučar-Pajek, Strel, Kovač, & Pajek, 2004; Strel, Kovač, & Jurak, 2007) and lon-gitudinal studies of children and youth (Strel, Kovač, & Rogelj, 2006), jumped up dramatically from 1983 to 2003, especially in younger age groups.
The present study used data from the fitness evalua-tion system Sports Educational Chart, which has been carried out in all Slovenian schools annually since 1991 (Strel et al., 1997). Because of the huge amount of da-ta only the results for boys are analysed and presented in this article. The data regarding girls is available upon request to interested readers by directly contacting the authors of this article.
METHODOLOGY
Sample of measured subjectsThe sample (TABLE 1) consists of all boys who par-
ticipated in measurements as part of the fitness evalu-ation system Sport Educational Chart (Strel, Kovač,

Acta Univ. Palacki. Olomuc., Gymn. 2008, vol. 38, no. 1 19
& Rogelj, 2006; Strel et al., 1997; Šturm et al., 1990) from 1991 to 2006. Measurements were held annually in April during the usual physical education lessons in all Slovenian schools. Only healthy boys who were not exempt from physical education for health reasons and whose parents had given their written consent to par-ticipate in the measurements were included.
Slightly more than 90% of primary school boys below the age of 15 were measured, whereas the proportion of older boys (16 to 19 years) is between 60–84%, depend-ing on the type of high school (Strel, Kovač, & Rogelj, 2006). High school education is not compulsory in Slov-enia; nevertheless, the number of those attending high schools is growing every year and has in the last decade included more than 90% of all young people. In addi-tion, the proportion of young people entering four year high school programmes has also been increasing and those entering two and three year programmes decreas-ing, thus providing more data about the 17 and 18 year old population.
In the first year of school (seven year old children) an apparent increase in the number of boys is noted be-tween the years 2000 and 2004. In that period, a gradual transition to the then new nine year long compulsory education started in Slovenia, which meant that children entered schools earlier. The transition to nine year long compulsory education was gradual so that between 2000 and 2005, six and seven year old pupils were entering their first year of primary school. A smaller number of boys is noticed in other years as a result of the birth rate having decreased by more than a third (Statistical office of the Republic of Slovenia, 2006).
Data analysisData were analysed with the use of the SPSS 15.0
statistical package. The prevalence of excessive weight (excluding obesity) and obesity as such were determined according to the IOTF cut off points (Cole et al., 2000) separately for age (7 to 18 year old boys, ±6 months) and the year of measurement (1991 to 2006). Confidence intervals for the proportions were computed using the Collett formula (Collett, 1991).
RESULTS
The prevalence of overweight and obesity in 7 to 18 year old boys from 1991 to 2006 is shown in TA-BLE 2 and 3. A 95% confidence interval width for the overweight proportion ranges from 1.1% to 3.2%, but is only wider than 2% for seven year old boys. A 95% con-fidence interval width for the obese proportion ranges from 1.1% to 3.2% and rarely exceeds 1.5%. The confi-dence interval width for the proportion of overweight and obese boys is never higher than 20.6% and 37.8%, respectively, of its point estimate. As the sample used in this study is not a probability sample, the listed con-fidence intervals should only be considered for descrip-tive purposes.
When the entire sample is considered irrespective of the age of boys, the proportions of overweight and obese boys are almost steadily growing from 1991 to 2006. In the observed period the percentage of obese boys more than doubled – from 2.8% in 1991 to 6.1% in 2006,
TABLE 1Sample sizes by age of boys and year of measurement
YearAge
7 8 9 10 11 12 13 14 15 16 17 181991 2867 11886 12647 13053 13298 13921 13691 13168 12391 9850 8564 65331992 2706 11888 12197 12799 13353 13797 14006 13739 12718 11187 10034 77631993 2653 11955 12096 12356 13048 13685 13880 13986 13420 11403 10833 83481994 2814 11364 12315 12326 12626 13455 13792 13803 13782 12229 11102 93631995 2792 11541 11365 12280 12300 12753 13383 13591 13254 11908 11320 91801996 2608 12049 11909 11593 12567 12602 12820 13323 13026 10596 10644 91791997 2295 10724 11813 11497 11276 12209 11994 12100 11547 8710 8600 74861998 2267 10200 10878 11808 11632 11327 12163 11838 11331 9392 8709 77051999 2113 10150 10378 10944 11945 11696 11305 11934 11112 8982 8361 73022000 2655 9247 10335 10478 11083 12007 11576 11143 11198 9078 8535 75632001 3216 9365 9409 10276 10414 10955 11741 11257 10394 9038 8418 73472002 4284 8897 9445 9453 10287 10413 10865 11537 10534 8167 8137 72792003 5688 9022 9018 9495 9510 10377 10349 10820 10917 8592 7692 72402004 8642 8935 9111 9026 9502 9492 10287 10320 10209 8957 8288 68952005 8391 8814 8989 9160 9135 9619 9481 10296 9695 8184 8159 71922006 8142 8329 8667 8789 8982 8918 9370 9247 9174 6525 7062 6715

20 Acta Univ. Palacki. Olomuc., Gymn. 2008, vol. 38, no. 1
TABLE 2Prevalence of overweight (excluding obesity) in Slovenian boys (in %) from 1991 to 2006
YearAge
7 8 9 10 11 12 13 14 15 16 17 181991 12.0 12.4 12.7 13.6 14.0 14.0 13.7 13.3 13.1 14.6 13.7 14.01992 10.9 11.4 12.2 12.4 13.2 13.1 12.3 11.7 11.3 12.6 12.6 11.41993 11.5 12.1 13.8 14.0 14.4 15.1 14.5 13.0 12.5 13.4 13.8 12.61994 12.1 11.9 13.5 15.3 15.5 15.6 15.3 13.9 13.7 14.3 13.8 13.51995 13.0 12.9 13.9 14.9 15.8 16.3 15.2 14.5 13.4 14.6 14.4 12.81996 12.5 13.1 14.6 14.9 16.0 16.8 16.0 14.4 14.5 15.5 14.9 14.01997 12.7 13.3 14.7 15.5 15.5 16.1 15.6 14.9 13.7 15.6 14.4 13.91998 13.0 13.9 15.6 15.6 16.7 16.6 15.9 15.1 14.8 15.1 15.3 14.51999 12.9 13.0 15.6 17.2 16.6 17.5 16.5 15.0 14.9 15.1 14.5 14.72000 12.4 14.4 16.2 17.4 18.4 17.3 17.7 16.0 15.1 15.8 15.5 14.12001 13.4 14.3 16.5 18.0 19.0 18.7 17.7 17.3 15.5 15.8 15.5 15.42002 12.3 14.1 16.1 17.5 17.8 19.1 18.2 16.6 16.1 15.8 14.9 14.42003 11.1 14.3 16.5 17.3 18.8 18.6 18.1 16.9 15.7 15.6 15.5 14.92004 12.5 14.9 17.8 19.0 19.5 19.4 19.2 17.8 17.0 17.7 16.5 16.52005 12.5 14.8 17.9 19.2 19.6 20.8 19.7 18.2 17.3 18.5 18.5 16.92006 13.4 15.8 18.3 19.7 21.0 21.1 20.7 19.5 18.6 19.5 19.2 18.6
TABLE 3Prevalence of obesity in Slovenian boys (in %) from 1991 to 2006
YearAge
7 8 9 10 11 12 13 14 15 16 17 181991 3.7 3.6 3.6 3.2 3.1 3.0 2.8 2.2 2.2 2.2 2.0 1.21992 3.3 3.2 3.0 2.7 2.7 2.5 2.4 2.0 1.9 1.6 1.5 1.11993 4.0 4.1 3.6 3.6 3.2 3.2 2.8 2.5 2.1 2.1 1.6 1.21994 4.2 4.4 4.2 3.9 3.7 3.6 3.4 2.8 2.4 2.2 1.9 1.31995 3.7 4.5 4.6 4.3 4.0 3.9 3.5 3.4 2.8 2.8 1.9 1.81996 5.9 4.9 5.0 4.6 4.5 4.0 4.0 3.3 3.2 3.0 2.1 1.91997 5.0 5.5 4.6 4.6 4.1 4.1 3.7 3.4 2.8 3.1 2.6 1.71998 5.4 5.7 5.5 4.8 4.8 4.3 4.2 3.3 3.2 3.2 2.8 1.81999 4.6 5.5 6.1 5.5 5.0 4.7 4.2 3.8 3.2 3.7 2.7 2.12000 6.5 5.2 5.4 5.4 5.6 5.1 4.5 3.9 3.5 3.5 3.1 2.12001 6.7 6.5 6.0 5.6 5.6 5.7 4.9 4.5 3.8 3.9 3.0 2.62002 5.7 6.5 6.2 5.4 5.3 5.4 5.1 4.1 4.0 3.8 3.3 2.22003 5.6 6.0 6.2 5.7 5.0 4.9 5.0 4.3 4.0 3.8 3.2 2.22004 5.4 5.9 6.5 6.1 6.1 5.7 5.0 5.0 4.4 4.1 3.3 2.52005 6.6 7.0 6.4 6.9 6.9 6.8 5.9 5.1 4.8 4.9 3.7 2.92006 6.7 7.3 7.6 6.9 7.1 7.1 6.9 5.5 4.9 5.0 4.5 2.9
whereas the percentage of overweight (excluding obese) boys grew from 13.5% in 1991 to 18.8% in 2006.
Although the overall prevalence of overweight and obese boys was continuously growing from 1991 to 2006, the pattern of changes (Fig. 1 and 2) remained almost the same. The percentage of overweight children has the highest values between the ages of 11 and 13
and then steadily decreases until the age of 15. At the age of 16 it slightly increases again and then gradually decreases until the age of 18, whereas the percentage of obese children only increases from the age of seven to nine and until the age of 18 it decreases to less than half of its maximal value.

Acta Univ. Palacki. Olomuc., Gymn. 2008, vol. 38, no. 1 21
Fig. 1Proportion of overweight and obese boys in Slovenia from 1991 to 2006
0%
2%
4%
6%
8%
10%
12%
14%
16%
18%
20%
1991 1992 1993 1994 1995 1996 1997 1998 1999 2000 2001 2002 2003 2004 2005 2006
overweight obese
Fig. 2Proportion of overweight boys at different ages in Slovenia from 1991 to 2006
0%
5%
10%
15%
20%
25%
7 8 9 10 11 12 13 14 15 16 17 18age (years)1991 1996 2001 2006
22 Acta Univ. Palacki. Olomuc., Gymn. 2008, vol. 38, no. 1
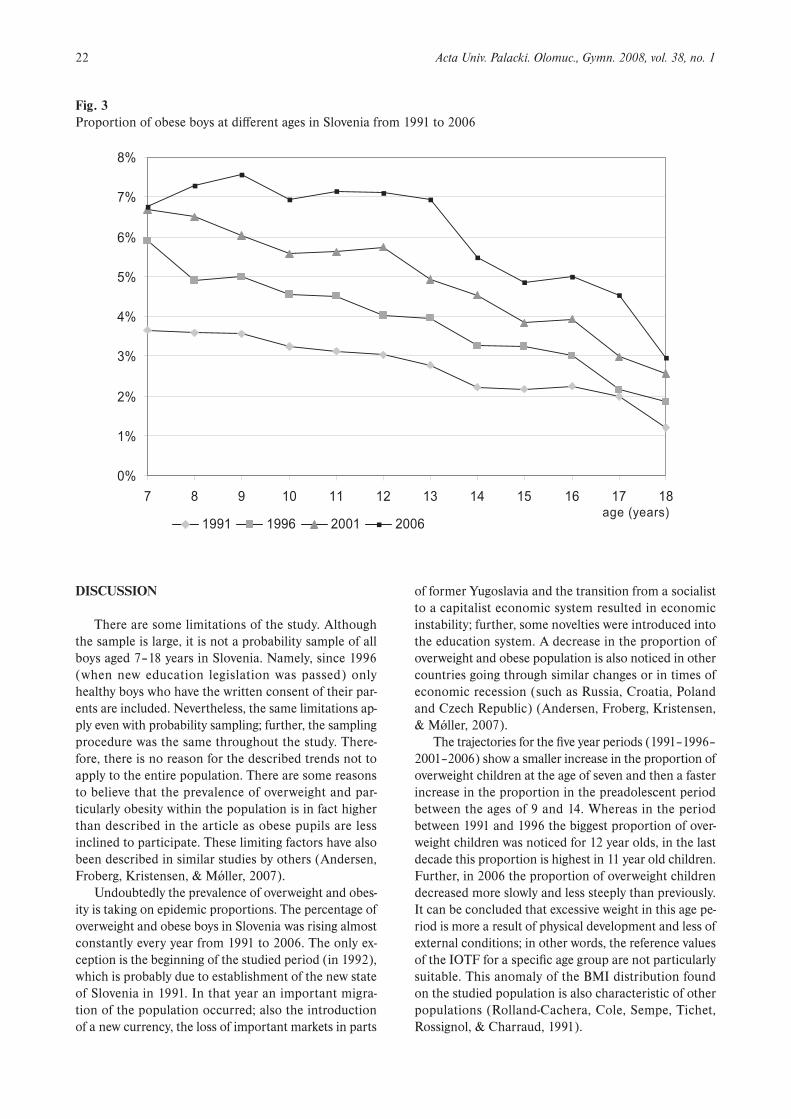
Fig. 3 Proportion of obese boys at different ages in Slovenia from 1991 to 2006
0%
1%
2%
3%
4%
5%
6%
7%
8%
7 8 9 10 11 12 13 14 15 16 17 18age (years)
1991 1996 2001 2006
DISCUSSION
There are some limitations of the study. Although the sample is large, it is not a probability sample of all boys aged 7–18 years in Slovenia. Namely, since 1996 (when new education legislation was passed) only healthy boys who have the written consent of their par-ents are included. Nevertheless, the same limitations ap-ply even with probability sampling; further, the sampling procedure was the same throughout the study. There-fore, there is no reason for the described trends not to apply to the entire population. There are some reasons to believe that the prevalence of overweight and par-ticularly obesity within the population is in fact higher than described in the article as obese pupils are less inclined to participate. These limiting factors have also been described in similar studies by others (Andersen, Froberg, Kristensen, & Mǿller, 2007).
Undoubtedly the prevalence of overweight and obes-ity is taking on epidemic proportions. The percentage of overweight and obese boys in Slovenia was rising almost constantly every year from 1991 to 2006. The only ex-ception is the beginning of the studied period (in 1992), which is probably due to establishment of the new state of Slovenia in 1991. In that year an important migra-tion of the population occurred; also the introduction of a new currency, the loss of important markets in parts
of former Yugoslavia and the transition from a socialist to a capitalist economic system resulted in economic instability; further, some novelties were introduced into the education system. A decrease in the proportion of overweight and obese population is also noticed in other countries going through similar changes or in times of economic recession (such as Russia, Croatia, Poland and Czech Republic) (Andersen, Froberg, Kristensen, & Mǿller, 2007).
The trajectories for the five year periods (1991–1996–2001–2006) show a smaller increase in the proportion of overweight children at the age of seven and then a faster increase in the proportion in the preadolescent period between the ages of 9 and 14. Whereas in the period between 1991 and 1996 the biggest proportion of over-weight children was noticed for 12 year olds, in the last decade this proportion is highest in 11 year old children. Further, in 2006 the proportion of overweight children decreased more slowly and less steeply than previously. It can be concluded that excessive weight in this age pe-riod is more a result of physical development and less of external conditions; in other words, the reference values of the IOTF for a specific age group are not particularly suitable. This anomaly of the BMI distribution found on the studied population is also characteristic of other populations (Rolland-Cachera, Cole, Sempe, Tichet, Rossignol, & Charraud, 1991).

Acta Univ. Palacki. Olomuc., Gymn. 2008, vol. 38, no. 1 23
Also worrying is the status of the population older than 15 years; namely, in 2006 a considerable increase in the proportion of overweight young people was no-ticed in comparison to previous periods.
Obesity is rising at higher rates than excessive weight as it has more than doubled in just 15 years. The propor-tion of overweight boys increases between the ages of 7 and 13 and then gradually decreases until the age of 18. The proportion of the obese population has been decreasing from around 7 year old to 18 year old boys, with an exception in 2006 where an increase was shown from the ages 7 to 9, followed by a first dip at the age of 10 and a partial stagnation until the age of 13; after-wards the decrease until the age of 18 is slightly larger than in other periods.
It should be mentioned that the proportion of the measured population is slightly lower in high schools compared to primary school and that it also depends on the type of school involved. In gymnasium programmes it included over 85% of the population, whereas in vo-cational schools this value stands at around 60% (Strel, Kovač, & Rogelj, 2006). Particularly vocational schools show a larger proportion of overweight and obese boys (Brettschneider & Naul, 2004; Kovač, Strel, & Leskošek, 2007; Kristensen, Wedderkopp, Mǿller et al., 2006) as these boys come from families with a lower social sta-tus and it can be presumed that the actual proportion of young people with excessive weight is higher than shown.
The age period between 11 and 18 years is marked in the Slovenian education system by the introduction of specialised physical education teachers; the results of motor tests significantly improve (Strel et al., 2003) due to the better working conditions of this age group (a smaller number of children in a group, lessons carried out in sports halls and other specialised places – dance and fitness studios, etc.) and sports teachers’ better knowledge about systematic work and the selection of suitable contents and work loading. It is surprising to notice that the proportion of children with excessive weight is highest particularly in the period between the ages of 11 and 13, when young people have the best conditions available for sports activities in schools and still show an interest in free time sports participation in sports clubs. It can be concluded that the excessive weight seen in this period is connected with the transi-tion to puberty, where an accelerated increase of height is still not noticed although the body mass is already increasing (Strel, Kovač, & Rogelj, 2006).
The prevalence of overweight and obesity, its secu-lar trends and pattern of changes from childhood to adolescence in Slovenia are similar to those in many other countries in Europe and the rest of the world. Although the data are not directly comparable with recent studies in other European countries reviewed
by Lobstein and Frelut (2003) due to methodological and other differences, it seems that the prevalence of overweight children in Slovenia is in conformity with the country’s geographical position in Europe. As an example, in 2000 the prevalence of overweight (includ-ing obese) 7–9 year old boys in Slovenia was 20.4%, while the prevalence of overweight children (Lobstein & Frelut, 2003 – did not report the results separately for boys and girls) of the same age and in a similar pe-riod (most studies were carried out in 1997–2001) were around 30–35% in Mediterranean countries and around 20% in other countries. With 14 to 17 year old boys, the equivalent prevalence in Slovenia was 19.1%, while in Europe it ranged from 8–23%.
The increase in the proportion of both (overweight and obese) groups in developed countries is a result of the different ways young people spend their free time; their characteristics are mainly motor inactivity and in-correct diets (energy rich food and unsuitable eating habits). The way young people spend their free time has changed in recent years. Most studies show that the volume of free time physical activities gradually de-creases with age (Brettschneider & Naul, 2004; Jurak et al., 2003; Riddoch et al., 2004). A review of several European studies (Currie et al., 2004; Engström, 2002) shows that physical activity significantly decreases with age – 3% per annum for boys. Data from the HBSC re-search for Slovenian boys show that only every second Slovenian boy is moderately to intensively active at the age of 11; the information is also valid for 41% of 13 year olds and every third 15 year old boy (Stergar, Scagnetti, & Pucelj, 2006). These results indicate that the physical activity of Slovenian boys is above the average of other countries included in the HBSC study, nevertheless, it is far from satisfactory as it has been noticed that in recent years the proportion of the physically active population has been shrinking (Jurak, 2006; Jeriček, 2007).
Unfortunately it has been noted (Gabrijelčič Blen-kuš, 2001; Stergar, Scagnetti, & Pucel, 2006) that the number of overweight and obese boys in the period of adolescence is also a result of unhealthy eating habits. In the Slovenian part of the HBSC study the authors state that 8% of boys were found to follow some kind of diet; at the same time only 64% of boys were happy with their body weight (Stergar, Scagnetti, & Pucel, 2006). The proportion of people who think of themselves as overweight is also increasing among boys. Although they did not follow any diet, 20% of boys (and 33% of girls) were convinced that they needed to lose weight.
With young people and particularly with boys, a “shallow” approach to nutrition is being noticed in-stead of enjoying healthy meals (Stergar, Scagnetti, & Pucel, 2006). Presumably, this is a result of the easier access to various snacks (Drummond, Crombie, & Kirk, 1996). Gabrijelčič Blenkuš (2001) found that pupils in

24 Acta Univ. Palacki. Olomuc., Gymn. 2008, vol. 38, no. 1
Ljubljana eat irregularly (leaving out breakfast and din-ner) and do not have regular eating patterns. Particularly exposed are pupils from vocational schools whose meals are also of the poorest quality. According to the HBSC data 42% of boys always eat breakfast, on the other hand 30% of boys never have breakfast at all. From year 5 of primary school to year 1 of high school the proportion of boys having breakfast decreases by 7.5%. Boys more often than girls have at least three meals a day, how-ever, the quality of their meals is poorer as they do not eat enough fruit and vegetables and consume too many sweet drinks (Stergar, Scagnetti, & Pucel, 2006).
The health consequences of excessive weight during childhood are less clear but a systematic review shows that childhood obesity is strongly associated with risk factors of cardiovascular disease (CVD) and diabetes, orthopaedic problems and mental disorders (Andersen, Froberg, Kristensen, & Mǿller, 2007; Dietz, 1998). The number of children with health problems is also on the rise in Slovenia, particularly among the youngest chil-dren (Brcar, 2005). An increased tendency has been noted for diseases of the muscular-skeletal system and mental and behavioural disorders.
An unhealthy lifestyle in the adult population is an-other reason for the increase in the proportion of men dying from cardiovascular diseases. This is also one of the reasons why Slovenian men have a significantly low-er life expectancy (68.9 years) than women (77.8 years) (Statistical office of the Republic of Slovenia, 2006).
CONCLUSION
Clearly the prevalence of overweight and obesity is also taking on epidemic proportions in Slovenia (Bučar Pajek, Strel, Kovač, & Pajek, 2004; Strel, Kovač, & Ju-rak, 2007). The percentage of overweight and obese boys in Slovenia rose almost constantly every year from 1991 to 2006, with the only real exception at the beginning of the period (in 1992). Obesity is growing at higher rates than overweight, as it has more than doubled in just 15 years.
The proportion of overweight boys is increasing nearly constantly between the ages of 7 and 18, whereas the proportion of obese boys decreases with age. It is interesting to notice the biggest increase in the 15 year period was noted for boys aged 10 to 13 as this period is marked with specialised PE teachers and the best available conditions in schools, as well as the largest participation in extracurricular sports programmes. The results for the high school population are slightly better; nevertheless, the proportion of overweight and obese boys is twice as high as in girls (Strel, Kovač, & Jurak, 2007).
Warnings about these negative trends have already been issued for a longer period; unfortunately the gov-ernment does not listen to health and sports experts. Particularly in the last two years a reduction in the hours for physical education lessons has occurred in high school programmes (Kovač, 2006), with this being one of the biggest mistakes of educational policy makers. Therefore, sports pedagogues and health workers are calling for an increase and not a decrease in the number of physical education lessons and improved access to free extracurricular sports programmes; however, it is also vital that parents ensure healthy eating habits and limit children’s time spent in front of TV and computer screens.
REFERENCES
Andersen, L. B., Froberg, K., Kristensen P. L., & Mǿl-ler, N. C. (2007). Physical activity and physical fit-ness in relation to cardiovascular disease in children. In W. B. Brettschneider & R. Naul (Eds.), Obesity in Europe: Young people’s physical activity and seden-tary lifestyles (pp. 57–100). Frankfurt am Main: Peter Lang.
Avbelj, M., Saje-Hribar, N., Seher-Zupančič, M., Brcar, P., Kotnik, P., Iršič, A., Bratanič, N., Kržišnik, C., & Bat-telino, T. (2005). Overweight and obesity prevalence among 5 year old children and 15 to 16 year old ado-lescents in Slovenia. Zdravstveni vestnik, 74, 753–759.
Brcar, P. (2005). Health of children and youth of both genders. In A. Črnak-Meglič (Ed.), Otroci in mla-dina v prehodni družbi: Analiza položaja v Sloveniji. Maribor: Ministrstvo za šolstvo in šport, Urad Repu-blike Slovenije za mladino. Retrieved 4. 9. 2007 from World Wide Web: http://www.ivz.si/javne_datote-ke/datoteke/856-ZdravjecotrokCcmadostniccincm-ladostnikovcPOLONAcBRCARcmarecc2006.doc
Brettschneider, W. B., & Naul, R. (2004). Study on young people’s lifestyle and sedentariness and the role of sport in the context of education and as a means of restoring the balance. Paderborn: University of Paderborn and Council of Europe.
Bučar-Pajek M., Strel, J., Kovač, M., & Pajek, J. (2004). Expansion of the prevalence of overweight and obese schoolchildren, aged 7 to 10: A new epidemic risk factor? In R. Pišot, V. Štemberger, J. Zurc, & A. Obid (Eds.), Abstracts and proceedings of 3rd International symposium Child in Motion. Koper: Univerza na Pri-morskem & Znanstveno raziskovalno središče.
Cash, T. F. (2002). Cognitive behavioral perspectives on body image. In T. F. Cash & T. Pruzinsky (Eds.), Body images: A handbook of theory, research and clini-cal practice (38–46). New York, London: Guilford Press.

Acta Univ. Palacki. Olomuc., Gymn. 2008, vol. 38, no. 1 25
Cole, T. J., Bellizzi, M. C., Flegal, K. M., & Dietz, W. H. (2000). Establishing a standard definition for child overweight and obesity worldwide: International sur-vey. British Medical Journal, 320, 1240–243.
Collett, D. (1991). Modelling binary data. London: Chapman and Hall.
Currie, C., Roberts, C., Morgan, A., Smith, R., Setterto-bulte, W., Samdal, O. et al. (2004). Young people’s health in context: Health behaviour in school aged children (HBSC) study – international report from the 2001/2002 survey. Health Policy for Children and Adolescents, 4. Copenhagen: World Health Organiza-tion regional office for Europe.
Dehghan, M., Akhtar-Danesh, N., & Merchant, A. T. (2005). Childhood obesity, prevalence and preven-tion. Nutrition Journal, 4, 24.
Dietz, W. H. (1998). Health consequences of obesity in youth: Childhood predictors of adult disease. Paedi-atrics, 101, 518–525.
Drummond, S., Crombie, N., & Kirk, T. (1996). A cri-tique of the effects of snacking on body weight status. European Journal of Clinical Nutrition, 50, 779–783.
Gabrijelčič Blenkuš, M. (2001). Some eating habits of high school pupils in Ljubljana with a stress on the difference between genders. Zdravstveno varstvo, 40, 135–143.
Goni, A., & Zulaka, L. (2000). Relationship between physical education classes and the enhancement of fifth grade pupils’ self concept. Perceptual and motor skills, 91, 246–250.
James, P. T. (2004). Obesity: The worldwide epidemic. Clinics in Dermatology, 22(4), 276–80.
Jeriček, M. (2007). Presentation of the results of the study Health related behaviour in the academic year 2006. Ljubljana: Inštitut za varovanje zdravja RS, Center za promocijo zdravja.
Jurak, G. (2006). Sports vs. the cigarettes & coffee life-style of Slovenian high school students. Anthropologi-cal Notebooks 12(2), 79–95.
Jurak, G., Kovač, M., Strel, J., Majerič, M., Starc, G., Filipčič, T. et al. (2003). Sports activities of Slovenian children and young people during their summer holi-days. Ljubljana: University of Ljubljana, Faculty of Sport.
Kovač, M. (2006). When social becomes biological: The effect of different physical education curricula on the motor and physical development of high school girls. Anthropological Notebooks, 12(2), 97–112.
Kovač, M., Strel, J., & Leskošek, B. (2007). Morpho-logical characteristics and motor abilities of boys following different secondary school programmes. Kinesiology, 39(1), 62–73.
Kristensen, P. L., Wedderkopp, N., Mǿller N. C., An-dersen, L. B., Bai, C. N., & Froberg, K. (2006).
Tracking and prevalence of cardiovascular disease risk factors across socio-economic classes: A longi-tudinal sub study of the European youth heart study. Public Health, 6, 20.
Lobstein, T., Baur, L., & Uauy, R. (2004). Obesity in children and young people: A crisis in public health. Obesity Reviews 5(1), 1–104.
Lobstein, T., & Frelut. M. L. (2003). Prevalence of over-weight among children in Europe. Obesity Reviews 4(4), 195–200.
Malina, R. M., & Katzmarzyk, P. T. (1999). Validity of the body mass index as an indicator of the risk and presence of overweight in adolescents. American Journal of Clinical Nutrition, 70, 131–116.
Parsons, T. J., Power, C., Logan, S., & Summerbell, C. D. (1999). Childhood predictors of adult obesity: A sys-tematic review. International Journal of Obesity, 23, 1–107.
Riddoch, C. J., Andersen, L. B., Wedderkopp, N., Har-ro, M., Klasson-Heggebo, L., Sardinha, L. B. et al. (2004). Physical activity levels and patterns of 9 and 15 year old European children. Medicine & Science in Sports & Exercise, 36, 86–92.
Rolland-Cachera, M. F., Cole, T. J., Sempe, M., Tichet, J., Rossignol, C., & Charraud, A. (1991). Body mass index variations: Centiles from birth to 87 years. Eu-ropean Journal of Clinical Nutrition 45, 13–21.
Stergar, E., Scagnetti, N., & Pucelj, V. (2006). Health related behaviour. Ljubljana: Inštitut za varovanje zdravja.
Stomatakis, E., Primatesta, P., Chinn, S., Rona, R., & Falascheti, E. (2005). Overweight and obesity trends from 1974 to 2003 in English children: What is the role of socio-economic factors? Archives of Dis-ease in Childhood, 90, 999–1004.
Strel, J., Ambrožič, F., Kondrič, M., Kovač, M., Lesko-šek, B., Štihec, J., & Šturm, J. (1997). Sports educa-tional chart. Ljubljana: Ministry of Education and Sport.
Strel, J., Kovač, M., & Jurak, G. (2007). Physical and motor development, sport activities and lifestyles of Slovenian children and youth – changes in the last few decades. In W. D. Brettschneider & R. Naul (Eds.), Obesity in Europe: Young people’s physical ac-tivity and sedentary lifestyles (pp. 243–264). Frank-furt am Main: Peter Lang.
Strel, J., Kovač, M., Jurak, G., Bednarik, J., Leskošek, B., Starc, G., Majerič, M., & Filipčič, T. (2003). Certain morphological, motor, functional and health parameters of children and youth in Slovenia in the period 1990 to 2000. Ljubljana: Fakulteta za šport, Inštitut za kineziologijo.
Strel, J., Kovač, M., & Rogelj, A. (2006). Data collection sports education chart – report for the academic year 2005/2006 and some comparisons with the academic year 2004/2005. Ljubljana: Fakulteta za šport.

26 Acta Univ. Palacki. Olomuc., Gymn. 2008, vol. 38, no. 1
Šturm, J., Strel, J., Ambrožič, F., Leskošek, B., Strojnik, V., & Krpač, F. (1990). An information system for evalu-ation of motor abilities and morphological character-istics of the youth in the Republic of Slovenia. Teorie a praxe tělesné výchovy, 38(7), 431–437.
Whitaker, R. C, Wright, J. A., Pepe, M. S., Seidel, K. D., & Dietz, W. H. (1997). Predicting obesity in young adulthood from childhood and parental obesity. New England Journal of Medicine, 337, 869–873.
WHO. Obesity and overweight. Retrieved 11. 7. 2007 from World Wide Web: http://www.who.int/hpr/NPH/docs/gs_obesity.pdf
Statistical office of the Republic of Slovenia (2006). Sta-tistične informacije – Rapid reports No. 188. Prebival-stvo – Population (21. 11. 2006). Ljubljana: Statistični urad Republike Slovenije. Retrieved 11. 9. 2007 from World Wide Web: http://www.stat.si/doc/statinf/05-si-021-0602.pdf
TENDENCE K NADVÁZE A OBEZITĚU SLOVINSKÝCH CHLAPCŮ
V LETECH 1991–2006(Souhrn anglického textu)
Studie zkoumala skupinu slovinských chlapců ve věku od sedmi do osmnácti let trpících nadváhou nebo obezitou, a to s použitím každoročně opakovaného prů-řezového výzkumu. Výzkum, probíhající od roku 1991 do roku 2006, byl založen na měření indexu tělesné hmotnosti podle norem Mezinárodní asociace pro studi-um obezity (IOTF). Výsledky ukazují, že podíl chlapců s nadváhou v tomto období vzrostl o 40 % (ze 13,5 % na 18,8 %), přičemž podíl obézních chlapců se více než zdvojnásobil (ze 2,8 % na 6,1 %). Rozšíření nadváhy a obezity je nejvyšší v dětství a rané adolescenci, kdy je více než dvojnásobné v porovnání s věkem osmnácti let. Trendy a prevalence obezity a nadváhy jsou podobné jako v ostatních zemích a odpovídají zeměpisné poloze Slovinska v Evropě. V posledních letech bylo zazname-náno, že nejvyšší počet chlapců s nadváhou patří do vě-
kové skupiny 11 až 13 let. Věk se v porovnání s výsledky z minulosti snížil o jeden rok. Počet začíná klesat po 13. roku. Zajímavé je, že věková kategorie s nejvyšším výskytem chlapců s nadváhou zahrnuje rovněž fyzicky nejaktivnější populaci, která má tři hodiny tělesné vý-chovy týdně pod vedením specializovaných pedagogů. Kromě toho se chlapci v tomto věku velice často účastní mimoškolních sportovních aktivit. Tato anomálie v dis-tribuci BMI, kterou jsme u zkoumané populace konsta-tovali, je charakteristická také pro jiné populace. Lze tedy učinit závěr, že nadměrná váha v tomto období je spíše výsledkem tělesného vývoje než vnějších podmí-nek. Jinými slovy, referenční hodnoty IOTF nejsou pro tuto konkrétní věkovou skupinu zcela vhodné.
Klíčová slova: index tělesné hmotnosti BMI, nadváha, obe-zita, chlapci, Slovinsko.
Ass. prof. Marjeta Kovač, Ph.D.
Education and previous work experienceGraduated from physical education, worked in primary and secondary school, member of Department of Sport Didactics at the Faculty of Sport in Ljubljana.Scientific orientationMostly interested in problems of physical development, children and youth lifestyles and assessment of physi-cal education. Co-author of all Slovenian curricula for physical education.First-line publicationsAuthor of about 60 scientific articles and books.
University of Ljubljana
Faculty of Sport
Gortanova 22
10000 Ljubljana
Slovenia

Acta Univ. Palacki. Olomuc., Gymn. 2008, vol. 38, no. 1 27
POSTURE ANALYSIS USING POSITION DETECTOR DTP2 IN SENESCENT WOMEN AFTER THE APPLICATION OF A TARGETED EXERCISE PROGRAM
Jarmila Riegerová, Jakub Krejčí, Petr Kolisko, Miroslava Přidalová
Faculty of Physical Culture, Palacký University, Olomouc, Czech Republic
Submitted in November, 2007
During the years 2005, 2006, and 2007, we studied changes in the posture and spinal shape in three groups of younger female seniors (mean age 61, 63, and 66 years) using the diagnostic device DTP2 following the interventional procedure of a targeted exercise program (the Chinese therapeutic exercise known as “Hui chun gong”). The exercise influenced mainly the pelvic area; the trends suggesting improved posture and stability did not reach statistical sig-nificance in all cases. Since the exercise technique is technically difficult, improperly performed positions resulted in a zero effect rather than improvement.
Positive changes were always found in terms of improved stance stability and significant shift of the thoracic kyphosis towards the vertical axis, which suggests improved posture. Shoulder position showed a certain degree of inconsistency in terms of changes in shoulder asymmetry. Pelvic position also responded to the intervention procedures by shifting the asymmetry of the spinal angles after the 1st and 2nd phases of exercise, while a statistically significant offset of the left sided asymmetry was achieved after the 3rd phase. We found a reduced extent of titubation of the axial skeleton, which was evaluated to be an accompanying effect of the improved stance stability. In total, best results were manifested following the intervention in 2007, when the extent of titubation was decreased in the direction of both the x and y axes, a statistically significant positive change was found in the adjustment of symmetry of the posterior superior iliac spine, and a materially significant trend of a decrease in the axial values of lordoses and thoracic kyphosis was observed. The reasons for these changes can be found in an increased emphasis on the proper performance of exercise techniques and thus adjustment of muscle imbalances.
Subjective feelings of the senior patients were very beneficial, as they evaluated very positively the feeling of im-proved stance stability.
Keywords: Posture, DTP2, women, senescence, targeted exercise program Hui Chun Gong.
INTRODUCTION
Upright posture can be considered to be an indi-vidual postural program which came into existence in the course of human evolution. “Bad” posture can usually be seen in individuals lacking the disposition towards variability of postural and motor variations. We can also find it in probands who are forced to assume long term unchanging or repeatedly identical positions in their occupations. Bad posture is usually a source of various functional disorders of the postural system, which, in the case of frequent occurrence, may even lead to structural changes. Clinical pictures of poor bod-ily posture in the elderly are very diverse. They usually involve disorders of the postural arrangement of the spinal elements with sagittal or lateral axial deviation, displacements of the spinal sectors as compared to the head and support base, kyphotic posture, or disorders associated with rotation. This study is focused on estab-lishing changes in the shape of the spine and in bodily posture before and after the application of therapeutic
exercises performed for a period of three and six months in women of early senior age (senescence). We chose a Chinese therapeutic exercise called “Hui chun gong” to correct posture and flexibility. It involves precisely targeted, slowly led movements that are designed to af-fect the whole body. The exercise is also known as “the rejuvenation exercise of the Chinese emperors” and it is claimed to have considerable therapeutic effects by the non professional public. Imagination and laughter are important to establish mental balance.
OBJECTIVE AND METHOD
The objective of the work was to verify the presumed changes in posture and spine shape using the DTP2 diagnostic device after an intervention procedure of the selected targeted exercise program (Chinese therapeutic exercise). The women exercised in a continuous time sequence of three months during the year 2005 and six months during the years 2006 and 2007. The exercise

28 Acta Univ. Palacki. Olomuc., Gymn. 2008, vol. 38, no. 1
was done on a weekly basis for 1½ hours, and in addi-tion the probands observed a home exercise program for at least 15 minutes a day. Once the intervention had been completed, this regular program was no longer followed.
The research group comprised 20 female probands in the year 2005, 23 senior patients in the year 2006 and 21 female probands in the year 2007, who underwent examination at baseline and at the end of the experi-ment. The exercise was always started by 30 women. The 2006 group included 52, 17% of whom were women who had already exercised in the first year of research. The 2007 group, included 42.86% of women who had already exercised in the second year of research. This communication has the character of a pilot study given the numbers of probands.
Standard anthropometric methods and instrumenta-tion were used for somatometric measurements, while the DTP2 diagnostic system (somatographic method) was used for the examination of spinal shape and body statics.
The DTP2 device was developed in cooperation with the Department of Biomechanics and Technical Cyber-netics and the Functional Anthropology and Physiology Department at the FPC PU, Olomouc (Kolisko et al., 1995, 2003, 2005). It enables a graphic and numeric analysis of selected points on the body surface in the 3D Cartesian system of coordinates against the zero vertical
axis (the zero vertical axis is a vertical line leading from the centre between the proband’s heels). Each of the de-tected points is thereby determined by three coordinates as follows – x coordinate – sagittal distance of the point from the zero vertical, y coordinate – ventral (dorsal) distance from the zero vertical, z coordinate – height of the point cranially from the first caudally measured points on the spine.
After marking the points on the proband’s body, each position in a free stance was measured repeatedly three times. Skin projections of the C3
–L5 spinous proc-
esses were used (22 points). In addition, we measured the position of the acromion as well as the position of the posterior superior iliac spine in the pelvic region. To identify the spinal shape, which is defined by the projection of the marked points against the ideal vertical axis, we determined the mean spinal shape. The latter was used as a basis for determination of the polynomial coefficient of the 6th degree, which expresses the char-acter of the spinal shape curve in the frontal and sagit-tal plane with a sufficient precision (Krejčí, 2007). To obtain a more precise interpretation of changes in the spinal shape curve in the sagittal plane, we used angle values that characterize the angles of cervical, thoracic, and lumbar segments. An example of the graphic repre-sentation is shown in Fig. 1, while data is summarized in TABLE 4.
Fig. 1 Mean angle parameters of spinal shape curves in the sagittal plane – the third stage of examination
Legend:PRE – examination before the application of the exercise programPOST – examination after the application of the exercise program● – average position of the spinous processCT – cervicothoracic junctionTL – thoracolumbar junction
αC – cervical lordosis angle
αT – thoracic kyphosis angle
αL – lumbar lordosis angle
IV – ideal vertical axis
Acta Univ. Palacki. Olomuc., Gymn. 2008, vol. 38, no. 1 29
Basic statistical characteristics were used to evaluate mean changes in the spinal shape expressed in quan-titative data; differences were tested by a paired t-test at the 0.05 level of significance. The mean values of the defined points provide information on the potential trends of changes in body posture; angular character-istics of the curvature peaks in the sagittal and frontal planes characterize the shape of the sagittal and lateral curvature of the spine; mean standard deviation values of repeated measurements inform about the titubation of the spine.
RESULTS AND DISCUSSION
TABLE 1Basic statistical characteristics of selected anthropomet-ric parameters in women – examination in the years 2005 (n = 20), 2006 (n = 23), and 2007 (n = 21)
ParametersBaseline examination Final examination
x1 s1 x2 s2
Age (2005)(n = 20)
61.35 3.87 61.65 3.87
Weight 70.05 8.85 68.95 8.61
Height 163.79 4.49 163.83 4.21
BMI 26.19 3.81 25.77 3.76
Age (2006)(n = 23)
63.26 4.88 63.78 4.87
Weight 66.37 10.20 67.11 10.26
Height 161.90 4.94 161.89 5.02
BMI 25.30 3.97 25.63 3.86
Age (2007)(n = 21)
65.69 4.94 66.06 4.93
Weight 68.00 11.69 68.80 12.11
Height 161.40 3.95 161.30 3.98
BMI 28.06 4.27 26.38 4.37
TABLE 1 shows basic statistical characteristics of selected anthropometric parameters in the group of women of senescent age, obtained during the initial and final examination.
The mean body weight and height of women were within the range of normal values for the Czech popu-lation (Bláha et al., 1986). BMI and analysis of body composition indicate a more robust constitution and slight overweight.
We used spinal curves of all the probands in both frontal and sagittal planes to calculate the average spi-nal curvature. Based on the comparison of the average spinal curvature before and after the application of the targeted exercise program, we observed differences in the position of the x, y, and z points and in stance sta-bility (Fig. 2).
When analyzing the results of research in the year 2005, a significant accentuation of the axial system shift to the left of the zero vertical was found in the frontal region in the case of 65% of probands while no change was observed in the remaining 35%. The average range of ellipses – titubations (SD) – was reduced by 0.7 cm in both the x and y axes (TABLE 2), which falls within the level of an allowed measurement error. The limit of 1.0 mm has been set for a material significance of the difference. In a subjective evaluation the probands em-phasized an improvement in their stance stability.
After the completion of the research in 2006, a shift of the spinal curve towards the vertical axis was ob-served in the frontal plane in 50% of probands, and peak of the thoracic kyphosis also came nearer to the zero vertical axis (22.22% of probands). The average range of titubations increased from the mean 1.1 mm in the x axis and 0.2 mm in the y axis, which – as a matter of fact – is negligible.
The 2007 results are similar to the trends found in the 1st stage of the examination. The range of tituba-tions was reduced by 1.1 mm in the x axis and 0.3 mm in the y axis.
TABLE 2Changes in standard deviation of the mean range of ellipses – variance from axis x and axis y
YearMean C3–L5
Pre PostSDx (mm) SDy (mm) SDx (mm) SDy (mm)
2005 5.2 5.9 4.5 5.2
2006 3.8 5.9 4.9 6.1
2007 4.6 5.7 3.5 5.4
Mean values of changes in acromial and posterior superior iliac spine angles from the horizontal plane laid through these angles are shown in TABLE 3.
In the frontal plane, we examined a change in the position of acromia and the position of the left and right posterior superior iliac spine compared to the horizontal plane laid through them. Shoulder position was charac-terized by a certain degree of inconsistency. Mean angle values suggest minor side shifts of shoulder asymmetry (1 degree means approximately 5 mm in the shoulder area and 2 to 3 mm in the pelvic area). During the first stage of research in the year 2005, a statistically signifi-cant difference was found involving a shift from left sid-ed asymmetry to right sided asymmetry; the difference after recalculation was approximately 3.15 mm. The po-sition of the pelvis also responded to the intervention procedure in both the 1st and the 2nd phases by shifts in the asymmetry of the spinal angles. After the third phase in the year 2007, we again reported a shift from the left sided asymmetry to the right sided asymmetry in

30 Acta Univ. Palacki. Olomuc., Gymn. 2008, vol. 38, no. 1
Fig. 2Evaluation of the average spinal curvature in the frontal and sagittal planes depicting the stability of the individual points on the spine (ellipses) in the stance (1st to 3rd stage of research, years 2005, 2006, and 2007). Standard devia-tions (ellipses) are shown in 10 times magnification.
1st stage
2nd stage
3rd stage
Legend: PRE – examination before the application of the exercise programPOST – examination after the application of the exercise program+ – mean position of the left acromion and left posterior superior spine, respectively× – mean position of the right acromion and right posterior superior spine, respectively● – mean position of the spinous process� – standard deviations of the spinous process (10 times magnification)IV – ideal vertical axis

Acta Univ. Palacki. Olomuc., Gymn. 2008, vol. 38, no. 1 31
TABLE 3Basic statistical characteristics of the acromial and spinal angles (expressed in degrees)
YearAcromial angle Posterior superior spine angle
pre postdif.
pre postdif.
x s x s x s x s
2005 –0.36 1.36 0.48 1.80 0.86* –0.80 3.32 0.11 2.27 0.91
2006 0.15 1.75 –0.47 1.93 –0.63* 0.70 2.40 –0.45 2.51 –1.15
2007 –0.03 1.65 0.13 1.55 0.16 –2.35 3.82 –0.23 2.99 2.12*
Note:Negative value means the left shoulder is higher, while positive value means the right shoulder is higher.
TABLE 4Mean angular values for cervical and lumbar lordosis and thoracic kyphosis
YearCervical lordosis angle α
CThoracic kyphosis angle α
TLumbar lordosis angle α
L
x pre x post dif. x pre x post dif. x pre x post dif.
2005 29.83 40.10 10.27* 50.36 51.78 1.43 33.73 31.41 –2.31
2006 43.79 51.57 7.79 53.55 52.66 –0.89 33.29 34.84 1.55
2007 23.08 20.87 –2.21 45.95 45.73 –0.22 45.01 46.06 1.05
the shoulder posture and both a statistically and factu-ally significant difference suggesting an improved pelvic posture wherein left sided asymmetry was reduced by 2.12° (4.24 mm). Postural corrections were generally found to be the best after the third phase. We explained these findings by an increased emphasis on the accuracy of exercise technique and in the individual findings of muscle imbalance. Some exercises in the exercise set are technically demanding. Their incorrect or incom-plete performance – in the event of muscular imbal-ance – could negatively affect the muscle coordination in the region of the shoulder girdle and cause variations in the symmetry of shoulder posture. Pelvic posture also responded in the context of effects of movement chains. Positive trends towards the subjective perception of an improved stance stability were observed.
During the evaluation of angles that characterize the spinal curvature, we found a significant change in the angle of cervical lordosis, namely an increase by 10.27°, after the phase 1 intervention exercise. Concerning the angles characterizing the thoracic and lumbar spine, we found a factual increase by 1.43° in thoracic kyphosis and decrease in the depth of lumbar lordosis by 2.31°. No significant correlations were found between the change in the spinal curvature and range of titubation. In the second phase, only a factual increase in the angle values were found for lordoses, namely by 7.79° (cervical lordosis) and 1.55° (lumbar lordosis), while the mean angle of thoracic kyphosis responded by a suggested trend towards correction of kyphotic posture by 0.90°. In the third phase, we reported a positive change for cervical lordosis and thoracic kyphosis (2.21° and 0.22°,
respectively), while a suggested deepening by 1.05° was found for lumbar lordosis. These differences were not statistically significant (TABLE 4).
As we already mentioned, these women evaluated the subjective feeling of improved stance stability very positively. A detailed case analysis of the results of the individual probands revealed that the postural system responded on an individual basis according to its setting and observance of the exercise techniques. Therefore changes in the response of the axial system to the cho-sen intervention manifested both as positive corrections and also zero changes.
Previous analysis provides a certain response to the thoughts of Vařeková et al. (2007), who raised the question as to whether a high frequency of muscular shortening and weakening is the norm in older age. Known anatomical principles pertaining to “ageing” of the muscular apparatus require a regular, target oriented musculoskeletal activity, which shall become a basis for further positively tuned structural and physiological set-tings. The entire age spectrum of our society should be educated in terms of primary care and healthy move-ment.
CONCLUSIONS
The study groups of women of a young senior age had their mean body weight and height within the range of normal values for the Czech population. BMI and analysis of body composition indicated a more robust constitution and slight overweight.

32 Acta Univ. Palacki. Olomuc., Gymn. 2008, vol. 38, no. 1
When evaluating the changes in the average spinal curvature in the frontal plane after the completion of the exercise program in the years 2005, 2006, and 2007, a shift of the axial system was found towards the zero vertical axis and primarily a reduction in the mean range of titubations. This condition manifested by a subjective feeling of improved stance stability.
With respect to the shoulder posture, a fluctuation was found, namely a shift in the shoulder asymmetry. Pelvis posture also responded to the interventional ex-ercise by shifting the asymmetry of spinal angles, and after the 3rd phase, a significant compensation of the left sided asymmetry.
When evaluating the angles characterizing the spinal curvature, we reported variability of the response in the sense of a factual increase or decrease in the depth of lor-doses. The best results were achieved after the 3rd phase of research, when increased emphasis was placed on proper technique of performance of individual exercis-es. Their improper or incomplete performance – in the event of muscular imbalance – could negatively affect the muscle coordination in the region of the shoulder and pelvic girdles. When asked for subjective evaluation, women emphasized improved stance stability.
ACKNOWLEDGMENT
This study was carried out within the research project granted by the Ministry of Education, Youth and Sports “Physical activity and inactivity of inhabitants of the Czech Republic in the context of behavioral changes, no: 6198959221”.
REFERENCES
Hackl, M. (2001). Omlazovací cvičení čínských císařů (Chuej čchun kung). Bratislava: Eugenika Pbl.
Kolisko, P., & Salinger, J. (1995). Diagnostika tvaru pá-teře pomocí polohového snímače. In J. Riegerová (Ed.), Diagnostika pohybového systému – metody vy-šetření, primární prevence, prostředky pohybové terapie (pp. 87–88). Olomouc: Univerzita Palackého.
Kolisko, P., Krejčí, J., & Salinger, J. (2003). Diagnostic-ký systém DTP1 a jeho využití při hodnocení tvaru a funkce páteře. Česká antropologie, (53), 35–38.
Kolisko, P., Salinger, J., Krejčí, J., Novotný, J., & Szot-kowská, J. (2005) Hodnocení tvaru a funkce páteře s využitím diagnostického systému DTP1, 2. Olomouc: Univerzita Palackého.
Krejčí, J. (2007). Systém pro diagnostiku tvaru páteře člověka. Disertační práce, Univerzita Palackého, Pří-rodovědecká fakulta, Olomouc.
Riegerová, J., Přidalová, M., & Szotkowská, J. (2005). Somatometrické charakteristiky a rozbor svalových
funkcí u žen – seniorek před a po aplikaci cílených cvičení. Slov. Antropol., 7(3), 142–146.
Riegerová, J., Szotkowská, J., Přidalová, M., & Krejčí, J. (2006). Vliv čínského léčebného cvičení na posturu a pohybový aparát seniorek. Med. Sport. Boh. Slov., 15(5), 212–216.
Riegerová, J., Szotkowská, J., & Krejčí, J. (2007). Di-agnostics of posture and spine using the DTP2: Po-sition detector for U3A senior students before and after an intervention procedure by a targeted exer-cise program. Auxologija a promocja zdrowia, Kielce, 4, 253–264.
Riegerová, J., Szotkowská, J., Přidalová, M., & Krejčí, J. (2007). The influence of medical exercise on the so-matic parameters and movement system of senior women. Przeglad Anthropologiczny, 5, 111.
Vařeková, R., Vařeka, I., Hnátek, J., Píšťková, N., & Bu-rianová, K. (2007). Sledování pohybového systému u klientů středního a seniorského věku. Česká antro-pologie, (57), 80–82.
ANALÝZA POSTURYPOLOHOVÝM SNÍMAČEM DTP2
U ŽEN VE VĚKU SENESCENCE PO APLIKACI CÍLENÉHO CVIČEBNÍHO PROGRAMU
(Souhrn anglického textu)
U 3 souborů žen v mladším seniorském věku (prů-měrný věk 61, 63 a 66 let) jsme v roce 2005, 2006 a 2007 sledovali změny v držení těla a ve tvaru páteře pomocí diagnostického přístroje DTP2 po intervenčním zása-hu cíleného cvičebního programu (čínské terapeutické cvičení Chuej čchun kung). Cvičení ovlivnilo přede-vším oblast pánve, trendy naznačující zlepšení držení těla a stability nedosáhly ve všech případech statistické významnosti. Vzhledem k tomu, že technika cvičení je cíleně náročná, nesprávně provedené pozice nevedly ke zlepšení, ale projevily se nulovým efektem.
Vždy byly nalezeny pozitivní změny ve smyslu zlepše-ní stability stoje a signifikantního posunu hrudní kyfózy k vertikále, což svědčí o zlepšení držení těla. V posta-vení ramen se projevila určitá rozkolísanost ve smyslu změn asymetrie ramen. Také postavení pánve reagovalo na intervenční zásahy přesuny asymetrie spinálních úhlů po 1. a 2. etapě cvičení, po 3. etapě došlo ke statisticky významnému vyrovnání levostranné asymetrie. Nalezli jsme zmenšení rozsahu titubací axiálního skeletu, což je doprovodným projevem zvýšení stability stoje.
Celkově
se nejlepší výsledky projevily po intervenci v roce 2007, kdy se snížil rozsah titubací ve směru osy x i y, byla zjiš-těna statisticky významná pozitivní změna v úpravě sy-metrie spina iliaca posterior superior a nalezen věcně významný trend snížení úhlových hodnot lordóz i hrud-ní kyfózy. Zdůvodnění těchto změn je možné najít ve
Acta Univ. Palacki. Olomuc., Gymn. 2008, vol. 38, no. 1 33
zvýšeném důrazu na správné provádění technik cvičení a tím i úprav svalových dysbalancí.
Subjektivní pocity seniorek byly velmi příznivé, vyso-ce pozitivně hodnotily pocit zlepšení stability stoje.
Klíčová slova: držení těla, DTP2, ženy, senescence, cílený cvičební program.
Prof. RNDr. Jarmila Riegerová, CSc.
Education and previous work experienceUniversity education, 1968–1990 lecturer, associate pro-fessor at the Faculty of Science, Palacký University, Olo-mouc, 1991 till the present associate professor, professor at the Faculty of Physical Culture, Palacký University, Olomouc.Scientific orientation Functional anthropology, environmentalism of human, kinesiology.First-line publication Until now has published 120 papers and research stud-ies in Czech as well as in foreign literature, 1 monograph and 5 instructional texts.
Palacký University
Faculty of Physical Culture
tř. Míru 115
771 11 Olomouc
Czech Republic


Acta Univ. Palacki. Olomuc., Gymn. 2008, vol. 38, no. 1 35
THE HEIGHT OF THE LONGITUDINAL FOOT ARCH ASSESSEDBY CHIPPAUX-ŠMIŘÁK INDEX IN THE COMPENSATED
AND UNCOMPENSATED FOOT TYPES ACCORDING TO ROOT
Ivan Vařeka*, **, Renata Vařeková*
*Faculty of Physical Culture, Palacký University, Olomouc, Czech Republic**Luhačovice Spa, Co., Luhačovice, Czech Republic
Submitted in January, 2008
It is known that functional types and subtypes of foot according to Root differ, among others, by the height of foot arch when load is applied. The study objective was to use the Chippaux-Šmiřák index (CSI) to evaluate the height of the longitudinal foot arch in functional (sub)types according to Root. The test group consisted of 141 women (17–85 year, x = 58.8, SD = 12) and 87 men (22–86 year, x = 58.7, SD = 11.91), mainly middle aged and older. One examiner as-sessed the foot types and subtypes in all test subjects – rearfoot varus compensated (RFvarC), partially compensated (RFvarP) and uncompensated (RFvarN), forefoot varus compensated (FFvarC), partially compensated (FFvarP) and uncompensated (FFvarN), forefoot valgus flexible (FFvalgF), semiflexible (FFvalgS) and rigid (FFvalgR) and neutral foot (N). The other examiner evaluated all footprints and he assessed CSI. The sequence was determined on the basis of average CSI; significance of the differences we found was tested by ANOVA and the post-hoc Fisher LSD test. The results showed that functional subtypes could be – with high significance – divided into 2 extreme groups. On one side of the spectrum are the compensated, resp. flexible subtypes with high CSI (thus lower longitudinal foot arch). On the other side of spectrum are uncompensated, respectively rigid subtypes with low CSI. In the central part of the spectrum there are intermediate subtypes. Neutral types can be placed in the central group, rather into its left side. Gender influence is negligible. The results also confirmed the assumption concerning the differences among functional (sub)types in the height of the longitudinal foot arch when load is applied. Nevertheless it cannot by itself replace a personal and physical examination by an examiner who is greatly acquainted with functional anatomy and kinesiology.
Keywords: Rearfoot varus, forefoot varus, forefoot valgus, Chippaux-Šmiřák index.
INTRODUCTION
Classical clinical typology distinguishes 3 basic foot types: flat foot, normal foot and high foot. Althougth the first description of flat foot is attributed to Galen (Xarchas & Tsolakidis, 2004), the term flat foot was introduced into contemporary practice by Durlacher in 1845 who also designed a suitable shoe padding. In 1888, Whitman completed the patomechanics in pes valgus and he considered muscle activity as a principle factor for foot stabilisation and muscle weakening as a cause for the overloading of other muscles and liga-ments and the cause of pain as well. In the twenties, the classic typology was completed with a tripod model of foot arch that is related to the classic orthopaedic con-cept of collapsed arches as a cause of metatarsalgy. In spite of the fact that the tripod model has been recent-ly repeatedly disputed (Henning & Milani, 1993; Roy, 1988; Cavanagh, Rodgers, & Ibioshi, 1987) it can be still granted a certain validity (Vařeka, 2003). Nevertheless it is obvious that from the aspect of function, a diagnosis
of flat foot is about as vague as a diagnosis of bad pos-ture. When evaluating the findings, it is appropriate to take into account the difference between longitudinal and transversal flat foot because the heightened longi-tudinal arching is often accompanied by lowered trans-versal arching. Terminologically and practically it is also good to distinguish between the clinical findings of flat foot and pes planus diagnosis. A high arch (pes cavus) is the opposite of a flat foot. As far as the diagnostics and orthotics therof, it is important that the accentua-tion of longitudinal arching is often accompanied by lowering of transversal arching under metatarsal heads. Various clinical examinations are used for their being placed into the mentioned categories, including simple footprints and anthropometric measurements. In an at-tempt to achieve greater objectivity and to obtain valid results, imaging technology (X-ray) and sophisticated systems measuring the distribution of pressure under the planta are used (e. g. footscan or EMED pedar). The interpretation of these results in accordance with classic typology is insufficient because classic typology does not

36 Acta Univ. Palacki. Olomuc., Gymn. 2008, vol. 38, no. 1
deal in great detail with dynamic changes of the loaded foot during the gait cycle.
In 1954–1966, Merton Root introduced the func-tional typology that lays stress on the foot as a dynamic complex and not merely as a static structure. He drew from the studies of Manter (movements in the subtalar and transversotarsal joint, 1941), of Hicks (orientation of joint axes, 1953), of Wright (rearfoot movements, 1956), of Elftman (locking of the transversotarsal joint during supination in the subtalar joint, 1960) and of Scheiber, Weinerman and Bar Levy (significance of the mutual position of forefoot and rearfoot, 1948 and 1950). It resulted in a new classification of normal and abnormal foot types. In basic (“normal”, ideal) position according to Root, the axis of the lower ⅓ of the shank and of the heel passes vertically and at the same time the plantar planes of the heel and rearfoot coincide. The aberrations from this position are related to foot function disorders. The protocols for diagnostics and so called functional orthosis with the usage of chocks and backings were created on the above mentioned ba-sis. Root, his colleagues and followers further improved this typology. The original classification of main types (rearfoot varus, forefoot varus and valgus forefoot) was completed with other subtypes and variations. Today it is a rather comlex system that enables us to explain logically the findings on the foot also at the proximal levels. Various foot types can have similar but not identi-cal clinical findings. That is why it is mostly important to distinguish between the findings in the case of the unloaded foot and the same foot when it is loaded dur-ing standing and walking – when the potential com-pensations can occur. That requires a certain level of knowledge of foot kinesiology and patho-kinesiology and practical experience as well.
It is known from medical practice that Root’s func-tional (sub)types differ – among others – by the height of the longitudinal arch when loaded. The objective of this study was to verify these differences.
METHODOLOGY
The test group consisted of 228 test subjects, 141 women (17–85 year, x = 58.8, SD = 12) and 87 men (22–86 year, x = 58.7, SD = 11.91). They were the cli-ents of Luhačovice Spa Company, mainly middle aged or older. Kinesiological examination was carried out, including the static footprint by means of the membrane podoscope. Furthermore, we assessed the functional foot types according to Root. One examiner was performing continually this functional evaluation in the course of the whole research period. The other examiner assessed the footprints by means of the Chippaux-Šmiřák index
(CSI) at the end of the whole research period. In CSI, the ratio of the smallest width of the middle part of the footprint to the biggest width of the forefoot is deter-mined. The values of the smallest width of the forefoot are found on the line that is perpendicular to the lateral tangent of the footprint; the width of the front part of the footprint is measured at the joint point of the lateral and medial tangent point of the forefoot. Higher CSI can mean a relatively wider midfoot in comparison to the forefoot, which is considered to be an indicator of a lower arch. The reason why CSI was chosen for foot arch evaluation is because it correlates very well with the X-ray evaluation of an arch and because it is a very simple measurement (Maes, Andrianne, & Burny, 2004; Mathieson, Upton, & Prior, 2004). The methodology used draws upon Klementa’s descriptions (1987).
The functional examination was based on the former works of Magee (1992), McPoil and Brocato (1990), Sutherland (1996), Valmassy (1996) and Vařeka and Vařeková (2003, 2005). We firstly performed the visual evaluation of the lower limbs in a standing test subject by viewing him/her from behind. Then the subject lies pronated with ⅓ of his/her lower limbs extending over the bed. He/she bent the non examined limb and put his/her foot’s heel on the level of the fossa poplitea of the examined limb. The neutral position of the subtalar joint was determined by the palpitation method. The dorsiflexion and the locking of the transversotarsal joint were achieved by applying pressure with the thumb of the other hand on the sole below the head of the 5th meta-tarsus. Then we visually evaluated the rearfoot position relative to the shank axis and the forefoot position rela-tive to the rearfoot (McPoil & Brocato, 1990; Sutherland, 1996; Valmassy, 1996; Vařeka & Vařeková, 2003, 2005). For the purpose of this study, three functional foot types were determined – rearfoot varus (RFvar), forefoot varus (FFvar), forefoot valgus (FFvalg) and neutral foot. We compared the findings in each foot when unloaded and loaded by the subject’s standing on it and we determined the compensated (resp. flexible) and uncompensated (resp. rigid) subtypes. Inexplicit findings were placed as belonging to the intermediate subtype (TABLE 1).
To simplify the classification we did not establish the types upinated forefoot and that kind of finding was regarded as forefoot varus. Similarly, the finding of the plantarflexed first ray was regarded as forefoot valgus. Detailed description of individual foot types was published repeatedly (Scherer & Moris 1996; Valmassy, 1996; Vařeka & Vařeková, 2003, 2006).
The obtained data were sorted in the Excel program. ANOVA and the post-hoc Fisher LSD test in Statisti-ca 6.0 were used to test the hypothesis. The differences were considered statistically significant at p < 0.05.

Acta Univ. Palacki. Olomuc., Gymn. 2008, vol. 38, no. 1 37
RESULTS
The basic descriptive statistics are shown in TA-BLE 2 where the subtypes are ranked according to CSI. Although the average values for the left and right foot differ a little, the ranking range is the same for both.
The significance of these differences (TABLE 3) convincingly confirmed the originally made assumption about the existence of differences in the height of the longitudinal foot arch among the individual functional subtypes that can be divided on the basis of CSI val-ues into 3 subgroups – compensated (resp. flexible), intermediate and uncompensated (resp. rigid). On the
right side of the spectrum are compensated, resp. flex-ible subtypes – FFvarC, RFvarC and FFvalgF with high CSI (thus a lower longitudinal arch). Within this group, FFvarC has also significantly higher CSI (thus a lower arch) than FFvalgF and RFvarC. On the other side of the spectrum are uncompensated, resp. rigid subtypes – FFvalgR, RFvarN and FFvarN with low CSI – these subtypes have no significant differences in CSI. In the middle part of the spectrum are the intermediate types RFvarP, FFvarP and FFvalgS – none of these subtypes have significant differences in CSI. Normal functional types can be put on the basis of CSI into the middle group, rather to its left side.
TABLE 1 Functional types and subtypes
Type Subtype Abbreviation
Rearfoot varus RFvar
compensated RFvarC
partially compensated RFvarP
uncompensated RFvarN
Forefoot varus FFvar
compensated FFvarC
partially compensated FFvarP
uncompensated FFvarN
Forefoot valgus FFvalg
flexible FFvalgF
semiflexible FFvalgS
rigid FFvalgR
Neutral N
TABLE 2Foot subtypes ranked according to the average value of the Chippaux-Šmiřák index
TypeLeft Right
n M SD M SD
FFvarC 23 0.442 0.133 0.447 0.114
RFvarC 44 0.381 0.065 0.383 0.084
FFvalgF 32 0.357 0.048 0.356 0.038
RFvarP 26 0.340 0.089 0.329 0.089
FFvalgS 15 0.319 0.066 0.327 0.054
FFvarP 4 0.317 0.098 0.326 0.081
N 38 0.311 0.076 0.311 0.078
FFvarN 10 0.236 0.110 0.26 0.117
RFvarN 16 0.18 0.097 0.2 0.098
FFvalgR 20 0.163 0.091 0.18 0.091
Sum 228
Legend: n – number; M – simple average; SD – standard deviationfor the other abbreviations see TABLE 1

38 Acta Univ. Palacki. Olomuc., Gymn. 2008, vol. 38, no. 1
TABLE 3 Significance of differences in Chippaux-Šmiřák index value among functional subtypes
FFvarC0.44; 0.45
RFvarC0.38; 0.38
*
FFvalgF0.36; 0.36
ns **
RFvarP0.34; 0.33
ns dx*sin**dx***
FFvalgS0.32; 0.33
ns ns sin(*)sin***dx**
FFvarP
0.32; 0.32ns ns ns ns *
N
0.31; 0.31ns ns ns ns ** ***
FFvarN
0.24; 0.26sin(*) ns ns sin*
sin**dx*
sin***dx**
***
RFvarN0.18; 0.2
ns *** *sin***dx**
*** *** *** ***
FFvalgR0.16; 0.18
ns ns *** * *** *** *** *** ***
Legend: functional subtypes ranked according to average value of CSI, average value is shown in order left; right ns – non-significant(*) p < 0.06 (non-significant); * p < 0.05; ** p < 0.01; *** p < 0.001for the other abbreviations see TABLE 1
TABLE 4Influence of gender
CSI_L CSI_R
F p F p
Gender 2.098 0.149 0.953 0.330
Gender* subtyp 1.370 0.229 1.579 0.156
Legend: CSI_R(L) – Chippaux-Šmirak index left (right); F – ANOVA test criterion; p – significance level; Gender* subtyp – interaction between gender and subtype

Acta Univ. Palacki. Olomuc., Gymn. 2008, vol. 38, no. 1 39
TABLE 4 shows the gender influence on results showed in TABLE 3. It is obvious that the interaction between gender and foot subtype has no significant rela-tion to CSI value, so the differences in CSI among foot subtypes is approximately similar in men as well as in women.
DISCUSSION
The results show agreement with the early pub-lished descriptions of loaded foot arch in the individual functional subtypes of foot during a gait cycle (McPoil & Brocato, 1990; Pratt & Sanner, 1996; Valmassy, 1996). The foot does not go through a whole gait cycle when taking the static footprint; nevertheless the static load is approximately comparable to midstance.
Compensated rearfoot varus with sufficient compen-satory pronation in the subtalar joint (and adduction and plantarflexion of the talus) enables the contact of the medial edge of the foot with the ground. Rearfoot pro-nation is very quick and remains throughout the whole support phase. Thus the foot arch is decreased, which corresponds with the higher CSI values of our test sub-jects. On the contrary, in uncompensated rearfoot varus, the pronation in the subtalar joint does not occur so when one treads fully on one’s foot, the permanent load stays in the lateral edge of the foot. As a substitutional compensatory mechanism, the 1st ray plantar flexes and it causes the accentuation of the medial curve of the foot arch (McPoil & Brocato, 1990; Valmassy, 1996), which again corresponds with our results.
It is typical for compensated forefoot varus that there is hyperpronation in the subtalar joint with heel valgus when one treads fully on one’s foot. As a result, the transversotarsal joint is unlocked and the foot arch is flattened (Hunt, 1990; Pratt & Sanner, 1996). Concern-ing the fact that even greater compensatory pronation occurs in this case than in compensated rearfoot varus, the foot arch flattening should be more prominent as well. Our finding of the significant highest CSI from all subtypes is in accordance with this assumption. In uncompensated forefoot varus, unlocking and flattening does not occur, which is again in accordance with low CSI findings.
Flexible forefoot valgus is characterised by a suf-ficient opportunity for forefoot supination along the longitudinal axes of transversotarsal joint so that the forefoot can reach the ground when loaded. Thus it does not need compensatory supination in the subtalar joint (Hunt, 1990; Pratt & Sanner, 1996). But the supination in the transversotarsal joint unlocks the forefoot and in that it worsens the forefoot’s resistance to applied load
in the midstance phase of the support and taking off phases. The foot medial curve collapses while loaded, which clinically manifests itself by showing a prominent difference in the height of the medial curve of the foot arch while loaded and unloaded. Rearfoot pronation re-mains throughout the whole support phase and through the initiation of the foot heel taking off. It corresponds with higher CSI in our test subjects. In rigid forefoot valgus, the compensatory supination along the longitu-dinal axis of transversotarsal joint does not occur. To achieve the situation that the whole area of the fore-foot has contact with the ground, the compensatory inversion/supination of calcaneus (Hunt, 1990; Pratt & Sanner, 1996) with talus dorsiflexion and adduction (in transversal level) is needed. The lateral edge of the foot is overloaded when (among others, because of the lower ability of a rigid structure to absorb the load at the time). In gait cycle analysis, the rearfoot supination in heel contact is evident (sometimes even before the heel reaches the ground) and the medial curve of the foot arch is accented both when loaded and unloaded. In our test group, the subjects with this subtype had the lowest average values of CSI, ergo the lowest longi-tudinal arch.
CONCLUSION
The obtained results support our assumptions about foot arch height differences among individual functional foot types and subtypes. Compensated (resp. flexible) subtypes have lower longitudinal arches than uncom-pensated (resp. rigid) subtypes, which finding correlates with previously published kinesiological articles (Hunt, 1990; Magee, 1992; Pratt & Sanner, 1996; Valmassy, 1996; Vařeka & Vařeková, 2003, 2005). Gender influ-ence is negligible. Footprint analysis can to a certain extent help to estimate the level of compensation or flex-ibility in individual functional foot types. Footprint eval-uation cannot by itself replace a personal and physical examination by an examiner who is well acquainted with foot functional anatomy and kinesiology. For example a descriptive diagnosis of flat foot based on footprints cannot differentiate between compensated subtypes of rearfoot/forefoot varus and the flexible forefoot valgus. The situation is similar in the field of uncompensated (resp. rigid) subtypes. Also, the middle values of CSI can indicate not only a normal foot but also partially compensated (resp.semiflexible) subtypes. The ways of compensatory orthoses are then different (Pratt & San-ner, 1996; Valmassy, 1996; Vařeka & Vařeková, 2005) and their unsuitable application could lead to problem accentuation.

40 Acta Univ. Palacki. Olomuc., Gymn. 2008, vol. 38, no. 1
REFERENCES
Cavanagh, P. R., Rodgers, M. M., & Ibioshi, A. (1987). Pressure distribution under symptom – free feet dur-ing barefoot standing. Foot Ankle, 7(5), 262–276.
Henning, E. M., & Milani, T. L. (1993). The tripod sup-port of the foot: An analysis of pressure distribution under static and dynamic loading. Z. Orthop. Ihre Grenzgeb., 131(3), 279–284.
Hunt, G. C. (1990). Examination of lower extremity dys-function. In J. A. Gould (Ed.), Orthopaedic and sports physical therapy (2nd ed.). St. Louis: Moshby.
Klementa, J. (1987). Somatometrie nohy. Frekvence ně-kterých ortopedických vad z hlediska praktického vyu-žití v lékařství, školství a ergonomii. Praha: SPN.
Maes, R., Andrianne, Y., & Burny, B. (2004). Retrospec-tive study of the correlation between foot print pa-rameters and the Djian-Annonier angle for studying the plantar vault: Results in 158 feet. J. Bone Joint Surg., 86, 35.
Magee, D. J. (1992). Orthopaedic physical assessment (2nd ed.). Philadelphia: W. B. Saunders.
Mathieson, I., Upton, D., & Prior, T. (2004). Examin-ing the validity of selected measures of foot type: A preliminary study. J. Am. Podiatr. Med. Assoc., 94(3), 275–281.
McPoil, T. G., Jr., & Brocato, R. S. (1990). The foot and ankle: Biomechanical evaluation and treat-ment. In J. A. Gould (Ed.), Orthopaedic and sports physical therapy (2nd ed.) (pp. 293–321). St. Louis: Moshby.
Pratt, D. J., & Sanner, W. H. (1996). Paediatric foot orthoses. The Foot, 6(3), 99–11.
Roy, K. J. (1988). Force, pressure and motion meas-urements in the foot current concepts. Clin. Podiatr. Med. Surg., 5(3), 491–508.
Scherer, P. R., & Morris, J. L. (1996). The classifica-tion of human foot types, abnormal foot function and pathology. In R. L. Valmassy (Ed.), Clinical biomechanics of the lower extremities (pp. 59–84). St. Louis: Mosby.
Sutherland, Ch. C., Jr. (1996). Gait evaluation in clini-cal biomechanics. In R. L. Valmassy (Ed.), Clinical biomechanics of the lower extremities (pp. 59–84). St. Louis: Mosby.
Valmassy, R. L. (1996). Pathomechanics of lower ex-tremity function. In R. L. Valmassy (Ed.), Clinical biomechanics of the lower extremities (pp. 59–84). St. Louis: Mosby.
Vařeka, I. (2003). Dynamický model „tříbodové“ opory nohy. Pohybový systém, 10(3, 4), 193–198.
Vařeka, I., & Vařeková, R. (2003). Klinická typologie nohy. Rehabil. fyz. lék., 10(3), 94–102.
Vařeka, I., & Vařeková, R. (2005). Patokineziologie nohy a funkční ortézování. Rehabil. fyz. lék., 12(4), 155–166.
Xarchas, K. C., & Tsolakidis, G. F. (2004). Galen: Au-thor of the first flatfoot description. J. Am. Podiatr. Med. Assoc. 94(5), 508–509.
VÝŠKA PODÉLNÉ NOŽNÍ KLENBYSTANOVENÁ METODOU CHIPPAUX-ŠMIŘÁK
U KOMPENZOVANÝCHA NEKOMPENZOVANÝCH TYPŮ NOHY
DLE ROOTA(Souhrn anglického textu)
Je známo, že funkční typy a subtypy nohy dle Roo-ta se liší mimo jiné i výškou nožní klenby při zatížení. Cílem této práce bylo porovnat výšku podélné nožní klen-by u funkčních (sub)typů nohy dle Roota pomocí Chip-paux-Šmiřákova indexu (CSI). Soubor tvořilo 141 žen (17–85 let, x = 58,8, SD = 12) a 87 mužů (22–86 let, x = 58,7, SD = 11,91) převážně středního a vyššího věku. Jeden vyšetřující stanovil u všech probandů funkční typ a subtyp nohy – varozní zánoží kompenzované (RFvarC), částečně kompenzovaná (RFvarP) a nekompenzované (RFvarN), varozní předonoží kompenzované (FFvarC), částečně kompenzované (FFvarP) a nekompenzované (FFvarN), valgozní předonoží flexibilní (FFvalgF), se-miflexibilní (FFvalgS) a rigidní (FFvalgR) a neutrální typ (N). Druhý vyšetřující zhodnotil všechny plantogra-my a stanovil CSI. Na základě průměrné hodnoty CSI bylo stanoveno pořadí a statistická významnost zjištěných rozdílů byla testována pomocí ANOVA a post-hoc Fishe-rova LSD testu. Výsledky ukázaly, že funkční subtypy lze s vysokou mírou statistické pravděpodobnosti rozdělit do 2 krajních skupin. Na jedné straně spektra leží subtypy s vysokou hodnotu CSI (tedy nižší podélnou klenbou), kompenzované, resp. flexibilní subtypy. Na opačné pravé straně spektra leží nekompenzované, resp. rigidní subty-py s nízkou hodnotou CSI. Ve střední části spektra leží přechodné subtypy. Neutrální funkční typ lze zařadit do střední skupiny, spíše k levé straně. Vliv pohlaví je zane-dbatelný. Výsledky tak potvrdily předpoklad o rozdílech mezi funkčními (sub)typy ve výšce podélné nožní klenby při zatížení. Stanovení výšky podélné klenby nohy pomo-cí plantogramu může pomoci při odhadu stupně kom-penzace či flexibility jednotlivých funkčních typů. Samo o sobě však nemůže nahradit vlastní aspekci a fyzikální vyšetření nohy vyšetřujícím, který je dobře seznámen s funkční anatomií a kineziologií.
Klíčová slova: varozní zánoží, varozní předonoží, valgozní předonoží, index Chippaux-Šmiřák.

Acta Univ. Palacki. Olomuc., Gymn. 2008, vol. 38, no. 1 41
MUDr. Ivan Vařeka, Ph.D.
Education and previous work experience1987 – graduated on Faculty of Medicine, Palacký Uni-versity, Olomouc, Czech Republic.1990 – postgraduate diploma in internal medicine.1994 – diploma in myoskeletal medicine.1995 – postgraduate diploma in physiotherapy, balneol-ogy and rehabilitation medicine.2002 – certificate in rehabilitation medicine – postgrad-uate training course – Tel Aviv University, Israel.2005 – Ph.D. thesis (Postural function of the lower ex-tremity – influence of the knee flexion on the subtalar joint position in closed kinematic chain).Work experience1987–1990 – Medical department, District hospital, Krnov, Czech Republic – PRHO. 1990–1992 – The 1st clinic of internal medicine, Fac-ulty hospital, Olomouc, Czech Republic – PRHO-SHO registrar.1992–cont. – Department of physiotherapy, Faculty of Physical Culture, Palacký University, Olomouc, Czech Republic – lecturer (ass. prof.) – kinesiology, physical therapy, internal medicine.1992–2002 – RRR centrum (centrum for treatment of pain and movement disorders), Olomouc, Czech Repub-lic – medical assistant.
1996–1998 – RL corpus (centre for treatment of chil-dren movements disorders with Vojta’s method), Olo-mouc, Czech Republic – SpR consultant.2001 (3 months) – Department of orthopaedic reha-bilitation, Chaim Sheba Medical Centre, Tel Hashomer (Tel Aviv), Israel – trainee. 2001–cont. – Luhačovice Spa, Luhačovice, Czech Re-public – consultant. First-line publicationsVařeka, I., & Dvořák, R. (1999). Ontogenesis of human
motor as the ability to control the position of cen-tre of mass. Rehabilitace a fyzikální lékařství, 6(3), 84–85.
Vařeka, I., & Dvořák, R. (2001). The postural model of chain reaction in functional disorders at the lo-comotor system. Rehabilitace a fyzikální lékařství, 8(1), 33–37.
Vařeka, I., & Vařeková, R. (2003). The clinical typology of the foot. Rehabilitace a fyzikální lékařství, 10(3), 94–102.
Vařeka, I. (2003). The dynamic model of “tripod” foot support. Pohybové ústrojí, 10(3, 4), 193–198,233–239.
Vařeka, I. (2004). Subtalar joint pronation/eversion induced by knee flexion in closed kinematic chain. Rehabilitace a fyzikální lékařství, 11(4), 163–168.
Vařeka, I., & Šiška, E. (2005). Laterality – the interdis-ciplinary problem. Československá psychologie, 49(3), 237–249.
Vařeka, I., & Vařeková, R. (2005). The pathokinesiol-ogy of the foot and functional ortheses. Rehabilitace a fyzikální lékařství, 12(4), 109–111.
Vařeka, I. (2006). Interpretation of the course of mo-tor development revisited – the newborn period and holokinetic stage. Rehabilitace a fyzikální lékařství, 13(2), 74–81.
Vařeka, I. (2006). Interpretation of the course of motor development revisited – from monokinetic stage up to toddler period. Rehabilitace a fyzikální lékařství, 13(2), 82–91.
Palacký University
Faculty of Physical Culture
tř. Míru 115
771 11 Olomouc
Czech Republic


Acta Univ. Palacki. Olomuc., Gymn. 2008, vol. 38, no. 1 43
THE SIGNIFICANCE OF SENSORIMOTOR RESPONSE COMPONENTSAND EMG SIGNALS DEPENDING ON STIMULI TYPE IN FENCING
Zbigniew Borysiuk
Faculty of Physical Education and Physiotherapy, Opole University of Technology, Opole, Poland
Submitted in January, 2008
The purpose of the present study was to examine reaction time, movement time (MT) and electromyography sig-nals under conditions of tactile, acoustic and visual stimulation. Two groups of subjects took part in the study – one consisting of advanced fencers (n = 12, average age 22.3) having practiced fencing for an average of 8.3 years; and the other consisting of novice fencers (n = 15, average age 14.8) having practiced fencing for an average of 2.8 years. The research tool applied in the study was an innovative system of surface electromyography with peripheral equip-ment that enabled participants’ reactions to tactile, audio and visual stimulation to be recorded. The system made it possible to record RT and MT separately. The subjects were exposed to forty five stimuli in a randomized manner for each type of stimulation. The tested fencers responded fastest to tactile stimuli, then to acoustic stimuli, and in a much slower way to visual stimuli (p < 0.01). The advanced fencers exhibited significantly lower values of RT, MT, and EMG in comparison with the novice fencers. Both groups exhibited a decrease in the EMG signal value during the tactile, acoustic and visual stimulation trials, supporting the hypothesis. A slight coincidence of EMG signal curves was also observed in the visual stimuli test. It can be concluded that visual perception lowers muscle tension in novice fencers (p < 0.050).
Keywords: Surface electromyography, fencing, reaction time, tactile stimuli.
INTRODUCTION
Apart from assessment of movement precision, an-other fundamental type of evaluation of motor behavior is measurement of sensor-motor responses, depending on the type of stimuli. It is assumed that an individu-al who processes information faster in the course of time is more efficient in many types of motor tasks. Reaction time (RT) and movement time (MT) are the basic measures (ms) of the speed of information proc-esses (Schmidt, 1991).
In terms of the training process one needs to take ac-count of the significance of the dominant stimuli charac-teristic of a particular sport, such as reactions to visual, tactile and acoustic stimuli (Czajkowski, 2001). Quick perception and prompt identification of acoustic stimuli play a significant role in athletic running events, swim-ming and skating (Starkes & Ericsson, 2003). Combat sports (such as fencing, boxing, and karate) feature a number of requirements as far as tactile and visual per-ception is concerned. In fencing in particular, apart from the obvious significance of reactions to visual stimuli, responses to the opponent’s blade strikes (so called iron sensing) are also vital. What is more, acoustic effects are also important to some extent in fencing, as the fencer’s step rhythm enables assessment of the distance between the contestants and determines the choice of footwork techniques (Lukovich, 1986).
RT can be defined as an interval between the appear-ance of a stimulus (e. g. visual stimulus) and the first bioelectrical muscle activity (Kelso, 1995). MT is an interval between the registered muscle activity and the completed movement. Thus it became necessary to de-sign a device that could examine RT and MT separately along with the EMG signal. As we know, most movement reactions in real sport are made in a repetitive sequence manner, and thus a system able to register such move-ments was developed. For this purpose, the threshold of electromyography signal detection was established. This was necessary as empirical studies indicated that subjects often tensed their muscles excessively before testing, which caused a failure in the registration system (Borysiuk, 2000).
Studies of responses to stimulation in sport have been carried out by Williams and Grant (1999) and Abernethy (1996), who suggest that the RT to (recep-tive tactile) stimulation falls between 90 and 130 ms, to acoustic stimuli from 20 to 50 ms, and to light signals from 180 to 200 ms. Earlier studies examining different kinds of fencers’ RT reached similar conclusions (Tyszler & Tyszler, 1995), and also there was also a finding that advanced athletes displayed a considerably shorter RT in their responses to visual stimuli. The Borysiuk’s and Zmarzly’s (2005) study of physically active students using the surface electromyography (sEMG) system showed that RT to tactile stimuli (RTT) was about

44 Acta Univ. Palacki. Olomuc., Gymn. 2008, vol. 38, no. 1
20 ms shorter than RT to acoustic stimuli (RTA), and about 80 ms shorter in RT to visual stimuli (RTV). An innovative system of information registration was used in this research, in conjunction with sEMG (De Luca, 1997). This new approach was motivated by the need to separate data about information processes taking place in the central nervous system (RT), from the movement itself (MT).
The following research questions were formulated: 1. Does the type of stimulation influence RT, MT and
EMG signal values in advanced and novice fenc-ers?
2. How significantly do the parameters of information processes differ in advanced and novice fencers?
The adopted hypothesis predicted that the RT, MT and EMG parameters differed considerably depending on the type of stimulation, and that they were signifi-cantly reduced in the advanced fencers.
Thanks to application of the beginner expert para-digm, certain proposals can be suggested to fencers. The differences in RT, MT and EMG can serve as a database for development of motor habits, understood as sensor-motor responses to tactile, acoustic and visual stimuli.
METHODS
Participants The participants were divided into two groups. The
group of advanced fencers (n = 12, mean age 22.3) con-sisted of athletes who had been actively practicing fenc-ing for a mean of 8.3 years. The group of novice fencers (n = 15, mean age 14.8) consisted of athletes who had been practicing fencing for a mean of 2.8 years.
The study was preceded by numerous piloting stud-ies, which made it possible to choose the most optimal methods of measurement. The range and methodol-ogy of the experiment gained the approval of the lead
author’s institute’s Bioethics commission of scientific research (13. 4. 2006).
Instrumentation From the standpoint of physical culture sciences, i. e.
muscle physiology and psychomotor reactions, the sys-tem of surface electromyography (sEMG) seems to be the most useful. Following De Luca (1997) three types of sEMG application can be distinguished:– establishment of the muscle activation time, i. e. the
start and finish of muscle stimulation,– assessment of muscle strength,– establishment of the muscle fatigue index through
analysis of the spectrum of signal frequency.
The first use of sEMG, i. e. setting the muscle acti-vation time, can be also employed in diagnostics of in-formation processes. This innovative application would necessitate a separate analysis of parameters of informa-tion processes in the central nervous system, interpreted as reaction time (RT) and movement time (MT). RT is the interval between the occurrence of the stimulus (e. g. visual) and the first bioelectrical activity of the muscle. MT is the interval between the registered muscle activity and the completion of movement. It would be necessary to design a device capable of calculating these param-eters as well as the value of muscle activation (µV).
Measurement systemThe measurement system consists of the analogue
and digital parts (Borysiuk & Zmarzly, 2006). Fig. 1 presents the respective flow chart. The analogue part allows pre-amplification and filtering of the EMG signal. The signal is then digitalized and transmitted to the microprocessor. The microprocessor input is equipped with the switching circuit (buttons). The applied soft-ware allows synchronizing measurement samples, digital prefiltering and generation of data transfer protocol. The data is transferred with the aid of USB 2.0 (Universal
Fig. 1 Flow chart of the measurement system

Acta Univ. Palacki. Olomuc., Gymn. 2008, vol. 38, no. 1 45
Serial Bus). The digital signal representing the EMG voltage is sent to the PC. The software allows detection of the latency time, motor reaction time and synchro-nization with the visual impulses. Moreover, the PC collects data and studied parameters and the subject’s characteristics and places them into a database.
PC softwareThe software consists of modules responsible for
data acquisition, signal processing, setting the signal pa-rameters and visualization and storage of measurement results. The data transfer module ensures the transfer of synchronic data representing the measured EMG signal. The data is processed, digitally filtered and buff-ered. A respective module determines the measurement sequence consisting of cyclic light impulses in a specific color. The number of impulses and intervals between them can be regulated in a wide spectrum. There is a possibility of random timing. Furthermore, the se-quence may include interfering impulses in different colors and quantity. On the basis of the time difference between the occurrence of the light impulse in a specific color and the signal of muscle activation, the motor reaction time and latency time are detected. The time course of the EMG signal, respective time intervals and the voltage range during reaction are visualized during measurement. At the same time respective character-istics are being generated. After the measurement the results can be stored in a database or saved as graphic files (JPG).
Testing station with peripheral devices The testing station consists of a PC and an electro-
myograph connected to two pairs of electrodes and the reference electrode through binary outlets. The electro-myograph is operated from the control panel. Since the computer screen can emit only visual stimuli the testing station was also equipped with a loudspeaker emitting acoustic signals and an electromagnet generating tactile stimuli (Fig. 2).
Fig. 2 The subject is waiting for a tactile signal (an electromag-net bolt hits against the palm)
Procedures The participants responded to singular tactile, acous-
tic and visual stimuli. Their responses were recorded as simple reactions classified into different types. During the study three test trials were carried out in which the sEMG system emitted 45 tactile, acoustic and visual stimuli. The three trials were separated by two ten minute breaks, where were used to avoid sensor-motor facilitation and thus to obtain more objective results. RT, MT and EMG were registered in all trials: 1. In the tactile stimuli test a computer assisted electro-
magnet was used. The electromagnet bolt was placed in the plate on which the subject’s palm of his/her dominant hand rested. After the bolt hit against the palm, the subject pressed the button with his/her fingers, covering a distance of 35 mm.
2. The acoustic signal was emitted by a speaker con-nected to the EMG apparatus. The subject pressed the panel button following each stimulus in the same way as in the tactile stimuli test.
3. The visual stimulus was displayed on the computer screen as a red circle taking up about a quarter of the screen. Immediately after noticing the signal the participants had to press the button in the same way as in the previous tests.
In all the trials, time intervals in stimuli emission were set at random between 1 and 5 seconds (Fig. 3).
Statistical analysis The conformity of results with the normal distribu-
tion was examined. Friedman’s ANOVA was chosen as a nonparametric test as this criterion was not satisfied. A t-test for dependent variables was chosen for the anal-ysis of the subjects’ internal structure. The inter group analysis results were represented graphically by way of unweighted means.
RESULTS The system registered RT, MT and EMG to tac-
tile stimuli (RTT, MTT, EMGT); acoustic stimuli (RTA, MTA, EMGA) and visual stimuli (RTV, MTV, EMGV).
Advanced fencers The collected data confirmed the assumption that
the fencers achieved the best results in reaction to tac-tile stimuli by reducing RT for about 21 ms in their re-sponses to acoustic stimuli and 75 ms in their responses to visual stimuli (TABLE 1).
The t-test for dependent variables confirmed signifi-cant differences between the three indices of reaction time: RTV v. RTT (p < 0.001), RTV v. RTA (p < 0.001) and RTT v. RTA (p < 0.021). There were no significant

46 Acta Univ. Palacki. Olomuc., Gymn. 2008, vol. 38, no. 1
Fig. 3EMG signal curve with RT and MT marked values
differences in the MT parameters between 214 and 221 ms. The level of statistical significance for MT of the three kinds of stimulation amounted to MTV v. MTT (p < 0.819), MTT v. MTA (p < 0.698), MTA v. MTV (p < 0.601), respectively. The obtained results were similar as the subjects had to cover the same distance (35 mm) using their fingers. The significant time differ-ences in RT in the three trials had no influence on MT fluctuation.
The collected data point to a significant variability of EMG parameters (TABLE 2). The highest values concerned the differences between EMGA and EMGV (p < 0.002) and between EMGT and EMGV (p < 0.003). As far as the differences in EMG signals to tactile stimuli and acoustic stimuli are concerned, the level of signifi-cance was p < 0.048. The results showed that the tactile and acoustic stimulation caused a lower EMG signal. They indicate that the participants’ response to visual signals causes a decrease of muscle tension without ef-fective RT reduction.
TABLE 1Variability indicators of RT, MT depending on the type of stimuli with advanced fencers
Variable Average
rank Sum
of ranks Average
Standarddeviation
RTT 1.250 15.000 125.250 24.110
MTT 4.833 58.000 219.833 33.108
RTA 2.1667 26.000 146.166 29.941
MTA 4.250 51.000 213.666 52.908
RTV 3.416 41.000 200.166 28.856
MTV 5.083 61.000 220.833 20.818
TABLE 2Variability of EMG signal on tactile, acoustic and visual stimulation with advanced fencers
Variable Average
rank Sum
of ranks Average
Standarddeviation
EMGT 2.750 33.000 716.833 196.081
EMGA 2.000 24.000 585.167 52.958
EMGV 1.250 15.000 512.333 61.705
Novice fencers The collected data confirmed the assumption that in
reactions to different stimuli novice fencers achieved the best (the lowest) RT values, ie: RTT, RTA and RTV. The following differences were noted: RTV v. RTT (p < 0.001) and RTV v. RTA (p < 0.001). There were no significant differences between RTA and RTT (p < 0.378). An anal-ysis of mutual dependencies for MT did not show any significant differences in particular trials (TABLE 3).
TABLE 3Variability indicators of RT, MT depending on the type of stimuli with novice fencers
Variable Average
rank Sum
of ranks Average
Standarddeviation
RTT 1.733 26.000 149.067 28.255
MTT 4.400 66.000 225.733 31.263
RTA 1.600 24.000 164.267 45.731
MTA 3.533 53.000 217.333 55.068
RTV 5.467 82.000 243.733 42.568
MTV 4.267 64.000 232.067 51.149

Acta Univ. Palacki. Olomuc., Gymn. 2008, vol. 38, no. 1 47
Significant differences were noted in the value of the EMG signal for the three kinds of stimulation. A similar decrease in the EMG signal value was noticed in the novice fencers as well as in the advanced fenc-ers (TABLE 4). Bioelectrical muscle tension expressed by a decreasing EMG value displayed a linear tenden-cy: EMGT v. EMGA (p < 0.001), EMGT v. EMGV (p < 0.001) and EMGA v. EMGV (p < 0.004).
TABLE 4Variability of EMG signal on tactile, acoustic and visual stimulation with novice fencers
Variable Average
rank Sum
of ranks Average
Standarddeviation
EMGT 2.933 44.000 904.600 153.677
EMGA 1.867 28.000 763.667 99.139
EMGV 1.200 18.000 603.600 142.931
EMG – electromyography EMGA – electromyography acoustic EMGT – electromyography tactile EMGV – electromyography visual MT – movement time MTA – movement time acoustic MTT – movement time tactile MTV – movement time visual RT – reaction time RTA – reaction time acoustic RTT – reaction time tactile RTV – reaction time visual
Comparative analysis of parameters of different kinds of stimulation for advanced and novice fencers using a t-test with a separate variance assessment
In the cases of each of these three kinds of stimula-tion one can observe significant RT differences as far as tactile (p < 0.029) and visual (p < 0.057) indices be-tween the tested groups were concerned. It is vital that the greatest differences concerned most RT to tactile stimuli; slight differences were recorded in responses to acoustic stimuli (p < 0.249). A characteristic tendency is the lack of significant differences concerning MT in the three trials. This suggests that novice athletes may compensate for delays in processing sensual informa-tion (expressed by RT) with their speed of movement (expressed by MT) (Fig. 4).
Both groups featured an expected drop in the EMG signal value in the tactile stimuli trial, acoustic stimuli trial and visual stimulation trial. A slight coincidence of EMG signal curves could also be observed in the visual stimuli test. This may suggest that visual perception lowers the novice fencers’ muscle tension (p < 0.050) (Fig. 5).
DISCUSSION
The research was aimed at estimation of reaction time (RT) and movement time (MT) in fencing. Ac-cording to fencing experts, some elite fencers feature instant RT and MT. There are, however, some elite fenc-ers whose pace of information processing is very fast, but the performance of their movements is relatively slow albeit accurate (Lukovich, 2003). The study used three types of stimulation (tactile, acoustic, visual) con-sidering the fact that success in fencing, unlike in many other combat sports, depends on the time of response to these three types of stimulation. An innovative EMG system not only allowed registration of muscle tone dur-ing the tests but also registration of information from any number of repeated movements.
The authors used experiments – considering the spe-cificity of fencing responses – measuring simple reaction time. It was assumed that a number of motor habits in sport would appear in the form of single sensor-mo-tor responses (Poulton, 1957), (Czajkowski, 2005). For instance, a simple reaction can be a response with a trained movement to a known stimulus. In fencing, simple reaction takes place when a fencer responds with a thrust or a parry to a familiar stimulus (coach’s signal) (Borysiuk, 2006). What is unknown is when exactly the coach would make the movement. This model of simple reaction is the basis of one of the most widely applied training methods in combat sports, i. e. exercising a giv-en action in response to the coach’s signal (Salczenko, 1980). That is why the stimuli in the present study were emitted at random in the range between 1 and 5 sec-onds.
The analysis of the study results confirmed the initial hypothesis about different reaction times, depending on the type of stimulation (Kandel et al., 2000). The re-sponses to tactile and acoustic stimuli were significantly faster than responses to visual stimuli. These differences were associated with neuronal transduction. It is com-monly asserted that reaction to visual stimuli is associ-ated with a considerable number of synaptic links with the retina. It can be assumed that significantly faster reactions to tactile stimuli are due to the large concen-tration of receptors in the finger pad (about 2000) as well as due to the system of conduction of impulses and the speed of stimulation of cortical areas of somatic sen-sation (Enoka, 2002). Finally, the efficiency of the audi-tory system depends on the receptors in the spiral organ of the middle ear cochlea. The impulses are conducted by sensory neurons in the auditory canal to the temporal lodes of cerebral cortex. According to Welford (1980) acoustic stimuli cover this distance in 10–15 ms.

48 Acta Univ. Palacki. Olomuc., Gymn. 2008, vol. 38, no. 1
Fig. 4 RT and MT profiles as dependent variables for advanced and novice fencers
Fig. 5 EMG signal profiles as dependent variables for advanced and novice fencers
The obtained results are in accordance with the re-sults of Abernethy, Woods and Parks (1999) of their study of athletes. However, they are slightly different from the data of Welford (1986) and Luce (1986), who studied young people featuring an average level of physi-cal activity. According to their findings, RT to acoustic
stimuli amounted from 140 to 160 ms, and it was shorter from 20 to 40 ms in comparison with responses to tac-tile stimuli. The aforementioned differences indicate that fencing training affects the speed of information processing in each kind of stimulation. At the same time, the use of a fencing weapon had a decisive influ-

Acta Univ. Palacki. Olomuc., Gymn. 2008, vol. 38, no. 1 49
ence on the improvement of reactions to tactile stimuli, which is of crucial significance in fencing.
The reaction time profiles of novice and expert fenc-ers revealed significant differences in RT to acoustic, tac-tile and visual stimuli. Characteristically, the reactions to acoustic stimuli revealed no significant differences. One may, therefore, conclude that reactions to tactile and visual stimuli can be effectively exercised. A similar tendency was observed in movement times of sensor-mo-tor reactions to the three types of stimuli. It shows that one’s predispositions to perform fast movements appear at the early stages of training and can be further devel-oped only to a limited extent. It can be claimed that the type of stimulation, as opposed to reaction time (RT), does not significantly affect the variability of movement time (MT) parameters. The greatest differences between RT and MT, between experts and beginners, were, how-ever, noted in reactions to visual stimuli. This shows that fencing training greatly reduces the information processing time in reaction to visual stimulation. A long term fencing training program, held under conditions of permanent time shortage, greatly affects the speed of the constitutive information processes (identification of stimuli, choice of response and reaction program-ming) as attributes of the decision making speed. The effectiveness of the information processing speed is re-lated to the development of cognitive processes such as analysis of initial signals, concentration and divisibility of attention. The advanced fencers’ ability to produce a fast reaction conditions the feeling of pace, which is an important part of fencing shock tactics.
Significant differences were observed between EMG values, which were much higher in the novice fencers in their reactions to tactile, acoustic and visual stimuli. Thus, the higher capacity of expert fencers reduces the tension of muscles involved in performance of the test. This relationship has been confirmed by many com-bat sports experts, e. g. Czajkowski (2005), Sadowski (1999).
The tactile system delivers information gathered in tactile receptors (Meisner’s and Rusffini corpuscles). Once the stimulation strength exceeds the threshold of activation of sensory nerves, the signals are activated and transmitted directly to the brain. In combat sports tac-tile perception plays a very important role next to visual perception. Eastern martial arts, boxing and fencing are contact sports in which the feedback about the strength and type of tactile stimuli determines the fighter’s choice of sensor-motor responses. What is characteristic of the historical development of fencing technique is the fact that even the most basic fencing movements, includ-ing thrusts, in all kinds of fencing weapons, commence with the contact between the master’s and student’s blades. The master’s release is a signal for action. Also acoustic stimulation is crucial for cognitive processes
in fencing as anticipatory perception of other stimuli. Acoustic information consists of such components as perception of the rhythm of movements, their frequency, timing and sound pitch and amplitude. The importance of hearing in sports involving artistic expression has been widely discussed in literature. In fencing (Szabo, 1977), (Czajkowski, 2001) footwork training is based on the feeling of rhythm relative to the concept of fencing pace. Losing the proper rhythm during offensive actions in the use of conventional weapons (saber, foil) usually ends in relinquishing the right of way and exposes fenc-ers to defeat in particular bouts.
Visual perception serves as a framework for sound signals. In other words, visual memory is like a map demonstrating auditory expression relative to motor proprioception. It can be concluded that visual infor-mation is complementary information in the process of making and adjusting decisions (Evangelista, 2000; Lukovich, 2003).
CONCLUSION
1. Assuming that a study of sport mastery development for several years from the novice to the master level is not practically feasible in longitudinal research, an informative beginner expert paradigm was adopted (Schack, 2003).
2. The obtained results confirm other reports concern-ing fast processing of tactile and acoustic informa-tion as opposed to visual information in athletes and sedentary and moderately physically active students (Starkes & Ericsson, 2003).
3. The research shows that novice and expert fencers differ significantly in their times of sensor-motor re-sponses to tactile and visual stimulation. The expert fencers’ sensor-motor responses were significantly re-duced in reaction time (RT), whereas non significant differences were observed in movement time (MT). The acoustic stimuli did not display any variability. These results prove that fencing training consisting of the application of blade work (parries and binds) in individual sessions with a coach, affects the devel-opment of perception skills and processing of tactile stimuli. The greatest differences were observed in the processing of visual information, which was de-cisively faster in the expert fencers.
4. Important conclusions can be drawn concerning the EMG signal, which reveals lower bioelectrical tension in expert fencers’ muscles in the cases of these three types of stimulation. The expert fencers responded faster, however more economically and sensibly, with-out generating unnecessary bioelectric tension. The similarity between the tests and real fencing actions made the expert fencers reproduce the motor pat-terns in the tests almost automatically.

50 Acta Univ. Palacki. Olomuc., Gymn. 2008, vol. 38, no. 1
5. The present research reveals differences in the qual-ity, structure and organization of motor patterns in performing motor tasks among expert and novice fencers. These differences are associated with the formation of neuronal as well as central represen-tations. At a high sports level their organization is multi-hierarchical allowing for the effectiveness and repeatability of responses which are determined by the spatial and temporal aspects of movement or-ganization.
The research conclusions can be useful guidelines for coaches in their development of motor patterns during a long term perceptual training program, based on the concept of KR (knowledge of results) feedback which considers time as a variable affecting the organization of motor programs.
ACKNOWLEDGMENT
Thanks to Prof. Dariusz Zmarzly from the Laboratory of electrical engineering, automatic control and compu-ter science of Opole University of Technology for their great support and technical assistance.
REFERENCES
Abernethy, B. (1996). Training the visual-perceptual skills of athletes: Insights from the study of motor expertise. American Journal of Sports Medicine, 24, 589–592.
Abernethy, B., Wood, J. M., & Parks, S. (1999). Can the anticipatory skills of experts be learned by nov-ices? Research Quarterly for Exercise and Sport, 70, 313–318.
Borysiuk, Z. (2000). Factors determining sport perform-ance level for fencers at the preliminary and cham-pionship stages of their training. ECSS conference, Jyvaskyla.
Borysiuk, Z., & Zmarzly, D. (2005). Surface electromy-ography (sEMG) as a research tool of psychomotor reactions. Annales Universitatis Mariae Curie-Sklo-dowska, Lublin-Polonia.
Czajkowski, Z. (2001). Theory, practice and methodol-ogy in fencing. Advanced course for fencing coaches. Katowice: AWF.
Czajkowski, Z. (2005). Understanding fencing: Unity and practice. SKA Swordplay Books. NY: Staten Is-land.
De Luca, C. J. (1997). The use of surface electromyogra-phy in biomechanics. Journal of Applied Biomechan-ics, 13, 135–163.
De Luca, C. J. (2002). Surface electromyography: Detec-tion and recording. DelSys In.
Enoka, R. (2002). Neuromechanics of human movement (3rd ed.). Champaign, IL: Human Kinetics.
Evangelista, N. (2000). The inner game of fencing: Excel-lence in form, technique, strategy and spirit. Illinois: Master’s Press, Lincolnwood.
Kandel, E. R., Schwarz, J. H., & Jessell, T. M. (2000). Principles of neural science. New York: McGraw-Hill.
Kelso, J. (1995). Dynamic patterns: The self organization of brain behavior. Cambridge, MA: MIT Press.
Luce, R. D. (1986). Response times: Their role in inferring elementary mental organization. New York: Oxford University Press.
Lukovich, I. (1986). Fencing. Debrecen: Alfoldi Print-ing House.
Lukovich, I. (2003). Electric foil fencing: Advanced com-petitive training. Staten Island, NY: SKA Swordplay Books.
Poulton, E. C. (1957). On prediction in skilled move-ments. Psychological Bulletin, 54, 467–478.
Roberts, G. C. (1992). Motivation in sport and exercise. Champaign, IL: Human Kinetics.
Sadowski, J. (1999). Studies of selected elements of movement coordination in taekwondo athletes. Rocz. Nauk. IWFiS, 5, 37–40.
Salczenko, I. N. (1980). Dwigazjelnyje wzajmodijestwi-ja sportsmienow. Kijew: Zdorowje.
Sanders, A. F. (1998). Elements of human performance: Reaction processes and attention in human skill. Mahwah, NJ: Lawrence Erlbaum Associates.
Schack, T. (2003). High speed scanning in movement based memory: Experimental studies in free climbing. Journal of Sport & Exercise Psychology, 25, 116–117.
Schmidt, R. (1991). Motor learning and performance. Champaing, IL: Human Kinetics.
Schmidt, R., & Wrisberg, C. (2004). Motor learning and performance (3rd ed.). Champaign, IL: Human Ki-netics.
Starkes, J. L., & Ericsson, K. A. (2003). Expert perform-ance in sports. Champaign, IL: Human Kinetics.
Szabo, L. (1977). Fencing and the master. Budapest: Corvina Kiado.
Tyshler, D., & Tyshler, G. (1995). Fencing. Moscow: Physical Education and Science Press.
Welford, A. (1980). Motor skill and aging. In C. Nadeau, W. Halliwel, K. Newell, & G. Roberts (Eds.), Psychol-ogy of motor behavior in sport (pp. 253–268).
Welford, A. T. (1986). Choice reaction time: Basic concepts. In A. T. Welford (Ed.), Reaction times(pp. 73–128). New York: Academic Press.
Williams, A. M., & Grant, A. (1999). Training percep-tual skill in sport. International Journal of Sport Psy-chology, 30, 194–220.

Acta Univ. Palacki. Olomuc., Gymn. 2008, vol. 38, no. 1 51
VÝZNAM KOMPONENTŮSENZORIMOTORICKÉ RESPONZE
A EMG SIGNÁLŮV ZÁVISLOSTI NA TYPU STIMULŮ PŘI ŠERMU
(Souhrn anglického textu)
Cílem této studie bylo zkoumat reakční čas (RČ), pohybový čas (PČ) a elektromyografické signály za pod-mínek taktilní, akustické a vizuální stimulace. Studie se zúčastnily dvě skupiny osob – jedna zahrnovala pokro-čilé šermíře (n = 12, průměrný věk 22,3), kteří se šermu věnují průměrně 8,3 roku, druhá pak zahrnovala začí-nající šermíře (n = 15, průměrný věk 14,8), kteří se šer-mu věnují průměrně 2,8 roku. Výzkumným nástrojem užitým při této studii byl inovativní systém povrchové elektromyografie s periferním vybavením umožňujícím zaznamenat reakce účastníků na taktilní, akustickou a vizuální stimulaci. Systém umožňoval zaznamenávat zvlášť RČ a PČ. Účastníci byli vystaveni čtyřiceti pěti náhodně voleným stimulům pro každý typ stimulace. Testovaní šermíři reagovali nejrychleji na taktilní stimu-ly, dále na akustické stimuly a teprve mnohem pomaleji na stimuly vizuální (p < 0,01). Zkušenější šermíři vy-kazovali ve srovnání se začínajícími šermíři významně nižší hodnoty RČ, PČ a EMG. Obě skupiny vykazovaly při taktilních, akustických a vizuálních testech sníženou hodnotu signálu EMG, což podporuje hypotézu. Při vi-zuálním stimulačním testu byla také pozorována mírná shoda signálních křivek EMG. Lze formulovat závěr, že vizuální percepce snižuje u začínajících šermířů musku-lární napětí (p < 0,050).
Klíčová slova: povrchová elektromyografie, šerm, reakční čas, taktilní stimuly.
Dr. Zbigniew Borisiuk
Education and previous work experienceDoctor of physical education science, graduated the Academy of Physical Education in Warsaw; doctor’s dissertation at Academy of Physical Education in Kato-wice. Successfully links theory with practice as a coach of the National Polish fencing team. In 1993 he trained British fencers and gave lectures to instructors and coaches as a result of the agreement with the Scotish national fencing federation. His students have won the titles of the World Champion and European Champion of juniors. He conducted research in the human kinetics area and the influence of psychomotor factors on the effectiveness in combat sports. Member of European college of sport science and International association of sport kinetics. Close cooperation with Faculty of Hu-man Kinetics at Technical University of Lisbon. The author of tens papers in motor control field, coaching and methodology of fencing published in Polish and foreign magazines and books.First-line publicationsBorysiuk, Z. (2005). Analysis of changes in saber fenc-
ing after the introduction of electrical scoring ap-paratus. Human Movement, 6(2), 129–136.
Borysiuk, Z. (2006). Complex evaluation of fencers predisposition in three stages of sport development. Biology of Sport, 23(1), 41–55.
Borysiuk, Z. (2007). Time and spatial aspects of move-ment anticipation. Biology of Sport, 24(3), 285–295.
Borysiuk, Z. (2008). Psychomotor reactions and expert opinions as factors of talent identification in fenc-ing. In Book of abstracts: 1st International congress on science and technology in fencing (pp. 65–69). Barce-lona.
Opole University of Technology
Faculty of Physical Educationand Physiotherapy
ul. Prószkowska 76
45 758 Opole
Poland


Acta Univ. Palacki. Olomuc., Gymn. 2008, vol. 38, no. 1 53
LOAD INTENSITY IN VOLLEYBALL GAME LIKE DRILLS
Michal Lehnert, Pavel Stejskal, Pavel Háp, Miroslav Vavák*
Faculty of Physical Culture, Palacký University, Olomouc, Czech Republic*Faculty of Physical Education, Komenský University, Bratislava, Slovak Republic
Submitted in December, 2007
The key problem of training in sports games is rightfully considered the relation between match performance and training load (Argaj, 2005; Bloomfield, Fricker, & Fitch, 1992; Dobrý & Semiginovský, 1988; Laurenčík, 2006; Reilly & Bangsbo, 1998; Tomajko, 2000). The training process in volleyball must result from the typical demands of match load, the specificities of players’ specializations and their roles in the game system of a team, athletes’ individual spe-cificities and, at the same time, respect the trends of modern volleyball and the training process. Changing an intensive movement activity focused on performing specific tasks for particular game specializations during a relay lasting only a few seconds with relatively long time outs is regarded as a significant volleyball match load parameter (Aartrijk, 2000; Alberda, 1995; Baacke, 1994; Papageorgiou, 1999; Papegeorgiou & Timmer, 1990; Polglaze & Davson, 1992; Přidal & Zapletalová, 2003; Ureña, 2000; Zhang, 2000; Zimmermann, 1999).
Keywords: Heart rate, sports games, training control, training process.
In the current training process, complex game like drills and preparatory games requiring participation and the close cooperation of more players or the whole team respectively are preferred. Drills drawn in this way rep-resent adaptation stimuli of complex character, which lead to an increase in effectiveness and game like situ-ations’ solution stability and which can also contribute to fitness development and maintenance. Effective load manipulation requires a perfect understanding of the used training means, which primarily holds for “key” drills of particular training periods. As one of the most approachable and reliable physiological indicators of inner load, the heart rate is considered (Bouchard, Shep-hard, & Stephens, 1994; De Van, Lacy, Cortez-Cooper, & Tanaka, 2005; Jeukendrup & Van Diemen, 1998; Neu-mann, Pfücner, & Hottenrott, 2005; Pate, 1991; Süss, 2006).
We proceeded based on the above mentioned facts found as a result of our research, whose aim was to find out the level of load represented by verified preparatory games’ versions and if the load in two repetitions of the same type of a preparatory game is similar.
METHODS
During the 2 one week competition microcycles, we observed 6 players of the SKUP Olomouc men’s vol-leyball team (age 21.2 ± 1.6 years). Their resting heart rate (x = 49.0 ± 3.0 bpm) was measured by means of heart rate monitors before they entered their training
session. Using the Leger test (Multiple progressive shut-tle run test) (Kovář, 1990; Novosad, Lehnert, & Frömel, 1994) we determined the players’ maximum heart rate (x = 192.0 ± 6.5 bpm) one week before the preparatory games were included. During the observed training cy-cles the players took part in four training sessions with the content of the preparatory competitive game being 6 v. 6 – in the first week with rule modifications and in the second week it was done without the modifications. The games were recorded with a camera.
A preparatory competitive game, the relay, was start-ed with a serve by one of two specified players, who regularly took turns in serving and did not participate in the game further. After the relay was finished, the coach threw another ball to the passing side. After four relays were played, the front line players exchanged their positions with the back row players. The passing team thus attacked in the same position four times after the serve pass and four times after passing the tossed ball. The passing team is given the advantage of the first at-tack, therefore the opponent is awarded by 2 points for each relay won. The game was played according to the rules of volleyball – the set was won by the team which first scores 25 points, the intervals between sets lasted for 2 minutes. During the training sessions, 9 sets were played (the actual time, i. e. without intervals of rest be-tween sets, was 50 : 20 min. in the first measurement and 51 : 45 min. in the second measurement). The B prepara-tory game was played without rule modifications. The fifth one of 5 sets was played up to 15 points (the actual times were 66 : 45 min. and 62 : 30 min.). The tactics of

54 Acta Univ. Palacki. Olomuc., Gymn. 2008, vol. 38, no. 1
the attack combinations were the same and prearranged in both types of preparatory games.
The intensity of the inner load during the prepara-tory games was assessed by measuring the heart rate using “Polar Vantage” heart rate monitors (Terbizan, Dolezal, & Albano, 2002). To assess the load intensity, the actual playing time (the sum of the length of single sets and rest intervals between them) was measured. To formulate the intensity, we determined, by means of “Polar” software and video record the necessary. Infor-mation, which we entered into a set form onto which we recorded the number of attacks performed by particu-lar players during a set. Before the training session the players recorded every movement activity longer than 15 minutes (any high intensity movement activity was forbidden during the period under consideration). They expressed themselves as to their currently felt fatigue and about sleeping as well (Pivnička, 2002).
RESULTS AND DISCUSSION
The inner load during the first and second repeti-tion of the A preparatory game (TABLE 1) was evalu-ated through the use of average heart rate in the game (AHR) and maximal heart rate (HRmax) during the game. The average circulation load expressed in the per-centage of a maximal heart rate determined by the Leger test (% HRmax) was calculated as well. The values of AHR found in this way represented 83.1% or 81.1% of a maximal heart rate as determined by the Leger test. From the results it is clear that the differences in values of controlled parameters were neither logically nor sta-tistically significant. We can presume that typical volley-ball game patterns express the considerable stability of the team game load. Comparison of particular average and maximal heart rate values during exercises in par-ticular players enabled us to get data about differences in load caused by the realized exercises (TABLE 1). In
this respect we can state that there were considerable dif-ferences. Significant differences of AHR in the case of the first training session were found in players number 5 and 6, i. e. outside hitters (18 bpm and 13 bpm). The difference was above all caused by a higher number of hits during the first measurement, which results from these players’ offensive activity record and game record analysis.
Also in the B preparatory game AHR and HRmax values in the first and second measurements differed minimally and were neither statistically nor logically significant (TABLE 2). The measured AHR values represented 76.9% and 74.8% of HRmax. However, the interindividual variability between the first and second measurements was considerable (1.2–16.4 bpm) with the biggest difference in the no.1 (diagonal) player. From whence it follows, among others, that it is very questionable to evaluate exercise’s demandingness according to the HR average values of a whole team because individual circulation response and any particu-lar player’s game involvement can differ markedly. The video record shows that the differences in repetitions of training exercises in tested players were especially influenced by different game dynamics, the amount of activity participation, and other influences, which are typical for sports games and which can significantly modify the training load parameters.
In A and B preparatory games we counted the aver-age values of AHR and CL from the first and second ex-ercises and subsequently we compared the preparatory games (TABLE 3). With regard to the mentioned HR data we can state that the differences between the A and B preparatory games in AHR (12 bpm) and in ZC (7%) represent, in terms of load manipulation, a significant difference, whose statistical significance was confirmed in both cases (we also counted the values of the median which did not significantly differ from the arithmetic mean and therefore we consider these values to be char-acteristic enough).
TABLE 1Preparatory game A – average and maximal heart rate values of tested players and verification of difference in signifi-cance in two repetitions (n = 6)
IndicatorPlayer
x SD CL Z1 2 3 4 5 6
AHRM1 181 150 144 155 167 160 159.5 12.04 83.1
.00M2 178 155 149 155 149 147 155.5 10.52 81.1
HRmaxM1 192 166 168 169 186 178 176.5 9.76 92.0
.00M2 192 170 172 172 171 167 174.0 8.23 90.7
Legend:M1 – first measurement; M2 – second measurement; AHR – average heart rate; HRmax – maximal heart rate; x – average value of a parameter in tested group; SD – standard deviation; CL – circulation load in % of maximal heart rate determinated by Leger test; Z – Wilcoxon test criterion valueStatistically significant values (p < 0.05) are in bold characters.

Acta Univ. Palacki. Olomuc., Gymn. 2008, vol. 38, no. 1 55
TABLE 2Preparatory game B – average and maximal heart rate values of tested players and verification of these differences’ significance in two repetitions (n = 6)
IndicatorPlayer
x SD CL Z1 2 3 4 5 6
AHRM1 165 140 147 145 152 136 147.5 9.32 76.9
.41M2 149 141 142 151 149 129 143.5 7.48 74.8
HRmaxM1 182 155 169 162 178 156 167.0 10.33 87.1
.00M2 169 157 169 170 177 157 166.5 7.25 86.8
Legend:M1 – first measurement; M2 – second measurement; AHR – average heart rate; HRmax – maximal heart rate; x – average value of a parameter in tested group; SD – standard deviation; CL – circulation load in % of maximal heart rate determinated by Leger test; Z – Wilcoxon test criterion valueStatistically significant values (p < 0.05) are in bold characters.
TABLE 3Basic statistical characteristics of the parameters in view and verification of preparatory games A and B values in terms of the differences’ significance (n = 6)
Parameter Med x SD R Z
AHR I 154.5 157.7 11.46 33.12.04
AHR II 146.1 145.4 8.66 25.1
CL I 80.9 82.5 3.82 9.72.04
CL II 76.4 75.8 4.50 12.6
Legend:AHR I – average heart rate in A preparatory game; AHR II – average heart rate in B preparatory game; CL I – circulation load in % of maximal heart rate in preparatory game A; CL II – circulation load in % of maximal heart rate in preparatory game B; Med – median; x – arithmetic mean; SD – standard deviation; R – range; Z – values of sign test criterion Statistically significant values (p < 0.05) are in bold characters.
The cause of significant differences in load intensity was a different game content including a number of of-fensive and defensive actions realized by both teams. In some players we can assume that, based on quite high HR values, the A preparatory game stimulated anaerobic glycolysis and mobilized carbohydrate energy sources. Therefore it is obvious that break shortening and extension of load intervals during the preparatory game result in an increase of training efficiency, under the condition that there is also optimal recovery.
To complete the image of a circulation response to both types of preparatory games we can use the HR values’ distribution in particular zones (Fig. 1). While in the B preparatory game, the lower HR zones’ load dominated, the A preparatory game is represented dis-tinctively more in HR zones higher than 160 bpm. Also from this picture it is possible to assume that in light of the intensity of the inner load, the A and B preparatory games represented two completely different stimuli and that a relay extension due to an additional ball toss in the A preparatory game resulted in a significant increase of the circulation load.
To specify the data about differences in particular players we counted average HR values of the players from both repetitions of preparatory games A and B.
From TABLE 4 it is obvious that in all tested per-sons we found higher values of AHR and CL in the A preparatory game but the difference was considerably diverse. From the tested group the biggest difference was found in players 1 and 6 (diagonal player and out-side hitter). The video record shows that the difference was, in the first case, due to a higher participation of the diagonal player in offensive actions connected with locomotion to the attacking zone in back row positions. For a diagonal player it is the typical participation in offensive game combinations, which was emphasized in the preparatory game. Also in the case of an outside hitter, there was an expressive increase in the number of passes and net attacks. It is probable that due to a higher involvement of anaerobic glycolysis, this kind of load exhausts the player’s muscle glycogen more than in the preparatory game without a change of rules. Thanks to the increased requirements of the A preparatory game we can assume its higher training effect if conditions allow optimal recovery.

56 Acta Univ. Palacki. Olomuc., Gymn. 2008, vol. 38, no. 1
Fig. 1Average HR values distribution of the tested group in particular zones of preparatory games A and B
23
4.8
9.3 8.1
19.2
14.1
28.6
20.7 2122.4
13.614.5
4.5
10.3
0.83.1
0
5
10
15
20
25
30
t
110-120 120-130 130-140 140-150 150-160 160-170 170-180 180-190 190-200
heart rate zones (beats/min)
Type A game like drill Type B game like drill
Legend:t – drill time with average HR within particular HR zones (%)
TABLE 4Comparison of preparatory games A and B – average HR values and circulation load in individuals
Player pmm PG AHR (CL) SD /d/
1A 179.5 (89.5) 4.44
22.6B 157.2 (79.2) 8.51
2A 152.7 (81.7) 8.25
12.2B 140.5 (75.1) 3.26
3A 146.7 (79.9) 8.82
2.4B 144.3 (77.6) 3.55
4A 155.2 (84.3) 3.90
7.9B 147.8 (80.3) 4.12
5A 158.3 (80.0) 10.8
7.6B 150.7 (75.1) 4.80
6A 153.7 (79.8) 10.49
21.6B 132.1 (67.7) 4.70
Legend:PG – preparatory game; AHR – average heart rate; CL – corresponding value of circulation load in %; SD – standard deviation; d – dif-ference of values in preparatory games A and B
CONCLUSIONS
1. A comparison of average HR values and the load circulation of players in the first and second perform-ances of the verified types of volleyball preparatory games showed logically and statistically insignificant
difference in the inner load. However, the difference in particular players was distinctively diverse.
2. We found out that in the tested group the A prepara-tory game represented a stronger training stimulus in terms of inner load. The differences in the observed parameters were diverse in particular players.

Acta Univ. Palacki. Olomuc., Gymn. 2008, vol. 38, no. 1 57
3. The amount of load in both types of preparatory games, as well as the differences, is necessary to view in connection with the performance level of players, quality of their training habits, keeping to tactical instructions, the motivation of players and other in-fluences.
4. It was confirmed that the average HR values of the whole group do not give a proper view of the load of particular players and they can be a source of error in training control.
PRACTICAL RECOMMENDATIONS
In training process control we recommend to take into consideration possible differences between HR val-ues in a tested group and individuals.
Requirements of the drills for particular players can be significantly modified by a coach. In drills of this kind we recommend to intentionally regulate the play-ers’ participation, especially by setting tactical tasks and by the placing of or setting the difficultness of the ad-ditional balls. In this way we can prepare a background for creating game like situations of a particular type and perfection of solving the situations in compliance with the actual needs of the players and the team.
The complex character of the A preparatory game and the possibility of changing the game conditions enable its use not only for perfection of the technical-tactical aspects of game performance but also for the development of specific volleyball endurance. We rec-ommend including the A preparatory game during the preparatory period, especially in its second half. It is advisable to use it in stabilization and competition mi-crocycles (here it is necessary to decrease the volume and to take into account the location within a training microcycle according to an oncoming match).
ACKNOWLEDGMENT
This study was carried out within the research project granted by the Ministry of Education, Youth and Sports “Physical activity and inactivity of inhabitants of the Czech Republic in the context of behavioral changes, no: 6198959221”.
REFERENCES
Argaj, G. (2005). Analýza tréninkového a herného za-ťaženia při vybraných športových hrách. In Zborník vedeckých prác Katedry hier FTVŠ UK (pp. 65–68). Bratislava: Fakulta telesnej výchovy a športu, Občan-ské združenie Športové hry.
Aatrijk, S. (2000). The rally point system – entertain-ment and excitement. The Coach, 1, 12–13.
Alberda, J. (1995). Load in volleyball. In F. Dannen-mann (Ed.), Load in volleyball (pp. 11–33). Frank-furt/M.: DVV.
Baacke, H. (1994). The particular features of volleyball and consequences for training. International Volley-ball Technique, 2, 9–20.
Bloomfield, J., Fricker, P. A., & Fitch, D. (1992). Text-book of science and medicine in sport. Champaign, IL: Human Kinetics.
Bouchard, C., Shephard, R. J., & Stephens, T. (1994). The consensus statement. In C. Bouchard, R. J. Shephard, & T. Stephens (Eds.), Physical activity, fitness, and health: International proceedings and con-sensus statement (pp. 9–76). Champaign, IL: Human Kinetics.
De Van, A. E., Lacy, K., Cortez-Cooper, Y., & Tanaka, H. (2005). Post exercise palpation of pulse rates: Its applicability to habitual exercisers. Scandina-vian Journal of Medicine and Science in Sports, 15, 177–181.
Dobrý, L., & Semiginovský, B. (1988). Sportovní hry: výkon a trénink. Praha: Olympia.
Kovář, R. (1990). Vícestupňový člunkový běh na vzdále-nost 20 metrů. Teorie a praxe tělesné výchovy, 38(6), 350–358.
Laurenčík, T. (2006). Vnútorné zaťaženie hráčok vo-lejbalu v zápase a vo vybraných metodicko-organi-začných formách. In Zborník vedeckých prác Katedry hier FTVŠ UK (pp. 71–82). Bratislava: Fakulta te-lesnej výchovy a športu, Občanské združenie Špor-tové hry.
Neumann, G., Pfücner, A., & Hottenrott, K. (2005). Tré-nink pod kontrolou: Metody, kontrola a vyhodnocení vytrvalostního tréninku. Praha: Grada.
Novosad, J., Lehnert, M., & Frömel, K. (1994). Mo-difizierung des Ausdauerpendellaufes und deren Ausnutzung bei der Diagnostik der kardiorespirato-rischen Tüchtigkeit. Acta Universitatis Palackianae Olomucensis. Gymnica, 24, 35–40.
Papageorgiou, A. (1999). Training with the new rules. The Coach, 1, 13.
Papageorgiou, A., & Timmer, T. (1990). Laufhandlun-gen im Volleyball. Deutsche Volleyballzeitschrift, 5, 38–41.
Pate, R. R., Blair, S. N., Durstine, J. L., Eddy, D. O., Hanson, P., Painter, P., & Smith, L. N. (1991). Guide-lines for exercise testing and prescription. London: Lea and Febiger.
Polglaze, T., & Dawson, B. (1992). The physiological requirements of the positions in state league volley-ball. Sports Coach, 15, 32–37.
Přidal, V., & Zapletalová, L. (2003). Volejbal. Herný výkon – trénink – riadenie. Bratislava: Peter Maču-ra – PEEM.

58 Acta Univ. Palacki. Olomuc., Gymn. 2008, vol. 38, no. 1
Reilly, T., & Bangsbo, J. (1998). Anaerobic and aerobic training. In B. Elliot (Ed.), Training in sport (Apply-ing sport science) (pp. 351–409). Chichester: John Wiley and Sons.
Süss, V. (2006). Význam indikátorů herního výkonu pro řízení tréninkového procesu. Praha: Karolinum.
Terbizan, D. J., Dolezal, B. A., & Albano, C. (2002). Validity of seven commercially available heart rate monitors. Measurement in Physical Education and Exercise Science, 6(4), 243–247.
Tomajko, D. (1997). Pohybové hry. Habilitační práce, Univerzita Palackého, Fakulta tělesné kultury, Olo-mouc.
Ureña, A. (2000). Effect of the new scoring system on male volleyball. The Coach, 4, 12–18.
Zhang, R. (2000). How to profit by the new rules. The Coach, 1, 9–11.
Zimmermann, B. (1999). Changes and potential pos-sibilities with the introduction of liberos in men’s world class volleyball. The Coach, 1, 4–12.
INTENZITA ZATÍŽENÍ PŘI HERNÍCH CVIČENÍCH VE VOLEJBALU
(Souhrn anglického textu)
V současném tréninkovém procesu vyspělých druž-stev ve sportovních hrách jsou preferována tréninková cvičení komplexního charakteru vyžadující zapojení a úzkou spolupráci více hráčů. Předpokladem efektiv-ní manipulace se zatížením je dokonalé poznání pou-žívaných cvičení. Cílem provedeného sledování, jehož se zúčastnilo 6 hráčů seniorského volejbalového druž-stva (průměrný věk 21.2 ± 1.6 let) bylo zjistit, jaké za-tížení představují dvě ověřované varianty průpravných her a zda bude zatížení při dvou opakováních stejného typu průpravné hry podobné. Porovnání průměrných hodnot srdeční frekvence sledovaného souboru volejba-listů při prvním a druhém provedení ukázalo na věcně i statisticky nevýznamný rozdíl ve velikosti vnitřního zatížení. Rozdíly hodnot sledovaných charakteristik srdeční frekvence u jednotlivců však potvrdily vysokou intraindividuální variabilitu velikosti vnitřního zatíže-ní. Z porovnání průměrných hodnot srdeční frekvence a zatížení cirkulace u dvou typů průpravných her vy-plynulo, že z hlediska vnitřního zatížení představovaly odlišné tréninkové stimuly. Z výsledků studie vyplývá, že při manipulaci se zatížením ve volejbalu u herních cvičeních a průpravných her je vhodné považovat úda-je o průměrných hodnotách srdeční frekvence pouze za orientační.
Klíčová slova: řízení sportovního tréninku, sportovní hry, srdeční frekvence, tréninkový proces.
Doc. PaedDr. Michal Lehnert, Dr.
Education and previous work experience1980–1985 – Pedagogical Faculty, Palacký University: Physical Education – Biology. 1985–1986 – Pedagogical Faculty, Palacký University: PaedDr.1987–1991 – teacher at elementary school1991–2007 – Faculty of Physical Culture, Palacký Uni-versity: assistant Professor.1993–1997 – Faculty of Physical Culture, Palacký Uni-versity: Ph.D.Since 2008 – Faculty of Physical Culture, Palacký Uni-versity: Associate Professor.First-line publicationsLehnert, M., Novosad, J., & Neuls, F. (2001). Základy
sportovního tréninku I. Olomouc: Hanex.Lehnert, M., Janura, M., & Stromšík, P. (2003). The
jump serve of the best servers on the Czech national men’s volleyball team. International Journal of Vol-leyball Research, 6(1), 10–13.
Lehnert, M., Janura, M., Jakubec, A., Stejskal, P,. & Stelzer, J. (2007). Reaction of the volleyball play-ers to the training microcycle with an increased strength training volume. International Journal of Volleyball Research, 9(1), 11–18.
Palacký University
Faculty of Physical Culture
tř. Míru 115
771 11 Olomouc
Czech Republic

Acta Univ. Palacki. Olomuc., Gymn. 2008, vol. 38, no. 1 59
AN EXAMPLE OF AN E-LEARNING COMMUNITY FOR LIFELONG LEARNINGBY PHYSICAL EDUCATION TEACHERS
Matej Majerič, Milan Žvan, Marko Kolenc*
Faculty of Sport, University of Ljubljana, Ljubljana, Slovenia*Zavod IZZIV, Ljubljana, Slovenia
Submitted in January, 2008
The contemporary trends in the world and in the EU indicate an increase in the number of e-learning communi-ties. This paper presents an example of the first learning community in Slovenia in the field of practical pedagogical training for students, the “Sportfolio.si”.
The Faculty, sport students, professors, and the mentors at schools cooperate within the e-learning community and in this way interconnect “theory and practice”. Within the e-community and by using blogs (web logs), users can share “examples of the best practice” and therefore gain, develop, and share professional competencies in the field of physical education – they are proving the idea that “you can develop your own knowledge if you share it with others”.
These are also the trends in the EU which require teachers to continuously adopt new roles (competencies), and to change or abandon some of their earlier ones. Teachers must therefore permanently arrange for their own personal and professional development. With so called lifelong learning, teachers are becoming an important integral part of the “learning society” or the society of knowledge, which represents one of the fundamental goals of the European policies in the field of education and training to be achieved by the year 2010.
In the future, e-learning communities could provide an efficient source of support for the lifelong learning of physi-cal education teachers and promote the development of sport of all types and dimensions.
Keywords: Lifelong learning, knowledge management, acquisition and development of professional competencies, informa-tional communication technology, learning communities.
INTRODUCTION
Changes in the society force teachers to adopt some new roles (by acquiring new competencies) and to change or abandon some of the earlier ones (Key com-petencies, 2002; Lifelong learning programme, 2006).
A teacher should primarily instigate changes or en-courage learning also by looking after his/her own per-sonal and professional development. Therefore, in the context of lifelong learning, each teacher is becoming an important part of a “learning society” or so called society of knowledge, which has also been one of the fundamental goals of European policies on education and training (Bologna declaration, 1999; Lisbon strat-egy, 2000; Lifelong learning programme, 2006).
According to Razdevšek-Pučko (2004), the vision of lifelong learning and continuous professional develop-ment requires critical thinking of the teacher. Schon (1999) says that a teacher should principally be “com-petent in practice” and able to generate new findings through the inspection of his/her own activity. Some of the key parts in the process of a lifelong learning proc-ess are the use of modern informational technology, cooperation with, experts, parents and other teachers as well as being qualified to inspect, scrutinise and evalu-
ate one’s own work. These are also some of the roles, demanding of the teacher to be “open” to changes and motivated for lifelong learning and continuous profes-sional development.
One of the key findings of the key competencies anal-ysis from the year 2002 similarly suggests specific ways to fulfil the goals in the field of educational and train-ing systems by 2010 within the framework of Lisbon strategy, as set by the EU member nations. The authors of an analysis have emphasised that new social condi-tions (on the global, national, local and other levels) put teachers into new roles, which they can acquire only by constant training and development of their knowledge and new competencies. Authors have emphasised as key competencies: qualification for implementing new types of work in the classroom (use of suitable approaches according to the social, cultural and ethnical diversity of pupils; the organisation of an optimal and motivat-ing learning environment with the aim of simplifying or encouraging the learning process; teamwork with other teachers and experts, who participate in the educational process with the same pupils), qualification for accept-ing new roles outside of the classroom and with social partners (organisation and evaluation of educational work; cooperation with parents and other social part-

60 Acta Univ. Palacki. Olomuc., Gymn. 2008, vol. 38, no. 1
ners), qualification for developing new competencies and new knowledge in pupils (developing lifelong learn-ing habits of pupils in the society of knowledge – teach-ing them about learning), development of their own professionalism (research approach and direction in problem solving; the responsible management of one’s own professional development in a lifelong learning process) and the use of informational communication technology (ICT) in formal learning situations (in the classroom) and other professional work (when needed for professional development).
SUBJECT
Modern trends in the EU and the world show an increase in the number of e-learning communities (i. e. e-communities), which use open coded internet tools, such as blogs (e. g. Wordpress, Blogger etc.). Blogs (web logs) are more than just simple web pages; they are per-sonal internet diaries that allow the users to commu-nicate with the World Wide Web by publishing their articles, comments, video materials, pictures, presenta-tions and other links.
RIS analysis from 2006 states that nearly 100 mil-lion people around the world use blogs. Data from the same analysis also show that in 2006 approximately 75.000 internet users in Slovenia between the ages of 10 and 75 visited or used blog sites. Further develop-ment of blog sites in Slovenia should follow developed countries; meaning that in the next few years half of these populations will follow blogs and a tenth will also contribute to them. Forecasts show that the number of blog sites in Slovenia will exceed the number 100.000 in the next few years, whilst the changes of school system (e-education) can push this number even higher (RIS, 2006).
The majority of blog sites in the world are still de-signed to report about events, impressions and opinions from the bloggers’ personal lives. Gradually the use of blogs and e-communities, particularly at the universities, is spreading into the field of education (for example Princeton University, University of Minnesota, Cornell University, University of Massachusetts Lowell, The University of British Columbia). Examples have con-firmed that functions of blog sites could be transferred to education. Their networking could set up e-commu-nities that will allow the users to acquire, develop and exchange professional competencies (Majerič & Kolenc, 2005).
According to the strategic direction of most of the EU policies (Bologna reform, 1999; Lisbon strategy, 2000; Lifelong learning programme, 2006 etc.) it can be expected that the learning communities in the field of training and education will, in the context of setting-up a “society of knowledge”, in the future, acquire a leading
role in the area of lifelong learning. This is particularly true, as one of the main goals of training and education in the EU is for an individual to gain functional knowl-edge or specific professional competencies in the short-est time possible and to quickly enter the job market, where she/he can add to these competencies and add to his/her own “know how”. In a society of knowledge the “know how” represents the “trademark” of an individual, who can promote it on blog sites and thus achieve better mobility and flexibility in the employment process. Addi-tional functions (e. g. RSS) enable the establishment of individual blog networks, depending on the individual’s interests. It can be expected that blog sites will in the future also simplify the Europass, which is designed to increase the mobility of employment within the EU.
All these processes are also connected with the modernisation of educational systems. Various institu-tions (universities, faculties etc.), which educate and train human resources, will need to use their experts (teachers, researchers…) to introduce novelties and es-tablish a “living” knowledge that will suit the needs and demands of the users in the job market. E-communities with their good practice of “living knowledge” could be a good support system in addition to conventional types of education, as they will strengthen active partnership between “theory and practice”.
From the e-education point of view the e-communi-ties can be understood as a support system for lifelong learning and the development of professional competen-cies, which has been devised based on the open method of regulation and has been assigned by the European council in Lisbon (2000) as a “way to spread good prac-tice and fulfil strategic goals in the area of education and training within the EU until 2010” (Izobraževanje in usposabljanje v Evropi, 2002).
Fig. 1Example of e-community work
Exchange of information/knowledge
Exchange of information/knowledge
mentors at schools and Faculty of
sport students
students
children, youth and parents
practic
Use the intenrnet diary – blog- to save,write and publish information on pedagogical practice. You can also search, acquire and exchange
information and knowledge between students, mentors, Faculty of sport teachers and also
children and parents..
Exchange of information/knowledge

Acta Univ. Palacki. Olomuc., Gymn. 2008, vol. 38, no. 1 61
Fig. 2Homepage http://sportfolio.si
On the basis of listed starting points and consider-ing the modern trends and technological solutions for setting up of learning communities, which were enabled by open coded internet tools, the first learning commu-nity “sportfolio.si” in the area of practical pedagogical training of students in Slovenia has been created within the project “Model of practical pedagogical training of students at Faculty of Sport”, which is partly financed by the European social fund and the Ministry of educa-tion and sport.
As a starting point, changes that occur in teacher’s everyday work were used; these changes have been ac-celerated in the EU along with the process of the imple-mentation of strategic policies (Bologna reform, 1999; Lisbon strategy, 2000; Lifelong learning programme, 2006 etc.) with a goal of establishing a “society of knowledge”. The main aim was to improve the qual-ity and efficiency of systems of education and training of teachers and educators; furthermore, to promote lifelong learning and the development of competen-cies for a society of knowledge with the use of ICT. At the same time, goals and strategies of the University of Ljubljana for the period 2006–2009 (UL, 2006) have been considered.
The main goal of the pilot project “Sportfolio.si” was to establish a learning community of teachers at the Faculty of Sport, teachers – mentors and students in practical pedagogical training; a community that will strive for cooperation and a connection between “theory and practice”. Users can exchange “examples of good practice” (different experience, opinions of performed lessons, teaching plans, other materials etc.) inside the community with the help of blogs (internet diaries) and in this way acquire, develop and exchange professional competencies in the field of physical education. In this way the idea that knowledge can be developed by shar-
ing it with others can be realised. A creative commons licence, which is a global movement for the protection of author’s rights, was being used to protect author’s rights whilst respecting the national legislation.
METHODOLOGY
The project started in June 2006 with a pilot analysis (Majerič, Kovač, Strel, & Kolenc, 2006) that studied the conditions for the setting up of an e-community for the purpose of the practical pedagogical training of teach-ers – mentors and students. From June to September a model of an e-community has been designed; this model has been being developed since 2004 (Majerič & Kolenc, 2005). In December 2006, three months into the running of the project, a quantitative analysis of data usage in the e-community was carried out. In March 2007 the number of visits and data transfer in the e-community www.sportfolio.si was analysed (Ko-lenc, 2007).
Sample of measured teachers – mentors
A questionnaire was returned by 53 out of 62 teach-ers – mentors, representing 85.5% of all teachers – men-tors, included in the project. 49.1% of the measured subjects were men (N = 26) and 50.9% were women (N = 27), 45.3% worked in the primary schools (N = 24) and 54.7% (N = 29) worked in high schools. Of the measured subjects, 92.3% had university degrees and 35.8% had been working in education for more than 20 years, while the proportion of subjects working in education between 6 and 10 years was 20.8%, between 11 and 15 years was 17% and between 16 and 20 years was 18.9%, which findings are very similar. Of the teach-ers, 52.8% had the title of “adviser”, 32.1% had the title of “mentor”, 5.7% of them had the title of “higher ad-viser” and 9.4% of thems did not hold any title. Teach-ers – mentors had been participating in carrying out the practical pedagogical training of students for an average of 10.1 years and their weekly workload amounted to 21.4 hours per week.
Sample of measured students
In the academic year 2005/2006, 86 of 184 students in their final year at the Faculty of Sport, the Univer-sity of Ljubljana, were randomly interviewed. They were included in practical pedagogical training; the sample represents 48.28% of all students training to become physical education teachers in the above mentioned year; 51.72% of subject in the sample were men and 48.28% were women. The majority of students wished to find employment in primary or high school after finish-ing the Faculty of Sport (AV = 1.78 out of 3).

62 Acta Univ. Palacki. Olomuc., Gymn. 2008, vol. 38, no. 1
Sample of measured variables Sample of questions in the questionnaire for students
and teachers – mentors included:1. Opinion of teachers – mentors about the impor-
tance of different statements on the acquiring and exchange of knowledge, experience and competen-cies for professional development.
2. Opinion of teachers – mentors about the way they are prepared to share their knowledge, experience and competencies with others.
3. Opinion of teachers – mentors and students about the e-communities, which enable the development of professional competencies in the sense of lifelong learning.
4. Opinion of teachers – mentors and students about the benefits of acquiring and exchanging of profes-sional experiences, knowledge and competencies.
5. Opinions of teachers – mentors and students about their willingness to cooperate in the e-communi-ties, which will enable the acquiring and mutual ex-change of competencies between the teachers and students.
6. Opinions of teachers – mentors about their willing-ness to share learning materials with others and willingness of students to use e-communities in the academic year 2005/2006.
Data collection and analysisData were collected within the pilot analysis by
Majerič et al. (2006) in June 2006. The statistical SPSS for Windows package was used to analyse the data and calculate basic indicators of descriptive statistics. Da-ta about the working of the learning society (number of visits, quantity of transferred data, number of users, number of active bloggs) were collected with the use of the AWStats programme and the quantitative analysis of users on the website www.sportfolio.si.
RESULTS AND AN ANALYSIS
Pilot analysisIt has been found that teachers – mentors in the
acquiring and exchanging of knowledge, experience and competencies for professional development con-sider it particularly important to be able to acquire and exchange various professional information (av = 3.72 out of 4), new ideas for professional work (av = 3.51 out of 4) and answers to various professional problems (av = 3.38 out of 4) (TABLE 1).
It has been found that the majority of teachers – mentors are prepared to share their knowledge, expe-rience and competencies by answering the questions
TABLE 1Opinion of teachers – mentors about the importance of different statements on the acquiring and exchange of knowl-edge, experience and competencies for professional development
Answerav sd
By acquiring and exchanging of knowledge, experience and competencies:
I can acquire and exchange various professional information 3.72 0.45
I can acquire and exchange new ideas for professional work 3.51 0.54
I can acquire and exchange answers to various professional problems 3.38 0.69
I can acquire and exchange new business contacts 2.53 0.87
I can acquire and exchange social contacts 2.13 0.94
I can acquire and exchange business opportunities 1.96 0.96
Note:4 level measuring ladder was used, with 1 representing the least important and 4 the most important
TABLE 2Opinion of teachers – mentors about the way they are prepared to share their knowledge, experience and competen-cies with others
AnswerOver telephone
By answeringthe questions via email
By answering questionson internet forums
At workshopsor seminarsfor students
In e-communities
f % F % f % f % f %
Yes 18 33.96 47 88.68 33 62.26 37 69.81 43 81.13
No 31 58.49 4 7.55 18 33.96 14 26.42 8 15.09
N/A 4 7.55 2 3.77 2 3.77 2 3.77 2 3.77
Total 53 100.00 53 100.00 53 100.00 53 100.00 53 100.00

Acta Univ. Palacki. Olomuc., Gymn. 2008, vol. 38, no. 1 63
via email (88.68%) and e-communities (81.13%) and less in workshops or seminars for students (69.81%) and by answering questions on internet forums (62.26%). The smallest proportion of teachers is prepared to share their experience over the telephone (33.96%) (TABLE 2).
Of these teachers, 60.38% use the internet every day (electronic mail, web searches…) and 28.30% a few times per week. This proportion is even higher in stu-dents – 63.22% of students use internet every day and 32.18% of the interviewed subjects a few times per week (TABLE 3).
Of teachers – mentors (60.38%) and 83.91% of stu-dents are of the opinion that professional e-communi-ties, working in the internet environment and with the
help of web pages or various internet applications, en-able the solving of current professional questions, the access and exchange of different professional sources and also enable the development of professional compe-tencies in a sense of lifelong learning, which are useful and necessary for successful work (TABLE 4).
Of teachers – mentors (96.23%) as well as 98.85% of students are of the opinion that acquiring and ex-changing knowledge, experience and competencies is beneficial as they can acquire and exchange various pro-fessional information, new ideas for professional work, answers to various professional problems, business con-tacts, social contacts and new business opportunities (TABLE 5).
TABLE 3Opinions of teachers – mentors and students about the frequency of internet use (electronic mail, web searches etc.)
AnswerTeachers – mentors Students
f % f %
Every day 32 60.38 55 63.22
Few times per week 15 28.30 28 32.18
Few times per month 6 11.32 4 4.60
Total 53 100.00 87 100.00
TABLE 4Opinion of teachers – mentors and students about e-communities, which enable the development of professional competencies in the sense of lifelong learning
AnswerTeachers – mentors Students
f % f %
They are useful and necessary for successful work 32 60.38 73 83.91
They are not useful and do not contribute to successful working 2 3.77 4 4.60
Other: I do not know them, I do not use them, they do not exist, they are not required to progress, they are probably useful, they are useful
16 30.19 10 11.49
Missing answers 2 3.77 0 0.00
Total 53 100.00 87 100.00
TABLE 5Opinion of teachers – mentors and students about the benefits of the acquiring and exchanging of professional experi-ences, knowledge and competencies
AnswerTeachers – mentors Students
f % f %
In my opinion it is beneficial to acquire and exchange various professional information, new ideas for professional work, answers to various professional problems, business contacts, social contacts and new business opportunities
51 96.23 86 98.85
In my opinion it is not beneficial, as the increasing competition forces me to keep my experience, knowledge and competencies for myself
0 0.00 1 1.15
Other 2 3.77 0 0.00
Total 53 100.00 87 100.00

64 Acta Univ. Palacki. Olomuc., Gymn. 2008, vol. 38, no. 1
Of teachers – mentors (73.58%) as well as 88.51% of students are prepared to cooperate in e-communities of teachers and students, as they are interested in modern approaches to acquiring and exchanging of professional competencies (TABLE 6).
Of teachers – mentors (86.79%) are prepared to share their teaching plans and didactic materials (learn-ing papers, cards, posters, criteria and descriptions for evaluation, video materials…) with other teacher – men-tors and students within e-communities, which would operate based on the rules of respecting intellectual ownership and authors’ rights.
Of students, 88.51% answered that they would have used the e-communities in the previous academic year (2005/2006), if they had been available, as they are interested in modern approaches to acquiring and ex-changing of professional competencies (TABLE 7).
The knowledge of internet blogs was also analysed in order to set up e-communities. It has been found that the proportion of teachers – mentors with a knowledge of internet blogs is 37.74% and is similar to the pro-portion of teachers without the knowledge of internet blogs (39.62%). The proportion of students with knowl-edge of internet blogs is slightly higher (49.43%), com-pared to those without knowledge about internet blogs (39.08%).
Analysis of the running of the elearning community “Sportfolio.si” and an analysis of the number of visits and data transfer within the community
Fig. 1Review of visits on the web page of the learning society (September 2006 – March 2007)
0
2000
4000
6000
8000
10000
12000
sept okt nov dec jan feb mar
Source: Advanced Web Statistics
Until December 2006, 219 blogs were set up in the first learning community “Sportfolio.si” at the University of Ljubljana. Out of all the registered blogs, 50 belonged to teachers (out of 63 participating), 165 belonged to
TABLE 6Opinions of teachers – mentors and students about their willingness to cooperate in e-communities, which will enable the acquiring and mutual exchange of competencies between teachers and students
AnswerTeachers – mentors Students
f % f %
Yes, I am prepared to cooperate (I am interested in modern approaches to acquiring and exchanging of professional competencies)
39 73.58 77 88.51
No, I am not prepared to cooperate (I prefer traditional methods of acquiring and exchang-ing of professional competencies)
2 3.77 6 6.90
Other: shortage of time, overloading, partial cooperation until necessary, if it is necessary, clear rules, “open cards”
10 18.87 4 4.60
Missing answers 2 3.77 0 0.00
Total 53 100.00 87 100.00
TABLE 7Opinions of teachers – mentors about their willingness to share learning materials with others and willingness of students to use e-communities in the academic year 2005/2006, if they were available
AnswerTeachers – mentors Students
f % f %
Yes 46 86.79 77 88.51
No 5 9.43 6 6.90
Missing answers 2 3.77 4 4.60
Total 53 100.00 87 100.00

Acta Univ. Palacki. Olomuc., Gymn. 2008, vol. 38, no. 1 65
students (out of 184 participating), 3 belonged to teach-ers or assistant professors at the Faculty of sport (out of 7 participating) and one was a user support blog. In March 2007, 169 out of all the registered blogs were still active (36 belonged to teachers – mentors, 130 be-longed to students and 3 belonged to teachers at the Faculty of Sport). It has been found that 61 students used their blogs mainly to publish assignments and ICT materials; 69 students also wrote diaries of practical pedagogical training and published teaching plans and various suggestions for practice. 28 teachers – men-tors used their blogs to publish timetables and other information related to practical pedagogical training of students; 8 teachers regularly published various infor-mation. From September 2006 until March 2007 more than 1000 various contributions were already published (teaching plans, video materials, good practice exam-ples, other materials…). More than 9 GB of information and electronic contents were exchanged between the blogs and nearly 50.000 visits on the web page www.sportfolio.si were recorded.
FINDINGS
Data show that teachers – mentors in the process of acquiring and exchanging the knowledge, experi-ence and competencies for professional development consider as particularly important the possibility to ac-quire and exchange various professional informations, new ideas for professional work and answers to various professional problems.
Analysis shows that the majority of teachers – men-tors and students are prepared to cooperate in the e-community and share their knowledge, experience and competencies with others. They consider the e-commu-nities, which enable lifelong learning, useful and nec-essary for a successful work, as they can acquire and exchange various professional informations, new ideas for professional work and answers to various profes-sional problems. The majority of them were prepared to cooperate in the e-community and exchange within the community didactic materials (teaching papers, cards, posters, criteria and descriptions for evaluation, video materials…) and teaching plans and share them with other teachers – mentors and students. The majority of students stated that they would use the e-community in the academic year 2005/2006, if it was available, and that they have already used other internet tools for ex-changing information.
The findings have confirmed the assumptions that key factors exist for the establishing of a learning com-munity; therefore on the basis of the starting points of Majerič and Kolenc (2005), a model of learning com-munities for practical pedagogical training was set up,
similar to those at some foreign universities (Princeton University, University of Minnesota, Cornell University, University of Massachusetts Lowell, and The University of British Columbia). A fundamental starting point was that it has to be simple for users and that it supports the use of modern information communication technology. Therefore, internet blogs, which allow the users to keep a personal internet diary and to exchange various in-formation and knowledge (presentations, photos, video material, etc.), were used.
The application of a learning community in prac-tice and its use among the teachers and students shows very encouraging results. This means that in a very short time a support to the lifelong learning in the field of professional competencies was set up, which is based on the open method of regulation and has been assigned by the European Council in Lisbon (2000) as a “way to spread good practice and fulfil strategic goals in the area of education and training within the EU until 2010” (Izobraževanje in usposabljanje v Evropi, 2002). This also brought the setting up of a new culture of knowledge management, which is based on the idea that “one’s own knowledge (competencies) can be developed by sharing it with others”.
E-learning societies are one of the modern methods for professional and quality discussions between theory and practice. They work on the principle of self regula-tion. This means that the users have an opportunity to prevent the publishing of unsuitable contents with their own comments. In this way they can exclude us-ers that publish “dubious” contents and do not respect the rules of the learning community (author’s rights, etc.). Establishing an expertly critical self regulation of the users should be a challenge for the educational institutions, which they should use to form and shape professional culture and knowledge management. This results in a direct connection of “theory and practice” and brings new opportunities for a quality promotion of the profession. Therefore, educational institutions should be the main instigators and (expert) coordina-tors of e-learning communities.
The Faculty of Sport has, as the first at the Uni-versity of Ljubljana, set up an e-learning community, which allows students, assistant teachers and teachers in “practice” to exchange the knowledge, competencies and experience in the area of practical pedagogical train-ing. This enables them to quickly exchange the informa-tion and knowledge between the Faculty of Sport as a main “institution of knowledge” in the field of sport in Slovenia and the teachers in its partner schools. This approach enables them to fulfil strategic goals of the UL (2006–2009), as it encourages and develops a partnership between theory and practice, strengthens the community of teachers at the faculty, students and teachers in “practice” and provides support for lifelong learning.

66 Acta Univ. Palacki. Olomuc., Gymn. 2008, vol. 38, no. 1
It is planned, as a result of the acquired experience and encouraging results in the setting up and function-ing of the e-learning community “Sportfolio.si”, that several updates will be prepared for the academic year 2007/2008. This will facilitate additional possibilities for the users in the acquiring and exchanging of knowledge and competencies. It is also planned that new learning communities in the field of sport will be used, which will influence development of all aspects of sport.
The project “sportfolio.si” serves the University of Ljubljana as a good example of cooperation between theory and practice. A model of the Faculty of Sport can be quickly transferred to any faculty or university. A kind of inter sector cooperation and exchange of in-formation and knowledge between the faculties at any university or between the universities and cooperation between various sectors of the economy could be estab-lished. This also facilitates the fulfilling of strategic EU policies (Bologna declaration, 1999; Lisbon strategy, 2000; Lifelong learning programme, 2006, etc.) in the area of education and training and the establishing of a “knowledgeable society”.
REFERENCES Bolonjska deklaracija (1999). Ministrstvo za visoko šol-
stvo, znanost in tehnologijo. Retrieved 27. 3. 2007 from the World Wide Web: http://www.mvzt.gov.si/fileadmin/mvzt.gov.si/pageuploads/doc/dokumen-ti_visokosolstvo/Bolonjski_proces/bolonjska_dekla-racija.pdf
Izobraževanje in usposabljanje v Evropi: Različni si-stemi, skupni cilji za 2010 (2002). Delovni program o ciljih za prihodnost sistemov izobraževanja in uspo-sabljanja. Bruselj: Generalni direktorat za izobraže-vanje in kulturo, Evropska komisija.
Key competencies (2002). Brussels: Eurydice, European Unit.
Kolenc, M. (2007). Obisk na spletnem mestu Sportfolio.si, po 5ih mesecih strmo navzgor. Retrieved 27. 3. 2007 from the World Wide Web: http://klub.sportfolio.si/
Lizbonska strategija (2000). Retrieved 27. 3. 2007 from the World Wide Web: http://ue.eu.int/ueDocs/cms_Data/docs/pressData/en/ec/00100-r1.en0.htm
Majerič, M. (2006). Poročilo o izvajanju projekta v letu 2006. Ljubljana: Fakulteta za šport.
Majerič, M., & Kolenc, M. (2005). E-samoučeča skupnost na področju vzgoje in izobraževanja. In Z. Labernik & M. Varšek (Eds.), 10. mednarodna konferenca – MIRK 05: Zbornik povzetkov (pp. 40). Ljubljana: Ministrstvo za šolstvo in šport in drugi.
Majerič, M., Kovač, M., Strel, J., Kolenc, M., & Marke-lj, M. (2006). Pilotska analiza projekta. Projekt “Mo-del praktičnega pedagoškega usposabljanja študen-tov Fakultete za šport” [Pilot analysis of the project Model of practical pedagogical training of Faculty of Sport students – unpublished]. Neobjavljeno. Ljublja-na: Fakulteta za šport.
Pehan, V., & Vehovar, V. (2006). E-izobraževanje 2005/2006 – visokošolski in višješolski zavodi. Retrieved 27. 3. 2007 from the World Wide Web: http://www.ris.org/index.php?fl=2&lact=1&bid=1293&parent=13
Program vseživljenjskega učenja (2006). Uradni list Ev-ropske unije. Retrieved 27. 3. 2007 from the World Wide Web: http://eur-lex.europa.eu/LexUriServ/site/sl/oj/2006/l_327/l_32720061124sl00450068.pdf
Razdevšek-Pučko, C. (2004). What kind of teacher is needed (expected) in today’s (and tomorrow’s) school? Sodob. pedagog., 55, 52–74.
RIS (2007). Blogi v letu 2006. Retrieved 27. 3. 2007 from the World Wide Web: http://www.ris.org/index.php?fl=1&nt=9&p1=276&p2=285&p3=&id=1074&sid=457
Univerza v Ljubljani (2006). Strategija 2006–2009. Re-trieved 27. 3. 2007 from the World Wide Web: http://www.uni-lj.si/Univerza/StrategijaUL2006_2009.pdf
PŘÍKLAD E-LEARNINGOVÉ KOMUNITY1
V CELOŽIVOTNÍM VZDĚLÁVÁNÍ UČITELŮTĚLESNÉ VÝCHOVY
(Souhrn anglického textu)
Současné trendy ve světě i v EU vykazují zvyšující se počet skupin, vzdělávajících se prostřednictvím e-lear-ningu, tzv. e-learningových komunit. Tento příspěvek představuje první takovouto e-learningovou komunitu ve Slovinsku, a to v oblasti pedagogické praxe studen-tů – „Sportfolio.si“.
Pedagogové, studenti sportu, profesoři a mentoři na školách v rámci e-learningové komunity spolupracu-jí a propojují tak „teorii a praxi“. V rámci e-komunity a pomocí blogů (weblogů) mohou uživatelé sdílet pří-klady nejlepších postupů a získávat, rozvíjet a sdílet tak
1 Autoři zvolili pro překlad výrazu e-learning community výraz e-learningová komunita, ačkoliv v tomto případě nejde o komunitu v sociologickém pojetí, ale ve významu přeneseném, a to do prostředí internetu. E-learningovou komunitou je zde rozuměna sociální skupina (v sociologickém významu skupina osob, jejíž členy spojuje vzájemná komunikace, normy, vzájemná očekávání a společně vykonávaná činnost), která se prostřednictvím elektronické komunikace v rámci tzv. weblogu vzdělává, přičemž toto vzdělávání zahrnuje vzájemné sdílení nabytých poznatků a zkušeností.

Acta Univ. Palacki. Olomuc., Gymn. 2008, vol. 38, no. 1 67
profesní kompetence v oblasti tělesné výchovy. Potvrzují tak myšlenku, že „vlastní vědomosti lze rozvíjet tím, že je sdílíme s ostatními“.
Takové jsou rovněž trendy v EU, která od pedago-gů požaduje neustále přejímat nové role (kompetence) a měnit či opouštět některé role dřívější. Pedagogové se tudíž musí neustále starat o vlastní osobnostní a profes-ní rozvoj. Pomocí tzv. celoživotního vzdělávání se peda-gogové stávají nedílnou součástí „učící se společnosti“ neboli společnosti vědomostní, která představuje jeden ze zásadních cílů evropské politiky v oblasti výchovy a vzdělávání, kterého má být dosaženo do roku 2010.
V budoucnosti by e-learningové komunity moh-ly představovat účinnou oporu při celoživotním vzdě-lávání učitelů tělesné výchovy a podpořit rozvoj sportů všech typů a měřítek.
Klíčová slova: celoživotní vzdělávání, management znalostí, osvojování a rozvoj profesních kompetencí, informační a ko-munikační technologie, e-learningové komunikace.
Assist. prof. Matej Majerič, Ph.D.
Education and previous work experienceSince 1999 employed at the Department of Didactics of Physical Education in schools at the University of Ljubljana, Faculty of Sport. Completed his Ph.D. in 2004 at the Faculty of Sport with a dissertation the “Analysis of assessment models of sports knowledge in physical education”. Working on the modern approaches to life-
long learning experience and permanent expert training of teachers and professionals in sport, he is a head of the Department for permanent expert education at the Fac-ulty of Sport and a coordinator of practical pedagogical training of the students at the Faculty of Sport. In 2006 and 2007 he successfully completed a project “A model of practical pedagogical training of students at the Fac-ulty of Sport”, which has been in part financed by the EU European Social Fund and the Ministry of Education and Sport of Republic of Slovenia. Within the project, the first e-learning community “Sportfolio.si”, intended for the lifelong learning of teachers and students in Slov-enia, has been set up. “Sportfolio.si” is based on an open method of adjustment, which the European Council in Lisbon (2001) defined as a “way for expanding examples of good practice, which enables the fulfilment of strategic goals in the area of education and training in the EU until 2010”. He is a member of the Programme board for further education and training of professional workers in education in Republic of Slovenia.Scientific orientationRecently, he has been researching knowledge manage-ment and modern approaches to lifelong learning in the field of sport, as well as the exchange and development of knowledge in the “society of knowledge”.First-line publicationsMajerič, M., & Kolenc, M. (2005). E-self learning com-
munity in the field of education and training. Ljublja-na: Ministry of education and sport.
Majerič, M., & Kolenc, M. (2007). Sportfolio.si: Setting up an e-community for the development of profes-sional competencies and lifelong learning of physical education teachers. Šport, 55(2), 5–12.
Majerič, M., Žvan, M., & Kolenc, M. (2007). Sportfo-lio.si: E-learning community for lifelong learning of physical education teachers. In 4th FIEP European congress Physical education and sports: Teacher’s preparation and their employability in Europe: Book of abstracts (pp. 80). Bratislava: Comenius University, Faculty of Physical Education and Sport, Slovak Sci-entific Society for Physical Education and Sport.
University of Ljubljana
Faculty of Sport
Gortanova 22
1000 Ljubljana
Slovenia


Acta Univ. Palacki. Olomuc., Gymn. 2008, vol. 38, no. 1 69
INSTRUCTIONS FOR MANUSCRIPT POKYNY PRO PŘÍPRAVU RUKOPISU
The Acta Universitatis Palackianae Olomucensis. Gymnica is an independent professional journal. The con tent of the magazine is focused on presentation of research notifications and theoretical studies connected with the prob lems of kinanthropology. The Editorial Board is look ing forward to all manuscripts written on the above subject.
General instructions
Acta Universitatis Palackianae Olomucensis. Gym ni ca je nezávis-lý odborný časopis. Svým obsahem je za mě řen na prezentaci původních výzkumných sdělení a teoretických studií, které se vztahují k vědecké problematice ki nan tro po lo gie. Redakce vítá všechny rukopisy zpracované v tomto duchu.
Obecné pokyny
The text of the contribution is in English. The con tribution is not to exceed a maximum limit of 15 pages (including tables, pictures, summaries and appendices). A summary will be in the Czech language, and by rule 1 page at the most.
The text is to be presented in MS Word editor and also as a printout.
All contributions are reviewed anonymously.
Interface of the contribution
Title of the contribution, name(s) of its author(s), workplace, date of handing in the contribution, summary of the text in English, key words.
Text of the contribution
Names of individual chapters are to be written in capital letter from the left margin. References to quoted authors see a brief from the publication manual http://www.gymnica.upol.cz.
Epilogue of the contribution
A reference summary (see a brief from the publication manual http://www.gymnica.upol.cz), address of the main author, sum-mary including the key words.
Tables, pictures, graphs, appendices
To be written on separate pages. A table is to be marked as TABLE 1 with its name below, write on the left margin above the table (the same applies for appendices). A picture is to be marked as Fig. 1, write from the left above the picture (the same applies for a graph).
All contributions to Acta UPO Gymnica must have been cor-rected by an English expert before being submitted to us. Please enclose an official confirmation of this correction. If possible we would appreciate the text in the original language.
We look forward to our further cooperation!
Doc. PhDr. Vlasta Karásková, CSc. Executive Editor
Doc. MUDr. Pavel Stejskal, CSc. Chairman of the Editorial Board
Address: Palacký University Faculty of Physical Culture tř. Míru 115 771 11 Olomouc Czech Republic
Phone: +420 585 636 357 E-mail: [email protected]
Text příspěvku v jazyce českém odevzdejte laskavě výkonné-mu redaktorovi. Na základě doporučující recenze upraví autor příspěvek k publikaci.
Text příspěvku je v jazyce anglickém. Rozsah příspěvku je max. 15 stran (včetně tabulek, obrázků, souhrnu a pří loh). Souhrn je v jazyce českém (max. 1 strana).
Odevzdává se text v editoru Word a 1 výtisk textu.Všechny příspěvky jsou anonymně recenzovány.
Úvod příspěvku
Název příspěvku, plná jména autorů, pracoviště, datum ode-vzdání příspěvku, krátký souhrn textu, klíčová slova.
Text příspěvku
Názvy jednotlivých kapitol velkými písmeny píšeme zle va. Od-kazy jen na autory a publikace, uvedené v referenčním se zna mu.
Závěr příspěvku
Referenční seznam, adresa hlavního autora, souhrn v češtině, včetně názvu a klíčových slov.
Tabulky, obrázky, grafy, přílohy
Píšeme na samostatné stránky. Tabulku označíme TABLE 1, obrázek nebo graf Fig. 1, přílohu Appendix 1. Název je pod označením, píšeme zleva.
Všechny příspěvky musí být před odevzdáním opra ve ny znalcem anglického jazyka (nejlépe rodilým mluvčím). Pro ve de-ní korektury je nutno doložit oficiálním po tvr ze ním. Příspěvek je třeba odevzdat taktéž v originální ja zy ko vé ver zi.
Děkujeme Vám za spolupráci.
Doc. PhDr. Vlasta Karásková, CSc. výkonný redaktor
Doc. MUDr. Pavel Stejskal, CSc. vědecký redaktor Adresa: Univerzita Palackého Fakulta tělesné kultury tř. Míru 115 771 11 Olomouc
Telefon: 585 636 357E-mail: [email protected]

ACTAUNIVERSITATIS PALACKIANAE OLOMUCENSIS
GYMNICA
Vol. 38 No. 1
Published by Palacký University, Olomouc 2008
Preparation and arrangement before print: Mgr. Zuzana Hanelová & Iva TezzelováTechnical Editor and graphic arrangement: Jitka Bednaříková
Published quarterlyMK ČR E12792
Electronic form available on address: http://www.gymnica.upol.cz
ISSN 1212-1185