Technical Information Oil and Gas Sector Significant Stationary Sources of NOx Emissions Final
Upload
truongduongCategory
view
226download
0
EPA-453/R-93-007
Alternative ControlTechniques Document—
NO Emissions from Stationaryx
Gas Turbines
Emission Standards Division
U. S. ENVIRONMENTAL PROTECTION AGENCYOffice of Air and Radiation
Office of Air Quality Planning and StandardsResearch Triangle Park, North Carolina 27711
January 1993
ALTERNATIVE CONTROL TECHNIQUES DOCUMENTS
This report is issued by the Emission Standards Division,
Office of Air Quality Planning and Standards, U.S. Environmental
Protection Agency, to provide information to State and local air
pollution control agencies. Mention of trade names and
commercial products is not intended to constitute endorsement or
recommendation for use. Copies of this report are available—as
supplies permit—from the Library Services Office (MD-35), U.S.
Environmental Protection Agency, Research Triangle Park,
North Carolina 27711 ([919] 541-2777) or, for a nominal fee, from
the National Technical Information Services, 5285 Port Royal
Road, Springfield, Virginia 22161 ([800] 553-NTIS).
TABLE OF CONTENTS
Section Page
1.0 INTRODUCTION . . . . . . . . . . . . . . . . . . . 1-1
2.0 SUMMARY . . . . . . . . . . . . . . . . . . . . . 2-12.1 NO FORMATION AND UNCONTROLLED NO EMISSIONS 2-1x x2.2 CONTROL TECHNIQUES AND CONTROLLED NO x
EMISSION LEVELS . . . . . . . . . . . . . 2-22.2.1 Combustion Controls . . . . . . . . . 2-22.2.2 Selective Catalytic Reduction . . . . 2-8
2.3 COSTS AND COST EFFECTIVENESS FOR NO CONTROLxTECHNIQUES . . . . . . . . . . . . . . . . 2-9
2.3.1 Capital Costs . . . . . . . . . . . . 2-102.3.2 Cost Effectiveness . . . . . . . . . 2-17
2.4 REVIEW OF CONTROLLED NO EMISSION LEVELS AND xCOSTS . . . . . . . . . . . . . . . . . . 2-23
2.5 ENERGY AND ENVIRONMENTAL IMPACTS OF NO xCONTROL TECHNIQUES . . . . . . . . . . . . 2-23
3.0 STATIONARY GAS TURBINE DESCRIPTION AND INDUSTRY APPLICATIONS . . . . . . . . . . . . . . . . . . 3-13.1 GENERAL DESCRIPTION OF GAS TURBINES . . . . 3-13.2 OPERATING CYCLES . . . . . . . . . . . . . . 3-6
3.2.1 Simple Cycle . . . . . . . . . . . . 3-73.2.2 Regenerative Cycle . . . . . . . . . 3-73.2.3 Cogeneration Cycle . . . . . . . . . 3-103.2.4 Combined Cycle . . . . . . . . . . . 3-10
3.3 INDUSTRY APPLICATIONS . . . . . . . . . . . 3-103.3.1 Oil and Gas Industry . . . . . . . . 3-133.3.2 Stand-By/Emergency Electric Power
Generation . . . . . . . . . . . . 3-143.3.3 Independent Electrical Power Producers 3-143.3.4 Electric Utilities . . . . . . . . . 3-153.3.5 Other Industrial Applications . . . . 3-16
3.4 REFERENCES FOR CHAPTER 3 . . . . . . . . . 3-19
4.0 CHARACTERIZATION OF NO EMISSIONS . . . . . . . . 4-1x4.1 THE FORMATION OF NO . . . . . . . . . . . 4-1x
4.1.1 Formation of Thermal and Prompt NO . 4-1x4.1.2 Formation of Fuel NO . . . . . . . . 4-4x
4.2 UNCONTROLLED NO EMISSIONS . . . . . . . . . 4-6x4.2.1 Parameters Influencing Uncontrolled
NO Emissions . . . . . . . . . . . 4-6x4.2.2 NO Emissions From Duct Burners . . . 4-12x
4.3 UNCONTROLLED EMISSION FACTORS . . . . . . . 4-134.4 REFERENCES FOR CHAPTER 4 . . . . . . . . . . 4-15
iv
TABLE OF CONTENTS (continued)
Section Page
5.0 NO CONTROL TECHNIQUES . . . . . . . . . . . . . . 5-1x5.1 WET CONTROLS . . . . . . . . . . . . . . . . 5-5
5.1.1 Process Description . . . . . . . . . 5-55.1.2 Applicability of Wet Controls . . . . 5-85.1.3 Factors Affecting the Performance of
Wet Controls . . . . . . . . . . . 5-85.1.4 Achievable NO Emissions Levels Using x
Wet Controls . . . . . . . . . . . 5-115.1.5 Impacts of Wet Controls on CO and HC
Emissions . . . . . . . . . . . . . 5-285.1.6 Impacts of Wet Controls on Gas Turbine
Performance . . . . . . . . . . . . 5-335.1.7 Impacts of Wet Controls on Gas Turbine
Maintenance . . . . . . . . . . . . 5-335.2 COMBUSTION CONTROLS . . . . . . . . . . . . 5-36
5.2.1 Lean Combustion and Reduced Combustor Residence Time . . . . . . . . . . 5-36
5.2.2 Lean Premixed Combustors . . . . . . 5-385.2.3 Rich/Quench/Lean Combustion . . . . . 5-59
5.3 SELECTIVE CATALYTIC REDUCTION . . . . . . . 5-635.3.1 Process Description . . . . . . . . . 5-635.3.2 Applicability of SCR for Gas Turbines 5-655.3.3 Factors Affecting SCR Performance . . 5-725.3.4 Achievable NO Emission Reduction x
Efficiency Using SCR . . . . . . . 5-735.3.5 Disposal Considerations for SCR . . . 5-73
5.4 CONTROLS USED IN COMBINATION WITH SCR . . . 5-745.5 EFFECT OF ADDING A DUCT BURNER IN HRSG
APPLICATIONS . . . . . . . . . . . . . . . 5-775.6 ALTERNATE FUELS . . . . . . . . . . . . . . 5-83
5.6.1 Coal-Derived Gas . . . . . . . . . . 5-835.6.2 Methanol . . . . . . . . . . . . . . 5-84
5.7 SELECTIVE NONCATALYTIC REDUCTION . . . . . . 5-875.8 CATALYTIC COMBUSTION . . . . . . . . . . . . 5-88
5.8.1 Process Description . . . . . . . . . 5-885.8.2 Applicability . . . . . . . . . . . . 5-885.8.3 Development Status . . . . . . . . . 5-88
5.9 OFFSHORE OIL PLATFORM APPLICATIONS . . . . . 5-915.10 REFERENCES FOR CHAPTER 5 . . . . . . . . . . 5-92
6.0 CONTROL COST . . . . . . . . . . . . . . . . . 6-16.1 WATER AND STEAM INJECTION AND OIL-IN-WATER
EMULSION . . . . . . . . . . . . . . . . . 6-26.1.1 Capital Costs . . . . . . . . . . . 6-46.1.2 Annual Costs . . . . . . . . . . . . 6-96.1.3 Emission Reduction and Cost
Effectiveness Summary for Water andSteam Injection . . . . . . . . . . 6-14
v
TABLE OF CONTENTS (continued)
Section Page
6.2 LOW-NO COMBUSTORS . . . . . . . . . . . . . 6-16x6.3 SELECTIVE CATALYTIC REDUCTION . . . . . . . 6-18
6.3.1 Capital Costs . . . . . . . . . . . . 6-186.3.2 Annual Costs . . . . . . . . . . . . 6-196.3.3 Cost Effectiveness for SCR . . . . . 6-26
6.4 OFFSHORE TURBINES . . . . . . . . . . . . . 6-326.4.1 Wet Injection . . . . . . . . . . . . 6-316.4.2 Selective Catalytic Reduction . . . . 6-34
6.5 REFERENCES FOR CHAPTER 6 . . . . . . . . . . 6-35
7.0 ENVIRONMENTAL AND ENERGY IMPACTS . . . . . . . . . 7-17.1 AIR POLLUTION . . . . . . . . . . . . . . . 7-1
7.1.1 Emission Reductions . . . . . . . . . 7-17.1.2 Emissions Trade-Offs . . . . . . . . 7-5
7.2 SOLID WASTE DISPOSAL . . . . . . . . . . . . 7-77.3 WATER USAGE AND WASTE WATER DISPOSAL . . . . 7-87.4 ENERGY CONSUMPTION . . . . . . . . . . . . . 7-107.5 REFERENCE FOR CHAPTER 7 . . . . . . . . . . 7-11
APPENDIX A . . . . . . . . . . . . . . . . . . . . . . A-1
APPENDIX B . . . . . . . . . . . . . . . . . . . . . . B-1
vi
LIST OF FIGURES
Figure Page
2-1 Uncontrolled NO emission levels and gas turbine xmanufacturers' guaranteed controlled levels using
wet injection. Natural gas fuel. . . . . . . . 2-5
2-2 Uncontrolled NO emission levels and gas turbine xmanufacturers' guaranteed controlled levels using
wet injection. Distillate oil fuel . . . . . . 2-6
2-3 Capital costs for water or steam injection . . . 2-11
2-4 Capital costs for dry low-NO combustion . . . . 2-13x
2-5 Capital costs, in $/MW, for combustion controls . 2-14
2-6 Capital costs for selective catalytic reduction . 2-15
2-7 Capital costs, in $/MW, for selective catalyticreduction . . . . . . . . . . . . . . . . . . . 2-16
2-8 Cost effectiveness of combustion controls . . . . 2-18
2-9 Cost effectiveness for selective catalyticreduction installed dowstream of combustioncontrols . . . . . . . . . . . . . . . . . . . 2-21
2-10 Combined cost effectiveness for combustioncontrols plus selective catalytic reduction . . 2-22
2-11 Controlled NO emission levels and associatedxcapital costs and cost effectiveness foravailable NO control techniques. Naturalxgas fuel . . . . . . . . . . . . . . . . . . . 2-24
3-1 The three primary sections of a gas turbine . . . 3-2
3-2 Types of gas turbine combustors . . . . . . . . . 3-3
3-3 Single-shaft gas turbine . . . . . . . . . . . . 3-5
3-4 Two-shaft gas turbine . . . . . . . . . . . . . . 3-5
3-5 Three-shaft gas turbine . . . . . . . . . . . . . 3-5
3-6 Simple cycle gas turbine application . . . . . . 3-8
3-7 Regenerative cycle gas turbine . . . . . . . . . 3-9
3-8 Cogeneration cycle gas turbine application . . . 3-11
vii
LIST OF FIGURES (continued)
Figure Page
3-9 Combined cycle gas turbine application . . . . . 3-12
3-10 Total capacity to be purchased by the utilityindustry . . . . . . . . . . . . . . . . . . . 3-17
3-11 Capital costs for electric utility plants . . . . 3-18
4-1 Influence of equivalence ratio on flame temperature . . . . . . . . . . . . . . . . . . 4-3
4-2 Thermal NO production as a function of flame xtemperature and equivalence ratio . . . . . . . 4-8
4-3 Influence of firing temperature on thermal NO formation. . . . . . . . . . . . . . . . . 4-9x
4-4 Influence of relative humidity and ambienttemperature on NO formation . . . . . . . . . 4-11x
5-1 Percentage of fuel-bound nitrogen converted toNO versus the fuel-bound nitrogen content andxthe water-to-fuel ratio for a turbine firingtemperature of 1000EC (1840EF) . . . . . . . . 5-12
5-2 Uncontrolled NO emissions and gas turbine xmanufacturers' guaranteed controlled levelsusing wet injection. Natural gas fuel . . . . 5-13
5-3 Uncontrolled NO emissions and gas turbine xmanufacturers' guaranteed controlled levelsusing wet injection. Distillate-oil fuel . . . 5-14
5-4 Nitrogen oxide emission test data for small,low-efficiency gas turbines with waterinjection firing natural gas . . . . . . . . . 5-17
5-5 Nitrogen oxide emission test data for aircraft-derivative gas turbines with water injectionfiring natural gas . . . . . . . . . . . . . . 5-18
5-6 Nitrogen oxide emission test data for heavy-dutygas turbines with water injection firingnatural gas . . . . . . . . . . . . . . . . . . 5-19
5-7 Nitrogen oxide emission test data for aircraft-derivative gas turbines with water injectionfiring distillate oil . . . . . . . . . . . . . 5-20
viii
LIST OF FIGURES (continued)
Figure Page
5-8 Nitrogen oxide emission test data for heavy-dutygas turbines with water injection and WFR'sless than 0.5 and firing distillate oil . . . . 5-21
5-9 Nitrogen oxide emission test data for heavy-dutygas turbines with water injection and WFR'sgreater than 0.5 and firing distillate oil . . 5-22
5-10 Nitrogen oxide emission test data for gas turbineswith steam injection firing natural gas . . . . 5-24
5-11 Nitrogen oxide emission test data for gas turbineswith steam injection firing distillate oil . . 5-25
5-12 Comparison of the WFR requirement for water-in-oilemulsion versus separate water injection for anoil-fired turbine . . . . . . . . . . . . . . . 5-27
5-13 Effect of wet injection on CO emissions . . . . . 5-31
5-14 Effect of water injection on HC emissions for oneturbine model . . . . . . . . . . . . . . . . . 5-32
5-15 Nitrogen oxide emissions versus turbine firingtemperature for combustors with and without a lean primary zone . . . . . . . . . . . . . . . 5-39
5-16 Cross-section of a lean premixed can-annularcombustor . . . . . . . . . . . . . . . . . . . 5-41
5-17 Operating modes for a lean premixed can-annularcombustor . . . . . . . . . . . . . . . . . . . 5-42
5-18 Cross-section of lean premixed annular combustiondesign . . . . . . . . . . . . . . . . . . . . 5-44
5-19 Cross-section of a low-NO silo combustor . . . . 5-45x
5-20 Low-NO burner for a silo combustor . . . . . . . 5-46x
5-21 "Stepped" NO and CO emissions for a low-NO x xcan-annular combustor burning natural gas anddistillate oil fuels . . . . . . . . . . . . . 5-49
5-22 "Stepped" NO and CO emissions for a low-NO x xcan-annular combustor burning natural gas . . . 5-50
ix
LIST OF FIGURES (continued)
Figure Page
5-23 Nitrogen oxide emission test results from a leanpremix silo combustor firing fuel oil withoutwet injection . . . . . . . . . . . . . . . . . 5-52
5-24 The CO emission test results from a lean premixsilo combustor firing fuel oil without wetinjection . . . . . . . . . . . . . . . . . . . 5-58
5-25 Nitrogen oxide emissions versus primary zone equivalence ratio for a rich/quench/leancombustor firing distillate oil . . . . . . . . 5-61
5-26 Effects of fuel bound nitrogen (FBN) content ofNO emissions for a rich/quench/lean combustor 5-62x
5-27 Cutaway view of a typical monolith catalyst bodywith honeycomb configuration . . . . . . . . . 5-64
5-28 Possible locations for SCR unit in HRSG . . . . . 5-67
5-29 Typical duct burner for gas turbine exhaustapplication . . . . . . . . . . . . . . . . . . 5-78
5-30 Cross-sectional view of a low-NO duct burner . . 5-79x
5-31 Low-NO duct burner designed for oil firing . . . 5-81x
5-32 Influence of load on NO , O , and CO emissionsx 2 2for methanol and natural gas . . . . . . . . . 5-86
5-33 A lean catalytic combustor . . . . . . . . . . . 5-89
5-34 A rich/lean catalytic combustor . . . . . . . . . 5-90
x
LIST OF TABLES
Table Page
2-1 UNCONTROLLED NO EMISSION FACTORS FOR GASxTURBINES . . . . . . . . . . . . . . . . . . . 2-3
4-1 UNCONTROLLED NO EMISSIONS FACTORS FOR GASxTURBINES AND DUCT BURNERS . . . . . . . . . . . 4-14
5-1 NO EMISSION LIMITS AS ESTABLISHED BY THE NEWxSOURCE PERFORMANCE STANDARDS FOR GAS TURBINES . 5-2
5-2 NO COMPLIANCE LIMITS AS ESTABLISHED BY THE SOUTHxCOAST AIR QUALITY MANAGEMENT DISTRICT (SCAQMD)FOR EXISTING TURBINES. RULE 1134. ADOPTEDAUGUST 1989 . . . . . . . . . . . . . . . . . . 5-3
5-3 NO EMISSION LIMITS RECOMMENDED BY THE NORTHEASTxSTATES FOR COORDINATED AIR USE MANAGEMENT(NESCAUM) . . . . . . . . . . . . . . . . . . . 5-4
5-4 WATER QUALITY SPECIFICATIONS OF SELECTED GASTURBINE MANUFACTURERS FOR WATER INJECTIONSYSTEMS . . . . . . . . . . . . . . . . . . . . 5-6
5-5 MANUFACTURER'S GUARANTEED NO REDUCTIONxEFFICIENCIES AND ESTIMATED WATER-TO-FUEL RATIOSFOR NATURAL GAS FUEL OPERATION . . . . . . . . 5-9
5-6 MANUFACTURER'S GUARANTEED NO REDUCTIONxEFFICIENCIES AND ESTIMATED WATER-TO-FUEL RATIOSFOR DISTILLATE OIL FUEL OPERATION . . . . . . . 5-10
5-7 ACHIEVABLE GAS TURBINE NO EMISSION REDUCTIONSxFOR OIL-FIRED TURBINES USING WATER-IN-OILEMULSIONS . . . . . . . . . . . . . . . . . . . 5-26
5-8 UNCONTROLLED NO EMISSIONS AND POTENTIAL NOx xREDUCTIONS FOR GAS TURBINES USING WATERINJECTION . . . . . . . . . . . . . . . . . . . 5-29
5-9 UNCONTROLLED NO EMISSIONS AND POTENTIAL NOx xREDUCTIONS FOR GAS TURBINES USING STEAMINJECTION . . . . . . . . . . . . . . . . . . . 5-30
5-10 REPRESENTATIVE WATER/STEAM INJECTION IMPACTS ONGAS TURBINE PERFORMANCE FOR ONE MANUFACTURER'SHEAVY-DUTY TURBINES . . . . . . . . . . . . . . 5-34
5-11 IMPACTS OF WET CONTROLS ON GAS TURBINEMAINTENANCE USING NATURAL GAS FUEL . . . . . . 5-35
xi
LIST OF TABLES (continued)
Table Page
5-12 MEASURED NO EMISSIONS FOR COMPLIANCE TESTS OF AxNATURAL GAS-FUELED LEAN PREMIXED COMBUSTORWITHOUT WATER INJECTION . . . . . . . . . . . . 5-53
5-13 MEASURED NO FOR OPERATION OF A LEAN PREMIXEDxCOMBUSTOR DESIGN OPERATING IN DIFFUSION MODE ONOIL FUEL WITH WATER INJECTION . . . . . . . . . 5-54
5-14 POTENTIAL NO REDUCTIONS FOR GAS TURBINES USINGxLEAN PREMIXED COMBUSTORS . . . . . . . . . . . 5-56
5-15 COMPARISON OF NO AND CO EMISSIONS FOR STANDARD xVERSUS LEAN PREMIXED COMBUSTORS FOR TWOMANUFACTURERS' TURBINES . . . . . . . . . . . . 5-57
5-16 GAS TURBINE INSTALLATIONS IN THE NORTHEASTERNUNITED STATES WITH SCR AND PERMITTED FOR BOTHNATURAL GAS AND OIL FUELS . . . . . . . . . . . 5-70
5-17 EMISSIONS TESTS RESULTS FOR GAS TURBINES USINGSTEAM INJECTION PLUS SCR . . . . . . . . . . . 5-75
5-18 SUMMARY OF SCR NO EMISSION REDUCTIONS AND AMMONIAxSLIP LEVELS FOR NATURAL GAS-FIRED TURBINES . . 5-76
5-19 NO EMISSIONS MEASURED BEFORE AND AFTER A DUCTxBURNER . . . . . . . . . . . . . . . . . . . . 5-82
5-20 NO EMISSIONS TEST DATA FOR A GAS TURBINE FIRINGxMETHANOL AT BASELOAD . . . . . . . . . . . . . 5-85
6-1 GAS TURBINE MODEL PLANTS FOR NO CONTROL xTECHNIQUES . . . . . . . . . . . . . . . . . . 6-3
6-2 FUEL AND WATER FLOW RATES FOR WATER AND STEAMINJECTION (1990 $) . . . . . . . . . . . . . . 6-5
6-3 FUEL PROPERTIES AND UTILITY AND LABOR RATES . . . 6-6
6-4 CAPITAL COSTS FOR WET INJECTION IN THOUSAND OFDOLLARS . . . . . . . . . . . . . . . . . . . . 6-7
6-5 ANNUAL COSTS FOR WATER AND STEAM INJECTION(1990 $) . . . . . . . . . . . . . . . . . . . 6-10
6-6 COST-EFFECTIVENESS SUMMARY FOR WATER AND STEAMINJECTION (1990 $) . . . . . . . . . . . . . . 6-15
xii
LIST OF TABLES (continued)
Table Page
6-7 COST-EFFECTIVENESS SUMMARY FOR DRY LOW-NOxCOMBUSTORS USING NATURAL GAS FUEL (1990 $) . . 6-17
6-8 PROCEDURES FOR ESTIMATING CAPITAL AND ANNUAL COSTSFOR SCR CONTROL OF NO EMISSIONS FROM GASxTURBINES . . . . . . . . . . . . . . . . . . . 6-20
6-9 CAPITAL AND ANNUAL COSTS FOR SCR USED DOWNSTREAMOF WATER OR STEAM INJECTION (1990 $) . . . . . 6-21
6-10 CAPITAL AND ANNUAL COSTS FOR SCR USED DOWNSTREAMOF LOW-NO COMBUSTION . . . . . . . . . . . . . 6-22x
6-11 COST-EFFECTIVENESS SUMMARY FOR SCR USED DOWNSTREAMOF GAS TURBINES WITH WET INJECTION (1990 $) . . 6-27
6-12 COST-EFFECTIVENESS SUMMARY FOR SCR USED DOWNSTREAMOF DRY LOW-NO COMBUSTION (1990 $) . . . . . . 6-28x
6-13 COMBINED COST-EFFECTIVENESS SUMMARY FOR WETINJECTION PLUS SCR (1990 $) . . . . . . . . . . 6-30
6-14 COMBINED COST-EFFECTIVENESS SUMMARY FOR DRYLOW-NO COMBUSTION PLUS SCR (1990 $) . . . . . 6-31x
6-15 PROJECTED WET INJECTION AND SCR COSTS FOR ANOFFSHORE GAS TURBINE . . . . . . . . . . . . . 6-33
7-1 MODEL PLANT UNCONTROLLED AND CONTROLLED NO xEMISSIONS FOR AVAILABLE NO CONTROL TECHNIQUES 7-2x
7-2 WATER AND ELECTRICITY CONSUMPTION FOR NO CONTROLxTECHNIQUES . . . . . . . . . . . . . . . . . . 7-9
1-1
1.0 INTRODUCTION
Congress, in the Clean Air Act Amendments of 1990 (CAAA),
amended Title I of the Clean Air Act (CAA) to address ozone
nonattainment areas. A new Subpart 2 was added to Part D of
Section 103. Section 183(c) of the new Subpart 2 provides that:
[w]ithin 3 years after the date of the enactment of theCAAA, the Administrator shall issue technical documentswhich identify alternative controls for all categories ofstationary sources of...oxides of nitrogen which emit orhave the potential to emit 25 tons per year or more of suchair pollutant.
These documents are to be subsequently revised and updated as
determined by the Administrator.
Stationary gas turbines have been identified as a category
that emits more than 25 tons of nitrogen oxide (NO ) per year. x
This alternative control techniques (ACT) document provides
technical information for use by State and local agencies to
develop and implement regulatory programs to control NOx
emissions from stationary gas turbines. Additional ACT documents
are being developed for other stationary source categories.
Gas turbines are available with power outputs ranging from
1 megawatt (MW) (1,340 horsepower [hp]) to over 200 MW
(268,000 hp) and are used in a broad scope of applications. It
must be recognized that the alternative control techniques and
the corresponding achievable NO emission levels presented inx
this document may not be applicable for every gas turbine
application. The size and design of the turbine, the operating
duty cycle, site conditions, and other site-specific factors must
be taken into consideration, and the suitability of an
1-2
alternative control technique must be determined on a case-by-
case basis.
The information in this ACT document was generated through
a literature search and from information provided by gas turbine
manufacturers, control equipment vendors, gas turbine users, and
regulatory agencies. Chapter 2.0 presents a summary of the
findings of this study. Chapter 3.0 presents information on gas
turbine operation and industry applications. Chapter 4.0
contains a discussion of NO formation and uncontrolled NOx x
emission factors. Alternative control techniques and achievable
controlled emission levels are included in Chapter 5.0. The cost
and cost effectiveness of each control technique are presented in
Chapter 6.0. Chapter 7.0 describes environmental and energy
impacts associated with implementing the NO control techniques. x
2-1
2.0 SUMMARY
This chapter summarizes the more detailed information
presented in subsequent chapters of this document. It presents a
summary of nitrogen oxide (NO ) formation mechanisms andx
uncontrolled NO emission factors, available NO emission controlx x
techniques, achievable controlled NO emission levels, the costsx
and cost effectiveness for these NO control techniques appliedx
to combustion gas turbines, and the energy and environmental
impacts of these control techniques. The control techniques
included in this analysis are water or steam injection, dry low-
NO combustors, and selective catalytic reduction (SCR).x
Section 2.1 includes a brief discussion of NO formationx
and a summary of uncontrolled NO emission factors. Section 2.2x
describes the available control techniques and achievable
controlled NO emission levels. A summary of the costs and cost-x
effectiveness for each control technique is presented in
Section 2.3. Section 2.4 reviews the range of controlled
emission levels, capital costs, and cost effectiveness.
Section 2.5 discusses energy and environmental impacts.
2.1 NO FORMATION AND UNCONTROLLED NO EMISSIONSx x
The two primary NO formation mechanisms in gas turbinesx
are thermal and fuel NO . In each case, nitrogen and oxygenx
present in the combustion process combine to form NO . Thermalx
NO is formed by the dissociation of atmospheric nitrogen (N )x 2
and oxygen (O ) in the turbine combustor and the subsequent2
formation of NO . When fuels containing nitrogen are combusted,x
this additional source of nitrogen results in fuel NO formation. x
Because most turbine installations burn natural gas or light
2-2
distillate oil fuels with little or no nitrogen content, thermal
NO is the dominant source of NO emissions. The formation ratex x
of thermal NO increases exponentially with increases inx
temperature. Because the flame temperature of oil fuel is higher
than that of natural gas, NO emissions are higher for operationsx
using oil fuel than natural gas.
Uncontrolled NO emission levels were provided by gasx
turbine manufacturers in parts per million, by volume (ppmv).
Unless stated otherwise, all emission levels shown in ppmv are
corrected to 15 percent O . These emission levels were used to2
calculate uncontrolled NO emission factors, in pounds (lb) ofx
NO per million British thermal units (Btu) (lb NO /MMBtu). x x
Sample calculations are shown in Appendix A. These uncontrolled
emission levels and emission factors for both natural gas and oil
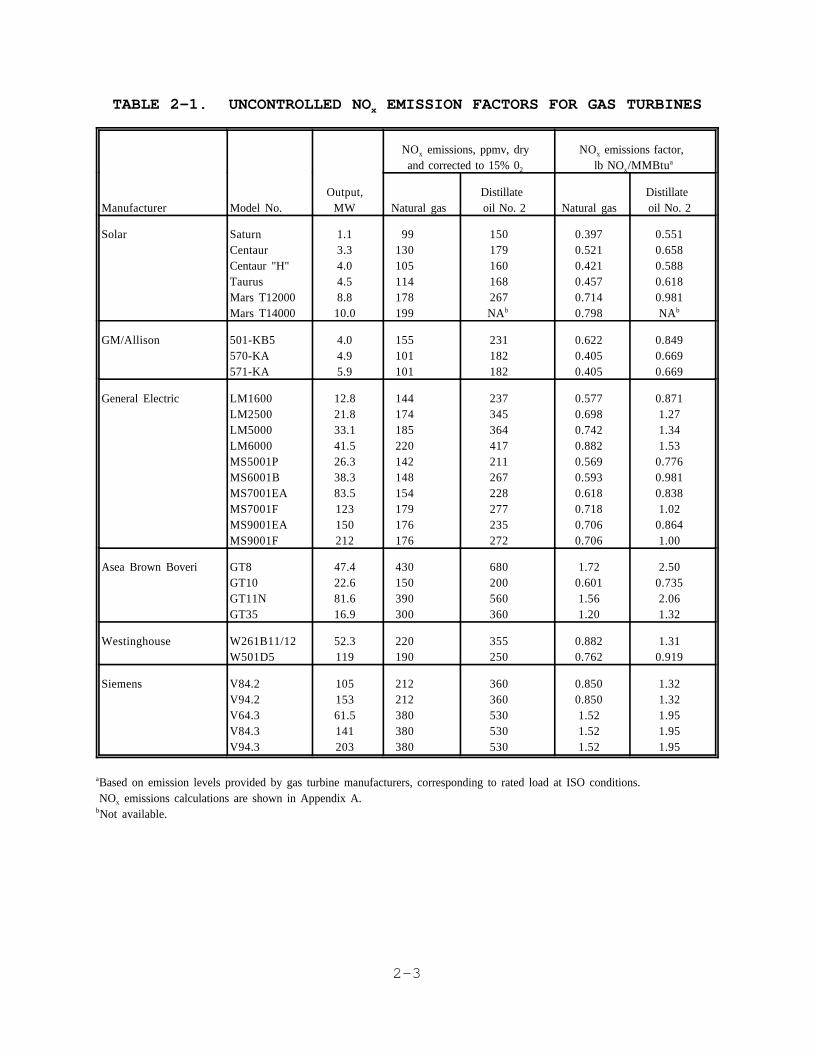
fuel are presented in Table 2-1
2-3
TABLE 2-1. UNCONTROLLED NO EMISSION FACTORS FOR GAS TURBINESx
NO emissions, ppmv, dryx
and corrected to 15% 02
NO emissions factor, x
lb NO /MMBtuxa
Manufacturer Model No.Output,
MW Natural gasDistillate oil No. 2 Natural gas
Distillate oil No. 2
Solar SaturnCentaurCentaur "H"TaurusMars T12000Mars T14000
1.13.34.04.58.810.0
99130105114178199
150179160168267NAb
0.3970.5210.4210.4570.7140.798
0.5510.6580.5880.6180.981NAb
GM/Allison 501-KB5570-KA571-KA
4.04.95.9
155101101
231182182
0.6220.4050.405
0.8490.6690.669
General Electric LM1600LM2500LM5000LM6000MS5001PMS6001BMS7001EAMS7001FMS9001EAMS9001F
12.821.833.141.526.338.383.5123150212
144174185220142148154179176176
237345364417211267228277235272
0.5770.6980.7420.8820.5690.5930.6180.7180.7060.706
0.8711.271.341.53
0.7760.9810.8381.02
0.8641.00
Asea Brown Boveri GT8GT10GT11NGT35
47.422.681.616.9
430150390300
680200560360
1.720.6011.561.20
2.500.7352.061.32
Westinghouse W261B11/12W501D5
52.3119
220190
355250
0.8820.762
1.310.919
Siemens V84.2V94.2V64.3V84.3V94.3
10515361.5141203
212212380380380
360360530530530
0.8500.8501.521.521.52
1.321.321.951.951.95
Based on emission levels provided by gas turbine manufacturers, corresponding to rated load at ISO conditions.a
NO emissions calculations are shown in Appendix A.x
Not available.b
2-4
. Uncontrolled NO emission levels range from 99 to 430 ppmv forx
natural gas fuel and from 150 to 680 ppmv for distillate oil
fuel. Corresponding uncontrolled emission factors range from
0.397 to 1.72 lb NO /MMBtu and 0.551 to 2.50 lb NO /MMBtu forx x
natural gas and distillate oil fuels, respectively. Because
thermal NO is primarily a function of combustion temperature,x
NO emission rates vary with combustor design. There is nox
discernable correlation between turbine size and NO emissionx
levels evident in Table 2-1.
2.2 CONTROL TECHNIQUES AND CONTROLLED NO EMISSION LEVELSx
Reductions in NO emissions can be achieved usingx
combustion controls or flue gas treatment. Available combustion
controls are water or steam injection and dry low-NO combustionx
designs. Selective catalytic reduction is the only available
flue gas treatment.
2.2.1 Combustion Controls
Combustion control using water or steam lowers combustion
temperatures, which reduces thermal NO formation. Fuel NOx x
formation is not reduced with this technique. Water or steam,
treated to quality levels comparable to boiler feedwater, is
injected into the combustor and acts as a heat sink to lower

2-5
flame temperatures. This control technique is available for all
new turbine models and can be retrofitted to most existing
installations.
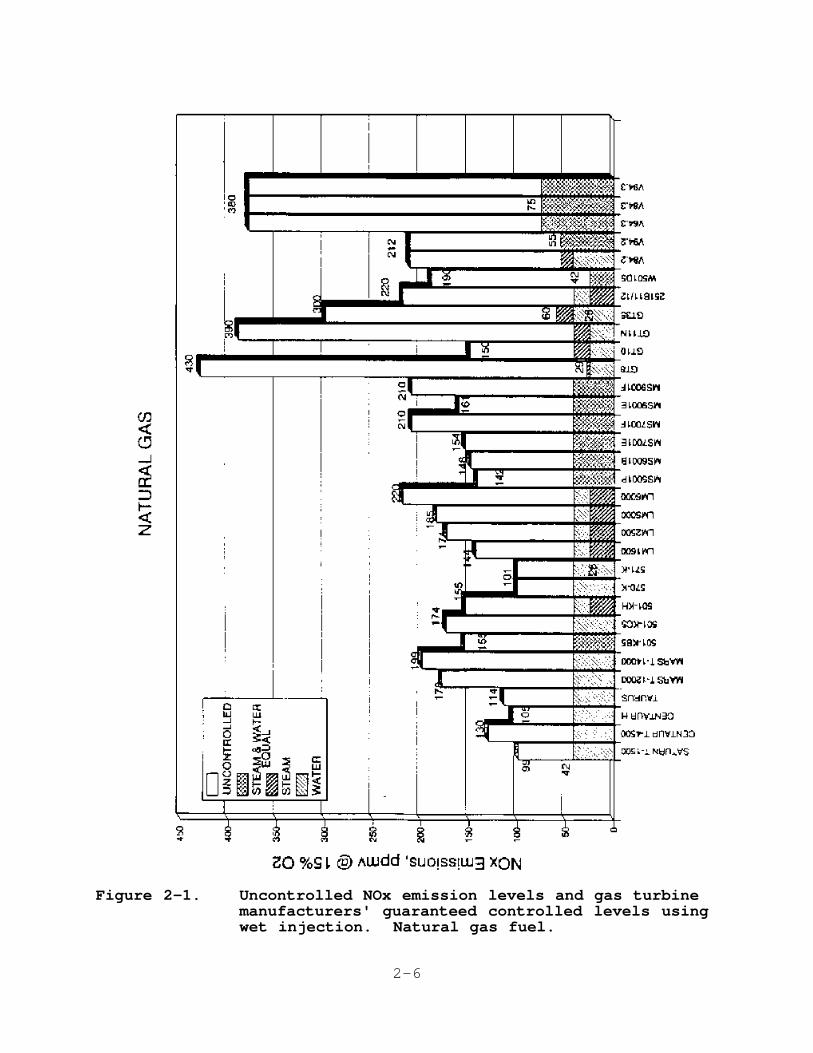
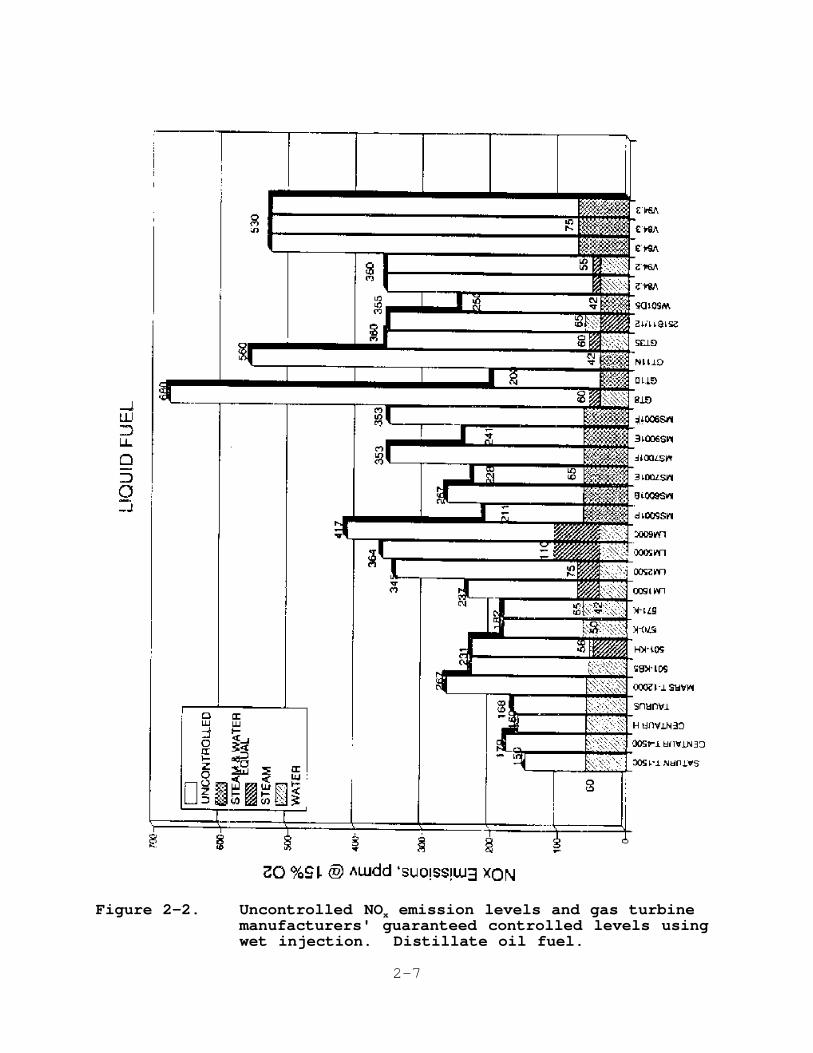
Although uncontrolled emission levels vary widely, the range
of achievable controlled emission levels using water or steam
injection is relatively small. Controlled NO emission levelsx
range from 25 to 42 ppmv for natural gas fuel and from 42 to
75 ppmv for distillate oil fuel. Achievable guaranteed
controlled emission levels, as provided by turbine manufacturers,
are shown for individual turbine models in Figures 2-1 and 2-2
2-6
Figure 2-1. Uncontrolled NOx emission levels and gas turbinemanufacturers' guaranteed controlled levels usingwet injection. Natural gas fuel.
2-7
Figure 2-2. Uncontrolled NO emission levels and gas turbinexmanufacturers' guaranteed controlled levels usingwet injection. Distillate oil fuel.

2-8
for natural gas and oil fuels, respectively.
The decision whether to use water versus steam injection for
NO reduction depends on many factors, including the availabilityx
of steam injection nozzles and controls from the turbine
manufacturer, the availability and cost of steam at the site, and
turbine performance and maintenance impacts. This decision is
usually driven by site-specific environmental and economic
factors.
A system that allows treated water to be mixed with the fuel
prior to injection is also available. Limited testing of water-
in-oil emulsions injected into the turbine combustor have
achieved NO reductions equivalent to direct water injection butx
at reduced water-to-fuel rates. The vendor reports a similar
system is available for natural gas-fired applications.
Dry low-NO combustion control techniques reduce NOx x
emissions without injecting water or steam. Two designs, lean
premixed combustion and rich/quench/lean staged combustion have
been developed.
Lean premixed combustion designs reduce combustion
temperatures, thereby reducing thermal NO . Like wet injection,x
this technique is not effective in reducing fuel NO . In ax
conventional turbine combustor, the air and fuel are introduced
at an approximately stoichiometric ratio and air/fuel mixing
occurs simultaneously with combustion. A lean premixed combustor
design premixes the fuel and air prior to combustion. Premixing
results in a homogeneous air/fuel mixture, which minimizes

2-9
2-10
localized fuel-rich pockets that produce elevated combustion
temperatures and higher NO emissions. A lean air-to-fuel ratiox
approaching the lean flammability limit is maintained, and the
excess air acts as a heat sink to lower combustion temperatures,
which lowers thermal NO formation. A pilot flame is used tox
maintain combustion stability in this fuel-lean environment.
Lean premixed combustors are currently available from
several turbine manufacturers for a limited number of turbine
models. Development of this technology is ongoing, and
availability should increase in the coming years. All turbine
manufacturers state that lean premixed combustors are designed
for retrofit to existing installations.
Controlled NO emission levels using dry lean premixedx
combustion range from 9 to 42 ppmv for operation on natural gas
fuel. The low end of this range (9 to 25 ppmv) has been limited
to turbines above 20 megawatts (MW) (27,000 horsepower [hp]); to
date, three manufacturers have guaranteed controlled NO emissionx
levels of 9 ppmv at one or more installations for utility-sized
turbines. Controlled NO emissions from smaller turbinesx
typically range from 25 to 42 ppmv. For operation on distillate
oil fuel, water or steam injection is required to achieve
controlled NO emissions levels of approximately 65 ppmv. x
Development continues for oil-fueled operation in lean premixed
designs, however, and one turbine manufacturer reports having
achieved controlled NO emission levels below 50 ppmv in limitedx
testing on oil fuel without wet injection.
A second dry low-NO combustion design is a rich/quench/leanx
staged combustor. Air and fuel are partially combusted in a
fuel-rich primary stage, the combustion products are then rapidly
quenched using water or air, and combustion is completed in a
fuel-lean secondary stage. The fuel-rich primary stage inhibits
NO formation due to low O levels. Combustion temperatures inx 2
the fuel-lean secondary stage are below NO formationx
temperatures as a result of the quenching process and the
presence of excess air. Both thermal and fuel NO are controlledx
with this design. Limited testing with fuels including natural
2-11
gas and coal have achieved controlled NO emissions of 25 ppmv. x
Development of this design continues, however, and currently the
rich/quench/lean combustor is not available for production
turbines.
2.2.2 Selective Catalytic Reduction
This flue gas treatment technique uses an ammonia (NH )3injection system and a catalytic reactor to reduce NO . Anx
injection grid disperses NH in the flue gas upstream of the3
catalyst, and NH and NO are reduced to N and water (H O) in the3 x 2 2
catalyst reactor. This control technique reduces both thermal
NO and fuel NO .x x
Ammonia injection systems are available that use either
anhydrous or aqueous NH . Several catalyst materials are3
available. To date, most SCR installations use a base-metal
catalyst with an operating temperature window ranging from
approximately 260E to 400EC (400E to 800EF). The exhaust
temperature from the gas turbine is typically above 480EC
(900EF), so the catalyst is located within a heat recovery steam
generator (HRSG) where temperatures are reduced to a range
compatible with the catalyst operating temperature. This
operating temperature requirement has, to date, limited SCR to
cogeneration or combined-cycle applications with HRSG's to reduce
flue gas temperatures. High-temperature zeolite catalysts,
however, are now available and have operating temperature windows
of up to 600EC (1100EF), which is suitable for installation
directly downstream of the turbine. This high-temperature
zeolite catalyst offers the potential for SCR applications with
simple cycle gas turbines.
To achieve optimum long-term NO reductions, SCR systemsx
must be properly designed for each application. In addition to
temperature considerations, the NH injection rate must be3
carefully controlled to maintain an NH /NO molar ratio that3 x
effectively reduces NO and avoids excessive NH emissionsx 3
downstream of the catalyst, known as ammonia slip. The selected
catalyst formulation must be resistant to potential masking
and/or poisoning agents in the flue gas.
2-12
To date, most SCR systems in the United States have been
installed in gas-fired turbine applications, but improvements in
SCR system designs and experience on alternate fuels in Europe
and Japan suggest that SCR systems are suitable for firing
distillate oil and other sulfur-bearing fuels. These fuels
produce sulfur dioxide (SO ), which may oxidize to sulfite (SO )2 3
in the catalyst reactor. This SO reacts with NH slip to form3 3
ammonium salts in the low-temperature section of the HRSG and
exhaust ductwork. The ammonium salts must be periodically
cleaned from the affected surfaces to avoid fouling and corrosion
as well as increased back-pressure on the turbine. Advances in
catalyst formulations include sulfur-resistant catalysts with low
SO oxidation rates. By limiting ammonia slip and using these2
sulfur-resistant catalysts, ammonium salt formation can be
minimized.
Catalyst vendors offer NO reduction efficiencies ofx
90 percent with ammonia slip levels of 10 ppmv or less. These
emission levels are warranted for 2 to 3 years, and all catalyst
vendors contacted accept return of spent catalyst reactors for
recycle or disposal.
Controlled NO emission levels using SCR are typicallyx
9 ppmv or less for gas-fueled turbine installations. With the
exception of one site, all identified installations operate the
SCR system in combination with combustion controls that reduce
NO emission levels into the SCR to a range of 25 to 42 ppmv. x
Most continuous-duty turbine installations fire natural gas;
there is limited distillate oil-fired operating experience in the
United States. Several installations with SCR in the northeast
United States that use distillate oil as a back-up fuel have
controlled NO emission limits of 18 ppmv for operation onx
distillate oil fuel.
2.3 COSTS AND COST EFFECTIVENESS FOR NO CONTROL TECHNIQUESx
Capital costs and cost effectiveness were developed for the
available NO control techniques. Capital costs are presented inx
Section 2.3.1. Cost-effectiveness figures, in $/ton of NOx
2-13
removed, are shown in Section 2.3.2. All costs presented are in
1990 dollars.
2.3.1 Capital Costs
Capital costs are the sum of purchased equipment costs,
taxes and freight charges, and installation costs. Purchased
equipment costs were estimated based on information provided by
equipment manufacturers, vendors, and published sources. Taxes,
freight, and installation costs were developed based on factors
recommended in the Office of Air Quality and Planning and
Standards Control Cost Manual (Fourth Edition). Capital costs
for combustion controls and SCR are presented in Sections 2.3.1.1
and 2.3.1.2, respectively.
2.3.1.1 Combustion Controls Capital Costs. Capital costs
for wet injection include a mixed bed demineralizer and reverse-
osmosis water treatment system and an injection system consisting
of pumps, piping and hardware, metering controls, and injection
nozzles. All costs for wet injection are based on the
availability of water at the site; no costs have been included
for transporting water to the site. These costs apply to new
installations; retrofit costs would be similar except that
turbine-related injection hardware and metering controls
purchased from the turbine manufacturer may be higher for
retrofit applications.
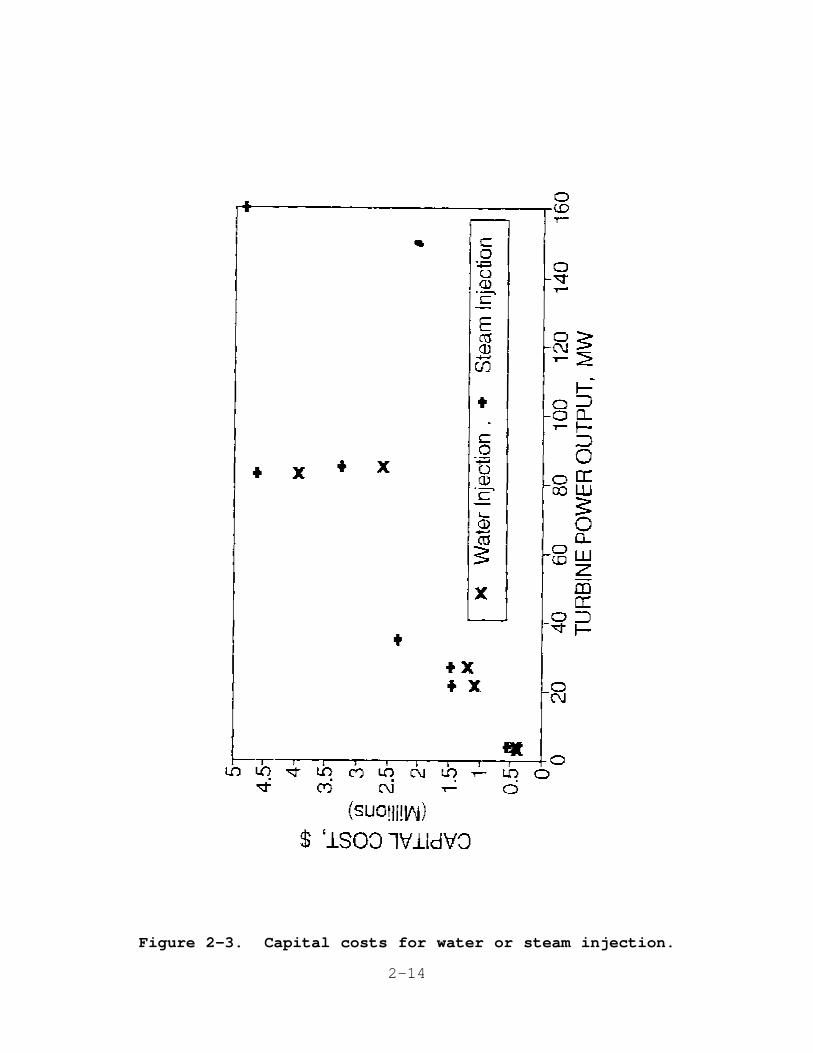
The capital costs for wet injection are shown in Figure 2-3,
and range from $388,000 for a 3.3 MW (4,430 hp) turbine to
$4,830,000 for a 161 MW (216,000 hp) turbine.
2-14
Figure 2-3. Capital costs for water or steam injection.

2-15
These capital costs include both water and steam injection
systems for use with either gas or distillate oil fuel
applications. Figure 2-3 shows that the capital costs for steam
injection are slightly higher than those for water injection for
turbines in the 3 to 25 MW (4,000 to 33,500 hp) range.
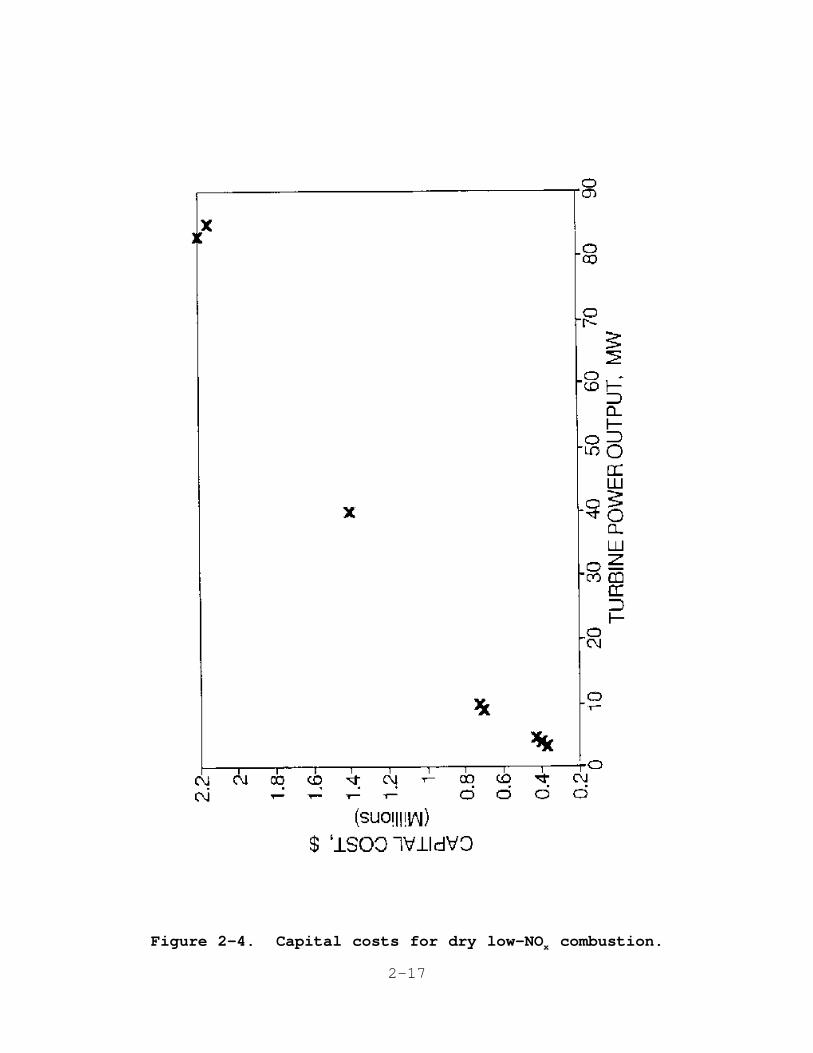
The capital costs for dry low-NO combustors are thex
incremental costs for this design over a conventional combustor
and apply to new installations. Turbine manufacturers estimate
retrofit costs to be approximately 40 to 60 percent higher than
new equipment costs. Incremental capital costs for dry low-NO x

2-16
combustion were provided by turbine manufacturers and are
presented in Figure 2-4.
2-17
Figure 2-4. Capital costs for dry low-NO combustion.x
2-18
The incremental capital costs range from $375,000 for a 3.3 MW
(4,430 hp) turbine to $2.2 million for an 85 MW (114,000 hp)
machine. Costs were not available for turbines above 85 MW
(114,000 hp).
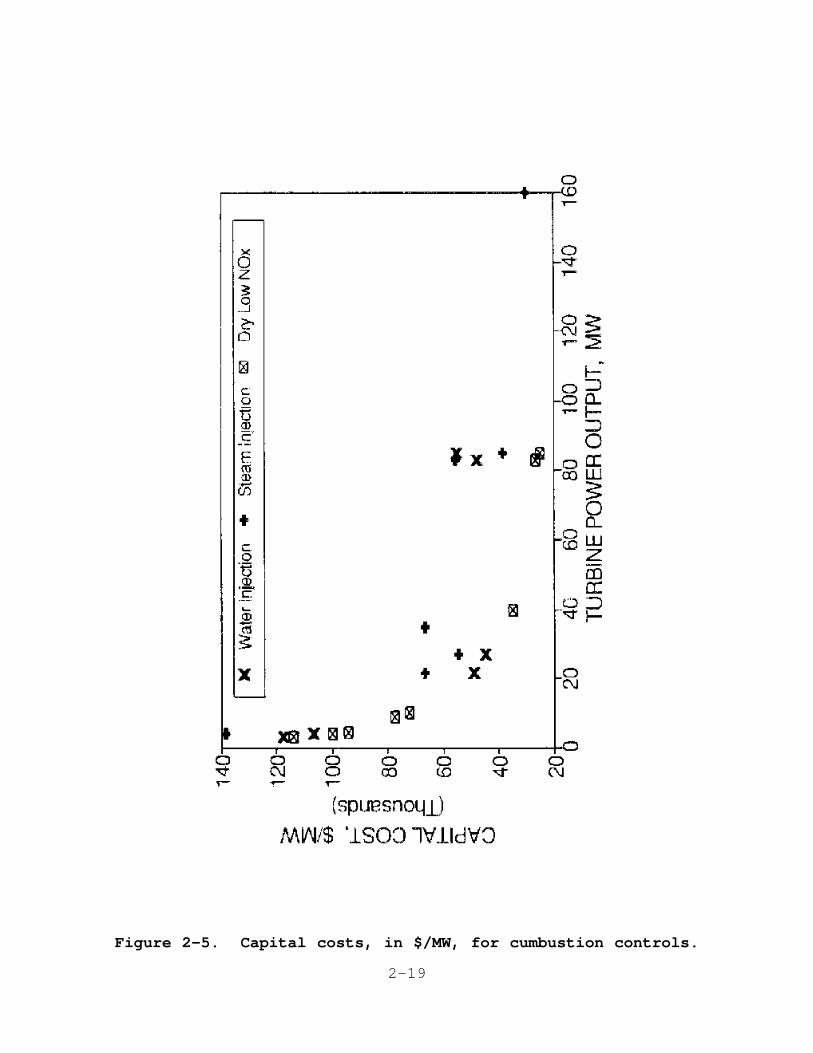
When evaluated on a $/MW ($/hp) basis, the capital costs for
wet injection or dry low-NO combustion controls are highest forx
the smallest turbines and decrease exponentially with increasing
turbine size. The range of capital costs for combustion
controls, in $/MW, and the effect of turbine size on capital
costs are shown in Figure 2-5.
2-19
Figure 2-5. Capital costs, in $/MW, for cumbustion controls.
2-20
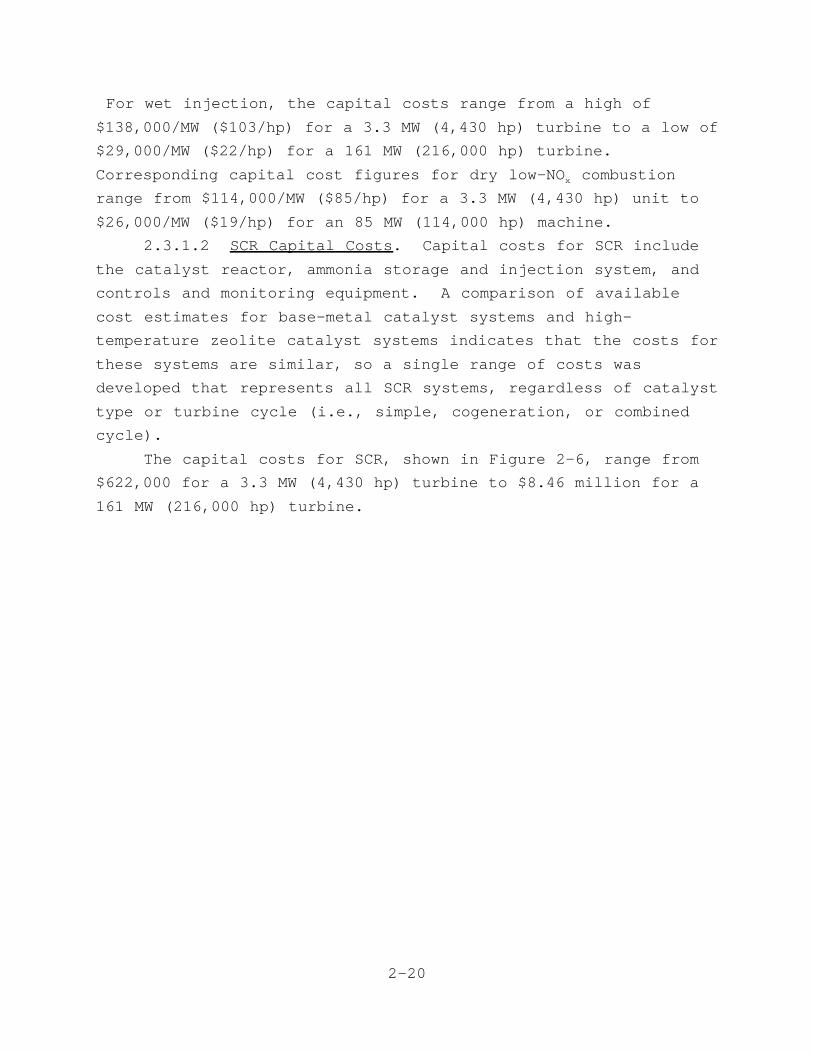
For wet injection, the capital costs range from a high of
$138,000/MW ($103/hp) for a 3.3 MW (4,430 hp) turbine to a low of
$29,000/MW ($22/hp) for a 161 MW (216,000 hp) turbine.
Corresponding capital cost figures for dry low-NO combustionx
range from $114,000/MW ($85/hp) for a 3.3 MW (4,430 hp) unit to
$26,000/MW ($19/hp) for an 85 MW (114,000 hp) machine.
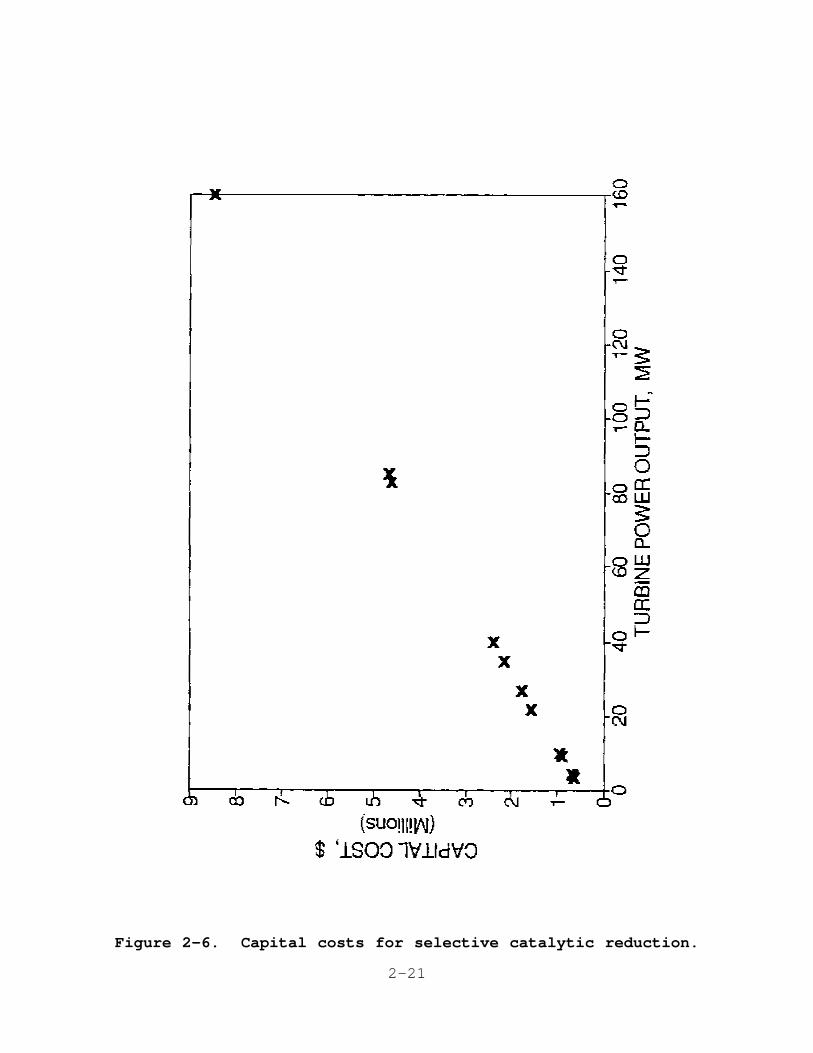
2.3.1.2 SCR Capital Costs. Capital costs for SCR include
the catalyst reactor, ammonia storage and injection system, and
controls and monitoring equipment. A comparison of available
cost estimates for base-metal catalyst systems and high-
temperature zeolite catalyst systems indicates that the costs for
these systems are similar, so a single range of costs was
developed that represents all SCR systems, regardless of catalyst
type or turbine cycle (i.e., simple, cogeneration, or combined
cycle).
The capital costs for SCR, shown in Figure 2-6, range from
$622,000 for a 3.3 MW (4,430 hp) turbine to $8.46 million for a
161 MW (216,000 hp) turbine.
2-21
Figure 2-6. Capital costs for selective catalytic reduction.

2-22
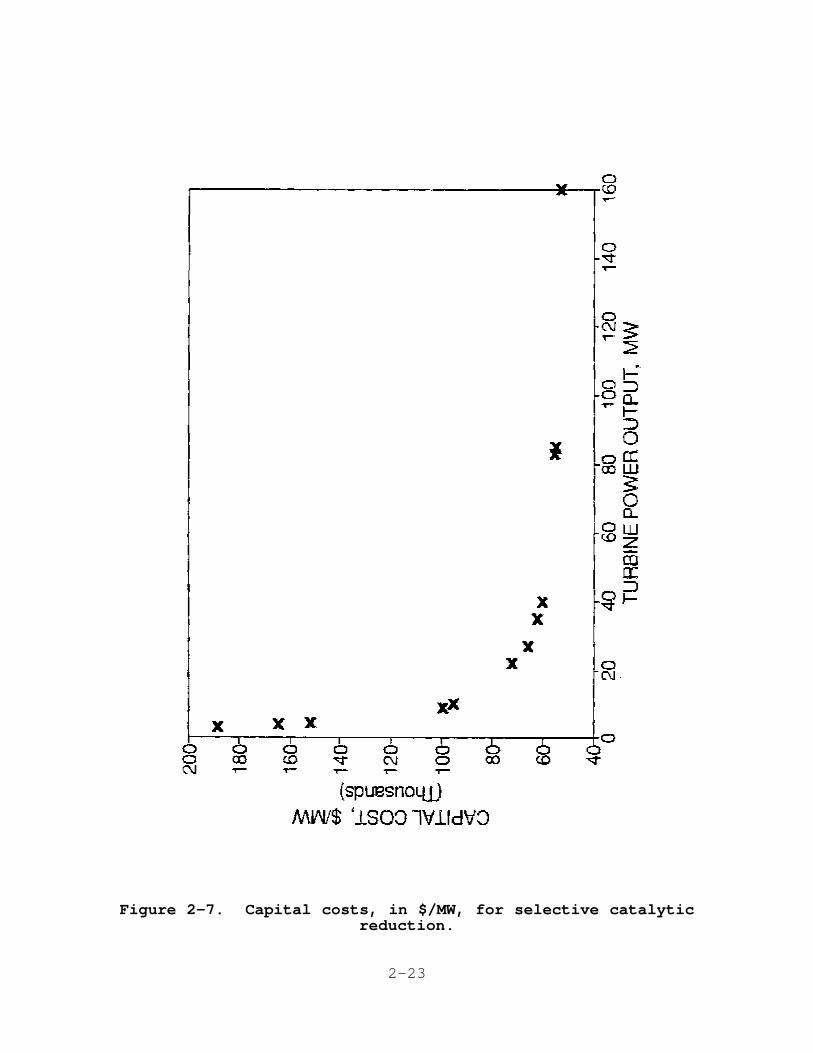
Figure 2-7 plots capital costs on a $/MW basis and shows that
these costs are highest for the smallest turbine, at $188,000/MW
($140/hp) for a 3.3 MW (4,430 hp) unit, and decrease
exponentially with increasing turbine size to $52/MW ($40/hp) for
a 161 MW (216,000 hp) machine.
2-23
Figure 2-7. Capital costs, in $/MW, for selective catalyticreduction.

2-24
These costs apply to new installations firing natural gas as
the primary fuel. No SCR sites using oil as the primary fuel
were identified, and costs were not available. For this

2-25

2-26

2-27
2-28
reason, the costs for gas-fired applications were also used for
oil-fired sites. Retrofit SCR costs could be considerably higher
than those shown here for new installations, especially if an
existing HRSG and ancillary equipment must be moved or modified
to accommodate the SCR system.
2.3.2 Cost Effectiveness
The cost effectiveness, in $/ton of NO removed, wasx
developed for each NO control technique. The cost effectivenessx
for a given control technique is calculated by dividing the total
annual cost by the annual NO reduction, in tons. The costx
effectiveness presented in this section correspond to 8,000
annual operating hours. Total annual costs were calculated as
the sum of all annual operating costs and annualized capital
costs. Annual operating costs include costs for incremental
fuel, utilities, maintenance, applicable performance penalties,
operating and supervisory labor, plant overhead, general and
administrative, and taxes and insurance. Capital costs were
annualized using the capital recovery factor method with an
equipment life of 15 years and an annual interest rate of
10 percent. Cost-effectiveness figures for combustion controls
and SCR are presented in Sections 2.3.2.1 and 2.3.2.2,
respectively.
2.3.2.1 Combustion Controls Cost Effectiveness. Cost
effectiveness for combustion controls is shown in Figure 2-8.
2-29
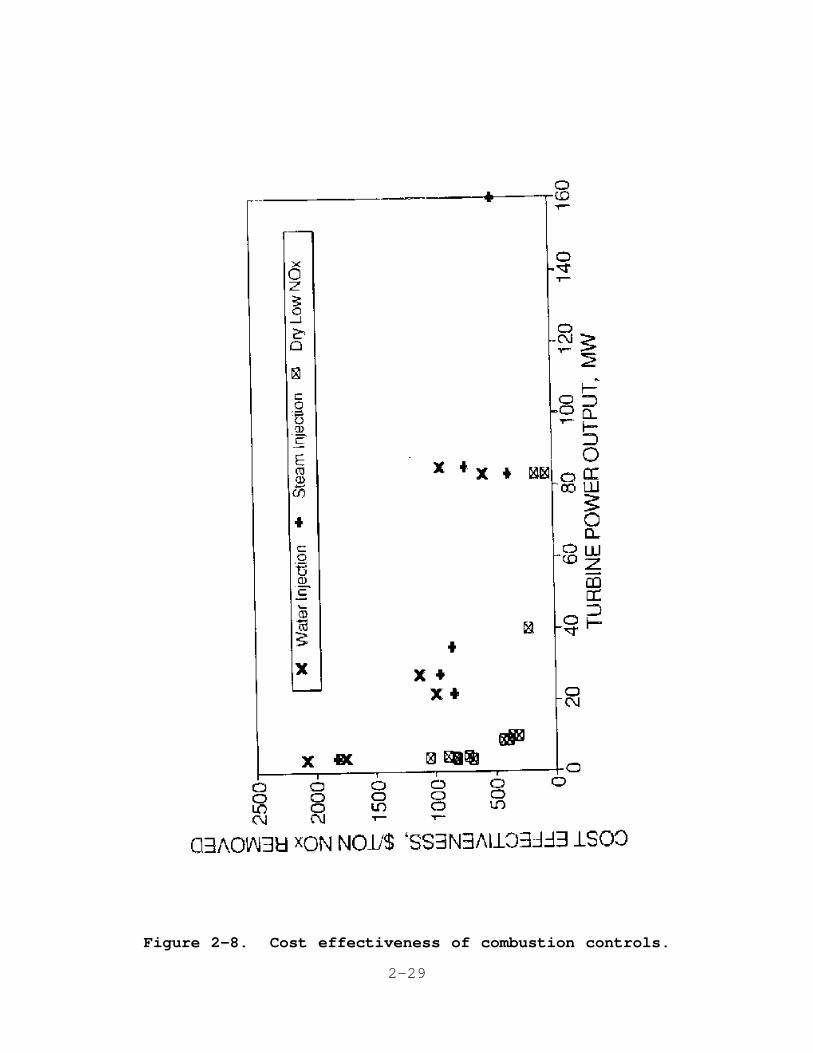
Figure 2-8. Cost effectiveness of combustion controls.
2-30
Figure 2-8 indicates that cost effectiveness for combustion
controls is highest for the smallest turbines and decreases
exponentially with decreasing turbine size. Figure 2-8 also
shows that the range of cost effectiveness for water injection is
similar to that for steam injection, primarily because the total
annual costs and achievable controlled NO emission levels forx
water and steam injection are similar. The cost-effectiveness
range for dry low-NO combustion is lower than that for wetx
levels are similar (25x
to 42 ppmv), due to the lower total annual costs for dry low-NOxcombustion.
2 - 3 1
For water injection, cost effectiveness, in $/ton of NOx
removed, ranges from $2,080 for a 3.3 MW (4,430 hp) unit to $575
for an 83 MW (111,000 hp) turbine and $937 for an 85 MW
(114,000 hp) turbine. For steam injection, cost effectiveness is
$1,830 for a 3.3 MW (4,430 hp), decreasing to $375 for an 83 MW
(111,000 hp) turbine, and increasing to $478 for a 161 MW
(216,000 hp) turbine. The relatively low cost effectiveness for
the 83 MW (111,000 hp) turbine is due to this particular
turbine's high uncontrolled NO emissions, which result in a
relatively high NO removal efficiency and lower costx
effectiveness. The cost effectiveness shown in Figure 2-8
number of oil-fired applications with water injection indicates
that the cost effectiveness ranges from 70 to 85 percent of the
NO removal efficiency achieved in oil-fired applications.x
For dry low-NO combustion, cost effectiveness, in $/ton ofx
NO removed, ranges from $1,060 for a 4.0 MW (5,360 hp) turbinex
down to $154 for an 85 MW (114,000 hp) machine. A cost
effectiveness of $57 was calculated for the 83 MW (111,000 hp)
unit. Again, the relatively high uncontrolled NO emissions andx
the resulting high NO removal efficiency for this turbine modelx
yields a relatively low cost-effectiveness figure. Current dry
low-NO combustion designs do not achieve NO reductions with oilx x
fuels, so the cost-effectiveness values shown in this section
apply only to gas-fired applications.
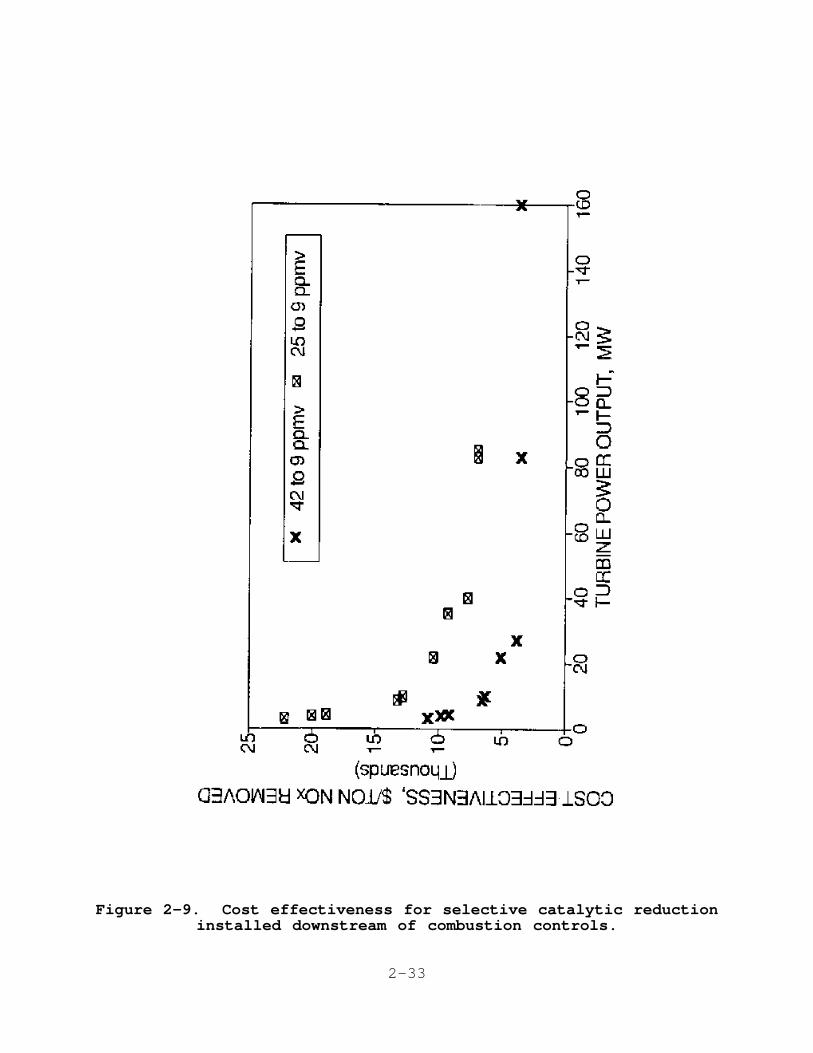
2.3.2.2 SCR Cost Effectiveness. Cost effectiveness for SCR
was calculated based on the use of combustion controls upstream
of the catalyst to reduce NO emissions to a range of 25 tox
42 ppmv at the inlet to the catalyst. This approach was used
because all available SCR cost information is for SCR
applications used in combination with combustion controls and all
but one of the 100+ SCR installations in the United States
operate in combination with combustion controls. For this cost
analysis, a 5-year catalyst life and a 9 ppmv controlled NOx
emission level was used to calculate cost effectiveness for SCR.

2-32
Figure 2-9 presents SCR cost effectiveness. Figure 2-9
shows that, like combustion controls, SCR cost effectiveness is
highest for the smallest turbines and decreases exponentially
with decreasing turbine size.
2-33
Figure 2-9. Cost effectiveness for selective catalytic reductioninstalled downstream of combustion controls.
2-34
Also, because this cost analysis uses a 9 ppmv controlled NOx
emission level for SCR, NO reduction efficiencies are higherx
where the NO emission level into the SCR is 42 ppmv than forx
applications with a 25 ppmv level. Cost effectiveness
corresponding to an inlet NO emission level of 42 ppmv, in $/tonx
of NO removed, ranges from a high of $10,800 for a 3.3 MW (4430x
hp) turbine to $3,580 for a 161 MW (216,000 hp) turbine. For an
inlet NO emission level of 25 ppmv, the cost-effectiveness rangex
shifts higher, from $22,100 for a 3.3 MW (4,430 hp) installation
to $6,980 for an 83 MW (111,000 hp) site.
The range of cost effectiveness for SCR shown in Figure 2-9
applies to gas-fired applications. Cost effectiveness developed
for a limited number of oil-fired installations using capital
costs from gas-fired applications yields cost-effectiveness
values ranging from approximately 70 to 77 percent of those for
gas-fired sites. The lower cost-effectiveness figures for oil-
fired applications result primarily from the greater annual NOx
reductions for oil-fired applications; the gas-fired capital
costs used for these oil-fired applications may understate the
actual capital costs for these removal rates and actual oil-fired
cost-effectiveness figures may be higher.
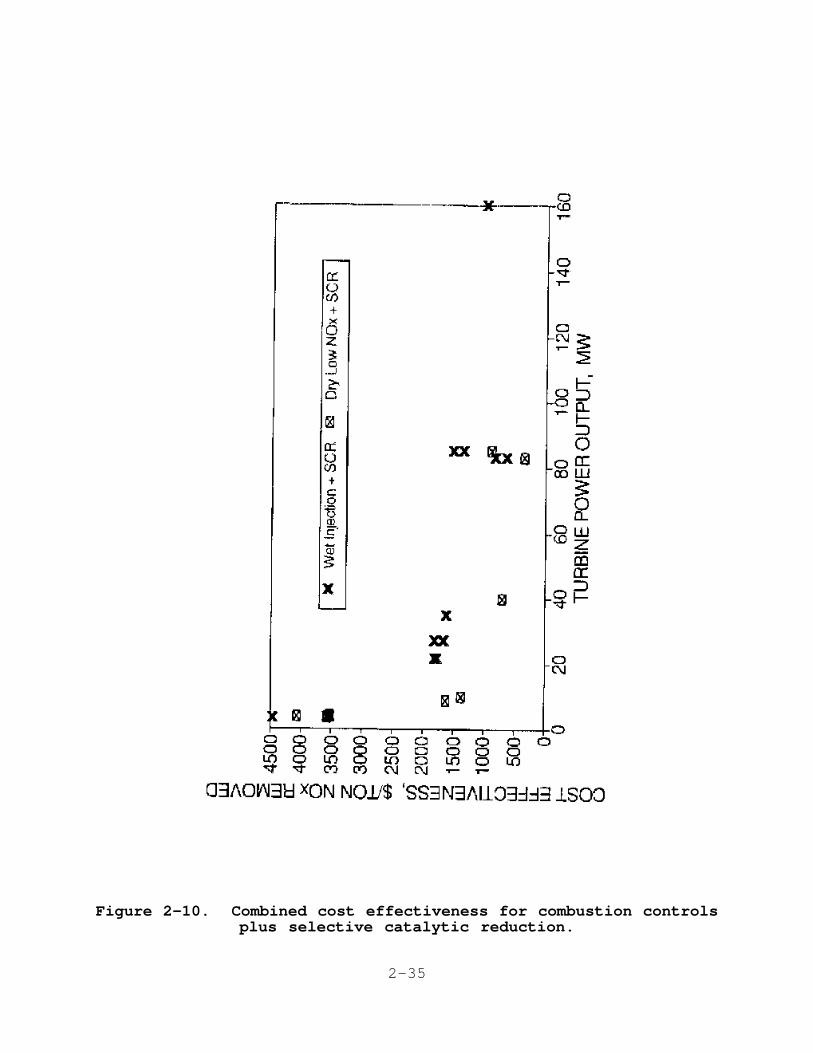
Combined cost-effectiveness figures, in $/ton of NOx
removed, were calculated for the combination of combustion
controls plus SCR by dividing the sum of the total annual costs
by the sum of the NO removed for both control techniques. Thex
controlled NO emission level for the combination of controls isx
9 ppmv. These combined cost-effectiveness figures are presented
in Figure 2-10.
2-35
Figure 2-10. Combined cost effectiveness for combustion controlsplus selective catalytic reduction.

2-36
For wet injection plus SCR, the combined cost effectiveness
ranges from $4,460 for a 3.3 MW (4,430 hp) application to $988
for a 160 MW (216,000 hp) site. The $645 cost-effectiveness
value for the 83 MW (111,000 hp) turbine is lower than the other
turbine models shown in Figure 2-10 due to

2-37
2-38
the relatively high uncontrolled NO emission level for thisx
turbine, which results in relatively high NO removal rates and ax
lower cost effectiveness. For dry low-NO combustion plus SCR,x
combined cost-effectiveness values range from $4,060 to $348 for
this turbine size range.
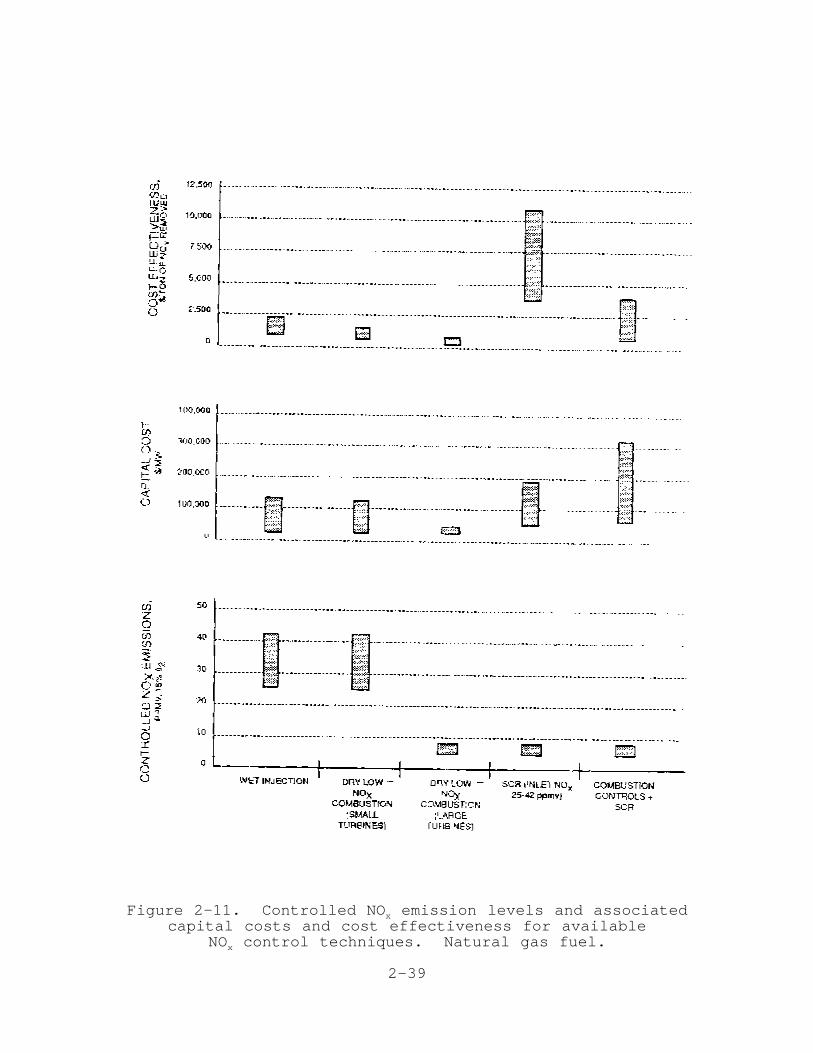
2.4 REVIEW OF CONTROLLED NO EMISSION LEVELS AND COSTSx
An overview of the performance and costs for available NOx
control techniques is presented in Figure 2-11.
2-39
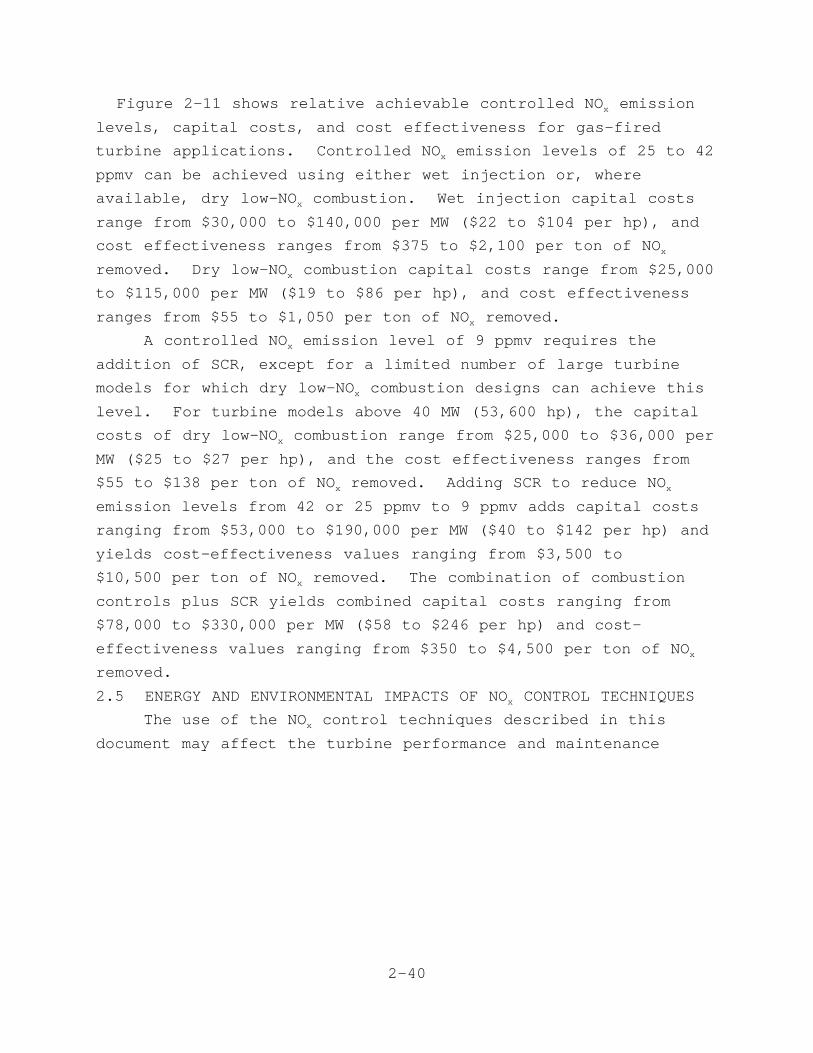
Figure 2-11. Controlled NO emission levels and associatedxcapital costs and cost effectiveness for available
NO control techniques. Natural gas fuel.x
2-40
Figure 2-11 shows relative achievable controlled NO emissionx
levels, capital costs, and cost effectiveness for gas-fired
turbine applications. Controlled NO emission levels of 25 to 42x
ppmv can be achieved using either wet injection or, where
available, dry low-NO combustion. Wet injection capital costsx
range from $30,000 to $140,000 per MW ($22 to $104 per hp), and
cost effectiveness ranges from $375 to $2,100 per ton of NOx
removed. Dry low-NO combustion capital costs range from $25,000x
to $115,000 per MW ($19 to $86 per hp), and cost effectiveness
ranges from $55 to $1,050 per ton of NO removed.x
A controlled NO emission level of 9 ppmv requires thex
addition of SCR, except for a limited number of large turbine
models for which dry low-NO combustion designs can achieve thisx
level. For turbine models above 40 MW (53,600 hp), the capital
costs of dry low-NO combustion range from $25,000 to $36,000 perx
MW ($25 to $27 per hp), and the cost effectiveness ranges from
$55 to $138 per ton of NO removed. Adding SCR to reduce NOx x
emission levels from 42 or 25 ppmv to 9 ppmv adds capital costs
ranging from $53,000 to $190,000 per MW ($40 to $142 per hp) and
yields cost-effectiveness values ranging from $3,500 to
$10,500 per ton of NO removed. The combination of combustionx
controls plus SCR yields combined capital costs ranging from
$78,000 to $330,000 per MW ($58 to $246 per hp) and cost-
effectiveness values ranging from $350 to $4,500 per ton of NOx
removed.
2.5 ENERGY AND ENVIRONMENTAL IMPACTS OF NO CONTROL TECHNIQUESx
The use of the NO control techniques described in thisx
document may affect the turbine performance and maintenance
2-41
requirements and may result in increased emissions of carbon
monoxide (CO), hydrocarbons (HC), and NH . These potential3
energy and environmental impacts are discussed in this section.
Water or steam injection affects turbine performance and in
some turbines also affects maintenance requirements. The
increased mass flow through the turbine resulting from water or
steam injection increases the available power output. The
quenching effect in the combustor, however, decreases combustion
efficiency, and consequently the efficiency of the turbine
decreases in most applications. The efficiency reduction is
greater for water than for steam injection, largely because the
heat of vaporization energy cannot be recovered in the turbine.
In applications where the steam can be produced from turbine
exhaust heat that would otherwise be rejected to the atmosphere,
the net gas turbine efficiency is increased with steam injection.
Injection of water or steam into the combustor increases the
maintenance requirements of the hot section of some turbine
models. Water injection generally has a greater impact than
steam on increased turbine maintenance. Water or steam injection
has the potential to increase CO and, to a lesser extent, HC
emissions, especially at water-to-fuel ratios above 0.8.
Turbine manufacturers report no significant performance
impacts for lean premixed combustors. Power output and
efficiency are comparable to conventional designs. No
maintenance impacts are reported, although long-term operating
experience is not available. Impacts on CO emissions vary for
different combustor designs. Limited data from three
manufacturers showed minimal or no increases in CO emissions for
controlled NO emission levels of 25 to 42 ppmv. For ax
controlled NO level of 9 ppmv, however, CO emissions increasedx
in from 10 to 25 ppmv in one manufacturer's combustor design.
For SCR, the catalyst reactor increases the back-pressure on
the turbine, which decreases the turbine power output by
approximately 0.5 percent. The addition of the SCR system and
associated controls and monitoring equipment increases plant
maintenance requirements, but it is expected that these

2-42
maintenance requirements are consistent with maintenance
schedules for other plant equipment. There is no impact on CO or
HC emissions from the turbine caused by the SCR system, but
ammonia slip through the catalyst reactor results in NH3
emissions. Ammonia slip levels are typically guaranteed by SCR
vendors at 10 ppmv, and operating experience indicates actual NH3
emissions are at or below this level.
3-43
3.0 STATIONARY GAS TURBINE DESCRIPTION AND INDUSTRY APPLICATIONS
This section describes the physical components and operating
cycles of gas turbines and how turbines are used in industry.
Projected growth in key industries is also presented.
3.1 GENERAL DESCRIPTION OF GAS TURBINES
A gas turbine is an internal combustion engine that operates
with rotary rather than reciprocating motion. A common example
of a gas turbine is the aircraft jet engine. In stationary
applications, the hot combustion gases are directed through one
or more fan-like turbine wheels to generate shaft horsepower
rather than the thrust propulsion generated in an aircraft
engine. Often the heat from the exhaust gases is recovered
through an add-on heat exchanger.

3-44
Figure 3-1
3-45
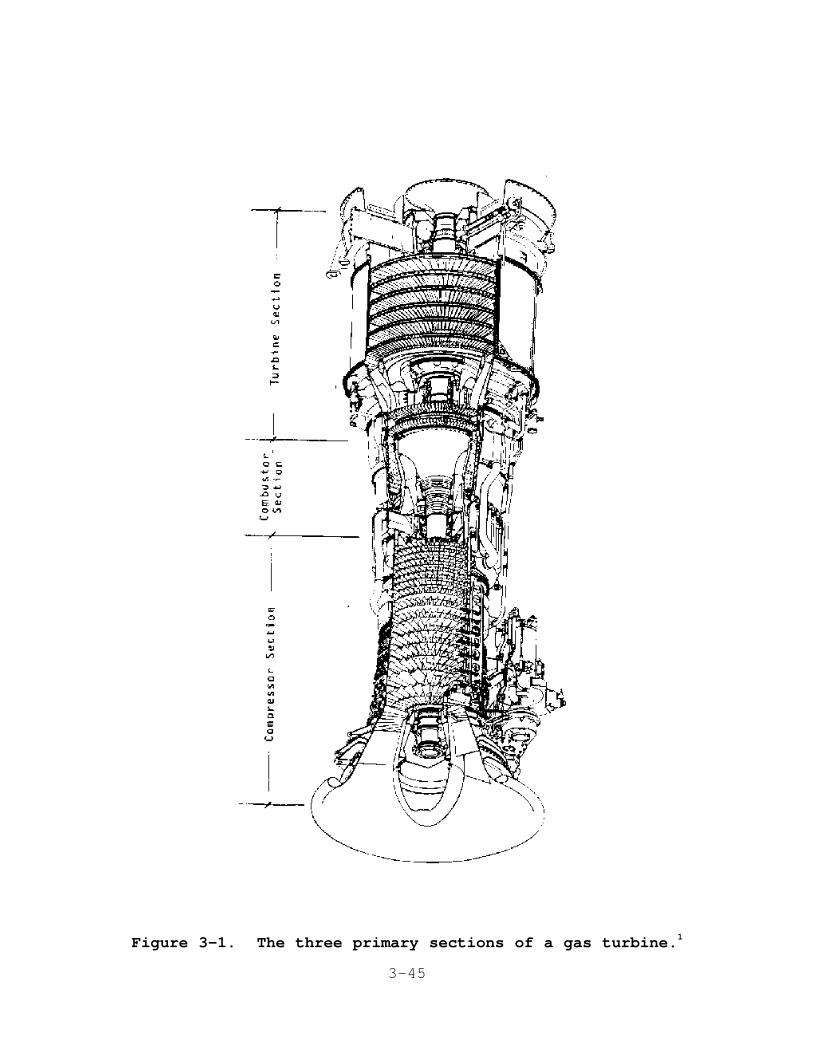
Figure 3-1. The three primary sections of a gas turbine.1
3-46
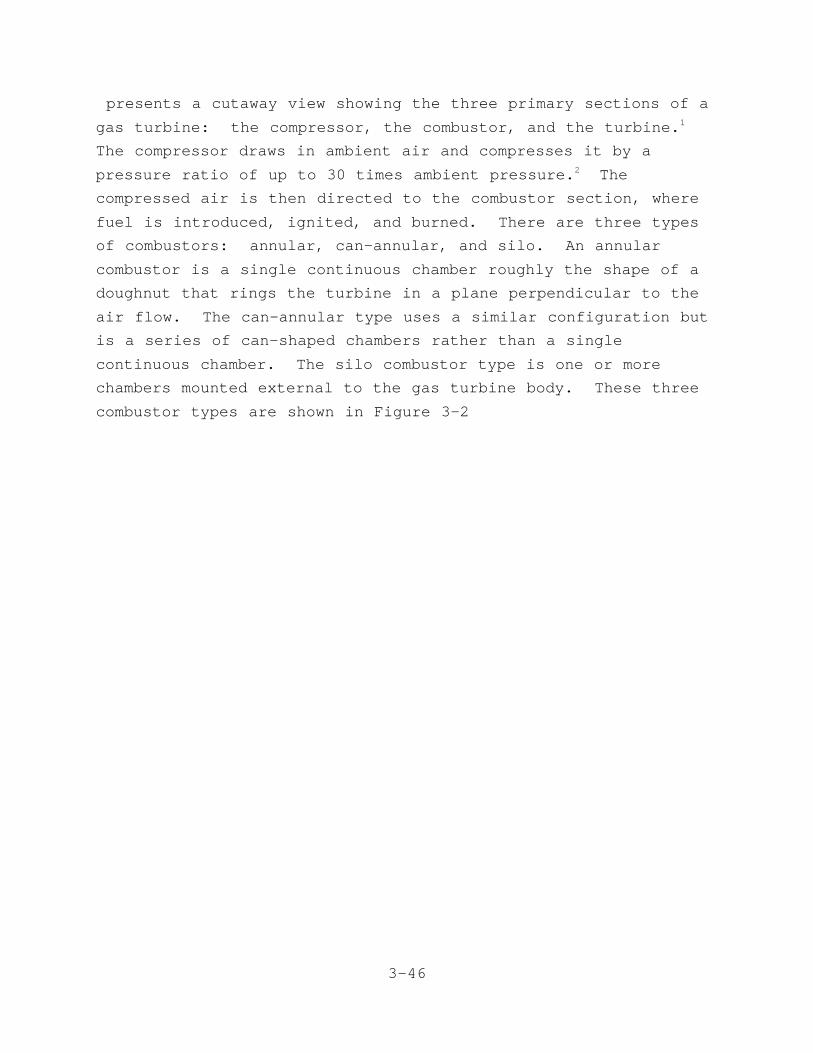
presents a cutaway view showing the three primary sections of a
gas turbine: the compressor, the combustor, and the turbine. 1
The compressor draws in ambient air and compresses it by a
pressure ratio of up to 30 times ambient pressure. The2
compressed air is then directed to the combustor section, where
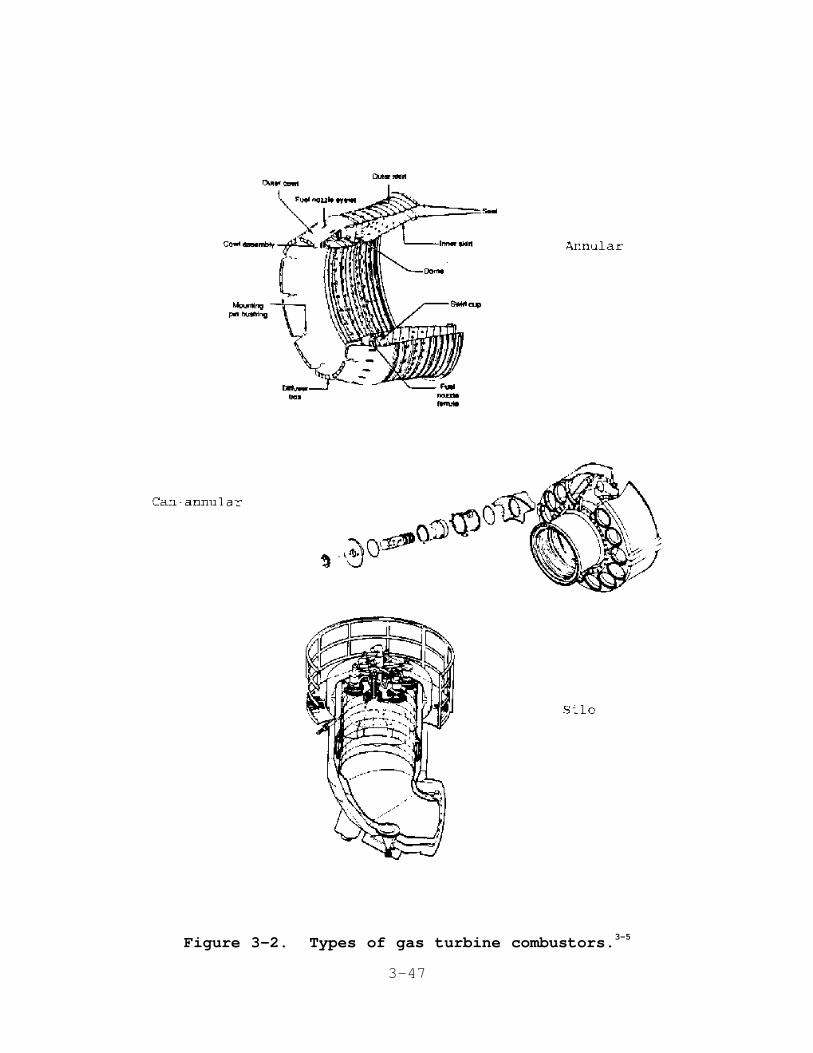
fuel is introduced, ignited, and burned. There are three types
of combustors: annular, can-annular, and silo. An annular
combustor is a single continuous chamber roughly the shape of a
doughnut that rings the turbine in a plane perpendicular to the
air flow. The can-annular type uses a similar configuration but
is a series of can-shaped chambers rather than a single
continuous chamber. The silo combustor type is one or more
chambers mounted external to the gas turbine body. These three
combustor types are shown in Figure 3-2
3-47
Figure 3-2. Types of gas turbine combustors.3-5

3-48
; further discussion of combustors is found in Chapter 5. 3-5
Flame temperatures in the combustor can reach 2000EC (3600EF). 6
The hot combustion gases

3-49
3-4
are then diluted with additional cool air from the compressor
section and directed to the turbine section at temperatures up to
1285EC (2350EF). Energy is recovered in the turbine section in6
the form of shaft horsepower, of which typically greater than
50 percent is required to drive the internal compressor section. 7
The balance of the recovered shaft energy is available to drive
the external load unit.
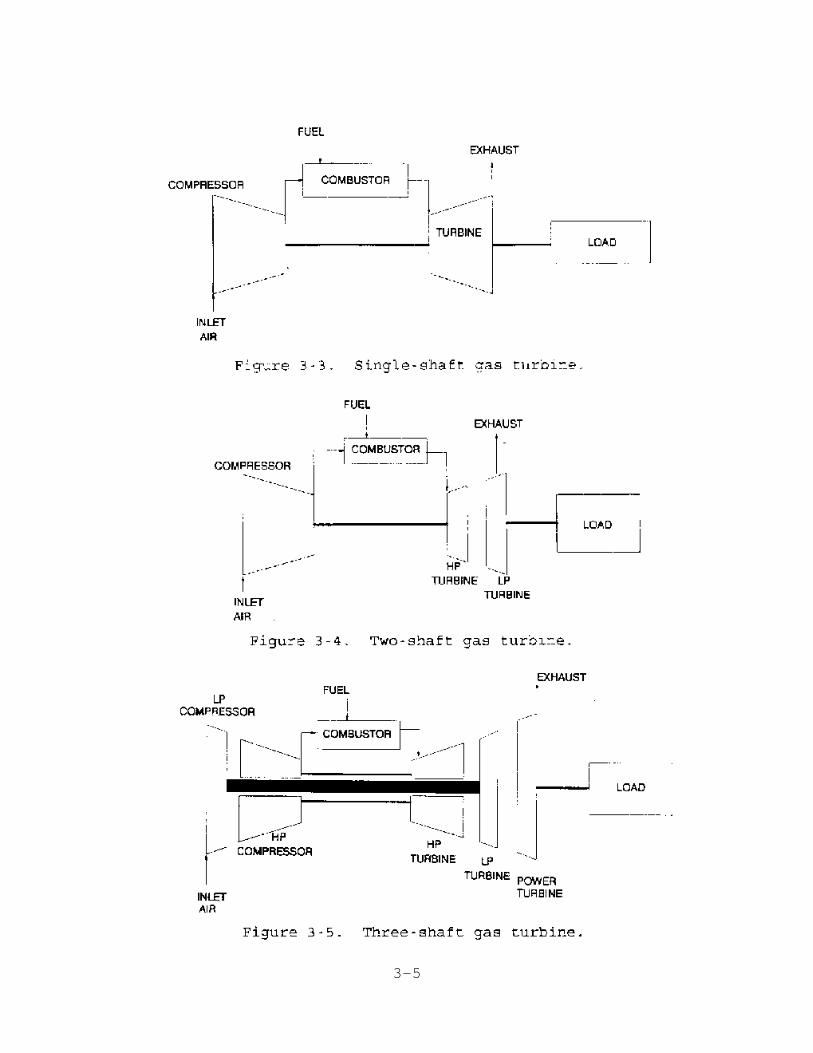
The compressor and turbine sections can each be a single
fan-like wheel assembly, or stage, but are usually made up of a
series of stages. In a single-shaft gas turbine, shown in
Figure 3-3
3-5
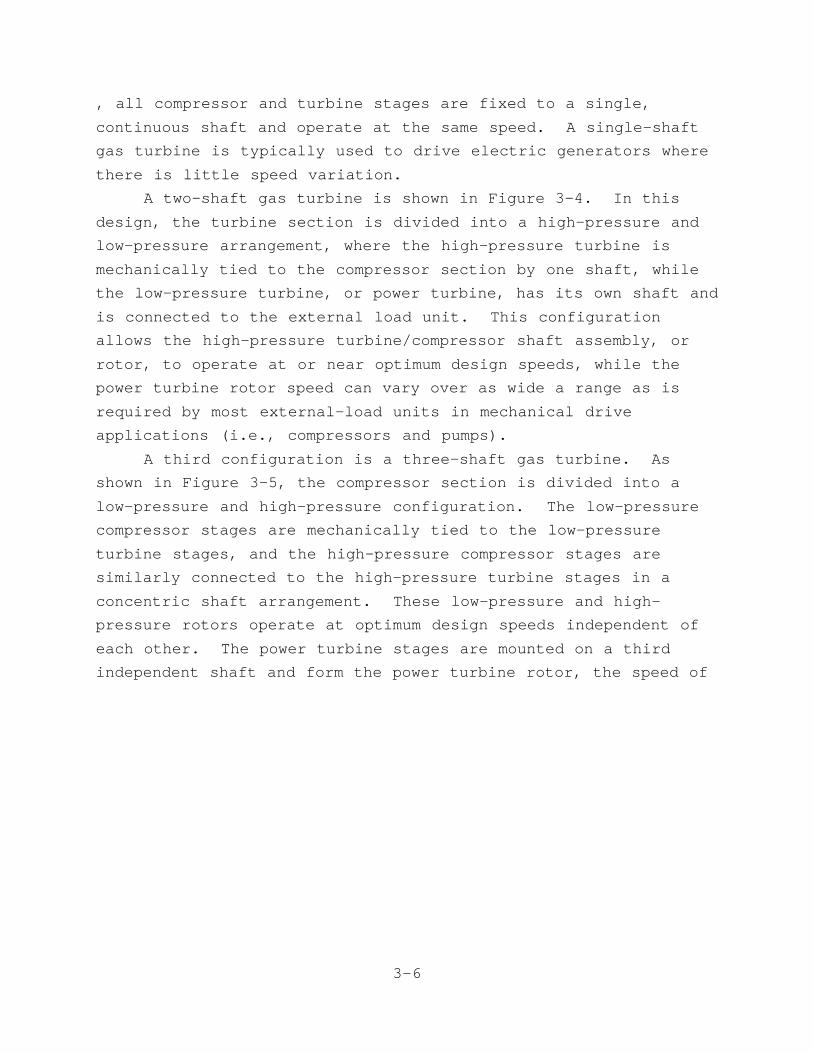
3-6
, all compressor and turbine stages are fixed to a single,
continuous shaft and operate at the same speed. A single-shaft
gas turbine is typically used to drive electric generators where
there is little speed variation.
A two-shaft gas turbine is shown in Figure 3-4. In this
design, the turbine section is divided into a high-pressure and
low-pressure arrangement, where the high-pressure turbine is
mechanically tied to the compressor section by one shaft, while
the low-pressure turbine, or power turbine, has its own shaft and
is connected to the external load unit. This configuration
allows the high-pressure turbine/compressor shaft assembly, or
rotor, to operate at or near optimum design speeds, while the
power turbine rotor speed can vary over as wide a range as is
required by most external-load units in mechanical drive
applications (i.e., compressors and pumps).
A third configuration is a three-shaft gas turbine. As
shown in Figure 3-5, the compressor section is divided into a
low-pressure and high-pressure configuration. The low-pressure
compressor stages are mechanically tied to the low-pressure
turbine stages, and the high-pressure compressor stages are
similarly connected to the high-pressure turbine stages in a
concentric shaft arrangement. These low-pressure and high-
pressure rotors operate at optimum design speeds independent of
each other. The power turbine stages are mounted on a third
independent shaft and form the power turbine rotor, the speed of
3-7
which can vary over as wide a range as is necessary for
mechanical drive applications.
Gas turbines can burn a variety of fuels. Most burn natural
gas, waste process gases, or liquid fuels such as distillate oils
(primarily No. 2 fuel oil). Some gas turbines are capable of
burning lower-grade residual or even crude oil with minimal
processing. Coal-derived gases can be burned in some turbines.
The capacity of individual gas turbines ranges from
approximately 0.08 to over 200 megawatts (MW) (107 to
268,000 horsepower [hp]). Manufacturers continue to increase2
the horsepower of individual gas turbines, and frequently they
are "ganged," or installed in groups so that the total horsepower
output from one location can meet virtually any installation's
power requirements.
Several characteristics of gas turbines make them attractive
power sources. These characteristics include a high horsepower-
to-size ratio, which allows for efficient space utilization, and
a short time from order placement to on-line operation. Many
suppliers offer the gas turbine, load unit, and all accessories
as a fully assembled package that can be performance tested at
the supplier's facility. This packaging is cost effective and
saves substantial installation time. Other advantages of gas
turbines are:
1. Low vibration;
2. High reliability;
3. No requirement for cooling water;
4. Suitability for remote operation;
5. Lower capital costs than reciprocating engines; and
6. Lower capital costs than boiler/steam turbine-based
electric power generating plants.8
3.2 OPERATING CYCLES
The four basic operating cycles for gas turbines are simple,
regenerative, cogeneration, and combined cycles. Each of these
cycles is described separately below.

3-8
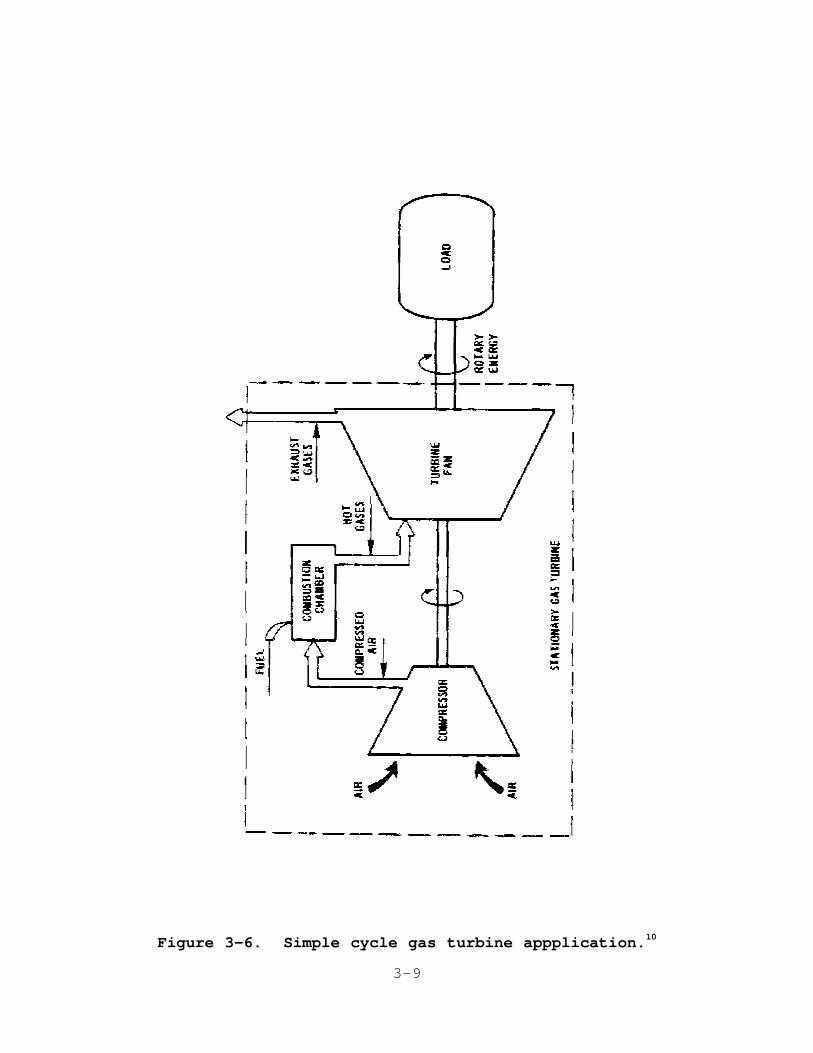
3.2.1 Simple Cycle
The simple cycle is the most basic operating cycle of a gas
turbine. In a simple cycle application, a gas turbine functions
with only the three primary sections described in Section 3.1, as
depicted in Figure 3-6.
3-9
Figure 3-6. Simple cycle gas turbine appplication.10
3-10
Cycle efficiency, defined as a percentage of useful shaft10
energy output to fuel energy input, is typically in the 30 to
35 percent range, although one manufacturer states an efficiency
of 40 percent for an engine recently introduced to the market. 9
In addition to shaft energy output, 1 to 2 percent of the fuel
input energy can be attributed to mechanical losses; the balance
is exhausted from the turbine in the form of heat. Simple cycle7
operation is typically used when there is a requirement for shaft
horsepower without recovery of the exhaust heat. This cycle
offers the lowest installed capital cost but also provides the
least efficient use of fuel and therefore the highest operating
cost.
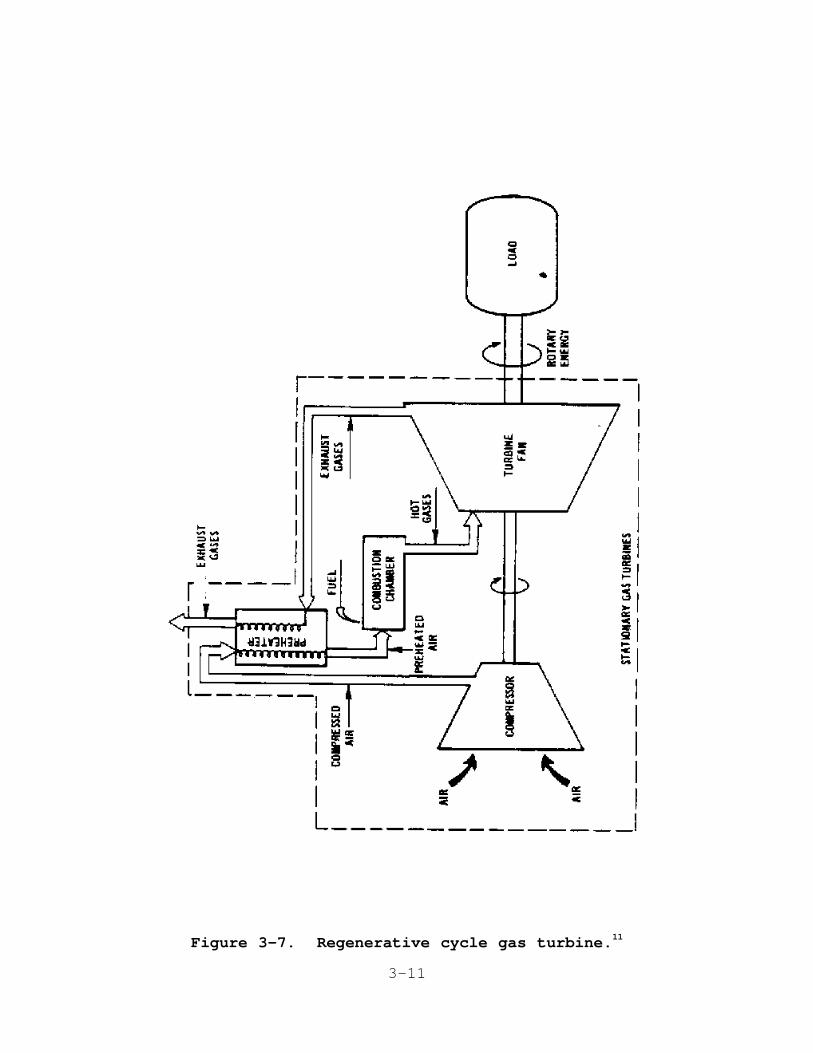
3.2.2 Regenerative Cycle
The regenerative cycle gas turbine is essentially a simple
cycle gas turbine with an added heat exchanger, called a
regenerator or recuperator, to preheat the combustion air. In
the regenerative cycle, thermal energy from the exhaust gases is
transferred to the compressor discharge air prior to being
introduced into the combustor. A diagram of this cycle is
depicted in Figure 3-7
3-11
Figure 3-7. Regenerative cycle gas turbine.11
3-12
. Preheating the combustion air reduces the amount of fuel11
required to reach design combustor temperatures and therefore
improves the overall cycle efficiency over that of simple cycle
operation. The efficiency gain is directly proportional to the
differential temperature between the exhaust gases and compressor
discharge air. Since the compressor discharge air temperature
increases with an increase in pressure ratio, higher regenerative
cycle efficiency gains are realized from lower compressor
pressure ratios typically found in older gas turbine models. 7
Most new or updated gas turbine models with high compressor
pressure ratios render regenerative cycle operation economically
unattractive because the capital cost of the regenerator cannot
be justified by the marginal fuel savings.

3-13

3-14
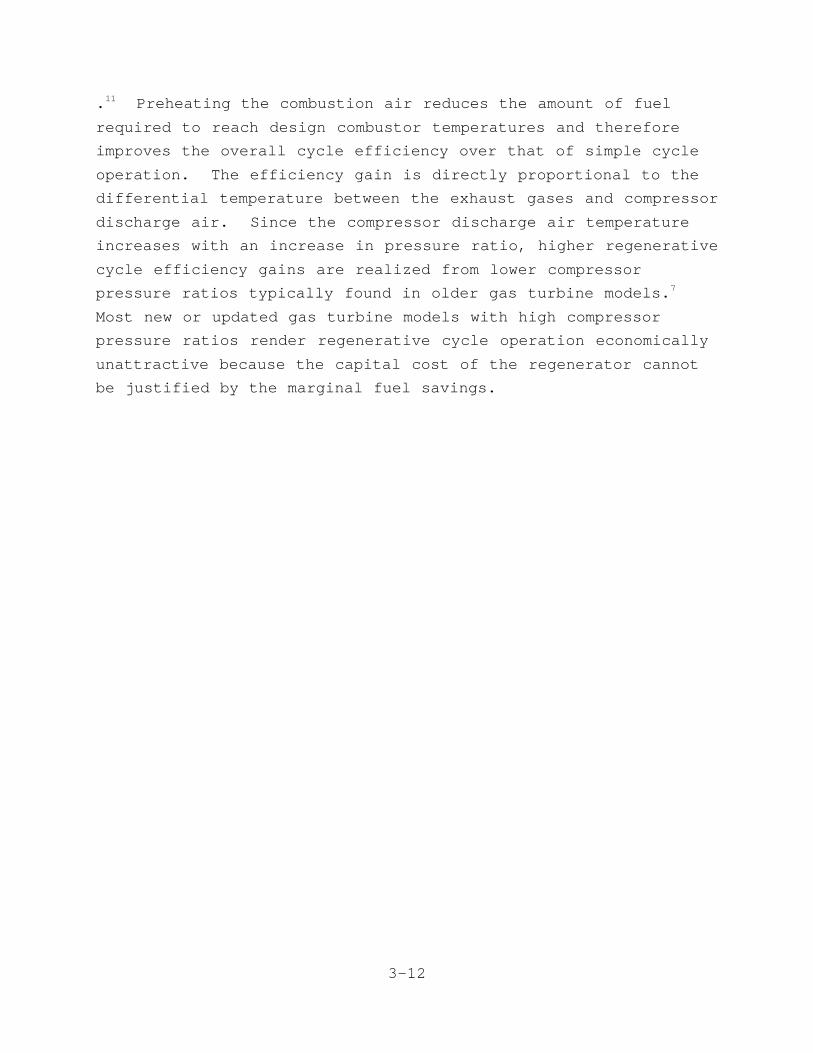
3.2.3 Cogeneration Cycle
A gas turbine used in a cogeneration cycle application is
essentially a simple cycle gas turbine with an added exhaust heat
exchanger, called a heat recovery steam generator (HRSG). This
configuration is shown in Figure 3-8
3-15
Figure 3-8. Cogeneration cycle gas turbine application.12
3-16
. The steam generated by the exhaust heat can be delivered at12
a variety of pressure and temperature conditions to meet site
thermal process requirements. Where the exhaust heat is not
sufficient to meet site requirements, a supplementary burner, or
duct burner, can be placed in the exhaust duct upstream of the
HRSG to increase the exhaust heat energy. Adding the HRSG
equipment increases the capital cost, but recovering the exhaust
heat increases the overall cycle efficiency to as high as
75 percent. 13
3.2.4 Combined Cycle
A combined cycle is the terminology commonly used for a gas
turbine/HRSG configuration as applied at an electric utility.
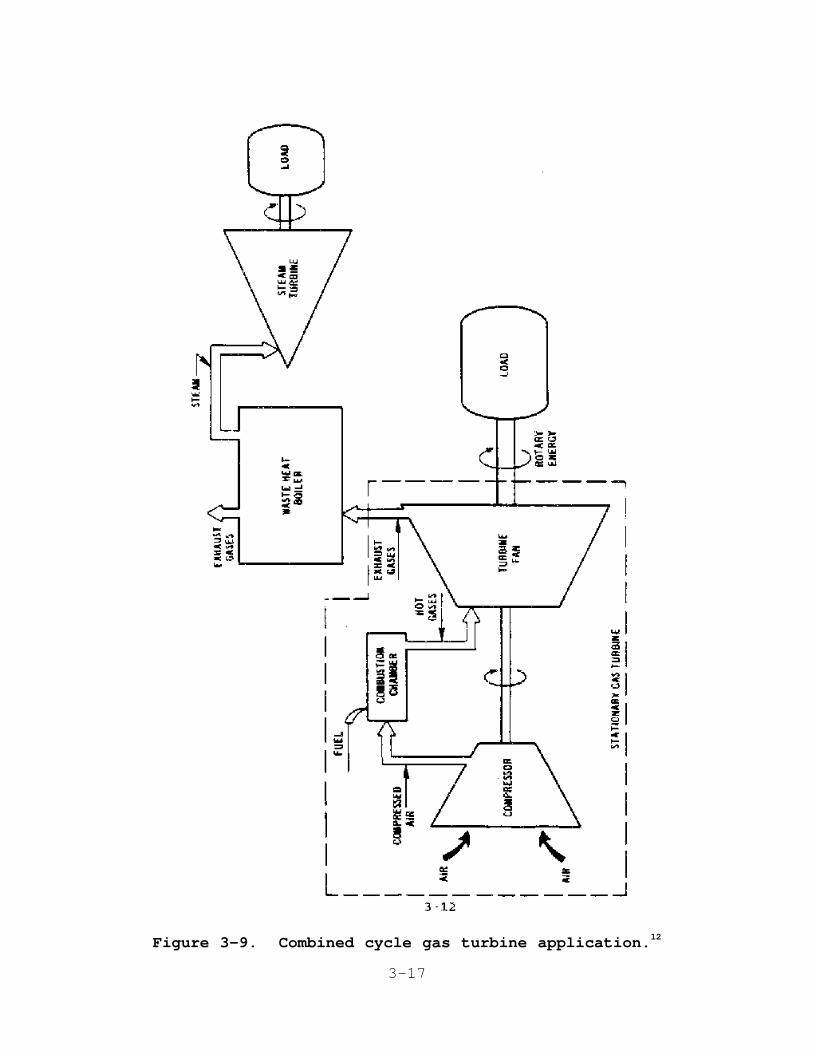
This cycle, shown in Figure 3-9
3-17
Figure 3-9. Combined cycle gas turbine application.12
3-18
, is used to generate electric power. The gas turbine drives12
an electric generator, and the steam produced in the HRSG is
delivered to a steam turbine, which also drives an electric
generator. The boiler may be supplementary-fired to increase the
steam production where desired. Cycle efficiencies can exceed
50 percent.
3.3 INDUSTRY APPLICATIONS
Gas turbines are used by industry in both mechanical and
electrical drive applications. Compressors and pumps are most
often the driven load unit in mechanical drive applications, and
electric generators are driven in electrical drive installations.
Few sites have gas/air compression or fluid pumping requirements
that exceed 15 MW (20,100 hp), and for this reason mechanical
drive applications generally use gas turbines in the 0.08- to
15.0-MW (107- to 20,100-hp) range. Electric power requirements14
range over the entire available range of gas turbines, however,
and all sizes can be found in electrical drive applications, from
0.08 to greater than 200 MW (107 to 268,000 hp).15
The primary applications for gas turbines can be divided
into five broad categories: the oil and gas industry,

3-19
3-20
stand-by/emergency electric power generation, independent
electric power producers, electric utilities, and other
industrial applications. Where a facility has a requirement16
for mechanical shaft power only, the installation is typically
simple or regenerative cycle. For facilities where either
electric power or mechanical shaft power and steam generation are
required, the installation is often cogeneration or combined
cycle to capitalize on these cycles' higher efficiencies.
3.3.1 Oil and Gas Industry
The bulk of mechanical drive applications are in the oil and
gas industry. Gas turbines in the oil and gas industry are used
primarily to provide shaft horsepower for oil and gas extraction
and transmission equipment, although they are also used in
downstream refinery operations. Most gas turbines found in this
industry are in the 0.08- to 15.0-MW (107- to 20,100-hp) range.
Gas turbines are particularly well suited to this industry,
as they can be fueled by a wide range of gaseous and liquid fuels
often available at the site. Natural gas and distillate oil are
the most common fuels. Many turbines can burn waste process
gases, and some turbines can burn residual oils and even crude
oil. In addition, gas turbines are suitable for remote
installation sites and unattended operation. Most turbines used
in this industry operate continuously, 8,000+ hours per year,
unless the installation is a pipeline transmission application
with seasonal operation.
Competition from reciprocating engines in this industry is
significant. Although gas turbines have a considerable capital
cost advantage, reciprocating engines require less fuel to
produce the same horsepower and consequently have a lower
operating cost. Selection of gas turbines vs. reciprocating17
engines is generally determined by site-specific criteria such as
installed capital costs, costs for any required emissions control
equipment, fuel costs and availability, annual operating hours,
installation and structural considerations, compatibility with
existing equipment, and operating experience.
3-21
3.3.2 Stand-By/Emergency Electric Power Generation
Small electric generator sets make up a considerable number
of all gas turbine sales under 3.7 MW (5,000 hp). The majority
of these installations provide backup or emergency power to
critical networks or equipment and use liquid fuel. Telephone
companies are a principal user, and hospitals and small
municipalities also are included in this market. These turbines
operate on an as-needed basis, which typically is between 75 and
200 hours per year.
Gas turbines offer reliable starting, low weight, small
size, low vibration, and relatively low maintenance, which are
important criteria for this application. Gas turbines in this
size range have a relatively high capital cost, however, and
reciprocating engines dominate this market, especially for
applications under 2,000 kW (2,700 hp). 18,19
3.3.3 Independent Electrical Power Producers
Large industrial complexes and refining facilities consume
considerable amounts of electricity, and many sites choose to
generate their own power. Gas turbines can be used to drive
electric generators in simple cycle operation, or an HRSG system
may be added to yield a more efficient cogeneration cycle. The
vast majority of cogeneration installations operate in a combined
cycle capacity, using a steam turbine to provide additional
electric power. The Public Utility Regulatory Policies Act
(PURPA) of 1978 encourages independent cogenerators to generate
electric power by requiring electric utilities to (1) purchase
electricity from qualifying producers at a price equal to the
cost the utility can avoid by not having to otherwise supply that
power (avoided cost) and (2) provide backup power to the
cogenerator at reasonable rates. Between 1980 and 1986,
approximately 20,000 MW of gas turbine-produced electrical
generating capacity was certified as qualifying for PURPA
benefits. This installed capacity by private industry power
generators is more than the sum of all utility gas turbine orders
for all types of central power plants during this period. The20
Department of Energy (DOE) expects an additional 27,000 MW
3-22
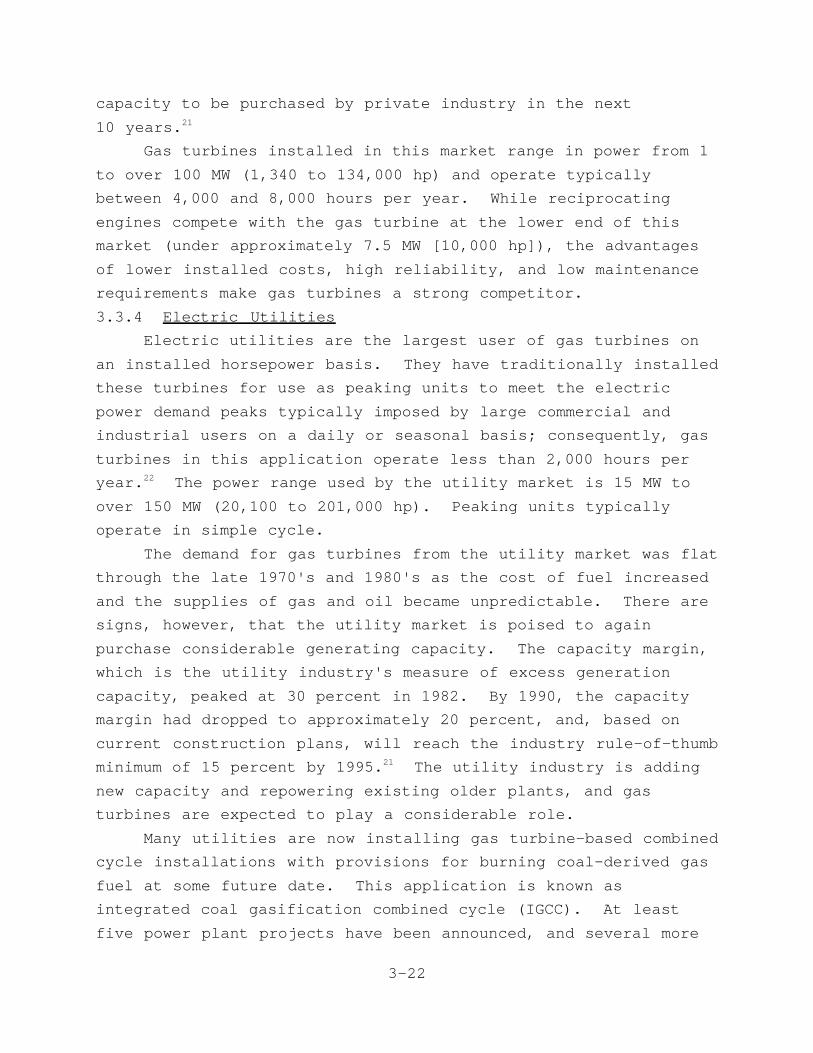
capacity to be purchased by private industry in the next
10 years.21
Gas turbines installed in this market range in power from 1
to over 100 MW (1,340 to 134,000 hp) and operate typically
between 4,000 and 8,000 hours per year. While reciprocating
engines compete with the gas turbine at the lower end of this
market (under approximately 7.5 MW [10,000 hp]), the advantages
of lower installed costs, high reliability, and low maintenance
requirements make gas turbines a strong competitor.
3.3.4 Electric Utilities
Electric utilities are the largest user of gas turbines on
an installed horsepower basis. They have traditionally installed
these turbines for use as peaking units to meet the electric
power demand peaks typically imposed by large commercial and
industrial users on a daily or seasonal basis; consequently, gas
turbines in this application operate less than 2,000 hours per
year. The power range used by the utility market is 15 MW to22
over 150 MW (20,100 to 201,000 hp). Peaking units typically
operate in simple cycle.
The demand for gas turbines from the utility market was flat
through the late 1970's and 1980's as the cost of fuel increased
and the supplies of gas and oil became unpredictable. There are
signs, however, that the utility market is poised to again
purchase considerable generating capacity. The capacity margin,
which is the utility industry's measure of excess generation
capacity, peaked at 30 percent in 1982. By 1990, the capacity
margin had dropped to approximately 20 percent, and, based on
current construction plans, will reach the industry rule-of-thumb
minimum of 15 percent by 1995. The utility industry is adding21
new capacity and repowering existing older plants, and gas
turbines are expected to play a considerable role.
Many utilities are now installing gas turbine-based combined
cycle installations with provisions for burning coal-derived gas
fuel at some future date. This application is known as
integrated coal gasification combined cycle (IGCC). At least
five power plant projects have been announced, and several more

3-23
are being negotiated. Capital costs for these plants are in many
cases higher than comparable natural gas-fueled applications, but
future price increases for natural gas could make IGCC an
attractive option for the future.23
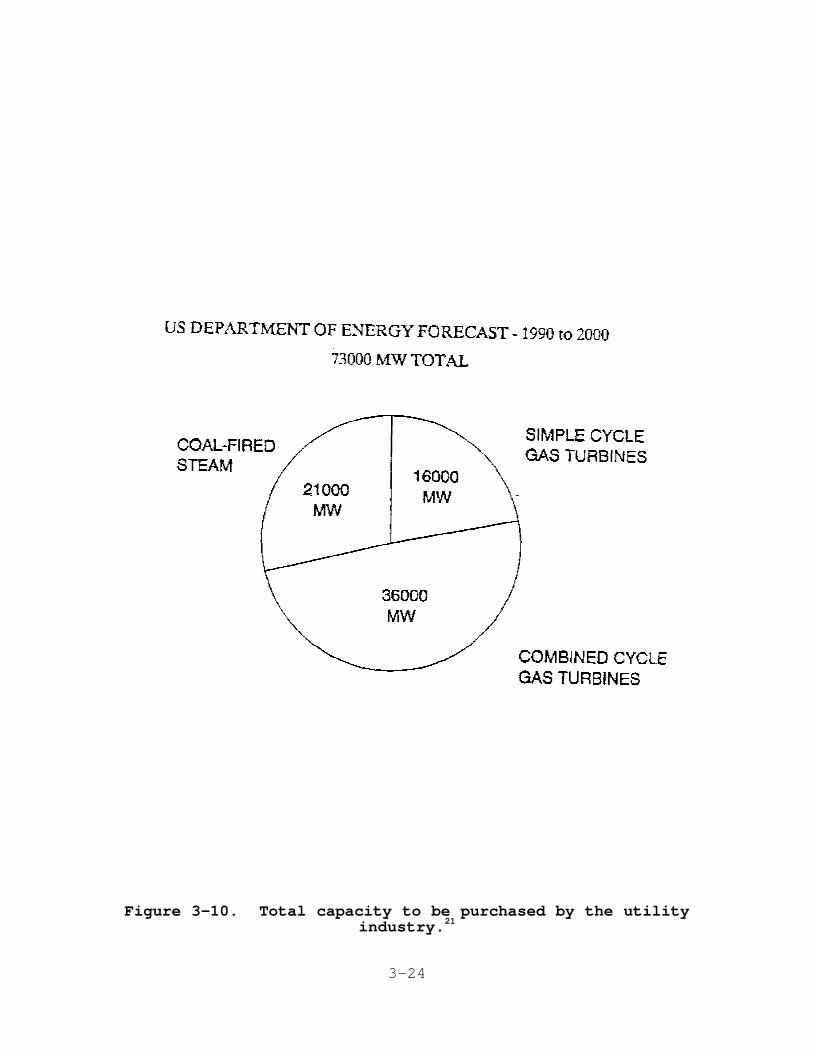
Utility orders for gas turbines have doubled in each of the
last 2 years. The DOE says that electric utilities will need to
add an additional 73,000 MW to capacity to meet demand by the
year 2000, and as Figure 3-10
3-24
Figure 3-10. Total capacity to be purchased by the utilityindustry.21
3-25
shows, DOE expects 36,000 MW of combined cycle and 16,000 MW of
simple cycle gas turbines to be purchased. This renewed interest
in gas turbines is a result of:
1. The introduction of new, larger, more efficient gas
turbines;
2. Lower natural gas prices and proven reserves to meet
current demand levels for more than 100 years;
3. Shorter lead times than those of competing equipment;
and
4. Lower capital costs for gas turbines.21

3-26
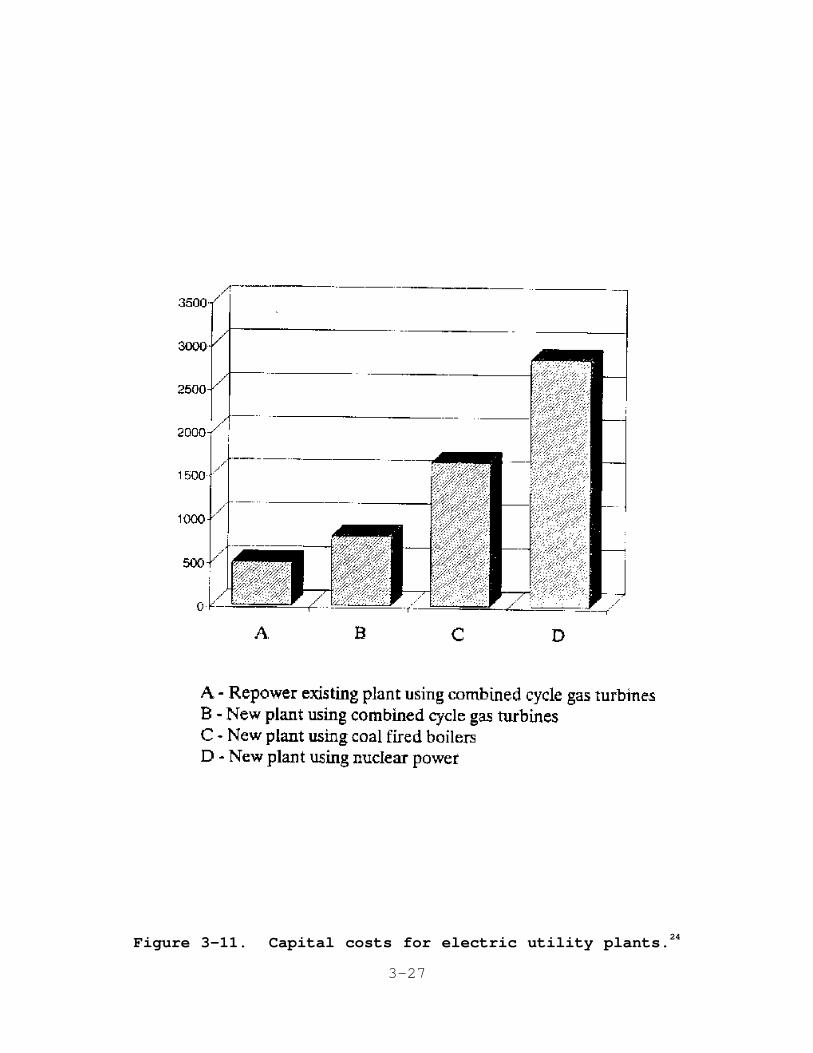
Utility capital cost estimates, as shown in Figure 3-11
3-27
Figure 3-11. Capital costs for electric utility plants.24
3-28
, are (1) $500 per KW for repowering existing plants with
combined cycle gas turbines, (2) $800 per KW for new combined
cycle plants, (3) $1,650 per KW for new coal-fired plants, and
(4) $2,850 per KW for new nuclear-powered plants.24
Gas turbines are also an alternative to displace planned or
existing nuclear facilities. A total of 1,020 MW of gas turbine-
generated electric power was recently commissioned in Michigan at
a plant where initial design and construction had begun for a
nuclear plant. Four additional idle nuclear sites are
considering switching to gas turbine-based power production due
to the legal, regulatory, financial, and public obstacles facing
nuclear facilities. 24
3.3.5 Other Industrial Applications
Industrial applications for gas turbines include various
types of mechanical drive and air compression equipment. These
applications peaked in the late 1960's and declined through the
1970's. With the promulgation of PURPA in 1978 (see25
Section 3.3.3), many industrial facilities have found it

3-29
3-30
economically feasible to install a combined cycle gas turbine to
meet power and steam requirements. Review of editions of Gas
Turbine World over the last several years shows that a broad
range of industries (e.g., pulp and paper, chemical, and food
processing) have installed combined cycle gas turbines to meet
their energy requirements.
3.4 REFERENCES FOR CHAPTER 3
1. Letters and attachments from Christie, A. R., GeneralElectric Company, to Snyder, R. B., MRI. January 1991. Gasturbine product literature.
2. 1990 Performance Specifications. Gas Turbine World. 11:20-48. 1990.
3. Letter and attachments from Sailer, E. D., General ElectricCompany, to Neuffer, W. J., EPA/ISB. August 29, 1991. Gasturbine product information.
4. Maghon, H., and A. Kreutzer (Siemens Product Group KWU,Muelheim, Germany), and H. Termuehlen (Utility PowerCorporation, Bradenton, Florida). The V84 Gas TurbineDesigned for Base-load and Peaking Duty. Presented at theAmerican Power Conference. Chicago. April 18-20, 1988. 20 pp.
5. Letter and attachments from Sailer, E. D., General ElectricCompany, to Snyder, R. B., Midwest Research Institute. August 24, 1991. Gas turbine product brochures.
6. Letter and attachments from Rosen, V., Siemens AG PowerGeneration Group KWU, to Neuffer, W. J., EPA/ISB. August 30, 1991. Gas turbine product information.
7. Brandt, D. C. GE Turbine Design Philosophy. GeneralElectric Company. Schenectady, New York. Presented at 33rdGE Turbine State-of-the-Art Technology Seminar forIndustrial, Cogeneration and Independent Power TurbineUsers. September 1989.
8. Standards Support and Environmental Impact Statement,Volume I: Proposed Standards of Performance for StationaryGas Turbines. U. S. Environmental Protection Agency. Research Triangle Park, NC. PublicationNo. EPA-450/2P77-017a. September 1977. pp. 3-1, 3-2.
9. General Electric Marine and Industrial Engineers. LM6000Gas Turbine. AG-3248. Cincinnati, Ohio. June 1990.
10. Reference 8, p. 3-37.
3-31
11. Reference 8, p. 3-43.
12. Reference 8, p. 3-44.
13. Kovick, J. M. Cogeneration Application Considerations. General Electric Company. Schenectady, New York. Presentedat 33rd GE Turbine State-of-the-Art Technology Seminar forIndustrial, Cogeneration and Independent Power TurbineUsers. September 1989.
14. Reference 8, p. 3-23.
15. Reference 8, pp. 3-10, 3-11, 3-12.
16. Reference 8, p. 3-18.
17. Reference 8, p. 3-24.
18. Reference 8, p. 3-26.
19. Letter and attachments from Swingle, R. L., Solar Turbines,Incorporated, to Neuffer, W. J., EPA:ISB. August 20, 1991. Gas turbine product information.
20. Williams, R., and E. Larson (Princeton University). Expanding Roles For Gas Turbines In Power Generation. Prepared for Vattenfall Electricity with the support of theOffice of Energy of the U.S. Agency for InternationalDevelopment. December 1985. p. 9.
21. Smock, R. W. Need Seen for New Utility Capacity in the'90's. Power Engineering. 93:29-31. April 1990.
22. Reference 4, p. 3-19.
23. Smock, R. W. Coalgas-fired Combined Cycle Projects Multiply. Power Engineering. 103:32-34. February, 1991.
24. Repowering Old Plants Gains Favor. Power Engineering. 94:25-27. May 1990.
25. Reference 4, p. 3-29.
4-1
4.0 CHARACTERIZATION OF NO EMISSIONS x
This section presents the principles of NO formation, thex
types of NO emitted (i.e., thermal NO , prompt NO , and fuelx x x
NO ), and how they are generated in a gas turbine combustionx
process. Estimated NO emission factors for gas turbines and thex
bases for the estimates are also presented.
4.1 THE FORMATION OF NO xNitrogen oxides form in the gas turbine combustion process
as a result of the dissociation of nitrogen (N ) and oxygen (O )2 2
into N and O, respectively. Reactions following this
dissociation result in seven known oxides of nitrogen: NO, NO ,2NO , N O, N O , N O , and N O . Of these, nitric oxide (NO) and3 2 2 3 2 4 2 5
nitrogen dioxide (NO ) are formed in sufficient quantities to be2
significant in atmospheric pollution. In this document, "NO "1x
refers to either or both of these gaseous oxides of nitrogen.
Virtually all NO emissions originate as NO. This NO isx
further oxidized in the exhaust system or later in the atmosphere
to form the more stable NO molecule. There are two mechanisms22
by which NO is formed in turbine combustors: (1) the oxidationx
of atmospheric nitrogen found in the combustion air (thermal NOx
and prompt NO ) and (2) the conversion of nitrogen chemicallyx
bound in the fuel (fuel NO ). These mechanisms are discussedx
below.
4.1.1 Formation of Thermal and Prompt NOx
Thermal NO is formed by a series of chemical reactions inx
which oxygen and nitrogen present in the combustion air
dissociate and subsequently react to form oxides of nitrogen.
4-2
The major contributing chemical reactions are known as the
Zeldovich mechanism and take place in the high temperature area
of the gas turbine combustor. Simply stated, the Zeldovich3
mechanism postulates that thermal NO formation increasesx
exponentially with increases in temperature and linearly with
increases in residence time.4
Flame temperature is dependent upon the equivalence ratio,
which is the ratio of fuel burned in a flame to the amount of
fuel that consumes all of the available oxygen. An equivalence5
ratio of 1.0 corresponds to the stoichiometric ratio and is the
point at which a flame burns at its highest theoretical
temperature. Figure 4-15
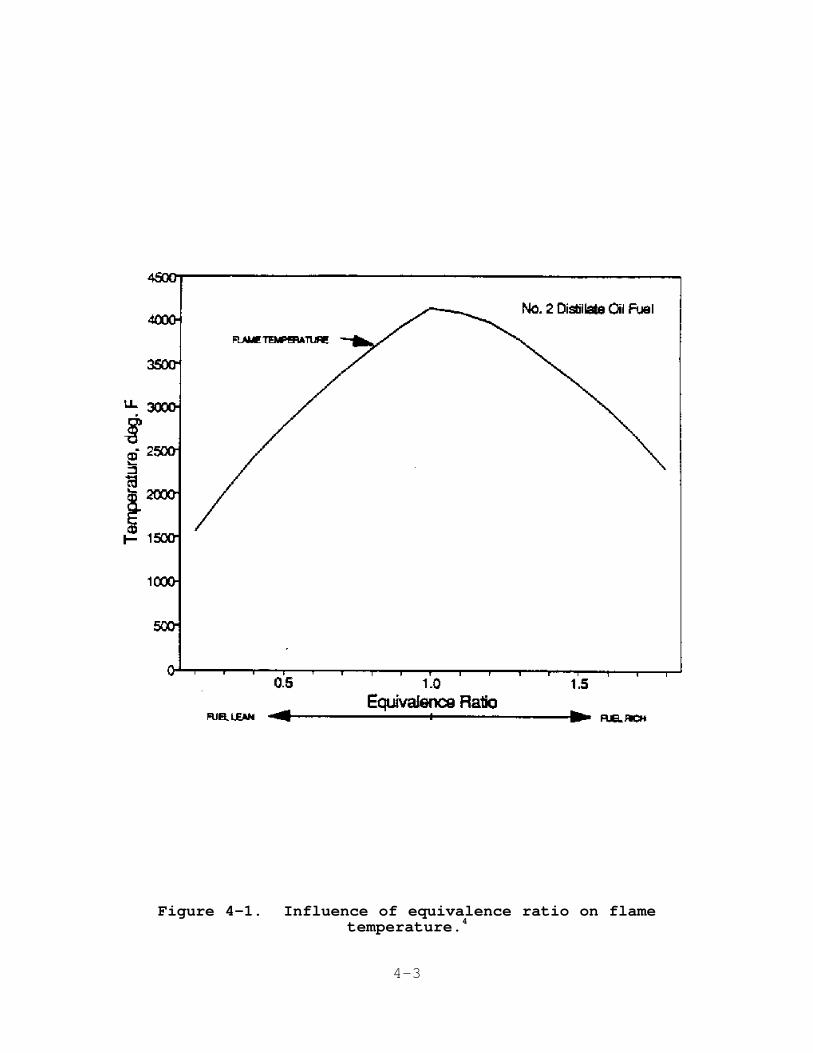
4-3
Figure 4-1. Influence of equivalence ratio on flametemperature.4
4-4
shows the flame temperature and equivalence ratio relationship
for combustion using No. 2 distillate fuel oil (DF-2).4
The series of chemical reactions that form thermal NOx
according to the Zeldovich mechanism are presented below.3
1. O º 2O;2
2. N º 2N;2
3. N + O º NO;
4. N + O º NO + O; and2
5. O + N º NO + N.2
This series of equations applies to a fuel-lean combustion
process. Combustion is said to be fuel-lean when there is excess
oxygen available (equivalence ratio <1.0). Conversely,
combustion is fuel-rich if insufficient oxygen is present to burn
all of the available fuel (equivalence ratio >1.0). Additional
equations have been developed that apply to fuel-rich combustion.
These equations are an expansion of the above series to add an
intermediate hydroxide molecule (OH):3

4-5
4-6
6. N + OH º NO + H,
and further to include an intermediate product, hydrogen cyanide
(HCN), in the formation process:3
7. N + CH º HCN + N and 2
8. N + OH º H + NO.
The overall equivalence ratio for gases exiting the gas
turbine combustor is less than 1.0. Fuel-rich areas do exist in4
the overall fuel-lean environment, however, due to
less-than-ideal fuel/air mixing prior to combustion. This being
the case, the above equations for both fuel-lean and fuel-rich
combustion apply for thermal NO formation in gas turbines. x
Prompt NO is formed in the proximity of the flame front asx
intermediate combustion products such as HCN, N, and NH are
oxidized to form NO as shown in the following equations:x
1. CH + N º HCN + N;2
2. CH + N º HCN + NH; and2 2
3. HCN, N, NH + O º NO +....x6
Prompt NO is formed in both fuel-rich flame zones andx
fuel-lean premixed combustion zones. The contribution of prompt
NO to overall NO emissions is relatively small in conventionalx x
near-stoichiometric combustors, but this contribution increases
with decreases in the equivalence ratio (fuel-lean mixtures).
For this reason, prompt NO becomes an important considerationx
for the low-NO combustor designs described in Chapter 5 andx
establishes a minimum NO level attainable in lean mixtures.x7
4.1.2 Formation of Fuel NOx
Fuel NO (also known as organic NO ) is formed when fuelsx x
containing nitrogen are burned. Molecular nitrogen, present as
4-7
N in some natural gas, does not contribute significantly to fuel2
NO formation. However, nitrogen compounds are present in coalx8
and petroleum fuels as pyridine-like (C H N) structures that tend5 5
to concentrate in the heavy resin and asphalt fractions upon
distillation. Some low-British thermal unit (Btu) synthetic
fuels contain nitrogen in the form of ammonia (NH ), and other3
low-Btu fuels such as sewage and process waste-stream gases also
contain nitrogen. When these fuels are burned, the nitrogen
bonds break and some of the resulting free nitrogen oxidizes to
form NO . With excess air, the degree of fuel NO formation isx x9
primarily a function of the nitrogen content in the fuel. The
fraction of fuel-bound nitrogen (FBN) converted to fuel NOx
decreases with increasing nitrogen content, although the absolute
magnitude of fuel NO increases. For example, a fuel withx
0.01 percent nitrogen may have 100 percent of its FBN converted
to fuel NO , whereas a fuel with a 1.0 percent FBN may have onlyx
a 40 percent fuel NO conversion rate. The low-percentage FBNx
fuel has a 100 percent conversion rate, but its overall NOx
emission level would be lower than that of the high-percentage
FBN fuel with a 40 percent conversion rate. 10
Nitrogen content varies from 0.1 to 0.5 percent in most
residual oils and from 0.5 to 2 percent for most U.S. coals. 11
Traditionally, most light distillate oils have had less than
0.015 percent nitrogen content by weight. However, today many
distillate oils are produced from poorer-quality crudes,
especially in the northeastern United States, and these
distillate oils may contain percentages of nitrogen exceeding the
0.015 threshold; this higher nitrogen content can increase fuel
NO formation. At least one gas turbine installation burningx4
coal-derived fuel is in commercial operation in the United
States.12
Most gas turbines that operate in a continuous duty cycle
are fueled by natural gas that typically contains little or no
FBN. As a result, when compared to thermal NO , fuel NO is not x x
4-8
currently a major contributor to overall NO emissions fromx
stationary gas turbines.
4.2 UNCONTROLLED NO EMISSIONSx
The NO emissions from gas turbines are generated entirelyx
in the combustor section and are released into the atmosphere via
the stack. In the case of simple and regenerative cycle
operation, the combustor is the only source of NO emissions. Inx
cogeneration and combined cycle applications, a duct burner may
be placed in the exhaust ducting between the gas turbine and the
heat recovery steam generator (HRSG); this burner also generates
NO emissions. (Gas turbine operating cycles are discussed inx
Section 3.2.) The amount of NO formed in the combustion zone isx
"frozen" at this level regardless of any temperature reductions
that occur at the downstream end of the combustor and is released
to the atmosphere at this level.1
4.2.1 Parameters Influencing Uncontrolled NO Emissionsx
The level of NO formation in a gas turbine, and hence thex
NO emissions, is unique (by design factors) to each gas turbinex
model and operating mode. The primary factors that determine the
amount of NO generated are the combustor design, the types ofx
fuel being burned, ambient conditions, operating cycles, and the
power output level as a percentage of the rated full power output
of the turbine. These factors are discussed below.
4.2.1.1 Combustor Design. The design of the combustor is
the most important factor influencing the formation of NO . x
Design considerations are presented here and discussed further in
Chapter 5.
Thermal NO formation, as discussed in Section 4.1.1, isx
influenced primarily by flame temperature and residence time.
Design parameters controlling equivalence ratios and the
introduction of cooling air into the combustor strongly influence
thermal NO formation. The extent of fuel/air mixing prior tox
combustion also affects NO formation. Simultaneous mixing andx
combustion results in localized fuel-rich zones that yield high
flame temperatures in which substantial thermal NO production x

4-9
takes place. The dependence of thermal NO formation on flame13x
temperature and equivalence ratio is shown in Figure 4-2
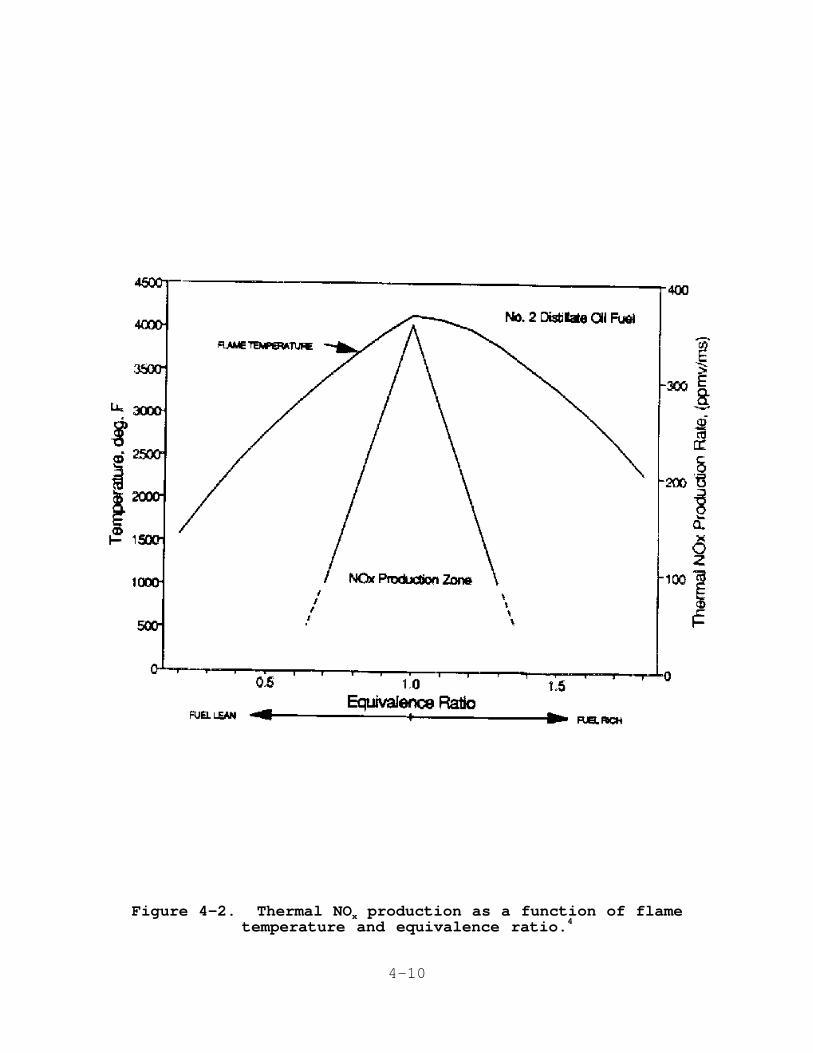
4-10
Figure 4-2. Thermal NO production as a function of flamextemperature and equivalence ratio.4
4-11
for DF-2. Conversely, prompt NO is largely insensitive to4x
changes in temperature and pressure.7
Fuel NO formation, as discussed in Section 4.1.2, is formedx
when FBN is released during combustion and oxidizes to form NO . x
Design parameters that control equivalence ratio and residence
time influence fuel NO formation.x14
4.2.1.2 Type of Fuel. The level of NO emissions variesx
for different fuels. In the case of thermal NO , this levelx
increases with flame temperature. For gaseous fuels, the
constituents in the gas can significantly affect NO emissionsx
levels. Gaseous fuel mixtures containing hydrocarbons with
molecular weights higher than that of methane (e.g., ethane,
propane, and butane) burn at higher flame temperatures and as a
result can increase NO emissions greater than 50 percent overx
NO levels for methane gas fuel. Refinery gases and somex
unprocessed field gases contain significant levels of these
higher molecular weight hydrocarbons. Conversely, gas fuels that
contain significant inert gases, such as CO , generally produce2
lower NO emissions. These inert gases serve to absorb heatx
during combustion, thereby lowering flame temperatures and
reducing NO emissions. Examples of this type of gas fuel arex
air-blown gasifier fuels and some field gases. Combustion of15
hydrogen also results in high flame temperatures, and gases with
significant hydrogen content produce relatively high NOx
emissions. Refinery gases can have hydrogen contents exceeding
50 percent.16

4-12
As is shown in Figure 4-3
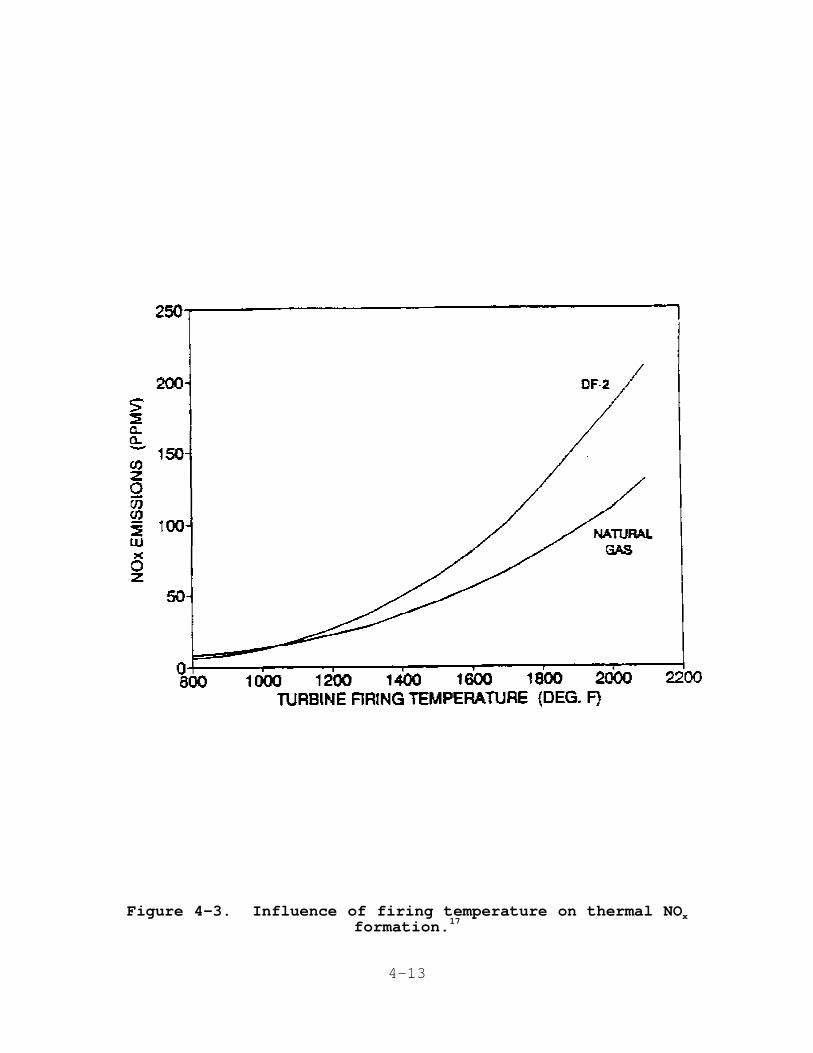
4-13
Figure 4-3. Influence of firing temperature on thermal NOxformation.17

4-14
, DF-2 burns at a flame temperature that is approximately 75EC
(100EF) higher than that of natural gas, and as a result, NOx
emissions are higher when burning DF-2 than they are when burning
natural gas. Low-Btu fuels such as coal gas burn with lower17
flame temperatures, which result in

4-15
4-16
substantially lower thermal NO emissions than natural gas orx
DF-2. For fuels containing FBN, the fuel NO production18x
increases with increasing levels of FBN.
4.2.1.3 Ambient Conditions. Ambient conditions that affect
NO formation are humidity, temperature, and pressure. Of thesex
ambient conditions, humidity has the greatest effect on NOx
formation. The energy required to heat the airborne water19
vapor has a quenching effect on combustion temperatures, which
reduces thermal NO formation. At low humidity levels, NOx x
emissions increase with increases in ambient temperature. At
high humidity levels, the effect of changes in ambient
temperature on NO formation varies. At high humidity levels andx
low ambient temperatures, NO emissions increase with increasingx
temperature. Conversely, at high humidity levels and ambient
temperatures above 10EC (50EF), NO emissions decrease withx
increasing temperature.
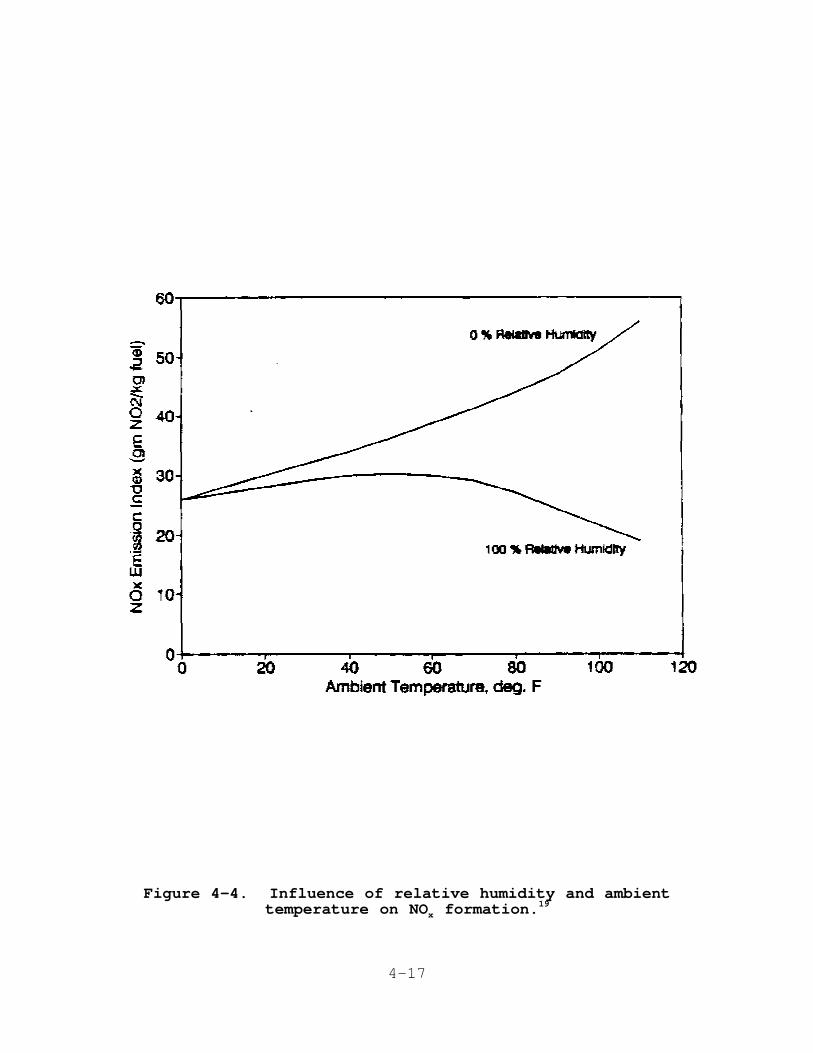
4-17
Figure 4-4. Influence of relative humidity and ambienttemperature on NO formation.x
19
4-18
This effect of humidity and temperature on NO formation is shownx
in Figure 4-4. A rise in ambient pressure results in higher
pressure and temperature levels entering the combustor and so Nox
production levels increase with increases in ambient pressure. 19
The influence of ambient conditions on measured NO emissionx
levels can be corrected using the following equation:20
NO = (NO )(P /P ) e (288EK/T )x xo r o a0.5 19(Ho-0.00633) 1.53
where:
NO = emission rate of NO at 15 percent O and Internationalx x 2Standards Organization (ISO) ambient conditions, volumepercent;
NO = observed NO concentration, parts per million by volumexo x(ppmv) referenced to 15 percent O ; 2
P = reference compressor inlet absolute pressure atr101.3 kilopascals ambient pressure, millimeters mercury(mm Hg);
P = observed compressor inlet absolute pressure at test, mmoHg;

4-19
4-20
H = observed humidity of ambient air, g H O/g air;o 2
e = transcendental constant, 2.718; and
T = ambient temperature, K.a
At least two manufacturers state that this equation does not
accurately correct NO emissions for their turbine models.x8,12
It is expected that these turbine manufacturers could provide
corrections to this equation that would more accurately correct
NO emissions for the effects of ambient conditions based on testx
data for their turbine models.
4.2.1.4 Operating Cycles. Emissions from identical
turbines used in simple and cogeneration cycles have similar NOx
emissions levels, provided no duct burner is used in heat
recovery applications. The NO emissions are similar because, asx
stated in Section 4.2, NO is formed only in the turbinex
combustor and remains at this level regardless of downstream
temperature reductions. A turbine operated in a regenerative
cycle produces higher NO levels, however, due to increasedx
combustor inlet temperatures present in regenerative cycle
applications.21
4.2.1.5 Power Output Level. The power output level of a
gas turbine is directly related to the firing temperature, which
is directly related to flame temperature. Each gas turbine has a
base-rated power level and corresponding NO level. At powerx
outputs below this base-rated level, the flame temperature is
lower, so NO emissions are lower. Conversely, at peak powerx
outputs above the base rating, NO emissions are higher due tox
higher flame temperature. The NO emissions for a range ofx
firing temperatures are shown in Figure 4-3 for one
manufacturer's gas turbine.17
4.2.2 NO Emissions From Duct Burnersx
In some cogeneration and combined cycle applications, the
exhaust heat from the gas turbine is not sufficient to produce
the desired quantity of steam from the HRSG, and a supplemental
burner, or duct burner, is placed in the exhaust duct between the
gas turbine and HRSG to increase temperatures to sufficient
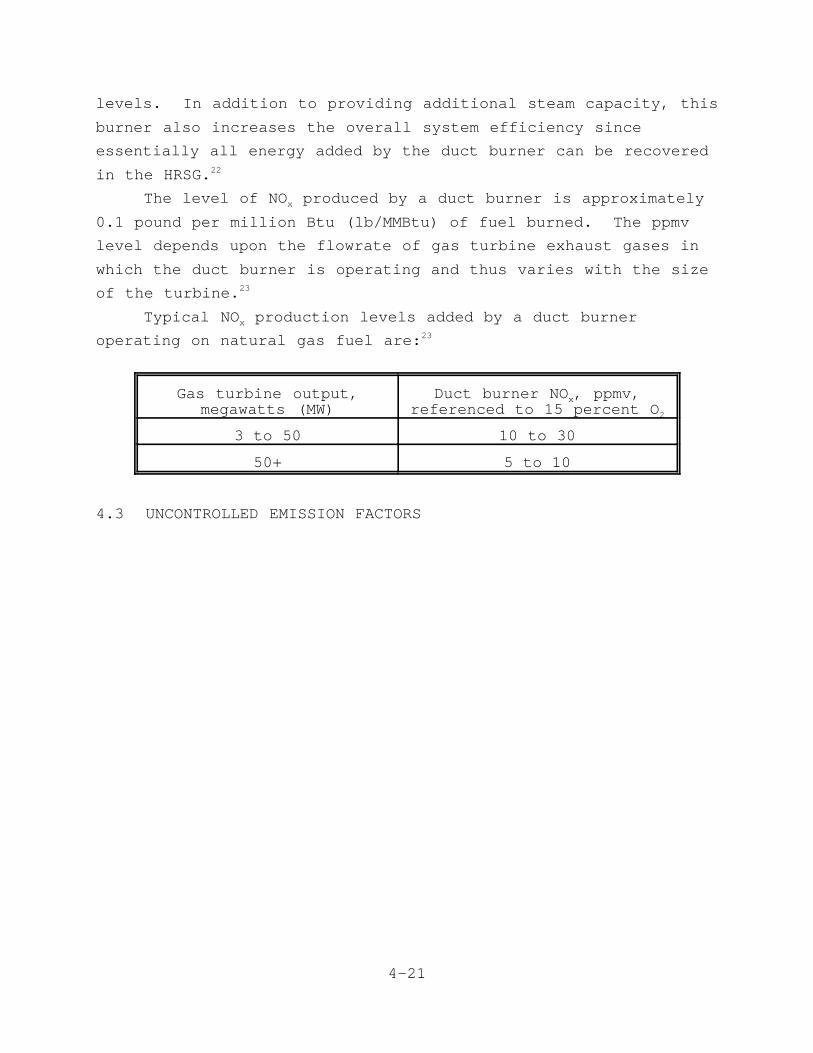
4-21
levels. In addition to providing additional steam capacity, this
burner also increases the overall system efficiency since
essentially all energy added by the duct burner can be recovered
in the HRSG. 22
The level of NO produced by a duct burner is approximatelyx
0.1 pound per million Btu (lb/MMBtu) of fuel burned. The ppmv
level depends upon the flowrate of gas turbine exhaust gases in
which the duct burner is operating and thus varies with the size
of the turbine.23
Typical NO production levels added by a duct burnerx
operating on natural gas fuel are:23
Gas turbine output, Duct burner NO , ppmv,megawatts (MW) referenced to 15 percent O
x
2
3 to 50 10 to 30
50+ 5 to 10
4.3 UNCONTROLLED EMISSION FACTORS

4-22
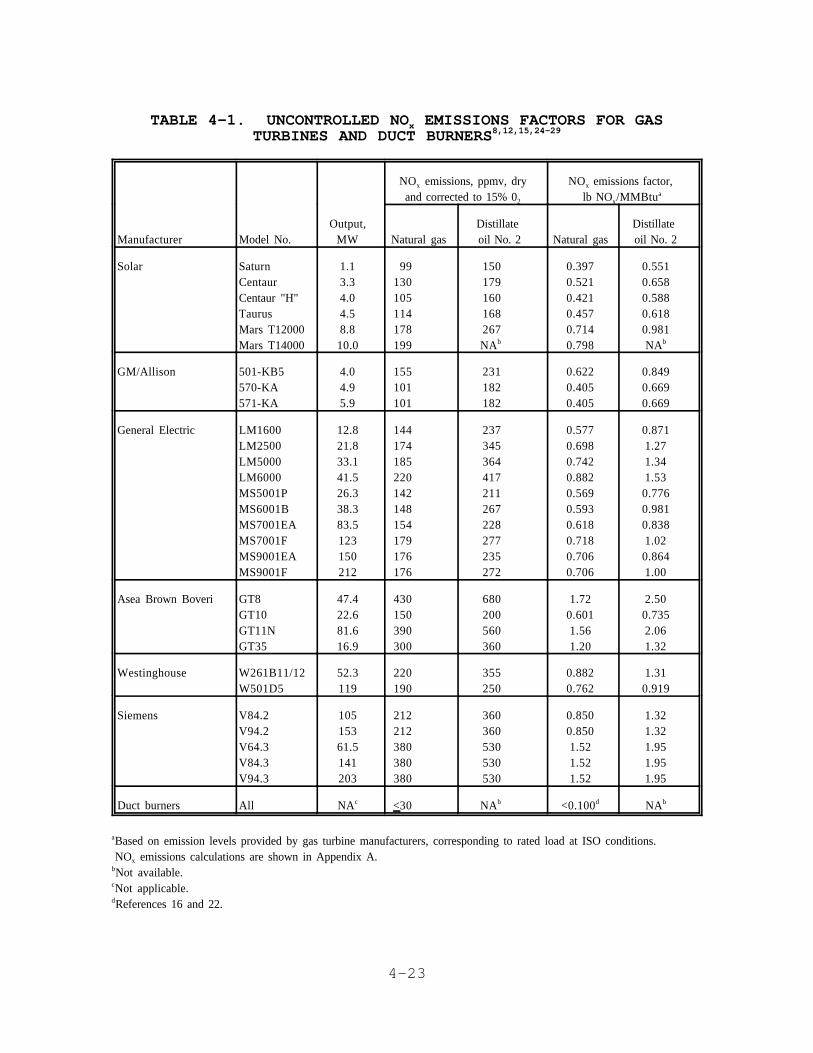
4-23
TABLE 4-1. UNCONTROLLED NO EMISSIONS FACTORS FOR GASxTURBINES AND DUCT BURNERS8,12,15,24-29
NO emissions, ppmv, dryx
and corrected to 15% 02
NO emissions factor, x
lb NO /MMBtuxa
Manufacturer Model No.Output,
MW Natural gasDistillate oil No. 2 Natural gas
Distillate oil No. 2
Solar SaturnCentaurCentaur "H"TaurusMars T12000Mars T14000
1.13.34.04.58.810.0
99130105114178199
150179160168267NAb
0.3970.5210.4210.4570.7140.798
0.5510.6580.5880.6180.981NAb
GM/Allison 501-KB5570-KA571-KA
4.04.95.9
155101101
231182182
0.6220.4050.405
0.8490.6690.669
General Electric LM1600LM2500LM5000LM6000MS5001PMS6001BMS7001EAMS7001FMS9001EAMS9001F
12.821.833.141.526.338.383.5123150212
144174185220142148154179176176
237345364417211267228277235272
0.5770.6980.7420.8820.5690.5930.6180.7180.7060.706
0.8711.271.341.530.7760.9810.8381.020.8641.00
Asea Brown Boveri GT8GT10GT11NGT35
47.422.681.616.9
430150390300
680200560360
1.720.6011.561.20
2.500.7352.061.32
Westinghouse W261B11/12W501D5
52.3119
220190
355250
0.8820.762
1.310.919
Siemens V84.2V94.2V64.3V84.3V94.3
10515361.5141203
212212380380380
360360530530530
0.8500.8501.521.521.52
1.321.321.951.951.95
Duct burners All NAc <30 NAb <0.100d NAb
Based on emission levels provided by gas turbine manufacturers, corresponding to rated load at ISO conditions.a
NO emissions calculations are shown in Appendix A.x
Not available.b
Not applicable.c
References 16 and 22.d
4-24
Uncontrolled emission factors are presented in Table 4-1.
These factors are based on uncontrolled emission levels provided
by manufacturers in ppmv, dry, and corrected to 15 percent O ,2corresponding to 100 percent output load and International
Standards Organization (ISO) conditions of 15EC (59EF) and 1
atmosphere (14.7 psia). Sample calculations are given in
Appendix A. The uncontrolled emissions factors range from 0.397
to 1.72 lb/MMBtu (99 to 430 ppmv) for natural gas and 0.551 to
2.50 lb/MMBtu (150 to 680 ppmv) for DF-2.

4-25
4-26
4.4 REFERENCES FOR CHAPTER 4
1. Control Techniques for Nitrogen Oxides Emissions FromStationary Sources - Revised Second Edition. U. S.Environmental Protection Agency. Research Triangle Park,NC. Publication No. EPA-450/3-83-002. January 1983. p. 2-1.
2. Stationary Internal Combustion Engines. Standards Supportand Environmental Impact Statement, Volume I: ProposedStandards of Performance. U. S. Environmental ProtectionAgency. Research Triangle Park, NC. PublicationNo. EPA-450/2-78-125a. July 1979. p. 4-3.
3. Standards Support and Environmental Impact Statement,Volume I: Proposed Standards of Performance for StationaryGas Turbines. U. S. Environmental Protection Agency. Research Triangle Park, NC. PublicationNo. EPA-450/277-011a. September 1977. pp. 3-71, 3-72.
4. Schorr, M. NO Control for Gas turbines: Regulations andxTechnology. General Electric Company. Schenectady, NY. For presentation at the Council of Industrial Boiler OwnersNO Control IV Conference. February 11-12, 1991. pp. 3-5.x
5. Davis, L. Dry Low NO Combustion for GE Heavy-Duty GasxTurbines. General Electric Company. Schenectady, NY. Presented at 33rd GE Turbine State-of-the-Art Technologyseminar for Industrial, Cogeneration and Independent PowerTurbine Users. September 1989.
6. Malte, P.C. Perspectives on NO Formation and Control ForxGas Turbine Engines. University of Washington (Seattle, WA)and Energy International (Bellevue, WA). Presented atGeneral Electric Research Center. Schenectady, NY. October 10, 1988. 46 pp.
7. Semerjian, H., and A. Vranos. NO Formation in PremixedxTurbulent Flames. Pratt and Whitney Aircraft and UnitedTechnologies Research Center, United TechnologiesCorporation. East Hartford, CT. 1976. 10 pp.
8. Letter and attachments from Rosen, V., Siemens AG PowerGeneration Group KWU, to Neuffer, W. J., EPA/ISB. August 30, 1991. Review of the draft gas turbine ACTdocument.
9. Wilkes, C. Control of NO Emissions From Industrial GasxTurbine Combustion Systems. General Motors Corporation. Indianapolis, IN. For presentation at the 82nd annualmeeting and exhibition - Anaheim, CA. June 25 to 30, 1989. p. 5.
10. Reference 2, p. 4-4.
4-27
11. Reference 1, p. 3-5.
12. Letter and attachments from Antos, R.J., WestinghouseElectric Corporation, to Neuffer, W.J., EPA/ISB. September 11, 1991. Gas turbine information.
13. Smith, K., L. Angello, and F. Kurzynske. Design and Testingof an Ultra-Low NO Gas Turbine Combustor. The AmericanxSociety of Mechanical Engineers. New York. 86-GT-263. 1986. p. 2.
14. Cutrone, M., M. Hilt, A. Goyal, E. Ekstedt, andJ. Notardonato. Evaluation of Advanced Combustors for DryNO Suppression with Nitrogen Bearing Fuels in Utility andxIndustrial Gas Turbines. Journal of Engineering for Power. 104:431. April 1982.
15. Letter and attachments from Sailer, E.D., General ElectricMarine and Industrial Engines, to Neuffer, W.J., EPA/ISB. August 29, 1991. Review of the draft gas turbine ACTdocument.
16. Letter and attachments from Etter, R.G., Koch Industries,Inc., to Neuffer, W.J., EPA/ISB. October 17, 1991. Reviewof the draft gas turbine ACT document.
17. U. S. Environmental Protection Agency. BackgroundInformation Document, Review of 1979 Gas Turbine New SourcePerformance Standard. Research Triangle Park, NC. Preparedby Radian Corporation under Contract No. 68-02-3816. 1985. p. 3-36.
18. Reference 17, p. 3-93.
19. Reference 17, pp. 3-39 through 3-41.
20. National Archives and Records Administration. Code ofFederal Regulations. 40 CFR 60.335. Washington, D.C. Office of the Federal Register. July 1989.
21. Reference 3, pp. 3-105, 3-106.
22. Backlund, J., and A. Spoormaker. Experience With NOxFormation/Reduction Caused by Supplementary Firing ofNatural Gas in Gas Turbine Exhaust Streams. The AmericanSociety of Mechanical Engineers. New York. 85-JPGC-G7-18. 1985. p. 2.
23. Telecon. Fiorenza, R., Coen Company, with Snyder, R.,Midwest Research Institute (MRI). March 8, 1991. NOxemissions levels for duct burners operating in gas turbineexhaust streams.
4-28
24. Letters and attachments from Leonard, G.L., General ElectricCompany, to Snyder, R.B., MRI. February 1991. Response togas turbine questionnaire.
25. Letters and attachments from Schorr, M., General ElectricCompany, to Snyder, R.B., MRI. March, April 1991. Responseto gas turbine questionnaire.
26. Letters and attachments from Gurmani, A., Asea Brown Boveri,to Snyder, R.B., MRI. February 1991. Response to gasturbine questionnaire.
27. Letters and attachments from Swingle, R., Solar TurbinesIncorporated, to Snyder, R.B., MRI. February 1991. Response to gas turbine questionnaire.
28. Letters and attachments from Kimsey, D.L., Allison GasTurbine Division of General Motors, to Snyder, R.B., MRI. February 1991. Response to gas turbine questionnaire.
29. Letter and attachment from vanderLinden, S., Asea BrownBoveri, to Neuffer, W.J., EPA/ISB. September 16, 1991. Gas turbine product information.
5-29
5.0 NO CONTROL TECHNIQUESx
Nationwide NO emission limits have been established forx
stationary gas turbines in the new source performance standards
(NSPS) promulgated in 1979. This standard, summarized in1
Table 5-1
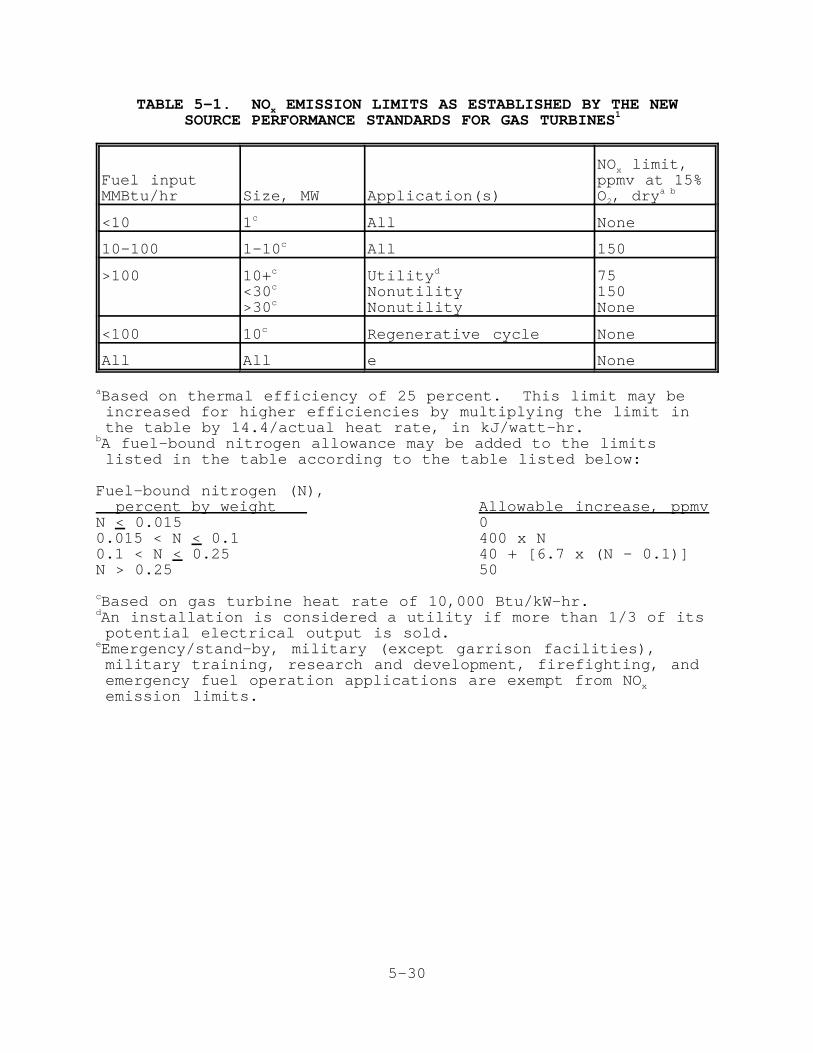
5-30
TABLE 5-1. NO EMISSION LIMITS AS ESTABLISHED BY THE NEWxSOURCE PERFORMANCE STANDARDS FOR GAS TURBINES 1
Fuel inputMMBtu/hr Size, MW Application(s)
NO limit,xppmv at 15%O , dry2
a b
<10 1c All None
10-100 1-10c All 150
>100 10+c
<30c
>30c
Utilityd
NonutilityNonutility
75150None
<100 10c Regenerative cycle None
All All e None
Based on thermal efficiency of 25 percent. This limit may bea
increased for higher efficiencies by multiplying the limit inthe table by 14.4/actual heat rate, in kJ/watt-hr.A fuel-bound nitrogen allowance may be added to the limitsb
listed in the table according to the table listed below:
Fuel-bound nitrogen (N), percent by weight Allowable increase, ppmvN < 0.015 00.015 < N < 0.1 400 x N0.1 < N < 0.25 40 + [6.7 x (N - 0.1)]N > 0.25 50
Based on gas turbine heat rate of 10,000 Btu/kW-hr.c
An installation is considered a utility if more than 1/3 of itsd
potential electrical output is sold.Emergency/stand-by, military (except garrison facilities),e
military training, research and development, firefighting, andemergency fuel operation applications are exempt from NOxemission limits.
5-31
, effectively sets a limit for new, modified, or reconstructed
gas turbines greater than 10.7 gigajoules per hour (approximately
3,800 horsepower [hp]) of 75 or 150 parts per million by volume
(ppmv), corrected to 15 percent oxygen (O ) on a dry basis,2
depending upon the size and application of the turbine. State
and regional regulatory agencies may set more restrictive limits,
and two organizations have established limits as low as 9 ppmv:
the South Coast Air Quality Management District (SCAQMD) has
defined limits as listed in Table 5-2
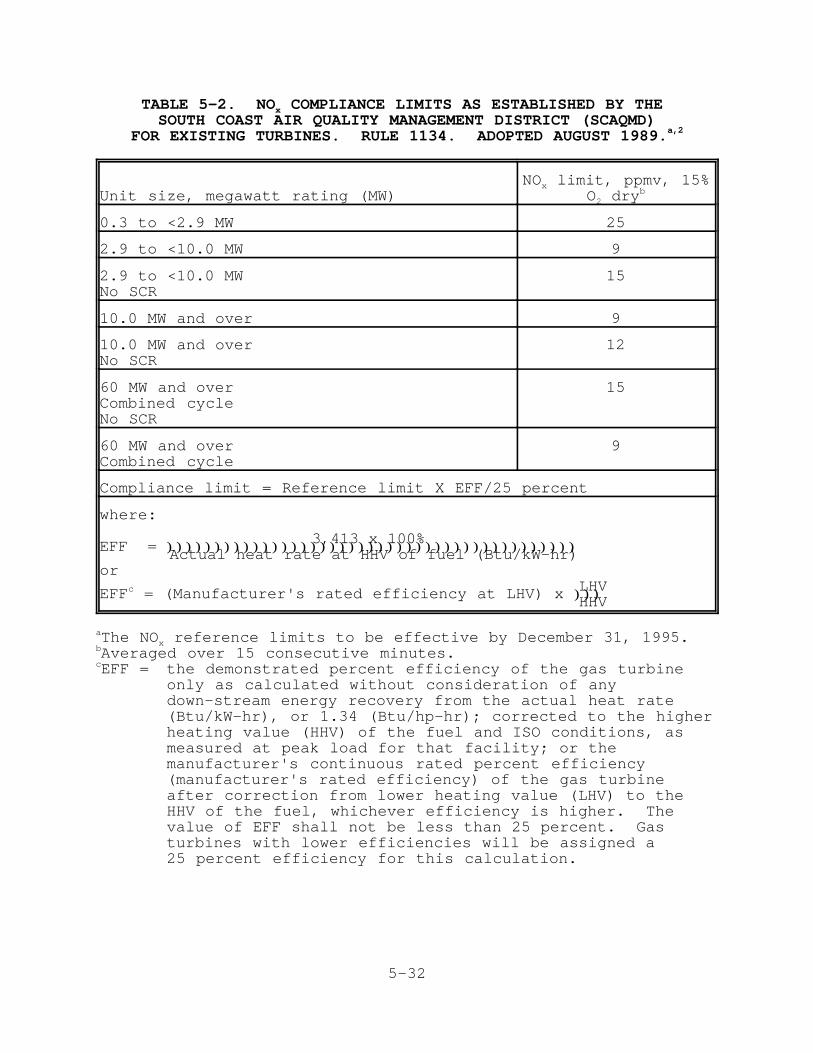
5-32
TABLE 5-2. NO COMPLIANCE LIMITS AS ESTABLISHED BY THE xSOUTH COAST AIR QUALITY MANAGEMENT DISTRICT (SCAQMD)
FOR EXISTING TURBINES. RULE 1134. ADOPTED AUGUST 1989.a,2
Unit size, megawatt rating (MW)NO limit, ppmv, 15%x
O dry2b
0.3 to <2.9 MW 25
2.9 to <10.0 MW 9
2.9 to <10.0 MWNo SCR
15
10.0 MW and over 9
10.0 MW and overNo SCR
12
60 MW and overCombined cycleNo SCR
15
60 MW and overCombined cycle
9
Compliance limit = Reference limit X EFF/25 percent
where:
3,413 x 100%EFF = ))))))))))))))))))))))))))))))))))))))))))) Actual heat rate at HHV of fuel (Btu/kW-hr)or LHVEFF = (Manufacturer's rated efficiency at LHV) x )))c
HHV
The NO reference limits to be effective by December 31, 1995. ax
Averaged over 15 consecutive minutes.b
EFF = the demonstrated percent efficiency of the gas turbinec
only as calculated without consideration of anydown-stream energy recovery from the actual heat rate(Btu/kW-hr), or 1.34 (Btu/hp-hr); corrected to the higherheating value (HHV) of the fuel and ISO conditions, asmeasured at peak load for that facility; or themanufacturer's continuous rated percent efficiency(manufacturer's rated efficiency) of the gas turbineafter correction from lower heating value (LHV) to theHHV of the fuel, whichever efficiency is higher. Thevalue of EFF shall not be less than 25 percent. Gasturbines with lower efficiencies will be assigned a25 percent efficiency for this calculation.

5-33
; and the Northeast States for Coordinated Air Use Management
(NESCAUM) has recommended limits as listed in Table 5-3.

5-34
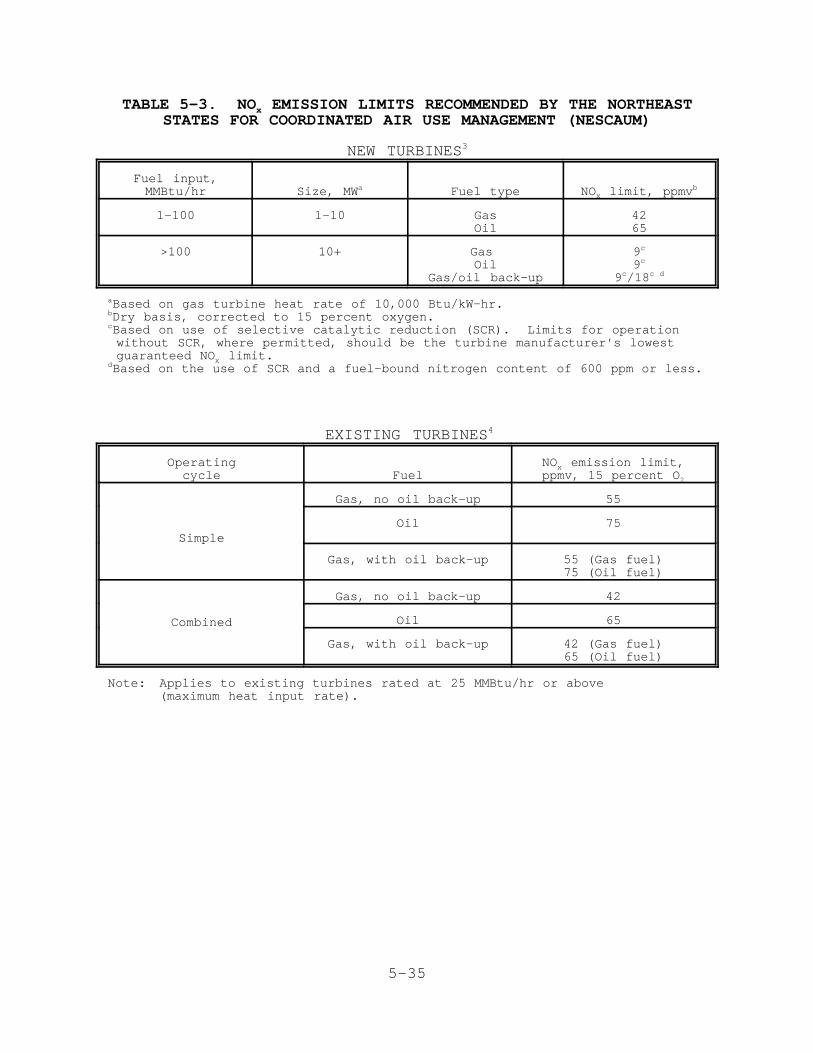
5-35
TABLE 5-3. NO EMISSION LIMITS RECOMMENDED BY THE NORTHEASTxSTATES FOR COORDINATED AIR USE MANAGEMENT (NESCAUM)
NEW TURBINES3
Fuel input,MMBtu/hr Size, MWa Fuel type NO limit, ppmvx
b
1-100 1-10 GasOil
4265
>100 10+ Gas Oil
Gas/oil back-up
9c
9c
9 /18c c d
Based on gas turbine heat rate of 10,000 Btu/kW-hr.a
Dry basis, corrected to 15 percent oxygen.b
Based on use of selective catalytic reduction (SCR). Limits for operationc
without SCR, where permitted, should be the turbine manufacturer's lowest guaranteed NO limit.xBased on the use of SCR and a fuel-bound nitrogen content of 600 ppm or less.d
EXISTING TURBINES4
Operatingcycle Fuel
NO emission limit,xppmv, 15 percent O2
Simple
Gas, no oil back-up 55
Oil 75
Gas, with oil back-up 55 (Gas fuel)75 (Oil fuel)
Combined
Gas, no oil back-up 42
Oil 65
Gas, with oil back-up 42 (Gas fuel)65 (Oil fuel)
Note: Applies to existing turbines rated at 25 MMBtu/hr or above(maximum heat input rate).

5-36
This chapter discusses the control techniques that are
available to reduce NO emissions for stationary turbines, thex
use of duct burners, the use of alternate fuels to lower NOx
emissions, and the applicability of NO control techniques tox
offshore applications. Each control technique is structured into
categories to discuss the process description, applicability,
factors that affect performance, and achievable controlled NOx
emission levels. Where information for a technique is limited,
one or more categories may be combined. Section 5.1 describes
wet controls, including water and steam injection. Section 5.2
describes combustion controls, including lean and staged
combustion. Selective catalytic reduction (SCR), a
postcombustion technique, is described in Section 5.3, and the
combination of SCR with other control techniques is described in

5-37

5-38
5-39
Section 5.4. Emissions from duct burners and their impact on
total NO emissions are described in Section 5.5. Section 5.6x
describes NO emission impacts when using alternate fuels. Twox
control techniques that show potential for future use, selective
noncatalytic reduction (SNCR) and catalytic combustion, are
described in Sections 5.7 and 5.8, respectively. Control
technologies for offshore oil platforms are described in
Section 5.9. Finally, references for Chapter 5 are found in
Section 5.10.
5.1 WET CONTROLS
The injection of either water or steam directly into the
combustor lowers the flame temperature and thereby reduces
thermal NO formation. This control technique is available fromx
all gas turbine manufacturers contacted for this study.5-11
The process description, applicability, factors affecting
performance, emissions data and manufacturers' guarantees,
impacts on other emissions, and gas turbine performance and
maintenance impacts are discussed in this section.
5.1.1 Process Description
Injecting water into the flame area of a turbine combustor
provides a heat sink that lowers the flame temperature and
thereby reduces thermal NO formation. Injection rates for bothx
water and steam are usually described by a water-to-fuel ratio
(WFR) and are usually given on a weight basis (e.g., lb water to
lb fuel).
A water injection system consists of a water treatment
system, pump(s), water metering valves and instrumentation,
turbine-mounted injection nozzles, and the necessary
interconnecting piping. Water purity is essential to prevent or
mitigate erosion and/or the formation of deposits in the hot
section of the turbine; Table 5-4
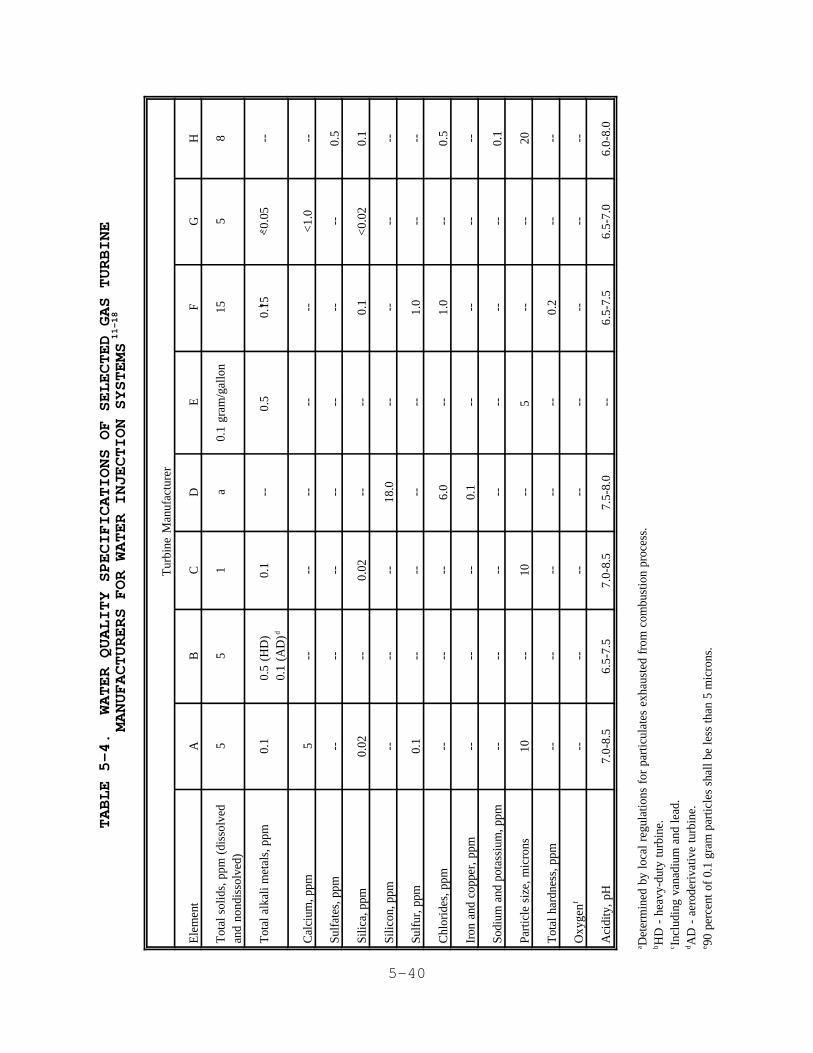
5-40
TABLE 5-4. WATER QUALITY SPECIFICATIONS OF SELECTED GAS TURBINE
MANUFACTURERS FOR WATER INJECTION SYSTEMS
11-18
Tur
bine
Man
ufac
ture
r
Ele
men
tA
BC
DE
FG
H
Tot
al s
olid
s, p
pm (
diss
olve
dan
d no
ndis
solv
ed)
55
1a
0.1
gram
/gal
lon
155
8
Tot
al a
lkal
i met
als,
ppm
0.1
0.5
(HD
)b
0.1
(AD
)d
0.1
--0.
5c
0.15
<0.
05--
Cal
cium
, ppm
5--
----
----
<1.
0--
Sulf
ates
, ppm
----
----
----
--0.
5
Silic
a, p
pm0.
02--
0.02
----
0.1
<0.
020.
1
Silic
on, p
pm--
----
18.0
----
----
Sulf
ur, p
pm0.
1--
----
--1.
0--
--
Chl
orid
es, p
pm--
----
6.0
--1.
0--
0.5
Iron
and
cop
per,
ppm
----
--0.
1--
----
--
Sodi
um a
nd p
otas
sium
, ppm
----
----
----
--0.
1
Part
icle
siz
e, m
icro
ns10
--10
--5
----
20
Tot
al h
ardn
ess,
ppm
----
----
--0.
2--
--
Oxy
genf
----
----
----
----
Aci
dity
, pH
7.0-
8.5
6.5-
7.5
7.0-
8.5
7.5-
8.0
--6.
5-7.
56.
5-7.
06.
0-8.
0
Det
erm
ined
by
loca
l re
gula
tions
for
par
ticul
ates
exh
aust
ed f
rom
com
bust
ion
proc
ess.
a HD
- h
eavy
-dut
y tu
rbin
e.b In
clud
ing
vana
dium
and
lead
.c A
D -
aer
oder
ivat
ive
turb
ine.
d 90 p
erce
nt o
f 0.
1 gr
am p
artic
les
shal
l be
less
than
5 m
icro
ns.
e

5-41
summarizes the water quality specifications for eight gas
turbine manufacturers.
In a steam injection system, steam replaces water as the
injected fluid. The injection system is similar to that for
water injection, but the pump is replaced by a steam-producing
boiler. This boiler is usually a heat recovery steam generator
5-42
(HRSG) that recovers the gas turbine exhaust heat and generates
steam. The balance of the steam system is similar to the water
injection system. The water treatment required for boiler feed
water to the HRSG yields a steam quality that is suitable for
injection into the turbine. The additional steam requirement for
NO control, however, may require that additional capacity bex
added to the boiler feed water treatment system.
Another technique that is commercially available for
oil-fired aeroderivative and industrial turbines uses a
water-in-oil emulsion to reduce NO emissions. This techniquex
introduces water into the combustion process by emulsifying water
in the fuel oil prior to injection. This emulsion has a water
content of 20 to 50 percent by volume and is finely dispersed and
chemically stabilized in the oil phase. The principle of NOx
control is similar to conventional water injection, but the
uniform dispersion of the water in the oil provides greater NOx
reduction than conventional water injection at similar WFR's.19
A water-in-oil emulsion injection system consists of
mechanical emulsification equipment, chemical stabilizer
injection equipment, water metering valves, chemical storage and
metering valves, and instrumentation. In most cases the
emulsifying system can be retrofitted to the existing fuel
delivery system, which eliminates the requirement for a separate
delivery system for water injection. At multiunit installations,
one emulsion system can be used to supply emulsified fuel to
several turbines. For dual fuel turbines, the emulsion can be
injected through the oil fuel system to control NO emissions.x19
Data provided by the vendor for this technique indicates
that testing has been performed on oil-fired turbines operating
in peaking duty. Long-term testing has not been completed at
this point to quantify the long-term effects of the emulsifier on
the operation and maintenance of the turbine.
5-43
5.1.2 Applicability of Wet Controls
Wet controls have been applied effectively to both
aeroderivative and heavy-duty gas turbines and to all
configurations except regenerative cycle applications. It is20
expected that wet controls can be used with regenerative cycle
turbines, but no such installations were identified. All
manufacturers contacted have water injection control systems
available for their gas turbine models; many also offer steam
injection control systems. Where both systems are available, the
decision of which control to use depends upon steam availability
and economic factors specific to each site.
Wet controls can be added as a retrofit to most gas turbine
installations. In the case of water injection, one limitation is
the possible unavailability of injection nozzles for turbines
operating in dual fuel applications. In this application, the
injection nozzle as designed by the manufacturer may not
physically accommodate a third injection port for water
injection. This limitation also applies to steam injection. In
addition, steam injection is not an available control option from
some gas turbine manufacturers.
5.1.3 Factors Affecting the Performance of Wet Controls
The WFR is the most important factor affecting the
performance of wet controls. Other factors affecting performance
are the combustor geometry and injection nozzle(s) design and the
fuel-bound nitrogen (FBN) content. These factors are discussed
below.
The WFR has a significant impact on NO emissions. x
Tables 5-5 and 5-6 provide NO reduction and WFRs for natural gasx
and
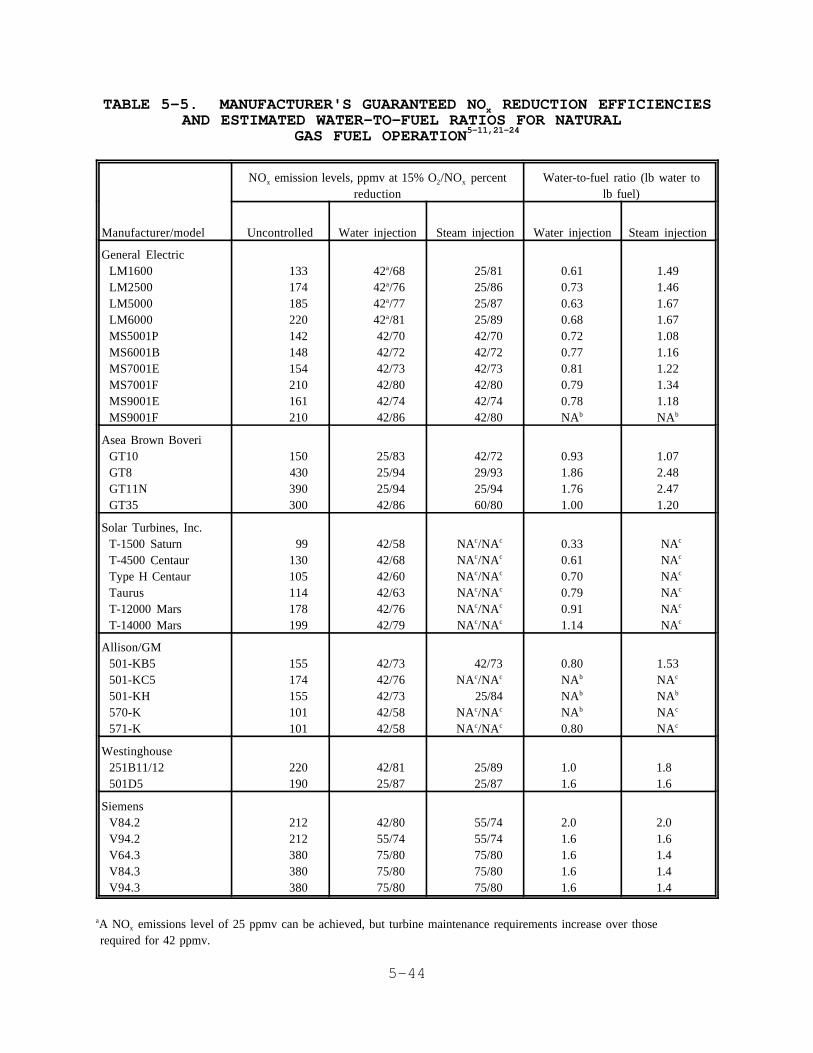
5-44
TABLE 5-5. MANUFACTURER'S GUARANTEED NO REDUCTION EFFICIENCIESxAND ESTIMATED WATER-TO-FUEL RATIOS FOR NATURAL
GAS FUEL OPERATION5-11,21-24
NO emission levels, ppmv at 15% O /NO percentx 2 x
reductionWater-to-fuel ratio (lb water to
lb fuel)
Manufacturer/model Uncontrolled Water injection Steam injection Water injection Steam injection
General ElectricLM1600LM2500LM5000LM6000MS5001PMS6001BMS7001EMS7001FMS9001EMS9001F
133174185220142148154210161210
42 /68a
42 /76a
42 /77a
42 /81a
42/7042/7242/7342/8042/7442/86
25/8125/8625/8725/8942/7042/7242/7342/8042/7442/80
0.610.730.630.680.720.770.810.790.78NAb
1.491.461.671.671.081.161.221.341.18NAb
Asea Brown BoveriGT10GT8GT11NGT35
150 430390300
25/8325/9425/9442/86
42/7229/9325/9460/80
0.931.861.761.00
1.072.482.471.20
Solar Turbines, Inc.T-1500 SaturnT-4500 CentaurType H CentaurTaurusT-12000 MarsT-14000 Mars
99130105114178199
42/5842/6842/6042/6342/7642/79
NA /NAc c
NA /NAc c
NA /NAc c
NA /NAc c
NA /NAc c
NA /NAc c
0.330.610.700.790.911.14
NAc
NAc
NAc
NAc
NAc
NAc
Allison/GM501-KB5501-KC5501-KH570-K571-K
155174155101101
42/7342/7642/7342/5842/58
42/73NA /NAc c
25/84NA /NAc c
NA /NAc c
0.80NAb
NAb
NAb
0.80
1.53NAc
NAb
NAc
NAc
Westinghouse251B11/12501D5
220190
42/8125/87
25/8925/87
1.0 1.6
1.8 1.6
SiemensV84.2V94.2V64.3V84.3V94.3
212212380380380
42/8055/7475/8075/8075/80
55/7455/7475/8075/8075/80
2.0 1.6 1.6 1.6 1.6
2.0 1.6 1.4 1.4 1.4
A NO emissions level of 25 ppmv can be achieved, but turbine maintenance requirements increase over thoseax
required for 42 ppmv.
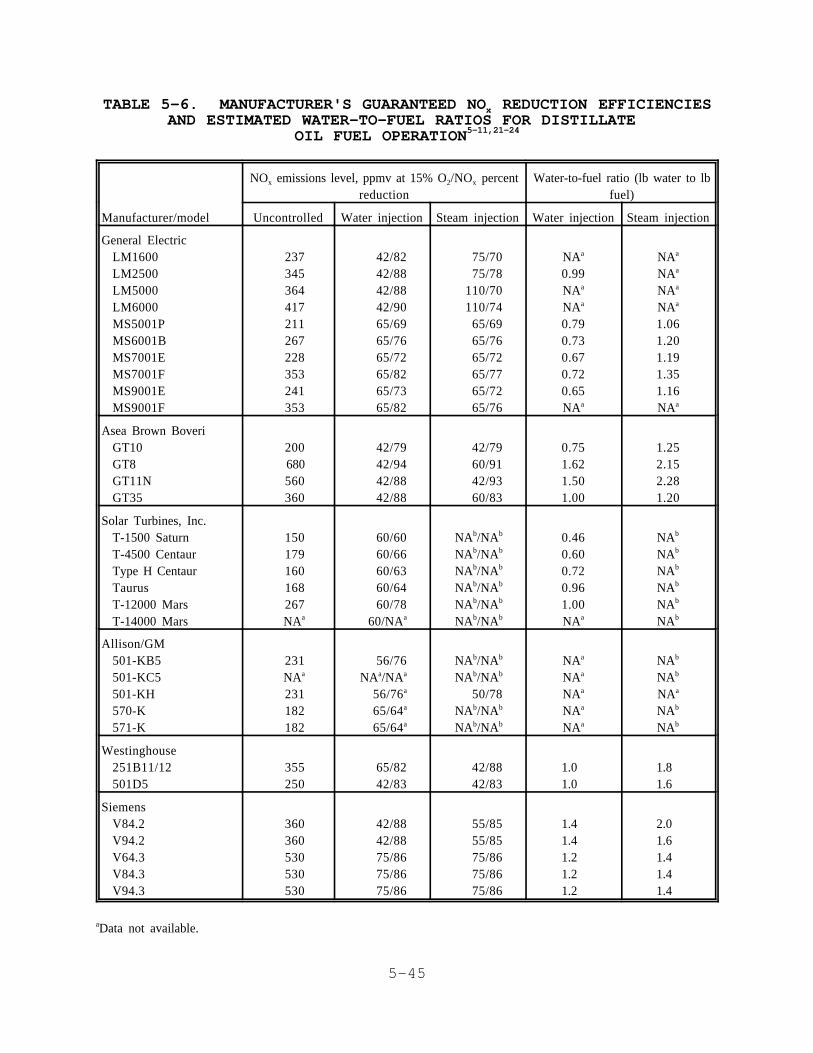
5-45
TABLE 5-6. MANUFACTURER'S GUARANTEED NO REDUCTION EFFICIENCIESxAND ESTIMATED WATER-TO-FUEL RATIOS FOR DISTILLATE
OIL FUEL OPERATION5-11,21-24
NO emissions level, ppmv at 15% O /NO percentx 2 x
reductionWater-to-fuel ratio (lb water to lb
fuel)
Manufacturer/model Uncontrolled Water injection Steam injection Water injection Steam injection
General ElectricLM1600LM2500LM5000LM6000MS5001PMS6001BMS7001EMS7001FMS9001EMS9001F
237345364417211267228353241353
42/8242/8842/8842/9065/6965/7665/7265/8265/7365/82
75/7075/78
110/70110/74
65/6965/7665/7265/7765/7265/76
NAa
0.99NAa
NAa
0.790.730.670.720.65NAa
NAa
NAa
NAa
NAa
1.061.201.191.351.16NAa
Asea Brown BoveriGT10GT8GT11NGT35
200 680560360
42/7942/9442/8842/88
42/7960/9142/9360/83
0.751.621.501.00
1.252.152.281.20
Solar Turbines, Inc.T-1500 SaturnT-4500 CentaurType H CentaurTaurusT-12000 MarsT-14000 Mars
150179160168267
NAa
60/6060/6660/6360/6460/78
60/NAa
NA /NAb b
NA /NAb b
NA /NAb b
NA /NAb b
NA /NAb b
NA /NAb b
0.460.600.720.961.00NAa
NAb
NAb
NAb
NAb
NAb
NAb
Allison/GM501-KB5501-KC5501-KH570-K571-K
231 NAa
231182182
56/76NA /NAa a
56/76a
65/64a
65/64a
NA /NAb b
NA /NAb b
50/78NA /NAb b
NA /NAb b
NAa
NAa
NAa
NAa
NAa
NAb
NAb
NAa
NAb
NAb
Westinghouse251B11/12501D5
355250
65/8242/83
42/8842/83
1.0 1.0
1.8 1.6
SiemensV84.2V94.2V64.3V84.3V94.3
360360530530530
42/8842/8875/8675/8675/86
55/8555/8575/8675/8675/86
1.4 1.4 1.2 1.2 1.2
2.0 1.6 1.4 1.4 1.4
Data not available.a
5-46
distillate oil fuels, respectively, based on information provided
by gas turbine manufacturers. For natural gas fuel, WFR's for
water or steam injection range from 0.33 to 2.48 to achieve
controlled NO emission levels ranging fromx
25 to 75 ppmv, corrected to 15 percent oxygen. For oil fuel,
WFR's range from 0.46 to 2.28 to achieve controlled NO emissionx
levels ranging from 42 to 110 ppmv, corrected to 15 percent
oxygen. Nitrogen oxide reduction efficiency increases as the WFR

5-47
5-48
increases. As shown in Tables 5-5 and 5-6, reduction
efficiencies of 70 to 90 percent are common. Note that, in
general, the WFR's for steam are higher than for water injection
because water acts as a better heat sink than steam due to the
heat absorbed by vaporization; therefore, higher levels of steam
than water must be injected for a given reduction level.
The combustor geometry and injection nozzle design and
location also affect the performance of wet controls. For
maximum NO reduction efficiency, the water must be atomized andx
injected in a spray pattern that provides a homogeneous mixture
of water droplets and fuel in the combustor. Failure to achieve
this mixing yields localized hot spots in the combustor that
produce increased NO emissions.x
The type of fuel affects the performance of wet controls.
In general, lower controlled NO emission levels can be achievedx
with gaseous fuels than with oil fuels. The FBN content also
affects the performance of wet controls. Those fuels with
relatively high nitrogen content, such as coal-derived liquids,
shale oil, and residual oils, result in significant fuel NOx
formation. Natural gas and most distillate oils are low-nitrogen
fuels. Consequently, fuel NO formation is minimal when thesex
fuels are burned.
Wet controls serve only to lower the flame temperature and
therefore are an effective control only for thermal NOx
formation; water injection may in fact increase the rate of fuel
NO formation, as shown in Figure 5-1. The mechanismsx25
responsible for this potential increase were not identified.
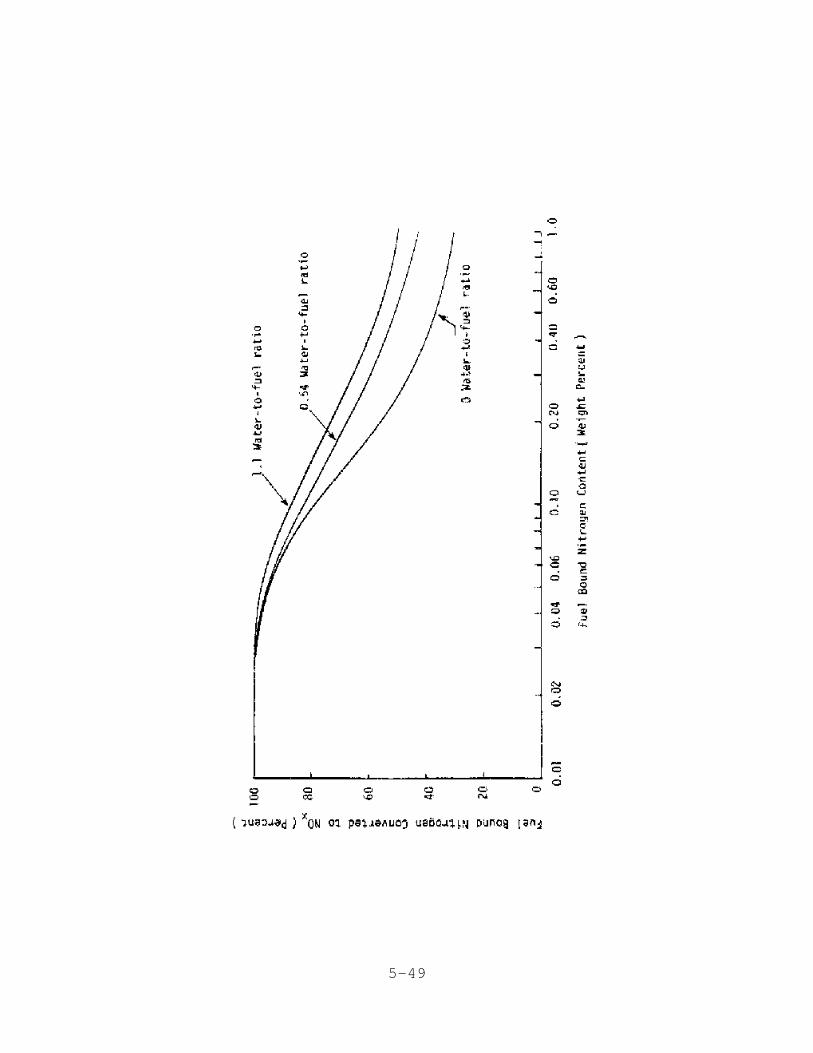
5-49
5-50
5.1.4 Achievable NO Emissions Levels Using Wet Controlsx
This section presents the achievable controlled NO emissionx
levels for wet injection, as guaranteed by gas turbine
manufacturers. Emission test data, obtained using EPA Test
Method 20 or equivalent, are also presented.
Guaranteed NO emission levels as provided by gas turbinex
manufacturers for wet controls are shown in Figures 5-2 and
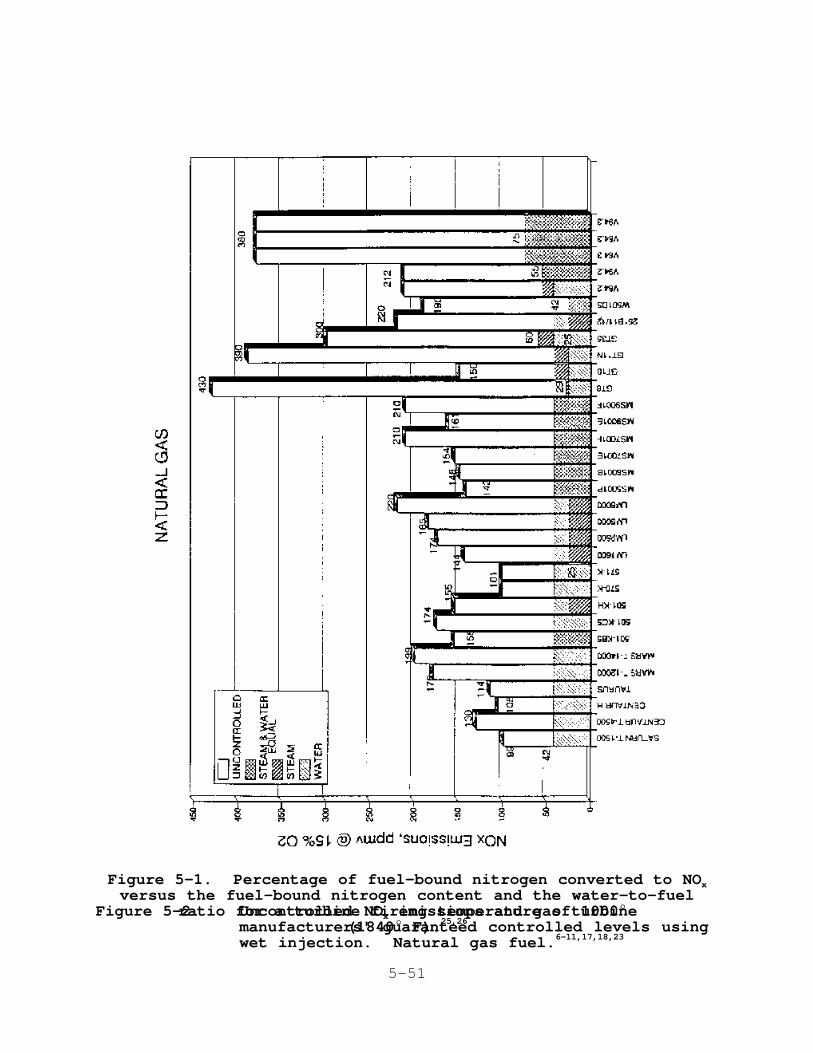
5-51
Figure 5-1. Percentage of fuel-bound nitrogen converted to NOxversus the fuel-bound nitrogen content and the water-to-fuel
ratio for a turbine firing temperature of 1000E (1840E F).25,26
Figure 5-2. Uncontrolled NO emissions and gas turbinexmanufacturers' guaranteed controlled levels usingwet injection. Natural gas fuel.6-11,17,18,23
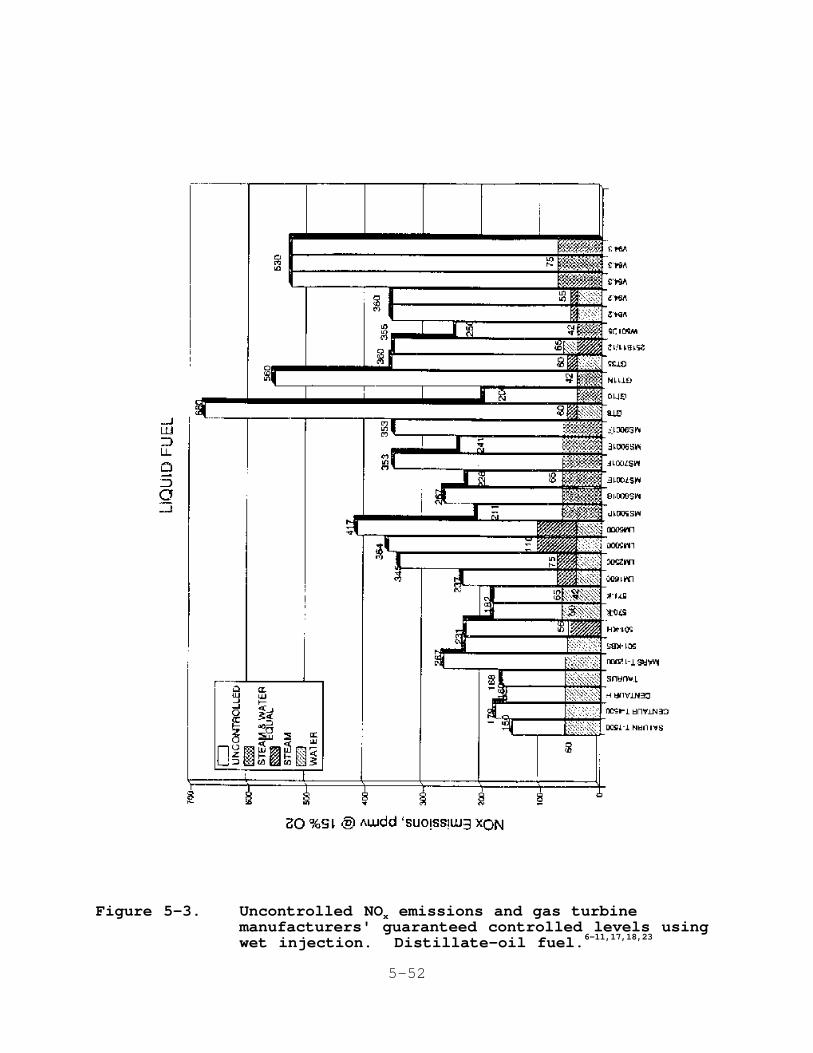
5-52
Figure 5-3. Uncontrolled NO emissions and gas turbinexmanufacturers' guaranteed controlled levels usingwet injection. Distillate-oil fuel.6-11,17,18,23

5-53
5-3. These figures show manufacturers' guaranteed NO emissionx
levels of 42 ppmv for most natural gas-fired turbines, and from
42 to

5-54

5-55
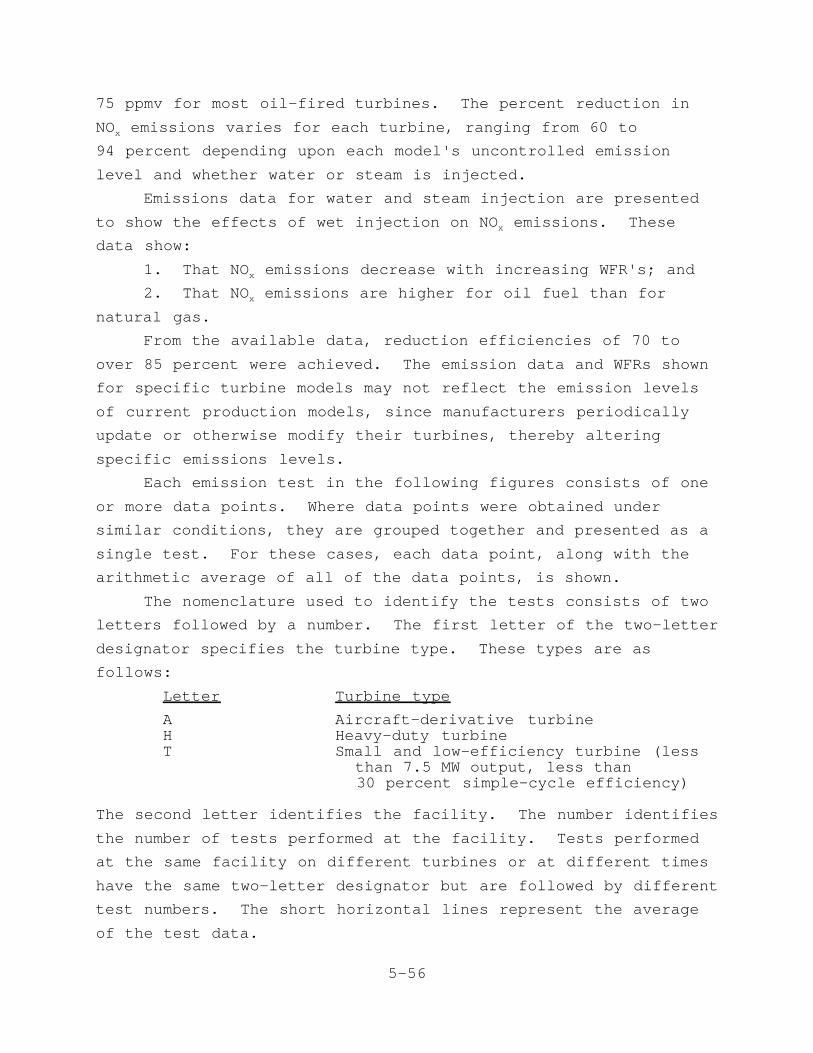
5-56
75 ppmv for most oil-fired turbines. The percent reduction in
NO emissions varies for each turbine, ranging from 60 tox
94 percent depending upon each model's uncontrolled emission
level and whether water or steam is injected.
Emissions data for water and steam injection are presented
to show the effects of wet injection on NO emissions. Thesex
data show:
1. That NO emissions decrease with increasing WFR's; andx
2. That NO emissions are higher for oil fuel than forx
natural gas.
From the available data, reduction efficiencies of 70 to
over 85 percent were achieved. The emission data and WFRs shown
for specific turbine models may not reflect the emission levels
of current production models, since manufacturers periodically
update or otherwise modify their turbines, thereby altering
specific emissions levels.
Each emission test in the following figures consists of one
or more data points. Where data points were obtained under
similar conditions, they are grouped together and presented as a
single test. For these cases, each data point, along with the
arithmetic average of all of the data points, is shown.
The nomenclature used to identify the tests consists of two
letters followed by a number. The first letter of the two-letter
designator specifies the turbine type. These types are as
follows:
Letter Turbine type
A Aircraft-derivative turbineH Heavy-duty turbineT Small and low-efficiency turbine (less
than 7.5 MW output, less than 30 percent simple-cycle efficiency)
The second letter identifies the facility. The number identifies
the number of tests performed at the facility. Tests performed
at the same facility on different turbines or at different times
have the same two-letter designator but are followed by different
test numbers. The short horizontal lines represent the average
of the test data.

5-57
Also presented are the available data on the turbine, wet
controls, uncontrolled NO emissions, percent NO reduction, andx x
fuel type. All of the data shown are representative of the
performance of wet controls when the turbine is operated at base
load or peak load. These loads represent the worst-case
conditions for NO emission reduction. Information on the WFR,x
turbine model, efficiency, control type, and fuel are included
with the emission test data.

5-58
Figures 5-4, 5-5, and 5-6 present the emission test data
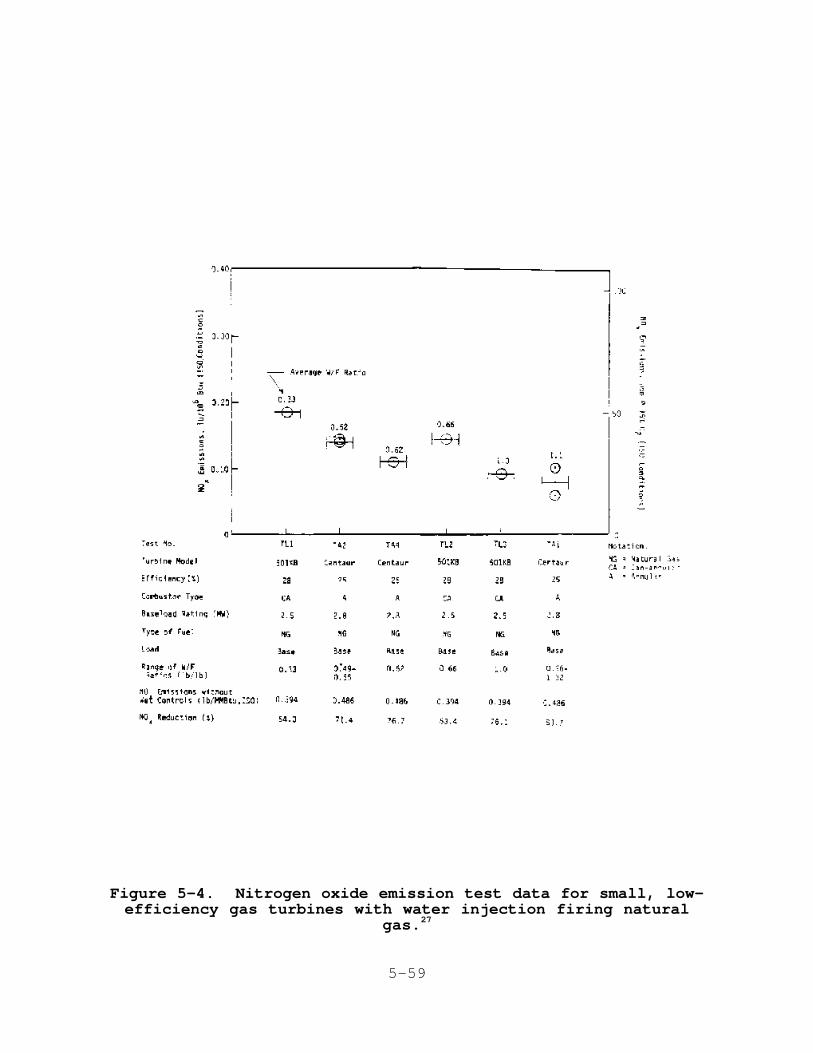
5-59
Figure 5-4. Nitrogen oxide emission test data for small, low-efficiency gas turbines with water injection firing natural
gas.27
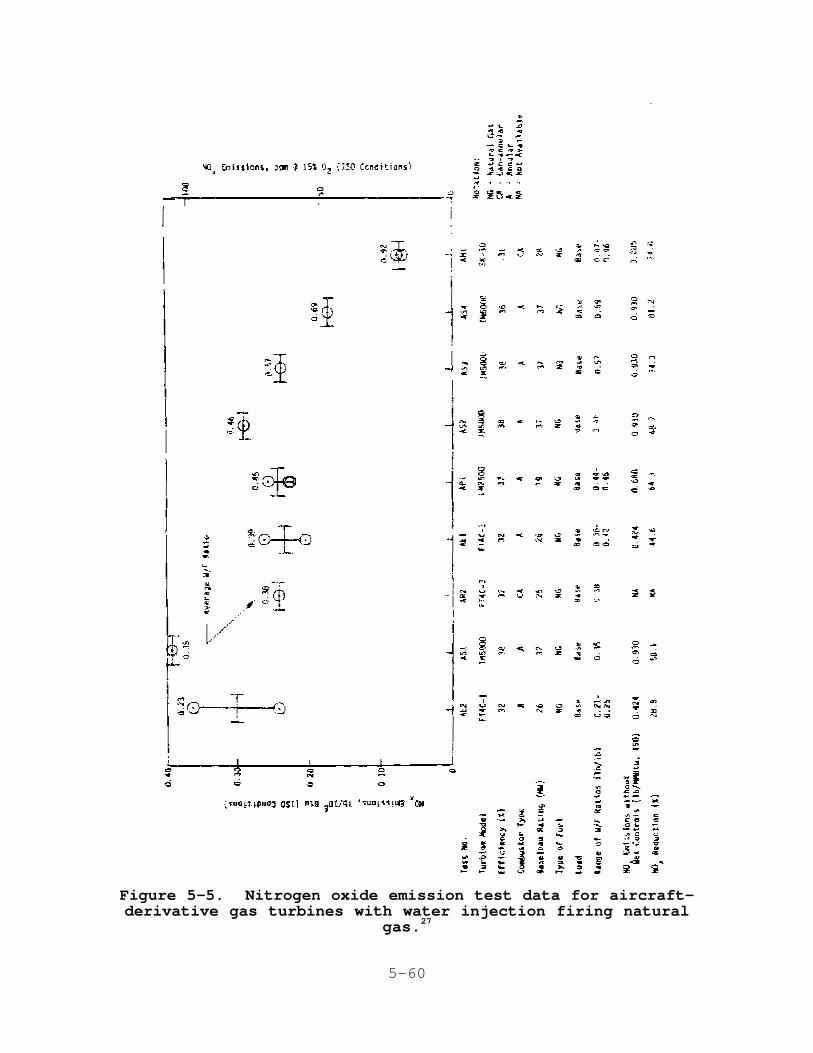
5-60
Figure 5-5. Nitrogen oxide emission test data for aircraft-derivative gas turbines with water injection firing natural
gas.27
5-61
Figure 5-6. Nitrogen oxide emission test data for heavy-duty gasturbines with water injection firing natural gas.27
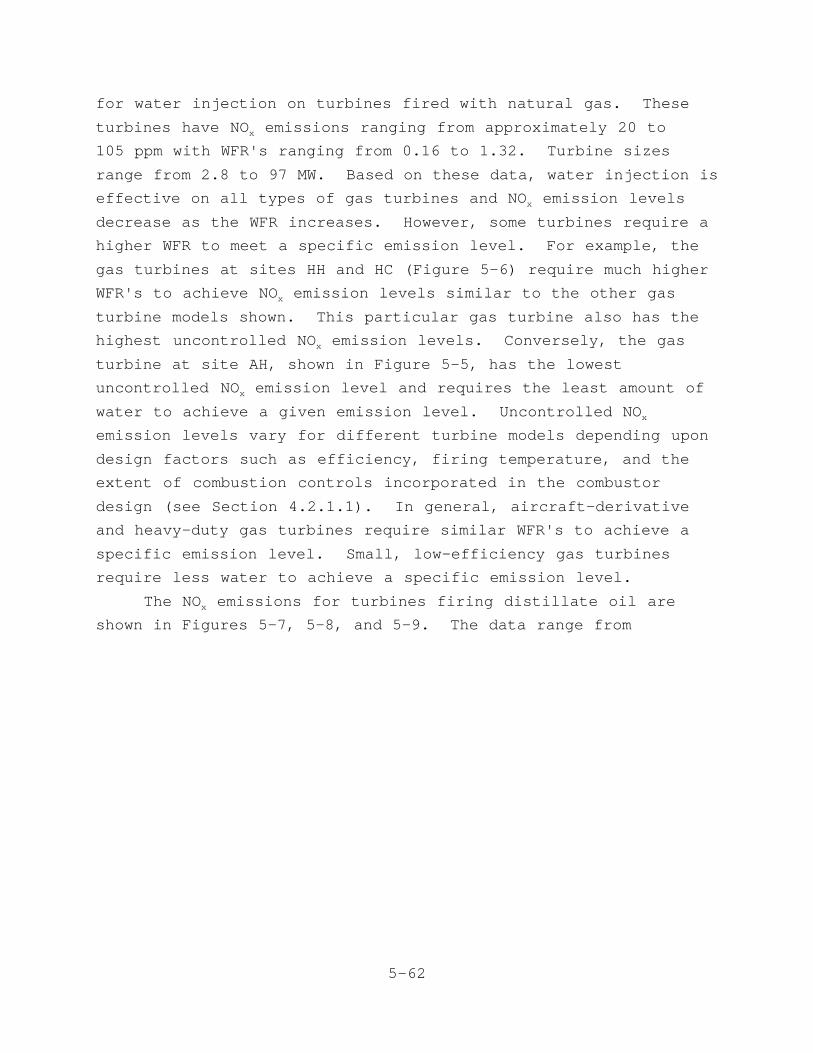
5-62
for water injection on turbines fired with natural gas. These
turbines have NO emissions ranging from approximately 20 tox
105 ppm with WFR's ranging from 0.16 to 1.32. Turbine sizes
range from 2.8 to 97 MW. Based on these data, water injection is
effective on all types of gas turbines and NO emission levelsx
decrease as the WFR increases. However, some turbines require a
higher WFR to meet a specific emission level. For example, the
gas turbines at sites HH and HC (Figure 5-6) require much higher
WFR's to achieve NO emission levels similar to the other gasx
turbine models shown. This particular gas turbine also has the
highest uncontrolled NO emission levels. Conversely, the gasx
turbine at site AH, shown in Figure 5-5, has the lowest
uncontrolled NO emission level and requires the least amount ofx
water to achieve a given emission level. Uncontrolled NOx
emission levels vary for different turbine models depending upon
design factors such as efficiency, firing temperature, and the
extent of combustion controls incorporated in the combustor
design (see Section 4.2.1.1). In general, aircraft-derivative
and heavy-duty gas turbines require similar WFR's to achieve a
specific emission level. Small, low-efficiency gas turbines
require less water to achieve a specific emission level.
The NO emissions for turbines firing distillate oil arex
shown in Figures 5-7, 5-8, and 5-9. The data range from
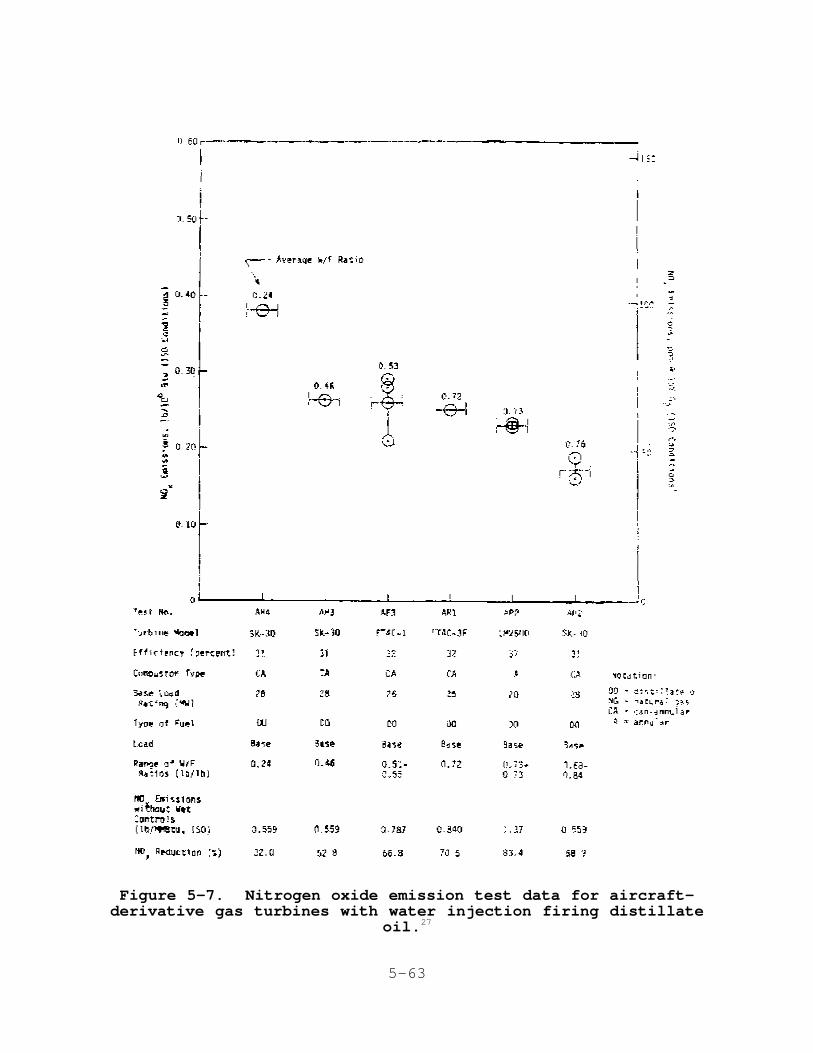
5-63
Figure 5-7. Nitrogen oxide emission test data for aircraft-derivative gas turbines with water injection firing distillate
oil.27
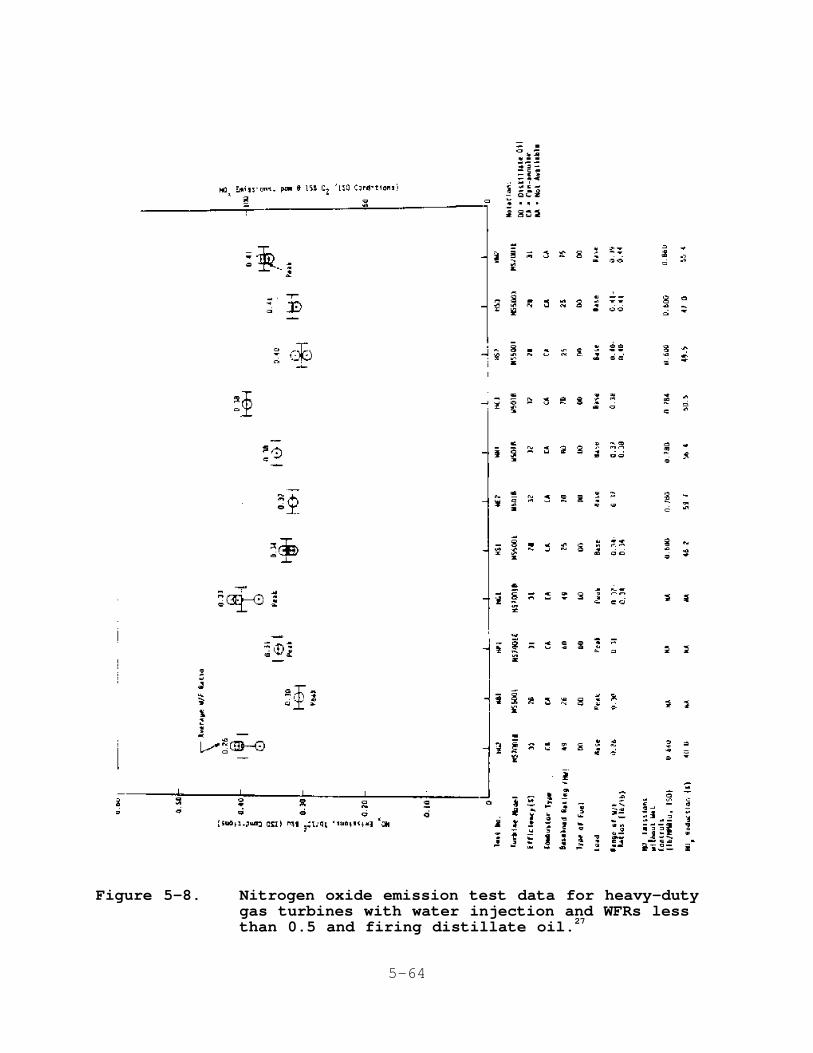
5-64
Figure 5-8. Nitrogen oxide emission test data for heavy-dutygas turbines with water injection and WFRs lessthan 0.5 and firing distillate oil.27
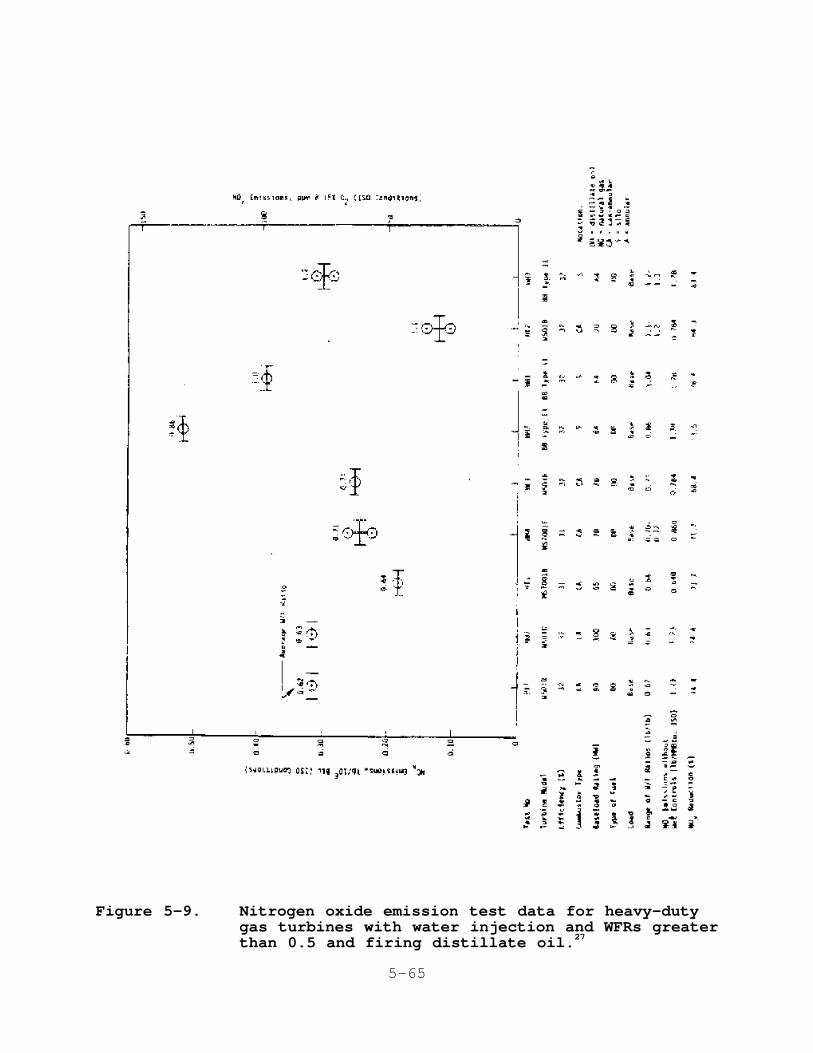
5-65
Figure 5-9. Nitrogen oxide emission test data for heavy-dutygas turbines with water injection and WFRs greaterthan 0.5 and firing distillate oil.27

5-66
approximately 30 to 135 ppm, with WFR's ranging from 0.24 to
1.31. The gas turbine sizes range from 19 to 95 MW. The data
for distillate oil-fired turbines show the same general trends as
the data for natural gas-fired turbines. Site HH (Figure 5-9)

5-67

5-68

5-69

5-70

5-71
5-72
again shows that higher WFR's are required due to the high
uncontrolled NO emissions from this gas turbine. Also, byx
comparing the emission data for the distillate oil-fired turbines
and natural gas-fired turbines, the data show that burning
distillate oil requires higher WFR's than does burning natural
gas for a given level of NO emissions. Higher WFR's arex
required because distillate oil produces higher uncontrolled NOx
levels than does natural gas (see Section 4.2.1.2).
The NO emission test data for steam injection are presentedx
in Figures 5-10
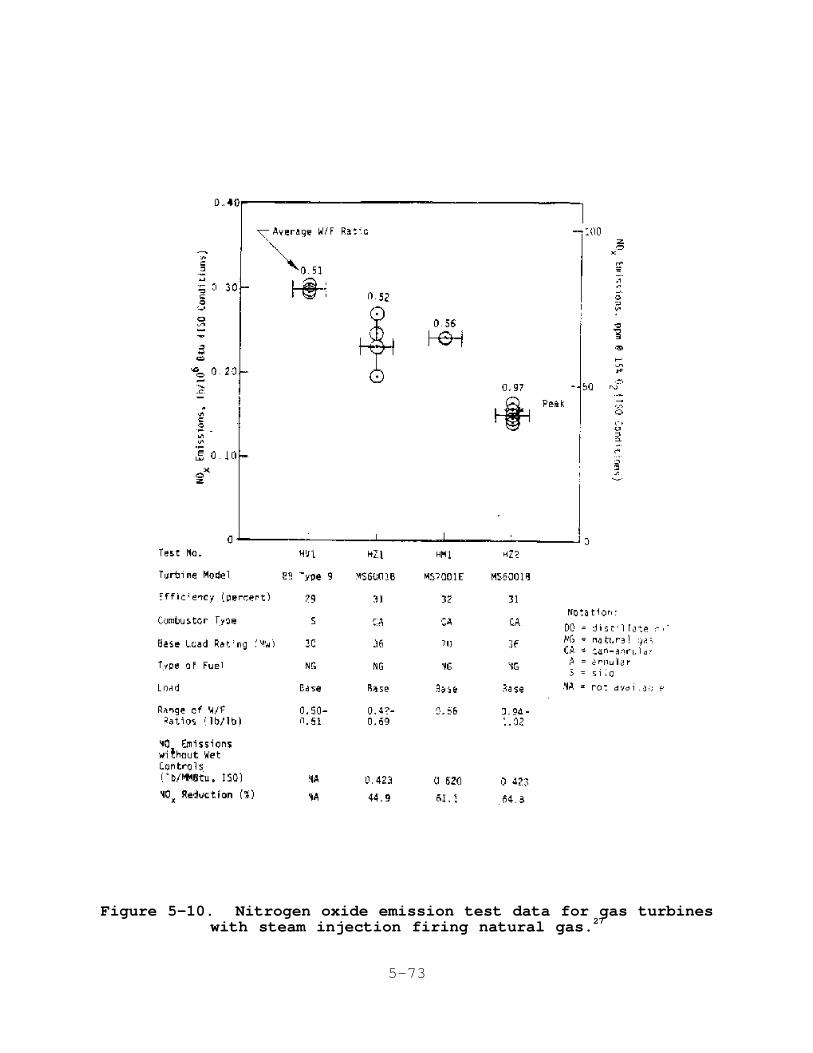
5-73
Figure 5-10. Nitrogen oxide emission test data for gas turbineswith steam injection firing natural gas.27
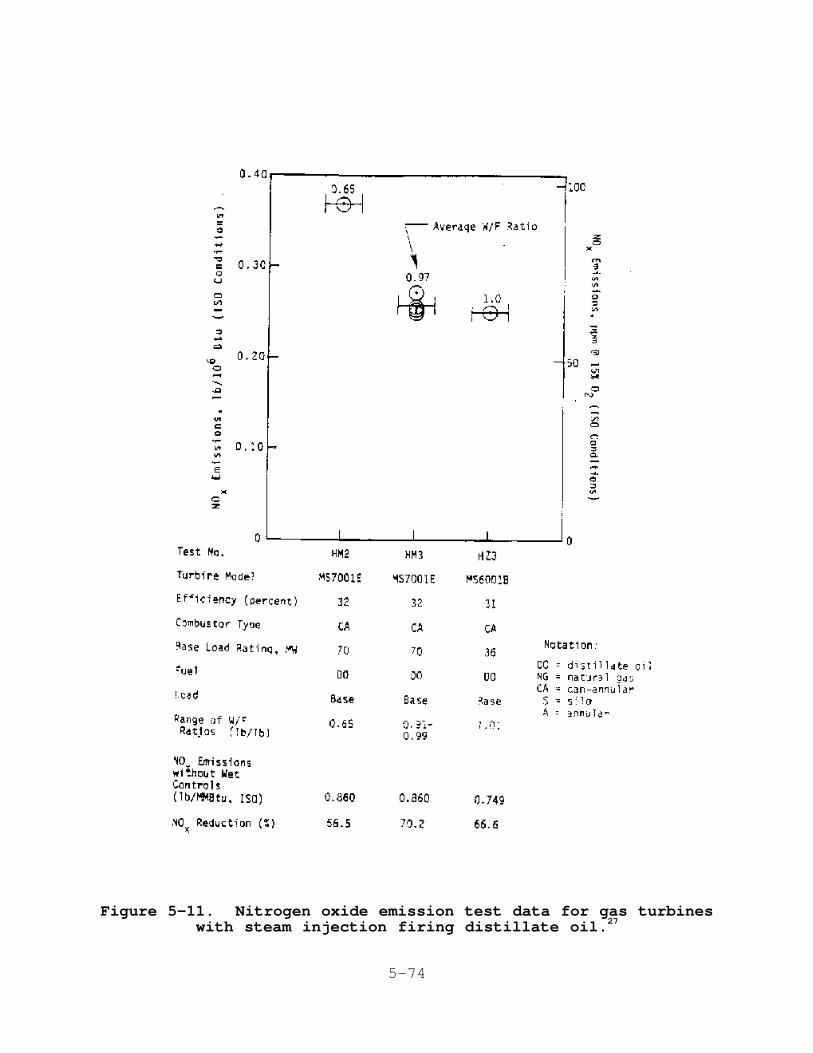
5-74
Figure 5-11. Nitrogen oxide emission test data for gas turbineswith steam injection firing distillate oil.27
5-75
and 5-11 for natural gas-fired turbines and distillate oil-fired
turbines, respectively. The turbines firing natural gas have NOx
emissions ranging from approximately 40 to 80 ppm, with WFR's
ranging from 0.50 to 1.02. The gas turbine sizes range from 30
to 70 MW.
The NO emissions for turbines firing distillate oil rangex
from approximately 65 to 95 ppm, with WFR's ranging from 0.65 to
1.01, and the gas turbine sizes tested were 36 and 70 MW. Fewer
data points are available for steam injection than for water
injection. However, the available data for both distillate oil-
fired and natural gas-fired turbines show that NO emissionsx
decrease as the steam-to-fuel ratio increases.
Reductions in NO emissions similar to water injection withx
oil-fired turbines have been achieved using water-in-oil
emulsions. Results of emission tests for four turbines are shown
in Table 5-7
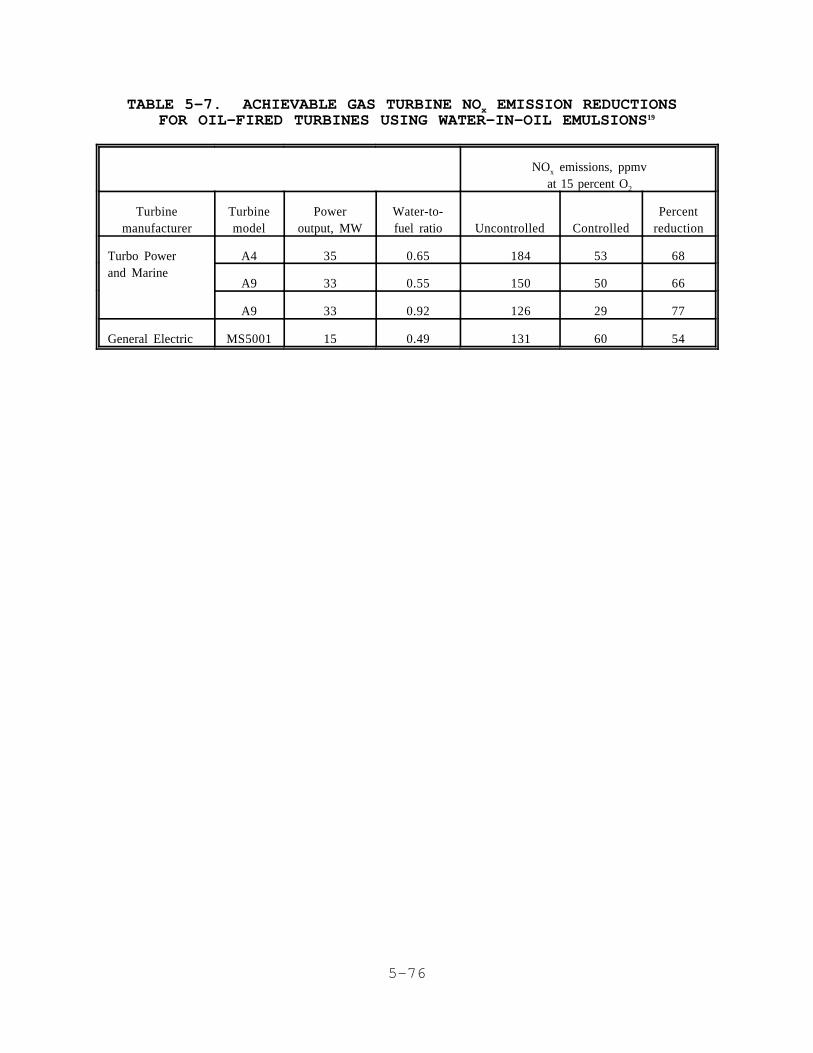
5-76
TABLE 5-7. ACHIEVABLE GAS TURBINE NO EMISSION REDUCTIONS xFOR OIL-FIRED TURBINES USING WATER-IN-OIL EMULSIONS19
NO emissions, ppmvx
at 15 percent O2
Turbinemanufacturer
Turbinemodel
Poweroutput, MW
Water-to-fuel ratio Uncontrolled Controlled
Percentreduction
Turbo Powerand Marine
A4 35 0.65 184 53 68
A9 33 0.55 150 50 66
A9 33 0.92 126 29 77
General Electric MS5001 15 0.49 131 60 54
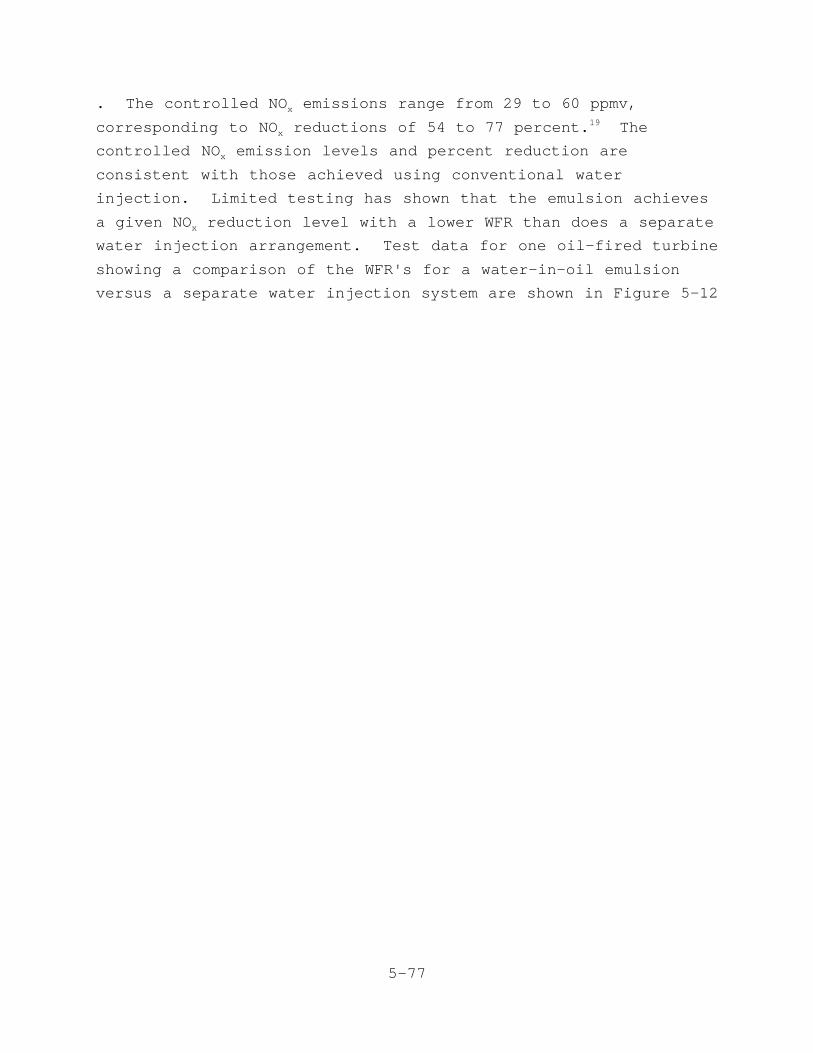
5-77
. The controlled NO emissions range from 29 to 60 ppmv,x
corresponding to NO reductions of 54 to 77 percent. Thex19
controlled NO emission levels and percent reduction arex
consistent with those achieved using conventional water
injection. Limited testing has shown that the emulsion achieves
a given NO reduction level with a lower WFR than does a separatex
water injection arrangement. Test data for one oil-fired turbine
showing a comparison of the WFR's for a water-in-oil emulsion
versus a separate water injection system are shown in Figure 5-12
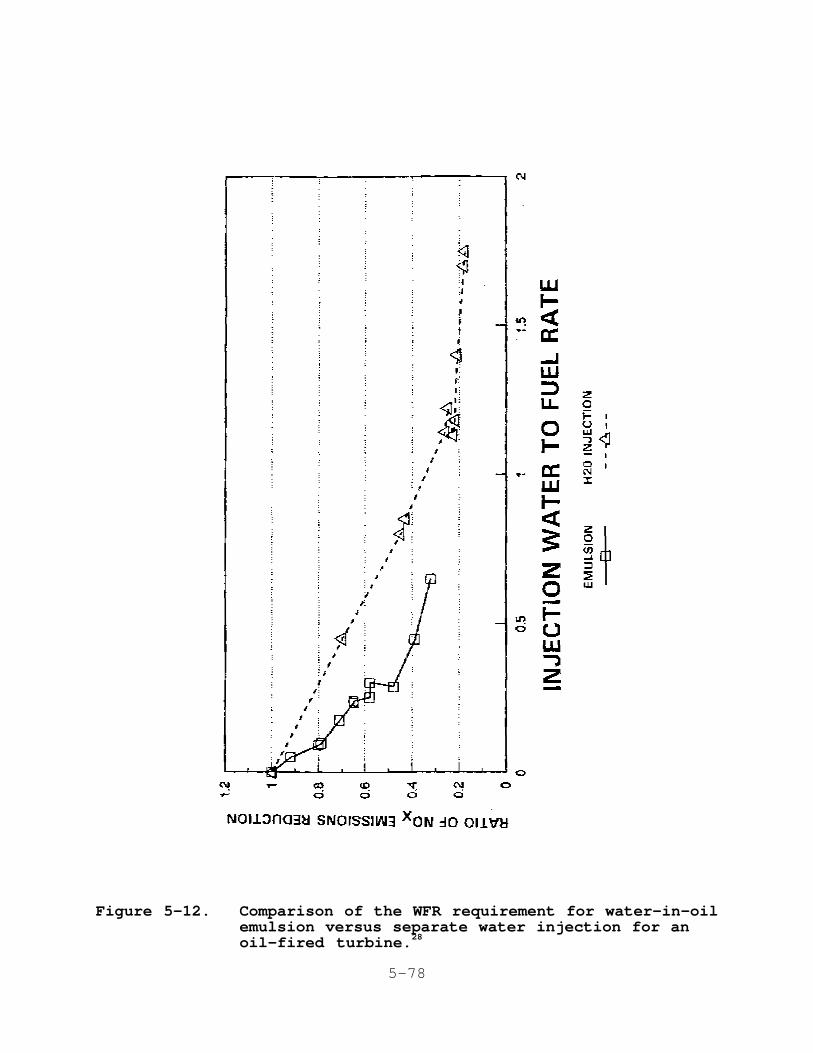
5-78
Figure 5-12. Comparison of the WFR requirement for water-in-oilemulsion versus separate water injection for anoil-fired turbine.28

5-79
. As shown here, NO reductions achieved by a water injectionx
system at a WFR of 1.0 can be achieved by a water-in-oil emulsion
at a WFR of 0.6.

5-80

5-81

5-82

5-83
On a mass basis, the reduction in NO emissions using waterx
injection is shown in Table 5-8
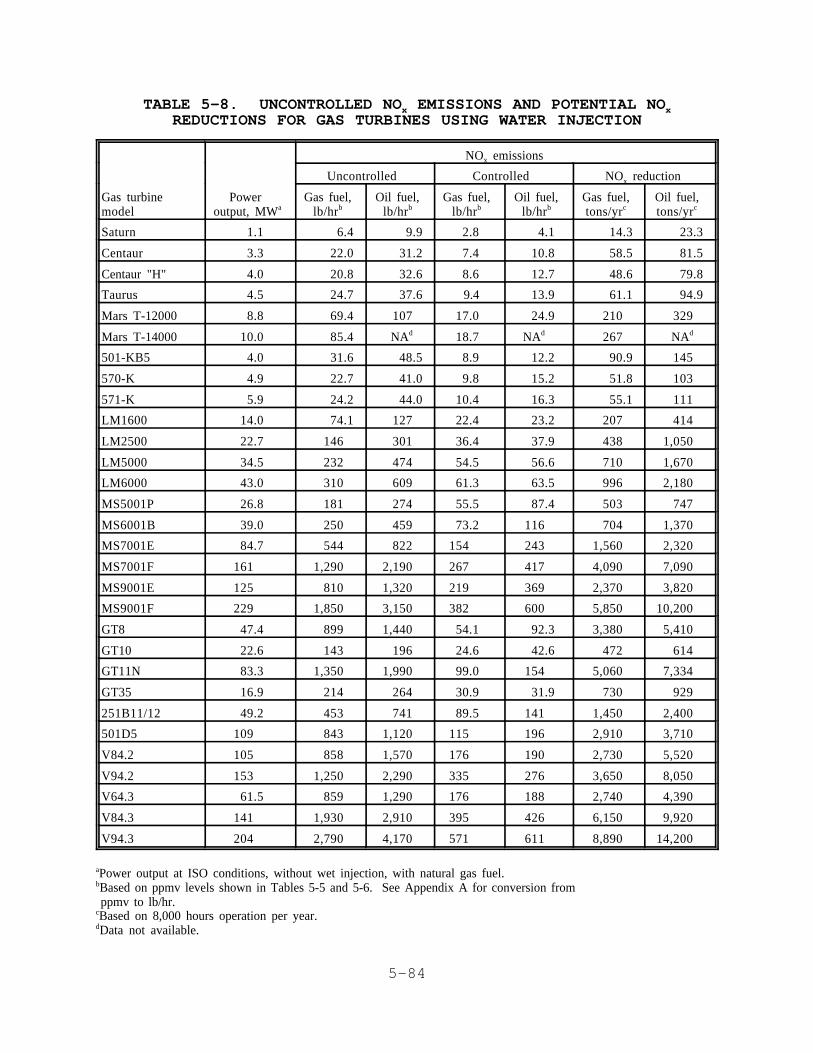
5-84
TABLE 5-8. UNCONTROLLED NO EMISSIONS AND POTENTIAL NOx xREDUCTIONS FOR GAS TURBINES USING WATER INJECTION
NO emissionsx
Uncontrolled Controlled NO reductionx
Gas turbinemodel
Power output, MWa
Gas fuel,lb/hrb
Oil fuel,lb/hrb
Gas fuel,lb/hrb
Oil fuel,lb/hrb
Gas fuel,tons/yrc
Oil fuel,tons/yrc
Saturn 1.1 6.4 9.9 2.8 4.1 14.3 23.3
Centaur 3.3 22.0 31.2 7.4 10.8 58.5 81.5
Centaur "H" 4.0 20.8 32.6 8.6 12.7 48.6 79.8
Taurus 4.5 24.7 37.6 9.4 13.9 61.1 94.9
Mars T-12000 8.8 69.4 107 17.0 24.9 210 329
Mars T-14000 10.0 85.4 NAd 18.7 NAd 267 NAd
501-KB5 4.0 31.6 48.5 8.9 12.2 90.9 145
570-K 4.9 22.7 41.0 9.8 15.2 51.8 103
571-K 5.9 24.2 44.0 10.4 16.3 55.1 111
LM1600 14.0 74.1 127 22.4 23.2 207 414
LM2500 22.7 146 301 36.4 37.9 438 1,050
LM5000 34.5 232 474 54.5 56.6 710 1,670
LM6000 43.0 310 609 61.3 63.5 996 2,180
MS5001P 26.8 181 274 55.5 87.4 503 747
MS6001B 39.0 250 459 73.2 116 704 1,370
MS7001E 84.7 544 822 154 243 1,560 2,320
MS7001F 161 1,290 2,190 267 417 4,090 7,090
MS9001E 125 810 1,320 219 369 2,370 3,820
MS9001F 229 1,850 3,150 382 600 5,850 10,200
GT8 47.4 899 1,440 54.1 92.3 3,380 5,410
GT10 22.6 143 196 24.6 42.6 472 614
GT11N 83.3 1,350 1,990 99.0 154 5,060 7,334
GT35 16.9 214 264 30.9 31.9 730 929
251B11/12 49.2 453 741 89.5 141 1,450 2,400
501D5 109 843 1,120 115 196 2,910 3,710
V84.2 105 858 1,570 176 190 2,730 5,520
V94.2 153 1,250 2,290 335 276 3,650 8,050
V64.3 61.5 859 1,290 176 188 2,740 4,390
V84.3 141 1,930 2,910 395 426 6,150 9,920
V94.3 204 2,790 4,170 571 611 8,890 14,200
Power output at ISO conditions, without wet injection, with natural gas fuel.a
Based on ppmv levels shown in Tables 5-5 and 5-6. See Appendix A for conversion from b
ppmv to lb/hr.Based on 8,000 hours operation per year.c
Data not available.d
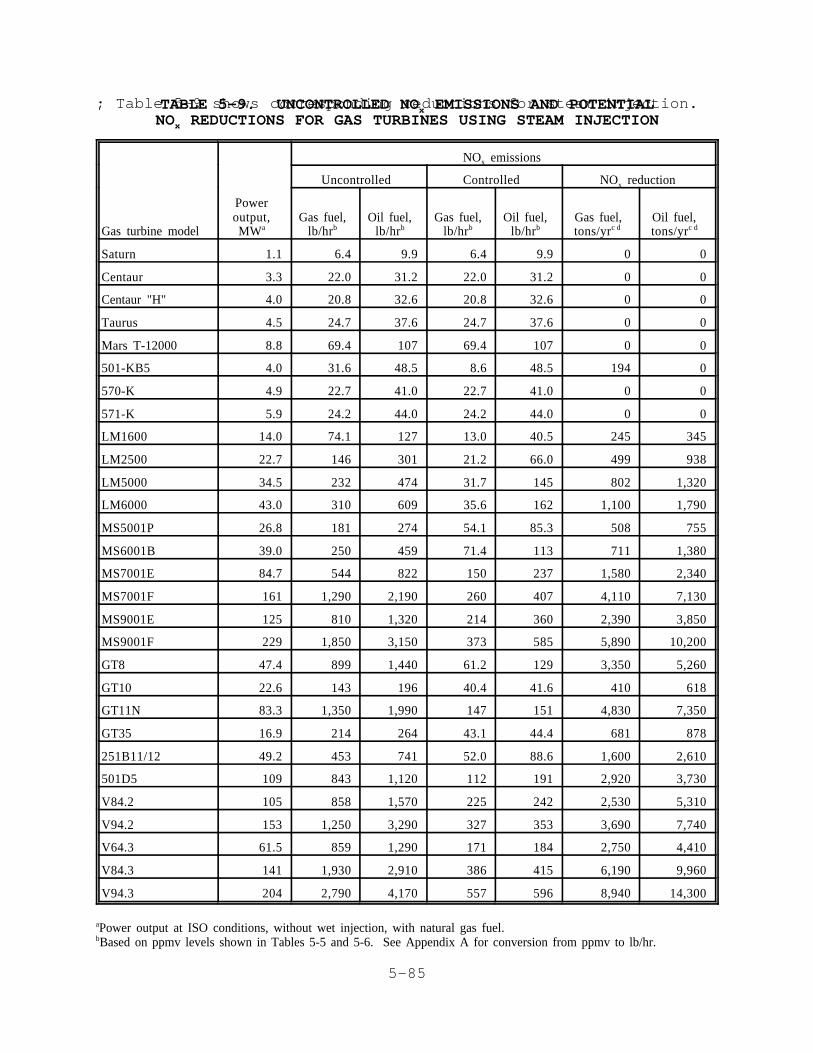
5-85
TABLE 5-9. UNCONTROLLED NO EMISSIONS AND POTENTIALxNO REDUCTIONS FOR GAS TURBINES USING STEAM INJECTIONx
NO emissionsx
Uncontrolled Controlled NO reductionx
Gas turbine model
Poweroutput,MWa
Gas fuel,lb/hrb
Oil fuel,lb/hrb
Gas fuel,lb/hrb
Oil fuel,lb/hrb
Gas fuel,tons/yrc d
Oil fuel,tons/yrc d
Saturn 1.1 6.4 9.9 6.4 9.9 0 0
Centaur 3.3 22.0 31.2 22.0 31.2 0 0
Centaur "H" 4.0 20.8 32.6 20.8 32.6 0 0
Taurus 4.5 24.7 37.6 24.7 37.6 0 0
Mars T-12000 8.8 69.4 107 69.4 107 0 0
501-KB5 4.0 31.6 48.5 8.6 48.5 194 0
570-K 4.9 22.7 41.0 22.7 41.0 0 0
571-K 5.9 24.2 44.0 24.2 44.0 0 0
LM1600 14.0 74.1 127 13.0 40.5 245 345
LM2500 22.7 146 301 21.2 66.0 499 938
LM5000 34.5 232 474 31.7 145 802 1,320
LM6000 43.0 310 609 35.6 162 1,100 1,790
MS5001P 26.8 181 274 54.1 85.3 508 755
MS6001B 39.0 250 459 71.4 113 711 1,380
MS7001E 84.7 544 822 150 237 1,580 2,340
MS7001F 161 1,290 2,190 260 407 4,110 7,130
MS9001E 125 810 1,320 214 360 2,390 3,850
MS9001F 229 1,850 3,150 373 585 5,890 10,200
GT8 47.4 899 1,440 61.2 129 3,350 5,260
GT10 22.6 143 196 40.4 41.6 410 618
GT11N 83.3 1,350 1,990 147 151 4,830 7,350
GT35 16.9 214 264 43.1 44.4 681 878
251B11/12 49.2 453 741 52.0 88.6 1,600 2,610
501D5 109 843 1,120 112 191 2,920 3,730
V84.2 105 858 1,570 225 242 2,530 5,310
V94.2 153 1,250 3,290 327 353 3,690 7,740
V64.3 61.5 859 1,290 171 184 2,750 4,410
V84.3 141 1,930 2,910 386 415 6,190 9,960
V94.3 204 2,790 4,170 557 596 8,940 14,300
Power output at ISO conditions, without wet injection, with natural gas fuel.a
Based on ppmv levels shown in Tables 5-5 and 5-6. See Appendix A for conversion from ppmv to lb/hr.b
; Table 5-9 shows corresponding reductions for steam injection.
5-86
As an example, a 21.8 MW turbine burning natural gas fuel can
reduce NO emissions by 452 tons/yr (8,000 hours operation) usingx
water injection and 511 tons/yr using steam injection. This same
turbine burning oil fuel will reduce annual NO emissions byx
1,040 tons using water injection and by 925 tons using steam
injection.
5.1.5 Impacts of Wet Controls on CO and HC Emissions
While carbon monoxide (CO) and hydrocarbon (HC) emissions
are relatively low for most gas turbines, water injection may
increase these emissions. Figure 5-13
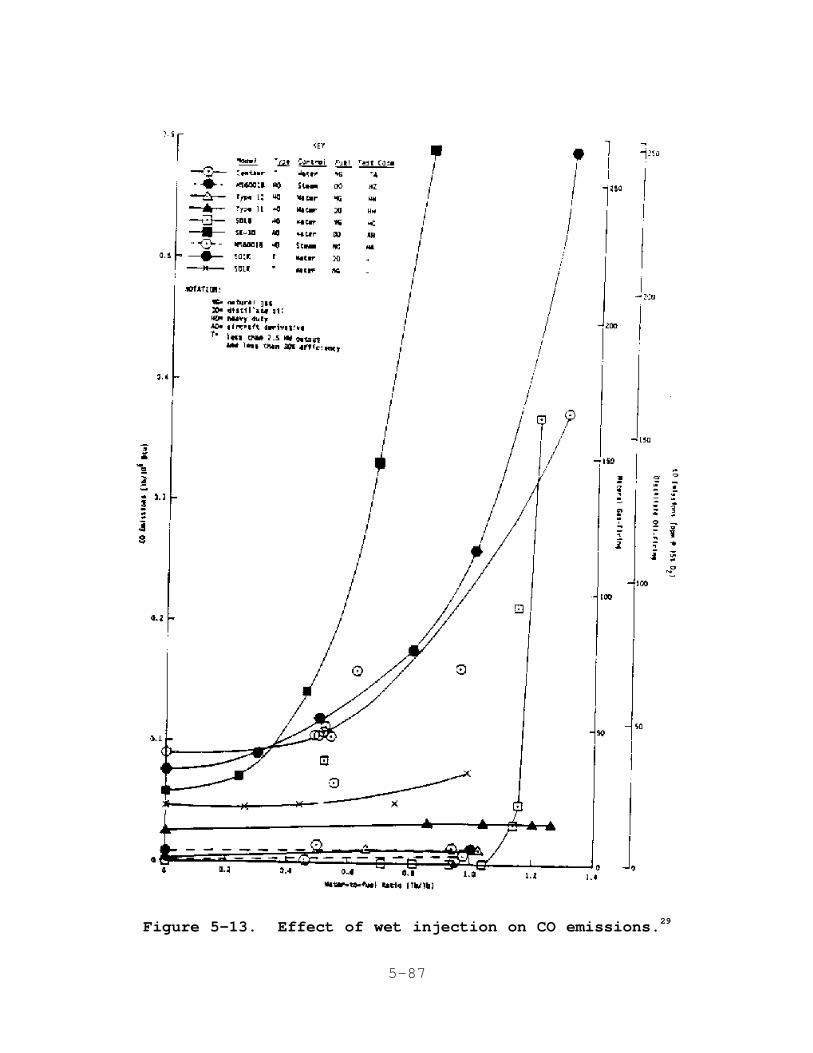
5-87
Figure 5-13. Effect of wet injection on CO emissions.29
5-88
shows the impact of water injection on CO emissions for several
production gas turbines. In many turbines, CO emissions increase
as the WFR increases, especially at WFR's above 0.8. Steam
injection also increases CO emissions at relatively high WFR's,
but the impact is less than that of water injection.29,30
Water and steam injection also increase HC emissions, but to
a lesser extent than CO emissions. The effect of water29,30
injection on HC emissions for one turbine is shown in
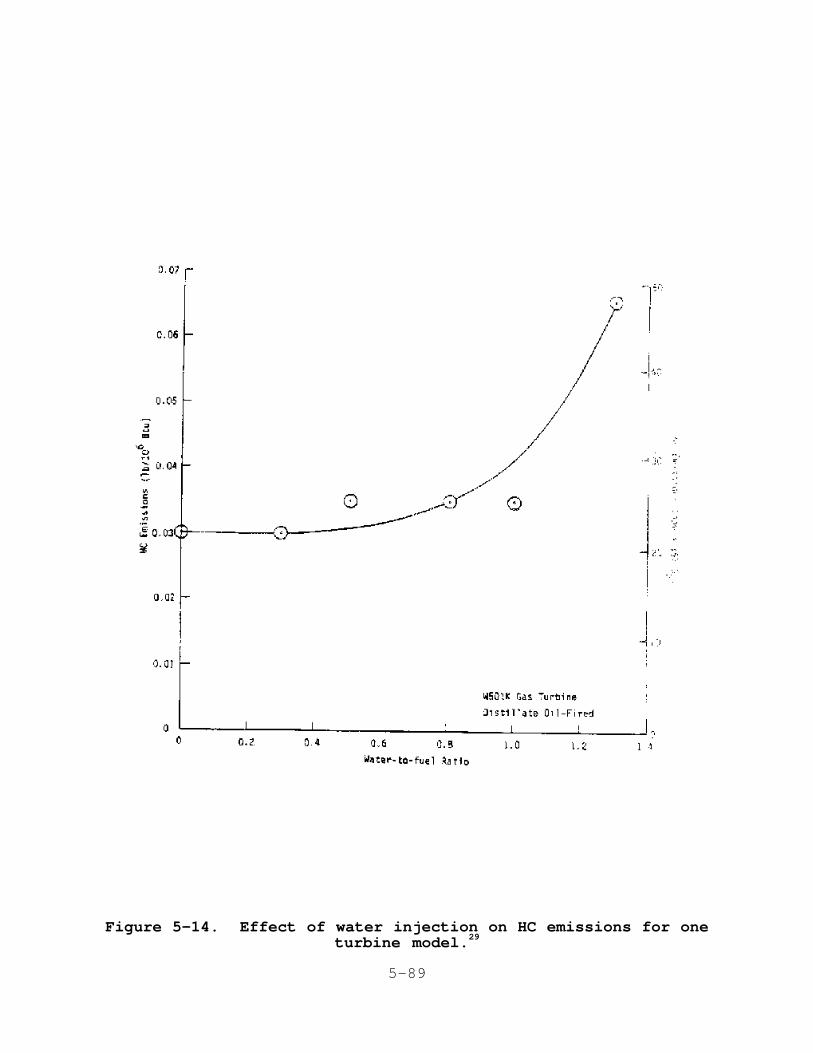
5-89
Figure 5-14. Effect of water injection on HC emissions for oneturbine model.29
5-90
Figure 5-14. Like CO emissions, hydrocarbon emissions increase
at WFR's above 0.8.
For applications where the water or steam injection rates
required for NO emission reductions result in excess CO and/orx
HC emissions, it may be possible to select an alternative turbine
and/or fuel with a relatively flat CO curve, as indicated in
Figure 5-13. Another alternative is an oxidation catalyst to
reduce these emissions. This oxidation catalyst is an add-on
control device that is placed in the turbine exhaust duct or HRSG
and serves to oxidize CO and HC to H O and CO . The catalyst2 2
material is usually a precious metal (platinum, palladium, or
rhodium), and oxidation efficiencies of 90 percent or higher can
be achieved. The oxidation process takes place spontaneously,
without the requirement for introducing reactants (such as
ammonia) into the flue gas stream.31

5-91

5-92

5-93
5-94
5.1.6 Impacts of Wet Controls on Gas Turbine Performance
Wet controls affect gas turbine performance in two ways:
power output increases and efficiency decreases. The energy from
the added mass flow and heat capacity of the injected water or
steam can be recovered in the turbine, which results in an
increase in power output. For water injection, the fuel energy
required to vaporize the water in the turbine combustor, however,
results in a net penalty to the overall efficiency of the
turbine. For steam injection, there is an energy penalty
associated with generating the steam, which results in a net
penalty to the overall cycle efficiency. Where the steam source
is exhaust heat, which would otherwise be exhausted to the
atmosphere, the heat recovery results in a net gain in gas
turbine efficiency. The actual efficiency reduction associated32
with wet controls is specific to each turbine and the actual WFR
required to meet a specific NO reduction. The overallx
efficiency penalty increases with increasing WFR and is usually
higher for water injection than for steam injection due to the
heat of vaporization associated with water. The impacts on
output and efficiency for one manufacturer's gas turbines are
shown in Table 5-10.
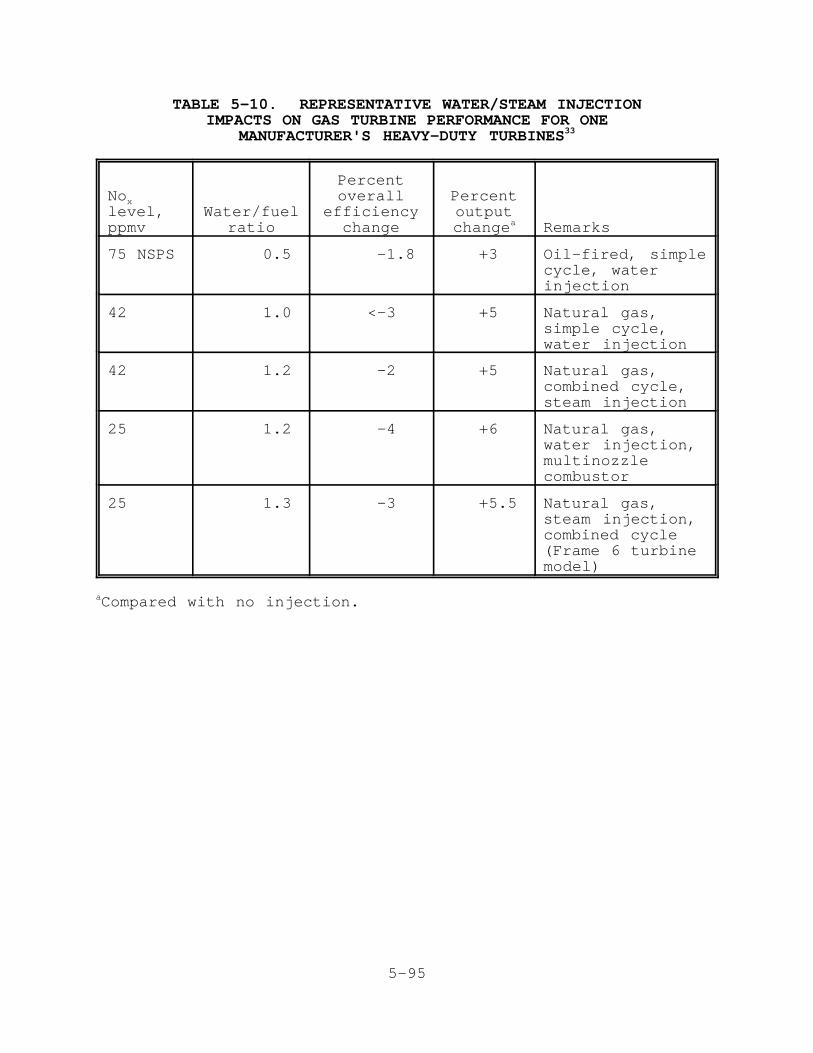
5-95
TABLE 5-10. REPRESENTATIVE WATER/STEAM INJECTIONIMPACTS ON GAS TURBINE PERFORMANCE FOR ONE
MANUFACTURER'S HEAVY-DUTY TURBINES33
Noxlevel,ppmv
Water/fuelratio
Percentoverall
efficiencychange
Percentoutputchangea Remarks
75 NSPS 0.5 -1.8 +3 Oil-fired, simplecycle, waterinjection
42 1.0 <-3 +5 Natural gas,simple cycle,water injection
42 1.2 -2 +5 Natural gas,combined cycle,steam injection
25 1.2 -4 +6 Natural gas,water injection,multinozzlecombustor
25 1.3 -3 +5.5 Natural gas,steam injection,combined cycle(Frame 6 turbinemodel)
Compared with no injection.a

5-96
5.1.7 Impacts of Wet Controls on Gas Turbine Maintenance
Water injection increases dynamic pressure oscillation
activity in the turbine combustor. This activity can, in some33
turbine models, increase erosion and wear in the hot section of
the turbine, thereby increasing maintenance requirements. As a
result, the turbine must be removed from service more frequently
for inspection and repairs to the hot section components. A
summary of the maintenance impacts as provided by manufacturers
is shown in Table 5-11.
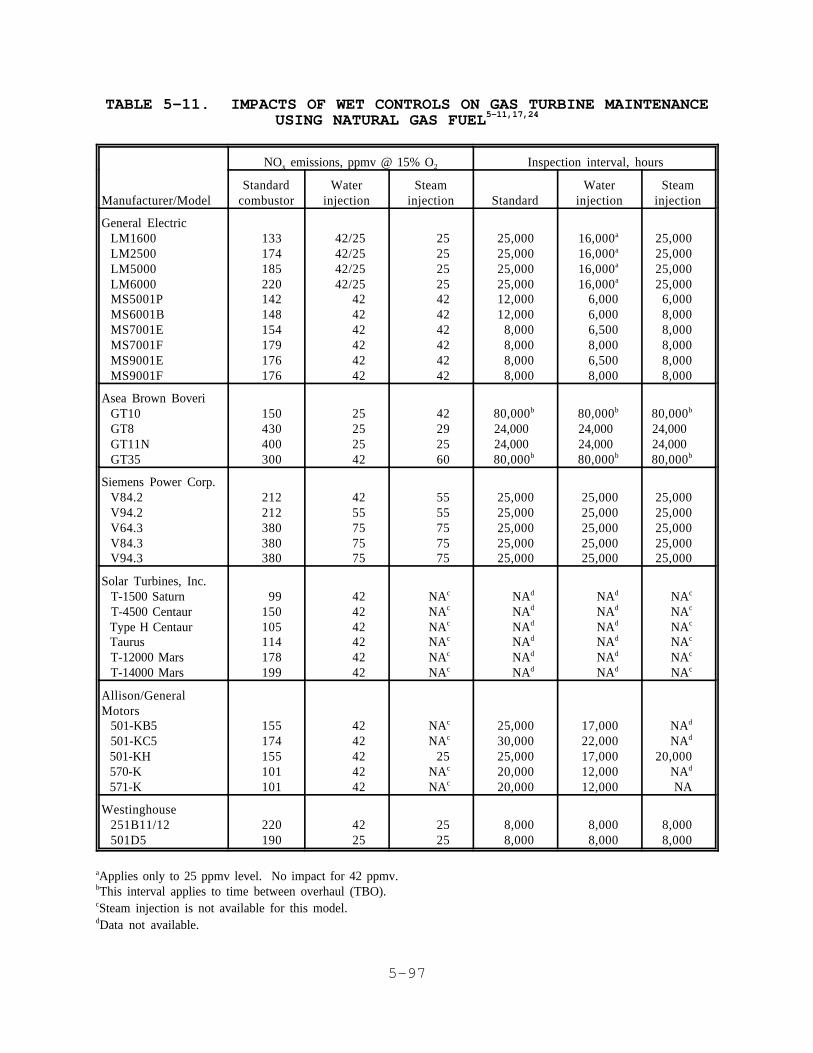
5-97
TABLE 5-11. IMPACTS OF WET CONTROLS ON GAS TURBINE MAINTENANCEUSING NATURAL GAS FUEL5-11,17,24
NO emissions, ppmv @ 15% Ox 2 Inspection interval, hours
Manufacturer/ModelStandard
combustorWater
injectionSteam
injection StandardWater
injectionSteam
injection
General ElectricLM1600LM2500LM5000LM6000MS5001PMS6001BMS7001EMS7001FMS9001EMS9001F
133174185220142148154179176176
42/2542/2542/2542/25
424242424242
25252525424242424242
25,00025,00025,00025,00012,00012,000
8,0008,0008,0008,000
16,000a
16,000a
16,000a
16,000a
6,0006,0006,5008,0006,5008,000
25,00025,00025,00025,000
6,0008,0008,0008,0008,0008,000
Asea Brown BoveriGT10GT8GT11NGT35
150430400300
25252542
42292560
80,000b
24,000 24,000 80,000b
80,000b
24,000 24,000 80,000b
80,000b
24,000 24,000 80,000b
Siemens Power Corp.V84.2V94.2V64.3V84.3V94.3
212212380380380
4255757575
5555757575
25,00025,00025,00025,00025,000
25,00025,00025,00025,00025,000
25,00025,00025,00025,00025,000
Solar Turbines, Inc. T-1500 Saturn T-4500 Centaur Type H Centaur Taurus T-12000 Mars T-14000 Mars
99150105114178199
424242424242
NAc
NAc
NAc
NAc
NAc
NAc
NAd
NAd
NAd
NAd
NAd
NAd
NAd
NAd
NAd
NAd
NAd
NAd
NAc
NAc
NAc
NAc
NAc
NAc
Allison/GeneralMotors 501-KB5 501-KC5 501-KH 570-K 571-K
155174155101101
4242424242
NAc
NAc
25NAc
NAc
25,00030,00025,00020,00020,000
17,00022,00017,00012,00012,000
NAd
NAd
20,000NAd
NA
Westinghouse251B11/12501D5
220190
4225
2525
8,0008,000
8,0008,000
8,0008,000
Applies only to 25 ppmv level. No impact for 42 ppmv.a
This interval applies to time between overhaul (TBO).b
Steam injection is not available for this model.c
Data not available.d

5-98
As this table shows, the maintenance impact, if any, varies
from manufacturer to manufacturer and model to model. Some
manufacturers stated that there is no impact on maintenance
intervals associated with water or steam injection for their
turbine models. Data were provided only for operation with
natural gas.

5-99
5-100
5.2 COMBUSTION CONTROLS
The formation of both thermal NO and fuel NO depends uponx x
combustion conditions, so modification of these conditions
affects NO formation. The following combustion modificationsx
are used to control NO emission levels:x
1. Lean combustion;
2. Reduced combustor residence time;
3. Lean premixed combustion; and
4. Two-stage rich/lean combustion.
These combustion modifications can be applied singly or in
combination to control NO emissions.x
The mechanisms by which each of these techniques reduce NOx
formation, their applicability to new gas turbines, and the
design or operating factors that influence NO reductionx
performance are discussed below by control technique.
5.2.1 Lean Combustion and Reduced Combustor Residence Time
5.2.1.1 Process Description. Gas turbine combustors were
originally designed to operate with a primary zone equivalence
ratio of approximately 1.0. (An equivalence ratio of 1.0
indicates a stoichiometric ratio of fuel and air. Equivalence
ratios below 1.0 indicate fuel-lean conditions, and ratios above
1.0 indicate fuel-rich conditions.) With lean combustion, the
additional excess air cools the flame, which reduces the peak
flame temperature and reduces the rate of thermal NO formation.x34
In all gas turbine combustor designs, the high-temperature
combustion gases are cooled with dilution air to an acceptable
temperature prior to entering the turbine. This dilution air
rapidly cools the hot gases to temperatures below those required
for thermal NO formation. With reduced residence timex
combustors, dilution air is added sooner than with standard
combustors. Because the combustion gases are at a high
temperature for a shorter time, the amount of thermal NO formedx
decreases.34
Shortening the residence time of the combustion products at
high temperatures may result in increased CO and HC emissions if
5-101
no other changes are made in the combustor. In order to avoid
increases in CO and HC emissions, combustors with reduced
residence time also incorporate design changes in the air
distribution ports to promote turbulence, which improves fuel/air
mixing and reduces the time required for the combustion process
to be completed. These designs may also incorporate fuel/air
premixing chambers. Therefore, the differences between reduced
residence time combustors and standard combustors are the
placement of the air ports, the design of the circulation flow
patterns in the combustor, and a shorter combustor length.34
5.2.1.2 Applicability. Lean primary zone combustion and
reduced residence time combustion have been applied to annular,
can-annular, and silo combustor designs. Almost all gas35-37
turbines presently being manufactured incorporate lean combustion
and/or reduced residence time to some extent in their combustor
designs, incorporating these features into production models
since 1975. However, the varying uncontrolled NO emission38,39x
levels of gas turbines shown in Figures 5-2 and 5-3 indicate that
these controls are not incorporated to the same degree in every
gas turbine and may be limited in some turbines by the quantity
of dilution air available for lean combustion.
Lean primary zone and reduced residence time are most
applicable to low-nitrogen fuels, such as natural gas and
distillate oil fuels. These modifications are not effective in
reducing fuel NO .x40
5.2.1.3 Factors Affecting Performance. For a given
combustor, the performance of lean combustion is directly
affected by the primary zone equivalence ratio. As shown in
Figure 4-2, the further the equivalence ratio is reduced below
1.0, the greater the reduction in NO emissions. However, if thex
equivalence ratio is reduced too far, CO emissions increase and
flame stability problems occur. This emissions tradeoff41
effectively limits the amount of NO reduction that can bex
achieved by lean combustion alone.

5-102
For combustors with reduced residence time, the amount of
NO emission reduction achieved is directly related to thex
decrease in residence time in the high-temperature flame zone.
5.2.1.4 Achievable NO Emission Levels Using Leanx
Combustion and Reduced Residence Time Combustors. Lean
combustion reduces NO emissions, and when used in combinationx
with reduced residence time, NO emissions are further reduced. x
Figure 5-1
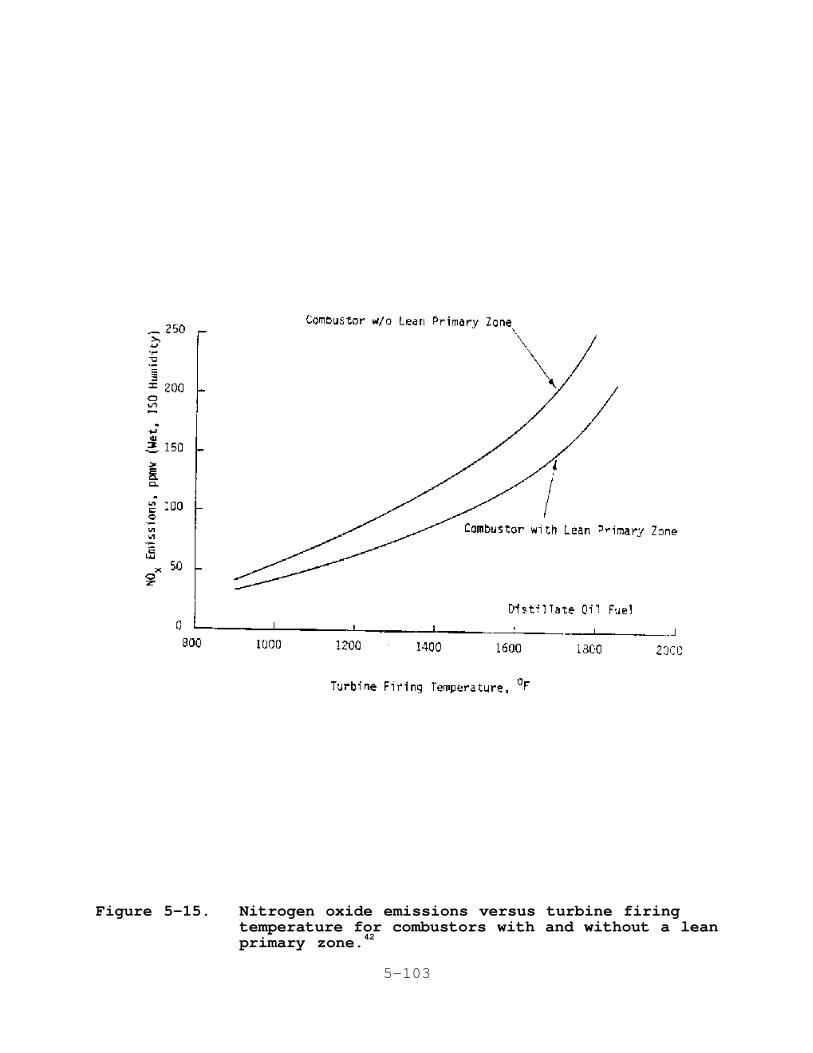
5-103
Figure 5-15. Nitrogen oxide emissions versus turbine firingtemperature for combustors with and without a leanprimary zone.42
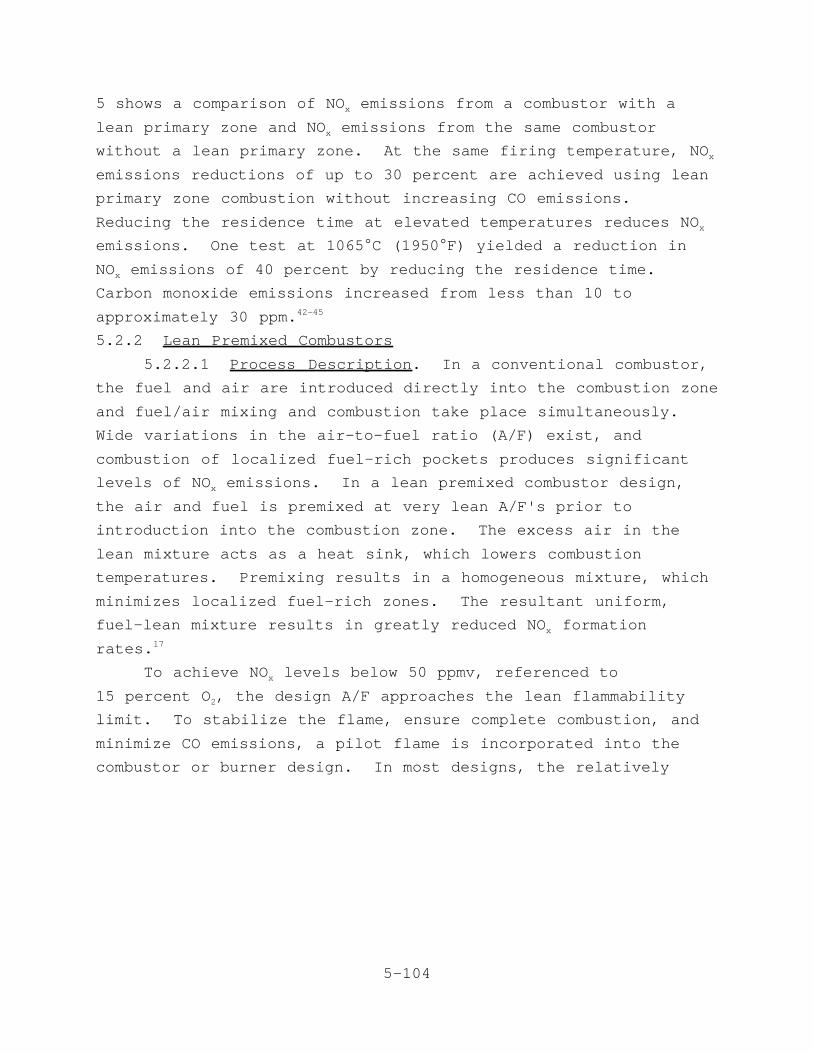
5-104
5 shows a comparison of NO emissions from a combustor with ax
lean primary zone and NO emissions from the same combustorx
without a lean primary zone. At the same firing temperature, NOx
emissions reductions of up to 30 percent are achieved using lean
primary zone combustion without increasing CO emissions.
Reducing the residence time at elevated temperatures reduces NOx
emissions. One test at 1065EC (1950EF) yielded a reduction in
NO emissions of 40 percent by reducing the residence time. x
Carbon monoxide emissions increased from less than 10 to
approximately 30 ppm. 42-45
5.2.2 Lean Premixed Combustors
5.2.2.1 Process Description. In a conventional combustor,
the fuel and air are introduced directly into the combustion zone
and fuel/air mixing and combustion take place simultaneously.
Wide variations in the air-to-fuel ratio (A/F) exist, and
combustion of localized fuel-rich pockets produces significant
levels of NO emissions. In a lean premixed combustor design,x
the air and fuel is premixed at very lean A/F's prior to
introduction into the combustion zone. The excess air in the
lean mixture acts as a heat sink, which lowers combustion
temperatures. Premixing results in a homogeneous mixture, which
minimizes localized fuel-rich zones. The resultant uniform,
fuel-lean mixture results in greatly reduced NO formationx
rates.17
To achieve NO levels below 50 ppmv, referenced tox
15 percent O , the design A/F approaches the lean flammability2
limit. To stabilize the flame, ensure complete combustion, and
minimize CO emissions, a pilot flame is incorporated into the
combustor or burner design. In most designs, the relatively

5-105
small amount of air and fuel supplied to this pilot flame is not
premixed and the A/F is nearly stoichiometric, so the pilot flame
temperature is relatively high. As a result, NO emissions fromx
the pilot flame are higher than from the lean premixed
combustion. 46
Virtually all gas turbine manufacturers have implemented
lean premixed combustion development programs. Three
manufacturers' designs that are available in production turbines
are described below.
The first design uses a can-annular combustor and is shown
in Figure 5-16
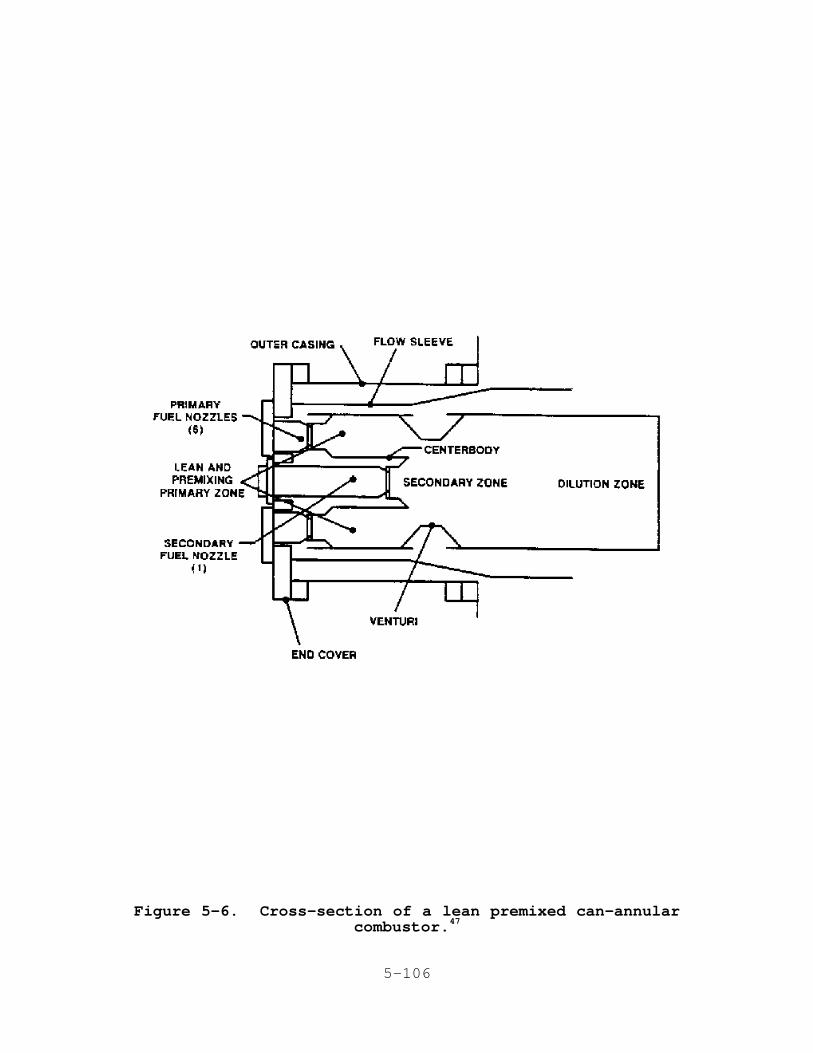
5-106
Figure 5-6. Cross-section of a lean premixed can-annularcombustor.47

5-107
. This is a two-stage premixed combustor: the first stage is
the portion of the combustor upstream of the venturi section and
includes the six primary fuel nozzles; the second stage is the
balance of the combustor and includes the single secondary fuel
nozzle.33
The operating modes for this combustor design are shown in
Figure 5-17. For ignition, warmup, and acceleration to
approximately 20 percent load, the first stage serves as the
complete combustor.
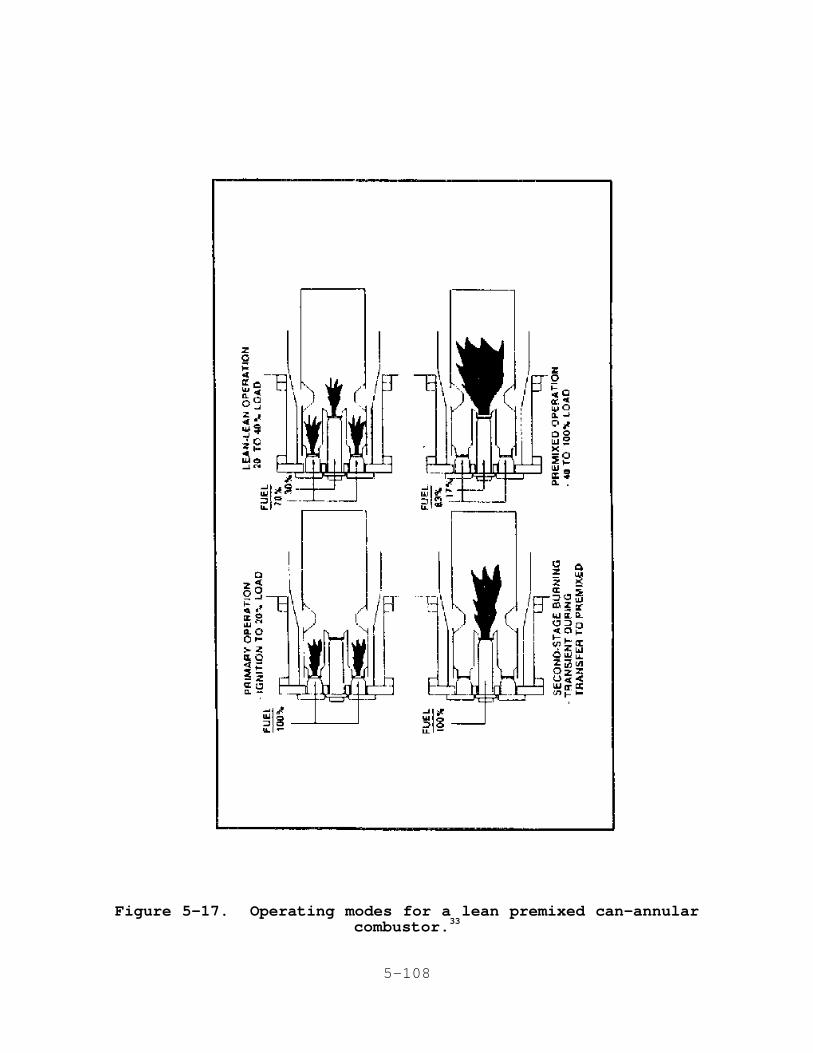
5-108
Figure 5-17. Operating modes for a lean premixed can-annularcombustor.33
5-109
Flame is present only in the first stage, and the equivalence
ratio is kept as low as stable combustion will permit. With
increasing load, fuel is introduced into the secondary stage, and
combustion takes place in both stages. Again, the equivalence
ratio is kept as low as possible in both stages to minimize NOx
emissions. When the load reaches approximately 40 percent, fuel
is cut off to the first stage and the flame in this stage is
extinguished. The venturi ensures the flame in the second stage
cannot propagate upstream to the first stage. When the first-
stage flame is extinguished (as verified by internal flame
detectors), fuel is again introduced into the first stage, which
becomes a premixing zone to deliver a lean, unburned, uniform
mixture to the second stage. The second stage acts as the
complete combustor in this configuration.33
For operation on distillate oil, fuel is introduced and
burned only in the first stage for ignition and for loads up to
approximately 50 percent. For loads greater than 50 percent,
fuel is introduced and burned in both stages. 33

5-110

5-111
Figure 5-18 shows a lean premixed combustor design used by
another manufacturer for an annular combustor.
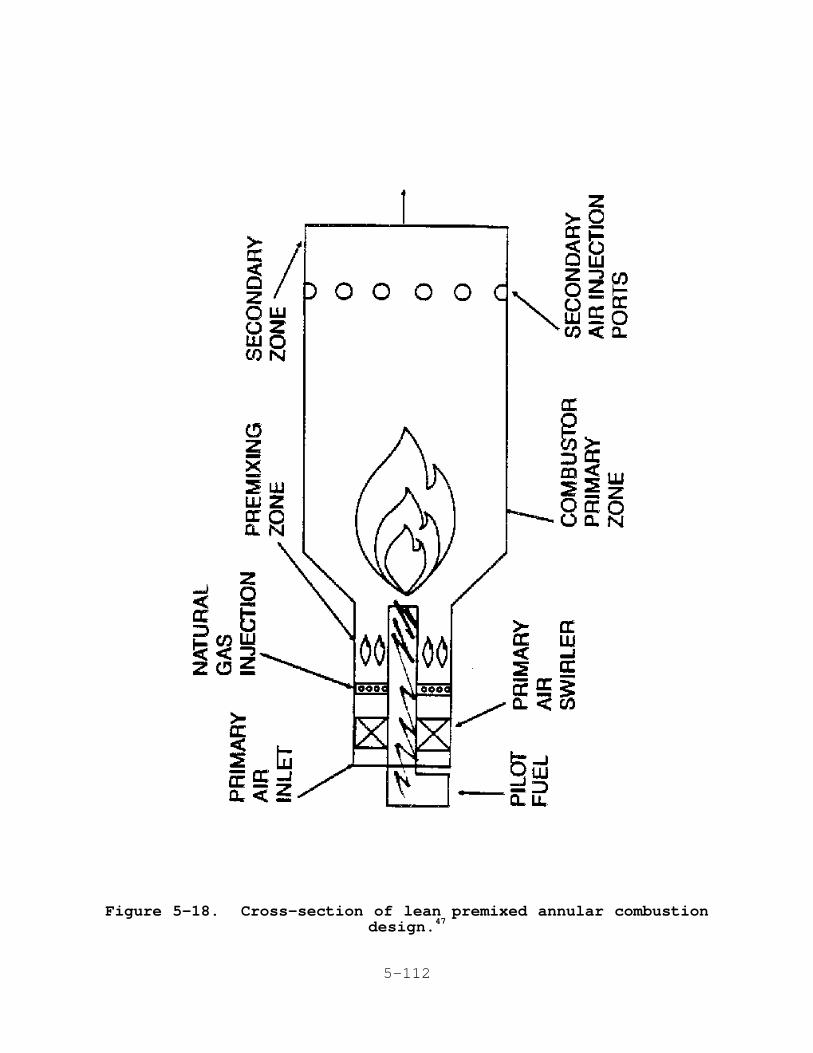
5-112
Figure 5-18. Cross-section of lean premixed annular combustiondesign.47

5-113
The air and fuel are premixed using a very lean A/F, and the
resultant uniform mixture is delivered to the primary combustion
zone where combustion is stabilized using a pilot flame. Using
one or more mechanical systems to regulate the airflow delivered
to the combustor, the premix mode is operable for output loads
between 50 and 100 percent. Below 50 percent load, only the
pilot flame is operating, and NO emissions levels are similar tox
those for conventional combustors.46
Another manufacturer's production low-NO design uses a silox
combustor. Unlike the can-annular and annular designs, the silo
combustor is mounted externally to the turbine and can therefore
be modified without significantly affecting the rest of the
turbine design, provided the mounting flange to the turbine is
unchanged. In addition, this large combustion chamber is fitted
with a ceramic lining that shields the metal surfaces from peak
flame temperatures. This lining reduces the requirement for
cooling air, so more air is available for the combustion
process. 17
This silo low-NO combustor design uses six burners, asx
shown in Figure 5-19
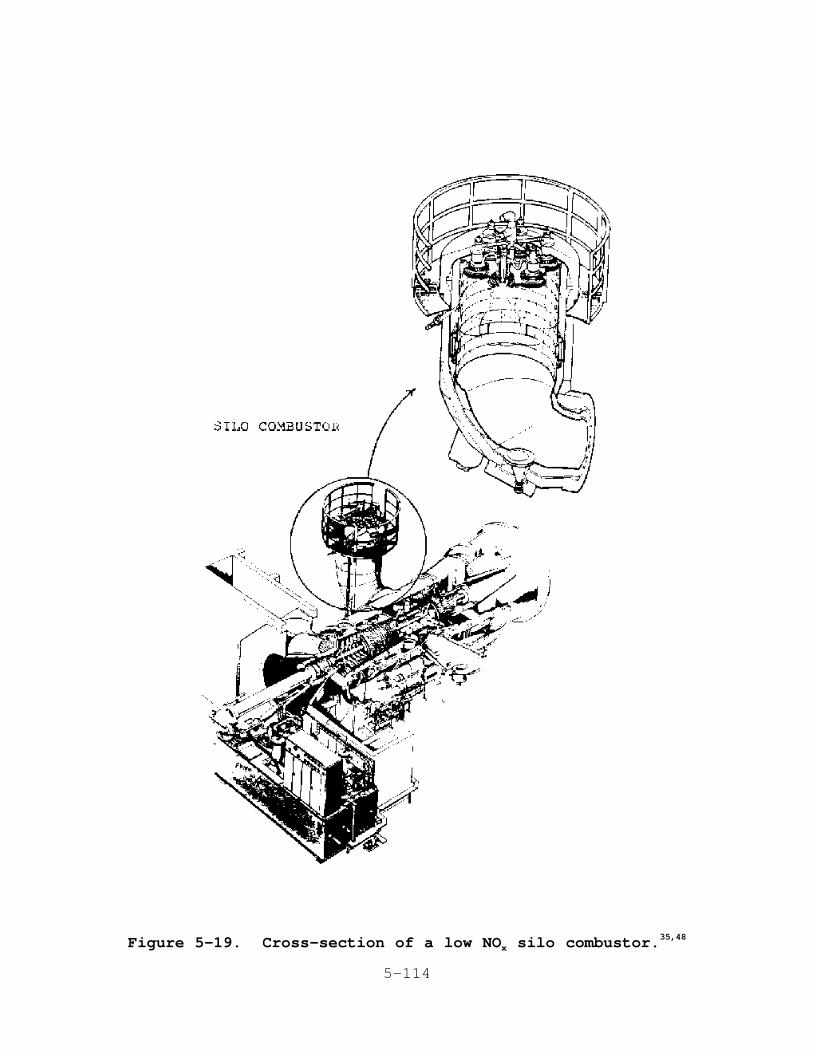
5-114
Figure 5-19. Cross-section of a low NO silo combustor.x35,48

5-115
. For operation on natural gas, each burner serves to premix the
air and fuel to deliver a lean and uniform mixture to the
combustion zone. To achieve the lowest possible NO emissions,x
the A/F of the premixed gases is kept very near the lean
flammability limit and a pilot flame is used to stabilize the
overall combustion process. This burner design is shown in
Figure 5-20
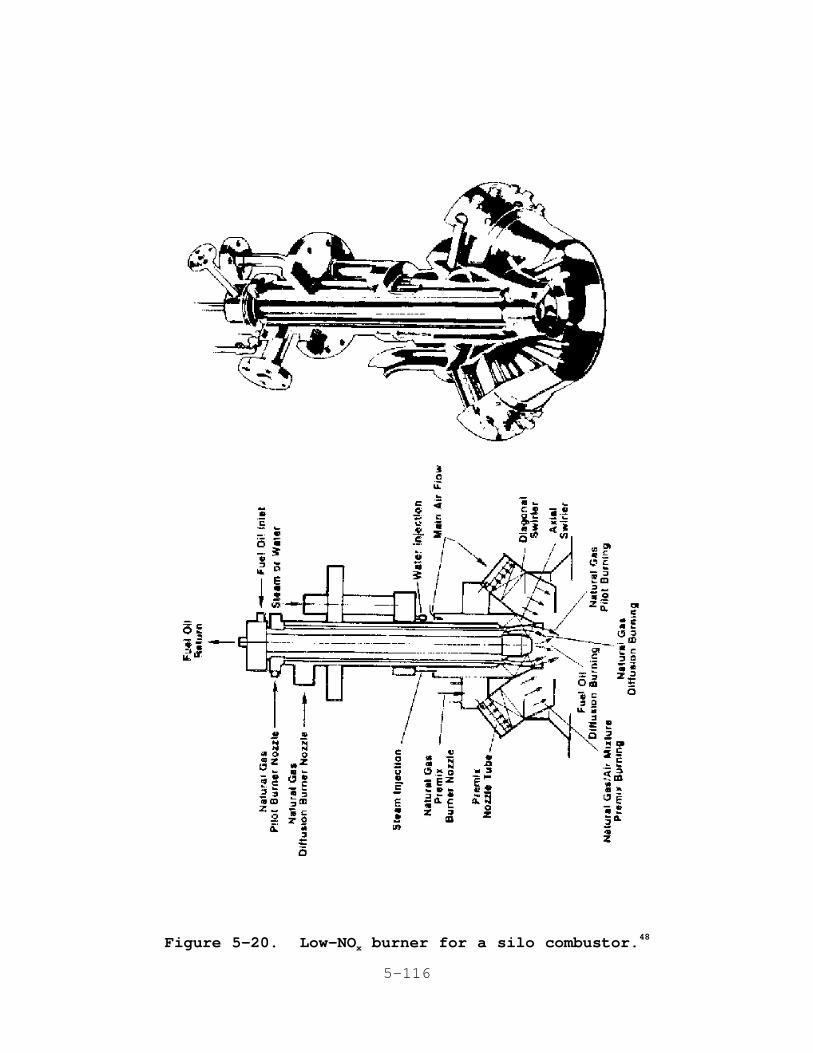
5-116
Figure 5-20. Low-NO burner for a silo combustor.x48

5-117
. Like the can-annular design, the burner in the silo combustor
cannot operate over the full power range of the gas turbine in
the premix mode due to inability of the premix mode to deliver
suitable A/F's at low power output levels. For this reason, the
burners are designed to operate in a conventional diffusion
burning mode at startup and low power outputs and switch to a
premix burning mode at higher power output levels.

5-118

5-119
5-120
For operation on distillate oil with the current burner
design, combustion occurs only in a diffusion mode and there is
no premixing of air and fuel.
5.2.2.2 Applicability. As discussed in Section 5.2.2.1,
lean premixed combustors apply to can-annular, annular, and silo
combustors. This combustion modification is effective in
reducing thermal NO emissions for both natural gas andx
distillate oil but is not effective on fuel NO . Therefore, leanx
premixed combustion is not as effective in reducing NO levels ifx
high-nitrogen fuels are fired.49
The multiple operating modes associated with the percent
operating load results in "stepped" NO emission levels. Tox
date, low NO emission levels occur only at loads greater than 40x
to 75 percent.
Lean premixed combustors currently are available for limited
models from three manufacturers contacted for this study. 6,17,24
Two additional manufacturers project an availability date of 1993
or 1994 for lean premixed combustors for some turbine models. 11,50
All of these manufacturers state that these lean premixed
combustors will be available for retrofit applications.
5.2.2.3 Factors Affecting Performance. The primary factors
affecting the performance of lean, premixed combustors are A/F
and the type of fuel. To achieve low NO emission levels, thex
A/F must be maintained in a narrow range near the lean
flammability limit of the mixture. Lean premixed combustors are
designed to maintain this A/F at rated load. At reduced load
conditions, the fuel input requirement decreases. To avoid
combustion instability and excessive CO emissions that would
occur as the A/F reaches the lean flammability limit, all
manufacturers' lean premixed combustors switch to a
diffusion-type combustion mode at reduced load conditions,
typically between 40 and 60 percent load. This switchover to a
diffusion combustion mode results in higher NO emissions. x
Natural gas produces lower NO levels than do oil fuels. x
The reasons for this are the lower flame temperature of natural
gas and the ability to premix this fuel with air prior to
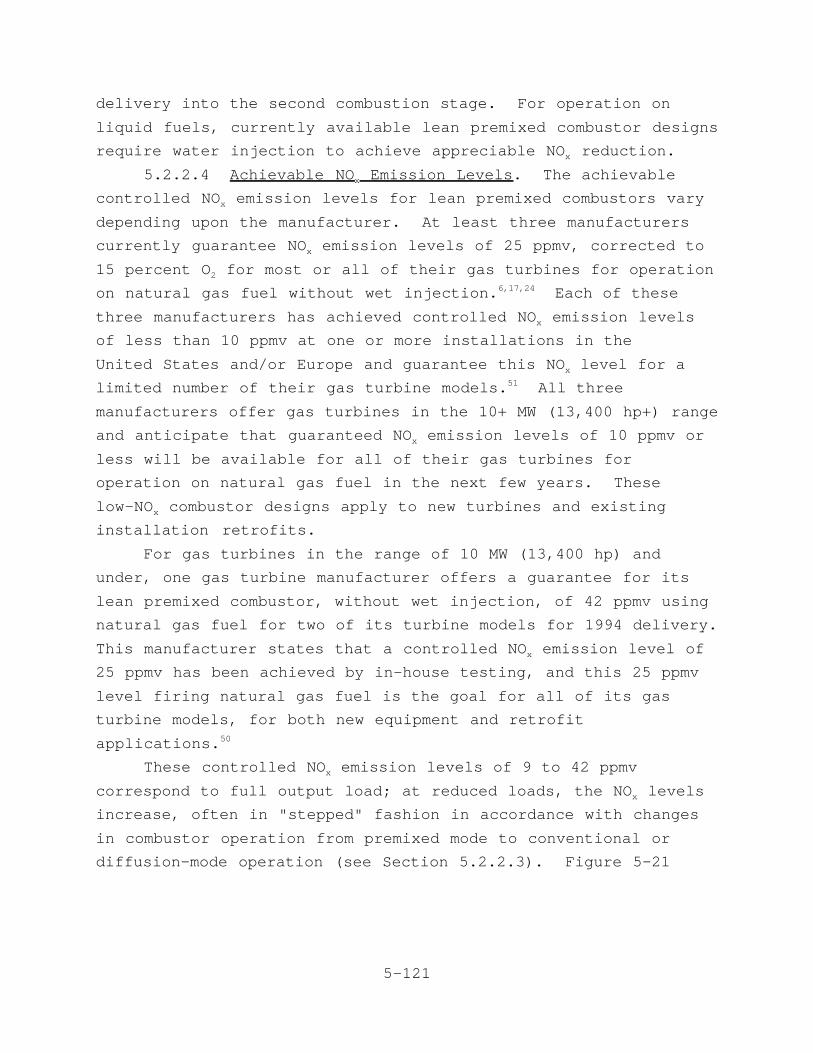
5-121
delivery into the second combustion stage. For operation on
liquid fuels, currently available lean premixed combustor designs
require water injection to achieve appreciable NO reduction.x
5.2.2.4 Achievable NO Emission Levels. The achievablex
controlled NO emission levels for lean premixed combustors varyx
depending upon the manufacturer. At least three manufacturers
currently guarantee NO emission levels of 25 ppmv, corrected tox
15 percent O for most or all of their gas turbines for operation2
on natural gas fuel without wet injection. Each of these6,17,24
three manufacturers has achieved controlled NO emission levelsx
of less than 10 ppmv at one or more installations in the
United States and/or Europe and guarantee this NO level for ax
limited number of their gas turbine models. All three51
manufacturers offer gas turbines in the 10+ MW (13,400 hp+) range
and anticipate that guaranteed NO emission levels of 10 ppmv orx
less will be available for all of their gas turbines for
operation on natural gas fuel in the next few years. These
low-NO combustor designs apply to new turbines and existingx
installation retrofits.
For gas turbines in the range of 10 MW (13,400 hp) and
under, one gas turbine manufacturer offers a guarantee for its
lean premixed combustor, without wet injection, of 42 ppmv using
natural gas fuel for two of its turbine models for 1994 delivery.
This manufacturer states that a controlled NO emission level ofx
25 ppmv has been achieved by in-house testing, and this 25 ppmv
level firing natural gas fuel is the goal for all of its gas
turbine models, for both new equipment and retrofit
applications.50
These controlled NO emission levels of 9 to 42 ppmvx
correspond to full output load; at reduced loads, the NO levelsx
increase, often in "stepped" fashion in accordance with changes
in combustor operation from premixed mode to conventional or
diffusion-mode operation (see Section 5.2.2.3). Figure 5-21
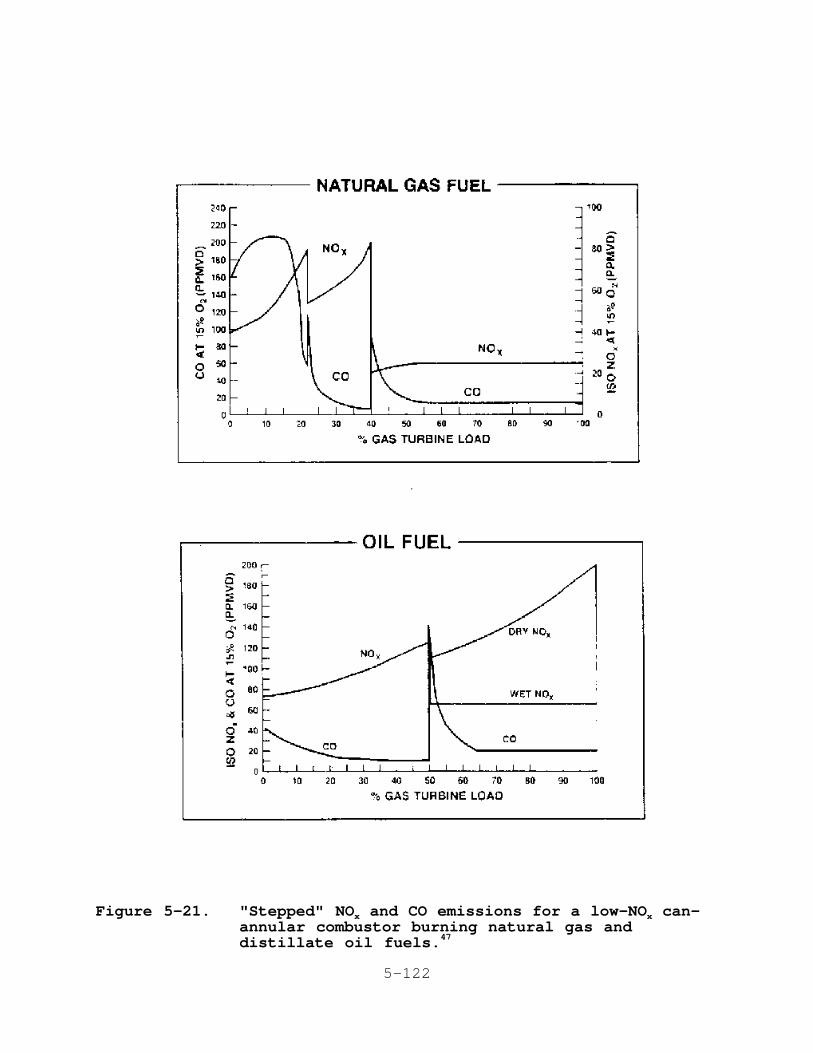
5-122
Figure 5-21. "Stepped" NO and CO emissions for a low-NO can-x xannular combustor burning natural gas anddistillate oil fuels.47
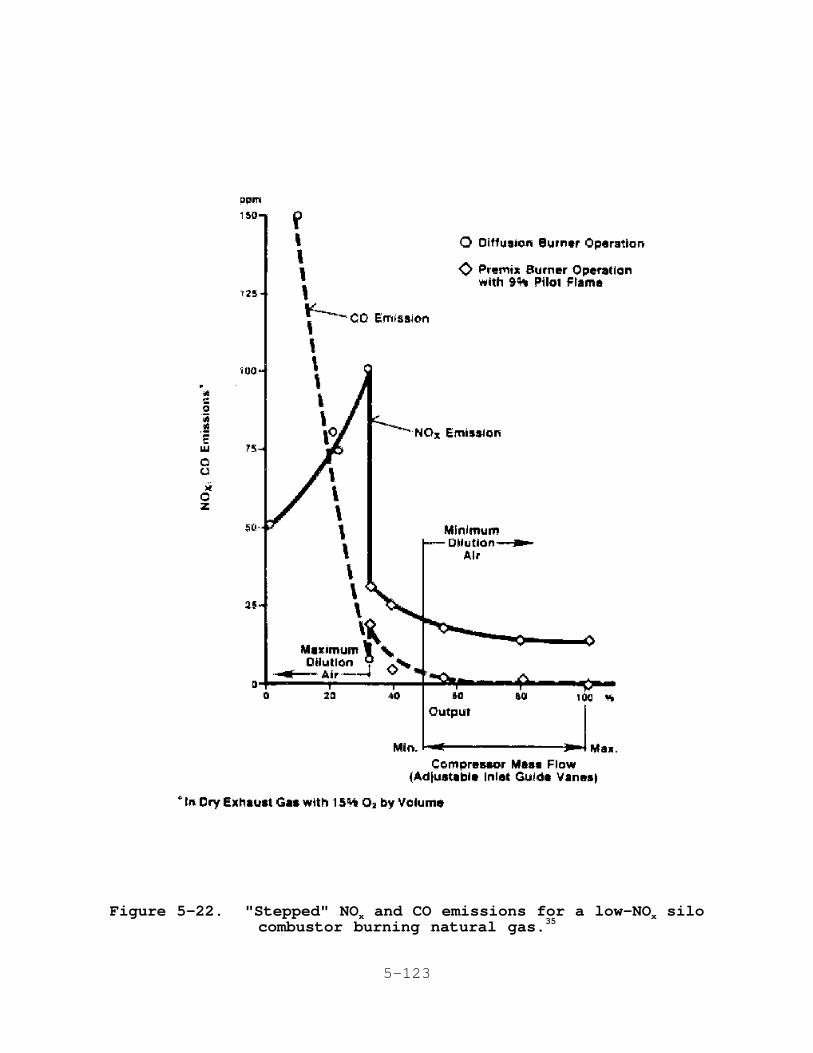
5-123
Figure 5-22. "Stepped" NO and CO emissions for a low-NO silox xcombustor burning natural gas.35

5-124
shows these stepped NO emissions levels for a can-annularx
combustor for natural gas and oil fuel operation. Figure 5-22

5-125

5-126
shows the emissions for a silo combustor operating on natural gas
only.
5-127
Figure 5-23. Nitrogen oxide emission text results from a leanpremix silo combustor firing fuel oil without wetinjection.53
5-128
The emission levels shown in Figures 5-21 and 5-22 correspond
to full-scale production turbines currently available from the
manufacturers.
Reduced NO emissions when burning oil fuel in currentlyx
available lean premixed combustor designs have been achieved only
with water or steam injection. With water or steam injection, a
65 ppmv NO level can be achieved in the turbine with a can-x
annular combustor design; a 65 ppmv level can also be met with
water injection in the turbine with a silo combustor at a WFR of
1.4. This 65 ppmv level for lean premixed combustors is48,52
higher than the controlled NO levels achieved with waterx
injection in oil-fired turbines using a conventional combustor
design.
Modification of the existing burner design used in the silo
combustor to allow premixing of the oil fuel with air prior to
combustion is under development. Tests performed using a 12 MW
(16,200 hp) turbine achieved NO emission levels below 50 ppmvx
without wet injection, corrected to 15 percent O , compared to2
uncontrolled levels of 150 ppmv or higher. The NO levels,x
without wet injection, as a function of equivalence ratio are
shown in Figure 5-23. The design equivalence ratio at rated load
is approximately 2.1. As shown in this figure, NO emissionsx
below 50 ppmv were achieved at rated power output at pilot fuel
flow levels of 10 percent of the total fuel input.52
Site test data for two turbines using silo-type lean
premixed combustors, as reported by the manufacturer, are shown
in Table 5-12. As this table shows, NO emission levels as lowx
as 16.5 ppmv were recorded for using natural gas fuel without
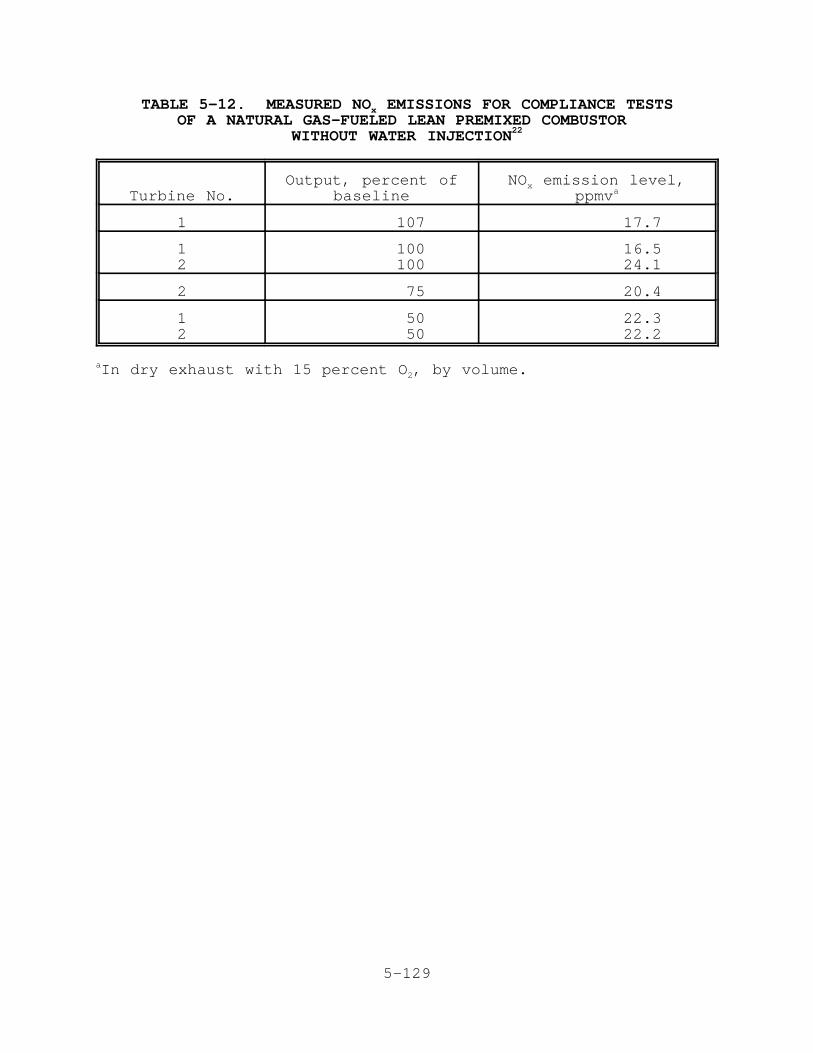
5-129
TABLE 5-12. MEASURED NO EMISSIONS FOR COMPLIANCE TESTSxOF A NATURAL GAS-FUELED LEAN PREMIXED COMBUSTOR
WITHOUT WATER INJECTION22
Turbine No.Output, percent of
baselineNO emission level,x
ppmva
1 107 17.7
12
100100
16.524.1
2 75 20.4
12
5050
22.322.2
In dry exhaust with 15 percent O , by volume.a2

5-130
water injection. Subsequent emission tests have achieved levels
below 10 ppmv. Corresponding data for operation on oil fuel51
using only the pilot (diffusion) stage for combustion, and with
water injection, is shown in Table 5-13. Levels of NO emissionsx
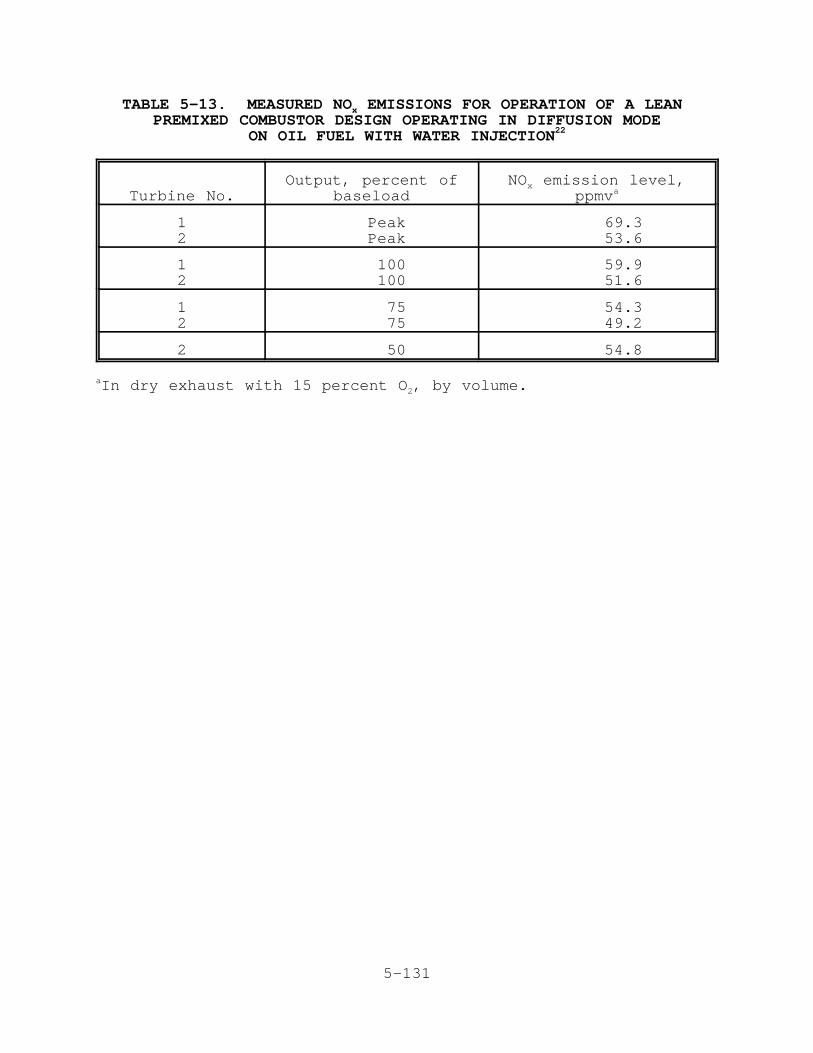
5-131
TABLE 5-13. MEASURED NO EMISSIONS FOR OPERATION OF A LEAN xPREMIXED COMBUSTOR DESIGN OPERATING IN DIFFUSION MODE
ON OIL FUEL WITH WATER INJECTION22
Turbine No.Output, percent of
baseloadNO emission level,x
ppmva
12
PeakPeak
69.353.6
12
100100
59.951.6
12
7575
54.349.2
2 50 54.8
In dry exhaust with 15 percent O , by volume.a2

5-132
at base load for No. 2 fuel oil are between 50 and 60 ppmv.
Based on information provided by turbine manufacturers, the
potential NO reductions using currently available lean premixed x

5-133

5-134

5-135
combustors are shown in Table 5-14. As this table indicates, NOx
emission reductions range from 14.7 tons/yr for a 1.1 MW
(1,480 hp) turbine to 10,400 tons/yr
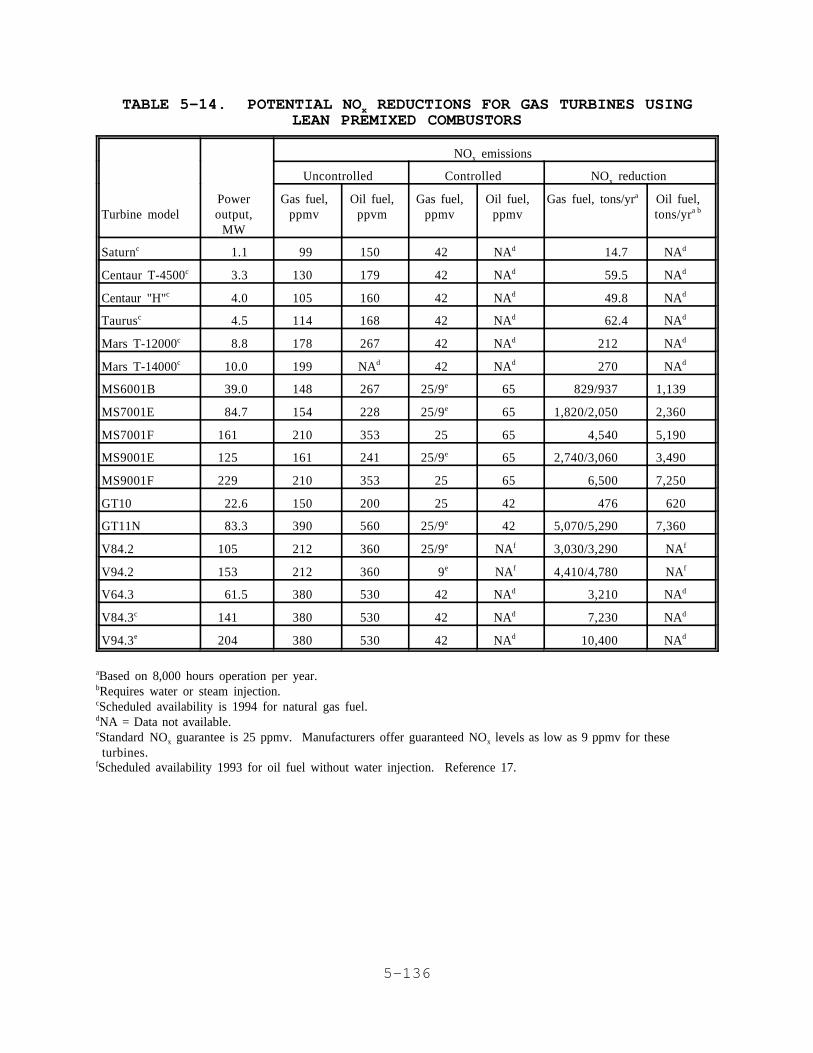
5-136
TABLE 5-14. POTENTIAL NO REDUCTIONS FOR GAS TURBINES USINGxLEAN PREMIXED COMBUSTORS
NO emissionsx
Uncontrolled Controlled NO reductionx
Turbine modelPoweroutput,
MW
Gas fuel,ppmv
Oil fuel,ppvm
Gas fuel,ppmv
Oil fuel,ppmv
Gas fuel, tons/yra Oil fuel,tons/yra b
Saturnc 1.1 99 150 42 NAd 14.7 NAd
Centaur T-4500c 3.3 130 179 42 NAd 59.5 NAd
Centaur "H"c 4.0 105 160 42 NAd 49.8 NAd
Taurusc 4.5 114 168 42 NAd 62.4 NAd
Mars T-12000c 8.8 178 267 42 NAd 212 NAd
Mars T-14000c 10.0 199 NAd 42 NAd 270 NAd
MS6001B 39.0 148 267 25/9e 65 829/937 1,139
MS7001E 84.7 154 228 25/9e 65 1,820/2,050 2,360
MS7001F 161 210 353 25 65 4,540 5,190
MS9001E 125 161 241 25/9e 65 2,740/3,060 3,490
MS9001F 229 210 353 25 65 6,500 7,250
GT10 22.6 150 200 25 42 476 620
GT11N 83.3 390 560 25/9e 42 5,070/5,290 7,360
V84.2 105 212 360 25/9e NAf 3,030/3,290 NAf
V94.2 153 212 360 9e NAf 4,410/4,780 NAf
V64.3 61.5 380 530 42 NAd 3,210 NAd
V84.3c 141 380 530 42 NAd 7,230 NAd
V94.3e 204 380 530 42 NAd 10,400 NAd
Based on 8,000 hours operation per year.a
Requires water or steam injection.b
Scheduled availability is 1994 for natural gas fuel.c
NA = Data not available.d
Standard NO guarantee is 25 ppmv. Manufacturers offer guaranteed NO levels as low as 9 ppmv for theseex x
turbines.Scheduled availability 1993 for oil fuel without water injection. Reference 17.f

5-137
for a 204 MW (274,000 hp) turbine for operation on natural gas
without wet injection. Corresponding NO emission reductions forx
operation on oil fuel, with water injection, range from
620 tons/yr for a 22.6 MW (30,300 hp) turbine to 7,360 tons/yr
for an 83.3 MW (112,000 hp) turbine.
Limited data from two manufacturers showing the impact of
lean premixed combustor designs on CO emissions are shown in
Table 5-15.
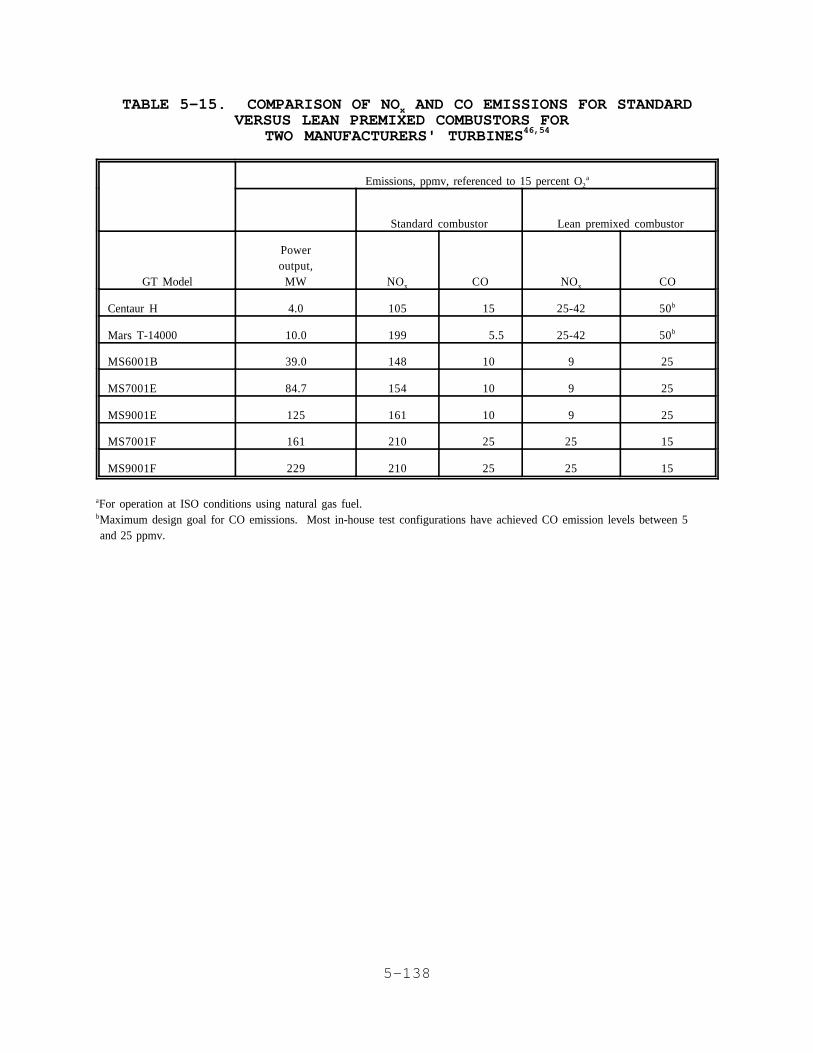
5-138
TABLE 5-15. COMPARISON OF NO AND CO EMISSIONS FOR STANDARDxVERSUS LEAN PREMIXED COMBUSTORS FOR
TWO MANUFACTURERS' TURBINES46,54
Emissions, ppmv, referenced to 15 percent O2a
Standard combustor Lean premixed combustor
GT Model
Poweroutput,
MW NOx CO NOx CO
Centaur H 4.0 105 15 25-42 50b
Mars T-14000 10.0 199 5.5 25-42 50b
MS6001B 39.0 148 10 9 25
MS7001E 84.7 154 10 9 25
MS9001E 125 161 10 9 25
MS7001F 161 210 25 25 15
MS9001F 229 210 25 25 15
For operation at ISO conditions using natural gas fuel.a
Maximum design goal for CO emissions. Most in-house test configurations have achieved CO emission levels between 5b
and 25 ppmv.
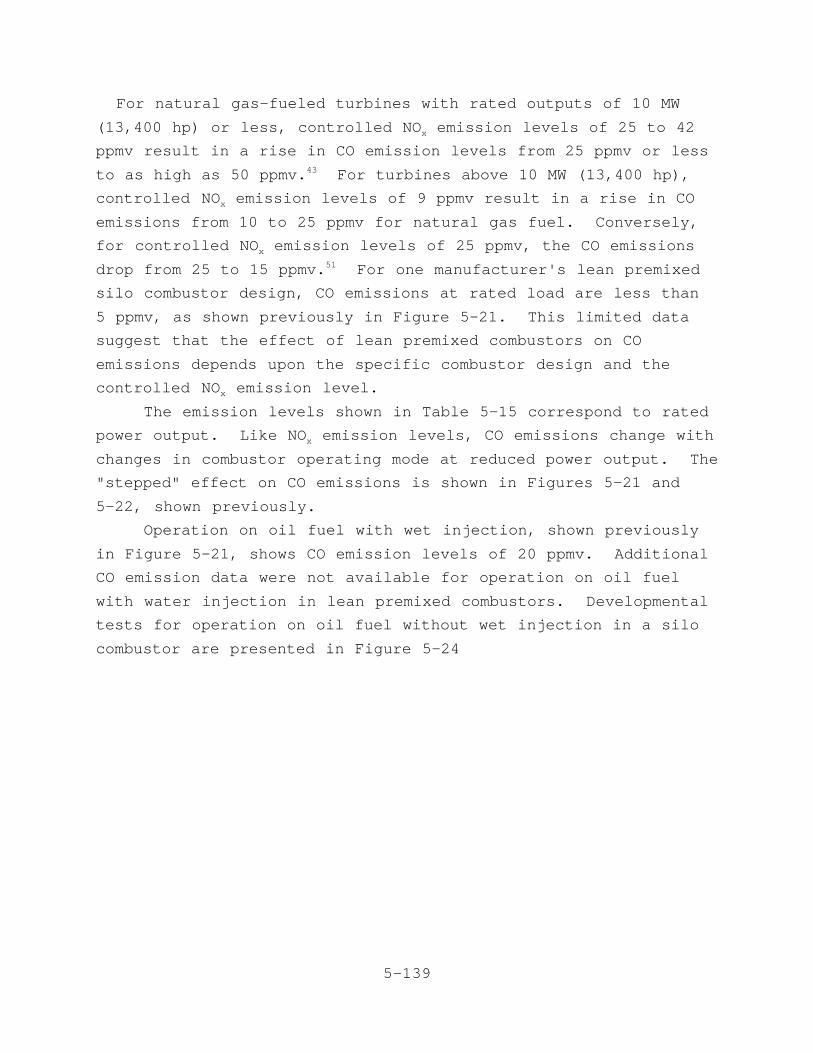
5-139
For natural gas-fueled turbines with rated outputs of 10 MW
(13,400 hp) or less, controlled NO emission levels of 25 to 42x
ppmv result in a rise in CO emission levels from 25 ppmv or less
to as high as 50 ppmv. For turbines above 10 MW (13,400 hp),43
controlled NO emission levels of 9 ppmv result in a rise in COx
emissions from 10 to 25 ppmv for natural gas fuel. Conversely,
for controlled NO emission levels of 25 ppmv, the CO emissionsx
drop from 25 to 15 ppmv. For one manufacturer's lean premixed51
silo combustor design, CO emissions at rated load are less than
5 ppmv, as shown previously in Figure 5-21. This limited data
suggest that the effect of lean premixed combustors on CO
emissions depends upon the specific combustor design and the
controlled NO emission level.x
The emission levels shown in Table 5-15 correspond to rated
power output. Like NO emission levels, CO emissions change withx
changes in combustor operating mode at reduced power output. The
"stepped" effect on CO emissions is shown in Figures 5-21 and
5-22, shown previously.
Operation on oil fuel with wet injection, shown previously
in Figure 5-21, shows CO emission levels of 20 ppmv. Additional
CO emission data were not available for operation on oil fuel
with water injection in lean premixed combustors. Developmental
tests for operation on oil fuel without wet injection in a silo
combustor are presented in Figure 5-24
5-140
Figure 5-24. The CO emission test results from a lean premixsilo combustor firing fuel oil without wet injection.

5-141
. At rated load, shown in this figure at an equivalence ratio of
approximately 2.1, CO emissions are less than 10 ppmv, corrected
to 15 percent O 2,

5-142

5-143
5-144
and are in the range of 0 to 2 ppmv for a pilot oil fuel flow of
10 percent (representing 10 percent of the total fuel flow). 53
This 10 percent pilot fuel flow corresponds to controlled NOx
emission levels below 50 ppmv, as shown previously in
Figure 5-22. No data for HC emissions were available for lean
premixed burner designs.
5.2.3 Rich/Quench/Lean Combustion
5.2.3.1 Process Description. Rich/quench/lean (RQL)
combustors burn fuel-rich in the primary zone and fuel-lean in
the secondary zone. Incomplete combustion under fuel-rich
conditions in the primary zone produces an atmosphere with a high
concentration of CO and hydrogen (H ). The CO and H replace2 2
some of the oxygen normally available for NO formation and alsox
act as reducing agents for any NO formed in the primary zone. x
Thus, fuel nitrogen is released with minimal conversion to NO . x
The lower peak flame temperatures due to partial combustion also
reduce the formation of thermal NO .x55
As the combustion products leave the primary zone, they pass
through a low-residence-time quench zone where the combustion
products are rapidly diluted with additional combustion air or
water. This rapid dilution cools the combustion products and at
the same time produces a lean A/F. Combustion is then completed
under fuel-lean conditions. This secondary lean combustion step
minimally contributes to the formation of fuel NO because mostx
of the fuel nitrogen will have been converted to N prior to the2
lean combustion phase. Thermal NO is minimized during leanx
combustion due to the low flame temperature.55
5.2.3.2 Applicability. The RQL combustion concept applies
to all types of gas turbines. None of the manufacturers
contacted for this study, however, currently have this design
available for their production turbines. This may be due to lack
of demand for this design due to the current limited use of
high-nitrogen-content fuels in gas turbines.
5.2.3.3 Factors Affecting Performance. The NO emissionsx
from RQL combustors are affected primarily by the equivalence
ratio in the primary combustion zone and the quench airflow rate.

5-145
Careful selection of equivalence ratios in the fuel-rich zone
will minimize both thermal and fuel NO formation. Further NOx x
reduction is achieved with increasing quench airflow rates, which
serve to reduce the equivalence ratio in the secondary (lean)
combustion stage.
5.2.3.4 Achievable NO Emissions Levels Usingx
Rich/Quench/Lean Combustion. The RQL staged combustion has been
demonstrated in rig tests to be effective in reducing both
thermal NO and fuel NO . As shown in Figure 5-25, NO emissionsx x x
are reduced by 40 to 50 percent in a test rig burning diesel
fuel.
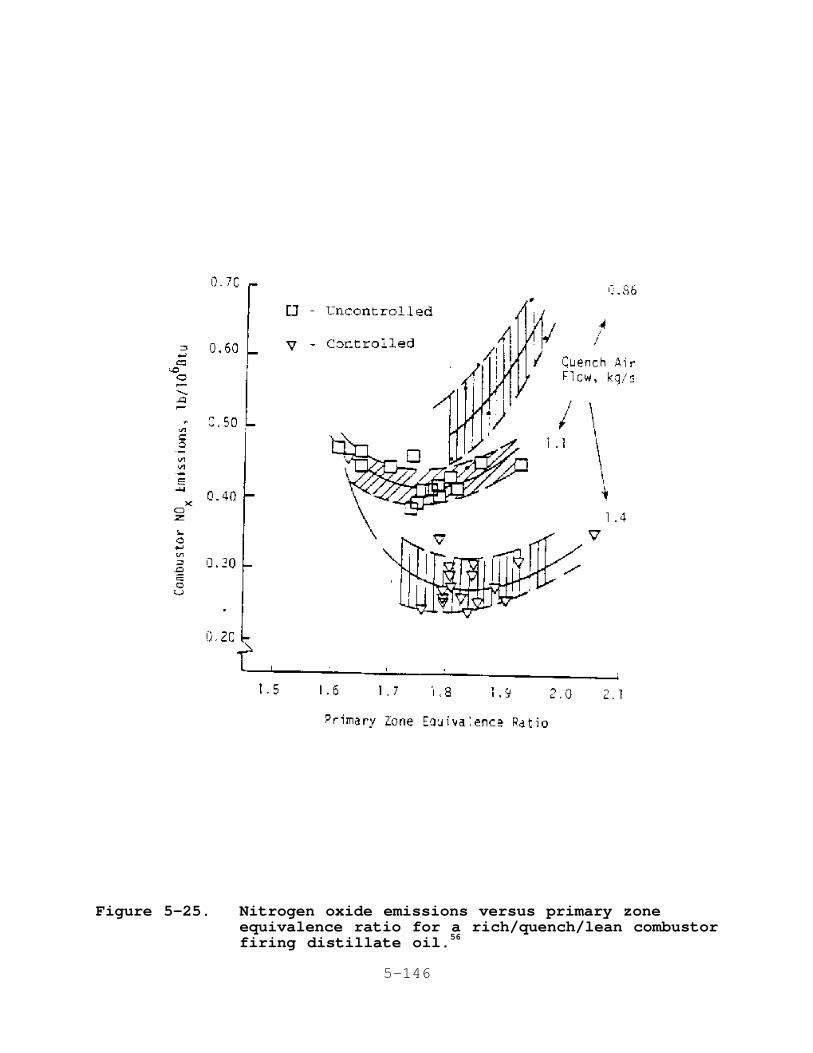
5-146
Figure 5-25. Nitrogen oxide emissions versus primary zoneequivalence ratio for a rich/quench/lean combustorfiring distillate oil.56

5-147
At an equivalence ratio of 1.8, the NO emissions can bex
reduced from 0.50 to 0.27 lb/MMBtu by increasing the quench
airflow from 0.86 to 1.4 kg/sec. Data were not available to
convert the NO emissions figures to ppmv. The effectiveness ofx
rich/lean staged combustion in reducing fuel NO when firingx
high-FBN fuels is shown in Figure 5-26.
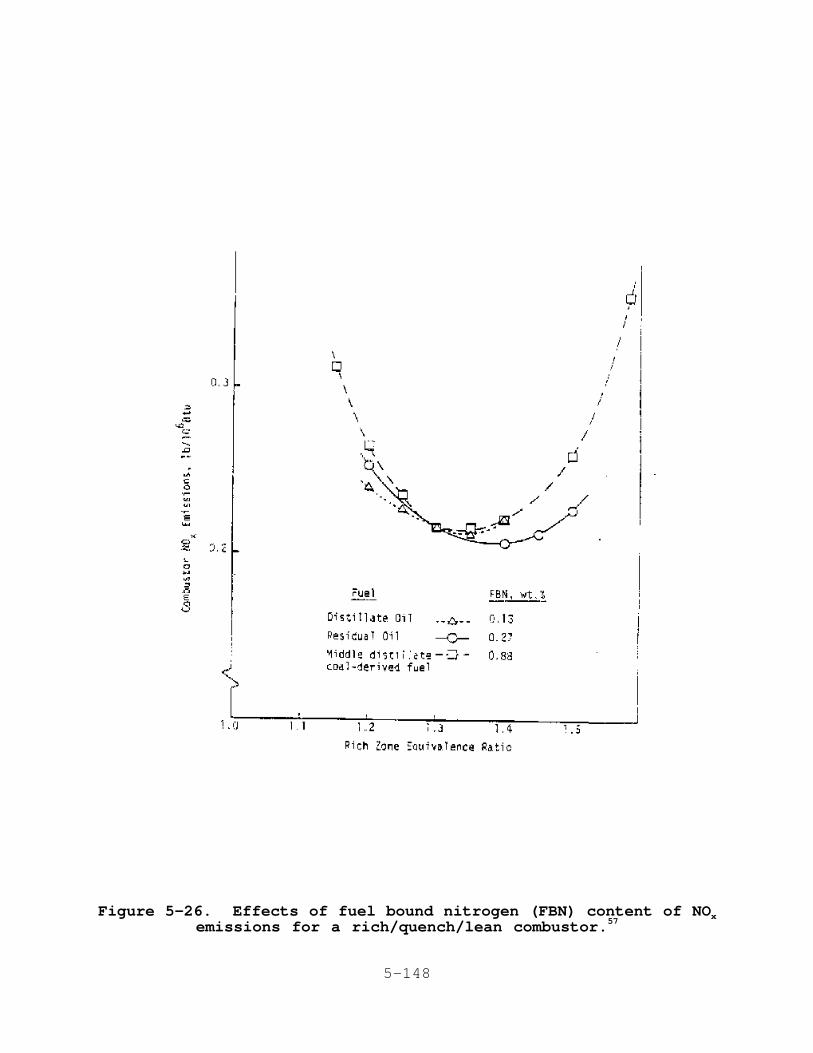
5-148
Figure 5-26. Effects of fuel bound nitrogen (FBN) content of NOxemissions for a rich/quench/lean combustor.57
5-149
Increasing the FBN content from 0.13 to 0.88 percent has little
impact on the total NO formation at an operating equivalencex
ratio of 1.3 to 1.4. Tests on other rich/lean combustors
indicate fuel nitrogen conversions to NO of about 7 tox
20 percent. These fuel nitrogen conversions represent a fuel58,59
NO emission reduction of approximately 50 to 80 percent. x
One manufacturer has tested an RQL combustor design in a
4 MW (5,360 hp) gas turbine fueled with a finely ground coal and
water mixture. The coal partially combusts in a fuel-rich zone
at temperatures of 1650EC (3000EF), with low O levels and an2
extremely short residence time. The partially combusted products
are then rapidly quenched with water, cooling combustion
temperatures to inhibit thermal NO formation. Additionalx
combustion air is then introduced, and combustion is completed
under fuel-lean conditions. In tests at the manufacturer's
plant, cosponsored by the U. S. Department of Energy, a NOx
emission level of 25 ppmv at 15 percent O was achieved. This2
combustor design can also be used with natural gas and oil fuels.
Single-digit NO emission levels are reported for operation on x

5-150
5-151
natural gas fuel. This combustor design is not yet available for
production turbines. 60
5.3 SELECTIVE CATALYTIC REDUCTION
Selective catalytic reduction (SCR) is an add-on NO controlx
technique that is placed in the exhaust stream following the gas
turbine. Over 100 gas turbine installations use SCR in the
United States. An SCR process description, the applicability61
of SCR for gas turbines, the factors affecting SCR performance,
and the achievable NO reduction efficiencies are discussed inx
this section.
5.3.1 Process Description
The SCR process reduces NO emissions by injecting ammoniax
into the flue gas. The ammonia reacts with NO in the presencex
of a catalyst to form water and nitrogen. In the catalyst unit,
the ammonia reacts with NO primarily by the followingx
equations:62
NH + NO + 1/4 O 6 N + 3/2 H O; and3 2 2 2
NH + 1/2 NO + 1/4 O 6 3/2 N + 3/2 H O.3 2 2 2 2
The catalyst's active surface is usually either a noble
metal, base metal (titanium or vanadium) oxide, or a
zeolite-based material. Metal-based catalysts are usually
applied as a coating over a metal or ceramic substrate. Zeolite
catalysts are typically a homogenous material that forms both the
active surface and the substrate. The geometric configuration of
the catalyst body is designed for maximum surface area and
minimum obstruction of the flue gas flow path to maximize
conversion efficiency and minimize back-pressure on the gas
turbine. The most common catalyst body configuration is a
monolith, "honeycomb" design, as shown in Figure 5-27.

5-152
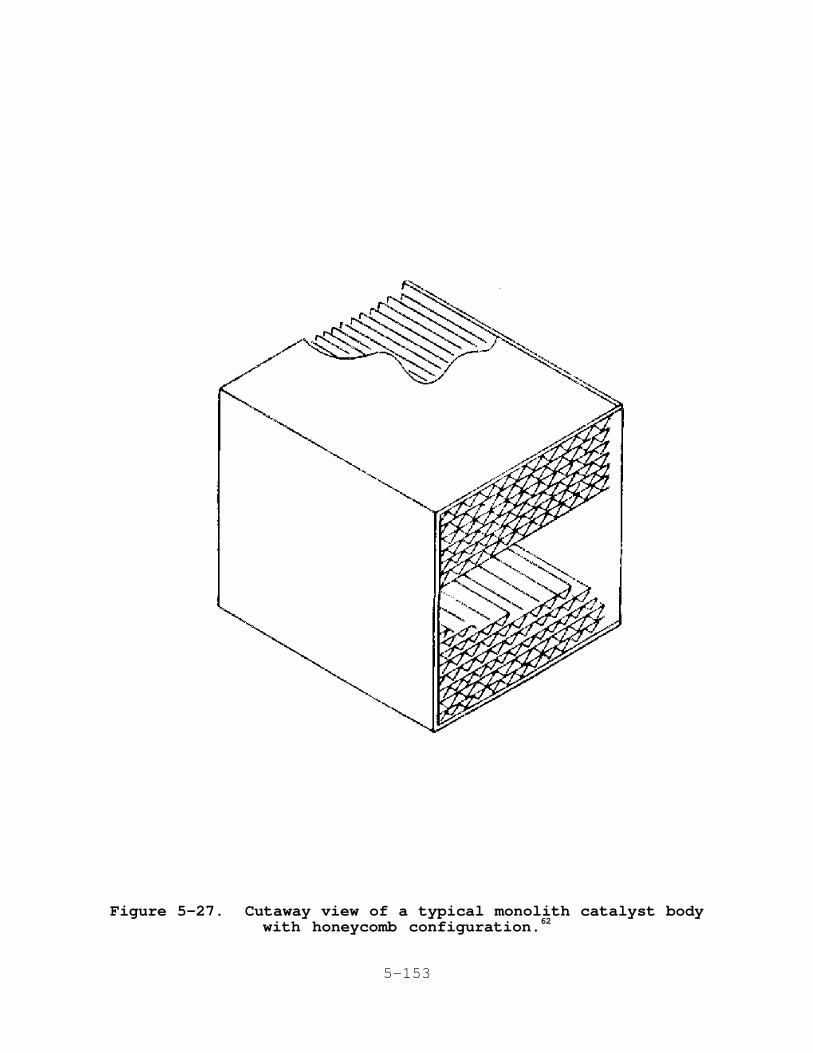
5-153
Figure 5-27. Cutaway view of a typical monolith catalyst bodywith honeycomb configuration.62

5-154
An ammonia injection grid is located upstream of the
catalyst body and is designed to disperse the ammonia uniformly
throughout the exhaust flow before it enters the catalyst unit.
In a typical ammonia injection system, anhydrous ammonia is drawn
from a storage tank and evaporated using a steam- or
electric-heated vaporizer. The vapor is mixed with a pressurized
carrier gas to provide both sufficient momentum through the
5-155
injection nozzles and effective mixing of the ammonia with the
flue gases. The carrier gas is usually compressed air or steam,
and the ammonia concentration in the carrier gas is about
5 percent.62
An alternative to using the anhydrous ammonia/carrier gas
system is to inject an a aqueous ammonia solution. This system
is currently not as common but removes the potential safety
hazards associated with transporting and storing anhydrous
ammonia and is often used in installations with close proximity
to populated areas.61,62
The NH /NO ratio can be varied to achieve the desired level3 x
of NO reduction. As indicated by the chemical reactionx
equations listed above, it takes one mole of NH to reduce one3
mole of NO, and two moles of NH to reduce one mole of NO . The3 2
NO composition in the flue gas from a gas turbine is overx
85 percent NO, and SCR systems generally operate with a molar
NH /NO ratio of approximately 1.0. Increasing this ratio will3 x63
further reduce NO emissions but will also result in increasedx
unreacted ammonia passing through the catalyst and into the
atmosphere. This unreacted ammonia is known as ammonia slip.
5.3.2 Applicability of SCR for Gas Turbines
Selective catalytic reduction applies to all gas turbine
types and is equally effective in reducing both thermal and fuel
NO emissions. There are, however, factors that may limit thex
applicability of SCR.
An important factor that affects the performance of SCR is
operating temperature. Gas turbines that operate in simple cycle
have exhaust gas temperatures ranging from approximately 450E to
540EC (850E to 1000EF). Base-metal catalysts have an operating
temperature window for clean fuel applications of approximately
260E to 400EC (400E to 800EF). For sulfur-bearing fuels that
produce greater than 1 ppm SO in the flue gas, the catalyst3
operating temperature range narrows to 315E to 400EC (600E to
800EF). The upper range of this temperature window can be
5-156
increased using a zeolite catalyst to a maximum of 590EC
(1100EF).64
Base metal catalysts are most commonly used in gas turbine
SCR applications, accounting for approximately 80 percent of all
U.S. installations, and operate in cogeneration or combined cycle
applications. The catalyst is installed within the HRSG, where
the heat recovery process reduces exhaust gas temperatures to the
proper operating range for the catalyst. The specific location
of the SCR within the HRSG is application-specific; Figure 5-28
shows two possible SCR locations.
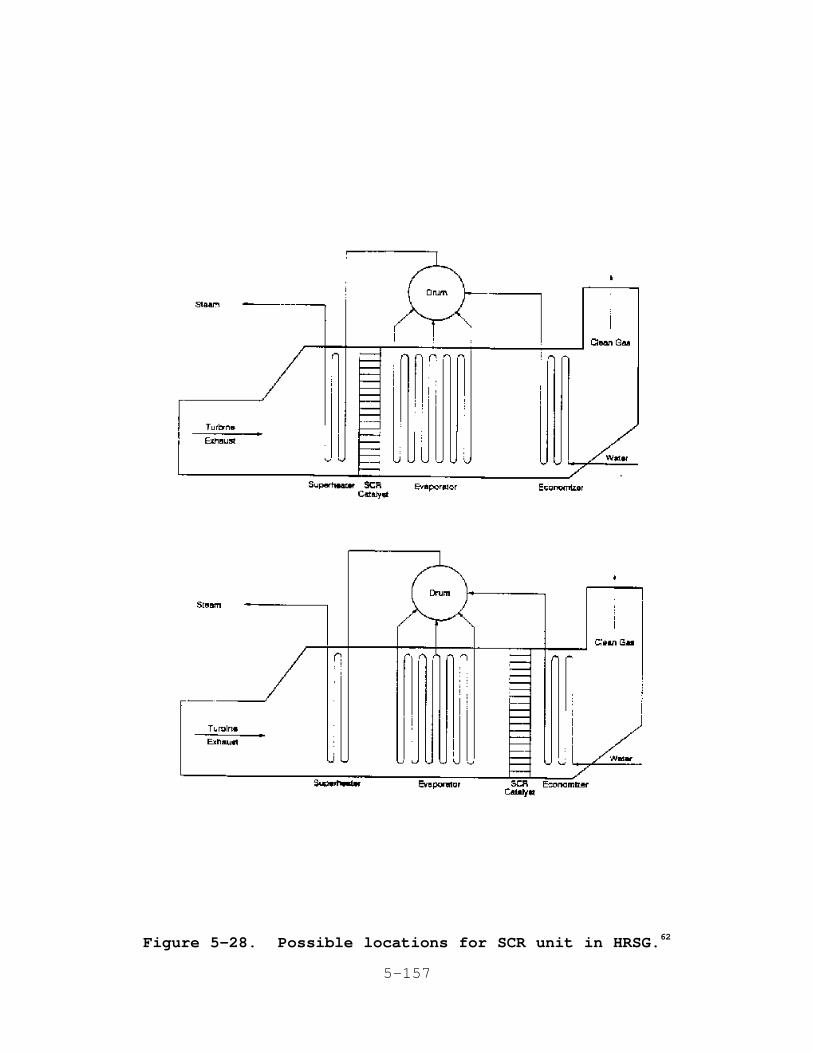
5-157
Figure 5-28. Possible locations for SCR unit in HRSG.62
5-158
In addition to the locations shown, the catalyst may also be
located within the evaporator section of the HRSG.
As noted above, zeolite catalysts have a maximum operating
temperature range of up to 590EC (1100EF), which is compatible
with simple cycle turbine exhaust temperatures. To date,
however, there is only one SCR installation operating with a
zeolite catalyst directly downstream of the turbine. This
catalyst, commissioned in December 1989, has an operating range
of 260E to 515EC (500E to 960EF) and operates approximately
90 percent of the time at temperatures above 500EC (930EF).65
Another consideration in determining the applicability of
SCR is complications arising from sulfur-bearing fuels. The
sulfur content in pipeline quality natural gas is negligible, but
distillate and residual oils as well as some low-Btu fuel gases
such as coal gas have sulfur contents that present problems when
used with SCR systems. Combustion of sulfur-bearing fuels
produces SO and SO emissions. A portion of the SO oxidizes to2 3 2
SO as it passes through the HRSG, and base metal catalysts have3
an SO -to-SO oxidation rate of up to five percent. In2 364
addition, oxidation catalysts, when used to reduce CO emissions,
will also oxidize SO to SO at rates of up to 50 percent. 2 366
Unreacted ammonia passing through the catalyst reacts with
SO to form ammonium bisulfate (NH HSO ) and ammonium sulfate3 4 4
[(NH ) SO ] in the low-temperature section of the HRSG. The rate4 2 4
of ammonium salt formation increases with increasing levels of
SO and NH , and the formation rate increases with decreasing 3 3
5-159
temperature. Below 200EC (400EF), ammonium salt formation occurs
with single-digit ppmv levels of SO and NH .3 366
The exhaust temperature exiting the HRSG is typically in the
range of 150E to 175EC (300E to 350EF), so ammonium salt
formation typically occurs in the low-temperature section of the
HRSG. Ammonium bisulfate is a sticky substance that over time66
corrodes the HRSG boiler tubes. Additionally, it deposits on
both the boiler and catalyst bed surfaces, leading to fouling and
plugging of these surfaces. These deposits result in increased
back pressure on the turbine and reduced heat transfer efficiency
in the HRSG. This requires that the HRSG be removed from service
periodically to water-wash the affected surfaces. Ammonium
sulfate is not corrosive, but like ammonium bisulfate, it
deposits on the HRSG surfaces and contributes to plugging and
fouling of the heat transfer system.33
Formation of ammonium salts can be avoided by limiting the
sulfur content of the fuel and/or limiting the ammonia slip. Low
SO -to-SO oxidizing catalysts are also available. Base metal2 3
catalysts are available with oxidation rates of less than
1 percent, but these low oxidation formulas also have lower NOx
reduction activity per unit volume and therefore require a
greater catalyst volume to achieve a given NO reduction level. x
Zeolite catalysts are reported to have intrinsic SO -to-SO2 3
oxidation rates of less than 1 percent. As stated above,64,66
pipeline-quality natural gas has negligible sulfur content, but
some sources of natural gas contain H S, which may contribute to2
ammonium salt formation. For oil fuels, even the lowest-sulfur
distillate oil or liquid aviation fuel contains sulfur levels
that can produce ammonium salts. According to catalyst vendors,
SCR systems can be designed for 90 percent NO reduction andx
10 ppm or lower NH slip for sulfur-bearing fuels up to 0.33
percent by weight. Continuous emission monitoring equipment64
has been developed for NH , and may be instrumental in regulating3
ammonia injection to minimize slip. 67
To date, there is limited operating experience using SCR
with oil-fired gas turbine installations. One combined cycle
5-160
installation using oil fuel, a United Airlines facility in
San Francisco installed in 1985, experienced fuel-related
catalyst problems and now uses only natural gas fuel. In the33
past, sulfur was found to poison the catalyst material.
Sulfur-resistant catalyst materials are now available, however,
and catalyst formulation improvements have proven effective in
resisting performance degradation with oil fuels in Europe and
Japan, where catalyst life in excess of 4 to 6 years has been
achieved, versus 8 to 10 years with natural gas fuel. A64
zeolite catalyst installed on a 5 MW (6710 hp) dual fuel
reciprocating engine in the northeastern United States has
operated for over 3 years and burned approximately
600,000 gallons of diesel fuel while maintaining a NO reductionx
efficiency of greater than 90 percent.3
In its guidance to member states, NESCAUM recommends that
SCR be considered for NO reduction in dual-fueled turbinex
applications. There are four combined cycle gas turbines
installations operating with SCR in the northeast United States
burning natural gas as the primary fuel with oil fuel as a
back-up. These installations, listed in Table 5-16, 3
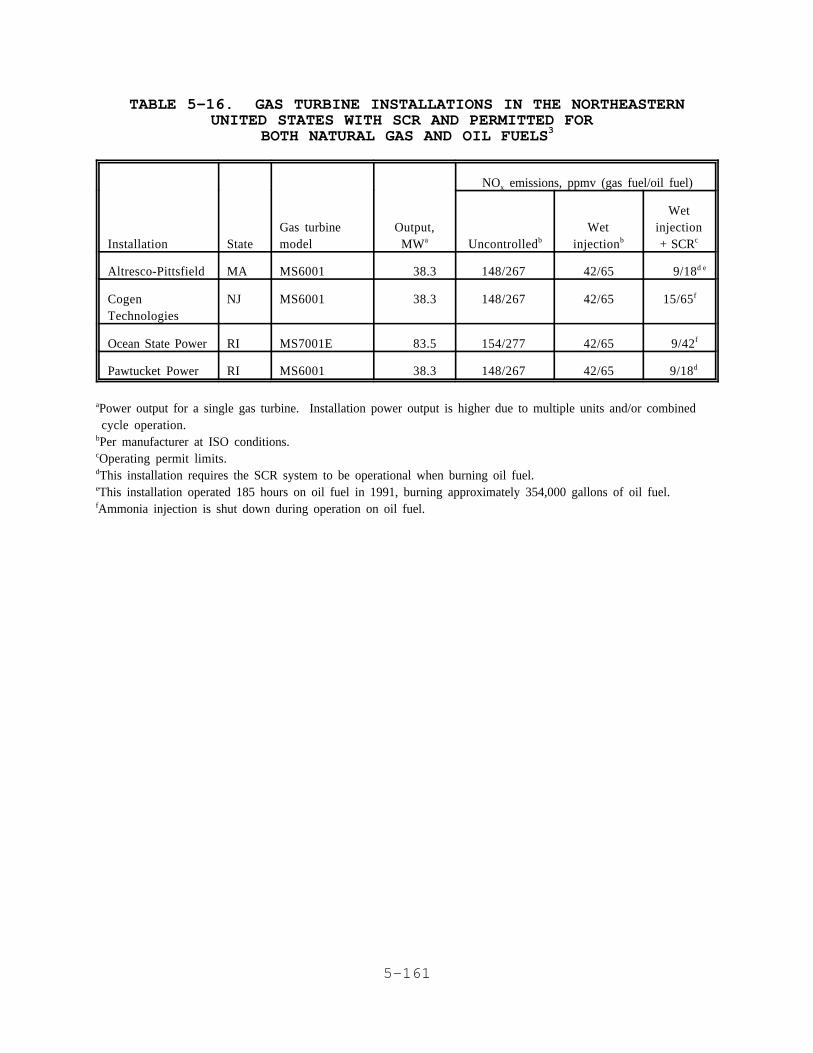
5-161
TABLE 5-16. GAS TURBINE INSTALLATIONS IN THE NORTHEASTERNUNITED STATES WITH SCR AND PERMITTED FOR
BOTH NATURAL GAS AND OIL FUELS3
NO emissions, ppmv (gas fuel/oil fuel)x
Installation StateGas turbinemodel
Output,MWa Uncontrolledb
Wetinjectionb
Wetinjection+ SCRc
Altresco-Pittsfield MA MS6001 38.3 148/267 42/65 9/18d e
CogenTechnologies
NJ MS6001 38.3 148/267 42/65 15/65 f
Ocean State Power RI MS7001E 83.5 154/277 42/65 9/42f
Pawtucket Power RI MS6001 38.3 148/267 42/65 9/18d
Power output for a single gas turbine. Installation power output is higher due to multiple units and/or combineda
cycle operation.Per manufacturer at ISO conditions.b
Operating permit limits.c
This installation requires the SCR system to be operational when burning oil fuel.d
This installation operated 185 hours on oil fuel in 1991, burning approximately 354,000 gallons of oil fuel.e
Ammonia injection is shut down during operation on oil fuel.f
5-162
began operating recently and have limited hours of operation on
oil fuel. As indicated in the table, two of these installations
shut down the ammonia injection when operating on oil fuel to
prevent potential operating problems arising from sulfur-bearing
fuels. Permits issued more recently in this region for other
dual-fuel installations, however, require that the SCR system be
operational on either fuel.3
A final consideration for SCR is catalyst masking or
poisoning agents. Natural gas is considered clean and free of
contaminants, but other fuels may contain agents that can degrade
catalyst performance. For refinery, field, or digester gas fuel
applications, it is important to have an analysis of the fuel and
properly design the catalyst for any identified contaminants.
Arsenic, iron, and silica may be present in field gases, along
with zinc and phosphorus. Catalyst life with these fuels depends
upon the content of the gas and is a function of the initial
5-163
design parameters. With oil fuels, in addition to the potential
for ammonium salt formation, it is important to be aware of heavy
metal content. Particulates in the flue gas can also mask the
catalyst. 64
Selective catalytic reduction may not be readily applicable
to gas turbines firing fuels that produce high ash loadings or
high levels of contaminants because these elements can lead to
fouling and poisoning of the catalyst bed. However, because gas
turbines are also subject to damage from these elements, fuels
with high levels of ash or contaminants typically are not used.
Coal, while not currently a common fuel for turbines, has a
number of potential catalyst deactivators. High dust
concentrations, alkali, earth metals, alkaline heavy metals,
calcium sulfate, and chlorides all can produce a masking or
blinding effect on the catalyst. High dust can also erode the
catalyst. Erosion commonly occurs only on the leading face of
the catalyst. Airflow deflectors and dummy layers of catalyst
can be used to straighten out the airflow and reduce erosion.
There is currently no commercial U.S. experience with coal. In
Japan, which burns low-sulfur coal with moderate dust levels,
catalyst life has been 5 years or more without replacement. In
Germany, with high dust loadings, the experience has also been
5 years or more.64
Masking agents deposit on the surface of the catalyst,
forming a barrier between the active catalyst surface and the
exhaust gas, inhibiting catalytic activity. Poisoning agents
chemically react with the catalyst and render the affected area
inactive. Masking agents can be removed by vacuuming or by using
soot blowers or superheated steam. Catalysts cleaned in this
manner can recover greater than 90 percent of the original
reduction activity. The effects of poisoning agents, however,
are permanent and the affected catalyst surface cannot be
regenerated.64
Retrofit applications for SCR may require the addition of a
heat exchanger for simple cycle installations, and replacement or
extensive modification of the existing HRSG in cogeneration and
5-164
combined cycle applications to accommodate the catalyst body.
For these reasons, retrofit applications for SCR could involve
high capital costs.
5.3.3 Factors Affecting SCR Performance
The NO reduction efficiency for an SCR system is influencedx
by catalyst material and condition, reactor temperature, space
velocity, and the NH /NO ratio. These design and operating3 x63
variables are discussed below.
Several catalyst materials are available, and each has an
optimum NO removal efficiency range corresponding to a specificx
temperature range. Proprietary formulations containing titanium
dioxide, vanadium pentoxide, platinum, or zeolite are available
to meet a wide spectrum of operating temperatures. The NOx
removal efficiencies for these catalysts are typically between 80
and 90 percent when new. The NO removal efficiency graduallyx
decreases over the operating life of the catalyst due to
deterioration from masking, poisoning, or sintering. The rate63
of catalyst performance degradation depends upon operating
conditions and is therefore site-specific.
The space velocity (volumetric flue gas flow divided by the
catalyst volume) is an indicator of gas residence time in the
catalyst unit. The lower the space velocity, the higher the
residence time, and the higher the potential for increased NOx
reduction. Because the gas flow is a constant determined by the
gas turbine, the space velocity depends upon the catalyst volume,
or total active surface area. The distance across the opening
between plates or cells in the catalyst, referred to as the
pitch, affects the overall size of the catalyst body. The
smaller the pitch, the greater the number of rows or cells that
can be placed in a given volume. Therefore, for a given catalyst
body size, the smaller the pitch, the larger the catalyst volume
and the lower the space velocity. For natural gas applications
the catalyst pitch is typically 2.5 millimeters (mm) (0.10 inch
[in.]), increasing to 5 to 7 mm (0.20 to 0.28 in.) for coal-fuel
applications. 64
5-165
As discussed in Section 5.3.1, the NH /NO ratio can be3 x
varied to achieve the desired level of NO reduction. Increasingx
this ratio increases the level of NO reduction but may alsox
result in higher ammonia slip levels.
5.3.4 Achievable NO Emission Reduction Efficiency Using SCRx
Most SCR systems operating in the United States have a space
velocity of about 30,000/hr, a NH /NO ratio of about 1.0, and3 x
ammonia slip levels of approximately 10 ppm. The resulting NOx
reduction efficiency is about 90 percent. Reduction efficiency41
is the level of NO removed as a percentage of the level of NOx x
entering the SCR unit. Only one gas turbine installation in the
United States was identified using only SCR to reduce NOx
emissions. This installation has two natural gas-fired 8.5 MW
gas turbines, each with its own HRSG in which is installed an SCR
system. A summary of emission testing at this site lists NOx
emissions at the inlet to the SCR catalyst at 130 ppmv.
Controlled NO emissions downstream of the catalyst were 18 ppmv,x
indicating a NO reduction efficiency of 86 percent. Maximumx
ammonia slip levels were listed at 35 ppmv.68
All other gas turbine installations identified as using SCR
in the United States use this control method in combination with
wet injection and/or low-NO combustors. The emission levelsx
that can be achieved by this combination of controls are found in
Section 5.4.
5.3.5 Disposal Considerations for SCR
The SCR catalyst material has a finite life, and disposal
can pose a problem. The guaranteed catalyst life offered by
catalyst suppliers ranges from 2 to 3 years. In Japan, where64
SCR systems have been in operation since 1980, experience shows
that many catalysts in operation with natural gas-fired boilers
have performed well for 7 years or longer. In any case, at63,64
some point the catalyst must be replaced, and those units
containing heavy metal oxides such as vanadium or titanium
potentially could be considered hazardous wastes. While the
amount of hazardous material in the catalyst is relatively small,
the volume of the catalyst body can be quite large, and disposal
5-166
of this waste could be costly. Some suppliers provide for the
removal and disposal of spent catalyst. Precious metal and
zeolite catalysts do not contain hazardous wastes.
5.4 CONTROLS USED IN COMBINATION WITH SCR
With but one exception, SCR units installed in the United
States are used in combination with wet controls or combustion
controls described in Sections 5.1 and 5.2. Wet controls yield
NO emission levels of 25 to 42 ppmv for natural gas and 42 tox
110 ppmv for distillate oil, based on the data provided by gas
turbine manufacturers and shown in Figures 5-10 and 5-11. A
carefully designed SCR system can achieve NO reductionx
efficiencies as high as 90 percent, with ammonia slip levels of
10 ppmv or less for natural gas and low-sulfur (<0.3 percent by
weight) fuel applications. 64
As discussed for wet injection in Sections 5.1.4 and
5.2.2.4, controlled NO emission levels for natural gas rangex
from 25 to 42 ppmv for natural gas fuel and from 42 to 110 ppmv
for oil fuel. Applying a 90 percent reduction efficiency for
SCR, NO levels can be theoretically reduced to 2.5 to 4.2 andx
4.2 to 11.0 ppmv for natural gas and oil fuels, respectively.
For oil fuels and other sulfur-bearing fuels, a reduction
efficiency of 90 percent requires special design considerations
to address potential operational problems caused by the sulfur
content in the fuel. This subject is discussed in Section 5.3.2.
The final controlled NO emission level depends upon the NOx x
level exiting the turbine and the achievable SCR reduction
efficiency.
Test reports provided by SCAQMD include three gas turbine
combined cycle installations fired with natural gas that have
achieved NO emission levels of 3.4 to 7.2 ppmv, referenced tox
15 percent oxygen. The NO and CO emissions reported for thesex
tests are shown in Table 5-17
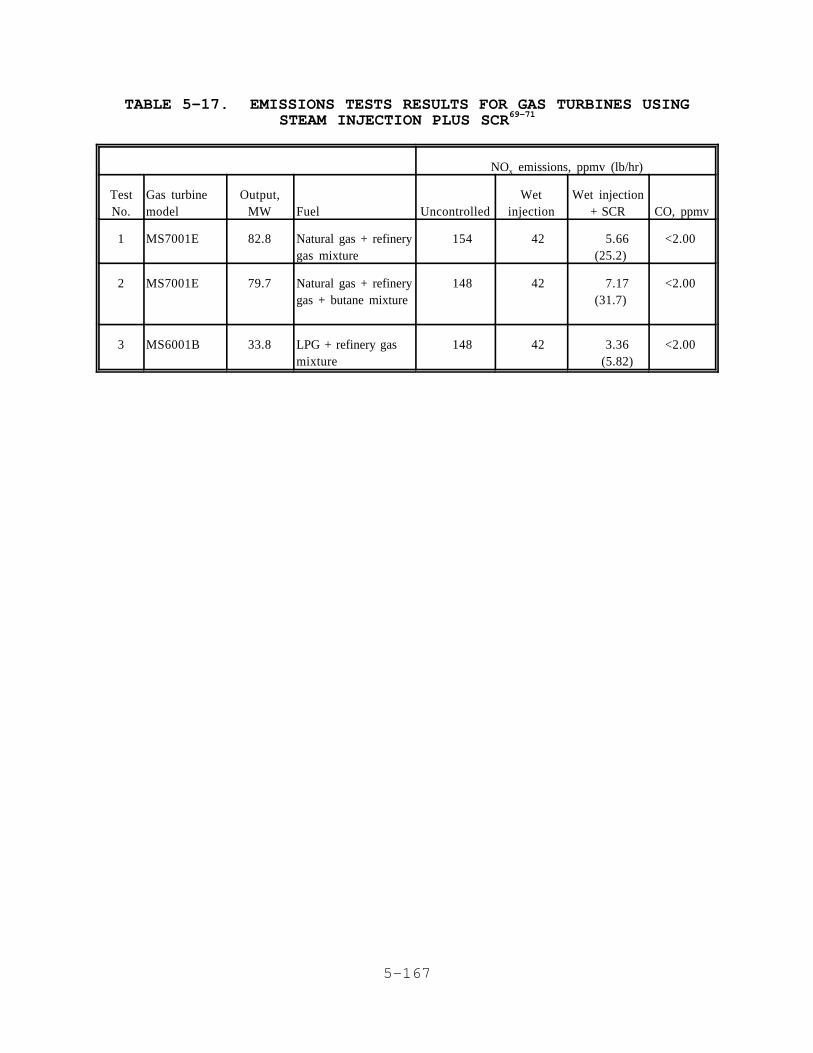
5-167
TABLE 5-17. EMISSIONS TESTS RESULTS FOR GAS TURBINES USINGSTEAM INJECTION PLUS SCR69-71
NO emissions, ppmv (lb/hr)x
TestNo.
Gas turbinemodel
Output,MW Fuel Uncontrolled
Wetinjection
Wet injection+ SCR CO, ppmv
1 MS7001E 82.8 Natural gas + refinerygas mixture
154 42 5.66(25.2)
<2.00
2 MS7001E 79.7 Natural gas + refinerygas + butane mixture
148 42 7.17(31.7)
<2.00
3 MS6001B 33.8 LPG + refinery gasmixture
148 42 3.36(5.82)
<2.00
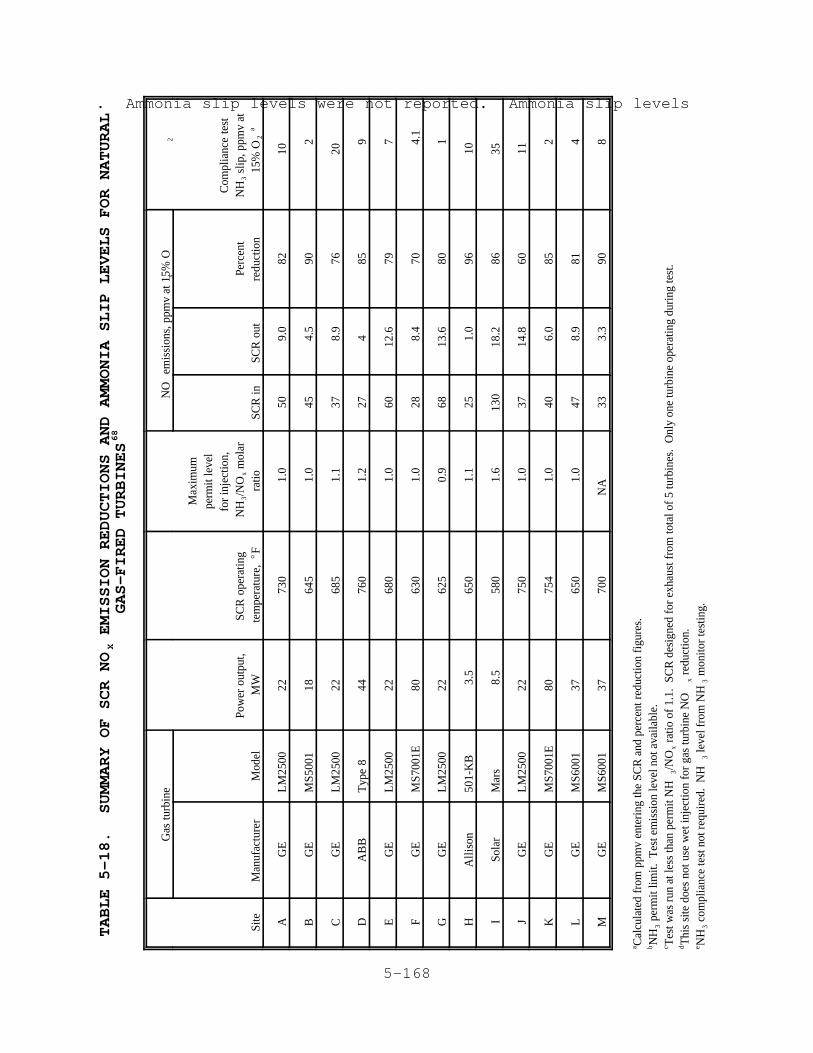
5-168
TABLE 5-18. SUMMARY OF SCR NO EMISSION REDUCTIONS AND AMMONIA SLIP LEVELS FOR NATURAL
XGAS-FIRED TURBINES
68
Gas
turb
ine
NO
em
issi
ons,
ppm
v at
15%
Ox
2
Site
Man
ufac
ture
rM
odel
Pow
er o
utpu
t,M
WSC
R o
pera
ting
tem
pera
ture
, EF
Max
imum
perm
it le
vel
for
inje
ctio
n, N
H/N
O m
olar
3x
ratio
SCR
inSC
R o
uta
Perc
ent
redu
ctio
n
Com
plia
nce
test
NH
slip
, ppm
v at
3
15%
O2
AG
EL
M25
0022
730
1.0
509.
082
10
BG
EM
S500
118
645
1.0
454.
590
2
CG
EL
M25
0022
685
1.1
378.
976
20
DA
BB
Typ
e 8
4476
01.
227
485
9
EG
EL
M25
0022
680
1.0
6012
.679
7
FG
EM
S700
1E80
630
1.0
288.
470
4.1
GG
EL
M25
0022
625
0.9
6813
.680
1
HA
llis
on50
1-K
B3.
565
01.
125
1.0
9610
ISo
lar
Mar
s8.
558
01.
613
018
.286
35
JG
EL
M25
0022
750
1.0
3714
.860
11
KG
EM
S700
1E80
754
1.0
406.
085
2
LG
EM
S600
137
650
1.0
478.
981
4
MG
EM
S600
137
700
NA
333.
390
8
Cal
cula
ted
from
ppm
v en
teri
ng th
e SC
R a
nd p
erce
nt r
educ
tion
figu
res.
a NH
per
mit
limit.
Tes
t em
issi
on le
vel n
ot a
vaila
ble.
b3
Tes
t was
run
at l
ess
than
per
mit
NH
/NO
rat
io o
f 1.
1. S
CR
des
igne
d fo
r ex
haus
t fro
m to
tal o
f 5
turb
ines
. O
nly
one
turb
ine
oper
atin
g du
ring
test
.c
3x
Thi
s si
te d
oes
not u
se w
et in
ject
ion
for
gas
turb
ine
NO
red
uctio
n.d
x
NH
com
plia
nce
test
not
req
uire
d. N
H le
vel f
rom
NH
mon
itor
test
ing.
e3
33
. Ammonia slip levels were not reported. Ammonia slip levels

5-169
were reported, however, in a summary of emission tests for 13 SCR
installations and are presented in Table 5-18. For these68
sites, operating on natural gas fuel, the NO reductionx
efficiency of the catalyst ranges

5-170
5-171
from 60 to 96 percent, with most reduction efficiencies between
80 and 90 percent. Ammonia slip levels range from 1 to 35 ppmv.
The site with the 35 ppmv ammonia slip level is unique in that it
is the only site identified in the United States that uses only
SCR rather than a combination of SCR and wet injection to reduce
NO emissions. With the exception of this site, all NH slipx 3
levels in Table 5-18 that are based on test data are less than
10 ppmv. Based on information received from catalyst vendors, it
is expected that an SCR system operating downstream of a gas
turbine without wet injection could be designed to limit ammonia
slip levels to 10 ppmv or less. No test data are available for64
SCR operation on gas turbines fired with distillate oil fuels.
5.5 EFFECT OF ADDING A DUCT BURNER IN HRSG APPLICATIONS
A duct burner is often added in cogeneration and combined
cycle applications to increase the steam capacity of the HRSG
(see Section 4.2.2). Duct burners in gas turbine exhaust streams
consist of pipes or small burners that are placed in the exhaust
gas stream to allow firing of additional fuel, usually natural
gas. Duct burners can raise gas turbine exhaust temperatures to
1000EC (2000EF), but a more common temperature is 760EC (1400EF).
The gas turbine exhaust is the source of oxygen for the duct
burner.

5-172
Figure 5-29 shows a typical natural gas-fired duct burner
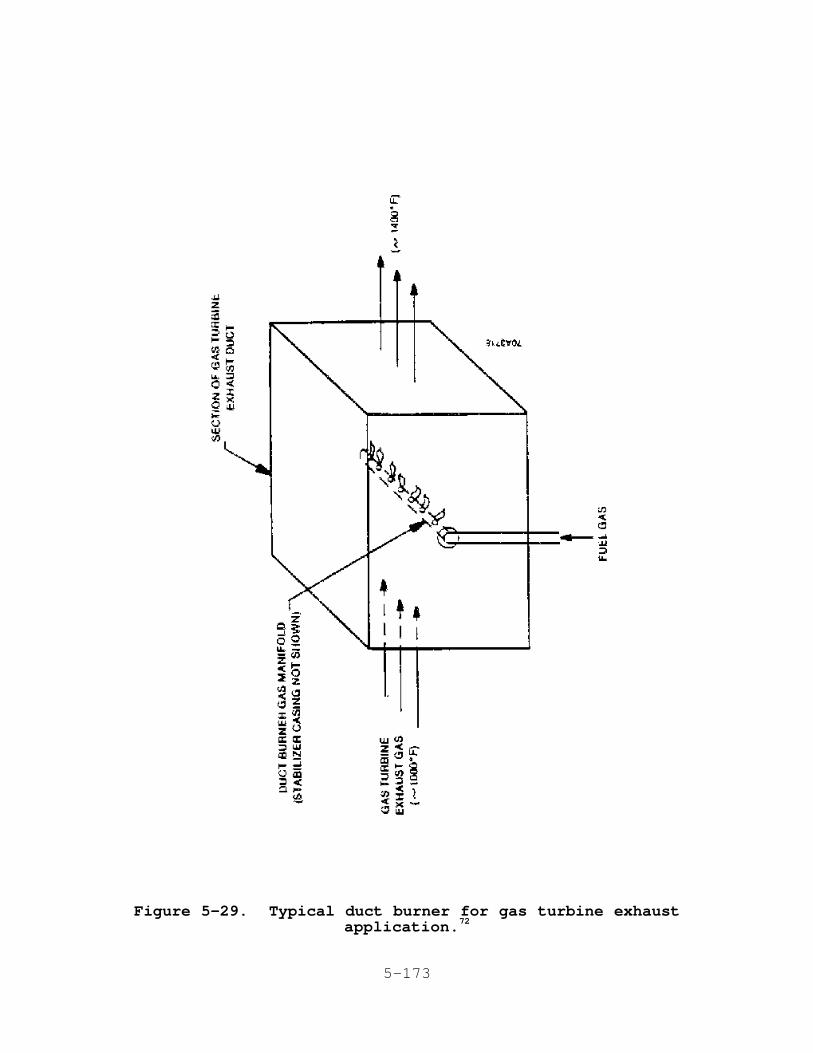
5-173
Figure 5-29. Typical duct burner for gas turbine exhaustapplication.72
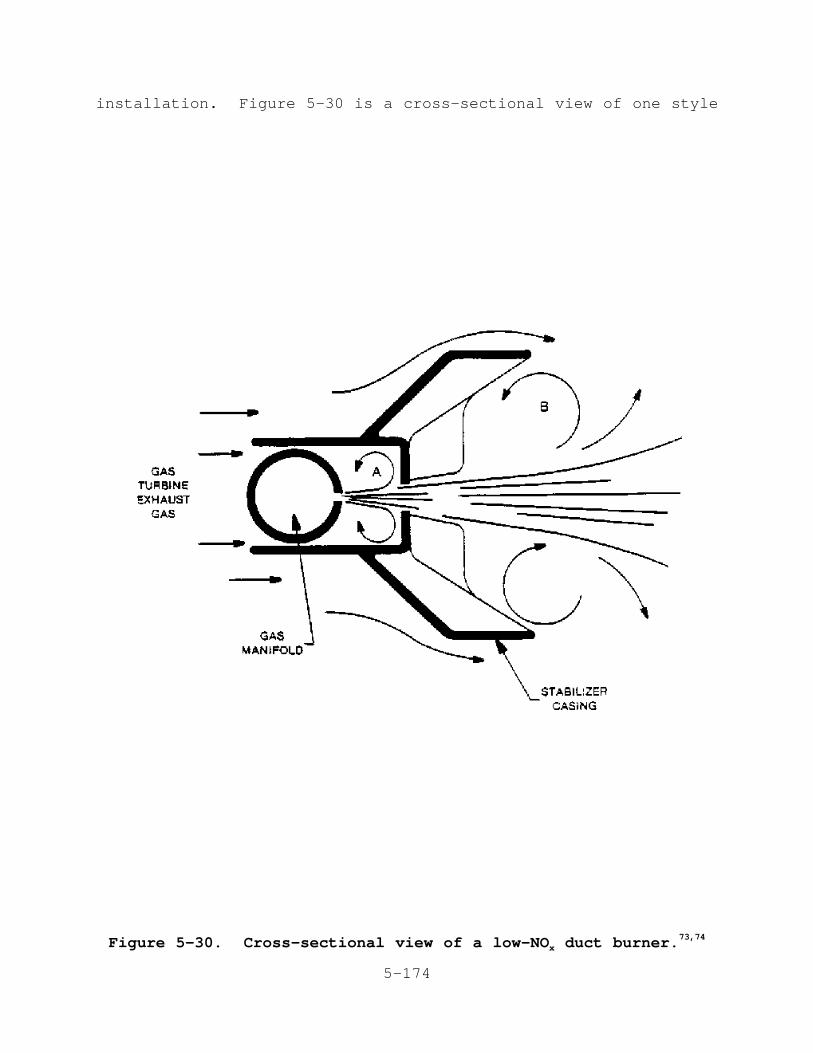
5-174
Figure 5-30. Cross-sectional view of a low-NO duct burner.x73,74
installation. Figure 5-30 is a cross-sectional view of one style
5-175
of duct burner that incorporates design features to reduce NO . x
In this low-NO design, natural gas exits the orifice in thex
manifold and mixes with the gas turbine exhaust entering through
a small slot between the casing and the gas manifold. This
mixture forms a jet diffusion flame that causes the recirculation
shown in Zone "A." Due to the limited amount of turbine exhaust
that can enter Zone A, combustion in this zone is fuel-rich. As
the burning gas jet exits into Zone "B," it mixes with combustion
products that are recirculated by the flow eddies behind the
wings of the stabilizer casing. The flame then expands into the
turbine exhaust gas stream, where combustion is completed.

5-176

5-177
For oil-fired burners, the design principles of the burner
are the same. However, the physical layout is slightly
different, as shown in
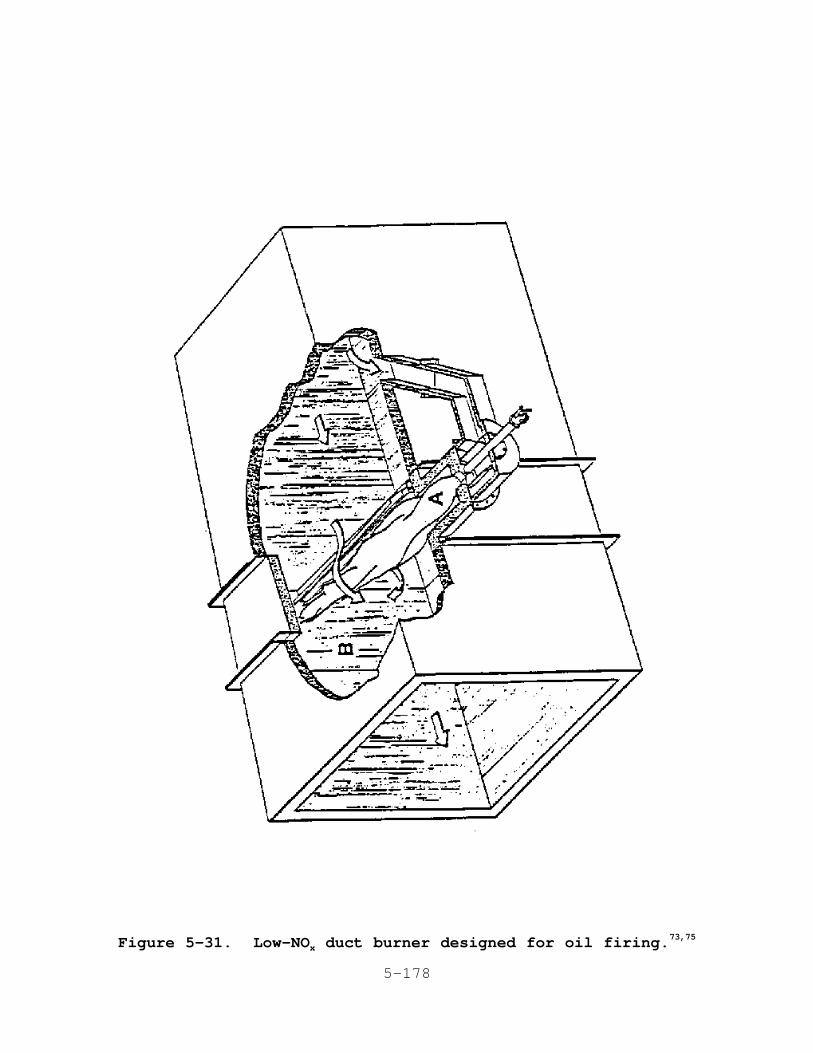
5-178
Figure 5-31. Low-NO duct burner designed for oil firing.x73,75
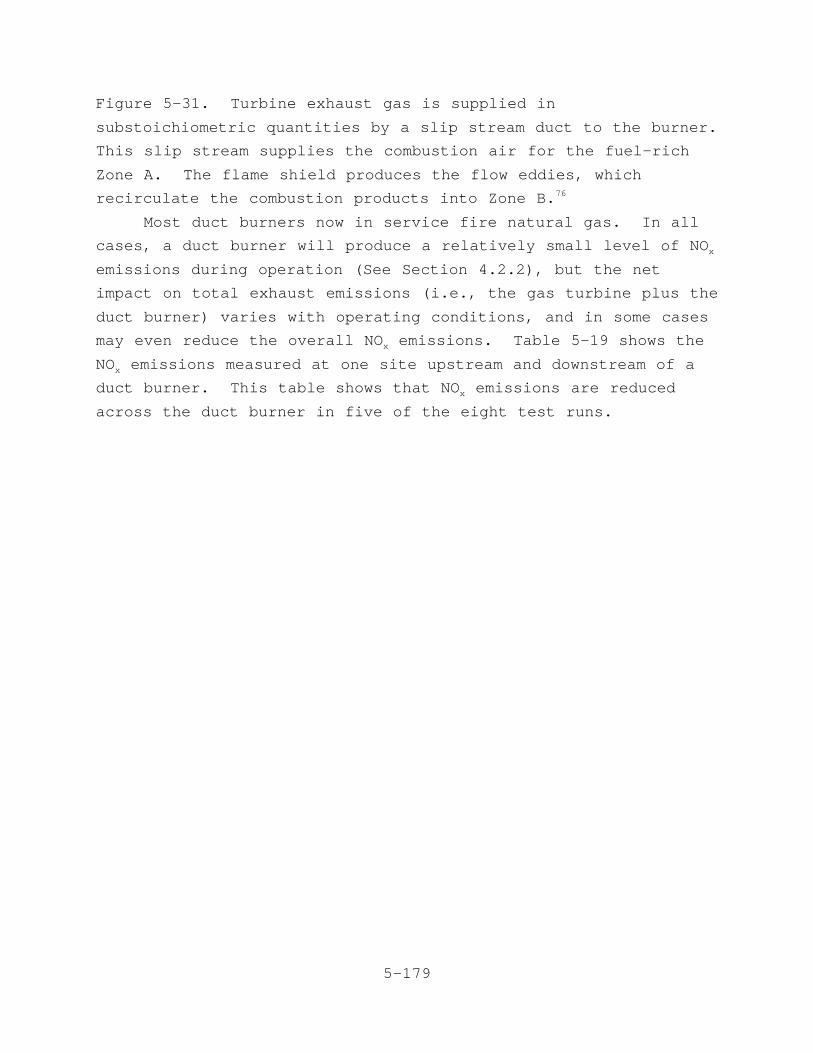
5-179
Figure 5-31. Turbine exhaust gas is supplied in
substoichiometric quantities by a slip stream duct to the burner.
This slip stream supplies the combustion air for the fuel-rich
Zone A. The flame shield produces the flow eddies, which
recirculate the combustion products into Zone B.76
Most duct burners now in service fire natural gas. In all
cases, a duct burner will produce a relatively small level of NOx
emissions during operation (See Section 4.2.2), but the net
impact on total exhaust emissions (i.e., the gas turbine plus the
duct burner) varies with operating conditions, and in some cases
may even reduce the overall NO emissions. Table 5-19 shows thex
NO emissions measured at one site upstream and downstream of ax
duct burner. This table shows that NO emissions are reducedx
across the duct burner in five of the eight test runs.
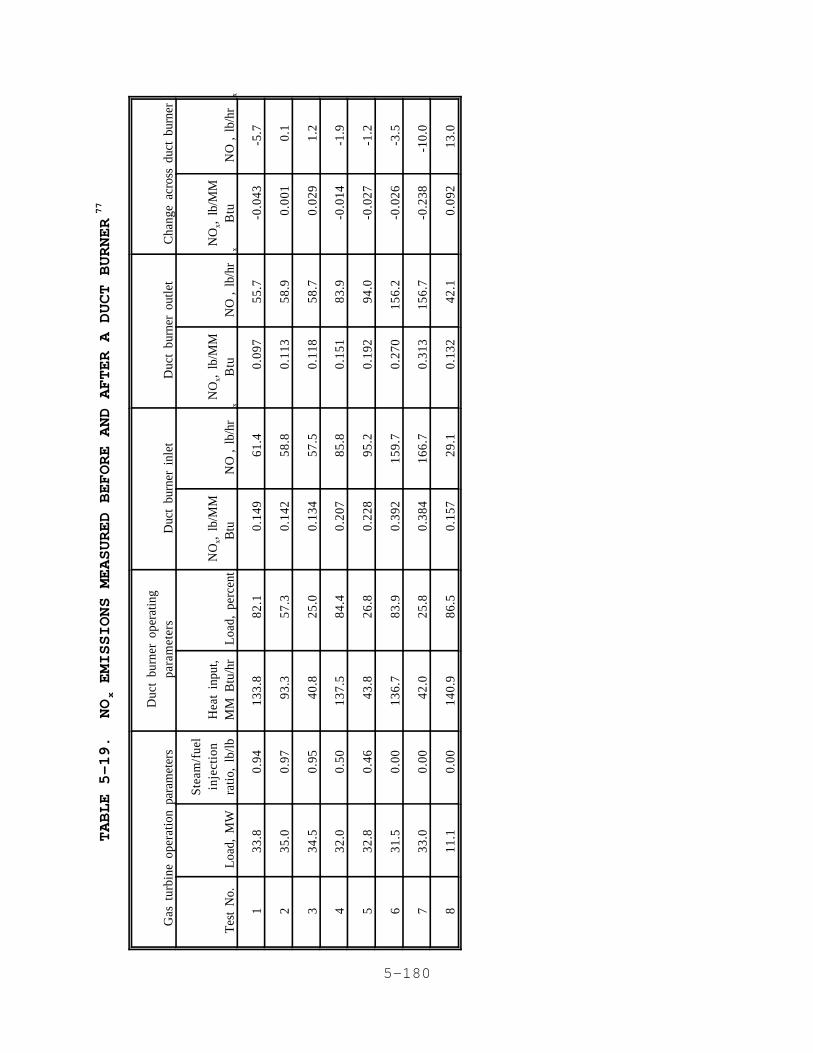
5-180
TABLE 5-19. NO EMISSIONS MEASURED BEFORE AND AFTER A DUCT BURNER
x77
Gas
tur
bine
ope
ratio
n pa
ram
eter
sD
uct
burn
er o
pera
ting
para
met
ers
Duc
t bu
rner
inl
etD
uct
burn
er o
utle
tC
hang
e ac
ross
duc
t bu
rner
Tes
t N
o.L
oad,
MW
Ste
am/f
uel
inje
ctio
nra
tio,
lb/
lbH
eat
inpu
t,M
M B
tu/h
rL
oad,
per
cent
NO
, lb
/MM
x Btu
N
O,
lb/h
rx
NO
, lb
/MM
x
Btu
NO
, lb
/hr
x
NO
, lb
/MM
x
Btu
NO
, lb
/hr
x
133
.80.
9413
3.8
82.1
0.14
961
.40.
097
55.7
-0.0
43-5
.7
235
.00.
9793
.357
.30.
142
58.8
0.11
358
.90.
001
0.1
334
.50.
9540
.825
.00.
134
57.5
0.11
858
.70.
029
1.2
432
.00.
5013
7.5
84.4
0.20
785
.80.
151
83.9
-0.0
14-1
.9
532
.80.
4643
.826
.80.
228
95.2
0.19
294
.0-0
.027
-1.2
631
.50.
0013
6.7
83.9
0.39
215
9.7
0.27
015
6.2
-0.0
26-3
.5
733
.00.
0042
.025
.80.
384
166.
70.
313
156.
7-0
.238
-10.
0
811
.10.
0014
0.9
86.5
0.15
729
.10.
132
42.1
0.09
213
.0
5-181
The reason for this net NO reduction is not known, but itx
is believed to be a result of the reburning process in which the
intermediate combustion products from the duct burner interact
with the NO already present in the gas turbine exhaust. Thex
manufacturer of the burner whose emission test results are shown
in Table 5-19 states that the following conditions are necessary
for reburning to occur:
1. The burner flame must produce a high temperature in a
fuel-rich zone;
2. A portion of the turbine exhaust containing NO must bex
introduced into the localized fuel-rich zone with a residence
time sufficient for the reburning process to convert the turbine
NO to N and O ; andx 2 2
3. The burner fuel should contain no FBN.78
In general, sites using a high degree of supplementary
firing have the highest potential for a significant amount of
reburning. In practice, only a limited number of sites achieve
these reburning conditions due to specific plant operating
requirements. 78

5-182
5-183
5.6 ALTERNATE FUELS
Because thermal NO production is an exponential function ofx
flame temperature (see Section 4.1.1), it follows that using
fuels with flame temperatures lower than those of natural gas or
distillate oils results in lower thermal NO emissions. x
Coal-derived gas and methanol have demonstrated lower NOx
emissions than more conventional natural gas or oil fuels. For
applications using fuels with high FBN contents, switching to a
fuel with a lower FBN content will reduce thermal NO formationx
and thereby lower total NO emissions.x
5.6.1 Coal-Derived Gas
Combustor rig tests have demonstrated that burning
coal-derived gas (coal gas) that has been treated to remove FBN
produces approximately 30 percent of the NO emission levelsx
experienced when burning natural gas. This is because coal gas
has a low heat energy level of around 300 Btu or less, which
results in a flame temperature lower than that of natural gas. 79
The cost associated with producing coal gas suitable for
combustion in a gas turbine has made this alternative
economically unattractive, but recent advances in coal
gasification technology have renewed interest in this fuel.
A coal gas-fueled power plant is currently operating in the
United States at a Dow Chemical plant in Placquemine, Louisiana.
This facility operates with a subsidy from the Federal
Government, which compensates for the price difference between
coal gas and conventional fuels. Several commercial projects
have been recently announced using technology developed by
Texaco, Shell, Dow Chemical, and the U.S. Department of Energy.
Facilities have been permitted for construction in Massachusetts
and Delaware.80
A demonstration facility, known as Cool Water, operated
using coal gas for 5 years in Southern California in the early
1980's. The NO emissions were reported at 0.07 lb/MMBtu. Fuelx80
analysis data is not available to convert this NO emission levelx
to a ppmv figure. No other emissions data are available.

5-184
5.6.2 Methanol
Methanol has a flame temperature of 1925EC (3500EF) versus
2015EC (3660EF) for natural gas and greater than 2100EC (3800EF)
for distillate oils. As a result, the NO emission levels whenx
burning methanol are lower than those for either natural gas or
distillate oils.
Table 5-20 presents NO emission data for a full-scalex
turbine firing methanol.
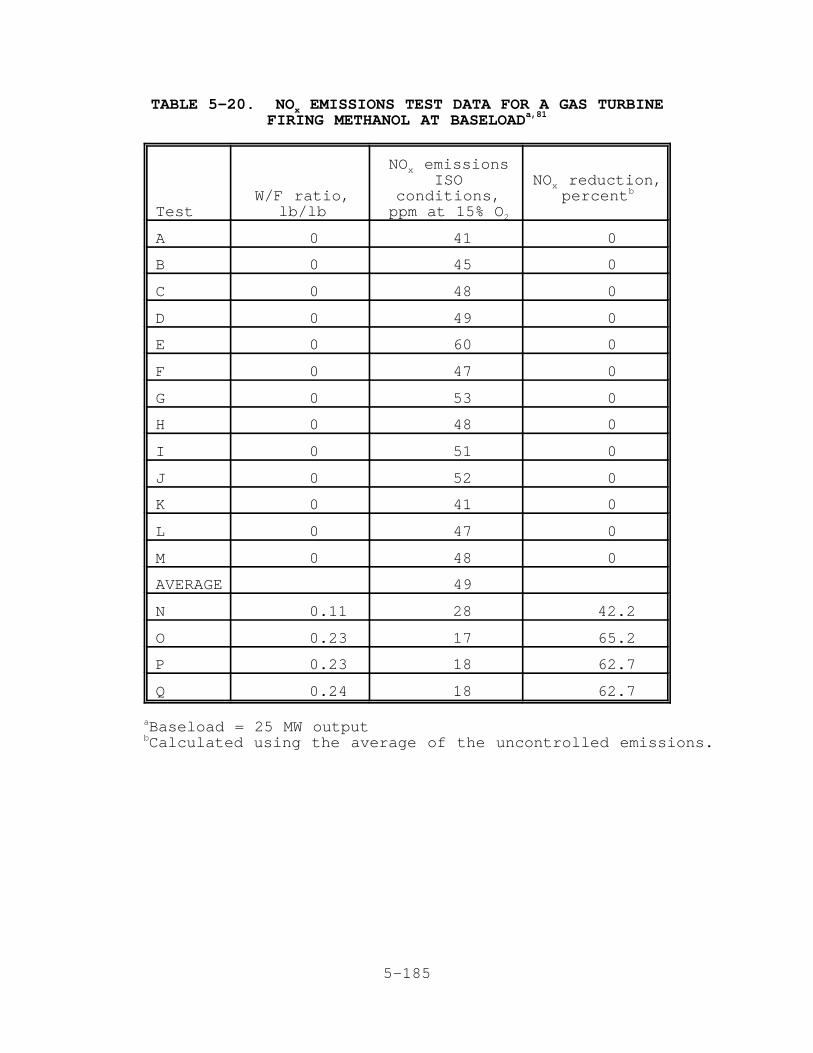
5-185
TABLE 5-20. NO EMISSIONS TEST DATA FOR A GAS TURBINExFIRING METHANOL AT BASELOADa,81
TestW/F ratio,
lb/lb
NO emissionsxISO
conditions,ppm at 15% O2
NO reduction,xpercentb
A 0 41 0
B 0 45 0
C 0 48 0
D 0 49 0
E 0 60 0
F 0 47 0
G 0 53 0
H 0 48 0
I 0 51 0
J 0 52 0
K 0 41 0
L 0 47 0
M 0 48 0
AVERAGE 49
N 0.11 28 42.2
O 0.23 17 65.2
P 0.23 18 62.7
Q 0.24 18 62.7
Baseload = 25 MW outputa
Calculated using the average of the uncontrolled emissions.b
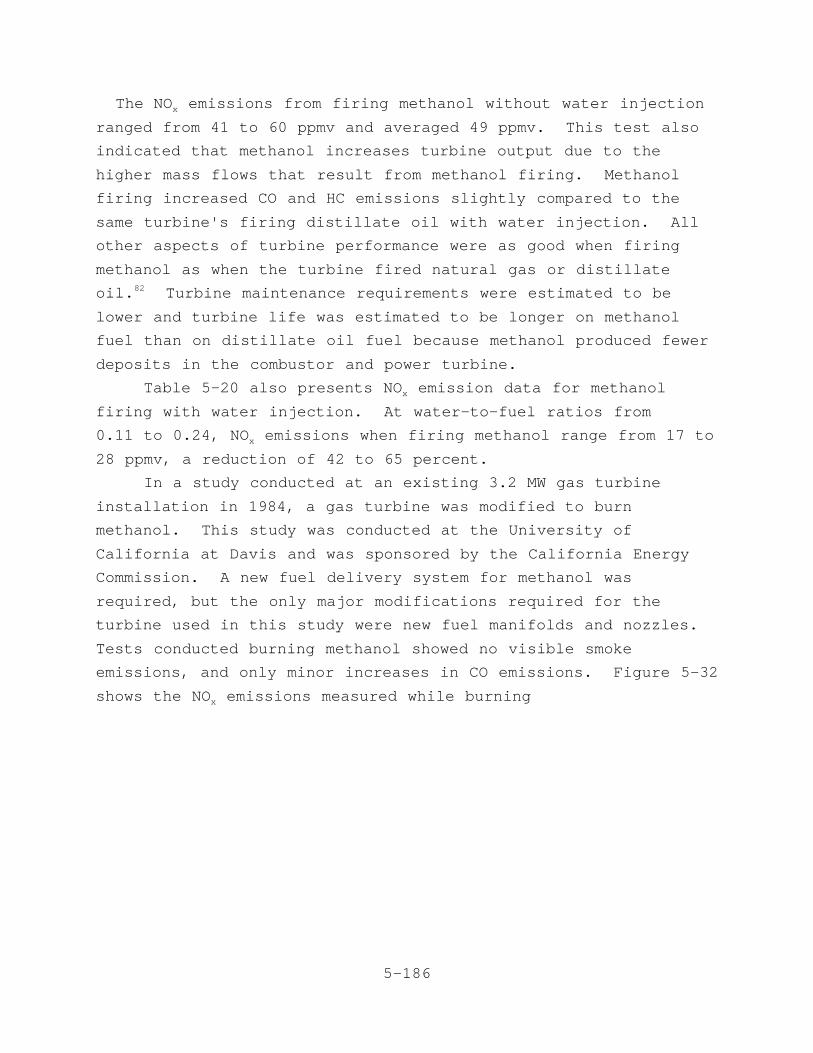
5-186
The NO emissions from firing methanol without water injectionx
ranged from 41 to 60 ppmv and averaged 49 ppmv. This test also
indicated that methanol increases turbine output due to the
higher mass flows that result from methanol firing. Methanol
firing increased CO and HC emissions slightly compared to the
same turbine's firing distillate oil with water injection. All
other aspects of turbine performance were as good when firing
methanol as when the turbine fired natural gas or distillate
oil. Turbine maintenance requirements were estimated to be82
lower and turbine life was estimated to be longer on methanol
fuel than on distillate oil fuel because methanol produced fewer
deposits in the combustor and power turbine.
Table 5-20 also presents NO emission data for methanolx
firing with water injection. At water-to-fuel ratios from
0.11 to 0.24, NO emissions when firing methanol range from 17 tox
28 ppmv, a reduction of 42 to 65 percent.
In a study conducted at an existing 3.2 MW gas turbine
installation in 1984, a gas turbine was modified to burn
methanol. This study was conducted at the University of
California at Davis and was sponsored by the California Energy
Commission. A new fuel delivery system for methanol was
required, but the only major modifications required for the
turbine used in this study were new fuel manifolds and nozzles.
Tests conducted burning methanol showed no visible smoke
emissions, and only minor increases in CO emissions. Figure 5-32
shows the NO emissions measured while burning x
5-187
Figure 5-32. Influence of load on NO , and CO emissions forx 2methanol and natural gas.83

5-188
methanol and natural gas. Reductions of up to 65 percent were
achieved, as NO emissions were 22 to 38 ppm when burningx
methanol versus

5-189
5-190
62 to 100 ppm for natural gas. In addition to the intrinsically
lower NO production, water can be readily mixed with methanolx
prior to delivery to the turbine to obtain the additional NOx
reduction levels achievable with wet injection. Gas turbine
performance characteristics, including startup, acceleration,
load changes, and full load power, were all deemed acceptable by
the turbine manufacturer.83
The current economics of using methanol as a primary fuel
are not attractive. There are no confirmed commercial
methanol-fueled gas turbine installations in the United States.
5.7 SELECTIVE NONCATALYTIC REDUCTION
Selective noncatalytic reduction (SNCR) is an add-on
technology that reduces NO using ammonia or urea injectionx
similar to SCR but operates at a higher temperature. At this
higher operating temperature of 870E to 1200EC (1600E to 2200EF),
the following reaction occurs:84
NO + NH + O + H O + (H ) 6 N + H O.x 3 2 2 2 2 2
This reaction occurs without requiring a catalyst,
effectively reducing NO to nitrogen and water. The operatingx
temperature can be lowered from 870EC (1600EF) to 700EC (1300EF)
by injecting hydrogen (H ) with the ammonia, as is shown in the2
above equation.
Above the upper temperature limit, the following reaction
occurs:84
NH + O 6 NO + H O.3 2 x 2
Levels of NO emissions increase when injecting ammonia orx
urea into the flue gas at temperatures above the upper
temperature limits of 1200EC (2200EF).
Since SNCR does not require a catalyst, this process is more
attractive than SCR from an economic standpoint. The operating
temperature window, however, is not compatible with gas turbine
exhaust temperatures, which do not exceed 600EC (1100EF).
Additionally, the residence time required for the reaction is
approximately 100 milliseconds, which is relatively slow for gas
turbine operating flow velocities.85
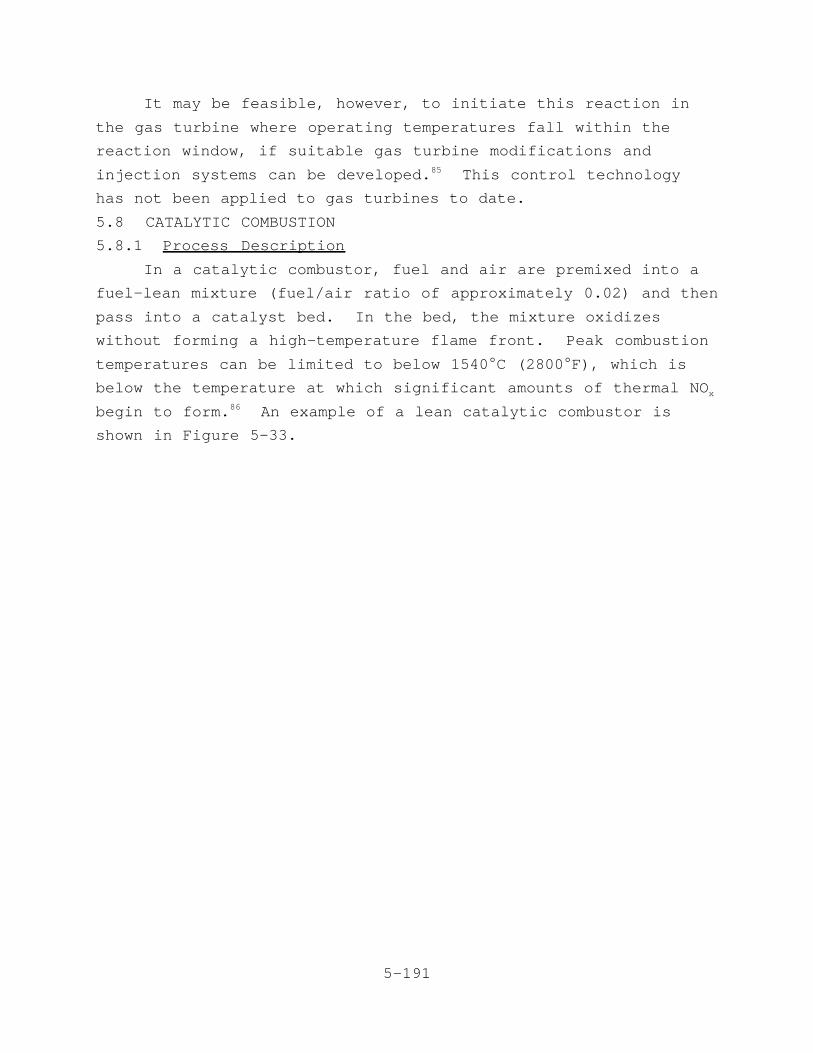
5-191
It may be feasible, however, to initiate this reaction in
the gas turbine where operating temperatures fall within the
reaction window, if suitable gas turbine modifications and
injection systems can be developed. This control technology85
has not been applied to gas turbines to date.
5.8 CATALYTIC COMBUSTION
5.8.1 Process Description
In a catalytic combustor, fuel and air are premixed into a
fuel-lean mixture (fuel/air ratio of approximately 0.02) and then
pass into a catalyst bed. In the bed, the mixture oxidizes
without forming a high-temperature flame front. Peak combustion
temperatures can be limited to below 1540EC (2800EF), which is
below the temperature at which significant amounts of thermal NOx
begin to form. An example of a lean catalytic combustor is86
shown in Figure 5-33.
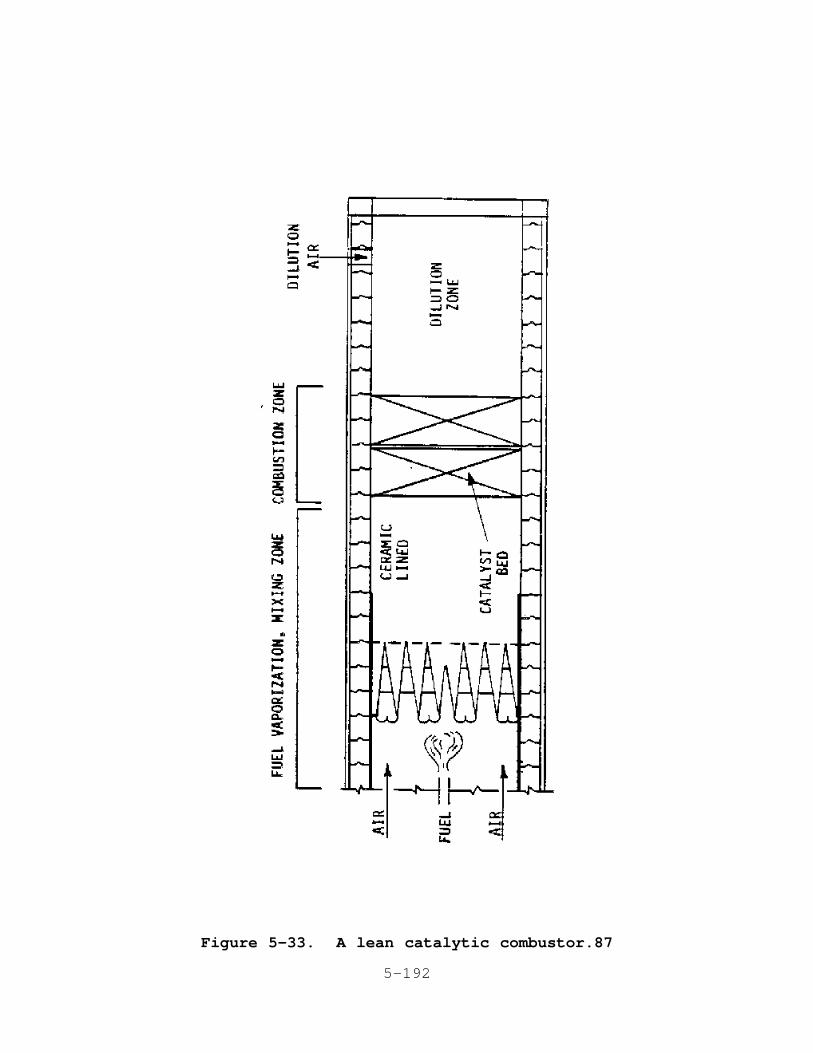
5-192
Figure 5-33. A lean catalytic combustor.87
5-193
Figure 5-34. A rich/lean catalytic combustor.89
5-194
Catalytic combustors can also be designed to operate in a
rich/lean configuration, as shown in Figure 5-34. In this
configuration, the air and fuel are premixed to form a fuel-rich
mixture, which passes through a first stage catalyst where
combustion begins. Secondary air is then added to produce a lean
mixture, and combustion is completed in a second stage catalyst
bed. 89
5.8.2 Applicability
Catalytic combustion techniques apply to all combustor types
and are effective on both distillate oil- and natural gas-fired
turbines. Because of the limited operating temperature range,
catalytic combustors may not be easily applied to gas turbines
subject to rapid load changes (such as utility peaking
turbines). Gas turbines that operate continuously at base load90
(such as industrial cogeneration applications) would not be as
adversely affected by any limits on load following capability. 91
5.8.3 Development Status
Presently, the development of catalytic combustors has been
limited to bench-scale tests of prototype combustors. The major
problem is the development of a catalyst that will have an
acceptable life in the high-temperature and -pressure environment

5-195
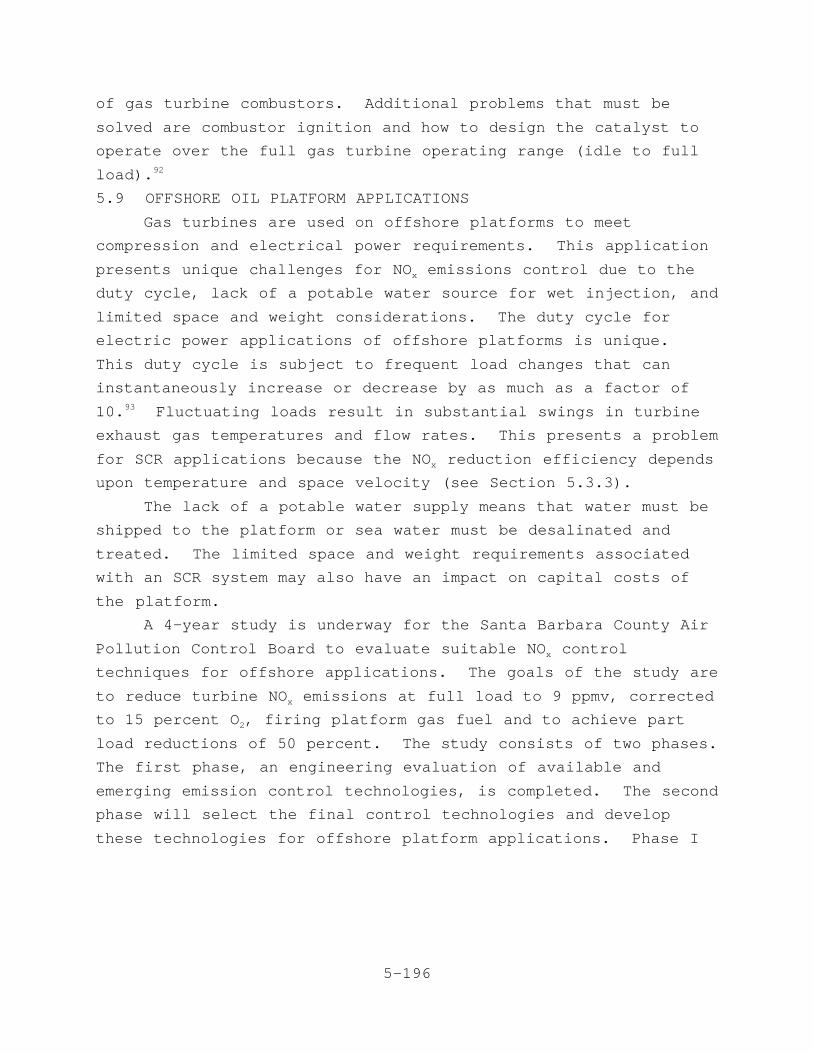
5-196
of gas turbine combustors. Additional problems that must be
solved are combustor ignition and how to design the catalyst to
operate over the full gas turbine operating range (idle to full
load). 92
5.9 OFFSHORE OIL PLATFORM APPLICATIONS
Gas turbines are used on offshore platforms to meet
compression and electrical power requirements. This application
presents unique challenges for NO emissions control due to thex
duty cycle, lack of a potable water source for wet injection, and
limited space and weight considerations. The duty cycle for
electric power applications of offshore platforms is unique.
This duty cycle is subject to frequent load changes that can
instantaneously increase or decrease by as much as a factor of
10. Fluctuating loads result in substantial swings in turbine93
exhaust gas temperatures and flow rates. This presents a problem
for SCR applications because the NO reduction efficiency dependsx
upon temperature and space velocity (see Section 5.3.3).
The lack of a potable water supply means that water must be
shipped to the platform or sea water must be desalinated and
treated. The limited space and weight requirements associated
with an SCR system may also have an impact on capital costs of
the platform.
A 4-year study is underway for the Santa Barbara County Air
Pollution Control Board to evaluate suitable NO controlx
techniques for offshore applications. The goals of the study are
to reduce turbine NO emissions at full load to 9 ppmv, correctedx
to 15 percent O , firing platform gas fuel and to achieve part2
load reductions of 50 percent. The study consists of two phases.
The first phase, an engineering evaluation of available and
emerging emission control technologies, is completed. The second
phase will select the final control technologies and develop
these technologies for offshore platform applications. Phase I

5-197
of this study concludes that the technologies with the highest
estimated probability for success in offshore applications are:
- Water injection plus SCR (80 percent);
- Methanol fuel plus SCR (70 percent);
- Lean premixed combustion plus SCR (65 percent); and
- Steam dilution of fuel prior to combustion plus SCR
(65 percent).
A key conclusion drawn from Phase I of this study is that
none of the above technologies or combination of technologies in
offshore platform applications currently has a high probability
of successfully achieving the NO emission reduction goals ofx
this study without substantial cost and impacts to platform and
turbine operations, added safety considerations, and other
environmental concerns. These issues will be further studied in
Phase II for the above control technologies.
5.10 REFERENCES FOR CHAPTER 5
1. National Archives and Records Administration. Code of
Federal Regulations. 40 CFR 60.332. Subpart GG. Washington, D.C. Office of the Federal Register. July1989.
2. South Coast Air Quality Management District. Emissions ofOxides of Nitrogen from Stationary Gas Turbines. Rule 1134. Los Angeles. August 4, 1989.
3. Letter and attachments from Conroy, D. B., U.S. EPA RegionI, to Neuffer, W. J., EPA/ISB. January 15, 1992. Review ofdraft gas turbine ACT document.
4. Northeast States For Coordinated Air Use Management. Recommendation On NO RACT for Industrial Boilers, InternalxCombustion Engines and Gas Turbines. September 18, 1992.
5. Letter and attachment from Leonard, G. L., General ElectricCompany, to Snyder, R. B., MRI. February 1991. Response togas turbine questionnaire.
6. Letters and attachments from Schorr, M., General ElectricCompany, to Snyder, R. B., MRI. March, April 1991. Response to gas turbine questionnaire.
7. Letter and attachments from Gurmani, A., Asea Brown Boveri,to Snyder, R. B., MRI. February 4, 1991. Response to gasturbine questionnaire.
5-198
8. Letter and attachment from Swingle, R., Solar TurbinesIncorporated, to Snyder, R. B., MRI. February 1991. Response to gas turbine questionnaire.
9. Letter and attachment from Kimsey, D. L., Allison GasTurbine Division of General Motors, to Snyder, R. B., MRI. February 1991. Response to gas turbine questionnaire.
10. Letter and attachment from Kraemer, H., Siemens PowerCorporation, to Snyder, R. B., January 1991. Response togas turbine questionnaire.
11. Letter and attachments from Antos, R. J., WestinghouseElectric Corporation, to Neuffer, W. J., EPA. September 11,1991. Review of Draft Gas Turbine ACT document.
12. Letter and attachment from Bogus, A. S., Garrett TurbineEngine Company, to Dalrymple, D., Radian Corporation. April 13, 1983. Stationary gas turbines. p. 7.
13. General Electric Company. General Electric Heavy-Duty GasTurbines. Schenectady, New York. 1983. Section 6.
14. Letter from Dvorak, United Technologies Corporation, PowerSystems Division, to Goodwin, D. R., EPA. April 7, 1978. Limits on water used for injection into the FT4 gas turbinecombustion chamber to control emissions.
15. Letter and attachments from Solt, J. C., Solar TurbinesIncorporated, to Noble, E., EPA. August 23, 1983. NSPSreview.
16. General Motors. General Motors Response to Four-Year ReviewQuestions on the NSPS for Stationary Gas Turbines. Submitted to U. S. Environmental Protection Agency. Research Triangle Park, NC. July 5, 1983. 144 FederalRegister 176. September 10, 1979. 52 pp.
17. Letter and attachments from Rosen, V., Siemens AG, toNeuffer, W. J., EPA/ISB. August 30, 1991. Review of DraftGas Turbine ACT document.
18. Letter and attachments from Sailer, E. D., General ElectricMarine and Industrial Engines, to Neuffer, W. J., EPA/ISB. August 29, 1991. Review of Draft Gas Turbine ACT document.
19. Letter and attachments from Mincy, J. E., Nalco Fuel Tech,to Neuffer, W.J., EPA/ISB. September 9, 1991. Review ofdraft gas turbine ACT document.
5-199
20. U. S. Environmental Protection Agency. BackgroundInformation Document, Review of 1979 Gas Turbine New SourcePerformance Standard. Research Triangle Park, NC. Preparedby Radian Corporation under Contract No. 68-02-3816. 1985. p. 4-36.
21. Letters and attachments from Leonard, G. L., GeneralElectric Company, to Snyder, R. B., MRI. May 24, 1991. Response to gas turbine questionnaire.
22. Telecon. Snyder, R., MRI, with Rayome, D., U.S. TurbineCorporation. May 23, 1991. Gas turbine NO control andxmaintenance impacts.
23. Letter and attachment from Gurmani, A., Asea Brown Boveri,to Snyder, R. B., MRI. May 30, 1991. Response to gasturbine questionnaire.
24. Letter and attachments from van der Linden, S., Asea BrownBoveri, to Neuffer, W. J., EPA/ISB. September 16, 1991. Review of draft gas turbine ACT document.
25. Wilkes, C., and R. C. Russell (General Electric Company). The Effects of Fuel Bound Nitrogen Concentration and WaterInjection on NO Emissions from a 75 MW Gas Turbine. xPresented at the Gas Turbine Conference & Products Show. London, England. April 9-13, 1978. ASME Paper No.78-GT-89. p. 1.
26. Reference 20, pp. 4-33, 4-34.
27. Reference 20, pp. 4-39 through 4-47.
28. Letter and attachments from Valentine, J. M., Energy andEnvironmental Partners, to Neuffer, W. J., EPA/ISB. April 26, 1991. Control of NO emissions using water-in-oilxemulsions.
29. Reference 20, pp. 4-48 thru 4-50.
30. Sailer, E. D. NO Abatement With Steam Injection onxAircraft Derivative Gas Turbines. General Electric Marineand Industrial Engines. Presented to the AmericanCogeneration Association. Scottsdale, AZ. March 13, 1989. 5 pp.
31. Becker, E., M. Kosanovich, and G. Cordonna. Catalyst Designfor Emission Control of Carbon Monoxide and HydrocarbonsFrom Gas Engines. Johnson Matthey. Wayne, PA. Forpresentation at the 81st Annual Air Pollution ControlAssociation meeting. Dallas. June 19-24, 1988. 16 pp.
32. Reference 20, p. 4-51.
5-200
33. Schorr, M. NO Control for Gas Turbines: Regulations andxTechnology. General Electric Company. Schenectady, NY. For presentation at the Council of Industrial Boiler OwnersNO Control IV Conference. February 11-12, 1991. 11 pp.x
34. Reference 20, pp. 4-2 thru 4-5.
35. Maghon, H., and A. Krutzer (Siemens Product Group KWU,Muelheim, Germany) and H. Termuehlen (Utility PowerCorporation, Bradenton, FL). The V84 Gas Turbine Designedfor Reliable Base Load and Peaking Duty. Presented at theAmerican Power Conference. Chicago. April 18-20, 1988. 20 pp.
36. Meeting. Barnett, K., Radian Corporation, to File. February 6, 1984. Discuss Rolls-Royce Emission TestingProcedures and Low-NO Combustors. p. 3.x
37. U. S. Environmental Protection Agency. Standards Supportand Environmental Impact Statement. Volume 1: ProposedStandards of Performance for Stationary Gas Turbines. Research Triangle Park, NC. Publication No.EPA 450/2-77-017a. September 1977. pp. 4-48 - 4-83.
38. Touchton, G. L., J. F. Savelli, and M. B. Hilt (GeneralElectric Company, U.S.A.). Emission Performance and ControlTechniques for Industrial Gas Turbines. Schenectady,New York. Gas Turbine Reference Library No. GER-2486H. 1982. p. 351.
39. Johnson, R. H. and C. Wilkes (General Electric Company). Emissions Performance of Utility and Industrial GasTurbines. Presented at the American Power Conference. April 23-25, 1979. Schenectady, New York. p. 5.
40. Reference 20, p. 4-5.
41. Angello, L. (Electric Power Research Institute, Palo Alto,CA) and P. Lowe (InTech, Inc., Potomac, MD). Gas TurbineNitrogen Oxide (NO ) Control. Current Technologies andxOperating Combustion Experiences. Presented at the 1989Joint Symposium on Stationary NO Control. San Francisco. xMarch 6-9, 1989. 18 pp.
42. Guthan, D. C. and C. Wilkes (General Electric Company, U.S.A.). Emission Control and Hardware Technology. Schenectady, New York. Gas Turbine Reference LibraryNo. GERP3125. 1981. p. 4.
43. Letter and attachments from Malloy, M. K., Rolls-RoyceLimited, to Jennings, M., Radian Corporation. May 12, 1983. 8 pp. Response to questionnaire concerning emission levelsof Rolls-Royce gas turbines and of emission controltechniques offered.
5-201
44. McKnight, D. (Rolls-Royce Limited). Development of aCompact Gas Turbine Combustor to Give Extended Life andAcceptable Exhaust Emissions. Journal of Engineering forPower. 101(3):101. July 1979.
45. Reference 36, Attachment 1.
46. Smith, K. O., and P. B. Roberts. Development of a Low NOxIndustrial Gas Turbine Combustor. Solar Turbines Inc. SanDiego, CA. Presented at the Canadian Gas AssociationSymposium on Industrial Application of Gas Turbines. Banff,Alberta. October 16-18, 1991. 18 pp.
47. Letter and attachments from Cull, C., General ElectricCompany, to Snyder, R. B., MRI. April 1991. Response torequest for published General Electric Company presentationmaterials.
48. Maghon, H., and L. Schellhorn (Siemens Product Group KWU,Muelheim, Germany); J. Becker and J. Kugler (DelmorvaPower & Light Company, Wilmington, DE); and H. Termuehlen(Utility Power Corporation, Bradenton, FL). Gas TurbineOperating Performance and Considerations for Combined CycleConversion at Hay Road Power Station. Presented at theAmerican Power Conference. Chicago. April 23-25, 1990. 12 pp.
49. Reference 20, p. 4-10.
50. Letter and attachments from Swingle, R., Solar TurbinesIncorporated, to Snyder, R., MRI. May 21, 1991. Low-NOxgas turbine information.
51. Smock, R. Utility Generation Report - Gas turbines reach9 ppm nitrogen oxide emissions dry. Power Engineering. 96(3):10. March 1992.
52. Davis, L. Dry Low NO Combustion Systems for GE Heavy-DutyxGas Turbines. General Electric Company. Schenectady, NY. Presented at 35th GE Turbine Sate-of-the-Art TechnologySeminar. August 1991. 10 pp.
53. Magnon, H., and P. Berenbrink (Siemens KWU) andH. Termuehlen and G. Gartner (Siemens Power Corporation). Progress in NO and CO Emission Reduction of Gas Turbines. xPresented at the Joint American Society of MechanicalEngineers/Institute of Electronic and Electrical EngineersPower Generation Conference. Boston. October 21-25, 1990. 7 pp.
54. Letter and attachments from King, D., General ElectricIndustrial Power Systems Sales, to Snyder, R. B., MRI. August 25, 1992. Performance and emission levels forindustrial gas turbines.
5-202
55. Cutrone, M., and M. Hilt (General Electric Company,
Schenectady, NY); A. Goyal and E. Ekstedt (General ElectricCompany, Evandale, OH); and J. Notardonato (NASA/LewisResearch Center, Cleveland, OH). Evaluation of AdvancedCombustors for Dry NO Suppression With Nitrogen BearingxFuels in Utility and Industrial Gas Turbines. Journal ofEngineering for Power. 104:429-438. April 1982.
56. Stambler, I. Strict NO Codes Call for Advanced ControlxTechnology. Gas Turbine World. 13(4):58. September-October 1983. p. 58.
57. Novick, A. S., and D. L. Troth (Detroit Diesel Allison) andJ. Notardonato (NASA Lewis Research Center.) MultifuelEvaluation of Rich/Quench/Lean Combustor. ASME Paper No.83-GT-140. p. 6.
58. Lew, H. G. (Westinghouse Electric Company) et al. Low NOxand Fuel Flexible Gas Turbine Combustors. Presented at theGas Turbine Conference & Products Show. Houston, TX. March 9-12, 1981. ASME Paper No. 81-GT-99. p. 10.
59. McVey, J. B., R. A. Sederquist, J. B. Kennedy, and L. A.Angello (United Technologies Research Center). Testing of aFull-Scale Staged Combustor Operating with a SyntheticLiquid Fuel. ASME Paper No. 83-GT-27. p. 8.
60. Allison-DOE Run Gas Turbine Directly on Pulverized Coal. GasTurbine World. 21(6):39. November-December 1991.
61. Minutes of meeting dated February 5, 1992, amongrepresentatives of the Institute of Clean Air Companies(formerly Industrial Gas Cleaning Institute), U.S.Environmental Protection Agency, and Midwest ResearchInstitute. December 10, 1991. Review of draft gas turbineACT document.
62. Radian Corporation. Evaluation of Oil-Fired Gas TurbineSelective Catalytic Reduction (SCR) NO Control. Prepared2for the Electric Power Research Institute, Palo Alto, CA,and the Gas Research Institute (Chicago). EPRI GS-7056. December 1990. pp. 4-7.
63. Benson, C., G. Chittick, and R. Wilson. (Arthur D. Little,Inc.). Selective Catalytic Reduction Technology forCogeneration Plants. Prepared for New England CogenerationAssociation. November 1988. 54 pp.
64. Letter and attachments from Smith, J. C., Institute of CleanAir Companies, to Neuffer, W. J., EPA/ISB. May 14, 1992. Response to EPA questionnaire regarding flue gas treatmentprocesses for emission reductions dated March 12, 1992.
5-203
65. Letter and attachments from Craig, R. J., Unocal Science andTechnology Division of Unocal Corporation, to Lee, L.,California Air Resources Board. July 24, 1991. Gas turbineSCR installation experience and information.
66. May, P. A., L. M. Campbell, and K. L. Johnson (RadianCorporation). Environmental and Economic Evaluation of GasTurbine SCR NO Control. Research Triangle Park, NC. xPresented at the 1991 Joint EPRI/EPA Symposium forStationary Combustion NO Control. March 1991. Volume 2.x18 pp.
67. Durham, M. D., T. G. Ebner, M. R. Burkhardt, and F. J.Sagan. Development of An Ammonia Slip Monitor for ProcessControl of NH Based NO Control Technologies. ADA3 xTechnologies, Inc. Presented at the Continuous EmissionMonitoring Conference, Air and Waste Management Association. Chicago. November 12-15, 1989. 18 pp.
68. Field Survey of SCR Gas Turbine Operating Experience. Prepared for the Electric Power Research Institute. PaloAlto, CA. May, 1991.
69. Harris, B., and J. Steiner (Pope and Steiner EnvironmentalServices). Source Test Report. South Coast Air QualityManagement District. Los Angeles. PS-90-2107. April 11,1990.
70. Harris, B., and J. Steiner (Pope and Steiner EnvironmentalServices). Source Test Report. South Coast Air QualityManagement District. Los Angeles. PS-90-2108. April 12,1990.
71. Harris, B., and J. Steiner (Pope and Steiner EnvironmentalServices). Source Test Report. South Coast Air QualityManagement District. Los Angeles. PS-90-2148. May 1,1990.
72. Reference 20, pp. 3-20.
73. Letter and attachments from Brown, R., Coen Company, Inc.,to Dalrymple, D., Radian Corporation. August 16, 1983. Duct Burner Emissions in Turbine Exhaust Gas Streams.
74. Reference 20, p. 3-21.
75. Reference 20, p. 3-22.
76. Reference 20, pp. 3-19, 4-79, 4-80.
77. Podlensky, J., et al. (GCA Corporation). Emission TestReport, Crown Zellerbach, Antioch, CA. March 1984.
5-204
78. Backlund, J., and A. Spoormaker. Experience with NOxFormation/Reduction Caused by Supplementary Firing ofNatural Gas in Gas Turbine Exhaust Streams. The AmericanSociety of Mechanical Engineers. New York. 85-JPGC-G7-18. 1985. 5 pp.
79. Reference 36, pp. 3-93, 3-94.
80. Smock, R. Coal Gas-fired Combined Cycle Projects Multiply. Power Engineering. 135(2):32-33. February 1991.
81. Weir, A., Jr., W. H. von KleinSmid, and E. A. Danko(Southern California Edison Company). Test and Evaluationof Methanol in a Gas Turbine System. Prepared for ElectricPower Research Institute. Palo Alto California. Publication No. EPRI AP-1712. February 1981. pp. A-76 through A-78.
82. Reference 81, pp. 5-1, 5-2.
83. Shore, D., and G. Shiomoto (KVB, Incorporated, Irvine, CA)and G. Bemis (California Energy Commission, Sacramento, CA). Utilization of Methanol as a Fuel for a Gas TurbineCogeneration Plant. Prepared for Electric Power ResearchInstitute. Chicago. CS-4360, Volume II, EPA ContractNo. 68-02-3695. January 1986.
84. Fellows, W. D. Experience with the Exxon Thermal DeNOxProcess in Utility and Independent Power Production ExxonResearch and Engineering Company. Florham Park, NJ. August1990. 5 pp.
85. Bernstein, S., and P. Malte (Energy International, Inc.). Emissions Control for Gas Transmission Engines. Preparedfor the Gas Research Institute. Chicago. PresentationNo. PRES 8070. July 1989. 17 pp.
86. Krill, W. V., J. P. Kesselring, and E. K. Chu (AcurexCorporation). Catalytic Combustion for Gas TurbineApplications. Presented at the Gas Turbine Conference &Exhibit & Solar Energy Conference. San Diego, CA. March 12-15, 1979. ASME Paper No. 79-GT-188. p. 4.
87. Reference 58, p. 6.
88. Reference 86, p. 8.
89. Washam, R. M. (General Electric Company). Dry Low NOxCombustion System for Utility Gas Turbine. Presented at the1983 Joint Power Generation Conference. Indianapolis, IN. ASME Paper No. 83-JPGC-GT-13. p. 1.
90. Reference 86, p. 7.

5-205
91. Reference 20, p. 4-23.
92. Reference 37, p. 4-88
93. Little, A.D. Offshore Gas Turbine NO Control TechnologyxDevelopment Program. Phase I--Technology Evaluation. Prepared for Santa Barbara County Air Pollution ControlBoard. August 1989. 130 pp.
6-206
6.0 CONTROL COSTS
Capital and annual costs are presented in this chapter for
the nitrogen oxide (NO ) control techniques described inx
Chapter 5.0. These control techniques are water and steam
injection, low-NO combustion, and selective catalyticx
reduction (SCR) used in combination with these controls. Model
plants were developed to evaluate the control techniques for a
range of gas turbine sizes, fuel types, and annual operating
hours. The gas turbines chosen for these model plants range in
size from 1.1 to 160 megawatts (MW) (1,500 to 215,000 horsepower
[hp]) and include both aeroderivative and heavy-duty turbines.
Model plants were developed for both natural gas and distillate
oil fuels. For offshore oil production platforms, cost
information was available only for one turbine model.
The life of the control equipment depends upon many factors,
including application, operating environment, maintenance
practices, and materials of construction. For this study, a
15-year life was chosen.
Both new and retrofit costs are presented in this chapter.
For water and steam injection, these costs were assumed to be the
same because most of the water treatment system installation can
be completed while the plant is operating and because gas turbine
nozzle replacement and piping connections to the treated water
supply can be performed during a scheduled downtime for
maintenance. Estimated costs are provided for both new and
retrofit low-NO combustion applications. No SCR retrofitx
applications were identified, and costs for SCR retrofit
applications were not available. The cost to retrofit an
6-207
existing gas turbine installation with SCR would be considerably
higher than the costs shown for a new installation, especially
for combined cycle and cogeneration installations where the
heat-recovery steam generator (HRSG) would have to be modified or
replaced to accommodate the catalyst reactor.
This chapter is organized into five sections. Water and
steam injection costs are described in Section 6.1. Low-NOx
combustor costs are summarized in Section 6.2. Costs for SCR
used in combination with water or steam injection or low-NOx
combustion are described in Section 6.3. Water injection and SCR
costs for offshore gas turbines are presented in Section 6.4, and
references are listed in Section 6.5.
a. WATER AND STEAM INJECTION AND OIL-IN-WATER EMULSION
Ten gas turbines models were selected, and from these
turbines 24 model plants were developed using water or steam
injection or water-in-oil emulsion to control NO emissions. x
These 24 models, shown in Table 6-1
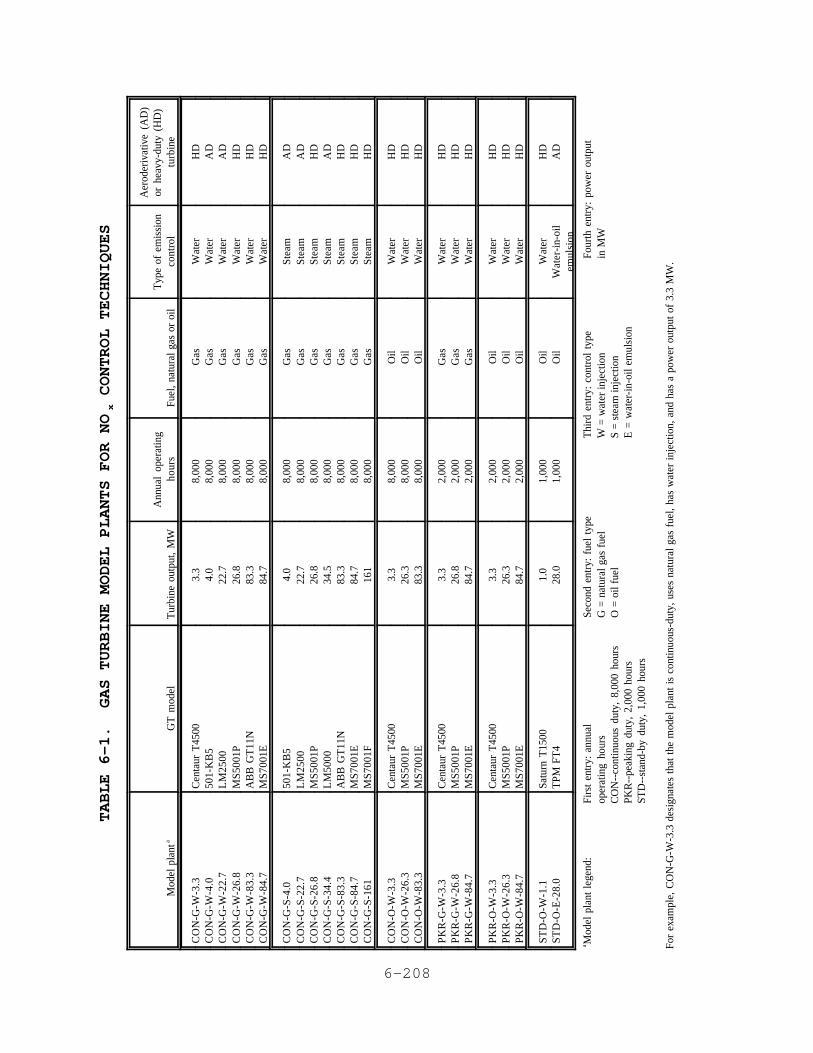
6-208
TABLE 6-1. GAS TURBINE MODEL PLANTS FOR NO CONTROL TECHNIQUES
x
Mod
el p
lant
aG
T m
odel
Tur
bine
out
put,
MW
Ann
ual
oper
atin
gho
urs
Fuel
, nat
ural
gas
or
oil
Typ
e of
em
issi
onco
ntro
l
Aer
oder
ivat
ive
(AD
)or
hea
vy-d
uty
(HD
)tu
rbin
e
CO
N-G
-W-3
.3C
ON
-G-W
-4.0
CO
N-G
-W-2
2.7
CO
N-G
-W-2
6.8
CO
N-G
-W-8
3.3
CO
N-G
-W-8
4.7
Cen
taur
T45
0050
1-K
B5
LM
2500
MS5
001P
AB
B G
T11
NM
S700
1E
3.3
4.0
22.7
26
.8
83.3
84
.7
8,00
0 8,
000
8,00
0 8,
000
8,00
0 8,
000
Gas
Gas
Gas
Gas
Gas
Gas
Wat
erW
ater
Wat
erW
ater
Wat
erW
ater
HD
AD
AD
HD
HD
HD
CO
N-G
-S-4
.0C
ON
-G-S
-22.
7C
ON
-G-S
-26.
8C
ON
-G-S
-34.
4C
ON
-G-S
-83.
3C
ON
-G-S
-84.
7C
ON
-G-S
-161
501-
KB
5L
M25
00M
S500
1PL
M50
00A
BB
GT
11N
MS7
001E
MS7
001F
4.0
22.7
26
.8
34.5
83
.3
84.7
16
1
8,00
0 8,
000
8,00
0 8,
000
8,00
0 8,
000
8,00
0
Gas
Gas
Gas
Gas
Gas
Gas
Gas
Stea
mSt
eam
Stea
mSt
eam
Stea
mSt
eam
Stea
m
AD
AD
HD
AD
HD
HD
HD
CO
N-O
-W-3
.3C
ON
-O-W
-26.
3C
ON
-O-W
-83.
3
Cen
taur
T45
00M
S500
1PM
S700
1E
3.3
26.3
83
.3
8,00
0 8,
000
8,00
0
Oil
Oil
Oil
Wat
erW
ater
Wat
er
HD
HD
HD
PK
R-G
-W-3
.3P
KR
-G-W
-26.
8P
KR
-G-W
-84.
7
Cen
taur
T45
00M
S500
1PM
S700
1E
3.3
26.8
84
.7
2,00
0 2,
000
2,00
0
Gas
Gas
Gas
Wat
erW
ater
Wat
er
HD
HD
HD
PKR
-O-W
-3.3
PKR
-O-W
-26.
3PK
R-O
-W-8
4.7
Cen
taur
T45
00M
S500
1PM
S700
1E
3.3
26.3
84
.7
2,00
0 2,
000
2,00
0
Oil
Oil
Oil
Wat
erW
ater
Wat
er
HD
HD
HD
STD
-O-W
-1.1
STD
-O-E
-28.
0Sa
turn
T15
00T
PM F
T4
1.0
28.0
1,
000
1,00
0 O
ilO
ilW
ater
Wat
er-i
n-oi
lem
ulsi
on
HD
AD
Mod
el p
lant
leg
end:
aFi
rst
entr
y: a
nnua
lop
erat
ing
hour
sC
ON
--co
ntin
uous
dut
y, 8
,000
hou
rsPK
R--
peak
ing
duty
, 2,
000
hour
sST
D--
stan
d-by
dut
y, 1
,000
hou
rs
Seco
nd e
ntry
: fu
el t
ype
G =
nat
ural
gas
fue
lO
= o
il fu
el
Thi
rd e
ntry
: co
ntro
l ty
peW
= w
ater
inje
ctio
nS
= st
eam
inje
ctio
nE
= w
ater
-in-
oil
emul
sion
Four
th e
ntry
: po
wer
out
put
in M
W
For
exam
ple,
CO
N-G
-W-3
.3 d
esig
nate
s th
at t
he m
odel
pla
nt i
s co
ntin
uous
-dut
y, u
ses
natu
ral
gas
fuel
, has
wat
er i
njec
tion,
and
has
a p
ower
out
put
of 3
.3 M
W.
6-209
, characterize variations in existing units with respect to
turbine size, type (i.e., aero-derivative vs. heavy duty),
operating hours, and type of fuel. A total of 24 model plants
were developed; 16 of these were continuous-duty (8,000 hours per
year) and 8 were intermittent-duty (2,000 or 1,000 hours per
year). Thirteen of the continuous-duty model plants burn natural
gas fuel; 6 of the 13 use water injection, and 7 use steam
injection to reduce NO emissions. The three remainingx
continuous-duty model plants burn distillate oil fuel and use
water injection to reduce NO emissions. Of the eightx
intermittent-duty model plants, six operate 2,000 hours per year
(three natural gas-fueled and three distillate oil-fueled), and
two operate 1,000 hours per year (both distillate oil-fueled).
All intermittent-duty model plants use water rather than steam
for NO reduction because it was assumed that the additionalx
capital costs associated with steam-generating equipment could
not be justified for intermittent service.
Costs were available for applying water-in-oil emulsion
technology to only one gas turbine, and insufficient data were
available to develop costs for a similar water-injected model

6-210
plant for this turbine. As a result, the costs and cost
effectiveness for the water-in-oil emulsion model plant should
not be compared to those of water-injected model plants.
Capital costs are described in Section 6.1.1, annual costs
are described in Section 6.1.2, and emission reductions and the
cost effectiveness of wet injection controls are discussed in
Section 6.1.3. Additional discussion of the cost methodology and
details about some of the cost estimating procedures are provided
in Appendix B.
Fuel rates and water flow rates were calculated for each
model plant using published design power output and efficiency,
expressed as heat rate, in British thermal units per
kilowatt-hour (Btu/kWh). The values for these parameters are1
presented in Table 6-2
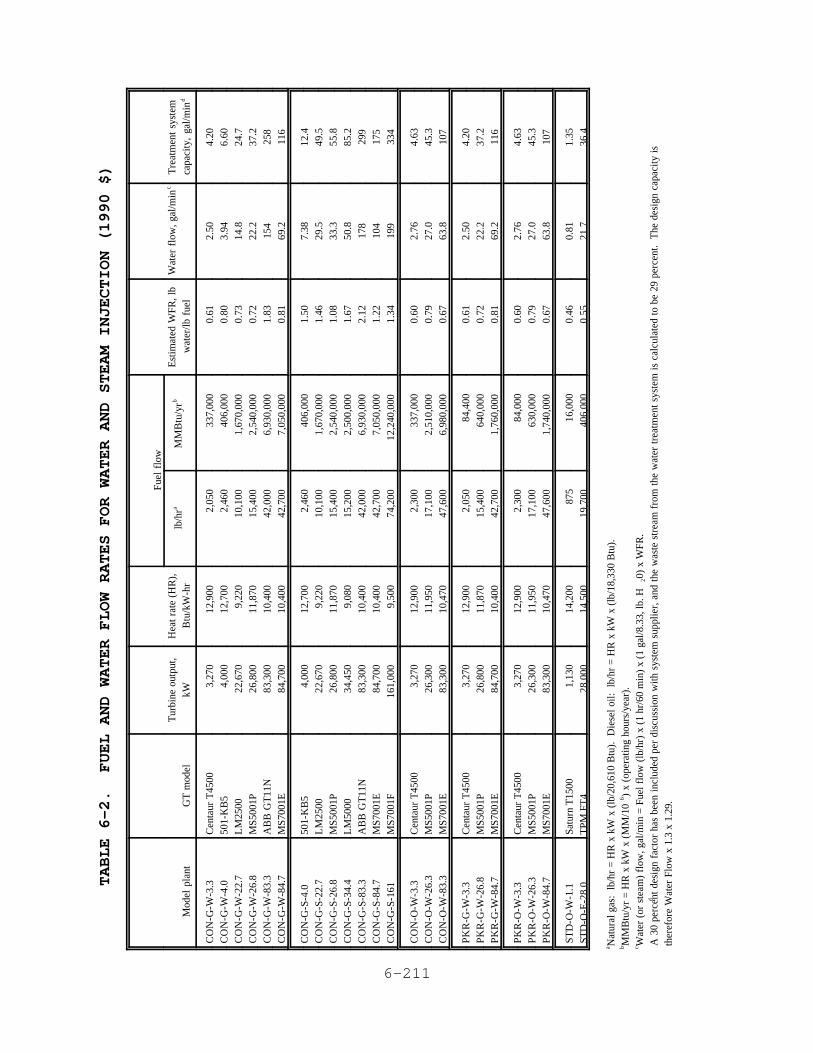
6-211
TABLE 6-2. FUEL AND WATER FLOW RATES FOR WATER AND STEAM INJECTION (1990 $)
Mod
el p
lant
GT
mod
elT
urbi
ne o
utpu
t,kW
Hea
t ra
te (
HR
),B
tu/k
W-h
r
Fuel
flo
wE
stim
ated
WFR
, lb
wat
er/lb
fue
lW
ater
flo
w, g
al/m
inc
Tre
atm
ent
syst
emca
paci
ty,
gal/m
ind
lb/h
raM
MB
tu/y
r b
CO
N-G
-W-3
.3C
ON
-G-W
-4.0
CO
N-G
-W-2
2.7
CO
N-G
-W-2
6.8
CO
N-G
-W-8
3.3
CO
N-G
-W-8
4.7
Cen
taur
T45
0050
1-K
B5
LM
2500
MS5
001P
AB
B G
T11
NM
S700
1E
3,27
04,
000
22,6
7026
,800
83,3
0084
,700
12,9
0012
,700
9,22
011
,870
10,4
0010
,400
2,05
02,
460
10,1
0015
,400
42,0
0042
,700
337,
000
406,
000
1,67
0,00
02,
540,
000
6,93
0,00
07,
050,
000
0.61
0.80
0.73
0.72
1.83
0.81
2.50
3.94
14.8
22.2
154
69.2
4.20
6.60
24.7
37.2
258
116
CO
N-G
-S-4
.0C
ON
-G-S
-22.
7C
ON
-G-S
-26.
8C
ON
-G-S
-34.
4C
ON
-G-S
-83.
3C
ON
-G-S
-84.
7C
ON
-G-S
-161
501-
KB
5L
M25
00M
S500
1PL
M50
00A
BB
GT
11N
MS7
001E
MS7
001F
4,00
022
,670
26,8
0034
,450
83,3
0084
,700
161,
000
12,7
009,
220
11,8
709,
080
10,4
0010
,400
9,50
0
2,46
010
,100
15,4
0015
,200
42,0
0042
,700
74,2
00
406,
000
1,67
0,00
02,
540,
000
2,50
0,00
06,
930,
000
7,05
0,00
012
,240
,000
1.50
1.46
1.08
1.67
2.12
1.22
1.34
7.38
29.5
33.3
50.8
178
104
199
12.4
49.5
55.8
85.2
299
175
334
CO
N-O
-W-3
.3C
ON
-O-W
-26.
3C
ON
-O-W
-83.
3
Cen
taur
T45
00M
S500
1PM
S700
1E
3,27
026
,300
83,3
00
12,9
0011
,950
10,4
70
2,30
017
,100
47,6
00
337,
000
2,51
0,00
06,
980,
000
0.60
0.79
0.67
2.76
27.0
63.8
4.63
45.3
107
PK
R-G
-W-3
.3P
KR
-G-W
-26.
8P
KR
-G-W
-84.
7
Cen
taur
T45
00M
S500
1PM
S700
1E
3,27
026
,800
84,7
00
12,9
0011
,870
10,4
00
2,05
015
,400
42,7
00
84,4
0064
0,00
01,
760,
000
0.61
0.72
0.81
2.50
22.2
69.2
4.20
37.2
116
PK
R-O
-W-3
.3P
KR
-O-W
-26.
3P
KR
-O-W
-84.
7
Cen
taur
T45
00M
S500
1PM
S700
1E
3,27
026
,300
83,3
00
12,9
0011
,950
10,4
70
2,30
017
,100
47,6
00
84,0
0063
0,00
01,
740,
000
0.60
0.79
0.67
2.76
27.0
63.8
4.63
45.3
107
STD
-O-W
-1.1
STD
-O-E
-28.
0Sa
turn
T15
00T
PM F
T4
1,13
028
,000
14,2
0014
,500
875
19,7
0016
,000
406,
000
0.46
0.55
0.81
21.7
1.35
36.4
a Nat
ural
gas
: lb
/hr
= H
R x
kW
x (
lb/2
0,61
0 B
tu).
Die
sel o
il: l
b/hr
= H
R x
kW
x (
lb/1
8,33
0 B
tu).
MM
Btu
/yr
= H
R x
kW
x (
MM
/10
) x
(ope
ratin
g ho
urs/
year
).b
6
Wat
er (
or s
team
) fl
ow, g
al/m
in =
Fue
l flo
w (
lb/h
r) x
(1
hr/6
0 m
in)
x (1
gal
/8.3
3, lb
. H0)
x W
FR.
c2
A 3
0 pe
rcen
t de
sign
fac
tor
has
been
inc
lude
d pe
r di
scus
sion
with
sys
tem
sup
plie
r, a
nd t
he w
aste
str
eam
fro
m t
he w
ater
tre
atm
ent
syst
em i
s ca
lcul
ated
to
be 2
9 pe
rcen
t. T
he d
esig
n ca
paci
ty is
d
the
refo
re W
ater
Flo
w x
1.3
x 1
.29.

6-212
for each model plant. Fuel rates were estimated based on the
heat rates, the design output, and the lower heating value (LHV)
of the fuel. The LHV's used in this analysis for natural gas and
diesel fuel are 20,610 Btu per pound (Btu/lb) and 18,330 Btu/lb,
respectively, as shown in Table 6-3
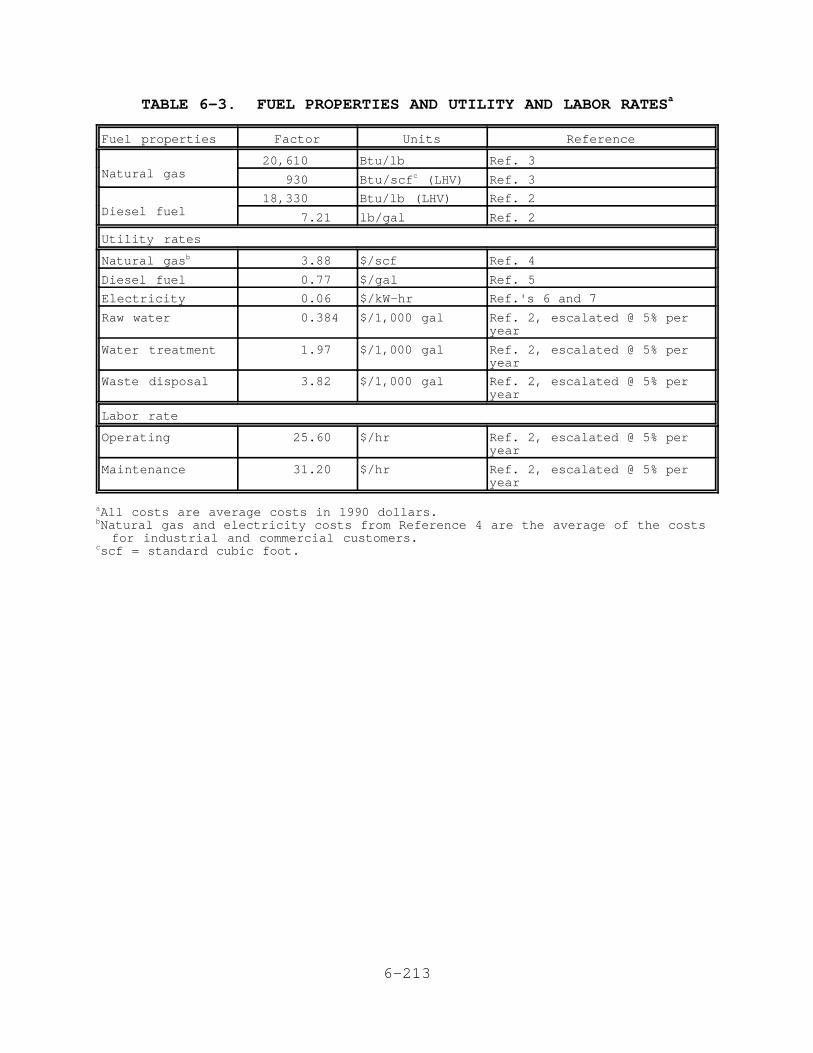
6-213
TABLE 6-3. FUEL PROPERTIES AND UTILITY AND LABOR RATESa
Fuel properties Factor Units Reference
Natural gas20,610 Btu/lb Ref. 3
930 Btu/scf (LHV)c Ref. 3
Diesel fuel18,330 Btu/lb (LHV) Ref. 2
7.21 lb/gal Ref. 2
Utility rates
Natural gasb 3.88 $/scf Ref. 4
Diesel fuel 0.77 $/gal Ref. 5
Electricity 0.06 $/kW-hr Ref.'s 6 and 7
Raw water 0.384 $/1,000 gal Ref. 2, escalated @ 5% peryear
Water treatment 1.97 $/1,000 gal Ref. 2, escalated @ 5% peryear
Waste disposal 3.82 $/1,000 gal Ref. 2, escalated @ 5% peryear
Labor rate
Operating 25.60 $/hr Ref. 2, escalated @ 5% peryear
Maintenance 31.20 $/hr Ref. 2, escalated @ 5% peryear
All costs are average costs in 1990 dollars.a
Natural gas and electricity costs from Reference 4 are the average of the costsb
for industrial and commercial customers.scf = standard cubic foot.c

6-214
. Water (or steam) injection rates were calculated based on2
published fuel rates and water-to-fuel ratios (WFR) provided by
manufacturers. According to a water treatment system8-12
supplier, treatment facilities are designed with a capacity
factor of 1.3. An additional 29 percent of the treated water13
flow rate is discarded as wastewater. Consequently, the water2
treatment facility design capacity is 68 percent (1.30 x 1.29)
greater than the water (or steam) injection rate.
i. Capital Costs
The capital costs for each model plant are presented in
Table 6-4
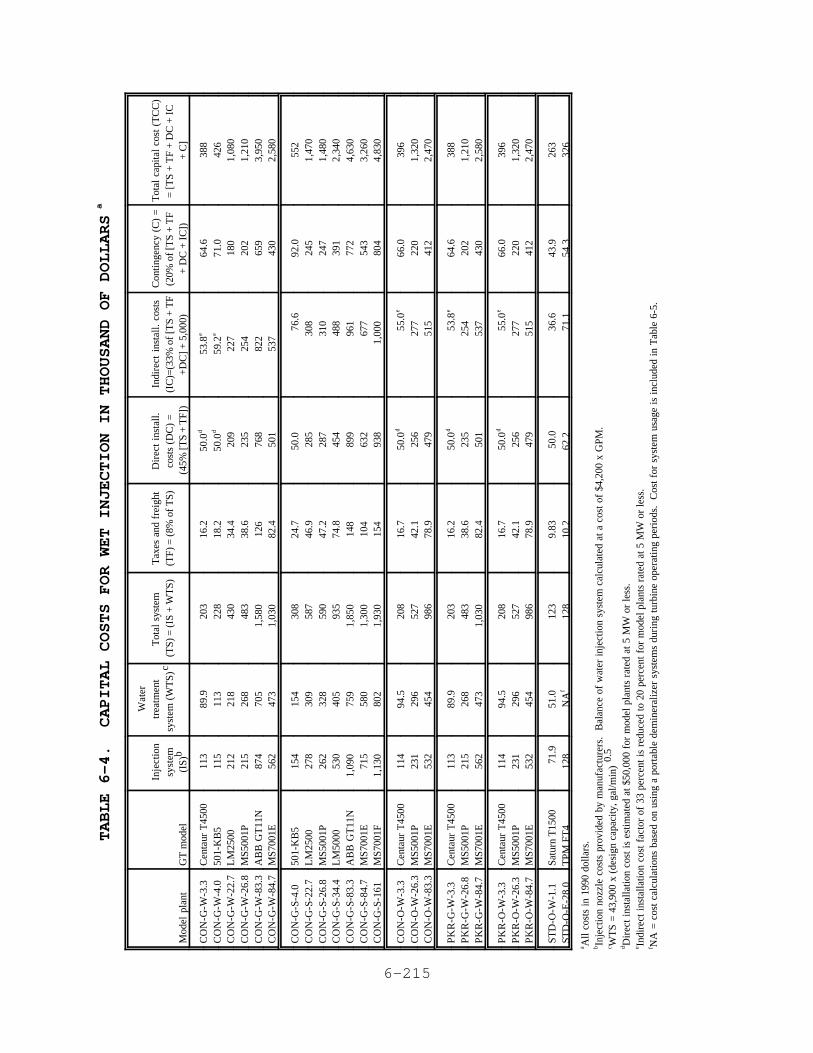
6-215
TABLE 6-4. CAPITAL COSTS FOR WET INJECTION IN THOUSAND OF DOLLARS
a
Mod
el p
lant
GT
mod
el
Inje
ctio
nsy
stem
(IS)
b
Wat
ertr
eatm
ent
syst
em (
WT
S)c
Tot
al s
yste
m
(TS)
= (
IS +
WT
S)T
axes
and
fre
ight
(TF)
= (
8% o
f T
S)D
irec
t in
stal
l. co
sts
(DC
) =
(45%
[TS
+ T
F])
Indi
rect
ins
tall.
cos
ts(I
C)=
(33%
of
[TS
+ T
F+D
C]
+ 5,
000)
Con
tinge
ncy
(C)
=(2
0% o
f [T
S +
TF
+ D
C +
IC
])
Tot
al c
apita
l co
st (
TC
C)
= [T
S +
TF
+ D
C +
IC
+ C
]
CO
N-G
-W-3
.3C
ON
-G-W
-4.0
CO
N-G
-W-2
2.7
CO
N-G
-W-2
6.8
CO
N-G
-W-8
3.3
CO
N-G
-W-8
4.7
Cen
taur
T45
0050
1-K
B5
LM
2500
MS5
001P
AB
B G
T11
NM
S700
1E
113
115
212
215
874
562
89.9
113
218
268
705
473
203
228
430
483
1,58
0 1,
030
16.2
18
.2
34.4
38
.6
126
82.4
50.0
d
50.0
d
209
235
768
501
53.8
e
59.2
e
227
254
822
537
64.6
71.0
180
202
659
430
388
426
1,08
01,
210
3,95
02,
580
CO
N-G
-S-4
.0C
ON
-G-S
-22.
7C
ON
-G-S
-26.
8C
ON
-G-S
-34.
4C
ON
-G-S
-83.
3C
ON
-G-S
-84.
7C
ON
-G-S
-161
501-
KB
5L
M25
00M
S500
1PL
M50
00A
BB
GT
11N
MS7
001E
MS7
001F
154
278
262
530
1,09
071
51,
130
154
309
328
405
759
580
802
308
587
590
935
1,85
0 1,
300
1,93
0
24.7
46
.9
47.2
74
.8
148
104
154
50.0
28
528
745
489
963
293
8
76.6
308
310
488
961
677
1,00
0
92.0
245
247
391
772
543
804
552
1,47
01,
480
2,34
04,
630
3,26
04,
830
CO
N-O
-W-3
.3C
ON
-O-W
-26.
3C
ON
-O-W
-83.
3
Cen
taur
T45
00M
S500
1PM
S700
1E
114
231
532
94.5
296
454
208
527
986
16.7
42
.1
78.9
50.0
d
256
479
55.0
e
277
515
66.0
220
412
396
1,32
02,
470
PK
R-G
-W-3
.3P
KR
-G-W
-26.
8P
KR
-G-W
-84.
7
Cen
taur
T45
00M
S500
1PM
S700
1E
113
215
562
89.9
268
473
203
483
1,03
0
16.2
38
.6
82.4
50.0
d
235
501
53.8
e
254
537
64.6
202
430
388
1,21
02,
580
PK
R-O
-W-3
.3P
KR
-O-W
-26.
3P
KR
-O-W
-84.
7
Cen
taur
T45
00M
S500
1PM
S700
1E
114
231
532
94.5
296
454
208
527
986
16.7
42
.1
78.9
50.0
d
256
479
55.0
e
277
515
66.0
220
412
396
1,32
02,
470
STD
-O-W
-1.1
STD
-O-E
-28.
0Sa
turn
T15
00T
PM F
T4
71.9
128
51.0
NA
f
123
128
9.83
10
.2
50.0
62.2
36
.671
.143
.954
.326
332
6a A
ll co
sts
in 1
990
dolla
rs.
Inje
ctio
n no
zzle
cos
ts p
rovi
ded
by m
anuf
actu
rers
. B
alan
ce o
f w
ater
inj
ectio
n sy
stem
cal
cula
ted
at a
cos
t of
$4,
200
x G
PM.
b WT
S =
43,9
00 x
(de
sign
cap
acity
, gal
/min
)c
0.5
Dir
ect
inst
alla
tion
cost
is
estim
ated
at
$50,
000
for
mod
el p
lant
s ra
ted
at 5
MW
or
less
.d In
dire
ct i
nsta
llatio
n co
st f
acto
r of
33
perc
ent
is r
educ
ed t
o 20
per
cent
for
mod
el p
lant
s ra
ted
at 5
MW
or
less
.e N
A =
cos
t ca
lcul
atio
ns b
ased
on
usin
g a
port
able
dem
iner
aliz
er s
yste
ms
duri
ng t
urbi
ne o
pera
ting
peri
ods.
C
ost
for
syst
em u
sage
is
incl
uded
in
Tab
le 6
-5.
f

6-216
. These costs were developed based on methodology in
Reference 2, which is presented in this section. The capital
costs include purchased equipment costs, direct and indirect
installation costs, and contingency costs.
(1) Purchased Equipment Costs. Purchased equipment costs
consist of the injection system, the water treatment system,
taxes, and freight. All costs are presented in 1990 dollars.

6-217

6-218
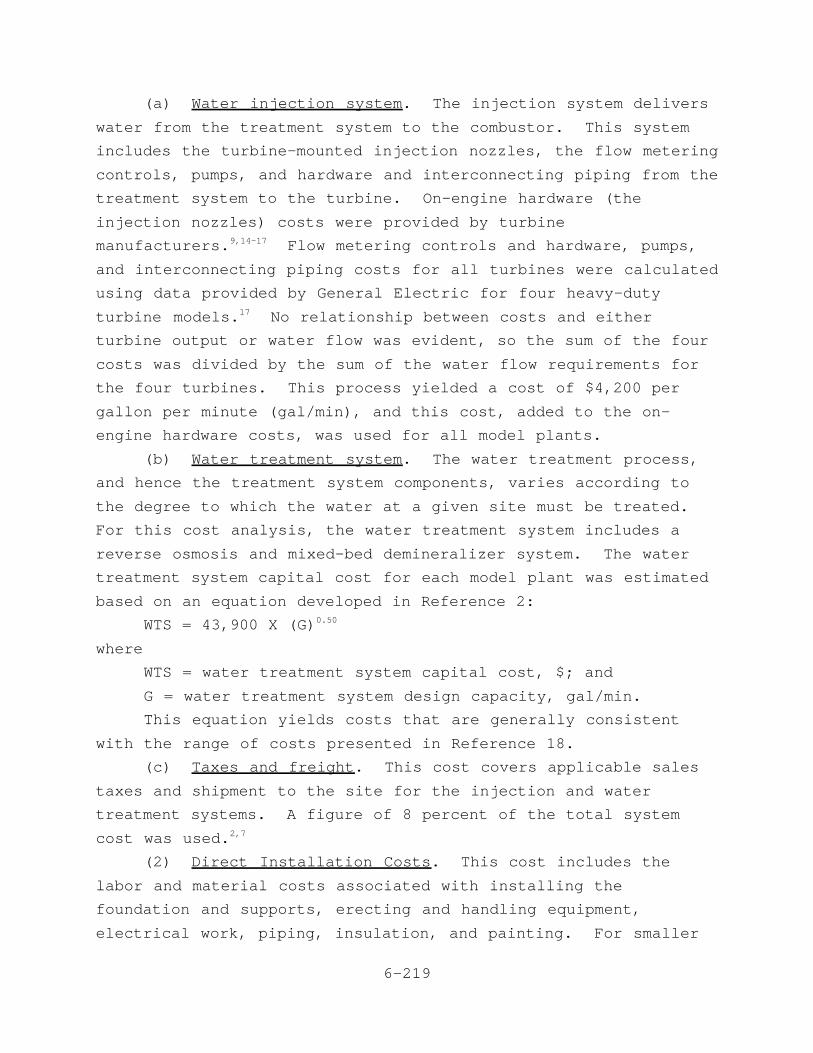
6-219
(a) Water injection system. The injection system delivers
water from the treatment system to the combustor. This system
includes the turbine-mounted injection nozzles, the flow metering
controls, pumps, and hardware and interconnecting piping from the
treatment system to the turbine. On-engine hardware (the
injection nozzles) costs were provided by turbine
manufacturers. Flow metering controls and hardware, pumps,9,14-17
and interconnecting piping costs for all turbines were calculated
using data provided by General Electric for four heavy-duty
turbine models. No relationship between costs and either17
turbine output or water flow was evident, so the sum of the four
costs was divided by the sum of the water flow requirements for
the four turbines. This process yielded a cost of $4,200 per
gallon per minute (gal/min), and this cost, added to the on-
engine hardware costs, was used for all model plants.
(b) Water treatment system. The water treatment process,
and hence the treatment system components, varies according to
the degree to which the water at a given site must be treated.
For this cost analysis, the water treatment system includes a
reverse osmosis and mixed-bed demineralizer system. The water
treatment system capital cost for each model plant was estimated
based on an equation developed in Reference 2:
WTS = 43,900 X (G)0.50
where
WTS = water treatment system capital cost, $; and
G = water treatment system design capacity, gal/min.
This equation yields costs that are generally consistent
with the range of costs presented in Reference 18.
(c) Taxes and freight. This cost covers applicable sales
taxes and shipment to the site for the injection and water
treatment systems. A figure of 8 percent of the total system
cost was used.2,7
(2) Direct Installation Costs. This cost includes the
labor and material costs associated with installing the
foundation and supports, erecting and handling equipment,
electrical work, piping, insulation, and painting. For smaller
6-220
turbines, the water treatment system is typically skid-mounted
and is shipped to the site as a packaged unit, which minimizes
field assembly and interconnections. The cost to install a skid-
mounted water treatment skid is typically $50,000, and this cost
is used for the direct installation cost for model plants less
than 5 MW (6700 hp). For larger turbines, it is expected that19
the water treatment system must be field-assembled and the direct
installation costs were calculated as 45 percent of the injection
and water treatment systems, including taxes and freight.2
(3) Indirect Installation Costs. This cost covers the
indirect costs (engineering, supervisory personnel, office
personnel, temporary offices, etc.) associated with installing
the equipment. The cost was taken to be 33 percent of the
systems' costs, taxes and freight, and direct costs, plus
$5,000 for model plants above 5 MW (6,700 hp). The indirect2
installation costs for skid-mounted water treatment systems are
expected to be less than for field-assembled systems; therefore,
for model plants with an output of less than 5 MW (6,700 hp), the
cost percentage factor was reduced from 33 to 20 percent.
(4) Contingency Cost. This cost is a catch-all meant to
cover unforeseen costs such as equipment redesign/ modification,
cost escalations, and delays encountered in startup. This cost
was estimated as 20 percent of the sum of the systems, taxes and
freight, and direct and indirect costs.2
ii. Annual Costs

6-221
The annual costs are summarized in Table 6-5
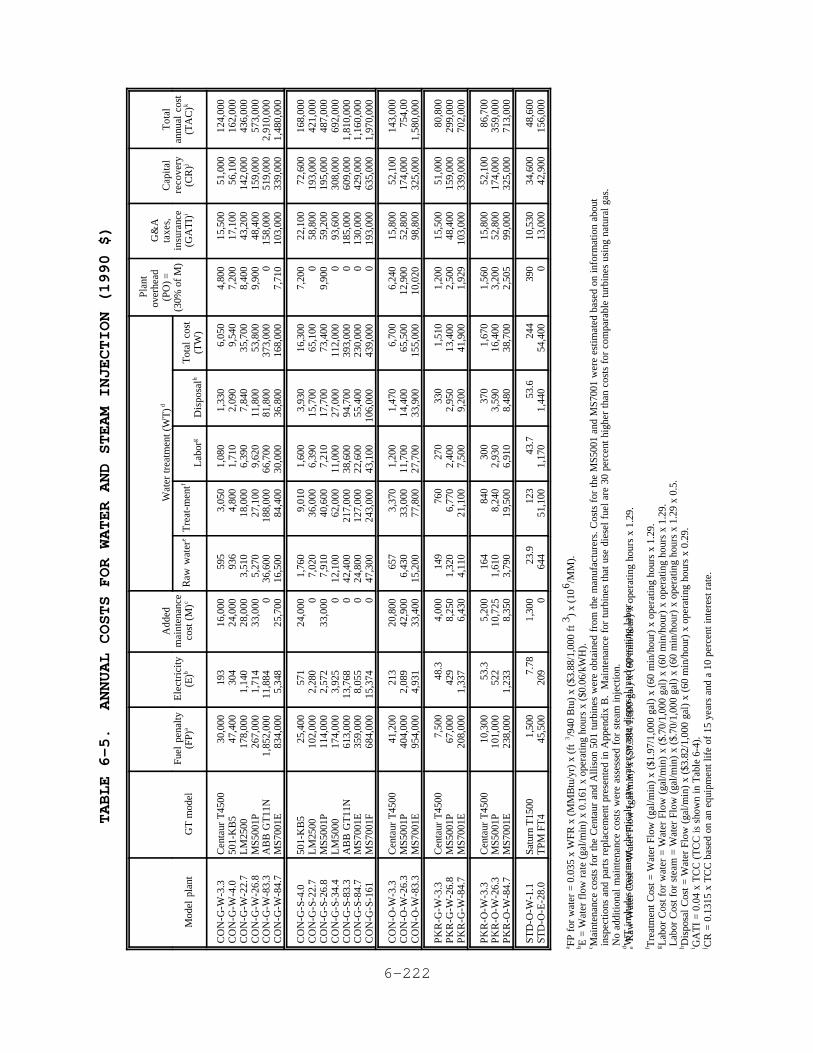
6-222
TABLE 6-5. ANNUAL COSTS FOR WATER AND STEAM INJECTION (1990 $)
Mod
el p
lant
GT
mod
elFu
el p
enal
ty(F
P)a
Ele
ctri
city
(E)b
Add
edm
aint
enan
ceco
st (
M)c
Wat
er tr
eatm
ent (
WT
)d
Pla
ntov
erhe
ad
(PO
) =(3
0% o
f M
)
G&
Ata
xes,
insu
ranc
e(G
AT
I)i
Cap
ital
reco
very
(CR
)j
Tot
alan
nual
cos
t(T
AC
)kR
aw w
ater
eT
reat
-men
tf
Lab
org
Dis
posa
lhT
otal
cos
t(T
W)
CO
N-G
-W-3
.3C
ON
-G-W
-4.0
CO
N-G
-W-2
2.7
CO
N-G
-W-2
6.8
CO
N-G
-W-8
3.3
CO
N-G
-W-8
4.7
Cen
taur
T45
0050
1-K
B5
LM
2500
MS5
001P
AB
B G
T11
NM
S700
1E
30,0
0047
,400
178,
000
267,
000
1,85
2,00
083
4,00
0
193
304
1,14
01,
714
11,8
845,
348
16,0
0024
,000
28,0
0033
,000
025
,700
595
936
3,51
05,
270
36,6
0016
,500
3,05
04,
800
18,0
0027
,100
188,
000
84,4
00
1,08
01,
710
6,39
09,
620
66,7
0030
,000
1,33
02,
090
7,84
011
,800
81,8
0036
,800
6,05
09,
540
35,7
0053
,800
373,
000
168,
000
4,80
07,
200
8,40
09,
900 0
7,71
0
15,5
0017
,100
43,2
0048
,400
158,
000
103,
000
51,0
0056
,100
142,
000
159,
000
519,
000
339,
000
124,
000
162,
000
436,
000
573,
000
2,91
0,00
01,
480,
000
CO
N-G
-S-4
.0C
ON
-G-S
-22.
7C
ON
-G-S
-26.
8C
ON
-G-S
-34.
4C
ON
-G-S
-83.
3C
ON
-G-S
-84.
7C
ON
-G-S
-161
501-
KB
5L
M25
00M
S500
1PL
M50
00A
BB
GT
11N
MS7
001E
MS7
001F
25,4
0010
2,00
011
4,00
017
4,00
061
3,00
035
9,00
068
4,00
0
571
2,28
02,
572
3,92
513
,768
8,05
515
,374
24,0
000
33,0
000 0 0 0
1,76
07,
020
7,91
012
,100
42,4
0024
,800
47,3
00
9,01
036
,000
40,6
0062
,000
217,
000
127,
000
243,
000
1,60
06,
390
7,21
011
,000
38,6
0022
,600
43,1
00
3,93
015
,700
17,7
0027
,000
94,7
0055
,400
106,
000
16,3
0065
,100
73,4
0011
2,00
039
3,00
023
0,00
043
9,00
0
7,20
0 09,
900 0 0 0 0
22,1
0058
,800
59,2
0093
,600
185,
000
130,
000
193,
000
72,6
0019
3,00
019
5,00
030
8,00
060
9,00
042
9,00
063
5,00
0
168,
000
421,
000
487,
000
692,
000
1,81
0,00
01,
160,
000
1,97
0,00
0
CO
N-O
-W-3
.3C
ON
-O-W
-26.
3C
ON
-O-W
-83.
3
Cen
taur
T45
00M
S500
1PM
S700
1E
41,2
0040
4,00
095
4,00
0
213
2,08
94,
931
20,8
0042
,900
33,4
00
657
6,43
015
,200
3,37
033
,000
77,8
00
1,20
011
,700
27,7
00
1,47
014
,400
33,9
00
6,70
065
,500
155,
000
6,24
012
,900
10,0
20
15,8
0052
,800
98,8
00
52,1
0017
4,00
032
5,00
0
143,
000
754,
001,
580,
000
PK
R-G
-W-3
.3P
KR
-G-W
-26.
8P
KR
-G-W
-84.
7
Cen
taur
T45
00M
S500
1PM
S700
1E
7,50
067
,000
208,
000
48.3
429
1,33
7
4,00
08,
250
6,43
0
149
1,32
04,
110
760
6,77
021
,100
270
2,40
07,
500
330
2,95
09,
200
1,51
013
,400
41,9
00
1,20
02,
500
1,92
9
15,5
0048
,400
103,
000
51,0
0015
9,00
033
9,00
0
80,8
0029
9,00
070
2,00
0
PK
R-O
-W-3
.3P
KR
-O-W
-26.
3P
KR
-O-W
-84.
7
Cen
taur
T45
00M
S500
1PM
S700
1E
10,3
0010
1,00
023
8,00
0
53.3
522
1,23
3
5,20
010
,725
8,35
0
164
1,61
03,
790
840
8,24
019
,500
300
2,93
06,
910
370
3,59
08,
480
1,67
016
,400
38,7
00
1,56
03,
200
2,50
5
15,8
0052
,800
99,0
00
52,1
0017
4,00
032
5,00
0
86,7
0035
9,00
071
3,00
0
STD
-O-W
-1.1
STD
-O-E
-28.
0Sa
turn
T15
00T
PM F
T4
1,50
045
,500
7.78
209
1,30
0 023
.964
412
351
,100
43.7
1,17
053
.61,
440
244
54,4
0039
0 010
,530
13,0
0034
,600
42,9
0048
,600
156,
000
FP f
or w
ater
= 0
.035
x W
FR x
(M
MB
tu/y
r) x
(ft
/940
Btu
) x
($3.
88/1
,000
ft
) x
(10
/MM
).a
33
6
E =
Wat
er f
low
rat
e (g
al/m
in)
x 0.
161
x op
erat
ing
hour
s x
($0.
06/k
WH
).b M
aint
enan
ce c
osts
for
the
Cen
taur
and
Alli
son
501
turb
ines
wer
e ob
tain
ed f
rom
the
man
ufac
ture
rs. C
osts
for
the
MS5
001
and
MS7
001
wer
e es
timat
ed b
ased
on
info
rmat
ion
abou
tc i
nspe
ctio
ns a
nd p
arts
rep
lace
men
t pr
esen
ted
in A
ppen
dix
B.
Mai
nten
ance
for
tur
bine
s th
at u
se d
iese
l fu
el a
re 3
0 pe
rcen
t hi
gher
tha
n co
sts
for
com
para
ble
turb
ines
usi
ng n
atur
al g
as.
No
addi
tiona
l m
aint
enan
ce c
osts
wer
e as
sess
ed f
or s
team
inj
ectio
n.W
T i
nclu
des
trea
tmen
t ch
emic
als,
raw
wat
er, w
aste
dis
posa
l, an
d op
erat
ing
labo
r.d
Raw
Wat
er C
ost =
Wat
er F
low
(ga
l/min
) x
($0.
384/
1,00
0 ga
l) x
(60
min
/hou
r) x
ope
ratin
g ho
urs
x 1.
29.
e Tre
atm
ent C
ost =
Wat
er F
low
(ga
l/min
) x
($1.
97/1
,000
gal
) x
(60
min
/hou
r) x
ope
ratin
g ho
urs
x 1.
29.
f Lab
or C
ost f
or w
ater
= W
ater
Flo
w (
gal/m
in)
x ($
.70/
1,00
0 ga
l) x
(60
min
/hou
r) x
ope
ratin
g ho
urs
x 1.
29.
g Lab
or C
ost f
or s
team
= W
ater
Flo
w (
gal/m
in)
x ($
.70/
1,00
0 ga
l) x
(60
min
/hou
r) x
ope
ratin
g ho
urs
x 1.
29 x
0.5
.D
ispo
sal
Cos
t =
Wat
er F
low
(ga
l/min
) x
($3.
82/1
,000
gal
) x
(60
min
/hou
r) x
ope
ratin
g ho
urs
x 0.
29.
h GA
TI
= 0.
04 x
TC
C (
TC
C is
sho
wn
in T
able
6-4
).i C
R =
0.1
315
x T
CC
bas
ed o
n an
equ
ipm
ent l
ife
of 1
5 ye
ars
and
a 10
per
cent
inte
rest
rat
e.j
6-223
for each model plant. Annual costs include the fuel penalty;
electricity; maintenance requirements; water treatment; overhead,
general and administrative, taxes, and insurance; and capital
recovery, as discussed in this section.
(1) Fuel Penalty. The reduction in efficiency
associated with water injection varies for each turbine model.
Based on data in Reference 2, it was estimated that a WFR of
1.0 corresponds to a fuel penalty of 3.5 percent for water
injection and 1.0 percent for steam injection. This percentage
was multiplied by the actual WFR and the annual fuel cost to
power pump (kWe) 'FR
3,960x H x (S.G.) x
1
0.6X
0.7457 kW
hpx
1
0.9
6-224
determine the fuel penalty for each model plant. The fuel flow
was multiplied by the unit fuel costs to determine the annual
fuel costs. As shown in Table 6-3, the natural gas cost is
$3.88/1,000 standard cubic feet (scf) and the diesel fuel cost is
$0.77/gal. 4,5
An increase in output from the turbine accompanies the
decrease in efficiency. This increase was not considered,
however, because not all sites have a demand for the available
excess power. In applications such as electric power generation,
where the excess power can be used at the site or added to
utility power sales, this additional output would serve to
decrease or offset the fuel penalty impact.
(2) Electricity Cost. The electricity costs shown in
Table 6-5 apply to the feedwater pump(s) for water or steam
injection. The pump power requirements are estimated from the
pump head (ft) and the water flow rate as shown in the following
equation:2
where:
FR = feedwater flow rate, gal/min (from Table 6-2);
H = total pump head (ft);
S.G. = specific gravity of the feed water;
0.6 = pump efficiency of 60 percent;
0.9 = electric motor efficiency of 90 percent;
3,960 = factor to correct units in FR and H to hp; and
0.7457 = factor to convert hp to kW.
For water injection, the feedwater pump(s) supply treated water
to the gas turbine injection system. For steam injection, the
feedwater pump(s) supply treated water to the boiler for steam
generation. This cost analysis uses a feedwater temperature of
55EC (130EF) with a density of 61.6 lb/ft and a total pump head3
requirement of 200 pounds per square inch, gauge (psig)
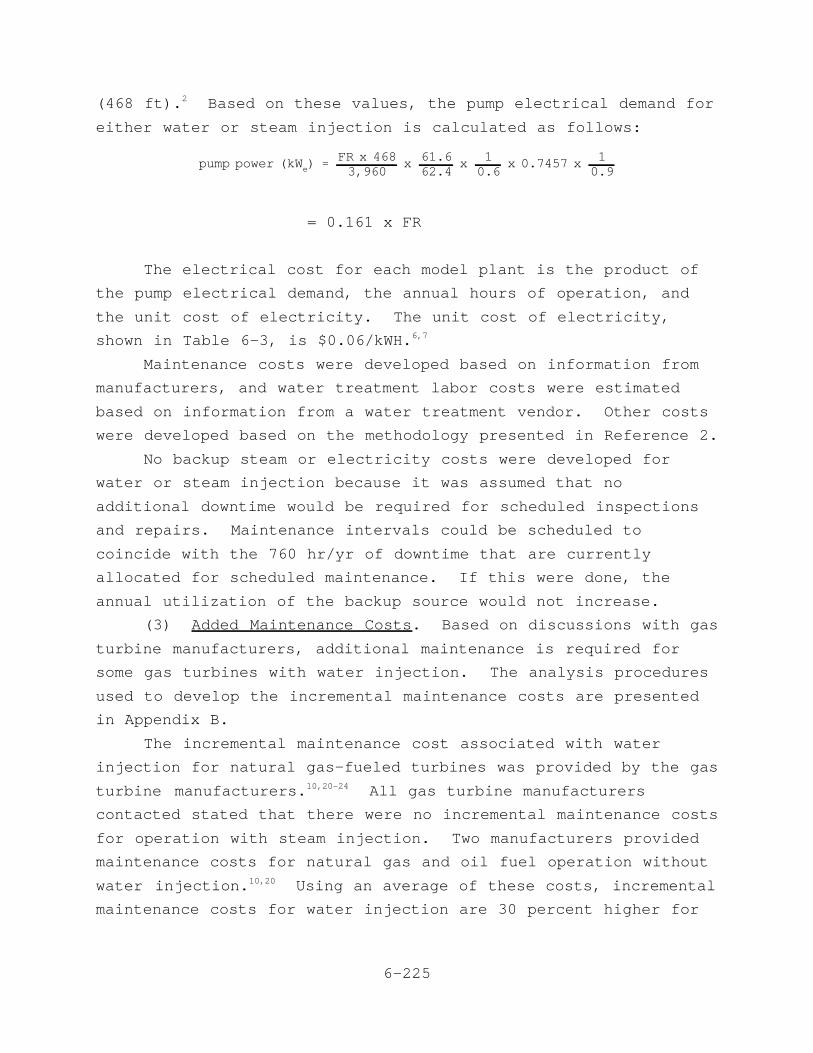
pump power (kWe) 'FR x 4683,960
x 61.662.4
x 10.6
x 0.7457 x 10.9
6-225
(468 ft). Based on these values, the pump electrical demand for2
either water or steam injection is calculated as follows:
= 0.161 x FR
The electrical cost for each model plant is the product of
the pump electrical demand, the annual hours of operation, and
the unit cost of electricity. The unit cost of electricity,
shown in Table 6-3, is $0.06/kWH.6,7
Maintenance costs were developed based on information from
manufacturers, and water treatment labor costs were estimated
based on information from a water treatment vendor. Other costs
were developed based on the methodology presented in Reference 2.
No backup steam or electricity costs were developed for
water or steam injection because it was assumed that no
additional downtime would be required for scheduled inspections
and repairs. Maintenance intervals could be scheduled to
coincide with the 760 hr/yr of downtime that are currently
allocated for scheduled maintenance. If this were done, the
annual utilization of the backup source would not increase.
(3) Added Maintenance Costs. Based on discussions with gas
turbine manufacturers, additional maintenance is required for
some gas turbines with water injection. The analysis procedures
used to develop the incremental maintenance costs are presented
in Appendix B.
The incremental maintenance cost associated with water
injection for natural gas-fueled turbines was provided by the gas
turbine manufacturers. All gas turbine manufacturers10,20-24
contacted stated that there were no incremental maintenance costs
for operation with steam injection. Two manufacturers provided
maintenance costs for natural gas and oil fuel operation without
water injection. Using an average of these costs, incremental10,20
maintenance costs for water injection are 30 percent higher for
6-226
plants that use diesel fuel instead of natural gas. Costs were
prorated for model plants that operate less than 8,000 hr/yr.
(4) Water Treatment Costs. Water treatment operating costs
include the cost of treatment (e.g., for chemicals and media
filters), operating labor, raw water, and wastewater disposal.
The raw water flow rate is equal to the treated water flow rate
(the water or steam injection rate) plus the flow rate of the
wastewater generated in the treatment plant. As noted in Section
6.1, the wastewater flow rate is equal to 29 percent of the
injection flow rate. The annual raw water, treated water, and
wastewater flow rates were multiplied by the appropriate unit
costs in Table 6-3 to determine the annual costs. Water
treatment labor costs were calculated at $0.70/1,000 gal for
water injection. This cost was multiplied by the total annual25
treated water flow rate to determine the annual water treatment
labor cost for water injection. Labor costs for steam injection
were assumed to be half as much as the costs for water injection
because it was assumed that the facility already has a water
treatment plant for the boiler feedwater. Therefore, the
operator requirements would be only those associated with the
increase in capacity of the existing treatment plant.
(5) Plant Overhead. This cost is the overhead associated
with the additional maintenance effort required for water
injection. The cost was calculated as 30 percent of the added
maintenance cost from Section 6.1.2.3.2
(6) General and Administrative, Taxes, and Insurance Costs
(GATI). This cost covers those expenses for administrative
overhead, property taxes, and insurance and was calculated as
4 percent of the total capital cost.2
(7) Capital Recovery. A capital recovery factor (CRF) was
multiplied by the total capital investment to estimate uniform
end-of-year payments necessary to repay the investment. The CRF
used in this analysis is 0.1315, which is based on an equipment
life of 15 years and an interest rate of 10 percent.
(8) Total Annual Cost. This cost is the sum of the annual
costs presented in Sections 6.1.2.1 through 6.1.2.7 and is the

6-227
total cost that must be paid each year to install and operate
water or steam injection NO emissions control for a gas turbine.x
iii. Emission Reduction and Cost-Effectiveness Summary for
Water and Steam Injection

6-228
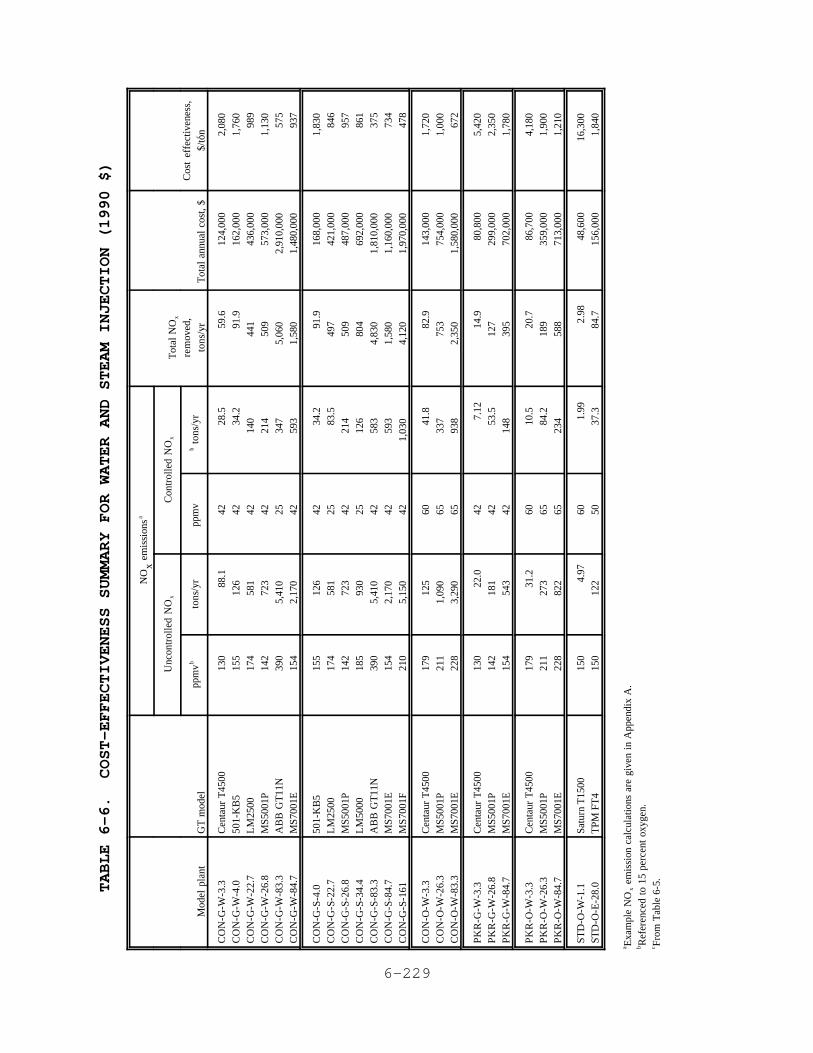
6-229
TABLE 6-6. COST-EFFECTIVENESS SUMMARY FOR WATER AND STEAM INJECTION (1990 $)
Mod
el p
lant
GT
mod
el
NO
em
issi
ons
xa
Tot
al N
Ox
rem
oved
,to
ns/y
rT
otal
ann
ual
cost
, $c
Cos
t ef
fect
iven
ess,
$/to
n
Unc
ontr
olle
d N
Ox
Con
trol
led
NO
x
ppm
vbto
ns/y
rpp
mv
bto
ns/y
r
CO
N-G
-W-3
.3C
ON
-G-W
-4.0
CO
N-G
-W-2
2.7
CO
N-G
-W-2
6.8
CO
N-G
-W-8
3.3
CO
N-G
-W-8
4.7
Cen
taur
T45
0050
1-K
B5
LM
2500
MS5
001P
AB
B G
T11
NM
S700
1E
130
155
174
142
390
154
88.1
12
6 58
1 72
3 5,
410
2,17
0
42
42
42
42
25
42
28.5
34
.2
140
214
347
593
59.6
91
.9
441
509
5,06
0 1,
580
124,
000
162,
000
436,
000
573,
000
2,91
0,00
0 1,
480,
000
2,08
0 1,
760
989
1,13
0 57
5 93
7
CO
N-G
-S-4
.0C
ON
-G-S
-22.
7C
ON
-G-S
-26.
8C
ON
-G-S
-34.
4C
ON
-G-S
-83.
3C
ON
-G-S
-84.
7C
ON
-G-S
-161
501-
KB
5L
M25
00M
S500
1PL
M50
00A
BB
GT
11N
MS7
001E
MS7
001F
155
174
142
185
390
154
210
126
581
723
930
5,41
0 2,
170
5,15
0
42
25
42
25
42
42
42
34.2
83
.5
214
126
583
593
1,03
0
91.9
49
7 50
9 80
4 4,
830
1,58
0 4,
120
168,
000
421,
000
487,
000
692,
000
1,81
0,00
0 1,
160,
000
1,97
0,00
0
1,83
0 84
6 95
7 86
1 37
5 73
4 47
8
CO
N-O
-W-3
.3C
ON
-O-W
-26.
3C
ON
-O-W
-83.
3
Cen
taur
T45
00M
S500
1PM
S700
1E
179
211
228
125
1,09
0 3,
290
60
65
65
41.8
33
7 93
8
82.9
75
3 2,
350
143,
000
754,
000
1,58
0,00
0
1,72
0 1,
000
672
PK
R-G
-W-3
.3P
KR
-G-W
-26.
8P
KR
-G-W
-84.
7
Cen
taur
T45
00M
S500
1PM
S700
1E
130
142
154
22.0
18
1 54
3
42
42
42
7.12
53
.5
148
14.9
12
7 39
5
80,8
00
299,
000
702,
000
5,42
0 2,
350
1,78
0
PK
R-O
-W-3
.3P
KR
-O-W
-26.
3P
KR
-O-W
-84.
7
Cen
taur
T45
00M
S500
1PM
S700
1E
179
211
228
31.2
27
3 82
2
60
65
65
10.5
84
.2
234
20.7
18
9 58
8
86,7
00
359,
000
713,
000
4,18
0 1,
900
1,21
0
STD
-O-W
-1.1
STD
-O-E
-28.
0Sa
turn
T15
00T
PM F
T4
150
150
4.97
12
2 60
50
1.
99
37.3
2.
9884
.7
48,6
00
156,
000
16,3
00
1,84
0
Exa
mpl
e N
O e
mis
sion
cal
cula
tions
are
giv
en i
n A
ppen
dix
A.
ax
Ref
eren
ced
to 1
5 pe
rcen
t ox
ygen
.b Fr
om T
able
6-5
.c
6-230
The uncontrolled and controlled NO emissions and the annualx
emission reductions for the model plants are shown in Table 6-6.
The emissions, in tons per year (tons/yr), were calculated as
shown in Appendix A.
The total annual cost was divided by the annual emission
reductions to determine the cost effectiveness for each model
plant. For continuous-duty natural gas-fired model plants, the
cost-effectiveness figures range from approximately $600 to
$2,100 per ton of NO removed for water injection, and decreasex
to approximately $400 to $1,850 per ton for steam injection. The
lower range of cost-effectiveness figures for steam injection is
primarily due to the greater NO reduction achieved with steamx
injection. For continuous-duty oil-fired model plants, the cost
effectiveness ranges from approximately $675 to $1,750 per ton of
NO removed, which is comparable to figures for gas-fired modelx
plants. The cost-effectiveness figures are higher for gas
turbines with lower power outputs because the fixed capital costs
associated with wet injection system installation have the
greatest impact on the smaller gas turbines.
Cost-effectiveness figures increase as annual operating
hours decrease. For turbines operating 2,000 hr/yr, the cost-
effectiveness figures are two to nearly three times higher than
those for continuous-duty model plants, and increase further for
model plants operating 1,000 hr/yr. For the oil-in-water
emulsion model plant, the cost effectiveness corresponding to
1,000 annual operating hours is $1,840/ton of NO removed. Nox
data were available to prepare a conventional water injection
model plant for this turbine to compare the relative cost-
effectiveness values.

6-231

6-232
b. LOW-NO COMBUSTORSx
Incremental capital costs for low-NO combustors relative tox
standard designs for new applications were provided by three
manufacturers for several turbines. Based on information3,14,26
from the manufacturers, the performance and maintenance
requirements for a low-NO combustor are expected to be the samex
as for a standard combustor, and so the only annual cost
associated with low-NO combustors is the capital recovery. Thex
capital recovery factor is 0.1315, assuming a life of 15 years
and an interest rate of 10 percent.

6-233
Table 6-7
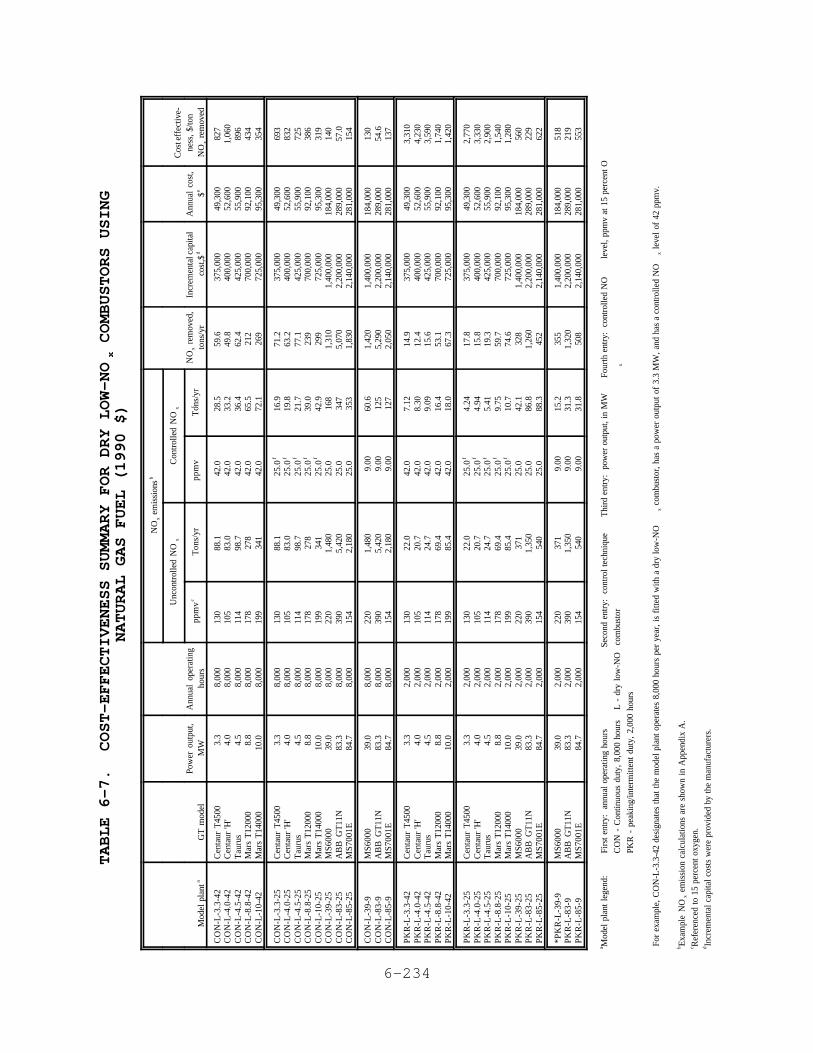
6-234
TABLE 6-7. COST-EFFECTIVENESS SUMMARY FOR DRY LOW-NO
COMBUSTORS USING
xNATURAL GAS FUEL (1990 $)
Mod
el p
lant
aG
T m
odel
Pow
er o
utpu
t,M
WA
nnua
l op
erat
ing
hour
s
NO
em
issi
ons
xb
NO
rem
oved
,x to
ns/y
rIn
crem
enta
l cap
ital
cost
,$d
Ann
ual
cost
,$e
Cos
t eff
ectiv
e-ne
ss, $
/ton
NO
rem
oved
x
Unc
ontr
olle
d N
Ox
Con
trol
led
NO
x
ppm
vc
Ton
s/yr
ppm
vc
Ton
s/yr
CO
N-L
-3.3
-42
CO
N-L
-4.0
-42
CO
N-L
-4.5
-42
CO
N-L
-8.8
-42
CO
N-L
-10-
42
Cen
taur
T45
00C
enta
ur 'H
'T
auru
sM
ars
T12
000
Mar
s T
1400
0
3.3
4.0
4.5
8.8
10.0
8,00
0 8,
000
8,00
0 8,
000
8,00
0
130
105
114
178
199
88.1
83
.0
98.7
27
8 34
1
42.0
42
.0
42.0
42
.0
42.0
28.5
33
.2
36.4
65
.5
72.1
59.6
49
.8
62.4
21
2 26
9
375,
000
400,
000
425,
000
700,
000
725,
000
49,3
00
52,6
00
55,9
00
92,1
00
95,3
00
827
1,06
0 89
6 43
4 35
4
CO
N-L
-3.3
-25
CO
N-L
-4.0
-25
CO
N-L
-4.5
-25
CO
N-L
-8.8
-25
CO
N-L
-10-
25C
ON
-L-3
9-25
CO
N-L
-83-
25C
ON
-L-8
5-25
Cen
taur
T45
00C
enta
ur 'H
'T
auru
sM
ars
T12
000
Mar
s T
1400
0M
S600
0A
BB
GT
11N
MS7
001E
3.3
4.0
4.5
8.8
10.0
39
.0
83.3
84
.7
8,00
0 8,
000
8,00
0 8,
000
8,00
0 8,
000
8,00
0 8,
000
130
105
114
178
199
220
390
154
88.1
83
.0
98.7
27
8 34
1 1,
480
5,42
0 2,
180
25.0
f
25.0
f
25.0
f
25.0
f
25.0
f
25.0
25
.0
25.0
16.9
19
.8
21.7
39
.0
42.9
16
8 34
7 35
3
71.2
63
.2
77.1
23
9 29
9 1,
310
5,07
0 1,
830
375,
000
400,
000
425,
000
700,
000
725,
000
1,40
0,00
0 2,
200,
000
2,14
0,00
0
49,3
00
52,6
00
55,9
00
92,1
00
95,3
00
184,
000
289,
000
281,
000
693
832
725
386
319
140
57.0
15
4
CO
N-L
-39-
9C
ON
-L-8
3-9
CO
N-L
-85-
9
MS6
000
AB
B G
T11
NM
S700
1E
39.0
83
.3
84.7
8,00
0 8,
000
8,00
0
220
390
154
1,48
0 5,
420
2,18
0
9.00
9.
00
9.00
60.6
12
5 12
7
1,42
0 5,
290
2,05
0
1,40
0,00
0 2,
200,
000
2,14
0,00
0
184,
000
289,
000
281,
000
130
54.6
13
7
PKR
-L-3
.3-4
2PK
R-L
-4.0
-42
PKR
-L-4
.5-4
2PK
R-L
-8.8
-42
PKR
-L-1
0-42
Cen
taur
T45
00C
enta
ur 'H
'T
auru
sM
ars
T12
000
Mar
s T
1400
0
3.3
4.0
4.5
8.8
10.0
2,00
0 2,
000
2,00
0 2,
000
2,00
0
130
105
114
178
199
22.0
20
.7
24.7
69
.4
85.4
42.0
42
.0
42.0
42
.0
42.0
7.12
8.
30
9.09
16
.4
18.0
14.9
12
.4
15.6
53
.1
67.3
375,
000
400,
000
425,
000
700,
000
725,
000
49,3
00
52,6
00
55,9
00
92,1
00
95,3
00
3,31
0 4,
230
3,59
0 1,
740
1,42
0
PKR
-L-3
.3-2
5PK
R-L
-4.0
-25
PKR
-L-4
.5-2
5PK
R-L
-8.8
-25
PKR
-L-1
0-25
PKR
-L-3
9-25
PKR
-L-8
3-25
PKR
-L-8
5-25
Cen
taur
T45
00C
enta
ur 'H
'T
auru
sM
ars
T12
000
Mar
s T
1400
0M
S600
0A
BB
GT
11N
MS7
001E
3.3
4.0
4.5
8.8
10.0
39
.0
83.3
84
.7
2,00
0 2,
000
2,00
0 2,
000
2,00
0 2,
000
2,00
0 2,
000
130
105
114
178
199
220
390
154
22.0
20
.7
24.7
69
.4
85.4
37
1 1,
350
540
25.0
f
25.0
f
25.0
f
25.0
f
25.0
f
25.0
25
.0
25.0
4.24
4.
94
5.41
9.
75
10.7
42
.1
86.8
88
.3
17.8
15
.8
19.3
59
.7
74.6
32
8 1,
260
452
375,
000
400,
000
425,
000
700,
000
725,
000
1,40
0,00
0 2,
200,
000
2,14
0,00
0
49,3
00
52,6
00
55,9
00
92,1
00
95,3
00
184,
000
289,
000
281,
000
2,77
0 3,
330
2,90
0 1,
540
1,28
0 56
0 22
9 62
2
*PK
R-L
-39-
9PK
R-L
-83-
9PK
R-L
-85-
9
MS6
000
AB
B G
T11
NM
S700
1E
39.0
83
.3
84.7
2,00
0 2,
000
2,00
0
220
390
154
371
1,35
0 54
0
9.00
9.
00
9.00
15.2
31
.3
31.8
355
1,32
0 50
8
1,40
0,00
0 2,
200,
000
2,14
0,00
0
184,
000
289,
000
281,
000
518
219
553
Mod
el p
lant
leg
end:
Firs
t en
try:
an
nual
ope
ratin
g ho
urs
Seco
nd e
ntry
: c
ontr
ol t
echn
ique
T
hird
ent
ry:
pow
er o
utpu
t, in
MW
Fo
urth
ent
ry:
cont
rolle
d N
O l
evel
, ppm
v at
15
perc
ent O
a
CO
N -
Con
tinuo
us d
uty,
8,0
00 h
ours
L
- d
ry l
ow-N
O c
ombu
stor
x
PKR
- p
eaki
ng/in
term
itten
t du
ty,
2,00
0 ho
urs
For
exa
mpl
e, C
ON
-L-3
.3-4
2 de
sign
ates
tha
t th
e m
odel
pla
nt o
pera
tes
8,00
0 ho
urs
per
year
, is
fitte
d w
ith a
dry
low
-NO
com
bust
or, h
as a
pow
er o
utpu
t of
3.3
MW
, and
has
a c
ontr
olle
d N
O l
evel
of
42 p
pmv.
xx
Exa
mpl
e N
O e
mis
sion
cal
cula
tions
are
sho
wn
in A
ppen
dix
A.
bx
Ref
eren
ced
to 1
5 pe
rcen
t ox
ygen
.c In
crem
enta
l cap
ital c
osts
wer
e pr
ovid
ed b
y th
e m
anuf
actu
rers
.d
6-235
presents the uncontrolled and controlled emission levels, the
annual emission reductions, incremental costs for a low-NOx
combustor over a conventional design, and the cost effectiveness
of low-NO combustors for all gas turbine models for whichx
sufficient data were available. Cost-effectiveness figures were
calculated for 8,000 and 2,000 hours of operation annually, using
controlled NO emission levels of 42, 25, and 9 parts perx
million, by volume (ppmv), referenced to 15 percent oxygen, which
are the achievable levels stated by the turbine manufacturers.
The cost effectiveness varies according to the uncontrolled NOx
emission level for the conventional combustor design and the
achievable controlled emission level for the low-NO design. Forx
continuous-duty applications, cost effectiveness for a controlled
NO emission level of 42 ppmv ranges from $353 to $1,060 per tonx
of NO removed. The cost-effectiveness range decreases to $57 tox
$832 per ton of NO removed for a controlled NO emission levelx x
of 25 ppmv and decreases further to $55 to $137 per ton of NOx
removed for a 9 ppmv control level. In all cases, the cost
effectiveness increases as the operating hours decrease. In
general, the cost effectiveness is higher for smaller gas
turbines than for larger turbines due to the relatively higher
capital cost per kW for low-NO combustors for smaller turbines. x
The cost-effectiveness range is lower for low-NO combustorsx
than for water or steam injection because the total annual costs
are lower and, in some cases, the controlled emission levels are
6-236
also lower. According to two turbine manufacturers, retrofit
costs are 40 to 60 percent greater than the incremental costs
shown in Table 6-7 for new installations. 3,14
c. SELECTIVE CATALYTIC REDUCTION
The costs for SCR for new installations were estimated for
all model plants. Retrofit costs for SCR were not available but
could be considerably higher than the costs shown for new
installations, especially in applications where an existing heat
recovery steam generator (HRSG) would have to be moved, modified,
or replaced to accommodate the addition of a catalyst reactor.
To date, most gas turbine SCR applications use a base metal
catalyst with an operating temperature range that requires
cooling of the exhaust gas from the turbine. For this reason,
SCR applications to date have been limited to combined cycle or
cogeneration applications that include an HRSG, which serves to
cool the exhaust gas to temperatures compatible with the
catalyst. The introduction of high-temperature zeolite
catalysts, however, makes it possible to install the catalyst
directly downstream of the turbine, and therefore feasible to
use SCR with simple-cycle applications as well as heat recovery
applications. As discussed in Section 5.3.2, to date there is at
least one gas turbine installation with a high-temperature
zeolite catalyst installed downstream of the turbine and upstream
of an HRSG. At present, no identified SCR systems are installed
in simple-cycle gas turbine applications.
An overview of the procedures used to estimate capital and
annual costs are described in Sections 6.3.1 and 6.3.2,
respectively; a detailed cost algorithm is presented in
Appendix B. The emission reduction and cost-effectiveness
calculations are described in Section 6.3.3.
i. Capital Costs
Five documents in the technical literature contained SCR
capital costs for 21 gas turbine facilities. Most of these
documents presented costs that were obtained from vendors, but
some may have also developed at least some costs based on their
own experiences. Most of the documents presented only the27-31
6-237
total capital costs, not costs for individual components, and
they did not provide complete descriptions of what the costs
included. These costs were plotted on a graph of total capital
costs versus gas turbine size. To this graph were added
estimates of total installed costs for a high-temperature
catalyst SCR system for installation upstream of the HRSG for
four turbine installations ranging in size from 4.5 to 83 MW
(6,030 to 111,000 hp). These high-temperature SCR system
estimates include the catalyst reactor, air injection system for
exhaust temperature control, ammonia storage and injection
system, instrumentation, and continuous emission monitoring
equipment. These SCR costs were estimated by the California Air
Resources Board (CARB) in 1991 dollars and are based on NOx
emission levels of 42 ppmv into and 9 ppmv out of the SCR. 35
These estimated costs, shown in Appendix B, fit well within the
range of costs from the 21 installations discussed above, and the
equation of a line determined by linear regression adequately
fits the data (R = 0.76) for all 25 points. Based on this2
graph, the total capital cost for either a base-metal SCR system
installed within the HRSG or a high-temperature zeolite catalyst
SCR system installed directly downstream of the turbine can be
calculated using the equation determined by the linear
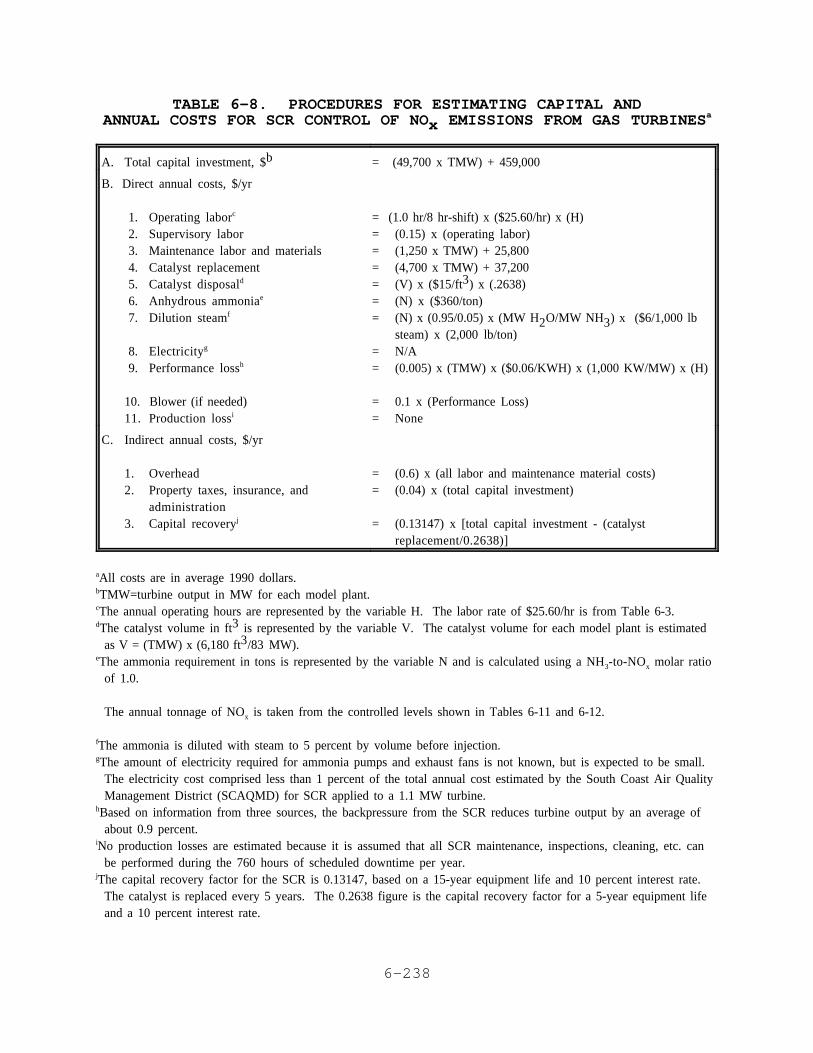
6-238
TABLE 6-8. PROCEDURES FOR ESTIMATING CAPITAL ANDANNUAL COSTS FOR SCR CONTROL OF NO EMISSIONS FROM GAS TURBINESx
a
A. Total capital investment, $b = (49,700 x TMW) + 459,000
B. Direct annual costs, $/yr
1. Operating laborc
2. Supervisory labor 3. Maintenance labor and materials 4. Catalyst replacement 5. Catalyst disposald
6. Anhydrous ammoniae
7. Dilution steamf
8. Electricityg
9. Performance lossh
10. Blower (if needed)11. Production lossi
= (1.0 hr/8 hr-shift) x ($25.60/hr) x (H)= (0.15) x (operating labor)= (1,250 x TMW) + 25,800= (4,700 x TMW) + 37,200= (V) x ($15/ft ) x (.2638)3
= (N) x ($360/ton)= (N) x (0.95/0.05) x (MW H O/MW NH ) x ($6/1,000 lb2 3
steam) x (2,000 lb/ton)= N/A= (0.005) x (TMW) x ($0.06/KWH) x (1,000 KW/MW) x (H)
= 0.1 x (Performance Loss)= None
C. Indirect annual costs, $/yr
1. Overhead2. Property taxes, insurance, and
administration3. Capital recoveryj
= (0.6) x (all labor and maintenance material costs)= (0.04) x (total capital investment)
= (0.13147) x [total capital investment - (catalystreplacement/0.2638)]
All costs are in average 1990 dollars.a
TMW=turbine output in MW for each model plant.b
The annual operating hours are represented by the variable H. The labor rate of $25.60/hr is from Table 6-3.c
The catalyst volume in ft is represented by the variable V. The catalyst volume for each model plant is estimatedd 3
as V = (TMW) x (6,180 ft /83 MW).3
The ammonia requirement in tons is represented by the variable N and is calculated using a NH -to-NO molar ratioe3 x
of 1.0.
The annual tonnage of NO is taken from the controlled levels shown in Tables 6-11 and 6-12.x
The ammonia is diluted with steam to 5 percent by volume before injection.f
The amount of electricity required for ammonia pumps and exhaust fans is not known, but is expected to be small. g
The electricity cost comprised less than 1 percent of the total annual cost estimated by the South Coast Air QualityManagement District (SCAQMD) for SCR applied to a 1.1 MW turbine.
Based on information from three sources, the backpressure from the SCR reduces turbine output by an average ofh
about 0.9 percent. No production losses are estimated because it is assumed that all SCR maintenance, inspections, cleaning, etc. cani
be performed during the 760 hours of scheduled downtime per year.The capital recovery factor for the SCR is 0.13147, based on a 15-year equipment life and 10 percent interest rate. j
The catalyst is replaced every 5 years. The 0.2638 figure is the capital recovery factor for a 5-year equipment lifeand a 10 percent interest rate.

6-239
regression. This equation is shown in Table 6-8 and was used to
calculate the total capital investment for SCR for each model
plant shown in Tables 6-9 and 6-10.
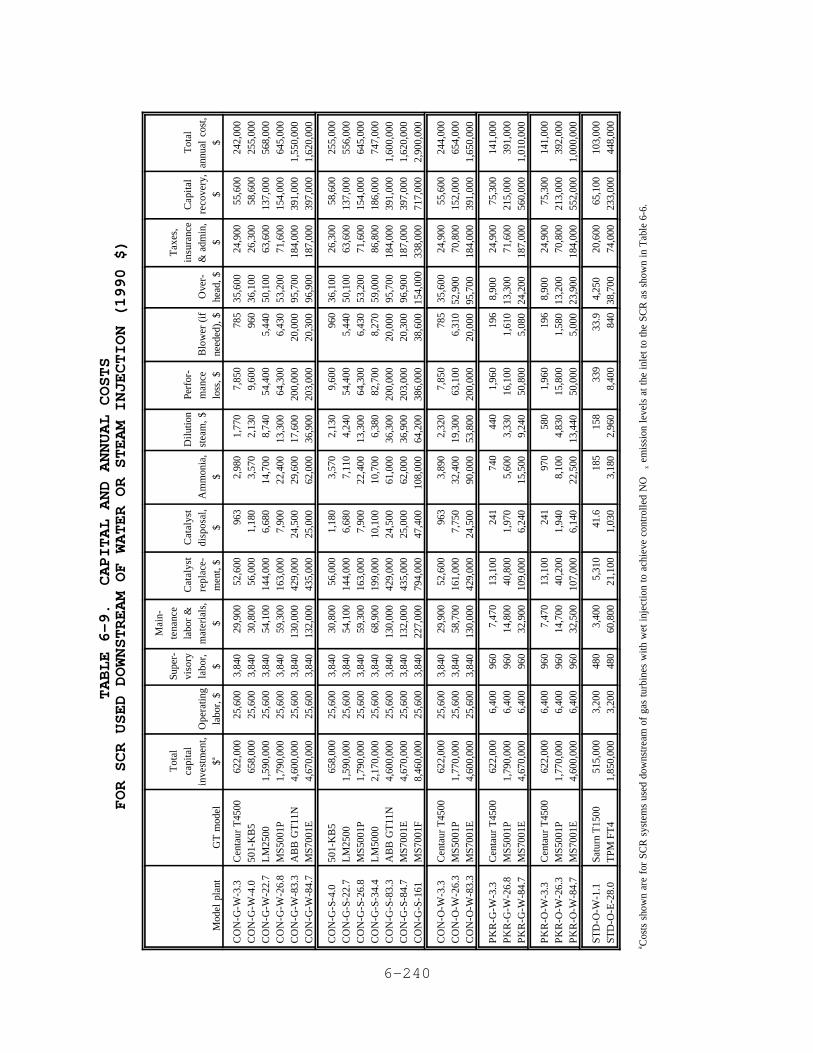
6-240
TABLE 6-9. CAPITAL AND ANNUAL COSTS
FOR SCR USED DOWNSTREAM OF WATER OR STEAM INJECTION (1990 $)
Mod
el p
lant
GT
mod
el
Tot
alca
pita
lin
vest
men
t,$a
Ope
ratin
gla
bor,
$
Supe
r-vi
sory
labo
r,$
Mai
n-te
nanc
ela
bor
&m
ater
ials
,$
Cat
alys
tre
plac
e-m
ent,
$
Cat
alys
tdi
spos
al,
$A
mm
onia
,$
Dil
utio
nst
eam
, $Pe
rfor
-m
ance
loss
, $
Blo
wer
(if
need
ed),
$O
ver-
head
, $
Tax
es,
insu
ranc
e&
adm
in,
$
Cap
ital
reco
very
,$
Tot
alan
nual
cos
t,$
CO
N-G
-W-3
.3C
ON
-G-W
-4.0
CO
N-G
-W-2
2.7
CO
N-G
-W-2
6.8
CO
N-G
-W-8
3.3
CO
N-G
-W-8
4.7
Cen
taur
T45
0050
1-K
B5
LM
2500
MS5
001P
AB
B G
T11
NM
S700
1E
622,
000
658,
000
1,59
0,00
0 1,
790,
000
4,60
0,00
0 4,
670,
000
25,6
00
25,6
00
25,6
00
25,6
00
25,6
00
25,6
00
3,84
0 3,
840
3,84
0 3,
840
3,84
0 3,
840
29,9
00
30,8
00
54,1
00
59,3
00
130,
000
132,
000
52,6
00
56,0
00
144,
000
163,
000
429,
000
435,
000
963
1,18
0 6,
680
7,90
0 24
,500
25
,000
2,98
0 3,
570
14,7
00
22,4
00
29,6
00
62,0
00
1,77
0 2,
130
8,74
0 13
,300
17
,600
36
,900
7,85
0 9,
600
54,4
00
64,3
00
200,
000
203,
000
785
960
5,44
0 6,
430
20,0
00
20,3
00
35,6
0036
,100
50,1
0053
,200
95,7
0096
,900
24,9
00
26,3
00
63,6
00
71,6
00
184,
000
187,
000
55,6
00
58,6
00
137,
000
154,
000
391,
000
397,
000
242,
000
255,
000
568,
000
645,
000
1,55
0,00
0 1,
620,
000
CO
N-G
-S-4
.0C
ON
-G-S
-22.
7C
ON
-G-S
-26.
8C
ON
-G-S
-34.
4C
ON
-G-S
-83.
3C
ON
-G-S
-84.
7C
ON
-G-S
-161
501-
KB
5L
M25
00M
S500
1PL
M50
00A
BB
GT
11N
MS7
001E
MS7
001F
658,
000
1,59
0,00
0 1,
790,
000
2,17
0,00
0 4,
600,
000
4,67
0,00
0 8,
460,
000
25,6
00
25,6
00
25,6
00
25,6
00
25,6
00
25,6
00
25,6
00
3,84
0 3,
840
3,84
0 3,
840
3,84
0 3,
840
3,84
0
30,8
00
54,1
00
59,3
00
68,9
00
130,
000
132,
000
227,
000
56,0
00
144,
000
163,
000
199,
000
429,
000
435,
000
794,
000
1,18
0 6,
680
7,90
0 10
,100
24
,500
25
,000
47
,400
3,57
0 7,
110
22,4
00
10,7
00
61,0
00
62,0
00
108,
000
2,13
0 4,
240
13,3
00
6,38
0 36
,300
36
,900
64
,200
9,60
0 54
,400
64
,300
82
,700
20
0,00
0 20
3,00
0 38
6,00
0
960
5,44
0 6,
430
8,27
0 20
,000
20
,300
38
,600
36,1
0050
,100
53,2
0059
,000
95,7
0096
,900
154,
000
26,3
00
63,6
00
71,6
00
86,8
00
184,
000
187,
000
338,
000
58,6
00
137,
000
154,
000
186,
000
391,
000
397,
000
717,
000
255,
000
556,
000
645,
000
747,
000
1,60
0,00
0 1,
620,
000
2,90
0,00
0
CO
N-O
-W-3
.3C
ON
-O-W
-26.
3C
ON
-O-W
-83.
3
Cen
taur
T45
00M
S500
1PM
S700
1E
622,
000
1,77
0,00
0 4,
600,
000
25,6
00
25,6
00
25,6
00
3,84
0 3,
840
3,84
0
29,9
00
58,7
00
130,
000
52,6
00
161,
000
429,
000
963
7,75
0 24
,500
3,89
0 32
,400
90
,000
2,32
0 19
,300
53
,800
7,85
0 63
,100
20
0,00
0
785
6,31
0 20
,000
35,6
0052
,900
95
,700
24,9
00
70,8
00
184,
000
55,6
00
152,
000
391,
000
244,
000
654,
000
1,65
0,00
0
PK
R-G
-W-3
.3P
KR
-G-W
-26.
8P
KR
-G-W
-84.
7
Cen
taur
T45
00M
S500
1PM
S700
1E
622,
000
1,79
0,00
0 4,
670,
000
6,40
0 6,
400
6,40
0
960
960
960
7,47
0 14
,800
32
,900
13,1
00
40,8
00
109,
000
241
1,97
0 6,
240
740
5,60
0 15
,500
440
3,33
0 9,
240
1,96
0 16
,100
50
,800
196
1,61
0 5,
080
8,90
0 13
,300
24
,200
24,9
00
71,6
00
187,
000
75,3
00
215,
000
560,
000
141,
000
391,
000
1,01
0,00
0
PK
R-O
-W-3
.3P
KR
-O-W
-26.
3P
KR
-O-W
-84.
7
Cen
taur
T45
00M
S500
1PM
S700
1E
622,
000
1,77
0,00
0 4,
600,
000
6,40
0 6,
400
6,40
0
960
960
960
7,47
0 14
,700
32
,500
13,1
00
40,2
00
107,
000
241
1,94
0 6,
140
970
8,10
0 22
,500
580
4,83
0 13
,440
1,96
0 15
,800
50
,000
196
1,58
0 5,
000
8,90
0 13
,200
23
,900
24,9
00
70,8
00
184,
000
75,3
00
213,
000
552,
000
141,
000
392,
000
1,00
0,00
0
STD
-O-W
-1.1
STD
-O-E
-28.
0Sa
turn
T15
00T
PM F
T4
515,
000
1,85
0,00
0 3,
200
3,20
0 48
0 48
0 3,
400
60,8
00
5,31
0 21
,100
41
.6
1,03
0 18
5 3,
180
158
2,96
0 33
9 8,
400
33.9
84
0 4,
250
38,7
00
20,6
00
74,0
00
65,1
00
233,
000
103,
000
448,
000
Cos
ts s
how
n ar
e fo
r SC
R s
yste
ms
used
dow
nstr
eam
of
gas
turb
ines
with
wet
inj
ectio
n to
ach
ieve
con
trol
led
NO
em
issi
on l
evel
s at
the
inl
et t
o th
e SC
R a
s sh
own
in T
able
6-6
.a
x
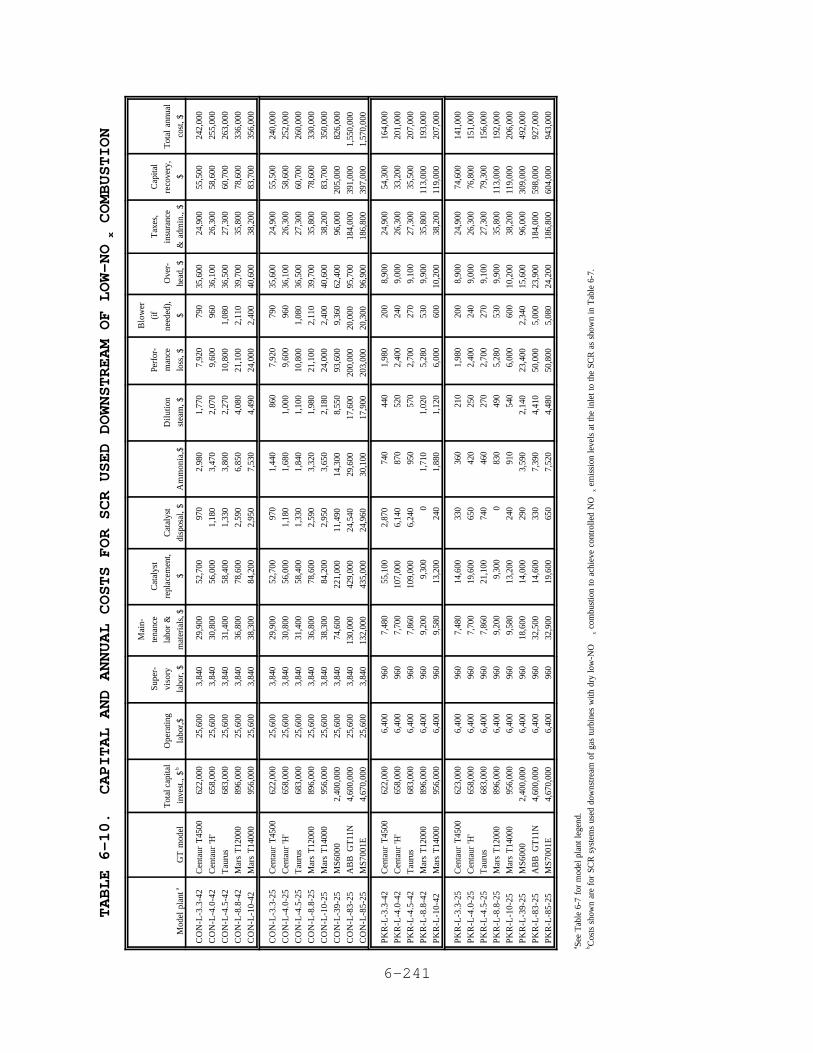
6-241
TABLE 6-10. CAPITAL AND ANNUAL COSTS FOR SCR USED DOWNSTREAM OF LOW-NO
COMBUSTION
x
Mod
el p
lant
aG
T m
odel
Tot
al c
apita
l
inve
st.,
$b
Ope
ratin
g
labo
r,$
Supe
r-
viso
ry
labo
r, $
Mai
n-
tena
nce
labo
r &
mat
eria
ls, $
Cat
alys
t
repl
acem
ent,
$
Cat
alys
t
disp
osal
, $
Am
mon
ia,$
Dil
utio
n
stea
m, $
Perf
or-
man
ce
loss
, $
Blo
wer
(if
need
ed),
$
Ove
r-
head
, $
Tax
es,
insu
ranc
e
& a
dmin
., $
Cap
ital
reco
very
,
$
Tot
al a
nnua
l
cost
, $
CO
N-L
-3.3
-42
CO
N-L
-4.0
-42
CO
N-L
-4.5
-42
CO
N-L
-8.8
-42
CO
N-L
-10-
42
Cen
taur
T45
00
Cen
taur
'H'
Tau
rus
Mar
s T
1200
0
Mar
s T
1400
0
622,
000
658,
000
683,
000
896,
000
956,
000
25,6
00
25,6
00
25,6
00
25,6
00
25,6
00
3,84
0
3,84
0
3,84
0
3,84
0
3,84
0
29,9
00
30,8
00
31,4
00
36,8
00
38,3
00
52,7
00
56,0
00
58,4
00
78,6
00
84,2
00
970
1,18
0
1,33
0
2,59
0
2,95
0
2,98
0
3,47
0
3,80
0
6,85
0
7,53
0
1,77
0
2,07
0
2,27
0
4,08
0
4,49
0
7,92
0
9,60
0
10,8
00
21,1
00
24,0
00
790
960
1,08
0
2,11
0
2,40
0
35,6
00
36,1
00
36,5
00
39,7
00
40,6
00
24,9
00
26,3
00
27,3
00
35,8
00
38,2
00
55,5
00
58,6
00
60,7
00
78,6
00
83,7
00
242,
000
255,
000
263,
000
336,
000
356,
000
CO
N-L
-3.3
-25
CO
N-L
-4.0
-25
CO
N-L
-4.5
-25
CO
N-L
-8.8
-25
CO
N-L
-10-
25
CO
N-L
-39-
25
CO
N-L
-83-
25
CO
N-L
-85-
25
Cen
taur
T45
00
Cen
taur
'H'
Tau
rus
Mar
s T
1200
0
Mar
s T
1400
0
MS6
000
AB
B G
T11
N
MS7
001E
622,
000
658,
000
683,
000
896,
000
956,
000
2,40
0,00
0
4,60
0,00
0
4,67
0,00
0
25,6
00
25,6
00
25,6
00
25,6
00
25,6
00
25,6
00
25,6
00
25,6
00
3,84
0
3,84
0
3,84
0
3,84
0
3,84
0
3,84
0
3,84
0
3,84
0
29,9
00
30,8
00
31,4
00
36,8
00
38,3
00
74,6
00
130,
000
132,
000
52,7
00
56,0
00
58,4
00
78,6
00
84,2
00
221,
000
429,
000
435,
000
970
1,18
0
1,33
0
2,59
0
2,95
0
11,4
90
24,5
40
24,9
60
1,44
0
1,68
0
1,84
0
3,32
0
3,65
0
14,3
00
29,6
00
30,1
00
860
1,00
0
1,10
0
1,98
0
2,18
0
8,55
0
17,6
00
17,9
00
7,92
0
9,60
0
10,8
00
21,1
00
24,0
00
93,6
00
200,
000
203,
000
790
960
1,08
0
2,11
0
2,40
0
9,36
0
20,0
00
20,3
00
35,6
00
36,1
00
36,5
00
39,7
00
40,6
00
62,4
00
95,7
00
96,9
00
24,9
00
26,3
00
27,3
00
35,8
00
38,2
00
96,0
00
184,
000
186,
800
55,5
00
58,6
00
60,7
00
78,6
00
83,7
00
205,
000
391,
000
397,
000
240,
000
252,
000
260,
000
330,
000
350,
000
826,
000
1,55
0,00
0
1,57
0,00
0
PKR
-L-3
.3-4
2
PKR
-L-4
.0-4
2
PKR
-L-4
.5-4
2
PKR
-L-8
.8-4
2
PKR
-L-1
0-42
Cen
taur
T45
00
Cen
taur
'H'
Tau
rus
Mar
s T
1200
0
Mar
s T
1400
0
622,
000
658,
000
683,
000
896,
000
956,
000
6,40
0
6,40
0
6,40
0
6,40
0
6,40
0
960
960
960
960
960
7,48
0
7,70
0
7,86
0
9,20
0
9,58
0
55,1
00
107,
000
109,
000
9,30
0
13,2
00
2,87
0
6,14
0
6,24
0 0
240
740
870
950
1,71
0
1,88
0
440
520
570
1,02
0
1,12
0
1,98
0
2,40
0
2,70
0
5,28
0
6,00
0
200
240
270
530
600
8,90
0
9,00
0
9,10
0
9,90
0
10,2
00
24,9
00
26,3
00
27,3
00
35,8
00
38,2
00
54,3
00
33,2
00
35,5
00
113,
000
119,
000
164,
000
201,
000
207,
000
193,
000
207,
000
PKR
-L-3
.3-2
5
PKR
-L-4
.0-2
5
PKR
-L-4
.5-2
5
PKR
-L-8
.8-2
5
PKR
-L-1
0-25
PKR
-L-3
9-25
PKR
-L-8
3-25
PKR
-L-8
5-25
Cen
taur
T45
00
Cen
taur
'H'
Tau
rus
Mar
s T
1200
0
Mar
s T
1400
0
MS6
000
AB
B G
T11
N
MS7
001E
623,
000
658,
000
683,
000
896,
000
956,
000
2,40
0,00
0
4,60
0,00
0
4,67
0,00
0
6,40
0
6,40
0
6,40
0
6,40
0
6,40
0
6,40
0
6,40
0
6,40
0
960
960
960
960
960
960
960
960
7,48
0
7,70
0
7,86
0
9,20
0
9,58
0
18,6
00
32,5
00
32,9
00
14,6
00
19,6
00
21,1
00
9,30
0
13,2
00
14,0
00
14,6
00
19,6
00
330
650
740 0
240
290
330
650
360
420
460
830
910
3,59
0
7,39
0
7,52
0
210
250
270
490
540
2,14
0
4,41
0
4,48
0
1,98
0
2,40
0
2,70
0
5,28
0
6,00
0
23,4
00
50,0
00
50,8
00
200
240
270
530
600
2,34
0
5,00
0
5,08
0
8,90
0
9,00
0
9,10
0
9,90
0
10,2
00
15,6
00
23,9
00
24,2
00
24,9
00
26,3
00
27,3
00
35,8
00
38,2
00
96,0
00
184,
000
186,
800
74,6
00
76,8
00
79,3
00
113,
000
119,
000
309,
000
598,
000
604,
000
141,
000
151,
000
156,
000
192,
000
206,
000
492,
000
927,
000
943,
000
See
Tab
le 6
-7 f
or m
odel
pla
nt le
gend
.a C
osts
sho
wn
are
for
SCR
sys
tem
s us
ed d
owns
trea
m o
f ga
s tu
rbin
es w
ith d
ry lo
w-N
O c
ombu
stio
n to
ach
ieve
con
trol
led
NO
em
issi
on le
vels
at t
he in
let t
o th
e SC
R a
s sh
own
in T
able
6-7
.b
xx
6-242
ii. Annual Costs
Total annual costs for SCR control were developed following
standard EPA procedures described in the OAQPS Control Cost
Manual for other types of add-on air pollution control devices
(APCD's). Information about annual costs was obtained from the
same sources that provided capital costs. Total annual costs27-31
consist of direct and indirect costs; parameters that make up
these categories and the equations for estimating the costs are

6-243

6-244
6-245
presented in Table 6-8 and are discussed below. The annual costs
are shown in Tables 6-9 and 6-10 for injection and dry low-NOx
combustion, respectively, for each of the model plants.
(1) Operating and Supervisory Labor. Information about
operating labor requirements was unavailable. Most facilities
have fully automated controls and monitoring/recording equipment,
which minimizes operator attention. Therefore, it was assumed
that 1 hr of operator attention would be required during an 8-hr
shift, regardless of turbine size. This operating labor
requirement is at the low end of the range recommended in the
OAQPS Control Cost Manual for other types of APCD's. Operator7
wage rates were estimated to be $25.60/hr in 1990, based on
escalating the costs presented in Reference 2 by 5 percent per
year to account for inflation. Supervisory labor costs were
estimated to be 15 percent of the operating labor costs,
consistent with the OAQPS Control Cost Manual.
(2) Maintenance Labor and Materials. Combined maintenance
labor and materials costs for 14 facilities were obtained from
four articles, but almost half of the data (6 facilities) were
provided by one source. The costs were escalated to 199027-30
dollars assuming an inflation rate of 5 percent per year. All of
the data are for facilities that burn natural gas. Provided that
ammonium salt formation is avoided by limiting ammonia slip and
sulfur content, the cost for operation with natural gas should
also apply for distillate oil fuel. Therefore, it was assumed32
that the cost data also apply to SCR control for turbines that
fire distillate oil fuel. The costs were plotted versus the
turbine size, and least-squares linear regression was used to
determine the equation of the line through the data (see
Appendix B). This equation, shown in Table 6-8, was used to
estimate the maintenance labor and materials costs shown in
Table 6-9 for the model plants.
(3) Catalyst Replacement. Replacement costs were obtained
for nine gas turbine facilities, and combined replacement and
disposal costs were obtained for another six gas turbine
facilities. The disposal costs were estimated for the six27-30
6-246
facilities as described below and in Appendix B. The replacement
costs for these six facilities were then estimated by subtracting
the estimated disposal costs from the combined costs. A catalyst
life of 5 years was used. All replacement costs were escalated
to 1990 dollars assuming a 5 percent annual inflation rate.
The estimated 1990 replacement costs were plotted versus the
turbine size, and least-squares linear regression was used to
determine the equation of the line through the data (see
Appendix B). This equation is shown in Table 6-8 and was used to
estimate the catalyst replacement costs shown in Table 6-9 for
the model plants.
(4) Catalyst Disposal. Catalyst disposal costs were
estimated based on a unit disposal cost of $15/ft , which was3
obtained from a zeolite catalyst vendor. This cost was used32
for each model plant, but the disposal cost may in fact be higher
for catalysts that contain heavy metals and are classified as
hazardous wastes. The catalyst volume for each model plant was
estimated based on information about the catalyst volume for one
facility and the assumption that there is a direct relationship
between the catalyst volume and the turbine output (i.e., the
design space velocity is the same regardless of the SCR size).
At one facility, 175 m (6,180 ft ) of catalyst is used in the3 3
SCR with an 83 MW (111,000 hp) turbine. The disposal cost for33
this catalyst would be $92,700, using a cost of $15/ft . 3
(5) Ammonia. The annual ammonia (NH ) requirement is3
calculated from the annual NO reduction achieved by the SCRx
system. Based on an NH /NO molar ratio of 1.0, the annual3 x
ammonia requirement, in tons, would equal the annual NOx
reduction, in tons, multiplied by the ratio of the molecular
weights for NH and NO . Anhydrous ammonia with a unit cost of3 x
$360/ton was used. The equation to calculate the annual cost34,35
for ammonia is shown in Table 6-8.
(6) Dilution Steam. As indicated in Section 5.3.1, steam
is used to dilute the ammonia to about 5 percent by volume before
injection into the HRSG. According to the OAQPS Control Cost
6-247
Manual, the cost to produce steam, or to purchase it, is about
$6/1,000 lb.
(7) Electricity. Electricity requirements to operate such
equipment as ammonia pumps and ventilation fans is believed to be
small. For one facility, the cost of electricity to operate
these components was estimated to make up less than 1 percent of
the total annual cost, but it is not clear that the number and
size of the fans and pumps represent a typical installation. 27
This cost for electricity is expected to be minor, however, for
all installations and was not included in this analysis.
For high-temperature catalysts installed upstream of the
HRSG, a blower may be required to inject ambient air into the
exhaust to regulate the temperature and avoid temperature
excursions above the catalyst design temperature range. The cost
to operate the blower is calculated to be 10 percent of the fuel
penalty.35
(8) Performance Loss. The performance loss due to
backpressure from the SCR is approximately 0.5 percent of the
turbine's design output. To make up for this lost output, it34-36
was assumed that electricity would have to be purchased at a cost
of $0.06/kWH, as indicated in Table 6-3.
(9) Production Loss. No costs for production losses were
included in this analysis. It was assumed that scheduled
inspections, cleaning, and other maintenance will coincide with
the 760 hr/yr of expected or scheduled downtime. It should be
recognized that adding the SCR system increases the overall
system complexity and the probability of unscheduled outages.
This factor should be taken into account when considering the
addition of an SCR system.
(10) Overhead. Standard EPA procedures for estimating
annual control costs include overhead costs that are equal to
60 percent of all labor and maintenance material costs.
(11) Property Taxes, Insurance, and Administration.
According to standard EPA procedures for estimating annual
control costs, property taxes, insurance, and administration
6-248
costs are equal to 4 percent of the total capital investment for
the control system.
(12) Capital Recovery. The CRF for SCR was estimated to be
0.13147 based on the assumption that the equipment life is
15 years and the interest rate is 10 percent.
iii. Cost Effectiveness for SCR
As indicated in Section 5.4, virtually all gas turbine
installations using SCR to reduce NO emissions also incorporatex
wet injection or low-NO combustors. The NO emission levelsx x
into the SCR, therefore, were in all cases taken to be equal to
the controlled NO emission levels shown for these controlx
techniques in Tables 6-6 and 6-7. The most common controlled NOx
emission limit for gas-fired SCR applications is 9 ppmv,
referenced to 15 percent oxygen. The capital costs used in this
analysis are expected to correspond to SCR systems sized to
reduce controlled NO emissions ranging from 25 to 42 ppmv fromx
gas-fired turbines to a controlled level of approximately 9 ppmv
downstream of the SCR. Based on the controlled NO emissionx
limits established by the Northeast States for Coordinated Air
Use Management (NESCAUM), shown in Table 5-3, these SCR systems
would reduce NO emissions to 18 ppmv for oil-fired applications. x
Cost-effectiveness figures for SCR in this analysis are therefore
calculated based on controlled NO emission levels of 9 andx
18 ppmv, corrected to 15 percent oxygen, for gas- and oil-fired
SCR model plants, respectively.
Cost effectiveness for SCR used downstream of wet injection
or dry low-NO combustion is shown in Tables 6-11x
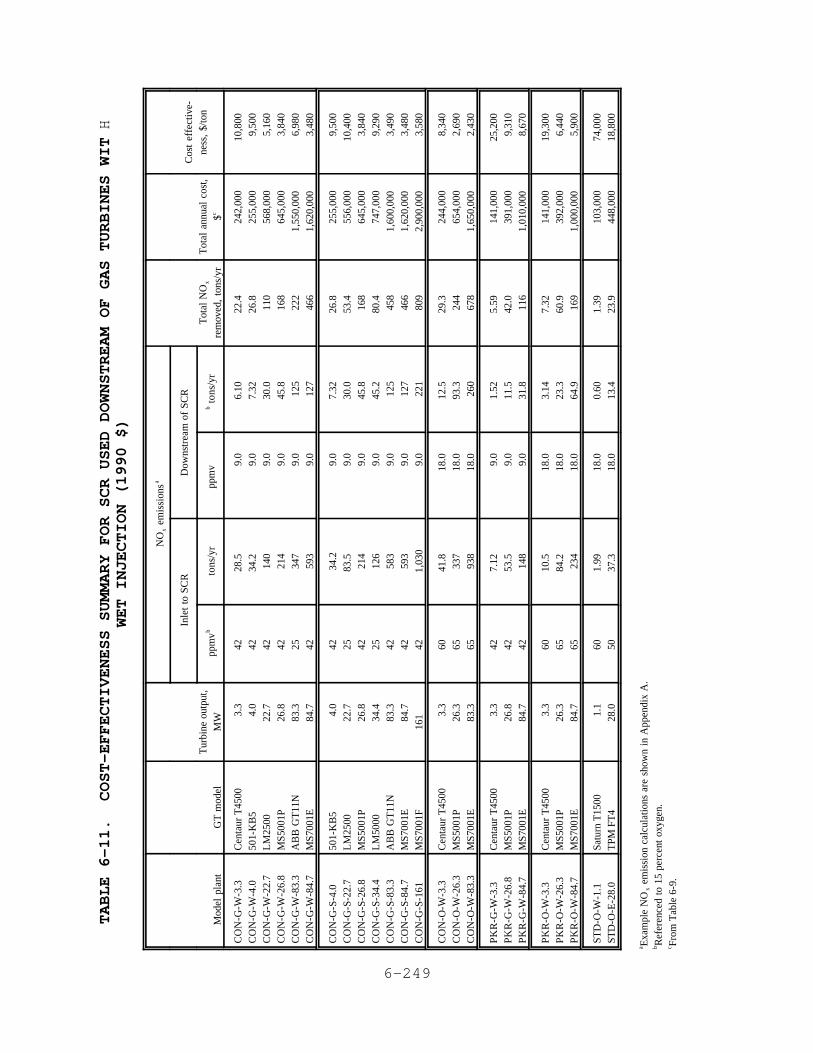
6-249
TABLE 6-11. COST-EFFECTIVENESS SUMMARY FOR SCR USED DOWNSTREAM OF GAS TURBINES WITH
WET INJECTION (1990 $)
Mod
el p
lant
GT
mod
elT
urbi
ne o
utpu
t,M
W
NO
em
issi
ons
xa
Tot
al N
Ox
rem
oved
, to
ns/y
rT
otal
ann
ual
cost
,$c
Cos
t ef
fect
ive-
ness
, $/
ton
Inle
t to
SC
RD
owns
trea
m o
f SC
R
ppm
vbto
ns/y
rpp
mv
bto
ns/y
r
CO
N-G
-W-3
.3C
ON
-G-W
-4.0
CO
N-G
-W-2
2.7
CO
N-G
-W-2
6.8
CO
N-G
-W-8
3.3
CO
N-G
-W-8
4.7
Cen
taur
T45
0050
1-K
B5
LM
2500
MS5
001P
AB
B G
T11
NM
S700
1E
3.3
4.0
22.7
26
.8
83.3
84
.7
42
42
42
42
25
42
28.5
34
.2
140
214
347
593
9.0
9.0
9.0
9.0
9.0
9.0
6.10
7.
32
30.0
45
.8
125
127
22.4
26
.8
110
168
222
466
242,
000
255,
000
568,
000
645,
000
1,55
0,00
0 1,
620,
000
10,8
00
9,50
0 5,
160
3,84
0 6,
980
3,48
0
CO
N-G
-S-4
.0C
ON
-G-S
-22.
7C
ON
-G-S
-26.
8C
ON
-G-S
-34.
4C
ON
-G-S
-83.
3C
ON
-G-S
-84.
7C
ON
-G-S
-161
501-
KB
5L
M25
00M
S500
1PL
M50
00A
BB
GT
11N
MS7
001E
MS7
001F
4.0
22.7
26
.8
34.4
83
.3
84.7
16
1
42
25
42
25
42
42
42
34.2
83.5
21
412
658
359
31,
030
9.0
9.0
9.0
9.0
9.0
9.0
9.0
7.32
30
.0
45.8
45
.2
125
127
221
26.8
53
.4
168
80.4
45
846
680
9
255,
000
556,
000
645,
000
747,
000
1,60
0,00
0 1,
620,
000
2,90
0,00
0
9,50
0 10
,400
3,
840
9,29
0 3,
490
3,48
0 3,
580
CO
N-O
-W-3
.3C
ON
-O-W
-26.
3C
ON
-O-W
-83.
3
Cen
taur
T45
00M
S500
1PM
S700
1E
3.3
26.3
83
.3
60
65
65
41.8
33
793
8
18.0
18
.0
18.0
12.5
93
.3
260
29.3
24
467
8
244,
000
654,
000
1,65
0,00
0
8,34
0 2,
690
2,43
0
PK
R-G
-W-3
.3P
KR
-G-W
-26.
8P
KR
-G-W
-84.
7
Cen
taur
T45
00M
S500
1PM
S700
1E
3.3
26.8
84
.7
42
42
42
7.12
53
.5
148
9.0
9.0
9.0
1.52
11
.5
31.8
5.59
42
.0
116
141,
000
391,
000
1,01
0,00
0
25,2
00
9,31
0 8,
670
PK
R-O
-W-3
.3P
KR
-O-W
-26.
3P
KR
-O-W
-84.
7
Cen
taur
T45
00M
S500
1PM
S700
1E
3.3
26.3
84
.7
60
65
65
10.5
84
.2
234
18.0
18
.0
18.0
3.14
23
.3
64.9
7.32
60
.9
169
141,
000
392,
000
1,00
0,00
0
19,3
00
6,44
0 5,
900
STD
-O-W
-1.1
STD
-O-E
-28.
0Sa
turn
T15
00T
PM F
T4
1.1
28.0
60
50
1.
99
37.3
18
.0
18.0
0.
60
13.4
1.
39
23.9
10
3,00
0 44
8,00
0 74
,000
18
,800
Exa
mpl
e N
O e
mis
sion
cal
cula
tions
are
sho
wn
in A
ppen
dix
A.
ax
Ref
eren
ced
to 1
5 pe
rcen
t ox
ygen
.b Fr
om T
able
6-9
.c
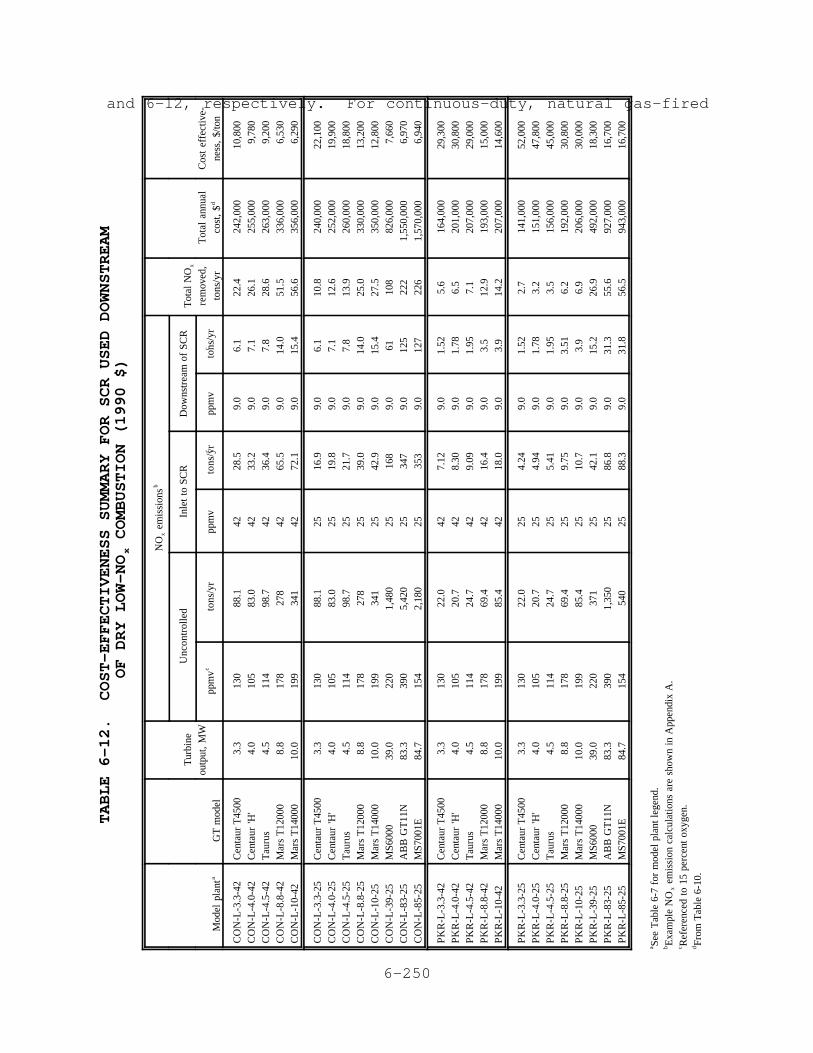
6-250
TABLE 6-12. COST-EFFECTIVENESS SUMMARY FOR SCR USED DOWNSTREAM
OF DRY LOW-NO COMBUSTION (1990 $)
x
Mod
el p
lant
aG
T m
odel
Tur
bine
outp
ut,
MW
NO
em
issi
ons
xb
Tot
al N
Ox
rem
oved
,to
ns/y
rT
otal
ann
ual
cost
, $d
Cos
t ef
fect
ive-
ness
, $/
ton
Unc
ontr
olle
dIn
let
to S
CR
Dow
nstr
eam
of
SCR
ppm
vcto
ns/y
rpp
mv
cto
ns/y
rpp
mv
cto
ns/y
r
CO
N-L
-3.3
-42
CO
N-L
-4.0
-42
CO
N-L
-4.5
-42
CO
N-L
-8.8
-42
CO
N-L
-10-
42
Cen
taur
T45
00C
enta
ur 'H
'T
auru
sM
ars
T12
000
Mar
s T
1400
0
3.3
4.0
4.5
8.8
10.0
130
105
114
178
199
88.1
83
.0
98.7
27
8 34
1
42
42
42
42
42
28.5
33
.2
36.4
65
.5
72.1
9.0
9.0
9.0
9.0
9.0
6.1
7.1
7.8
14.0
15
.4
22.4
26
.1
28.6
51
.5
56.6
242,
000
255,
000
263,
000
336,
000
356,
000
10,8
00
9,78
0 9,
200
6,53
0 6,
290
CO
N-L
-3.3
-25
CO
N-L
-4.0
-25
CO
N-L
-4.5
-25
CO
N-L
-8.8
-25
CO
N-L
-10-
25C
ON
-L-3
9-25
CO
N-L
-83-
25C
ON
-L-8
5-25
Cen
taur
T45
00C
enta
ur 'H
'T
auru
sM
ars
T12
000
Mar
s T
1400
0M
S600
0A
BB
GT
11N
MS7
001E
3.3
4.0
4.5
8.8
10.0
39
.0
83.3
84
.7
130
105
114
178
199
220
390
154
88.1
83
.0
98.7
27
8 34
1 1,
480
5,42
0 2,
180
25
25
25
25
25
25
25
25
16.9
19
.8
21.7
39
.0
42.9
16
8 34
7 35
3
9.0
9.0
9.0
9.0
9.0
9.0
9.0
9.0
6.1
7.1
7.8
14.0
15
.4
61
125
127
10.8
12
.6
13.9
25
.0
27.5
10
8 22
2 22
6
240,
000
252,
000
260,
000
330,
000
350,
000
826,
000
1,55
0,00
0 1,
570,
000
22,1
00
19,9
00
18,8
00
13,2
00
12,8
00
7,66
0 6,
970
6,94
0
PK
R-L
-3.3
-42
PK
R-L
-4.0
-42
PK
R-L
-4.5
-42
PK
R-L
-8.8
-42
PK
R-L
-10-
42
Cen
taur
T45
00C
enta
ur 'H
'T
auru
sM
ars
T12
000
Mar
s T
1400
0
3.3
4.0
4.5
8.8
10.0
130
105
114
178
199
22.0
20
.7
24.7
69
.4
85.4
42
42
42
42
42
7.12
8.
30
9.09
16
.4
18.0
9.0
9.0
9.0
9.0
9.0
1.52
1.
78
1.95
3.
5 3.
9
5.6
6.5
7.1
12.9
14
.2
164,
000
201,
000
207,
000
193,
000
207,
000
29,3
00
30,8
00
29,0
00
15,0
00
14,6
00
PK
R-L
-3.3
-25
PK
R-L
-4.0
-25
PK
R-L
-4.5
-25
PK
R-L
-8.8
-25
PK
R-L
-10-
25P
KR
-L-3
9-25
PK
R-L
-83-
25P
KR
-L-8
5-25
Cen
taur
T45
00C
enta
ur 'H
'T
auru
sM
ars
T12
000
Mar
s T
1400
0M
S600
0A
BB
GT
11N
MS7
001E
3.3
4.0
4.5
8.8
10.0
39
.0
83.3
84
.7
130
105
114
178
199
220
390
154
22.0
20
.7
24.7
69
.4
85.4
37
1 1,
350
540
25
25
25
25
25
25
25
25
4.24
4.
94
5.41
9.
75
10.7
42
.1
86.8
88
.3
9.0
9.0
9.0
9.0
9.0
9.0
9.0
9.0
1.52
1.
78
1.95
3.
51
3.9
15.2
31
.3
31.8
2.7
3.2
3.5
6.2
6.9
26.9
55
.6
56.5
141,
000
151,
000
156,
000
192,
000
206,
000
492,
000
927,
000
943,
000
52,0
00
47,8
00
45,0
00
30,8
00
30,0
00
18,3
00
16,7
00
16,7
00
See
Tab
le 6
-7 f
or m
odel
pla
nt le
gend
.a E
xam
ple
NO
em
issi
on c
alcu
latio
ns a
re s
how
n in
App
endi
x A
.b
x
Ref
eren
ced
to 1
5 pe
rcen
t ox
ygen
.c Fr
om T
able
6-1
0.d
and 6-12, respectively. For continuous-duty, natural gas-fired
6-251
model plants using water or steam injection,the cost
effectiveness for SCR ranges from approximately $3,500 to $10,800
per ton of NO removed. x
The cost-effectiveness range for SCR installed downstream of
continuous-duty, natural gas-fired turbines from 3 to 10 MW
(4,000 to 13,400 hp) using dry low-NO combustion is $6,290 tox
$10,800 per ton of NO removed for an inlet NO emission level ofx x
42 ppmv. The cost-effectiveness range for SCR increases for an

6-252
6-253
inlet NO emission level of 25 ppmv due to the lower NOx x
reduction efficiency. For an inlet NO level of 25 ppmv, thex
cost effectiveness ranges from $12,800 to $22,100 per ton of NOx
removed for 3 to 10 MW (4,000 to 13,400 hp) turbines and
decreases to $6,940 to $7,660 per ton of NO removed for largerx
turbines ranging from 39 to 85 MW (52,300 to 114,000 hp). As
these ranges indicate, the cost effectiveness for SCR is affected
by the inlet NO emission level and not the type of combustionx
control technique used for the turbine. The cost effectiveness
for continuous-duty, oil-fired model plants ranges from
approximately $2,450 to $8,350 per ton of NO removed. The SCRx
cost-effectiveness range for oil-fired applications is lower than
that for gas-fired installations in this cost analysis because
the same capital costs were used for both fuels (capital costs
were not available for applications using only distillate oil
fuel). The percent NO reduction for oil-fired applications isx
higher, so the resulting cost-effectiveness figures for oil-fired
applications are lower. It should be noted that this higher NOx
reduction for oil-fired applications may require a larger
catalyst reactor, at a higher capital cost. As a result, the
cost-effectiveness figures may actually be higher than those
shown in Table 6-11 for oil-fired applications.
The cost-effectiveness figures are higher for smaller gas
turbines because the fixed capital costs associated with the
installation of an SCR system have the greatest impact on smaller
gas turbines. Cost-effectiveness figures increase as annual
operating hours decrease. For turbines operating 2,000 hours per
year, cost-effectiveness figures are more than double those for
continuous-duty model plants, and they increase even further for
model plants operating 1,000 hr/yr.
Because virtually all SCR systems are installed downstream
of controlled gas turbines, combined cost-effectiveness figures
for wet injection plus SCR and also dry low-NO combustion plusx
SCR have been calculated and are shown in Tables 6-13
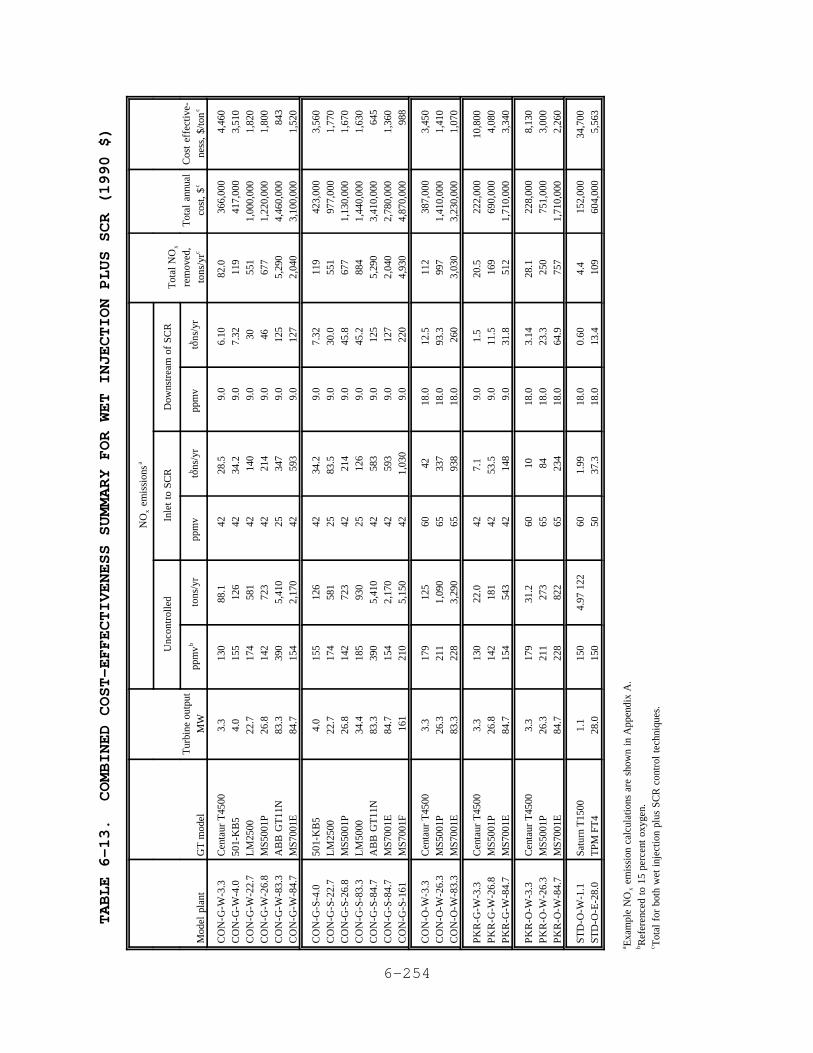
6-254
TABLE 6-13. COMBINED COST-EFFECTIVENESS SUMMARY FOR WET INJECTION PLUS SCR (1990 $)
Mod
el p
lant
GT
mod
elT
urbi
ne o
utpu
tM
W
NO
em
issi
ons
xa
Tot
al N
Ox
rem
oved
,to
ns/y
rc
Tot
al a
nnua
lco
st,
$c
Cos
t ef
fect
ive-
ness
, $/
ton
c
Unc
ontr
olle
dIn
let
to S
CR
Dow
nstr
eam
of
SCR
ppm
vbto
ns/y
rpp
mv
b tons
/yr
ppm
vb tons
/yr
CO
N-G
-W-3
.3C
ON
-G-W
-4.0
CO
N-G
-W-2
2.7
CO
N-G
-W-2
6.8
CO
N-G
-W-8
3.3
CO
N-G
-W-8
4.7
Cen
taur
T45
0050
1-K
B5
LM
2500
MS5
001P
AB
B G
T11
NM
S700
1E
3.3
4.0
22.7
26
.8
83.3
84
.7
130
155
174
142
390
154
88.1
12
658
172
35,
410
2,17
0
42
42
42
42
25
42
28.5
34
.2
140
214
347
593
9.0
9.0
9.0
9.0
9.0
9.0
6.10
7.
32
30 46 125
127
82.0
11
955
167
75,
290
2,04
0
366,
000
417,
000
1,00
0,00
0 1,
220,
000
4,46
0,00
0 3,
100,
000
4,46
0 3,
510
1,82
0 1,
800
843
1,52
0
CO
N-G
-S-4
.0C
ON
-G-S
-22.
7C
ON
-G-S
-26.
8C
ON
-G-S
-83.
3C
ON
-G-S
-84.
7C
ON
-G-S
-84.
7C
ON
-G-S
-161
501-
KB
5L
M25
00M
S500
1PL
M50
00A
BB
GT
11N
MS7
001E
MS7
001F
4.0
22.7
26
.8
34.4
83
.3
84.7
16
1
155
174
142
185
390
154
210
126
581
723
930
5,41
02,
170
5,15
0
42
25
42
25
42
42
42
34.2
83
.5
214
126
583
593
1,03
0
9.0
9.0
9.0
9.0
9.0
9.0
9.0
7.32
30
.0
45.8
45
.2
125
127
220
119
551
677
884
5,29
02,
040
4,93
0
423,
000
977,
000
1,13
0,00
0 1,
440,
000
3,41
0,00
0 2,
780,
000
4,87
0,00
0
3,56
0 1,
770
1,67
0 1,
630
645
1,36
0 98
8
CO
N-O
-W-3
.3C
ON
-O-W
-26.
3C
ON
-O-W
-83.
3
Cen
taur
T45
00M
S500
1PM
S700
1E
3.3
26.3
83
.3
179
211
228
125
1,09
03,
290
60
65
65
42 337
938
18.0
18
.0
18.0
12.5
93
.3
260
112
997
3,03
0
387,
000
1,41
0,00
0 3,
230,
000
3,45
0 1,
410
1,07
0
PK
R-G
-W-3
.3P
KR
-G-W
-26.
8P
KR
-G-W
-84.
7
Cen
taur
T45
00M
S500
1PM
S700
1E
3.3
26.8
84
.7
130
142
154
22.0
18
154
3
42
42
42
7.1
53.5
14
8
9.0
9.0
9.0
1.5
11.5
31
.8
20.5
16
951
2
222,
000
690,
000
1,71
0,00
0
10,8
00
4,08
0 3,
340
PK
R-O
-W-3
.3P
KR
-O-W
-26.
3P
KR
-O-W
-84.
7
Cen
taur
T45
00M
S500
1PM
S700
1E
3.3
26.3
84
.7
179
211
228
31.2
27
382
2
60
65
65
10 84 234
18.0
18
.0
18.0
3.14
23
.3
64.9
28.1
25
075
7
228,
000
751,
000
1,71
0,00
0
8,13
0 3,
000
2,26
0
STD
-O-W
-1.1
STD
-O-E
-28.
0Sa
turn
T15
00T
PM F
T4
1.1
28.0
15
0 15
0 4.
97 1
2260
50
1.
99
37.3
18
.0
18.0
0.
60
13.4
4.
4 10
915
2,00
0 60
4,00
0 34
,700
5,
563
Exa
mpl
e N
O e
mis
sion
cal
cula
tions
are
sho
wn
in A
ppen
dix
A.
ax
Ref
eren
ced
to 1
5 pe
rcen
t ox
ygen
.b T
otal
for
bot
h w
et i
njec
tion
plus
SC
R c
ontr
ol t
echn
ique
s.c
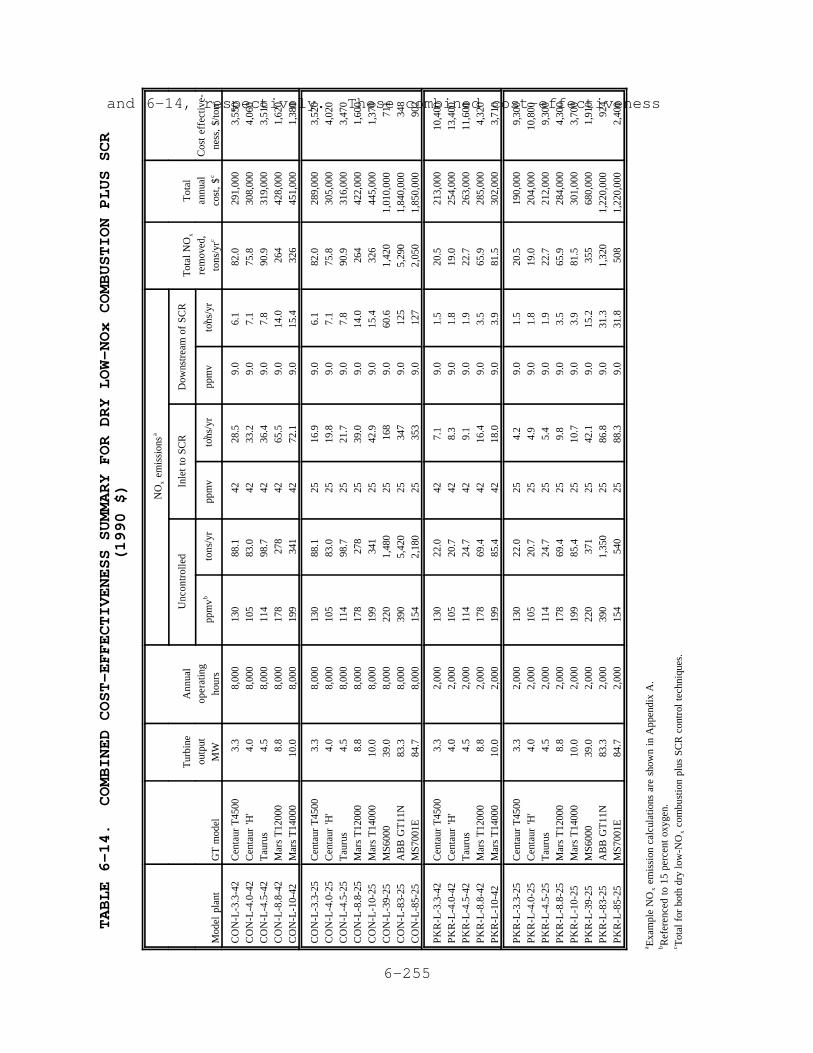
6-255
TABLE 6-14. COMBINED COST-EFFECTIVENESS SUMMARY FOR DRY LOW-NOx COMBUSTION PLUS SCR
(1990 $)
Mod
el p
lant
GT
mod
el
Tur
bine
outp
utM
W
Ann
ual
oper
atin
gho
urs
NO
em
issi
ons
xa
Tot
al N
Ox
rem
oved
,to
ns/y
rc
Tot
alan
nual
cost
, $c
Cos
t ef
fect
ive-
ness
, $/
ton
c
Unc
ontr
olle
dIn
let
to S
CR
Dow
nstr
eam
of
SCR
ppm
vbto
ns/y
rpp
mv
bto
ns/y
rpp
mv
bto
ns/y
r
CO
N-L
-3.3
-42
CO
N-L
-4.0
-42
CO
N-L
-4.5
-42
CO
N-L
-8.8
-42
CO
N-L
-10-
42
Cen
taur
T45
00C
enta
ur 'H
'T
auru
sM
ars
T12
000
Mar
s T
1400
0
3.3
4.0
4.5
8.8
10.0
8,00
0 8,
000
8,00
0 8,
000
8,00
0
130
105
114
178
199
88.1
83
.0
98.7
27
834
1
42
42
42
42
42
28.5
33
.2
36.4
65
.5
72.1
9.0
9.0
9.0
9.0
9.0
6.1
7.1
7.8
14.0
15
.4
82.0
75
.8
90.9
26
432
6
291,
000
308,
000
319,
000
428,
000
451,
000
3,55
0 4,
060
3,51
0 1,
620
1,38
0
CO
N-L
-3.3
-25
CO
N-L
-4.0
-25
CO
N-L
-4.5
-25
CO
N-L
-8.8
-25
CO
N-L
-10-
25C
ON
-L-3
9-25
CO
N-L
-83-
25C
ON
-L-8
5-25
Cen
taur
T45
00C
enta
ur 'H
'T
auru
sM
ars
T12
000
Mar
s T
1400
0M
S600
0A
BB
GT
11N
MS7
001E
3.3
4.0
4.5
8.8
10.0
39
.0
83.3
84
.7
8,00
0 8,
000
8,00
0 8,
000
8,00
0 8,
000
8,00
0 8,
000
130
105
114
178
199
220
390
154
88.1
83
.0
98.7
27
834
11,
480
5,42
02,
180
25
25
25
25
25
25
25
25
16.9
19
.8
21.7
39
.0
42.9
16
834
735
3
9.0
9.0
9.0
9.0
9.0
9.0
9.0
9.0
6.1
7.1
7.8
14.0
15
.4
60.6
12
512
7
82.0
75
.8
90.9
26
432
61,
420
5,29
02,
050
289,
000
305,
000
316,
000
422,
000
445,
000
1,01
0,00
0 1,
840,
000
1,85
0,00
0
3,52
0 4,
020
3,47
0 1,
600
1,37
0 71
1 34
8 90
2
PK
R-L
-3.3
-42
PK
R-L
-4.0
-42
PK
R-L
-4.5
-42
PK
R-L
-8.8
-42
PK
R-L
-10-
42
Cen
taur
T45
00C
enta
ur 'H
'T
auru
sM
ars
T12
000
Mar
s T
1400
0
3.3
4.0
4.5
8.8
10.0
2,00
0 2,
000
2,00
0 2,
000
2,00
0
130
105
114
178
199
22.0
20
.7
24.7
69
.4
85.4
42
42
42
42
42
7.1
8.3
9.1
16.4
18
.0
9.0
9.0
9.0
9.0
9.0
1.5
1.8
1.9
3.5
3.9
20.5
19
.0
22.7
65
.9
81.5
213,
000
254,
000
263,
000
285,
000
302,
000
10,4
00
13,4
00
11,6
00
4,32
0 3,
710
PK
R-L
-3.3
-25
PK
R-L
-4.0
-25
PK
R-L
-4.5
-25
PK
R-L
-8.8
-25
PK
R-L
-10-
25P
KR
-L-3
9-25
PK
R-L
-83-
25P
KR
-L-8
5-25
Cen
taur
T45
00C
enta
ur 'H
'T
auru
sM
ars
T12
000
Mar
s T
1400
0M
S600
0A
BB
GT
11N
MS7
001E
3.3
4.0
4.5
8.8
10.0
39
.0
83.3
84
.7
2,00
0 2,
000
2,00
0 2,
000
2,00
0 2,
000
2,00
0 2,
000
130
105
114
178
199
220
390
154
22.0
20
.7
24.7
69
.4
85.4
37
11,
350
540
25
25
25
25
25
25
25
25
4.2
4.9
5.4
9.8
10.7
42
.1
86.8
88
.3
9.0
9.0
9.0
9.0
9.0
9.0
9.0
9.0
1.5
1.8
1.9
3.5
3.9
15.2
31
.3
31.8
20.5
19
.0
22.7
65
.9
81.5
35
51,
320
508
190,
000
204,
000
212,
000
284,
000
301,
000
680,
000
1,22
0,00
0 1,
220,
000
9,30
0 10
,800
9,
300
4,30
0 3,
700
1,91
0 92
4 2,
400
Exa
mpl
e N
O e
mis
sion
cal
cula
tions
are
sho
wn
in A
ppen
dix
A.
ax
Ref
eren
ced
to 1
5 pe
rcen
t ox
ygen
.b T
otal
for
bot
h dr
y lo
w-N
O c
ombu
stio
n pl
us S
CR
con
trol
tec
hniq
ues.
cx
and 6-14, respectively. These combined cost-effectiveness

6-256
figures are calculated by dividing the sum of the total annual
costs by the

6-257
6-258
sum of the annual reduction of NO emissions for the combinedx
emission control techniques. For continuous-duty, natural gas-
fired model plants, the combined cost-effectiveness figures for
wet injection plus SCR range from approximately $650 to $4,500
per ton of NO removed. For continuous-duty, oil-fired modelx
plants, the combined cost effectiveness ranges from approximately
$1,100 to $3,550 per ton of NO removed. The combined cost-x
effectiveness figures for dry low-NO combustion plus SCR forx
continuous-duty, natural gas-fired model plants range from
approximately $350 to $3,550 per ton of NO removed.x
The combined cost-effectiveness figures increase with
decreasing turbine size and annual operating hours. Data were
not available to quantify the wet injection requirements and
controlled emissions levels for oil-fired turbines with low-NOx
combustors, so cost-effectiveness figures were not tabulated for
this control scenario.
d. OFFSHORE TURBINES
The only available information about the cost of NOx
controls for offshore gas turbines was presented in a report
prepared for the Santa Barbara County Air Pollution Control
District (SBCAPCD) in California. The performance and cost of37
about 20 NO control techniques for a 2.8 MW (3,750 hp) turbinex
were described in the report. Wet injection and SCR were
included in the analysis; low-NO combustors were not. The costsx
from the report are presented in Table 6-15
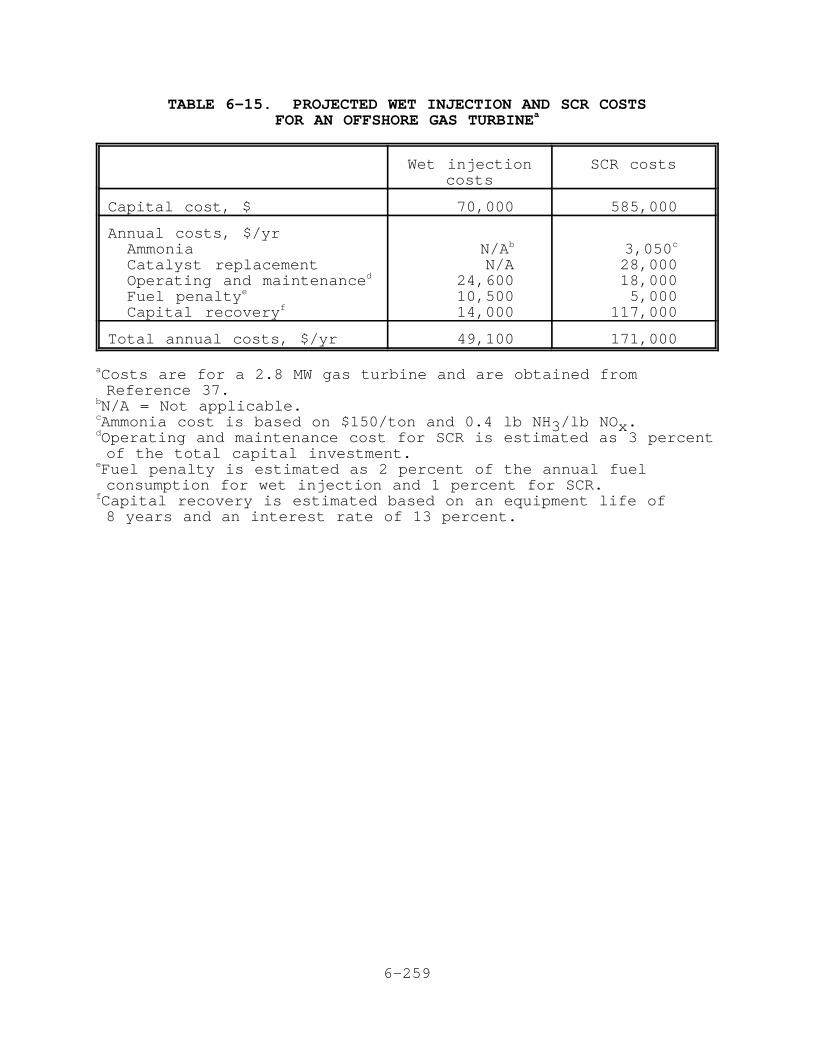
6-259
TABLE 6-15. PROJECTED WET INJECTION AND SCR COSTSFOR AN OFFSHORE GAS TURBINEa
Wet injectioncosts
SCR costs
Capital cost, $ 70,000 585,000
Annual costs, $/yrAmmoniaCatalyst replacementOperating and maintenanced
Fuel penaltye
Capital recoveryf
N/Ab
N/A24,60010,50014,000
3,050c
28,00018,0005,000
117,000
Total annual costs, $/yr 49,100 171,000
Costs are for a 2.8 MW gas turbine and are obtained froma
Reference 37.N/A = Not applicable.b
Ammonia cost is based on $150/ton and 0.4 lb NH /lb NO .c3 x
Operating and maintenance cost for SCR is estimated as 3 percentd
of the total capital investment.Fuel penalty is estimated as 2 percent of the annual fuele
consumption for wet injection and 1 percent for SCR.Capital recovery is estimated based on an equipment life off
8 years and an interest rate of 13 percent.
6-260
without adjustment because there is insufficient cost
information to know what adjustments need to be made.
Additionally, insufficient information is available to scale up
these costs for larger turbines. The water and steam injection
costs and SCR costs for offshore applications are discussed in
Sections 6.4.1 and 6.4.2, respectively.
i. Wet Injection
The report prepared for SBCAPCD assumed water injection
costs are the same as steam injection costs. The report did not
describe the components in the capital cost analysis for these
injection systems, but the results are much lower than those that
6-261
would be estimated by the procedures described in Section 6.1.1
of this report. The authors may have assumed that the engine-
mounted injection equipment cost was included in the turbine
capital cost and that a less rigorous water treatment process is
installed. Annual costs are also much lower than those that
would be estimated by the procedures described in Section 6.1.2
of this report. There are at least three reasons for the
difference: (1) the low capital cost leads to a low CRF, even
though the turbine life was assumed to be only 8 years;
(2) overhead costs and taxes, insurance, and administration costs
are not considered; and (3) the capacity factor is only
50 percent (i.e., about 4,400 hr/yr, vs. 8,000 hr/yr, as in
Section 6.1.2). The turbine life was only 8 years, which may
correspond to a typical service life of an offshore platform.
ii. Selective Catalytic Reduction
The total capital costs presented in the report for SBCAPCD
are similar to those that would be estimated by the procedures in
Section 6.2.1 of this report. However, it appears that $150,000
of the total in Reference 37 is for structural modifications to
the platform and $75,000 is for retrofit installation. When the
difference in the load factor is taken into account, some of the
annual costs are similar to those that would be estimated by the
procedures in Section 6.2.2 for a similarly sized turbine. The
catalyst replacement cost, however, is much lower; neither the
type of catalyst nor the replacement frequency were identified.
Ammonia costs are lower because the uncontrolled NO emissionx
level was assumed to be 110 ppmv instead of 150 ppmv and because
a unit cost of $150/ton was used instead of $400/ton. The
reference does not indicate whether or not catalyst disposal,
overhead, taxes, freight, and administration costs were
considered. Capital recovery costs are higher because the
equipment life is assumed to be only 8 years on the offshore
platform.
6-262
REFERENCES FOR CHAPTER 6
I. 1990 Performance Specifications. Gas Turbine World. 11:20-48. 1990.
II. U. S. Environmental Protection Agency. BackgroundInformation Document, Review of 1979 Gas Turbine New SourcePerformance Standards. Research Triangle Park, NC. Prepared by Radian Corporation under ContractNo. 68-02-3816. 1985.
III. Letter and attachments from Swingle, R., SolarTurbines Incorporated, to Neuffer, W. J.,EPA/ISB. August 20, 1991. Review of draft gasturbine ACT document.
IV. Monthly Energy Review. Energy Information Administration. March 1991. p. 113.
V. Petroleum Marketing Annual 1990. Energy InformationAdministration.
VI. Reference 3, p. 109.
VII. OAQPS Control Cost Manual (Fourth Edition). EPA-450/3-90-006. January 1990.
VIII. Letter and attachment from Leonard G., GeneralElectric Company, to Snyder, R., MRI. May 24,1991. Response to gas turbine questionnaire.
IX. Letter and attachment from Swingle, R., Solar TurbinesIncorporated, to Snyder, R., MRI. February 8, 1991. Maintenance considerations for gas turbines.
X. Telecon. Snyder, R., MRI, with Rayome, D., US TurbineCorporation. May 6, 1991. Maintenance costs for gasturbines.
XI. Telecon. Snyder, R., MRI, with Schorr, M., General ElectricCompany. May 22, 1991. Gas turbine water injection.
XII. Letter and attachments from Gurmani, A., AseaBrown Boveri, to Snyder, R., MRI. May 30, 1991. Response to gas turbine questionnaire.
XIII. Letter and attachment from Gagnon, S., HighPurity Services, Inc., to Snyder, R., MRI. April 4, 1991. Water treatment system design.
XIV. Letter and attachments from Gurmani, A., AseaBrown Boveri, to Snyder, R., MRI. February 4,1991. Response to gas turbine questionnaire.
6-263
XV. Letter and attachment from Kimsey, D., Allison Gas TurbineDivision of General Motors, to Snyder, R., MRI. February 19, 1991. Response to gas turbine request.
XVI. Letter and attachment from Leonard, G., GeneralElectric Company, to Snyder, R. MRI. February 14, 1991. Response to gas turbinequestionnaire.
XVII. Letter and attachments from Cull, C. GeneralElectric Company, to Snyder, R., MRI. May 14,1991. On-engine costs for water and steaminjection hardware.
XVIII. Bernstein, S., and P. Malte (EnergyInternational, Inc.). Emissions Control for GasTransmission Engines. Prepared for the GasResearch Institute. Chicago. PresentationNo. PRES 8070. July 1989. 17 pp.
XIX. Letter and attachments from Ali, S. A., AllisonGas Turbine Division of General Motors, toNeuffer, W. J., EPA/ISB. August 30, 1991. Review of draft gas turbine ACT document.
XX. Telecon. Snyder, R., MRI, with Schubert, R., GeneralElectric Marine and Industrial Division. April 26, 1991. Maintenance costs for gas turbines.
XXI. Letter and attachments from Swingle, R., SolarTurbines Incorporated, to Snyder, R., MRI. May 21, 1991. Maintenance considerations for gasturbines.
XXII. Walsh, E. Gas Turbine Operating and MaintenanceConsiderations. General Electric Company. Schenectady, NY. Presented at the 33rd GETurbine State-of-the-Art Technology Seminar forIndustrial, Cogeneration and Independent PowerTurbine Users. September 1989. 20 pp.
XXIII. Telecon. Snyder, R., MRI, with Pasquarelli, L.,General Electric Company. April 26, 1991. Maintenance costs for gas turbines.
XXIV. Letters and attachments from Schorr, M., GeneralElectric Company, to Snyder, R., MRI. March,April 1991. Response to gas turbinequestionnaire.
6-264
XXV. Kolp, D. (Energy Services, Inc.), S. Gagnon (HighPurity Services), and M. Rosenbluth (The Proctorand Gamble Co.). Water Treatment and MoistureSeparation in Steam Injected Gas Turbines. Prepared for the American Society of MechanicalEngineers. New York. Publication No. 90-GT-372, June, 1990.
XXVI. Letter from Cull, C., General Electric Company,to Snyder, R., MRI. May 29, 1991. Low-NOxCombustor Costs.
XXVII. Permit Application Processing and Calculations bySouth Coast Air Quality Management District forproposed SCR control of gas turbine at SaintJohn's Hospital and Health Center, Santa Monica,CA. May 23, 1989.
XXVIII. Prosl, T. (DuPont), and G. Scrivner (Dow). Technical Arguments and Economic Impact of SCR'sUse for NO Reduction of Combustion Turbine forxCogeneration. Paper presented at EPA Region VImeeting concerning NO abatement of combustionxturbines. December 17, 1987.
XXIX. Sidebotham, G., and R. Williams. Technology ofNO Control for Stationary Gas Turbines. Centerxfor Environmental Studies. Princeton University. January 1989.
XXX. Shareef, G., and D. Stone. Evaluation of SCR NOxControls for Small Natural Gas-Fueled PrimeMovers. Phase I. Prepared by Radian Corporationfor Gas Research Institute. July 1990.
XXXI. Hull, R., C. Urban, R. Thring, S. Ariga, M.Ingalls, and G. O'Neal. No Control TechnologyxData Base for Gas-Fueled Prime Movers, Phase I. Prepared by Southwest Research Institute for GasResearch Institute. April 1988.
XXXII. Letter and attachments from Henegan, D., NortonCompany, to Snyder, R., MRI. March 28, 1991. Response to SCR questionnaire.
XXXIII. Schorr, M. NO Control for Gas Turbines: xRegulations and Technology. General ElectricCompany. Schenectady, New York. Paper presentedat the Council of Industrial Boiler Owners NOxControl IV Conference. Concord, California. February 11-12, 1991. 11 pp.
XXXIV. Letter and attachment from Smith, J. C.,Institute of Clean Air Companies, to Neuffer, W.
6-265
J., EPA/ISB. May 14, 1992. Response to EPAquestionnaire regarding flue gas treatmentprocesses for emission reductions dated March 12,1992.
XXXV. State of California Air Resources Board. Determination of Reasonably Available ControlTechnology and Best Available Retrofit Technologyfor the Control of Oxides of Nitrogen FromStationary Gas Turbines. May 18, 1992.
XXXVI. Field Survey of SCR Gas Turbine OperatingExperience. Prepared for the Electric PowerResearch Institute. Palo Alto, CA. May, 1991.
XXXVII. Offshore Gas Turbine NO Control TechnologyxDevelopment Program. Phase I TechnologyEvaluation. Arthur D. Little, Inc. for SantaBarbara County Air Pollution Control District. August 1989.
XXXVIII. Champagne, D. See SCR Cost-effective for SmallGas Turbines. Cogeneration. January-February1988. pp. 26-29.

6-266
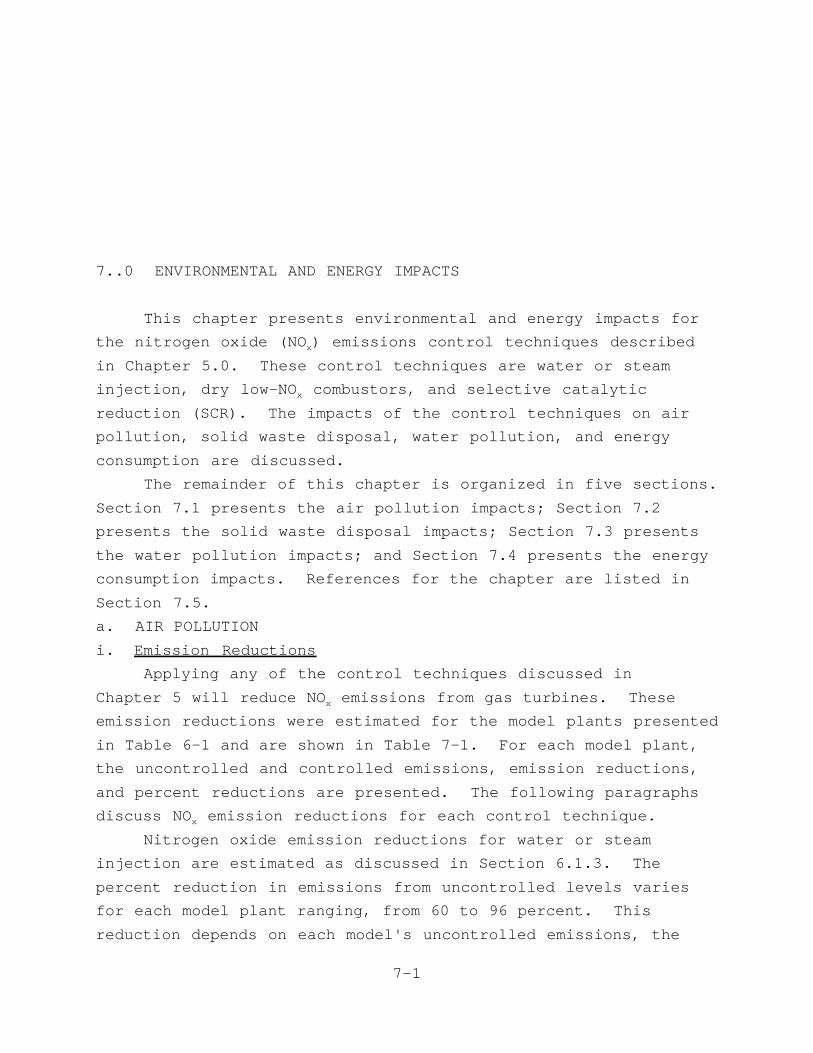
7-1
7..0 ENVIRONMENTAL AND ENERGY IMPACTS
This chapter presents environmental and energy impacts for
the nitrogen oxide (NO ) emissions control techniques describedx
in Chapter 5.0. These control techniques are water or steam
injection, dry low-NO combustors, and selective catalyticx
reduction (SCR). The impacts of the control techniques on air
pollution, solid waste disposal, water pollution, and energy
consumption are discussed.
The remainder of this chapter is organized in five sections.
Section 7.1 presents the air pollution impacts; Section 7.2
presents the solid waste disposal impacts; Section 7.3 presents
the water pollution impacts; and Section 7.4 presents the energy
consumption impacts. References for the chapter are listed in
Section 7.5.
a. AIR POLLUTION
i. Emission Reductions
Applying any of the control techniques discussed in
Chapter 5 will reduce NO emissions from gas turbines. Thesex
emission reductions were estimated for the model plants presented
in Table 6-1 and are shown in Table 7-1. For each model plant,
the uncontrolled and controlled emissions, emission reductions,
and percent reductions are presented. The following paragraphs
discuss NO emission reductions for each control technique.x
Nitrogen oxide emission reductions for water or steam
injection are estimated as discussed in Section 6.1.3. The
percent reduction in emissions from uncontrolled levels varies
for each model plant ranging, from 60 to 96 percent. This
reduction depends on each model's uncontrolled emissions, the
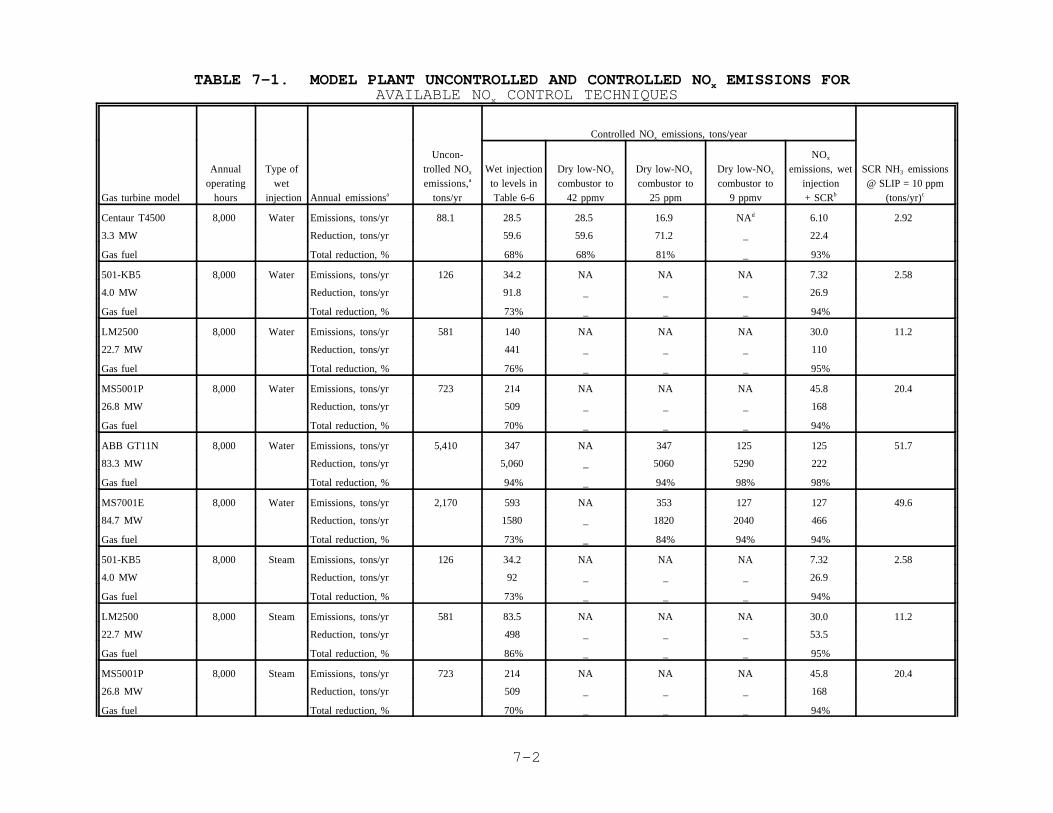
7-2
TABLE 7-1. MODEL PLANT UNCONTROLLED AND CONTROLLED NO EMISSIONS FOR xAVAILABLE NO CONTROL TECHNIQUESx
Controlled NO emissions, tons/yearx
Gas turbine model hours injection Annual emissions tons/yr Table 6-6 42 ppmv 25 ppm 9 ppmv + SCR (tons/yr)
Annual Type of trolled NO Wet injection Dry low-NO Dry low-NO Dry low-NO emissions, wet SCR NH emissionsoperating wet emissions, to levels in combustor to combustor to combustor to injection @ SLIP = 10 ppm
a
Uncon- NO
xa
x x x
x
b
3
c
Centaur T4500 8,000 Water Emissions, tons/yr 88.1 28.5 28.5 16.9 NA 6.10 2.92 d
3.3 MW Reduction, tons/yr 59.6 59.6 71.2 _ 22.4
Gas fuel Total reduction, % 68% 68% 81% _ 93%
501-KB5 8,000 Water Emissions, tons/yr 126 34.2 NA NA NA 7.32 2.58
4.0 MW Reduction, tons/yr 91.8 _ _ _ 26.9
Gas fuel Total reduction, % 73% _ _ _ 94%
LM2500 8,000 Water Emissions, tons/yr 581 140 NA NA NA 30.0 11.2
22.7 MW Reduction, tons/yr 441 _ _ _ 110
Gas fuel Total reduction, % 76% _ _ _ 95%
MS5001P 8,000 Water Emissions, tons/yr 723 214 NA NA NA 45.8 20.4
26.8 MW Reduction, tons/yr 509 _ _ _ 168
Gas fuel Total reduction, % 70% _ _ _ 94%
ABB GT11N 8,000 Water Emissions, tons/yr 5,410 347 NA 347 125 125 51.7
83.3 MW Reduction, tons/yr 5,060 _ 5060 5290 222
Gas fuel Total reduction, % 94% _ 94% 98% 98%
MS7001E 8,000 Water Emissions, tons/yr 2,170 593 NA 353 127 127 49.6
84.7 MW Reduction, tons/yr 1580 _ 1820 2040 466
Gas fuel Total reduction, % 73% _ 84% 94% 94%
501-KB5 8,000 Steam Emissions, tons/yr 126 34.2 NA NA NA 7.32 2.58
4.0 MW Reduction, tons/yr 92 _ _ _ 26.9
Gas fuel Total reduction, % 73% _ _ _ 94%
LM2500 8,000 Steam Emissions, tons/yr 581 83.5 NA NA NA 30.0 11.2
22.7 MW Reduction, tons/yr 498 _ _ _ 53.5
Gas fuel Total reduction, % 86% _ _ _ 95%
MS5001P 8,000 Steam Emissions, tons/yr 723 214 NA NA NA 45.8 20.4
26.8 MW Reduction, tons/yr 509 _ _ _ 168
Gas fuel Total reduction, % 70% _ _ _ 94%
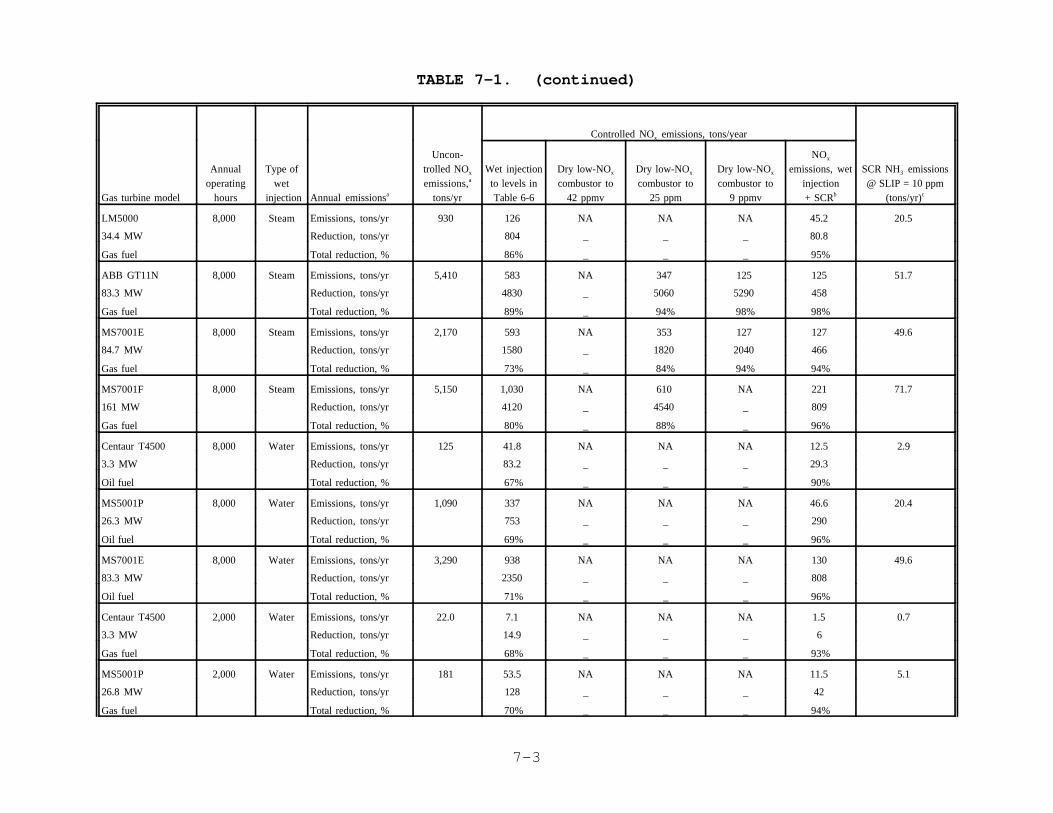
TABLE 7-1. (continued)
Controlled NO emissions, tons/yearx
Gas turbine model hours injection Annual emissions tons/yr Table 6-6 42 ppmv 25 ppm 9 ppmv + SCR (tons/yr)
Annual Type of trolled NO Wet injection Dry low-NO Dry low-NO Dry low-NO emissions, wet SCR NH emissionsoperating wet emissions, to levels in combustor to combustor to combustor to injection @ SLIP = 10 ppm
a
Uncon- NO
xa
x x x
x
b
3
c
7-3
LM5000 8,000 Steam Emissions, tons/yr 930 126 NA NA NA 45.2 20.5
34.4 MW Reduction, tons/yr 804 _ _ _ 80.8
Gas fuel Total reduction, % 86% _ _ _ 95%
ABB GT11N 8,000 Steam Emissions, tons/yr 5,410 583 NA 347 125 125 51.7
83.3 MW Reduction, tons/yr 4830 _ 5060 5290 458
Gas fuel Total reduction, % 89% _ 94% 98% 98%
MS7001E 8,000 Steam Emissions, tons/yr 2,170 593 NA 353 127 127 49.6
84.7 MW Reduction, tons/yr 1580 _ 1820 2040 466
Gas fuel Total reduction, % 73% _ 84% 94% 94%
MS7001F 8,000 Steam Emissions, tons/yr 5,150 1,030 NA 610 NA 221 71.7
161 MW Reduction, tons/yr 4120 _ 4540 _ 809
Gas fuel Total reduction, % 80% _ 88% _ 96%
Centaur T4500 8,000 Water Emissions, tons/yr 125 41.8 NA NA NA 12.5 2.9
3.3 MW Reduction, tons/yr 83.2 _ _ _ 29.3
Oil fuel Total reduction, % 67% _ _ _ 90%
MS5001P 8,000 Water Emissions, tons/yr 1,090 337 NA NA NA 46.6 20.4
26.3 MW Reduction, tons/yr 753 _ _ _ 290
Oil fuel Total reduction, % 69% _ _ _ 96%
MS7001E 8,000 Water Emissions, tons/yr 3,290 938 NA NA NA 130 49.6
83.3 MW Reduction, tons/yr 2350 _ _ _ 808
Oil fuel Total reduction, % 71% _ _ _ 96%
Centaur T4500 2,000 Water Emissions, tons/yr 22.0 7.1 NA NA NA 1.5 0.7
3.3 MW Reduction, tons/yr 14.9 _ _ _ 6
Gas fuel Total reduction, % 68% _ _ _ 93%
MS5001P 2,000 Water Emissions, tons/yr 181 53.5 NA NA NA 11.5 5.1
26.8 MW Reduction, tons/yr 128 _ _ _ 42
Gas fuel Total reduction, % 70% _ _ _ 94%
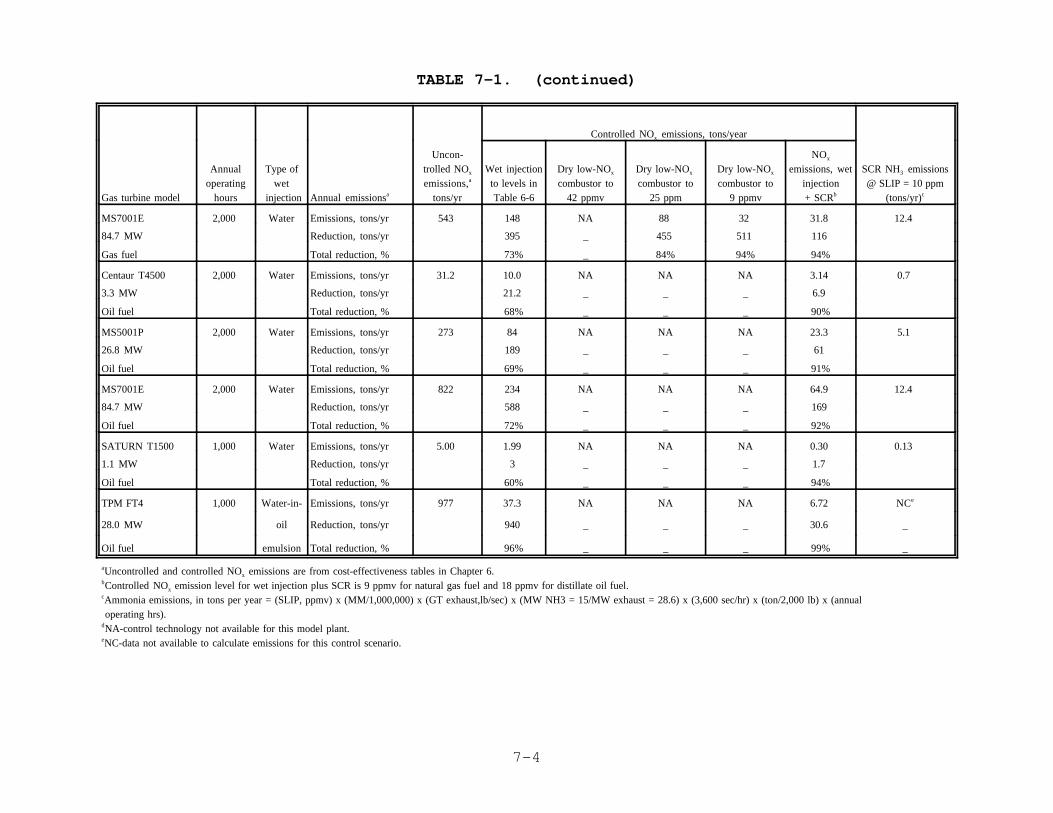
TABLE 7-1. (continued)
Controlled NO emissions, tons/yearx
Gas turbine model hours injection Annual emissions tons/yr Table 6-6 42 ppmv 25 ppm 9 ppmv + SCR (tons/yr)
Annual Type of trolled NO Wet injection Dry low-NO Dry low-NO Dry low-NO emissions, wet SCR NH emissionsoperating wet emissions, to levels in combustor to combustor to combustor to injection @ SLIP = 10 ppm
a
Uncon- NO
xa
x x x
x
b
3
c
7-4
MS7001E 2,000 Water Emissions, tons/yr 543 148 NA 88 32 31.8 12.4
84.7 MW Reduction, tons/yr 395 _ 455 511 116
Gas fuel Total reduction, % 73% _ 84% 94% 94%
Centaur T4500 2,000 Water Emissions, tons/yr 31.2 10.0 NA NA NA 3.14 0.7
3.3 MW Reduction, tons/yr 21.2 _ _ _ 6.9
Oil fuel Total reduction, % 68% _ _ _ 90%
MS5001P 2,000 Water Emissions, tons/yr 273 84 NA NA NA 23.3 5.1
26.8 MW Reduction, tons/yr 189 _ _ _ 61
Oil fuel Total reduction, % 69% _ _ _ 91%
MS7001E 2,000 Water Emissions, tons/yr 822 234 NA NA NA 64.9 12.4
84.7 MW Reduction, tons/yr 588 _ _ _ 169
Oil fuel Total reduction, % 72% _ _ _ 92%
SATURN T1500 1,000 Water Emissions, tons/yr 5.00 1.99 NA NA NA 0.30 0.13
1.1 MW Reduction, tons/yr 3 _ _ _ 1.7
Oil fuel Total reduction, % 60% _ _ _ 94%
TPM FT4 1,000 Water-in- Emissions, tons/yr 977 37.3 NA NA NA 6.72 NCe
28.0 MW oil Reduction, tons/yr 940 _ _ _ 30.6 _
Oil fuel emulsion Total reduction, % 96% _ _ _ 99% _
Uncontrolled and controlled NO emissions are from cost-effectiveness tables in Chapter 6.ax
Controlled NO emission level for wet injection plus SCR is 9 ppmv for natural gas fuel and 18 ppmv for distillate oil fuel.bx
Ammonia emissions, in tons per year = (SLIP, ppmv) x (MM/1,000,000) x (GT exhaust,lb/sec) x (MW NH3 = 15/MW exhaust = 28.6) x (3,600 sec/hr) x (ton/2,000 lb) x (annualc
operating hrs).NA-control technology not available for this model plant.d
NC-data not available to calculate emissions for this control scenario.e
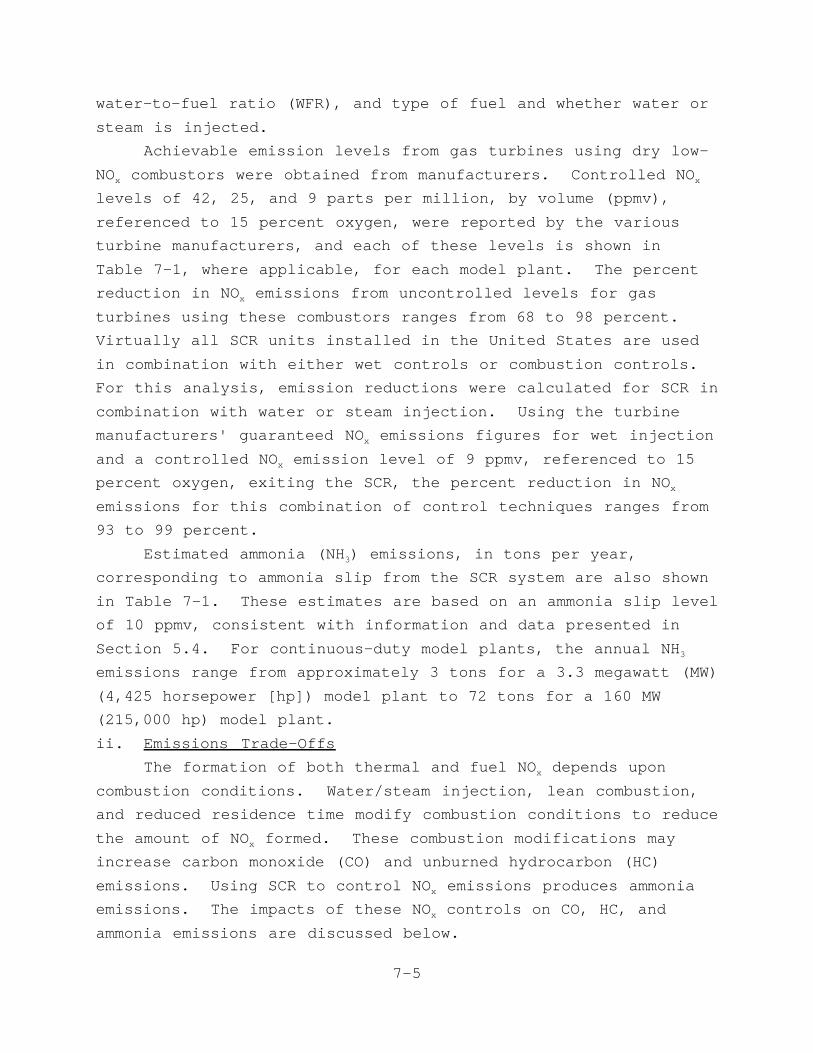
7-5
water-to-fuel ratio (WFR), and type of fuel and whether water or
steam is injected.
Achievable emission levels from gas turbines using dry low-
NO combustors were obtained from manufacturers. Controlled NOx x
levels of 42, 25, and 9 parts per million, by volume (ppmv),
referenced to 15 percent oxygen, were reported by the various
turbine manufacturers, and each of these levels is shown in
Table 7-1, where applicable, for each model plant. The percent
reduction in NO emissions from uncontrolled levels for gasx
turbines using these combustors ranges from 68 to 98 percent.
Virtually all SCR units installed in the United States are used
in combination with either wet controls or combustion controls.
For this analysis, emission reductions were calculated for SCR in
combination with water or steam injection. Using the turbine
manufacturers' guaranteed NO emissions figures for wet injectionx
and a controlled NO emission level of 9 ppmv, referenced to 15x
percent oxygen, exiting the SCR, the percent reduction in NOx
emissions for this combination of control techniques ranges from
93 to 99 percent.
Estimated ammonia (NH ) emissions, in tons per year,3
corresponding to ammonia slip from the SCR system are also shown
in Table 7-1. These estimates are based on an ammonia slip level
of 10 ppmv, consistent with information and data presented in
Section 5.4. For continuous-duty model plants, the annual NH3
emissions range from approximately 3 tons for a 3.3 megawatt (MW)
(4,425 horsepower [hp]) model plant to 72 tons for a 160 MW
(215,000 hp) model plant.
ii. Emissions Trade-Offs
The formation of both thermal and fuel NO depends uponx
combustion conditions. Water/steam injection, lean combustion,
and reduced residence time modify combustion conditions to reduce
the amount of NO formed. These combustion modifications mayx
increase carbon monoxide (CO) and unburned hydrocarbon (HC)
emissions. Using SCR to control NO emissions produces ammoniax
emissions. The impacts of these NO controls on CO, HC, andx
ammonia emissions are discussed below.
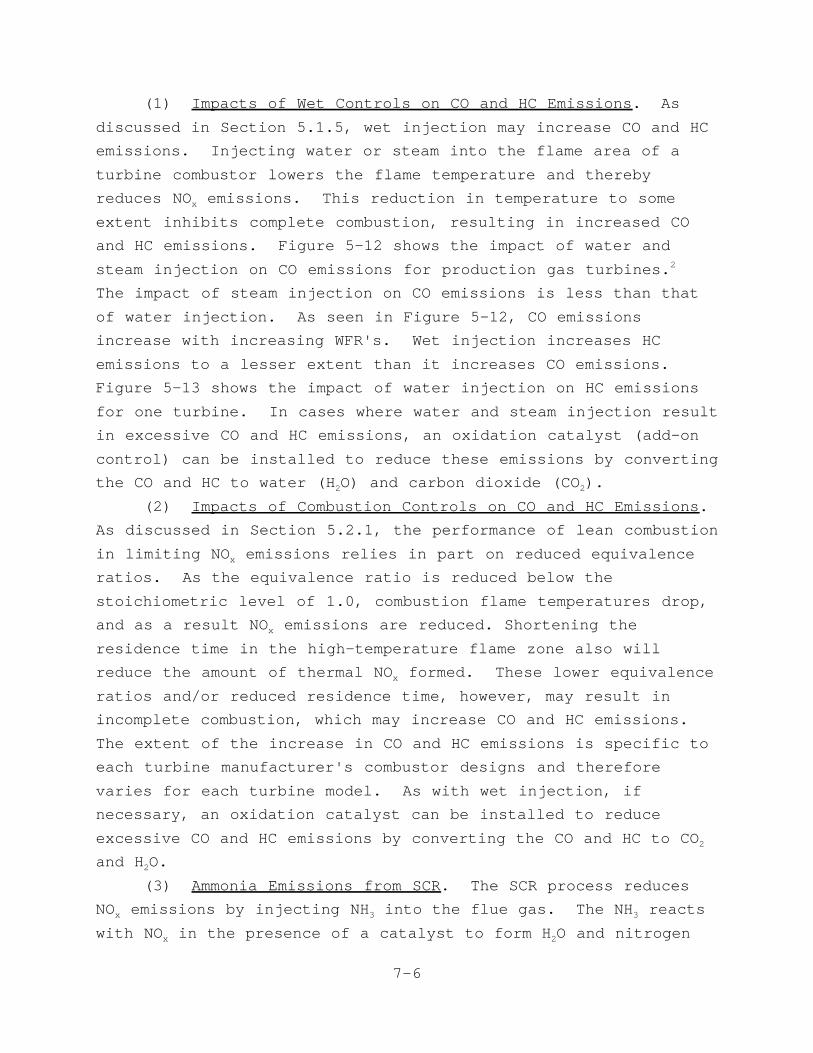
7-6
(1) Impacts of Wet Controls on CO and HC Emissions. As
discussed in Section 5.1.5, wet injection may increase CO and HC
emissions. Injecting water or steam into the flame area of a
turbine combustor lowers the flame temperature and thereby
reduces NO emissions. This reduction in temperature to somex
extent inhibits complete combustion, resulting in increased CO
and HC emissions. Figure 5-12 shows the impact of water and
steam injection on CO emissions for production gas turbines. 2
The impact of steam injection on CO emissions is less than that
of water injection. As seen in Figure 5-12, CO emissions
increase with increasing WFR's. Wet injection increases HC
emissions to a lesser extent than it increases CO emissions.
Figure 5-13 shows the impact of water injection on HC emissions
for one turbine. In cases where water and steam injection result
in excessive CO and HC emissions, an oxidation catalyst (add-on
control) can be installed to reduce these emissions by converting
the CO and HC to water (H O) and carbon dioxide (CO ).2 2
(2) Impacts of Combustion Controls on CO and HC Emissions.
As discussed in Section 5.2.1, the performance of lean combustion
in limiting NO emissions relies in part on reduced equivalencex
ratios. As the equivalence ratio is reduced below the
stoichiometric level of 1.0, combustion flame temperatures drop,
and as a result NO emissions are reduced. Shortening thex
residence time in the high-temperature flame zone also will
reduce the amount of thermal NO formed. These lower equivalencex
ratios and/or reduced residence time, however, may result in
incomplete combustion, which may increase CO and HC emissions.
The extent of the increase in CO and HC emissions is specific to
each turbine manufacturer's combustor designs and therefore
varies for each turbine model. As with wet injection, if
necessary, an oxidation catalyst can be installed to reduce
excessive CO and HC emissions by converting the CO and HC to CO2
and H O.2
(3) Ammonia Emissions from SCR. The SCR process reduces
NO emissions by injecting NH into the flue gas. The NH reactsx 3 3
with NO in the presence of a catalyst to form H O and nitrogenx 2
7-7
(N ). The NO removal efficiency of this process is partially2 x
dependent on the NH /NO ratio. Increasing this ratio reduces NO3 x x
emissions but increases the probability that unreacted ammonia
will pass through the catalyst unit into the atmosphere (known as
ammonia "slip"). Some ammonia slip is unavoidable because of
ammonia injection control limitations and imperfect distribution
of the reacting gases. A properly designed SCR system will limit
ammonia slip to less than 10 ppmv (see Section 5.4).
b. SOLID WASTE DISPOSAL
Catalytic materials used in SCR units for gas turbines
include precious metals (e.g., platinum), zeolites, and heavy
metal oxides (e.g., vanadium, titanium). Vanadium pentoxide, the
most commonly used SCR catalyst in the United States, is
identified as an acute hazardous waste under RCRA Part 261,
Subpart D - Lists of Hazardous Wastes. The Best Demonstrated
Available Technology (BDAT) Treatment Standards for Vanadium P119
and P120 states that spent catalysts containing vanadium
pentoxide are not classified as hazardous waste. State and1
local regulatory agencies, however, are authorized to establish
their own hazardous waste classification criteria, and spent
catalysts containing vanadium pentoxide may be classified as a
hazardous waste in some areas. Although the actual amount of
vanadium pentoxide contained in the catalyst bed is small, the
volume of the catalyst unit containing this material is quite
large and disposal can be costly. Where classified by State or
local agencies as a hazardous waste, this waste may be subject to
the Land Disposal Restrictions in 40 CFR Part 268, which allows
land disposal only if the hazardous waste is treated in
accordance with Subpart D - Treatment Standards. Such disposal
problems are not encountered with other catalyst materials, such
as precious metals and zeolites, because these materials are not
hazardous wastes.
c. WATER USAGE AND WASTE WATER DISPOSAL
Water availability and waste water disposal are
environmental factors to be considered with wet injection. The
impact of water usage on the water supply at some remote sites,

7-8
in small communities, or in areas where water resources may be
limited is an environmental factor that should be examined when
considering wet injection. The volume of water required for wet
injection is shown in Table 7-2
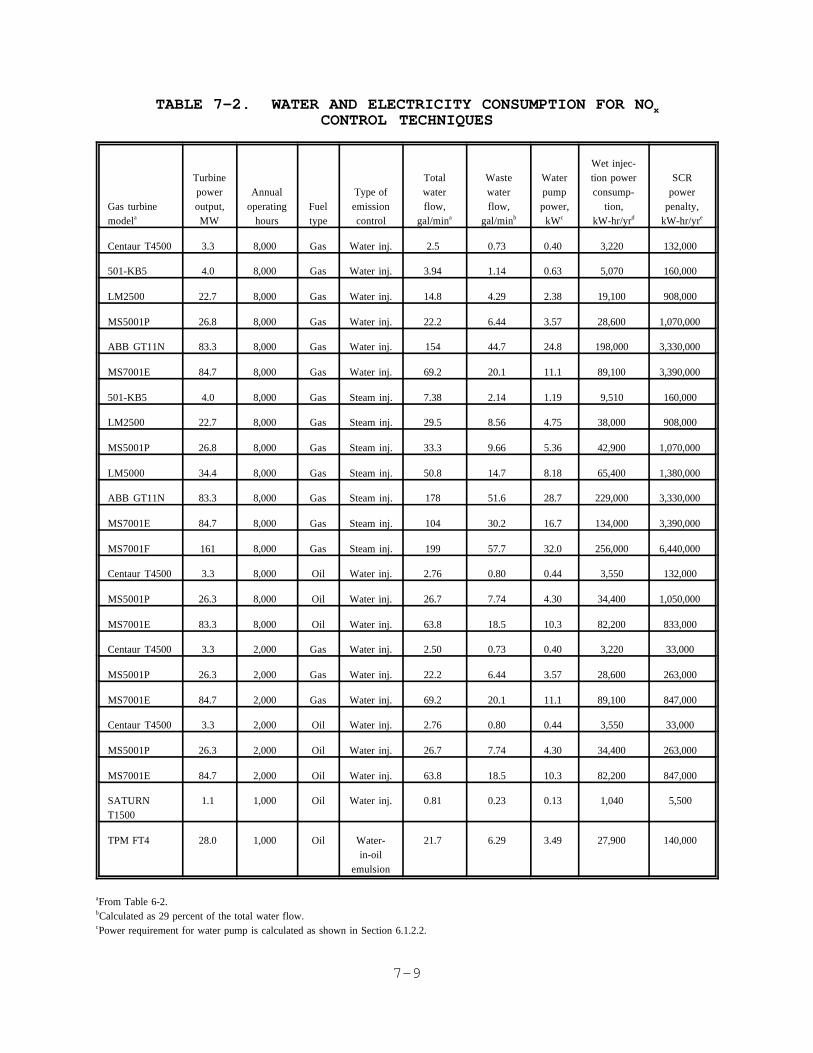
7-9
TABLE 7-2. WATER AND ELECTRICITY CONSUMPTION FOR NOxCONTROL TECHNIQUES
Gas turbinemodela
Turbinepoweroutput,MW
Annualoperating
hoursFueltype
Type ofemissioncontrol
Totalwaterflow,
gal/mina
Wastewaterflow,
gal/minb
Waterpumppower,
kWc
Wet injec-tion powerconsump-
tion,kW-hr/yrd
SCRpower
penalty,kW-hr/yre
Centaur T4500 3.3 8,000 Gas Water inj. 2.5 0.73 0.40 3,220 132,000
501-KB5 4.0 8,000 Gas Water inj. 3.94 1.14 0.63 5,070 160,000
LM2500 22.7 8,000 Gas Water inj. 14.8 4.29 2.38 19,100 908,000
MS5001P 26.8 8,000 Gas Water inj. 22.2 6.44 3.57 28,600 1,070,000
ABB GT11N 83.3 8,000 Gas Water inj. 154 44.7 24.8 198,000 3,330,000
MS7001E 84.7 8,000 Gas Water inj. 69.2 20.1 11.1 89,100 3,390,000
501-KB5 4.0 8,000 Gas Steam inj. 7.38 2.14 1.19 9,510 160,000
LM2500 22.7 8,000 Gas Steam inj. 29.5 8.56 4.75 38,000 908,000
MS5001P 26.8 8,000 Gas Steam inj. 33.3 9.66 5.36 42,900 1,070,000
LM5000 34.4 8,000 Gas Steam inj. 50.8 14.7 8.18 65,400 1,380,000
ABB GT11N 83.3 8,000 Gas Steam inj. 178 51.6 28.7 229,000 3,330,000
MS7001E 84.7 8,000 Gas Steam inj. 104 30.2 16.7 134,000 3,390,000
MS7001F 161 8,000 Gas Steam inj. 199 57.7 32.0 256,000 6,440,000
Centaur T4500 3.3 8,000 Oil Water inj. 2.76 0.80 0.44 3,550 132,000
MS5001P 26.3 8,000 Oil Water inj. 26.7 7.74 4.30 34,400 1,050,000
MS7001E 83.3 8,000 Oil Water inj. 63.8 18.5 10.3 82,200 833,000
Centaur T4500 3.3 2,000 Gas Water inj. 2.50 0.73 0.40 3,220 33,000
MS5001P 26.3 2,000 Gas Water inj. 22.2 6.44 3.57 28,600 263,000
MS7001E 84.7 2,000 Gas Water inj. 69.2 20.1 11.1 89,100 847,000
Centaur T4500 3.3 2,000 Oil Water inj. 2.76 0.80 0.44 3,550 33,000
MS5001P 26.3 2,000 Oil Water inj. 26.7 7.74 4.30 34,400 263,000
MS7001E 84.7 2,000 Oil Water inj. 63.8 18.5 10.3 82,200 847,000
SATURNT1500
1.1 1,000 Oil Water inj. 0.81 0.23 0.13 1,040 5,500
TPM FT4 28.0 1,000 Oil Water-in-oil
emulsion
21.7 6.29 3.49 27,900 140,000
From Table 6-2.a
Calculated as 29 percent of the total water flow.b
Power requirement for water pump is calculated as shown in Section 6.1.2.2.c

7-10
for each model plant.
Water purity is essential for wet injection systems in order
to prevent erosion and/or the formation of deposits in the hot
sections of the gas turbine. Water treatment systems are used to
achieve water quality specifications set by gas turbine
manufacturers. Table 5-4 summarizes these specifications for six
manufacturers.
Discharges from these water treatment systems have a
potential impact on water quality. As indicated in Section 6.1,
approximately 29 percent of the treated water flow rate
(22.5 percent of the raw water flow rate) is considered to be
discharged as wastewater. The wastewater flow rates for each of
the model plants with a water or steam injection control system
are estimated using this factor, and the results are presented in
Table 7-2. The wastewater contains increased levels of those
pollutants in the raw water (e.g., calcium, silica, sulfur, as
listed in Table 5-4) that are removed by the water treatment
system, along with any chemicals introduced by the treatment
process. Based on a wastewater flowrate equal to 29 percent of
the influent raw water, the concentration of pollutants
discharged from the water treatment system is approximately three
times higher than the pollutant concentrations in the raw water.
The impacts of these pollutants on water quality are
site-specific and depend on the type of water supply and on the
discharge restrictions. Influent water obtained from a
municipality will not contain high concentrations of pollutants.
However, surface water or well water used at a remote site might
contain high pollutant concentrations and may require additional
pretreatment to meet the water quality specifications set by
7-11
manufacturers. This additional pretreatment will increase the
pollutant concentrations of the wastewater discharge. Wastewater
discharges to publicly-owned treatment works (POTW's) must meet
the requirements of applicable Approved POTW Pretreatment
Programs.
d. ENERGY CONSUMPTION
Additional fuel and electrical energy is required over
baseline for wet injection controls, while additional electrical
energy is required for SCR controls. The following paragraphs
discuss these energy consumption impacts.
Injecting water or steam into the turbine combustor lowers
the net cycle efficiency and increases the power output of the
turbine. The thermodynamic efficiency of the combustion process
is reduced because energy that could otherwise be available to
perform work in the turbine must now be used to heat the
water/steam. This lower efficiency is seen as an increase in
fuel use. Table 5-10 shows the impacts of wet injection on gas
turbine performance for one manufacturer. This table shows a 2
to 4 percent loss in efficiency associated with WFR's required to
achieve NO emission levels of 25 to 42 ppmv in gas turbinesx
burning natural gas. The actual efficiency loss is specific to
each turbine model but generally increases with increasing WFR's
and is higher for water injection than for steam injection
(additional energy is required to heat and vaporize the water).
One exception to this efficiency penalty occurs with steam
injection, in which exhaust heat from the gas turbine is used to
generate the steam for injection. If the heat recovered in
generating the steam would otherwise be exhausted to atmosphere,
the result is an increase in net cycle efficiency.
The energy from the increased mass flow and heat capacity of
the injected water/steam can be recovered in the turbine,
resulting in an increase in power output accompanying the reduced
efficiency of the turbine (shown in Table 5-10 for one manufac-
turer). This increase in power output can be significant and
could lessen the impact of the loss in efficiency if the facility
has a demand for the available excess power.
7-12
Water and steam injection controls also require additional
electrical energy to operate the water injection feed water
pumps. The annual electricity usage for each model is the
product of the pump power demand, discussed in Section 6.1.2.2,
and the annual hours of operation. Table 7-2 summarizes this
electricity usage for each of the model plants.
For SCR units, additional electrical energy is required to
operate ammonia pumps and ventilation fans. This energy
requirement, however, is believed to be small and was not
included in this analysis.
The increased back-pressure in the turbine exhaust system
resulting from adding an SCR system reduces the power output from
the turbine. As discussed in Section 6.3.2.9, the power output
is typically reduced by approximately 0.5 percent. This power
penalty has been calculated for each model plant and is shown in
Table 7-2.
e. REFERENCE FOR CHAPTER 7
1.. 55 FR 22276, June 1, 1990.
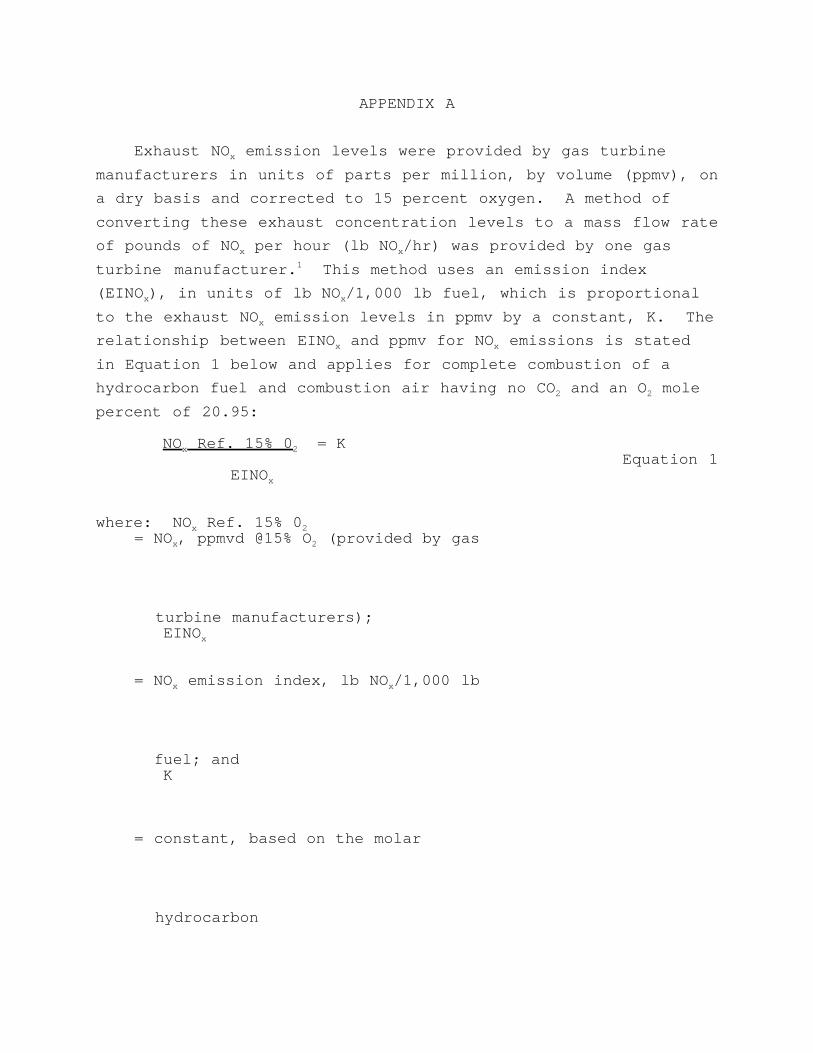
APPENDIX A
Exhaust NO emission levels were provided by gas turbinex
manufacturers in units of parts per million, by volume (ppmv), on
a dry basis and corrected to 15 percent oxygen. A method of
converting these exhaust concentration levels to a mass flow rate
of pounds of NO per hour (lb NO /hr) was provided by one gasx x
turbine manufacturer. This method uses an emission index1
(EINO ), in units of lb NO /1,000 lb fuel, which is proportionalx x
to the exhaust NO emission levels in ppmv by a constant, K. Thex
relationship between EINO and ppmv for NO emissions is statedx x
in Equation 1 below and applies for complete combustion of a
hydrocarbon fuel and combustion air having no CO and an O mole2 2
percent of 20.95:
NO Ref. 15% 0 = Kx 2Equation 1
EINOx
where: NO Ref. 15% 0x 2= NO , ppmvd @15% O (provided by gasx 2
turbine manufacturers); EINOx
= NO emission index, lb NO /1,000 lbx x
fuel; and K
= constant, based on the molar
hydrocarbon
A-2
ratio of the fuel.
The derivation of Equation 1 was provided by the turbine
manufacturer and is based on basic thermodynamic laws and
supported by test data provided by the manufacturer. According
to the manufacturer, this equation can be used to estimate NOx
emissions for operation with or without water/steam injection.
Equation 1 shows that NO emissions are dependent only uponx
the molar hydrocarbon ratio of the fuel and are independent of
the air/fuel ratio (A/F). The equation therefore is valid for
all gas turbine designs for a given fuel. The validity of this
approach to calculate NO emissions was supported by a second x
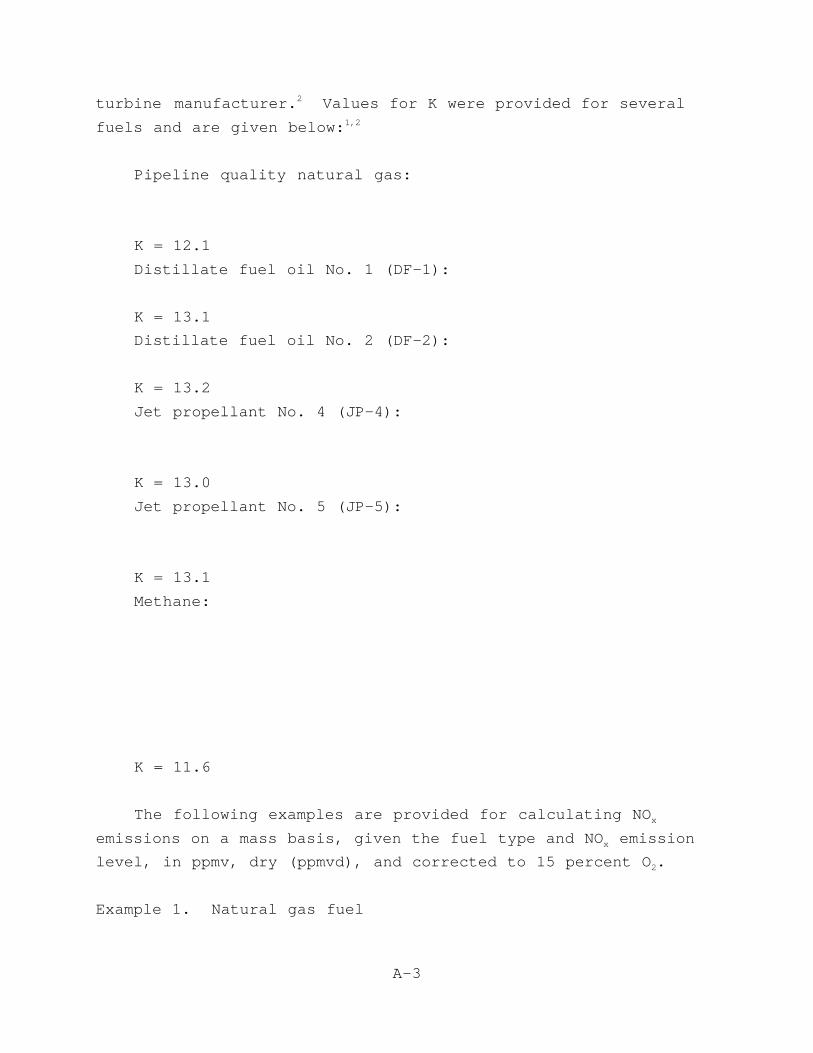
A-3
turbine manufacturer. Values for K were provided for several2
fuels and are given below:1,2
Pipeline quality natural gas:
K = 12.1
Distillate fuel oil No. 1 (DF-1):
K = 13.1
Distillate fuel oil No. 2 (DF-2):
K = 13.2
Jet propellant No. 4 (JP-4):
K = 13.0
Jet propellant No. 5 (JP-5):
K = 13.1
Methane:
K = 11.6
The following examples are provided for calculating NOx
emissions on a mass basis, given the fuel type and NO emissionx
level, in ppmv, dry (ppmvd), and corrected to 15 percent O .2
Example 1. Natural gas fuel
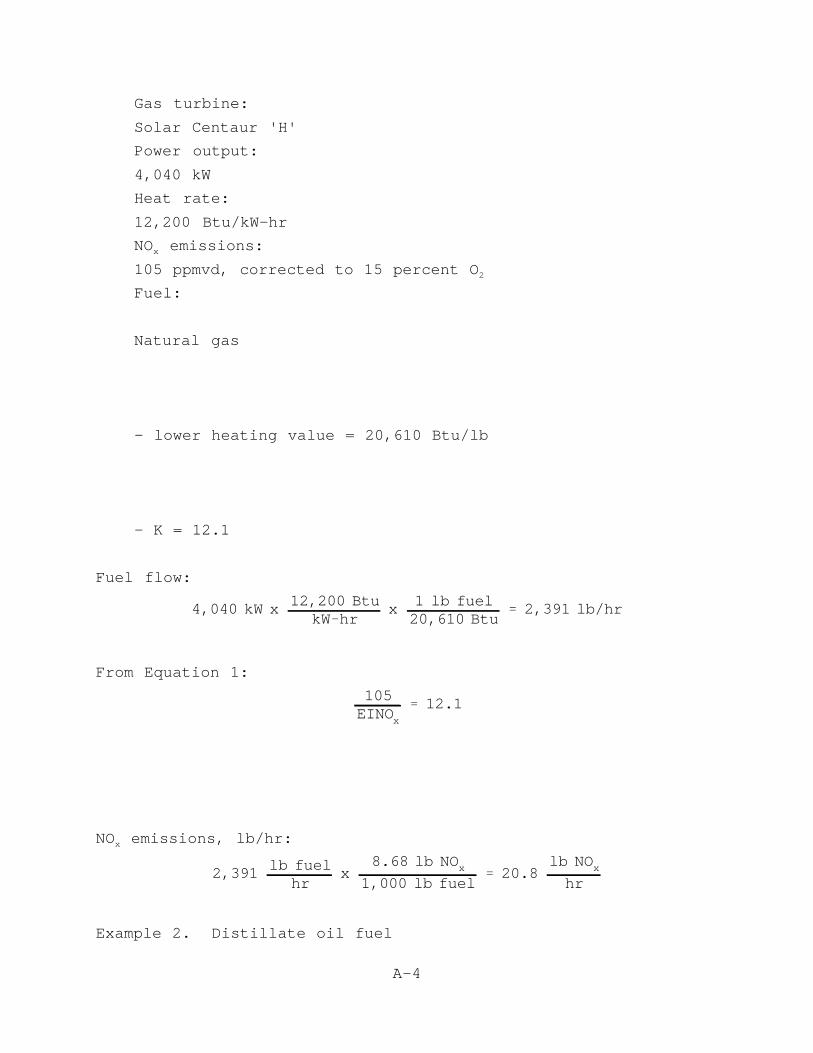
4,040 kW x 12,200 BtukW&hr
x 1 lb fuel20,610 Btu
' 2,391 lb/hr
105EINOx
' 12.1
2,391 lb fuelhr
x8.68 lb NOx
1,000 lb fuel' 20.8
lb NOxhr
A-4
Gas turbine:
Solar Centaur 'H'
Power output:
4,040 kW
Heat rate:
12,200 Btu/kW-hr
NO emissions:x
105 ppmvd, corrected to 15 percent O2
Fuel:
Natural gas
- lower heating value = 20,610 Btu/lb
- K = 12.1
Fuel flow:
From Equation 1:
NO emissions, lb/hr:x
Example 2. Distillate oil fuel
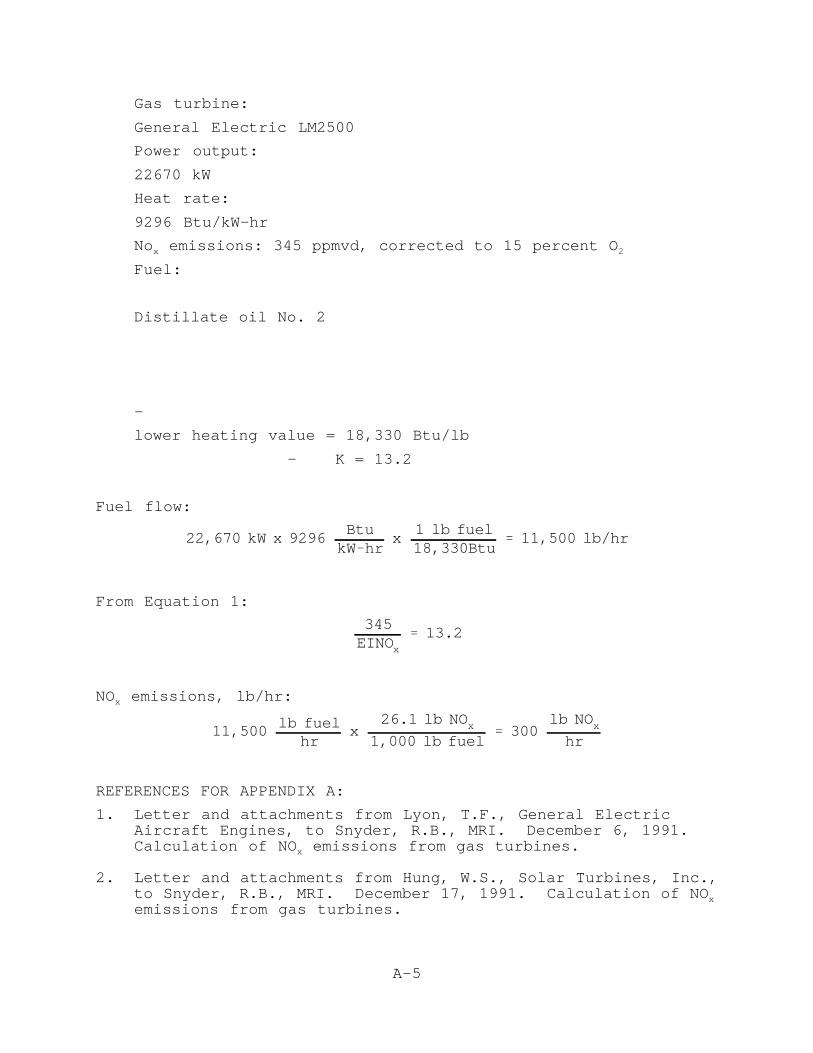
22,670 kW x 9296BtukW&hr
x1 lb fuel18,330Btu
' 11,500 lb/hr
345EINOx
' 13.2
11,500 lb fuelhr
x26.1 lb NOx
1,000 lb fuel' 300
lb NOxhr
A-5
Gas turbine:
General Electric LM2500
Power output:
22670 kW
Heat rate:
9296 Btu/kW-hr
No emissions: 345 ppmvd, corrected to 15 percent Ox 2
Fuel:
Distillate oil No. 2
-
lower heating value = 18,330 Btu/lb
- K = 13.2
Fuel flow:
From Equation 1:
NO emissions, lb/hr:x
REFERENCES FOR APPENDIX A:
1. Letter and attachments from Lyon, T.F., General ElectricAircraft Engines, to Snyder, R.B., MRI. December 6, 1991. Calculation of NO emissions from gas turbines.x
2. Letter and attachments from Hung, W.S., Solar Turbines, Inc.,to Snyder, R.B., MRI. December 17, 1991. Calculation of NOxemissions from gas turbines.


APPENDIX B. COST DATA AND METHODOLOGY USED TO PREPARE COSTFIGURES PRESENTED IN CHAPTER 6
B-1
APPENDIX B. RAW COST DATA AND COST ALGORITHMS
The maintenance costs for water injection and several of the
SCR costs presented in Chapter 5 are based on information from
turbine manufacturers and other sources that required
interpretation and analysis. Information about additional gas
turbine maintenance costs associated with water injection is
presented in Section B.1. Information on SCR capital costs,
catalyst replacement and disposal costs, and maintenance costs is
presented in Section B.2. References are listed in Section B.3.
B.1 WATER INJECTION MAINTENANCE COSTS
Information from each manufacturer and the applicable
analysis procedures used to develop maintenance cost impacts for
water injection are described in the following sections.
B.1.1 Solar
This manufacturer indicated that the annual maintenance cost
for the Centaur is $16,000/year. The cost for the Saturn was1
estimated to be $8,000. This $8,000 cost was then prorated for2
operation at 1,000/hr/yr, and was multiplied by 1.3 to account
for the additional maintenance required for oil fuel.
B.1.2 Allison
Maintenance costs for water injection were provided by a
company that packages Allison gas turbines for stationary
applications. This packager stated that for the 501 gas turbine
model, a maintenance contract is available which covers all
maintenance materials and labor costs associated with the
turbine, including all scheduled and unscheduled activities. The
cost of this contract for the 501 model is $0.0005 to $0.0010 per
KW-hour (KWH) more for water injection than for a turbine not
using water injection. For an installation operating3
8,000 hours per year at a base-rated output of 4,000 KW, and
using an average cost of $0.00075 per KWH, the annual additional
maintenance cost is $24,000. By the nature of the contract
offered, this figure represents a worst case scenario and to some
extent may exceed the actual incremental maintenance costs that
would be expected for water injection for this turbine.
B-2
B.1.3 General Electric
General Electric (GE) offers both aero-derivative type
(LM-series models) and heavy-duty type (MS-series models) gas
turbines. For the aero-derivative turbines, GE states that the
incremental maintenance cost associated with water injection is
$3.50 per fired hour. This cost is used to calculate the
maintenance cost for water injection for GE aeroderivative
turbines. No figures were provided for steam injection and no
maintenance cost was used for steam injection with these
turbines.4
Water injection also impacts the maintenance costs for the
heavy-duty MS-series models. Costs associated with more frequent
maintenance intervals required for models using water injection
have been calculated and summarized below. A GE representative
stated that the primary components which must be repaired at each
maintenance interval are the combustor liner and transition
pieces. Approximate costs to repair these pieces were provided5
by GE. For this analysis, the maximum cost estimates were used5
to calculate annual costs to accommodate repairs that may be
required periodically for injection nozzles, cross-fire tubes,
and other miscellaneous hardware. According to GE, a rule of
thumb is that if the repair cost exceeds 60 percent of the cost
of a new part, the part is replaced. The cost of a replacement5
part is therefore considered to be 1.67 times the maximum repair
cost. If water purity requirements are met, there are no
significant adverse impacts on maintenance requirements on other
turbine components, and hot gas path inspections and major
inspection schedules are not impacted. Combustion repair5
schedules, material costs, and labor hours are shown in
Table B-1. Scheduled maintenance intervals for models with water
injection were provided in Reference 6. Corresponding
maintenance intervals for models with steam injection were
assumed to be the same as models with no wet injection; these
scheduled maintenance intervals were provided in Reference 7.
Using the information in Table B-1, the total annual cost is
B-3
calculated and shown in Table B-2 for three GE heavy-duty turbine
models.
B.1.4 Asea Brown Boveri
This manufacturer states there are no maintenance impacts
associated with water injection.8
B.2 SCR COSTS
The total capital investment, catalyst replacement, and
maintenance costs are estimated based on information from the
technical literature. The cost algorithms are described in the
following sections.
B.2.1 Total Capital Investment
Total capital investment costs, which include purchased costs
and installation costs, were available for SCR systems for
combined cycle and cogeneration applications from five
sources. These costs were scaled to 1990 costs using the9-13
Chemical Engineering annual plant cost indexes and are applicable
to SCR systems in which the catalyst was placed within the heat
recovery steam generator (HRSG). In addition, estimated capital
investment costs were available from one source for SCR systems
in which a high temperature zeolite catalyst is installed
upstream of the HRSG. Both the original data and the scaled14
costs are presented in Table B-3. The scaled costs were plotted
against the turbine size and this plot is shown in Figure B-1. A
linear regression analysis was performed to determine the
equation for the line that best fits the data. This equation was
used to estimate the total capital investment for SCR for the
model plants and was extrapolated to estimate the costs for model
plants larger than 90 MW.
B.2.2 Maintenance Costs
Maintenance costs for SCR controls were obtained from four
literature sources, although 6 of the 14 points were obtained
from one article. These costs were scaled to 1990 costs9,11-13
assuming an inflation rate of five percent per year. All of the
data are for turbines that use natural gas fuel. Because there
are no data to quantify differences in SCR maintenance costs for
oil-fired applications, the available data for operation on
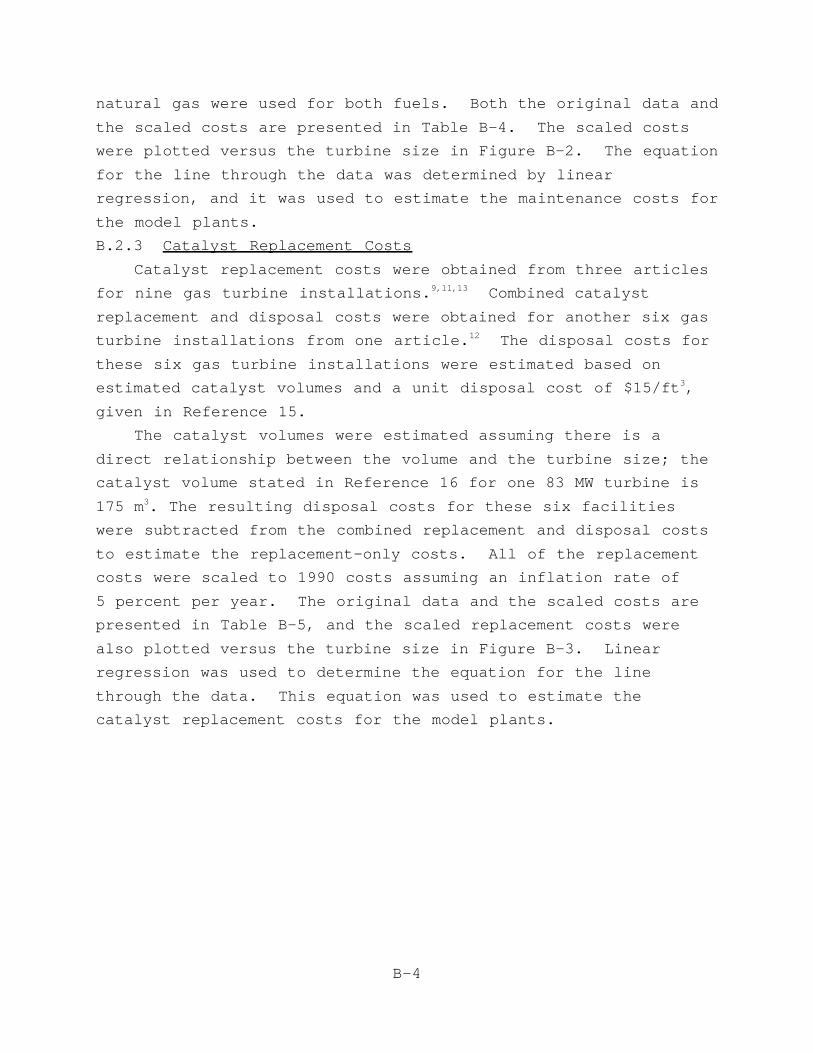
B-4
natural gas were used for both fuels. Both the original data and
the scaled costs are presented in Table B-4. The scaled costs
were plotted versus the turbine size in Figure B-2. The equation
for the line through the data was determined by linear
regression, and it was used to estimate the maintenance costs for
the model plants.
B.2.3 Catalyst Replacement Costs
Catalyst replacement costs were obtained from three articles
for nine gas turbine installations. Combined catalyst9,11,13
replacement and disposal costs were obtained for another six gas
turbine installations from one article. The disposal costs for12
these six gas turbine installations were estimated based on
estimated catalyst volumes and a unit disposal cost of $15/ft ,3
given in Reference 15.
The catalyst volumes were estimated assuming there is a
direct relationship between the volume and the turbine size; the
catalyst volume stated in Reference 16 for one 83 MW turbine is
175 m . The resulting disposal costs for these six facilities3
were subtracted from the combined replacement and disposal costs
to estimate the replacement-only costs. All of the replacement
costs were scaled to 1990 costs assuming an inflation rate of
5 percent per year. The original data and the scaled costs are
presented in Table B-5, and the scaled replacement costs were
also plotted versus the turbine size in Figure B-3. Linear
regression was used to determine the equation for the line
through the data. This equation was used to estimate the
catalyst replacement costs for the model plants.
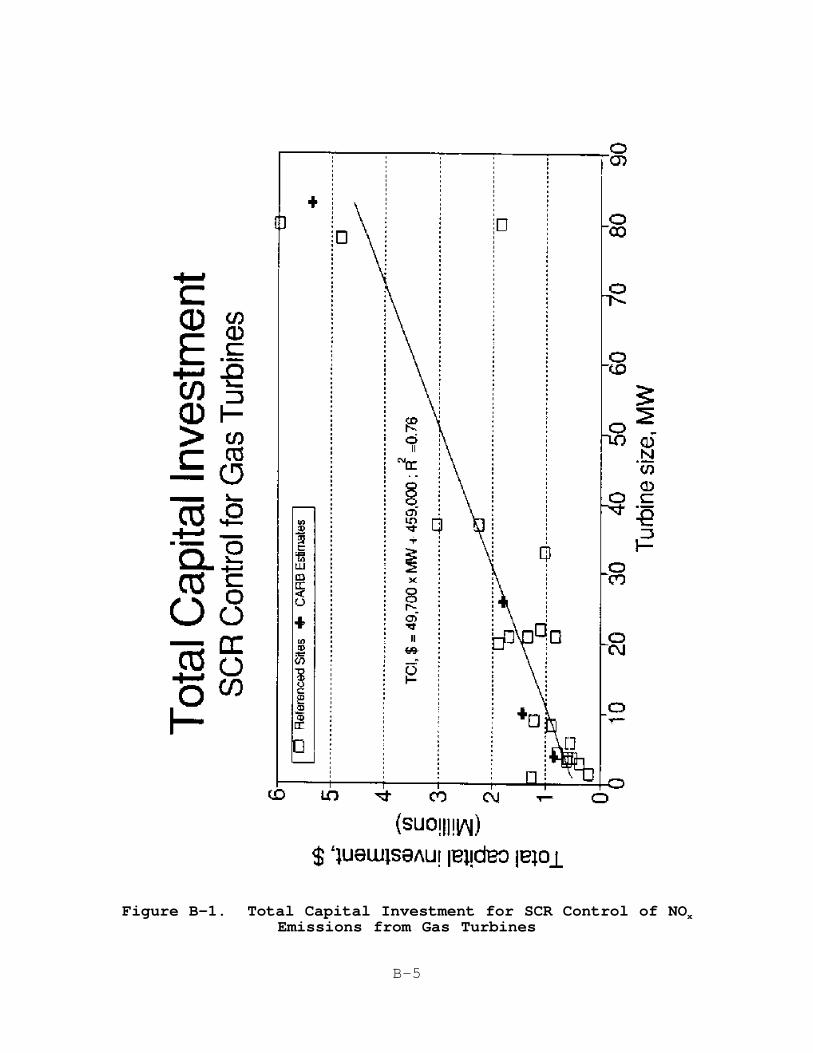
B-5
Figure B-1. Total Capital Investment for SCR Control of NOxEmissions from Gas Turbines
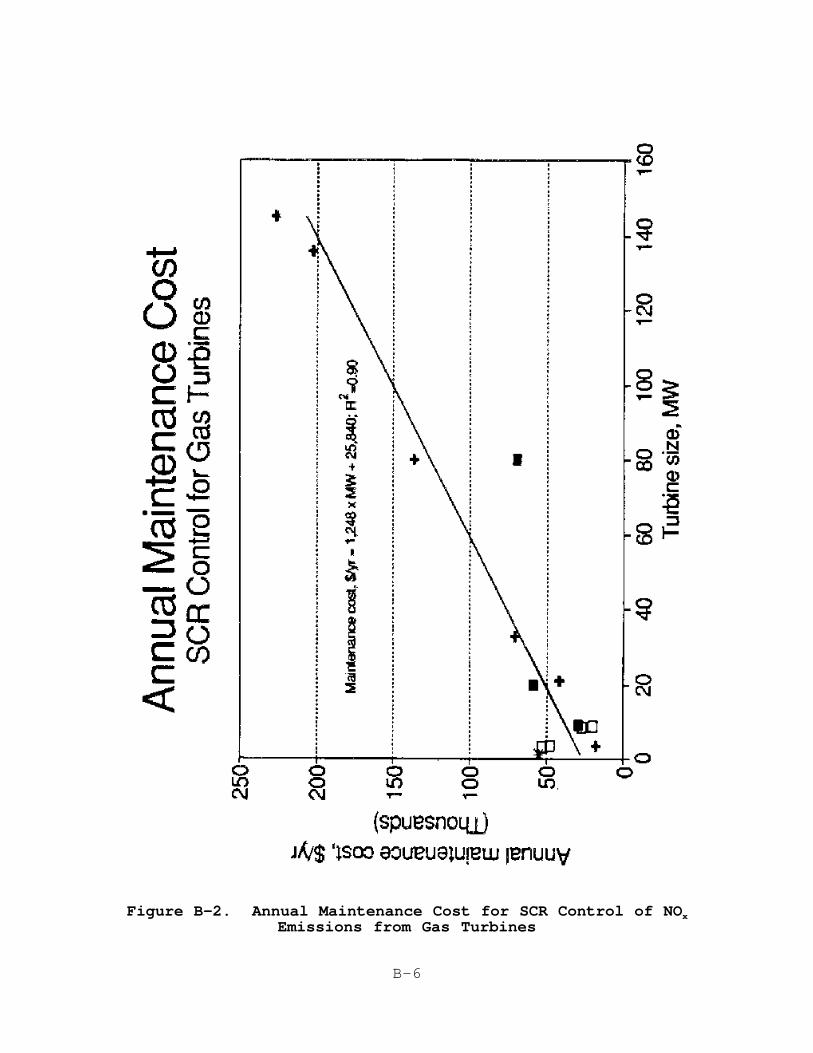
B-6
Figure B-2. Annual Maintenance Cost for SCR Control of NOxEmissions from Gas Turbines
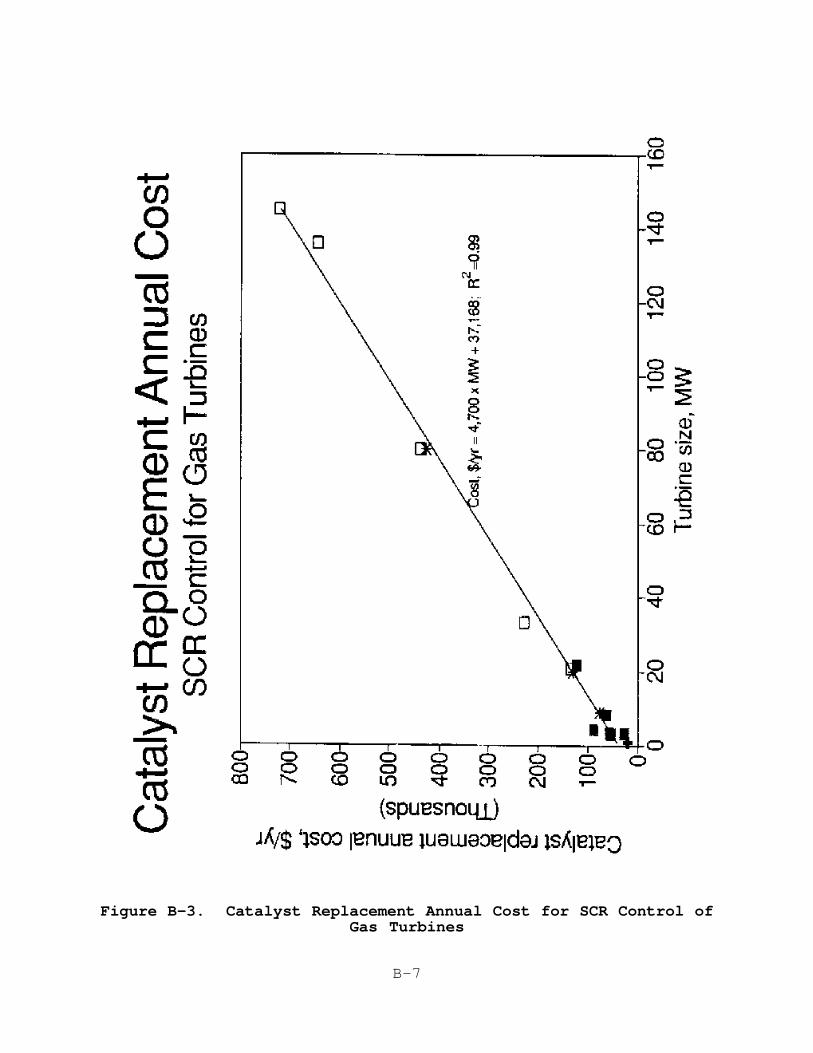
B-7
Figure B-3. Catalyst Replacement Annual Cost for SCR Control ofGas Turbines
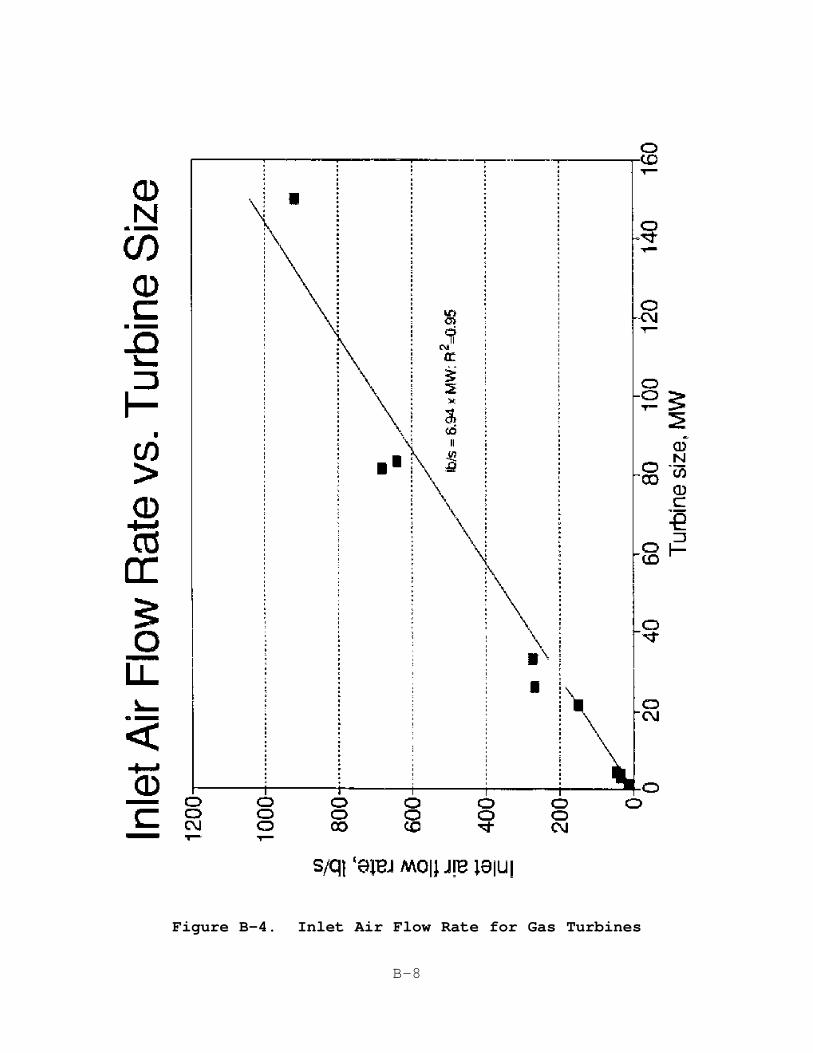
B-8
Figure B-4. Inlet Air Flow Rate for Gas Turbines

B-9

B-10

B-11

B-12

B-13
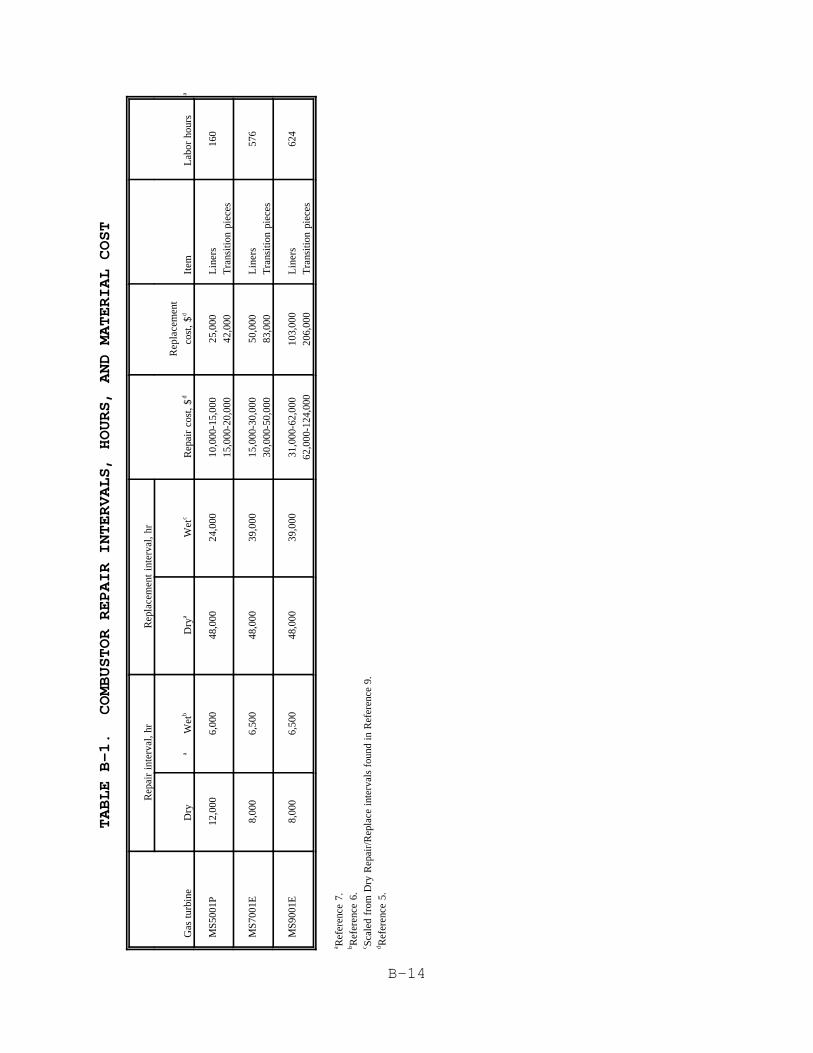
B-14
TABLE B-1. COMBUSTOR REPAIR INTERVALS, HOURS, AND MATERIAL COST
Rep
air
inte
rval
, hr
Rep
lace
men
t in
terv
al,
hr
Gas
tur
bine
Dry
aW
etb
Dry
aW
etc
Rep
air
cost
, $d
Rep
lace
men
tco
st,
$dIt
emL
abor
hou
rsa
MS5
001P
12,0
006,
000
48,0
0024
,000
10,0
00-1
5,00
015
,000
-20,
000
25,0
0042
,000
Lin
ers
Tra
nsiti
on p
iece
s16
0
MS7
001E
8,00
06,
500
48,0
0039
,000
15,0
00-3
0,00
030
,000
-50,
000
50,0
0083
,000
Lin
ers
Tra
nsiti
on p
iece
s57
6
MS9
001E
8,00
06,
500
48,0
0039
,000
31,0
00-6
2,00
062
,000
-124
,000
103,
000
206,
000
Lin
ers
Tra
nsiti
on p
iece
s62
4
Ref
eren
ce 7
.a R
efer
ence
6.
b Scal
ed f
rom
Dry
Rep
air/
Rep
lace
int
erva
ls f
ound
in
Ref
eren
ce 9
.c R
efer
ence
5.
d

B-15
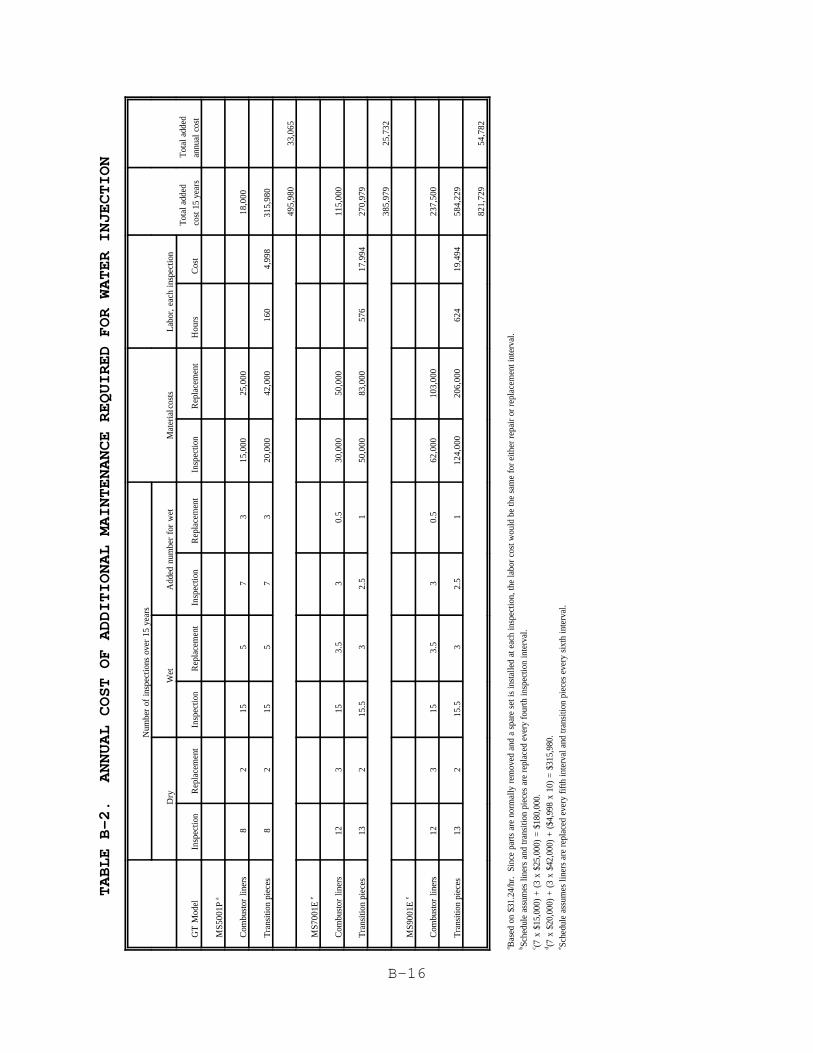
B-16
TABLE B-2. ANNUAL COST OF ADDITIONAL MAINTENANCE REQUIRED FOR WATER INJECTION
Num
ber
of i
nspe
ctio
ns o
ver
15 y
ears
Dry
Wet
Add
ed n
umbe
r fo
r w
etM
ater
ial c
osts
Lab
or,
each
ins
pect
ion
Tot
al a
dded
cost
15
year
s
Tot
al a
dded
annu
al c
ost
GT
Mod
elIn
spec
tion
Rep
lace
men
tIn
spec
tion
Rep
lace
men
tIn
spec
tion
Rep
lace
men
tIn
spec
tion
Rep
lace
men
tH
ours
Cos
t
MS5
001P
a
Com
bust
or l
iner
s8
215
57
315
,000
25,0
0018
,000
Tra
nsiti
on p
iece
s8
215
57
320
,000
42,0
0016
04,
998
315,
980
495,
980
33,0
65
MS7
001E
e
Com
bust
or l
iner
s12
315
3.5
30.
530
,000
50,0
0011
5,00
0
Tra
nsiti
on p
iece
s13
215
.53
2.5
150
,000
83,0
0057
617
,994
270,
979
385,
979
25,7
32
MS9
001E
e
Com
bust
or l
iner
s12
315
3.5
30.
562
,000
103,
000
237,
500
Tra
nsiti
on p
iece
s13
215
.53
2.5
112
4,00
020
6,00
062
419
,494
584,
229
821,
729
54,7
82
Bas
ed o
n $3
1.24
/hr.
Si
nce
part
s ar
e no
rmal
ly r
emov
ed a
nd a
spa
re s
et is
inst
alle
d at
eac
h in
spec
tion,
the
labo
r co
st w
ould
be
the
sam
e fo
r ei
ther
rep
air
or r
epla
cem
ent i
nter
val.
a Sche
dule
ass
umes
line
rs a
nd tr
ansi
tion
piec
es a
re r
epla
ced
ever
y fo
urth
insp
ectio
n in
terv
al.
b (7 x
$15
,000
) +
(3 x
$25
,000
) =
$180
,000
.c (7
x $
20,0
00)
+ (3
x $
42,0
00)
+ ($
4,99
8 x
10)
= $3
15,9
80.
d Sche
dule
ass
umes
line
rs a
re r
epla
ced
ever
y fi
fth
inte
rval
and
tran
sitio
n pi
eces
eve
ry s
ixth
inte
rval
.e

B-17
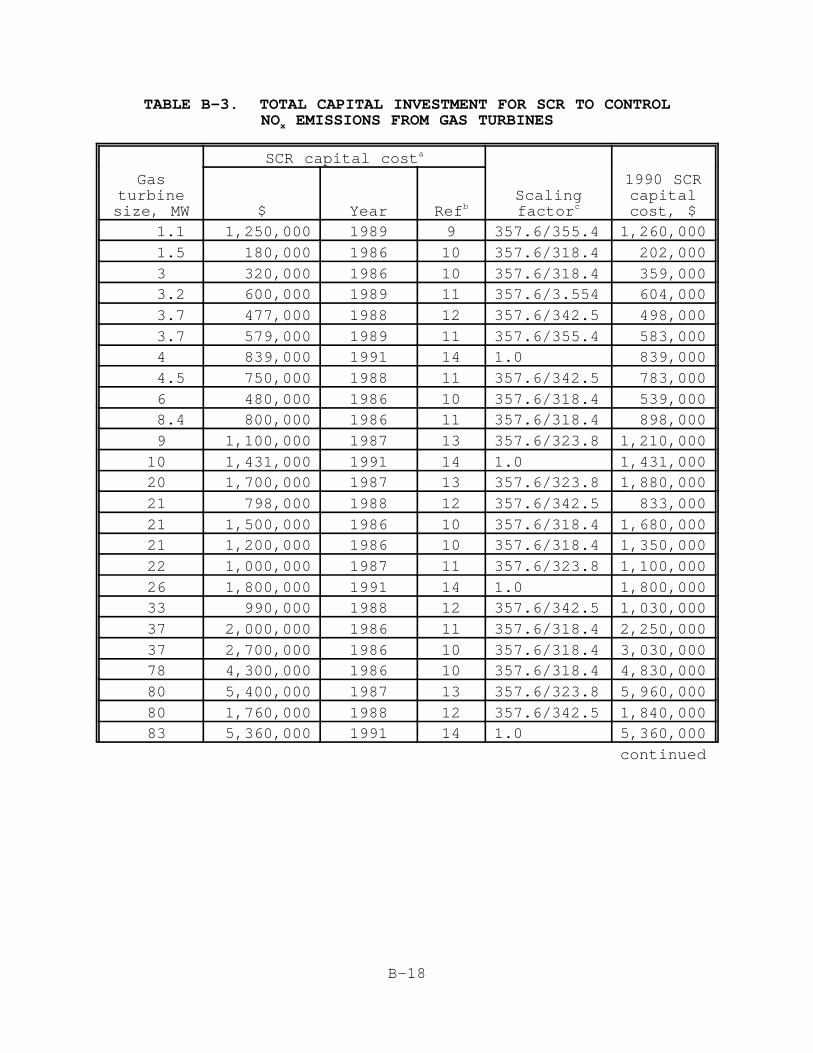
B-18
TABLE B-3. TOTAL CAPITAL INVESTMENT FOR SCR TO CONTROLNO EMISSIONS FROM GAS TURBINESx
SCR capital costa
Gas 1990 SCRturbine Scaling capitalsize, MW $ Year Ref factor cost, $b c
1.1 1,250,000 1989 9 357.6/355.4 1,260,000
1.5 180,000 1986 10 357.6/318.4 202,000
3 320,000 1986 10 357.6/318.4 359,0003.2 600,000 1989 11 357.6/3.554 604,000
3.7 477,000 1988 12 357.6/342.5 498,000
3.7 579,000 1989 11 357.6/355.4 583,0004 839,000 1991 14 1.0 839,000
4.5 750,000 1988 11 357.6/342.5 783,000
6 480,000 1986 10 357.6/318.4 539,0008.4 800,000 1986 11 357.6/318.4 898,000
9 1,100,000 1987 13 357.6/323.8 1,210,000
10 1,431,000 1991 14 1.0 1,431,00020 1,700,000 1987 13 357.6/323.8 1,880,000
21 798,000 1988 12 357.6/342.5 833,000
21 1,500,000 1986 10 357.6/318.4 1,680,00021 1,200,000 1986 10 357.6/318.4 1,350,000
22 1,000,000 1987 11 357.6/323.8 1,100,000
26 1,800,000 1991 14 1.0 1,800,00033 990,000 1988 12 357.6/342.5 1,030,000
37 2,000,000 1986 11 357.6/318.4 2,250,000
37 2,700,000 1986 10 357.6/318.4 3,030,00078 4,300,000 1986 10 357.6/318.4 4,830,000
80 5,400,000 1987 13 357.6/323.8 5,960,000
80 1,760,000 1988 12 357.6/342.5 1,840,00083 5,360,000 1991 14 1.0 5,360,000
continued
B-19
TABLE B-3. (Continued)
Total capital costs were provided by several sources, but it isa
not clear that they are on the same basis. For example, it islikely that the type of catalyst varies and the target NOxreduction efficiency may also vary. In addition, some estimatesmay not include costs for emission monitors; auxiliary equipmentlike the ammonia storage, handling, and transfer system; taxesand freight; or installation.Reference 12 also provided costs for SCR used with 136 MW andb
145 MW turbines. All of the costs for this reference are lowerthan the costs from other sources, and the differentialincreases as the turbine size increases. Because there are nocosts from other sources for such large turbines, these two datapoints would exert undue influence on the analysis; therefore,they have been excluded. Costs for large model plants wereestimated by extrapolating with the equation determined bylinear regression through the data for turbines with capacitiesless than 90 MW (see Figure B-1).Costs for years prior to 1990 are adjusted to 1990 dollarsc
based on the annual CE plant cost indexes. Costs estimated in1991 dollars were not adjusted.
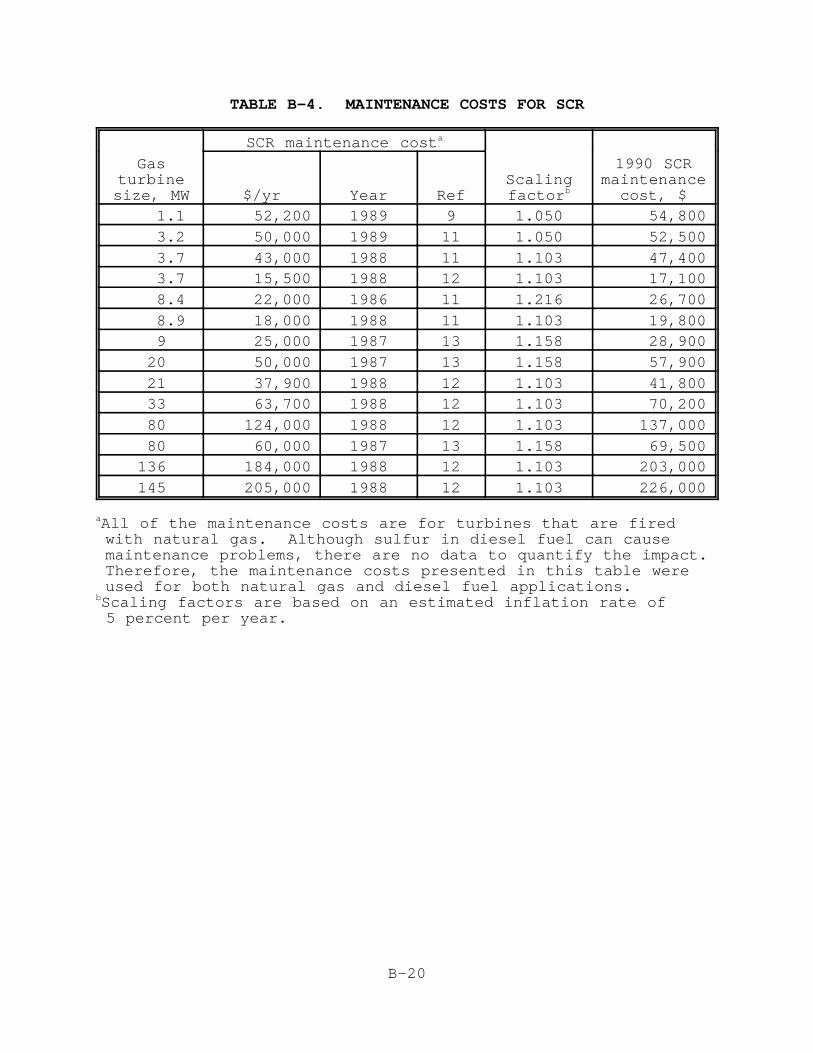
B-20
TABLE B-4. MAINTENANCE COSTS FOR SCR
SCR maintenance costa
Gas 1990 SCRturbine Scaling maintenancesize, MW $/yr Year Ref factor cost, $b
1.1 52,200 1989 9 1.050 54,800
3.2 50,000 1989 11 1.050 52,500
3.7 43,000 1988 11 1.103 47,4003.7 15,500 1988 12 1.103 17,100
8.4 22,000 1986 11 1.216 26,700
8.9 18,000 1988 11 1.103 19,8009 25,000 1987 13 1.158 28,900
20 50,000 1987 13 1.158 57,900
21 37,900 1988 12 1.103 41,80033 63,700 1988 12 1.103 70,200
80 124,000 1988 12 1.103 137,000
80 60,000 1987 13 1.158 69,500136 184,000 1988 12 1.103 203,000
145 205,000 1988 12 1.103 226,000
All of the maintenance costs are for turbines that are fireda
with natural gas. Although sulfur in diesel fuel can causemaintenance problems, there are no data to quantify the impact. Therefore, the maintenance costs presented in this table wereused for both natural gas and diesel fuel applications.Scaling factors are based on an estimated inflation rate ofb
5 percent per year.
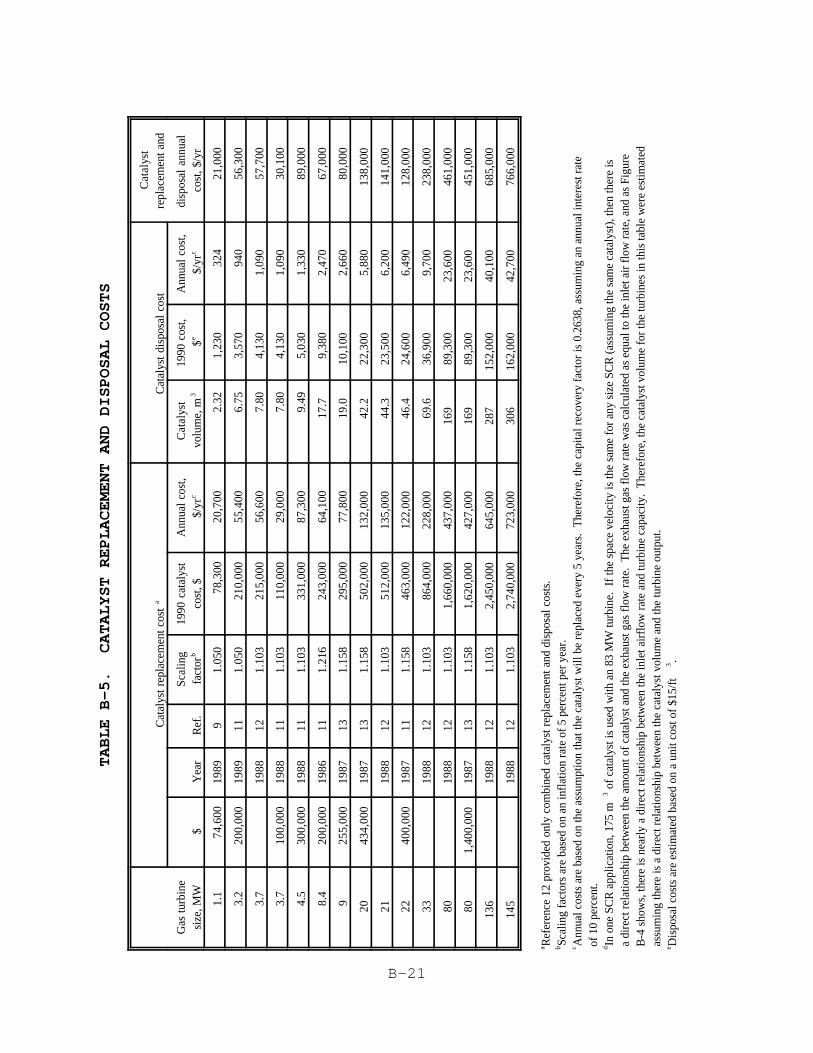
B-21
TABLE B-5. CATALYST REPLACEMENT AND DISPOSAL COSTS
Cat
alys
t rep
lace
men
t cos
ta
Cat
alys
t di
spos
al c
ost
Cat
alys
tre
plac
emen
t and
Gas
turb
ine
size
, MW
$Y
ear
Ref
.Sc
alin
gfa
ctor
b
1990
cat
alys
tco
st, $
Ann
ual
cost
,$/
yrc
Cat
alys
tvo
lum
e, m
3
1990
cos
t,$e
Ann
ual
cost
,$/
yrc
disp
osal
ann
ual
cost
, $/y
r
1.1
74,6
0019
899
1.05
078
,300
20,7
002.
321,
230
324
21,0
00
3.2
200,
000
1989
111.
050
210,
000
55,4
006.
753,
570
940
56,3
00
3.7
1988
121.
103
215,
000
56,6
007.
804,
130
1,09
057
,700
3.7
100,
000
1988
111.
103
110,
000
29,0
007.
804,
130
1,09
030
,100
4.5
300,
000
1988
111.
103
331,
000
87,3
009.
495,
030
1,33
089
,000
8.4
200,
000
1986
111.
216
243,
000
64,1
0017
.79,
380
2,47
067
,000
925
5,00
019
8713
1.15
829
5,00
077
,800
19.0
10,1
002,
660
80,0
00
2043
4,00
019
8713
1.15
850
2,00
013
2,00
042
.222
,300
5,88
013
8,00
0
2119
8812
1.10
351
2,00
013
5,00
044
.323
,500
6,20
014
1,00
0
2240
0,00
019
8711
1.15
846
3,00
012
2,00
046
.424
,600
6,49
012
8,00
0
3319
8812
1.10
386
4,00
022
8,00
069
.636
,900
9,70
023
8,00
0
8019
8812
1.10
31,
660,
000
437,
000
169
89,3
0023
,600
461,
000
801,
400,
000
1987
131.
158
1,62
0,00
042
7,00
016
989
,300
23,6
0045
1,00
0
136
1988
121.
103
2,45
0,00
064
5,00
028
715
2,00
040
,100
685,
000
145
1988
121.
103
2,74
0,00
072
3,00
030
616
2,00
042
,700
766,
000
Ref
eren
ce 1
2 pr
ovid
ed o
nly
com
bine
d ca
taly
st r
epla
cem
ent a
nd d
ispo
sal c
osts
.a Sc
alin
g fa
ctor
s ar
e ba
sed
on a
n in
flat
ion
rate
of
5 pe
rcen
t per
yea
r.b A
nnua
l cos
ts a
re b
ased
on
the
assu
mpt
ion
that
the
cata
lyst
will
be
repl
aced
eve
ry 5
yea
rs.
The
refo
re, t
he c
apita
l rec
over
y fa
ctor
is 0
.263
8, a
ssum
ing
an a
nnua
l int
eres
t rat
ec o
f 10
per
cent
.In
one
SC
R a
pplic
atio
n, 1
75 m
of
cata
lyst
is u
sed
with
an
83 M
W tu
rbin
e. I
f th
e sp
ace
velo
city
is th
e sa
me
for
any
size
SC
R (
assu
min
g th
e sa
me
cata
lyst
), th
en th
ere
isd
3
a d
irec
t rel
atio
nshi
p be
twee
n th
e am
ount
of
cata
lyst
and
the
exha
ust g
as f
low
rat
e. T
he e
xhau
st g
as f
low
rat
e w
as c
alcu
late
d as
equ
al to
the
inle
t air
flo
w r
ate,
and
as
Figu
re B
-4 s
how
s, th
ere
is n
earl
y a
dire
ct r
elat
ions
hip
betw
een
the
inle
t air
flow
rat
e an
d tu
rbin
e ca
paci
ty.
The
refo
re, t
he c
atal
yst v
olum
e fo
r th
e tu
rbin
es in
this
tabl
e w
ere
estim
ated
ass
umin
g th
ere
is a
dir
ect r
elat
ions
hip
betw
een
the
cata
lyst
vol
ume
and
the
turb
ine
outp
ut.
Dis
posa
l cos
ts a
re e
stim
ated
bas
ed o
n a
unit
cost
of
$15/
ft.
e3
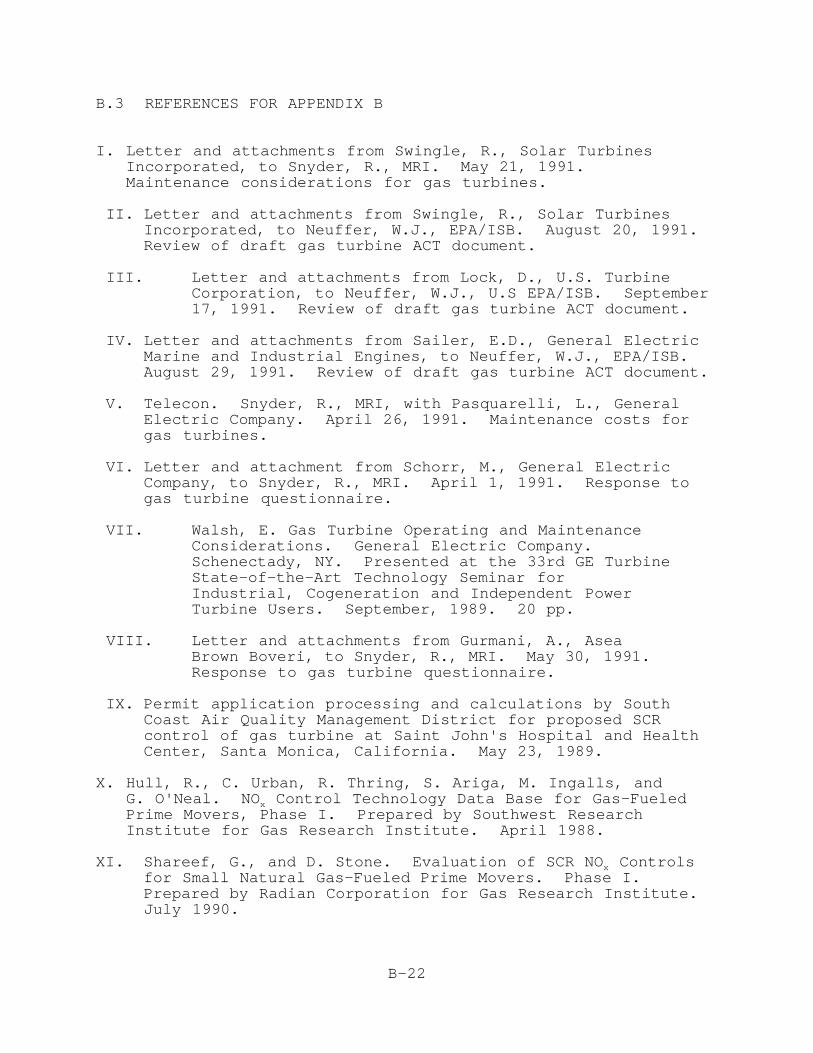
B-22
B.3 REFERENCES FOR APPENDIX B
I. Letter and attachments from Swingle, R., Solar Turbines
Incorporated, to Snyder, R., MRI. May 21, 1991. Maintenance considerations for gas turbines.
II. Letter and attachments from Swingle, R., Solar TurbinesIncorporated, to Neuffer, W.J., EPA/ISB. August 20, 1991. Review of draft gas turbine ACT document.
III. Letter and attachments from Lock, D., U.S. TurbineCorporation, to Neuffer, W.J., U.S EPA/ISB. September17, 1991. Review of draft gas turbine ACT document.
IV. Letter and attachments from Sailer, E.D., General ElectricMarine and Industrial Engines, to Neuffer, W.J., EPA/ISB. August 29, 1991. Review of draft gas turbine ACT document.
V. Telecon. Snyder, R., MRI, with Pasquarelli, L., GeneralElectric Company. April 26, 1991. Maintenance costs forgas turbines.
VI. Letter and attachment from Schorr, M., General ElectricCompany, to Snyder, R., MRI. April 1, 1991. Response togas turbine questionnaire.
VII. Walsh, E. Gas Turbine Operating and MaintenanceConsiderations. General Electric Company. Schenectady, NY. Presented at the 33rd GE TurbineState-of-the-Art Technology Seminar forIndustrial, Cogeneration and Independent PowerTurbine Users. September, 1989. 20 pp.
VIII. Letter and attachments from Gurmani, A., AseaBrown Boveri, to Snyder, R., MRI. May 30, 1991. Response to gas turbine questionnaire.
IX. Permit application processing and calculations by SouthCoast Air Quality Management District for proposed SCRcontrol of gas turbine at Saint John's Hospital and HealthCenter, Santa Monica, California. May 23, 1989.
X. Hull, R., C. Urban, R. Thring, S. Ariga, M. Ingalls, andG. O'Neal. NO Control Technology Data Base for Gas-FueledxPrime Movers, Phase I. Prepared by Southwest ResearchInstitute for Gas Research Institute. April 1988.
XI. Shareef, G., and D. Stone. Evaluation of SCR NO Controlsxfor Small Natural Gas-Fueled Prime Movers. Phase I. Prepared by Radian Corporation for Gas Research Institute. July 1990.
B-23
XII. Sidebotham, G., and R. Williams. Technology of NO Controlxfor Stationary Gas Turbines. Center for EnvironmentalStudies. Princeton University. January 1989.
XIII. Prosl, T., DuPont,and Scrivner, G., Dow. Technical Arguments and Economic Impact of SCR'sUse for NO Reduction of Combustion Turbine forxCogeneration. Paper presented at EPA Region 6meeting concerning NO abatement of CombustionxTurbines. December 17, 1987.
XIV. State of California Air Resources Board. Draft ProposedDetermination of Reasonably Available Control Technology AndBest Available Retrofit Technology for Stationary GasTurbines. August, 1991. Appendix C.
XV. Letter and attachments from Henegan, D., Norton Company,to Snyder, R., MRI. March 28, 1991. Response to SCRquestionnaire.
XVI. Schorr, M. NO Control for Gas Turbines: Regulations andxTechnology. General Electric Company. Schenectady, NewYork. Paper presented at the Council of Industrial BoilerOwners NO Control IV Conference. Concord, California. xFebruary 11-12, 1991. 11 pp.