Acs 2012 1 year estimates for norfolk compiled time series
33
CP05 ACS DEMOGRAPHIC AND HOUSING ESTIMATES 2012 American Community Survey 1-Year Estimates Supporting documentation on code lists, subject definitions, data accuracy, and statistical testing can be found on the American Community Survey website in the Data and Documentation section. Sample size and data quality measures (including coverage rates, allocation rates, and response rates) can be found on the American Community Survey website in the Methodology section. Although the American Community Survey (ACS) produces population, demographic and housing unit estimates, it is the Census Bureau's Population Estimates Program that produces and disseminates the official estimates of the population for the nation, states, counties, cities and towns and estimates of housing units for states and counties. An * indicates that the estimate is significantly different (at a 90% confidence level) than the estimate from the most current year. A "c" indicates the estimates for that year and the current year are both controlled; a statistical test is not appropriate. Subject Norfolk city, Virginia 2012 Estimate 2011 Estimate 2012 - 2011 Statistical Significance 2010 Estimate 2012 - 2010 Statistical Significance SEX AND AGE Total population 245,782 242,628 c 243,135 c Male 52.0% 51.5% * 51.9% Female 48.0% 48.5% * 48.1% Under 5 years 6.9% 7.0% 6.8% 5 to 9 years 6.1% 5.6% 5.7% 10 to 14 years 5.0% 5.5% 5.2% 15 to 19 years 7.4% 7.1% 7.3% 20 to 24 years 14.9% 15.2% 15.5% 25 to 34 years 18.0% 17.4% * 16.9% * 35 to 44 years 11.0% 11.0% 11.8% * 45 to 54 years 11.6% 12.2% * 12.1% * 55 to 59 years 5.2% 5.5% 5.0% 60 to 64 years 4.4% 4.2% 3.9% 65 to 74 years 5.0% 4.8% * 4.9% 75 to 84 years 3.0% 3.3% 3.7% * 85 years and over 1.5% 1.3% 1.1% * Median age (years) 29.6 29.7 29.8 18 years and over 79.3% 79.1% * 79.2% 21 years and over 71.9% 71.9% 71.6% 62 years and over 12.0% 11.7% 11.8% 65 years and over 9.6% 9.4% * 9.7% 18 years and over 194,930 191,815 * 192,658 * Male 52.4% 51.9% * 52.1% Female 47.6% 48.1% * 47.9% 65 years and over 23,551 22,732 * 23,552 Male 40.6% 40.3% 41.2% 1 of 6 09/19/2013
-
Upload
sarah-parker -
Category
Documents
-
view
220 -
download
2
description
Â
Transcript of Acs 2012 1 year estimates for norfolk compiled time series

CP05 ACS DEMOGRAPHIC AND HOUSING ESTIMATES
2012 American Community Survey 1-Year Estimates
Supporting documentation on code lists, subject definitions, data accuracy, and statistical testing can be found on the American Community Surveywebsite in the Data and Documentation section.
Sample size and data quality measures (including coverage rates, allocation rates, and response rates) can be found on the American CommunitySurvey website in the Methodology section.
Although the American Community Survey (ACS) produces population, demographic and housing unit estimates, it is the Census Bureau's PopulationEstimates Program that produces and disseminates the official estimates of the population for the nation, states, counties, cities and towns andestimates of housing units for states and counties.
An * indicates that the estimate is significantly different (at a 90% confidence level) than the estimate from the most current year. A "c" indicates theestimates for that year and the current year are both controlled; a statistical test is not appropriate.
Subject Norfolk city, Virginia
2012 Estimate 2011 Estimate 2012 - 2011Statistical
Significance
2010 Estimate 2012 - 2010Statistical
SignificanceSEX AND AGE
Total population 245,782 242,628 c 243,135 c Male 52.0% 51.5% * 51.9% Female 48.0% 48.5% * 48.1%
Under 5 years 6.9% 7.0% 6.8% 5 to 9 years 6.1% 5.6% 5.7% 10 to 14 years 5.0% 5.5% 5.2% 15 to 19 years 7.4% 7.1% 7.3% 20 to 24 years 14.9% 15.2% 15.5% 25 to 34 years 18.0% 17.4% * 16.9% * 35 to 44 years 11.0% 11.0% 11.8% * 45 to 54 years 11.6% 12.2% * 12.1% * 55 to 59 years 5.2% 5.5% 5.0% 60 to 64 years 4.4% 4.2% 3.9% 65 to 74 years 5.0% 4.8% * 4.9% 75 to 84 years 3.0% 3.3% 3.7% * 85 years and over 1.5% 1.3% 1.1% *
Median age (years) 29.6 29.7 29.8
18 years and over 79.3% 79.1% * 79.2% 21 years and over 71.9% 71.9% 71.6% 62 years and over 12.0% 11.7% 11.8% 65 years and over 9.6% 9.4% * 9.7%
18 years and over 194,930 191,815 * 192,658 * Male 52.4% 51.9% * 52.1% Female 47.6% 48.1% * 47.9%
65 years and over 23,551 22,732 * 23,552 Male 40.6% 40.3% 41.2%
1 of 6 09/19/2013

Subject Norfolk city, Virginia
2012 Estimate 2011 Estimate 2012 - 2011Statistical
Significance
2010 Estimate 2012 - 2010Statistical
Significance Female 59.4% 59.7% 58.8%
RACE
Total population 245,782 242,628 c 243,135 c One race 96.0% 96.1% 97.1% * Two or more races 4.0% 3.9% 2.9% *
One race 96.0% 96.1% 97.1% * White 47.9% 47.6% 48.0% Black or African American 42.4% 42.3% 44.4% * American Indian and Alaska Native 0.4% 0.4% 0.3% Cherokee tribal grouping N N N Chippewa tribal grouping N N N Navajo tribal grouping N N N Sioux tribal grouping N N N Asian 2.7% 3.5% * 3.4% * Asian Indian 0.0% 0.4% * 0.5% * Chinese 0.4% 0.2% 0.4% Filipino 1.7% 2.1% 1.2% Japanese 0.1% 0.1% 0.4% Korean 0.1% 0.3% 0.4% * Vietnamese 0.1% 0.2% 0.3% Other Asian 0.3% 0.3% 0.3% Native Hawaiian and Other Pacific Islander 0.2% 0.2% 0.4% Native Hawaiian N N N Guamanian or Chamorro N N N Samoan N N N Other Pacific Islander N N N Some other race 2.3% 2.1% 0.6% * Two or more races 4.0% 3.9% 2.9% * White and Black or African American 1.3% 1.3% 1.0% White and American Indian and Alaska Native 0.4% 0.5% 0.4% White and Asian 0.7% 0.8% 0.3% * Black or African American and American Indian andAlaska Native
0.2% 0.3% 0.2%
Race alone or in combination with one or more otherraces Total population 245,782 242,628 c 243,135 c White 51.3% 50.7% 50.5% Black or African American 44.6% 44.6% 45.7% * American Indian and Alaska Native 1.5% 1.3% 1.0% Asian 4.3% 4.9% * 4.3% Native Hawaiian and Other Pacific Islander 0.7% 0.3% 0.6% Some other race 2.6% 2.4% 1.3% *
HISPANIC OR LATINO AND RACE
Total population 245,782 242,628 c 243,135 c Hispanic or Latino (of any race) 7.2% 6.9% c 6.7% c Mexican 3.0% 1.9% * 1.9% * Puerto Rican 2.0% 1.6% 2.5% Cuban 0.1% 0.1% 0.2% Other Hispanic or Latino 2.1% 3.2% * 2.0% Not Hispanic or Latino 92.8% 93.1% c 93.3% c White alone 44.2% 44.4% 44.1% Black or African American alone 41.3% 41.1% 43.1% * American Indian and Alaska Native alone 0.4% 0.2% 0.3% Asian alone 2.7% 3.4% * 3.4% * Native Hawaiian and Other Pacific Islander alone 0.2% 0.2% 0.1%
2 of 6 09/19/2013

Subject Norfolk city, Virginia
2012 Estimate 2011 Estimate 2012 - 2011Statistical
Significance
2010 Estimate 2012 - 2010Statistical
Significance Some other race alone 0.4% 0.4% 0.1% Two or more races 3.7% 3.3% 2.2% * Two races including Some other race 0.0% 0.0% 0.3% * Two races excluding Some other race, and Three ormore races
3.6% 3.3% 2.0% *
Total housing units 95,435 95,021 95,123
3 of 6 09/19/2013
Subject Norfolk city, Virginia
2009 Estimate 2012 - 2009Statistical
Significance
2008 Estimate 2012 - 2008Statistical
SignificanceSEX AND AGE
Total population (X) (X) Male (X) (X) Female (X) (X)
Under 5 years (X) (X) 5 to 9 years (X) (X) 10 to 14 years (X) (X) 15 to 19 years (X) (X) 20 to 24 years (X) (X) 25 to 34 years (X) (X) 35 to 44 years (X) (X) 45 to 54 years (X) (X) 55 to 59 years (X) (X) 60 to 64 years (X) (X) 65 to 74 years (X) (X) 75 to 84 years (X) (X) 85 years and over (X) (X)
Median age (years) (X) (X)
18 years and over (X) (X) 21 years and over (X) (X) 62 years and over (X) (X) 65 years and over (X) (X)
18 years and over (X) (X) Male (X) (X) Female (X) (X)
65 years and over (X) (X) Male (X) (X) Female (X) (X)
RACE
Total population (X) (X) One race (X) (X) Two or more races (X) (X)
One race (X) (X) White (X) (X) Black or African American (X) (X) American Indian and Alaska Native (X) (X) Cherokee tribal grouping (X) (X) Chippewa tribal grouping (X) (X) Navajo tribal grouping (X) (X) Sioux tribal grouping (X) (X) Asian (X) (X) Asian Indian (X) (X) Chinese (X) (X) Filipino (X) (X) Japanese (X) (X) Korean (X) (X) Vietnamese (X) (X) Other Asian (X) (X) Native Hawaiian and Other Pacific Islander (X) (X) Native Hawaiian (X) (X) Guamanian or Chamorro (X) (X)
4 of 6 09/19/2013
Subject Norfolk city, Virginia
2009 Estimate 2012 - 2009Statistical
Significance
2008 Estimate 2012 - 2008Statistical
Significance Samoan (X) (X) Other Pacific Islander (X) (X) Some other race (X) (X) Two or more races (X) (X) White and Black or African American (X) (X) White and American Indian and Alaska Native (X) (X) White and Asian (X) (X) Black or African American and American Indian andAlaska Native
(X) (X)
Race alone or in combination with one or more otherraces Total population (X) (X) White (X) (X) Black or African American (X) (X) American Indian and Alaska Native (X) (X) Asian (X) (X) Native Hawaiian and Other Pacific Islander (X) (X) Some other race (X) (X)
HISPANIC OR LATINO AND RACE
Total population (X) (X) Hispanic or Latino (of any race) (X) (X) Mexican (X) (X) Puerto Rican (X) (X) Cuban (X) (X) Other Hispanic or Latino (X) (X) Not Hispanic or Latino (X) (X) White alone (X) (X) Black or African American alone (X) (X) American Indian and Alaska Native alone (X) (X) Asian alone (X) (X) Native Hawaiian and Other Pacific Islander alone (X) (X) Some other race alone (X) (X) Two or more races (X) (X) Two races including Some other race (X) (X) Two races excluding Some other race, and Three ormore races
(X) (X)
Total housing units (X) (X)
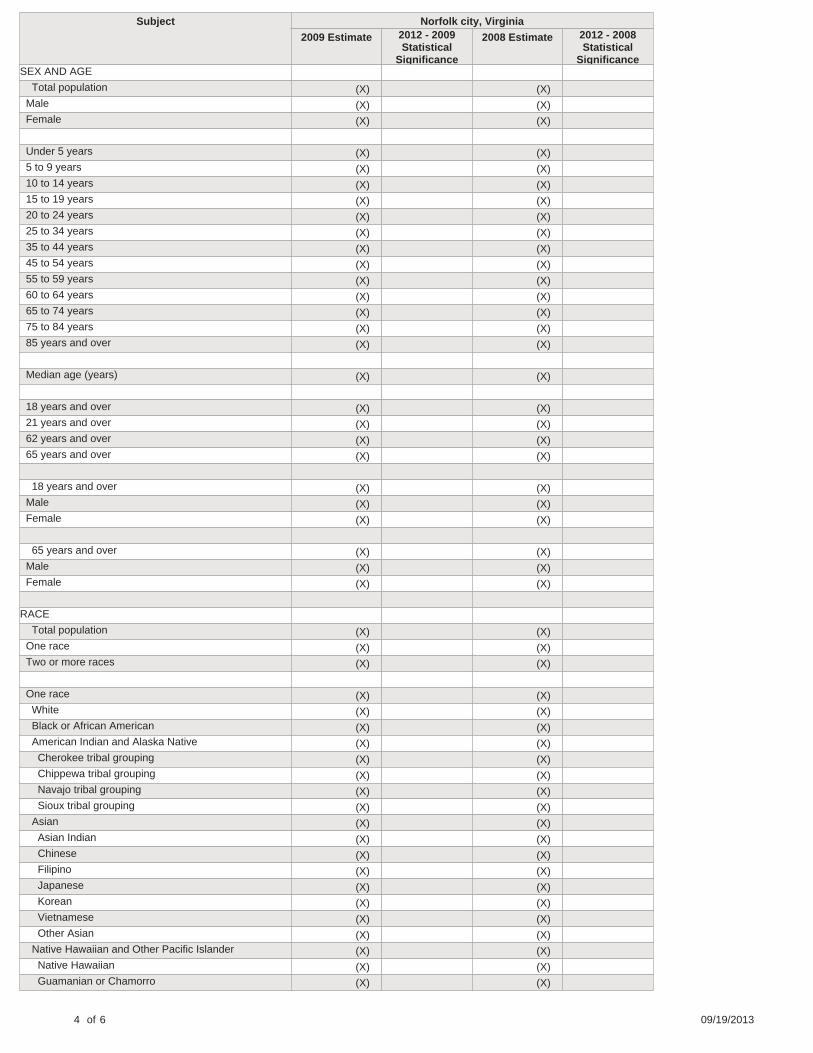
Data are based on a sample and are subject to sampling variability. The degree of uncertainty for an estimate arising from sampling variability isrepresented through the use of a margin of error. The value shown here is the 90 percent margin of error. The margin of error can be interpretedroughly as providing a 90 percent probability that the interval defined by the estimate minus the margin of error and the estimate plus the margin oferror (the lower and upper confidence bounds) contains the true value. In addition to sampling variability, the ACS estimates are subject tononsampling error (for a discussion of nonsampling variability, see Accuracy of the Data). The effect of nonsampling error is not represented in thesetables.
The 2008-2009 ACS one year estimates use controls that are based on Census 2000, while the 2010-2012 ACS one year estimates use controls thatare based on 2010 Census, which create differences in the population estimates. Therefore, estimates for 2008-2009 are suppressed in thiscomparison table and shown with an (X). For more details, visit the ACS Research Note Change in Population Controls [PDF 366K].
The ACS questions on Hispanic origin and race were revised in 2008 to make them consistent with the Census 2010 question wording. Any changesin estimates for 2008 and beyond may be due to demographic changes, as well as factors including questionnaire changes, differences in ACSpopulation controls, and methodological differences in the population estimates, and therefore should be used with caution. For a summary ofquestionnaire changes see http://www.census.gov/acs/www/methodology/questionnaire_changes/. For more information about changes in theestimates see http://www.census.gov/population/hispanic/files/acs08researchnote.pdf.
For more information on understanding race and Hispanic origin data, please see the Census 2010 Brief entitled, Overview of Race and
5 of 6 09/19/2013

Hispanic Origin: 2010, issued March 2011. (pdf format)
While the 2012 American Community Survey (ACS) data generally reflect the December 2009 Office of Management and Budget (OMB) definitions ofmetropolitan and micropolitan statistical areas; in certain instances the names, codes, and boundaries of the principal cities shown in ACS tables maydiffer from the OMB definitions due to differences in the effective dates of the geographic entities.
Estimates of urban and rural population, housing units, and characteristics reflect boundaries of urban areas defined based on Census 2000 data.Boundaries for urban areas have not been updated since Census 2000. As a result, data for urban and rural areas from the ACS do not necessarilyreflect the results of ongoing urbanization.
Source: U.S. Census Bureau, 2012 American Community Survey
Explanation of Symbols:
1. An '**' entry in the margin of error column indicates that either no sample observations or too few sample observations were available tocompute a standard error and thus the margin of error. A statistical test is not appropriate. 2. An '-' entry in the estimate column indicates that either no sample observations or too few sample observations were available to compute anestimate, or a ratio of medians cannot be calculated because one or both of the median estimates falls in the lowest interval or upper interval of anopen-ended distribution. 3. An '-' following a median estimate means the median falls in the lowest interval of an open-ended distribution. 4. An '+' following a median estimate means the median falls in the upper interval of an open-ended distribution. 5. An '***' entry in the margin of error column indicates that the median falls in the lowest interval or upper interval of an open-ended distribution. Astatistical test is not appropriate. 6. An '*****' entry in the margin of error column indicates that the estimate is controlled. A statistical test for sampling variability is not appropriate. 7. An 'N' entry in the estimate and margin of error columns indicates that data for this geographic area cannot be displayed because the number ofsample cases is too small. 8. An '(X)' means that the estimate is not applicable or not available.

CP02 SELECTED SOCIAL CHARACTERISTICS IN THE UNITED STATES
2012 American Community Survey 1-Year Estimates
Supporting documentation on code lists, subject definitions, data accuracy, and statistical testing can be found on the American Community Surveywebsite in the Data and Documentation section.
Sample size and data quality measures (including coverage rates, allocation rates, and response rates) can be found on the American CommunitySurvey website in the Methodology section.
Although the American Community Survey (ACS) produces population, demographic and housing unit estimates, it is the Census Bureau's PopulationEstimates Program that produces and disseminates the official estimates of the population for the nation, states, counties, cities and towns andestimates of housing units for states and counties.
An * indicates that the estimate is significantly different (at a 90% confidence level) than the estimate from the most current year. A "c" indicates theestimates for that year and the current year are both controlled; a statistical test is not appropriate.
Subject Norfolk city, Virginia
2012 Estimate 2011 Estimate 2012 - 2011Statistical
Significance
2010 Estimate 2012 - 2010Statistical
SignificanceHOUSEHOLDS BY TYPE
Total households 86,347 86,480 83,828 Family households (families) 59.9% 57.0% 54.1% * With own children under 18 years 28.5% 25.7% 25.2% * Married-couple family 36.4% 33.5% * 32.3% * With own children under 18 years 15.8% 12.7% * 13.2% * Male householder, no wife present, family 5.8% 5.0% 5.1% With own children under 18 years 2.8% 2.0% 2.3% Female householder, no husband present, family 17.7% 18.6% 16.7% With own children under 18 years 10.0% 11.0% 9.8% Nonfamily households 40.1% 43.0% 45.9% * Householder living alone 29.6% 32.2% 37.3% * 65 years and over 8.2% 8.4% 9.9% *
Households with one or more people under 18 years 33.0% 30.6% 28.7% *
Households with one or more people 65 years and over 20.0% 19.7% 20.7%
Average household size 2.55 2.55 2.75 * Average family size 3.20 3.26 3.69 *
RELATIONSHIP
Population in households 220,240 220,400 230,807 * Householder 39.2% 39.2% 36.3% * Spouse 14.2% 13.1% 11.8% * Child 28.8% 28.4% 30.6% Other relatives 8.7% 9.2% 10.6% * Nonrelatives 9.1% 10.1% 10.7% Unmarried partner 2.5% 2.4% 2.0%
MARITAL STATUS
Males 15 years and over 105,371 102,909 * 104,093 *
1 of 9 09/19/2013
Subject Norfolk city, Virginia
2012 Estimate 2011 Estimate 2012 - 2011Statistical
Significance
2010 Estimate 2012 - 2010Statistical
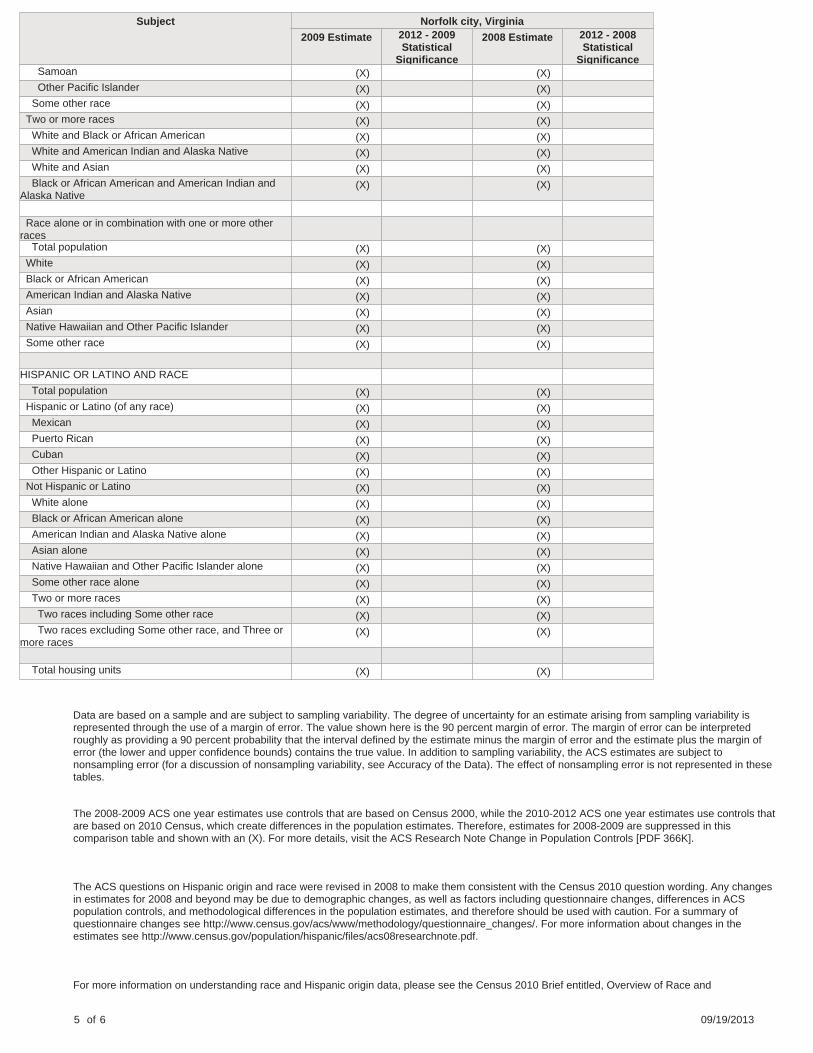
Significance Never married 48.2% 50.8% 49.9% Now married, except separated 36.9% 34.5% 32.4% * Separated 2.6% 3.3% 4.0% Widowed 2.2% 2.1% 2.0% Divorced 10.1% 9.4% 11.8%
Females 15 years and over 96,287 95,754 * 96,027 Never married 38.9% 42.1% * 40.0% Now married, except separated 35.3% 31.9% * 31.1% * Separated 4.6% 3.4% 6.2% * Widowed 7.7% 8.8% 9.6% * Divorced 13.5% 13.8% 13.0%
FERTILITY
Number of women 15 to 50 years old who had a birthin the past 12 months
4,525 3,209 4,198
Unmarried women (widowed, divorced, and nevermarried)
48.2% 46.6% 46.1%
Per 1,000 unmarried women 55 34 46 Per 1,000 women 15 to 50 years old 72 50 * 64 Per 1,000 women 15 to 19 years old 47 13 48 Per 1,000 women 20 to 34 years old 111 77 104 Per 1,000 women 35 to 50 years old 19 23 14
GRANDPARENTS
Number of grandparents living with own grandchildrenunder 18 years
5,976 6,721 4,861
Responsible for grandchildren 44.4% 46.0% 49.3% Years responsible for grandchildren
Less than 1 year 4.6% 5.4% 10.5% 1 or 2 years 18.4% 15.7% 7.4% 3 or 4 years 5.9% 9.2% 12.1% 5 or more years 15.4% 15.8% 19.3%
Number of grandparents responsible for owngrandchildren under 18 years
2,653 3,094 2,397
Who are female 69.3% 66.8% 74.1% Who are married 68.5% 60.4% 56.3%
SCHOOL ENROLLMENT
Population 3 years and over enrolled in school 69,582 68,578 68,299 Nursery school, preschool 5.7% 5.1% 6.0% Kindergarten 5.4% 4.4% 4.3% Elementary school (grades 1-8) 30.6% 31.0% 33.0% High school (grades 9-12) 13.6% 12.7% 13.5% College or graduate school 44.7% 46.8% 43.2%
EDUCATIONAL ATTAINMENT
Population 25 years and over 147,014 144,572 * 144,678 * Less than 9th grade 4.3% 2.9% * 3.6% 9th to 12th grade, no diploma 8.4% 11.3% * 11.3% * High school graduate (includes equivalency) 26.6% 27.8% 28.0% Some college, no degree 26.9% 26.0% 25.7% Associate's degree 7.6% 7.0% 6.6% Bachelor's degree 15.6% 15.2% 15.5% Graduate or professional degree 10.6% 9.8% 9.3%
Percent high school graduate or higher 87.2% 85.7% 85.1% Percent bachelor's degree or higher 26.2% 25.0% 24.8%
2 of 9 09/19/2013

Subject Norfolk city, Virginia
2012 Estimate 2011 Estimate 2012 - 2011Statistical
Significance
2010 Estimate 2012 - 2010Statistical
SignificanceVETERAN STATUS
Civilian population 18 years and over 171,329 170,140 179,183 * Civilian veterans 16.6% 16.7% 16.1%
DISABILITY STATUS OF THE CIVILIANNONINSTITUTIONALIZED POPULATION Total Civilian Noninstitutionalized Population 219,286 219,058 227,128 * With a disability 12.5% 11.8% 12.0%
Under 18 years 50,830 50,740 50,020 With a disability 4.8% 5.0% 4.8%
18 to 64 years 145,693 146,327 154,153 * With a disability 10.3% 10.0% 9.9%
65 years and over 22,763 21,991 * 22,955 With a disability 44.3% 39.4% 41.7%
RESIDENCE 1 YEAR AGO
Population 1 year and over 242,309 239,656 * 238,950 * Same house 76.3% 77.9% 77.3% Different house in the U.S. 23.2% 21.5% 22.2% Same county 12.1% 10.8% 9.5% * Different county 11.1% 10.7% 12.7% Same state 6.8% 6.0% 7.5% Different state 4.3% 4.7% 5.2% Abroad 0.5% 0.6% 0.5%
PLACE OF BIRTH
Total population 245,782 242,628 c 243,135 c Native 93.3% 93.3% 94.0% Born in United States 91.7% 91.2% 92.2% State of residence 49.1% 49.4% 51.3% Different state 42.6% 41.8% 40.9% Born in Puerto Rico, U.S. Island areas, or born abroadto American parent(s)
1.6% 2.1% 1.9%
Foreign born 6.7% 6.7% 6.0%
U.S. CITIZENSHIP STATUS
Foreign-born population 16,589 16,211 14,482 Naturalized U.S. citizen 45.4% 50.5% 36.2% Not a U.S. citizen 54.6% 49.5% 63.8%
YEAR OF ENTRY
Population born outside the United States 20,403 21,339 18,988
Native 3,814 5,128 4,506 Entered 2010 or later 0.8% 3.9% 1.0% Entered before 2010 99.2% 96.1% 99.0%
Foreign born 16,589 16,211 14,482 Entered 2010 or later 8.4% 6.4% 3.1% * Entered before 2010 91.6% 93.6% 96.9% *
WORLD REGION OF BIRTH OF FOREIGN BORN
Foreign-born population, excluding population born atsea
N N N
Europe N N N Asia N N N Africa N N N
3 of 9 09/19/2013
Subject Norfolk city, Virginia
2012 Estimate 2011 Estimate 2012 - 2011Statistical
Significance
2010 Estimate 2012 - 2010Statistical
Significance Oceania N N N Latin America N N N Northern America N N N
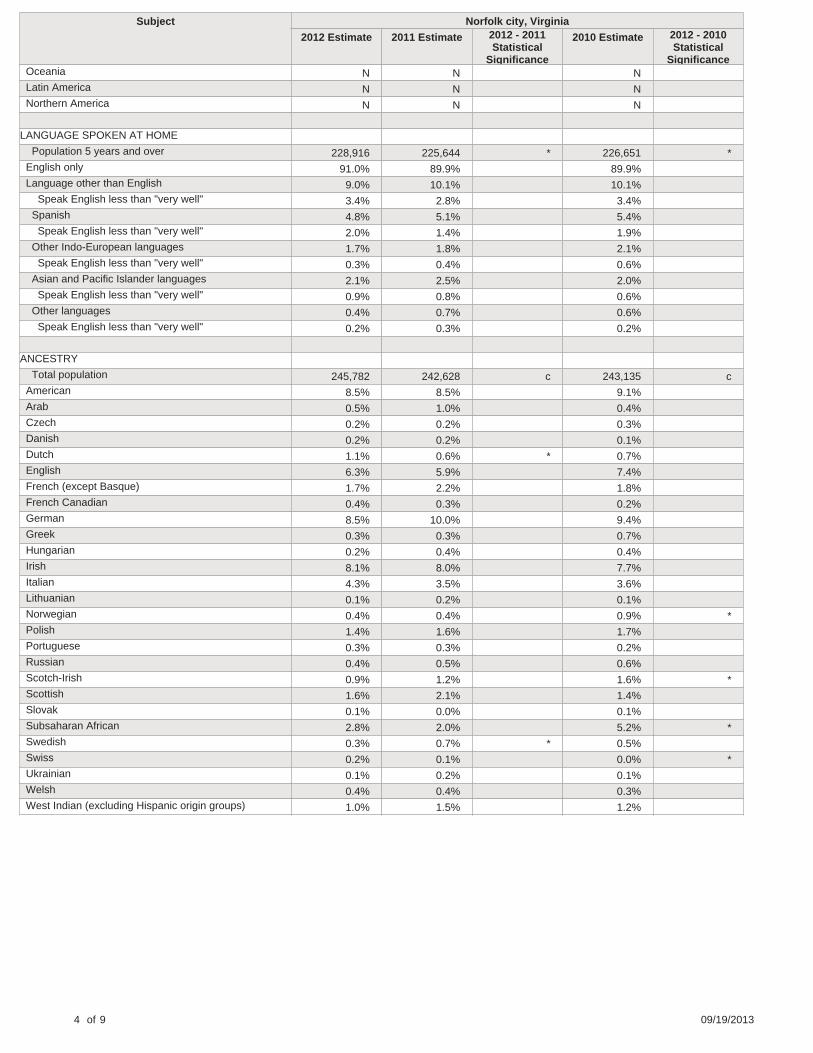
LANGUAGE SPOKEN AT HOME
Population 5 years and over 228,916 225,644 * 226,651 * English only 91.0% 89.9% 89.9% Language other than English 9.0% 10.1% 10.1% Speak English less than "very well" 3.4% 2.8% 3.4% Spanish 4.8% 5.1% 5.4% Speak English less than "very well" 2.0% 1.4% 1.9% Other Indo-European languages 1.7% 1.8% 2.1% Speak English less than "very well" 0.3% 0.4% 0.6% Asian and Pacific Islander languages 2.1% 2.5% 2.0% Speak English less than "very well" 0.9% 0.8% 0.6% Other languages 0.4% 0.7% 0.6% Speak English less than "very well" 0.2% 0.3% 0.2%
ANCESTRY
Total population 245,782 242,628 c 243,135 c American 8.5% 8.5% 9.1% Arab 0.5% 1.0% 0.4% Czech 0.2% 0.2% 0.3% Danish 0.2% 0.2% 0.1% Dutch 1.1% 0.6% * 0.7% English 6.3% 5.9% 7.4% French (except Basque) 1.7% 2.2% 1.8% French Canadian 0.4% 0.3% 0.2% German 8.5% 10.0% 9.4% Greek 0.3% 0.3% 0.7% Hungarian 0.2% 0.4% 0.4% Irish 8.1% 8.0% 7.7% Italian 4.3% 3.5% 3.6% Lithuanian 0.1% 0.2% 0.1% Norwegian 0.4% 0.4% 0.9% * Polish 1.4% 1.6% 1.7% Portuguese 0.3% 0.3% 0.2% Russian 0.4% 0.5% 0.6% Scotch-Irish 0.9% 1.2% 1.6% * Scottish 1.6% 2.1% 1.4% Slovak 0.1% 0.0% 0.1% Subsaharan African 2.8% 2.0% 5.2% * Swedish 0.3% 0.7% * 0.5% Swiss 0.2% 0.1% 0.0% * Ukrainian 0.1% 0.2% 0.1% Welsh 0.4% 0.4% 0.3% West Indian (excluding Hispanic origin groups) 1.0% 1.5% 1.2%
4 of 9 09/19/2013
Subject Norfolk city, Virginia
2009 Estimate 2012 - 2009Statistical
Significance
2008 Estimate 2012 - 2008Statistical
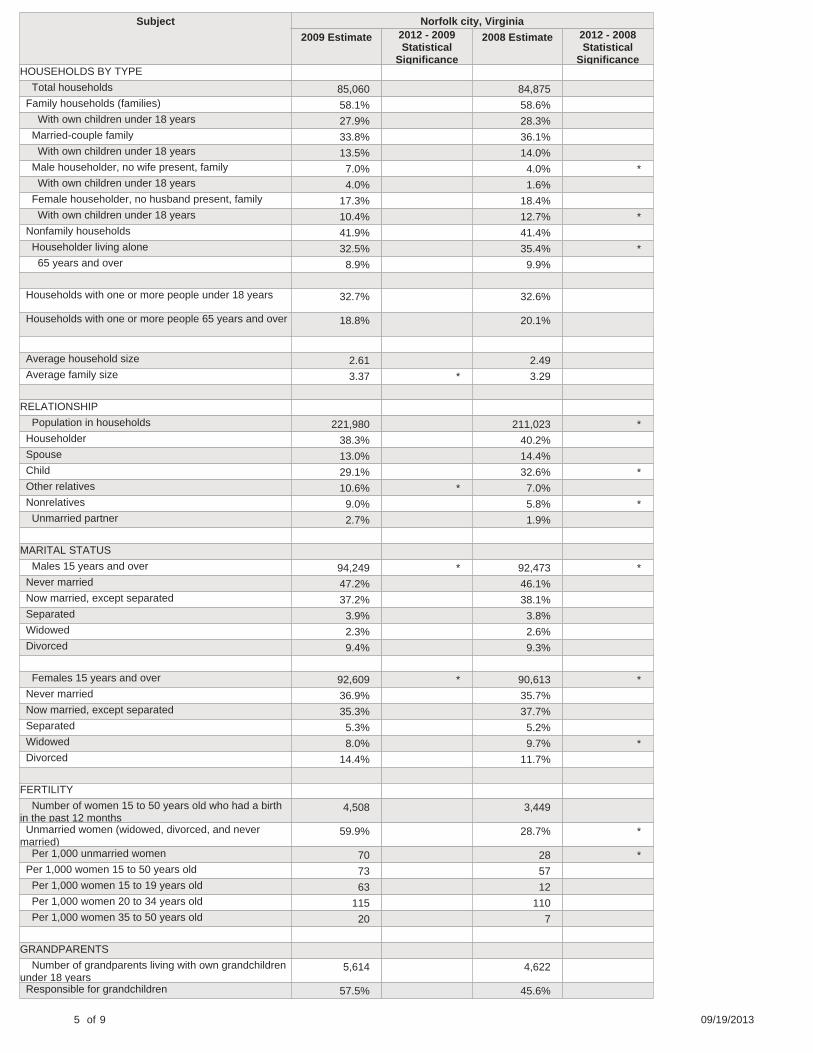
SignificanceHOUSEHOLDS BY TYPE
Total households 85,060 84,875 Family households (families) 58.1% 58.6% With own children under 18 years 27.9% 28.3% Married-couple family 33.8% 36.1% With own children under 18 years 13.5% 14.0% Male householder, no wife present, family 7.0% 4.0% * With own children under 18 years 4.0% 1.6% Female householder, no husband present, family 17.3% 18.4% With own children under 18 years 10.4% 12.7% * Nonfamily households 41.9% 41.4% Householder living alone 32.5% 35.4% * 65 years and over 8.9% 9.9%
Households with one or more people under 18 years 32.7% 32.6%
Households with one or more people 65 years and over 18.8% 20.1%
Average household size 2.61 2.49 Average family size 3.37 * 3.29
RELATIONSHIP
Population in households 221,980 211,023 * Householder 38.3% 40.2% Spouse 13.0% 14.4% Child 29.1% 32.6% * Other relatives 10.6% * 7.0% Nonrelatives 9.0% 5.8% * Unmarried partner 2.7% 1.9%
MARITAL STATUS
Males 15 years and over 94,249 * 92,473 * Never married 47.2% 46.1% Now married, except separated 37.2% 38.1% Separated 3.9% 3.8% Widowed 2.3% 2.6% Divorced 9.4% 9.3%
Females 15 years and over 92,609 * 90,613 * Never married 36.9% 35.7% Now married, except separated 35.3% 37.7% Separated 5.3% 5.2% Widowed 8.0% 9.7% * Divorced 14.4% 11.7%
FERTILITY
Number of women 15 to 50 years old who had a birthin the past 12 months
4,508 3,449
Unmarried women (widowed, divorced, and nevermarried)
59.9% 28.7% *
Per 1,000 unmarried women 70 28 * Per 1,000 women 15 to 50 years old 73 57 Per 1,000 women 15 to 19 years old 63 12 Per 1,000 women 20 to 34 years old 115 110 Per 1,000 women 35 to 50 years old 20 7
GRANDPARENTS
Number of grandparents living with own grandchildrenunder 18 years
5,614 4,622
Responsible for grandchildren 57.5% 45.6%
5 of 9 09/19/2013

Subject Norfolk city, Virginia
2009 Estimate 2012 - 2009Statistical
Significance
2008 Estimate 2012 - 2008Statistical
Significance Years responsible for grandchildren
Less than 1 year 18.8% * 8.6% 1 or 2 years 16.3% 18.3% 3 or 4 years 4.3% 10.6% 5 or more years 18.1% 8.0%
Number of grandparents responsible for owngrandchildren under 18 years
3,226 2,109
Who are female 78.1% 81.5% Who are married 43.6% * 53.0%
SCHOOL ENROLLMENT
Population 3 years and over enrolled in school 68,574 66,716 Nursery school, preschool 6.2% 6.7% Kindergarten 5.0% 6.8% Elementary school (grades 1-8) 31.9% 35.9% * High school (grades 9-12) 17.3% * 18.2% * College or graduate school 39.6% * 32.3% *
EDUCATIONAL ATTAINMENT
Population 25 years and over 135,617 * 134,559 * Less than 9th grade 4.3% 4.6% 9th to 12th grade, no diploma 11.2% * 12.4% * High school graduate (includes equivalency) 27.7% 27.0% Some college, no degree 27.5% 24.3% Associate's degree 6.1% 6.7% Bachelor's degree 13.5% * 13.2% * Graduate or professional degree 9.8% 11.8%
Percent high school graduate or higher 84.5% * 83.0% * Percent bachelor's degree or higher 23.2% * 25.0%
VETERAN STATUS
Civilian population 18 years and over 162,347 * 150,500 * Civilian veterans 17.2% 14.9%
DISABILITY STATUS OF THE CIVILIANNONINSTITUTIONALIZED POPULATION Total Civilian Noninstitutionalized Population 214,377 207,689 * With a disability 11.2% 12.8%
Under 18 years 54,685 * 59,786 * With a disability 3.8% 4.7%
18 to 64 years 137,535 * 125,233 * With a disability 9.0% 11.1%
65 years and over 22,157 22,670 With a disability 43.1% 43.7%
RESIDENCE 1 YEAR AGO
Population 1 year and over 229,020 * 230,648 * Same house 76.8% 75.5% Different house in the U.S. 22.2% 23.7% Same county 11.1% 11.8% Different county 11.1% 11.9% Same state 6.4% 5.3% Different state 4.6% 6.6% * Abroad 1.0% 0.7%
6 of 9 09/19/2013

Subject Norfolk city, Virginia
2009 Estimate 2012 - 2009Statistical
Significance
2008 Estimate 2012 - 2008Statistical
Significance
PLACE OF BIRTH
Total population 233,333 c 234,220 c Native 93.8% 93.4% Born in United States 92.3% 91.7% State of residence 50.8% 50.8% Different state 41.6% 40.9% Born in Puerto Rico, U.S. Island areas, or born abroadto American parent(s)
1.4% 1.7%
Foreign born 6.2% 6.6%
U.S. CITIZENSHIP STATUS
Foreign-born population 14,562 15,526 Naturalized U.S. citizen 44.7% 40.6% Not a U.S. citizen 55.3% 59.4%
YEAR OF ENTRY
Population born outside the United States 17,853 19,434
Native 3,291 3,908 Entered 2010 or later 0.0% 0.0% Entered before 2010 100.0% 100.0%
Foreign born 14,562 15,526 Entered 2010 or later 0.0% * 0.0% * Entered before 2010 100.0% * 100.0% *
WORLD REGION OF BIRTH OF FOREIGN BORN
Foreign-born population, excluding population born atsea
N N
Europe N N Asia N N Africa N N Oceania N N Latin America N N Northern America N N
LANGUAGE SPOKEN AT HOME
Population 5 years and over 214,417 * 215,261 * English only 91.0% 91.9% Language other than English 9.0% 8.1% Speak English less than "very well" 3.5% 3.4% Spanish 3.4% * 3.4% * Speak English less than "very well" 1.1% * 1.5% Other Indo-European languages 2.5% 2.0% Speak English less than "very well" 0.8% 0.5% Asian and Pacific Islander languages 2.1% 2.1% Speak English less than "very well" 1.2% 1.0% Other languages 0.9% 0.6% Speak English less than "very well" 0.4% 0.3%
ANCESTRY
Total population 233,333 c 234,220 c American 14.6% * 10.5% Arab 0.2% 0.2% Czech 0.2% 0.1% Danish 0.4% 0.1% Dutch 0.8% 0.7% English 7.2% 8.6% *
7 of 9 09/19/2013

Subject Norfolk city, Virginia
2009 Estimate 2012 - 2009Statistical
Significance
2008 Estimate 2012 - 2008Statistical
Significance French (except Basque) 2.4% 2.7% * French Canadian 0.2% * 0.4% German 8.7% 7.3% Greek 0.5% 0.5% Hungarian 0.3% 0.4% Irish 7.8% 7.9% Italian 3.5% 3.3% Lithuanian 0.4% 0.1% Norwegian 0.3% 0.7% Polish 1.8% 1.8% Portuguese 0.4% 0.2% Russian 0.5% 0.5% Scotch-Irish 0.9% 1.4% Scottish 1.6% 2.1% Slovak 0.5% 0.1% Subsaharan African 4.1% 4.0% Swedish 0.7% * 0.5% * Swiss 0.0% * 0.1% Ukrainian 0.1% 0.1% Welsh 0.4% 0.8% * West Indian (excluding Hispanic origin groups) 0.7% 1.6%
Data are based on a sample and are subject to sampling variability. The degree of uncertainty for an estimate arising from sampling variability isrepresented through the use of a margin of error. The value shown here is the 90 percent margin of error. The margin of error can be interpretedroughly as providing a 90 percent probability that the interval defined by the estimate minus the margin of error and the estimate plus the margin oferror (the lower and upper confidence bounds) contains the true value. In addition to sampling variability, the ACS estimates are subject tononsampling error (for a discussion of nonsampling variability, see Accuracy of the Data). The effect of nonsampling error is not represented in thesetables.
Ancestry listed in this table refers to the total number of people who responded with a particular ancestry; for example, the estimate given for Russianrepresents the number of people who listed Russian as either their first or second ancestry. This table lists only the largest ancestry groups; see theDetailed Tables for more categories. Race and Hispanic origin groups are not included in this table because official data for those groups come fromthe Race and Hispanic origin questions rather than the ancestry question (see Demographic Table).
Data for year of entry of the native population reflect the year of entry into the U.S. by people who were born in Puerto Rico, U.S. Island Areas or bornoutside the U.S. to a U.S. citizen parent and who subsequently moved to the U.S.
Selected migration data are not available for certain geographic areas due to problems with group quarters data collection and imputation. See ErrataNote #44 for details.
Fertility data are not available for certain geographic areas due to problems with data collection. See Errate Note #92 for details.
The Census Bureau introduced a new set of disability questions in the 2008 ACS questionnaire. Accordingly, comparisons of disability data from 2008or later with data from prior years are not recommended. For more information on these questions and their evaluation in the 2006 ACS Content Test,see the Evaluation Report Covering Disability.
While the 2012 American Community Survey (ACS) data generally reflect the December 2009 Office of Management and Budget (OMB) definitions ofmetropolitan and micropolitan statistical areas; in certain instances the names, codes, and boundaries of the principal cities shown in ACS tables maydiffer from the OMB definitions due to differences in the effective dates of the geographic entities.
Estimates of urban and rural population, housing units, and characteristics reflect boundaries of urban areas defined based on Census 2000 data.Boundaries for urban areas have not been updated since Census 2000. As a result, data for urban and rural areas from the ACS do not necessarilyreflect the results of ongoing urbanization.
Source: U.S. Census Bureau, 2012 American Community Survey
Explanation of Symbols:
8 of 9 09/19/2013

1. An '**' entry in the margin of error column indicates that either no sample observations or too few sample observations were available tocompute a standard error and thus the margin of error. A statistical test is not appropriate. 2. An '-' entry in the estimate column indicates that either no sample observations or too few sample observations were available to compute anestimate, or a ratio of medians cannot be calculated because one or both of the median estimates falls in the lowest interval or upper interval of anopen-ended distribution. 3. An '-' following a median estimate means the median falls in the lowest interval of an open-ended distribution. 4. An '+' following a median estimate means the median falls in the upper interval of an open-ended distribution. 5. An '***' entry in the margin of error column indicates that the median falls in the lowest interval or upper interval of an open-ended distribution. Astatistical test is not appropriate. 6. An '*****' entry in the margin of error column indicates that the estimate is controlled. A statistical test for sampling variability is not appropriate. 7. An 'N' entry in the estimate and margin of error columns indicates that data for this geographic area cannot be displayed because the number ofsample cases is too small. 8. An '(X)' means that the estimate is not applicable or not available.

CP03 SELECTED ECONOMIC CHARACTERISTICS
2012 American Community Survey 1-Year Estimates
Supporting documentation on code lists, subject definitions, data accuracy, and statistical testing can be found on the American Community Surveywebsite in the Data and Documentation section.
Sample size and data quality measures (including coverage rates, allocation rates, and response rates) can be found on the American CommunitySurvey website in the Methodology section.
Although the American Community Survey (ACS) produces population, demographic and housing unit estimates, it is the Census Bureau's PopulationEstimates Program that produces and disseminates the official estimates of the population for the nation, states, counties, cities and towns andestimates of housing units for states and counties.
An * indicates that the estimate is significantly different (at a 90% confidence level) than the estimate from the most current year. A "c" indicates theestimates for that year and the current year are both controlled; a statistical test is not appropriate.
Subject Norfolk city, Virginia
2012 Estimate 2011 Estimate 2012 - 2011Statistical
Significance
2010 Estimate 2012 - 2010Statistical
SignificanceEMPLOYMENT STATUS
Population 16 years and over 199,650 196,268 * 197,605 * In labor force 69.4% 71.5% 68.1% Civilian labor force 57.6% 60.5% 61.3% * Employed 50.2% 52.6% 53.3% * Unemployed 7.4% 7.8% 8.0% Armed Forces 11.8% 11.0% 6.8% * Not in labor force 30.6% 28.5% 31.9%
Civilian labor force 114,963 118,666 121,100 * Percent Unemployed 12.8% 13.0% 13.1%
Females 16 years and over 95,175 94,641 95,047 In labor force 64.1% 65.3% 62.7% Civilian labor force 58.5% 60.2% 59.7% Employed 51.3% 52.4% 52.4%
Own children under 6 years 18,935 18,754 18,645 All parents in family in labor force 61.9% 71.7% * 57.4%
Own children 6 to 17 years 28,656 29,027 29,301 All parents in family in labor force 74.7% 80.7% 76.8%
COMMUTING TO WORK
Workers 16 years and over 121,507 123,022 117,088 Car, truck, or van -- drove alone 73.2% 72.3% 71.8% Car, truck, or van -- carpooled 9.8% 8.7% 12.7% Public transportation (excluding taxicab) 4.5% 4.2% 4.1% Walked 3.1% 4.0% 6.4% * Other means 1.5% 2.2% 2.5% Worked at home 7.9% 8.6% 2.5% *
1 of 9 09/19/2013

Subject Norfolk city, Virginia
2012 Estimate 2011 Estimate 2012 - 2011Statistical
Significance
2010 Estimate 2012 - 2010Statistical
Significance Mean travel time to work (minutes) 22.7 21.9 21.0 *
OCCUPATION
Civilian employed population 16 years and over 100,260 103,274 105,268 Management, business, science, and arts occupations 30.8% 31.6% 29.8%
Service occupations 20.6% 21.1% 20.7% Sales and office occupations 26.0% 22.8% * 24.2% Natural resources, construction, and maintenanceoccupations
11.0% 13.3% 14.0% *
Production, transportation, and material movingoccupations
11.6% 11.3% 11.3%
INDUSTRY
Civilian employed population 16 years and over 100,260 103,274 105,268 Agriculture, forestry, fishing and hunting, and mining 0.2% 0.1% 0.3%
Construction 7.1% 7.7% 8.8% Manufacturing 7.7% 5.9% * 5.9% Wholesale trade 1.0% 1.3% 2.6% * Retail trade 13.5% 13.0% 11.6% Transportation and warehousing, and utilities 4.2% 5.2% 4.7% Information 1.5% 1.2% 2.4% Finance and insurance, and real estate and rental andleasing
5.4% 4.4% 4.7%
Professional, scientific, and management, andadministrative and waste management services
11.2% 11.8% 10.3%
Educational services, and health care and socialassistance
22.5% 22.4% 22.2%
Arts, entertainment, and recreation, andaccommodation and food services
10.3% 10.8% 10.5%
Other services, except public administration 5.4% 5.3% 5.6% Public administration 9.8% 10.8% 10.5%
CLASS OF WORKER
Civilian employed population 16 years and over 100,260 103,274 105,268 Private wage and salary workers 71.4% 73.2% 72.3% Government workers 25.0% 23.1% 24.1% Self-employed in own not incorporated businessworkers
3.6% 3.7% 3.5%
Unpaid family workers 0.0% 0.0% 0.0%
INCOME AND BENEFITS (IN 2012 INFLATION-ADJUSTED DOLLARS) Total households 86,347 86,480 83,828 Less than $10,000 11.0% 9.1% * 7.5% * $10,000 to $14,999 5.9% 6.1% 5.9% $15,000 to $24,999 11.5% 12.4% 12.3% $25,000 to $34,999 12.3% 11.7% 14.9% $35,000 to $49,999 15.9% 17.2% 16.1% $50,000 to $74,999 19.4% 19.3% 19.8% $75,000 to $99,999 8.5% 9.9% 9.0% $100,000 to $149,999 9.2% 8.3% 9.9% $150,000 to $199,999 3.1% 4.3% * 2.4% $200,000 or more 3.1% 1.7% * 2.2% * Median household income (dollars) 42,644 44,062 43,659 Mean household income (dollars) 60,955 57,278 59,060
With earnings 80.0% 81.8% 79.5% Mean earnings (dollars) 59,318 56,427 56,055 With Social Security 22.7% 23.0% 24.3% Mean Social Security income (dollars) 15,249 14,202 14,195 With retirement income 17.1% 18.3% 18.2%
2 of 9 09/19/2013

Subject Norfolk city, Virginia
2012 Estimate 2011 Estimate 2012 - 2011Statistical
Significance
2010 Estimate 2012 - 2010Statistical
Significance Mean retirement income (dollars) 25,303 21,637 25,678
With Supplemental Security Income 6.6% 5.8% 4.6% * Mean Supplemental Security Income (dollars) 8,726 8,288 9,788 With cash public assistance income 2.9% 3.4% 3.3% Mean cash public assistance income (dollars) 3,279 2,979 2,209 With Food Stamp/SNAP benefits in the past 12 months 19.5% 16.1% * 12.7% *
Families 51,735 49,334 45,363 * Less than $10,000 8.0% 6.4% 3.9% * $10,000 to $14,999 4.5% 4.6% 3.7% $15,000 to $24,999 8.5% 11.4% * 9.8% $25,000 to $34,999 11.8% 10.6% 13.6% $35,000 to $49,999 16.1% 18.4% 16.0% $50,000 to $74,999 21.1% 19.0% 22.5% $75,000 to $99,999 10.5% 11.5% 12.1% $100,000 to $149,999 10.3% 10.9% 12.5% $150,000 to $199,999 4.0% 4.8% 2.8% $200,000 or more 5.0% 2.5% * 3.2% * Median family income (dollars) 50,880 49,037 53,903 Mean family income (dollars) 73,254 64,277 * 68,351
Per capita income (dollars) 24,191 23,236 23,921
Nonfamily households 34,612 37,146 38,465 * Median nonfamily income (dollars) 30,865 34,367 * 32,304 Mean nonfamily income (dollars) 39,623 45,071 * 46,574 *
Median earnings for workers (dollars) 24,675 24,639 25,418 Median earnings for male full-time, year-round workers(dollars)
36,235 36,669 35,802
Median earnings for female full-time, year-roundworkers (dollars)
28,080 27,617 33,070 *
HEALTH INSURANCE COVERAGE
Civilian noninstitutionalized population 219,286 219,058 227,128 * With health insurance coverage 83.8% 81.4% * 82.2% With private health insurance 63.0% 63.8% 66.9% * With public coverage 30.6% 26.9% * 25.1% * No health insurance coverage 16.2% 18.6% * 17.8%
Civilian noninstitutionalized population under 18 years 50,830 50,740 50,020
No health insurance coverage 4.9% 7.8% * 7.4%
Civilian noninstitutionalized population 18 to 64 years 145,693 146,327 154,153 *
In labor force: 109,316 113,472 116,968 * Employed: 95,243 98,757 101,755 * With health insurance coverage 80.6% 78.5% 79.9% With private health insurance 75.8% 74.2% 76.6% With public coverage 7.4% 7.0% 5.1% * No health insurance coverage 19.4% 21.5% 20.1% Unemployed: 14,073 14,715 15,213 With health insurance coverage 50.8% 46.1% 48.9% With private health insurance 28.5% 27.8% 37.6% With public coverage 26.1% 19.7% 13.8% * No health insurance coverage 49.2% 53.9% 51.1% Not in labor force: 36,377 32,855 37,185 With health insurance coverage 80.0% 77.6% 77.5%
3 of 9 09/19/2013
Subject Norfolk city, Virginia
2012 Estimate 2011 Estimate 2012 - 2011Statistical
Significance
2010 Estimate 2012 - 2010Statistical
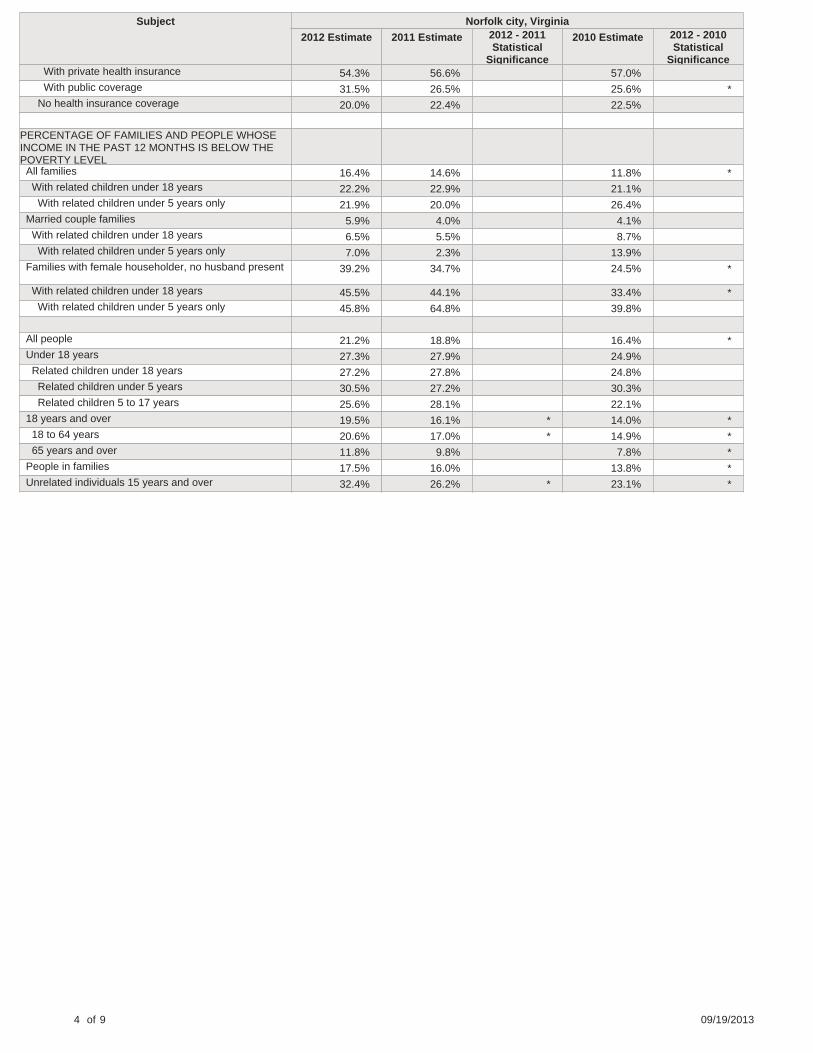
Significance With private health insurance 54.3% 56.6% 57.0% With public coverage 31.5% 26.5% 25.6% * No health insurance coverage 20.0% 22.4% 22.5%
PERCENTAGE OF FAMILIES AND PEOPLE WHOSEINCOME IN THE PAST 12 MONTHS IS BELOW THEPOVERTY LEVEL All families 16.4% 14.6% 11.8% * With related children under 18 years 22.2% 22.9% 21.1% With related children under 5 years only 21.9% 20.0% 26.4% Married couple families 5.9% 4.0% 4.1% With related children under 18 years 6.5% 5.5% 8.7% With related children under 5 years only 7.0% 2.3% 13.9% Families with female householder, no husband present 39.2% 34.7% 24.5% *
With related children under 18 years 45.5% 44.1% 33.4% * With related children under 5 years only 45.8% 64.8% 39.8%
All people 21.2% 18.8% 16.4% * Under 18 years 27.3% 27.9% 24.9% Related children under 18 years 27.2% 27.8% 24.8% Related children under 5 years 30.5% 27.2% 30.3% Related children 5 to 17 years 25.6% 28.1% 22.1% 18 years and over 19.5% 16.1% * 14.0% * 18 to 64 years 20.6% 17.0% * 14.9% * 65 years and over 11.8% 9.8% 7.8% * People in families 17.5% 16.0% 13.8% * Unrelated individuals 15 years and over 32.4% 26.2% * 23.1% *
4 of 9 09/19/2013

Subject Norfolk city, Virginia
2009 Estimate 2012 - 2009Statistical
Significance
2008 Estimate 2012 - 2008Statistical
SignificanceEMPLOYMENT STATUS
Population 16 years and over 184,079 * 179,695 * In labor force 70.7% 68.5% Civilian labor force 61.9% * 55.3% Employed 55.7% * 50.0% Unemployed 6.2% 5.4% * Armed Forces 8.9% * 13.1% Not in labor force 29.3% 31.5%
Civilian labor force 113,876 99,452 * Percent Unemployed 10.0% * 9.7% *
Females 16 years and over 91,108 * 88,770 * In labor force 66.4% 64.5% Civilian labor force 63.0% * 59.9% Employed 57.9% * 54.4%
Own children under 6 years 20,064 22,637 * All parents in family in labor force 72.9% * 64.1%
Own children 6 to 17 years 30,272 * 33,014 * All parents in family in labor force 79.2% 75.7%
COMMUTING TO WORK
Workers 16 years and over 117,281 111,150 * Car, truck, or van -- drove alone 74.6% 65.7% * Car, truck, or van -- carpooled 12.9% * 13.1% * Public transportation (excluding taxicab) 3.2% 5.7% Walked 3.8% 5.6% Other means 1.6% 1.0% Worked at home 3.9% * 9.0%
Mean travel time to work (minutes) 21.4 * 21.9
OCCUPATION
Civilian employed population 16 years and over (X) (X) Management, business, science, and arts occupations (X) (X)
Service occupations (X) (X) Sales and office occupations (X) (X) Natural resources, construction, and maintenanceoccupations
(X) (X)
Production, transportation, and material movingoccupations
(X) (X)
INDUSTRY
Civilian employed population 16 years and over 102,475 89,760 * Agriculture, forestry, fishing and hunting, and mining 0.1% 0.2%
Construction 5.8% 7.3% Manufacturing 7.6% 6.7% Wholesale trade 2.4% * 3.1% * Retail trade 12.0% 12.8% Transportation and warehousing, and utilities 5.2% 6.1% * Information 2.6% * 3.3% * Finance and insurance, and real estate and rental andleasing
5.0% 5.0%
Professional, scientific, and management, andadministrative and waste management services
9.3% 8.9%
Educational services, and health care and socialassistance
22.0% 24.1%
5 of 9 09/19/2013

Subject Norfolk city, Virginia
2009 Estimate 2012 - 2009Statistical
Significance
2008 Estimate 2012 - 2008Statistical
Significance Arts, entertainment, and recreation, andaccommodation and food services
14.2% * 10.3%
Other services, except public administration 5.0% 6.0% Public administration 8.9% 6.2% *
CLASS OF WORKER
Civilian employed population 16 years and over 102,475 89,760 * Private wage and salary workers 75.4% * 75.8% * Government workers 21.1% * 20.1% * Self-employed in own not incorporated businessworkers
3.4% 3.9%
Unpaid family workers 0.1% 0.2%
INCOME AND BENEFITS (IN 2012 INFLATION-ADJUSTED DOLLARS) Total households 85,060 84,875 Less than $10,000 8.6% * 9.2% $10,000 to $14,999 5.2% 6.4% $15,000 to $24,999 11.9% 15.4% * $25,000 to $34,999 13.0% 10.2% $35,000 to $49,999 14.4% 18.5% $50,000 to $74,999 19.6% 15.3% * $75,000 to $99,999 10.9% * 12.0% * $100,000 to $149,999 9.6% 7.7% $150,000 to $199,999 3.2% 2.8% $200,000 or more 3.5% 2.5% Median household income (dollars) 45,788 42,769 Mean household income (dollars) 63,660 61,882
With earnings 82.5% * 80.9% Mean earnings (dollars) 61,789 58,161 With Social Security 21.2% 22.1% Mean Social Security income (dollars) 14,786 14,567 With retirement income 18.3% 19.2% Mean retirement income (dollars) 20,141 24,370
With Supplemental Security Income 2.3% * 3.9% * Mean Supplemental Security Income (dollars) 7,756 8,239 With cash public assistance income 3.0% 2.7% Mean cash public assistance income (dollars) 3,141 2,126 With Food Stamp/SNAP benefits in the past 12 months 11.5% * 11.7% *
Families 49,423 49,706 Less than $10,000 6.9% 6.7% $10,000 to $14,999 2.9% 5.6% $15,000 to $24,999 10.4% 13.2% * $25,000 to $34,999 10.3% 7.9% * $35,000 to $49,999 14.0% 16.6% $50,000 to $74,999 21.3% 17.9% $75,000 to $99,999 12.2% 14.7% * $100,000 to $149,999 13.0% * 9.9% $150,000 to $199,999 4.0% 3.6% $200,000 or more 4.9% 3.8% Median family income (dollars) 55,740 49,918 Mean family income (dollars) 75,312 73,952
Per capita income (dollars) 25,468 24,800
Nonfamily households 35,637 35,169
6 of 9 09/19/2013

Subject Norfolk city, Virginia
2009 Estimate 2012 - 2009Statistical
Significance
2008 Estimate 2012 - 2008Statistical
Significance Median nonfamily income (dollars) 32,652 32,119 Mean nonfamily income (dollars) 42,986 42,950
Median earnings for workers (dollars) 27,497 * 24,429 Median earnings for male full-time, year-round workers(dollars)
39,219 * 36,158
Median earnings for female full-time, year-roundworkers (dollars)
32,446 * 29,379
HEALTH INSURANCE COVERAGE
Civilian noninstitutionalized population 214,377 207,689 * With health insurance coverage 82.8% 83.7% With private health insurance 67.4% * 66.8% * With public coverage 25.2% * 28.3% No health insurance coverage 17.2% 16.3%
Civilian noninstitutionalized population under 18 years 54,685 * 59,786 *
No health insurance coverage 7.8% 8.2%
Civilian noninstitutionalized population 18 to 64 years 137,535 * 125,233 *
In labor force: 109,231 93,803 * Employed: 98,346 84,843 * With health insurance coverage 77.3% 79.9% With private health insurance 75.5% 74.7% With public coverage 4.6% * 8.2% No health insurance coverage 22.7% 20.1% Unemployed: 10,885 * 8,960 * With health insurance coverage 50.0% 44.1% With private health insurance 38.6% 24.3% With public coverage 11.9% * 21.0% No health insurance coverage 50.0% 55.9% Not in labor force: 28,304 * 31,430 * With health insurance coverage 83.3% 78.4% With private health insurance 63.8% * 59.7% With public coverage 26.0% 24.9% * No health insurance coverage 16.7% 21.6%
PERCENTAGE OF FAMILIES AND PEOPLE WHOSEINCOME IN THE PAST 12 MONTHS IS BELOW THEPOVERTY LEVEL All families 13.1% 16.6% With related children under 18 years 21.8% 24.8% With related children under 5 years only 15.4% 20.9% Married couple families 3.1% * 5.4% With related children under 18 years 5.0% 6.0% With related children under 5 years only 4.0% 3.5% Families with female householder, no husband present 32.4% 39.5%
With related children under 18 years 40.0% 45.7% With related children under 5 years only 28.3% 51.7%
All people 16.5% * 19.5% Under 18 years 26.9% 30.5% Related children under 18 years 26.9% 30.3% Related children under 5 years 25.2% 34.9% Related children 5 to 17 years 27.7% 28.1% 18 years and over 13.2% * 15.3% * 18 to 64 years 13.6% * 15.5% * 65 years and over 10.6% 14.1%
7 of 9 09/19/2013

Subject Norfolk city, Virginia
2009 Estimate 2012 - 2009Statistical
Significance
2008 Estimate 2012 - 2008Statistical
Significance People in families 15.0% 18.5% Unrelated individuals 15 years and over 21.3% * 22.7% *
Data are based on a sample and are subject to sampling variability. The degree of uncertainty for an estimate arising from sampling variability isrepresented through the use of a margin of error. The value shown here is the 90 percent margin of error. The margin of error can be interpretedroughly as providing a 90 percent probability that the interval defined by the estimate minus the margin of error and the estimate plus the margin oferror (the lower and upper confidence bounds) contains the true value. In addition to sampling variability, the ACS estimates are subject tononsampling error (for a discussion of nonsampling variability, see Accuracy of the Data). The effect of nonsampling error is not represented in thesetables.
The methodology for calculating median income and median earnings changed between 2008 and 2009. Medians over $75,000 were most likelyaffected. The underlying income and earning distribution now uses $2,500 increments up to $250,000 for households, non-family households, families,and individuals and employs a linear interpolation method for median calculations. Before 2009 the highest income category was $200,000 forhouseholds, families and non-family households ($100,000 for individuals) and portions of the income and earnings distribution contained intervalswider than $2,500. Those cases used a Pareto Interpolation Method.
There were changes in the edit between 2009 and 2010 regarding Supplemental Security Income (SSI) and Social Security. The changes in the editloosened restrictions on disability requirements for receipt of SSI resulting in an increase in the total number of SSI recipients in the AmericanCommunity Survey. The changes also loosened restrictions on possible reported monthly amounts in Social Security income resulting in higher SocialSecurity aggregate amounts. These results more closely match administrative counts compiled by the Social Security Administration.
Employment and unemployment estimates may vary from the official labor force data released by the Bureau of Labor Statistics because ofdifferences in survey design and data collection. For guidance on differences in employment and unemployment estimates from different sources goto Labor Force Guidance.
The Census Bureau introduced an improved sequence of labor force questions in the 2008 ACS questionnaire. Accordingly, we recommend usingcaution when making labor force data comparisons from 2008 or later with data from prior years. For more information on these questions and theirevaluation in the 2006 ACS Content Test, see the "Evaluation Report Covering Employment Status" athttp://www.census.gov/acs/www/Downloads/methodology/content_test/P6a_Employment_Status.pdf, and the "Evaluation Report Covering WeeksWorked" at http://www.census.gov/acs/www/Downloads/methodology/content_test/P6b_Weeks_Worked_Final_Report.pdf. Additional information canalso be found at http://www.census.gov/people/laborforce/.
Workers include members of the Armed Forces and civilians who were at work last week.
Industry codes are 4-digit codes and are based on the North American Industry Classification System 2007. The Industry categories adhere to theguidelines issued in Clarification Memorandum No. 2, "NAICS Alternate Aggregation Structure for Use By U.S. Statistical Agencies," issued by theOffice of Management and Budget.
Census occupation codes for 2010 and later years are based on the 2010 revision of the Standard Occupational Classification (SOC). Occupationdata from 2010 and later years are not strictly comparable to data from prior to 2010. For more information on the Census occupation code changes,please visit our website at http://www.census.gov/people/io/methodology/indexes.html.
Logical coverage edits applying a rules-based assignment of Medicaid, Medicare and military health coverage were added as of 2009 -- please seehttp://www.census.gov/hhes/www/hlthins/publications/coverage_edits_final.pdf for more details. The corresponding 2008 data table in AmericanFactFinder does not incorporate these edits and is therefore not comparable to this table in 2009, 2010, 2011, or 2012. Select geographies of 2008data comparable to the 2009, 2010, 2011, and 2012 tables are accessible at http://www.census.gov/hhes/www/hlthins/data/acs/2008/re-run.html.
The health insurance coverage category names were modified in 2010. See ACS Health Insurance Definitions for a list of the insurance typedefinitions.
While the 2012 American Community Survey (ACS) data generally reflect the December 2009 Office of Management and Budget (OMB) definitions ofmetropolitan and micropolitan statistical areas; in certain instances the names, codes, and boundaries of the principal cities shown in ACS tables maydiffer from the OMB definitions due to differences in the effective dates of the geographic entities.
Estimates of urban and rural population, housing units, and characteristics reflect boundaries of urban areas defined based on Census 2000 data.Boundaries for urban areas have not been updated since Census 2000. As a result, data for urban and rural areas from the ACS do not necessarilyreflect the results of ongoing urbanization.
8 of 9 09/19/2013

Source: U.S. Census Bureau, 2012 American Community Survey
Explanation of Symbols:
1. An '**' entry in the margin of error column indicates that either no sample observations or too few sample observations were available tocompute a standard error and thus the margin of error. A statistical test is not appropriate. 2. An '-' entry in the estimate column indicates that either no sample observations or too few sample observations were available to compute anestimate, or a ratio of medians cannot be calculated because one or both of the median estimates falls in the lowest interval or upper interval of anopen-ended distribution. 3. An '-' following a median estimate means the median falls in the lowest interval of an open-ended distribution. 4. An '+' following a median estimate means the median falls in the upper interval of an open-ended distribution. 5. An '***' entry in the margin of error column indicates that the median falls in the lowest interval or upper interval of an open-ended distribution. Astatistical test is not appropriate. 6. An '*****' entry in the margin of error column indicates that the estimate is controlled. A statistical test for sampling variability is not appropriate. 7. An 'N' entry in the estimate and margin of error columns indicates that data for this geographic area cannot be displayed because the number ofsample cases is too small. 8. An '(X)' means that the estimate is not applicable or not available.

CP04 SELECTED HOUSING CHARACTERISTICS
2012 American Community Survey 1-Year Estimates
Supporting documentation on code lists, subject definitions, data accuracy, and statistical testing can be found on the American Community Surveywebsite in the Data and Documentation section.
Sample size and data quality measures (including coverage rates, allocation rates, and response rates) can be found on the American CommunitySurvey website in the Methodology section.
Although the American Community Survey (ACS) produces population, demographic and housing unit estimates, it is the Census Bureau's PopulationEstimates Program that produces and disseminates the official estimates of the population for the nation, states, counties, cities and towns andestimates of housing units for states and counties.
An * indicates that the estimate is significantly different (at a 90% confidence level) than the estimate from the most current year. A "c" indicates theestimates for that year and the current year are both controlled; a statistical test is not appropriate.
Subject Norfolk city, Virginia
2012 Estimate 2011 Estimate 2012 - 2011Statistical
Significance
2010 Estimate 2012 - 2010Statistical
SignificanceHOUSING OCCUPANCY
Total housing units 95,435 95,021 95,123 Occupied housing units 90.5% 91.0% 88.1% Vacant housing units 9.5% 9.0% 11.9%
Homeowner vacancy rate 3.2 3.9 4.7 Rental vacancy rate 5.8 7.9 7.4
UNITS IN STRUCTURE
Total housing units 95,435 95,021 95,123 1-unit, detached 47.9% 52.0% * 47.3% 1-unit, attached 8.4% 8.5% 8.5% 2 units 6.2% 5.3% 5.7% 3 or 4 units 7.0% 6.6% 7.7% 5 to 9 units 12.7% 9.6% * 12.8% 10 to 19 units 7.3% 6.7% 8.1% 20 or more units 9.1% 10.7% 8.9% Mobile home 1.4% 0.6% * 0.9% Boat, RV, van, etc. 0.0% 0.0% 0.0%
YEAR STRUCTURE BUILT
Total housing units 95,435 95,021 95,123 Built 2010 or later 1.3% 0.6% 0.1% * Built 2000 to 2009 8.3% 7.6% 7.0% Built 1990 to 1999 5.1% 5.2% 5.7% Built 1980 to 1989 11.1% 10.9% 10.5% Built 1970 to 1979 11.2% 13.2% 14.3% * Built 1960 to 1969 14.6% 14.5% 14.1% Built 1950 to 1959 20.0% 20.6% 19.9% Built 1940 to 1949 11.7% 14.9% * 12.8% Built 1939 or earlier 16.7% 12.4% * 15.6%
1 of 9 09/19/2013
Subject Norfolk city, Virginia
2012 Estimate 2011 Estimate 2012 - 2011Statistical
Significance
2010 Estimate 2012 - 2010Statistical
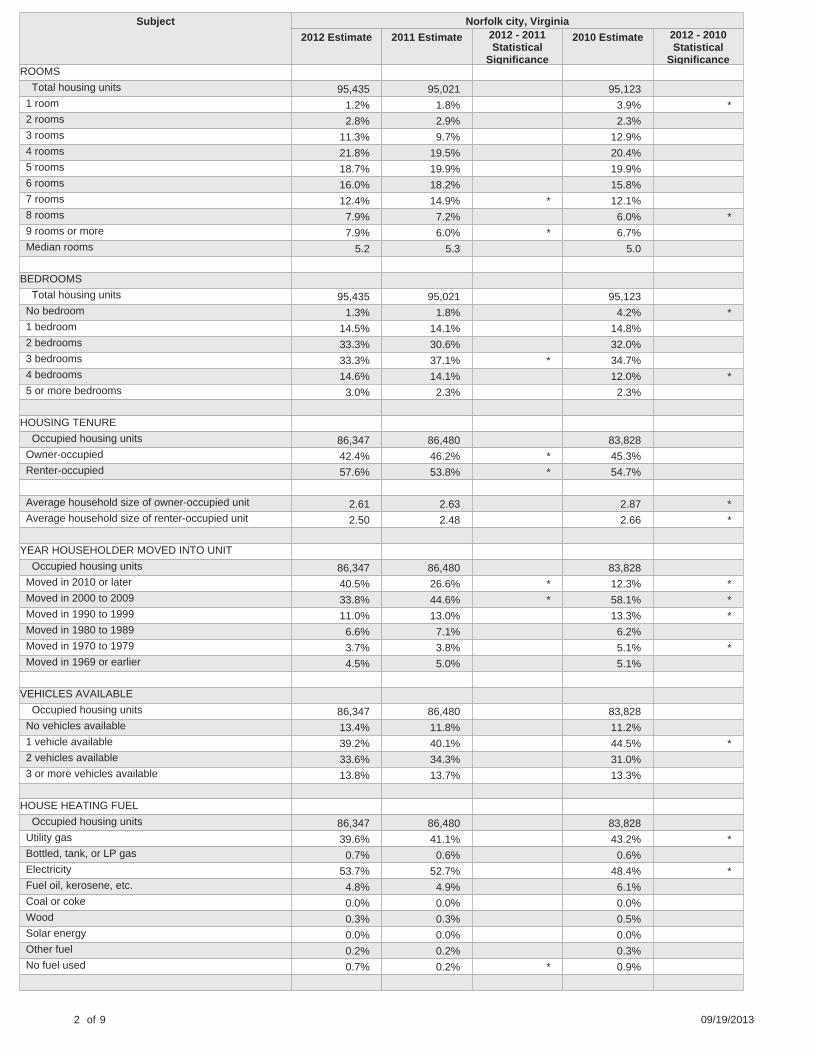
SignificanceROOMS
Total housing units 95,435 95,021 95,123 1 room 1.2% 1.8% 3.9% * 2 rooms 2.8% 2.9% 2.3% 3 rooms 11.3% 9.7% 12.9% 4 rooms 21.8% 19.5% 20.4% 5 rooms 18.7% 19.9% 19.9% 6 rooms 16.0% 18.2% 15.8% 7 rooms 12.4% 14.9% * 12.1% 8 rooms 7.9% 7.2% 6.0% * 9 rooms or more 7.9% 6.0% * 6.7% Median rooms 5.2 5.3 5.0
BEDROOMS
Total housing units 95,435 95,021 95,123 No bedroom 1.3% 1.8% 4.2% * 1 bedroom 14.5% 14.1% 14.8% 2 bedrooms 33.3% 30.6% 32.0% 3 bedrooms 33.3% 37.1% * 34.7% 4 bedrooms 14.6% 14.1% 12.0% * 5 or more bedrooms 3.0% 2.3% 2.3%
HOUSING TENURE
Occupied housing units 86,347 86,480 83,828 Owner-occupied 42.4% 46.2% * 45.3% Renter-occupied 57.6% 53.8% * 54.7%
Average household size of owner-occupied unit 2.61 2.63 2.87 * Average household size of renter-occupied unit 2.50 2.48 2.66 *
YEAR HOUSEHOLDER MOVED INTO UNIT
Occupied housing units 86,347 86,480 83,828 Moved in 2010 or later 40.5% 26.6% * 12.3% * Moved in 2000 to 2009 33.8% 44.6% * 58.1% * Moved in 1990 to 1999 11.0% 13.0% 13.3% * Moved in 1980 to 1989 6.6% 7.1% 6.2% Moved in 1970 to 1979 3.7% 3.8% 5.1% * Moved in 1969 or earlier 4.5% 5.0% 5.1%
VEHICLES AVAILABLE
Occupied housing units 86,347 86,480 83,828 No vehicles available 13.4% 11.8% 11.2% 1 vehicle available 39.2% 40.1% 44.5% * 2 vehicles available 33.6% 34.3% 31.0% 3 or more vehicles available 13.8% 13.7% 13.3%
HOUSE HEATING FUEL
Occupied housing units 86,347 86,480 83,828 Utility gas 39.6% 41.1% 43.2% * Bottled, tank, or LP gas 0.7% 0.6% 0.6% Electricity 53.7% 52.7% 48.4% * Fuel oil, kerosene, etc. 4.8% 4.9% 6.1% Coal or coke 0.0% 0.0% 0.0% Wood 0.3% 0.3% 0.5% Solar energy 0.0% 0.0% 0.0% Other fuel 0.2% 0.2% 0.3% No fuel used 0.7% 0.2% * 0.9%
2 of 9 09/19/2013

Subject Norfolk city, Virginia
2012 Estimate 2011 Estimate 2012 - 2011Statistical
Significance
2010 Estimate 2012 - 2010Statistical
SignificanceSELECTED CHARACTERISTICS
Occupied housing units 86,347 86,480 83,828 Lacking complete plumbing facilities 0.1% 0.7% * 0.1% Lacking complete kitchen facilities 0.5% 1.1% 0.3% No telephone service available 2.9% 3.5% 3.2%
OCCUPANTS PER ROOM
Occupied housing units 86,347 86,480 83,828 1.00 or less 96.7% 97.5% 96.5% 1.01 to 1.50 2.7% 1.7% 1.6% 1.51 or more 0.6% 0.9% 1.9% *
VALUE
Owner-occupied units 36,584 39,969 * 37,985 Less than $50,000 3.6% 2.0% * 2.9% $50,000 to $99,999 4.9% 5.2% 3.3% $100,000 to $149,999 14.8% 16.4% 13.3% $150,000 to $199,999 30.2% 29.0% 24.0% * $200,000 to $299,999 23.7% 27.2% 30.5% * $300,000 to $499,999 14.7% 13.9% 17.3% $500,000 to $999,999 7.4% 5.3% * 7.0% $1,000,000 or more 0.6% 1.1% 1.6% * Median (dollars) 193,400 195,300 216,300 *
MORTGAGE STATUS
Owner-occupied units 36,584 39,969 * 37,985 Housing units with a mortgage 74.0% 74.5% 70.0% * Housing units without a mortgage 26.0% 25.5% 30.0% *
SELECTED MONTHLY OWNER COSTS (SMOC)
Housing units with a mortgage 27,062 29,791 * 26,599 Less than $300 0.2% 0.0% 0.0% $300 to $499 0.7% 0.2% 0.9% $500 to $699 2.1% 1.4% 2.8% $700 to $999 7.3% 10.2% * 10.1% $1,000 to $1,499 35.5% 31.8% 24.6% * $1,500 to $1,999 24.6% 29.9% * 32.2% * $2,000 or more 29.5% 26.5% 29.4% Median (dollars) 1,572 1,586 1,698 *
Housing units without a mortgage 9,522 10,178 11,386 * Less than $100 0.6% 0.0% 0.0% $100 to $199 8.4% 3.0% * 2.3% * $200 to $299 8.3% 12.3% 9.2% $300 to $399 15.7% 13.0% 16.2% $400 or more 67.0% 71.7% 72.4% Median (dollars) 517 537 530
SELECTED MONTHLY OWNER COSTS AS APERCENTAGE OF HOUSEHOLD INCOME (SMOCAPI) Housing units with a mortgage (excluding units whereSMOCAPI cannot be computed)
26,863 29,678 * 26,599
Less than 20.0 percent 30.0% 22.1% * 24.7% 20.0 to 24.9 percent 16.2% 16.6% 13.7% 25.0 to 29.9 percent 10.9% 14.5% 15.8% * 30.0 to 34.9 percent 10.8% 11.0% 11.7% 35.0 percent or more 32.1% 35.8% 34.1%
Not computed 199 113 0
3 of 9 09/19/2013

Subject Norfolk city, Virginia
2012 Estimate 2011 Estimate 2012 - 2011Statistical
Significance
2010 Estimate 2012 - 2010Statistical
Significance
Housing unit without a mortgage (excluding unitswhere SMOCAPI cannot be computed)
9,281 9,969 11,336 *
Less than 10.0 percent 39.1% 29.1% * 31.9% 10.0 to 14.9 percent 18.2% 26.1% * 18.3% 15.0 to 19.9 percent 11.7% 11.2% 18.6% * 20.0 to 24.9 percent 9.0% 7.0% 7.8% 25.0 to 29.9 percent 7.1% 9.6% 6.3% 30.0 to 34.9 percent 3.8% 4.0% 6.2% 35.0 percent or more 11.1% 13.0% 10.8%
Not computed 241 209 50
GROSS RENT
Occupied units paying rent 48,497 45,672 44,857 Less than $200 2.7% 3.0% 2.0% $200 to $299 3.9% 3.7% 3.0% $300 to $499 3.9% 3.1% 2.7% $500 to $749 14.9% 13.5% 14.8% $750 to $999 34.2% 31.0% 33.9% $1,000 to $1,499 26.8% 31.9% * 32.8% * $1,500 or more 13.6% 13.8% 10.8% Median (dollars) 928 964 * 943
No rent paid 1,266 839 986
GROSS RENT AS A PERCENTAGE OF HOUSEHOLDINCOME (GRAPI) Occupied units paying rent (excluding units whereGRAPI cannot be computed)
47,191 44,346 43,794
Less than 15.0 percent 7.9% 8.0% 8.5% 15.0 to 19.9 percent 9.1% 10.8% 8.0% 20.0 to 24.9 percent 12.5% 9.8% 11.9% 25.0 to 29.9 percent 14.7% 12.3% 11.1% * 30.0 to 34.9 percent 9.8% 11.2% 13.6% * 35.0 percent or more 46.2% 47.8% 46.9%
Not computed 2,572 2,165 2,049
4 of 9 09/19/2013

Subject Norfolk city, Virginia
2009 Estimate 2012 - 2009Statistical
Significance
2008 Estimate 2012 - 2008Statistical
SignificanceHOUSING OCCUPANCY
Total housing units 96,216 95,657 Occupied housing units 88.4% 88.7% Vacant housing units 11.6% 11.3%
Homeowner vacancy rate 3.4 3.9 Rental vacancy rate 7.0 6.9
UNITS IN STRUCTURE
Total housing units 96,216 95,657 1-unit, detached 49.7% 49.2% 1-unit, attached 5.8% * 8.2% 2 units 8.3% 5.8% 3 or 4 units 6.5% 7.6% 5 to 9 units 10.6% 12.0% 10 to 19 units 9.5% * 7.5% 20 or more units 8.5% 9.4% Mobile home 1.1% 0.3% * Boat, RV, van, etc. 0.1% 0.0%
YEAR STRUCTURE BUILT
Total housing units 96,216 95,657 Built 2010 or later 0.0% * 0.0% * Built 2000 to 2009 7.8% 7.6% Built 1990 to 1999 5.5% 7.3% * Built 1980 to 1989 10.0% 9.8% Built 1970 to 1979 13.5% * 13.0% Built 1960 to 1969 13.1% 12.7% Built 1950 to 1959 21.6% 19.9% Built 1940 to 1949 12.6% 15.1% * Built 1939 or earlier 15.8% 14.6%
ROOMS
Total housing units 96,216 95,657 1 room 2.3% 4.3% * 2 rooms 2.4% 2.1% 3 rooms 12.9% 11.1% 4 rooms 19.7% 19.1% 5 rooms 20.1% 17.6% 6 rooms 16.8% 18.4% 7 rooms 11.5% 11.9% 8 rooms 8.4% 7.0% 9 rooms or more 5.9% * 8.5% Median rooms 5.1 5.3
BEDROOMS
Total housing units 96,216 95,657 No bedroom 2.5% * 4.5% * 1 bedroom 15.3% 14.9% 2 bedrooms 31.7% 29.9% 3 bedrooms 34.7% 34.1% 4 bedrooms 12.9% 13.5% 5 or more bedrooms 2.9% 3.0%
HOUSING TENURE
Occupied housing units 85,060 84,875 Owner-occupied 45.2% 46.9% * Renter-occupied 54.8% 53.1% *
5 of 9 09/19/2013

Subject Norfolk city, Virginia
2009 Estimate 2012 - 2009Statistical
Significance
2008 Estimate 2012 - 2008Statistical
Significance
Average household size of owner-occupied unit 2.76 2.53 Average household size of renter-occupied unit 2.48 2.45
YEAR HOUSEHOLDER MOVED INTO UNIT
Occupied housing units 85,060 84,875 Moved in 2010 or later 0.0% * 0.0% * Moved in 2000 to 2009 70.4% * 66.3% * Moved in 1990 to 1999 12.5% 13.9% * Moved in 1980 to 1989 6.8% 7.9% Moved in 1970 to 1979 4.1% 5.5% * Moved in 1969 or earlier 6.1% * 6.3% *
VEHICLES AVAILABLE
Occupied housing units 85,060 84,875 No vehicles available 10.2% * 13.0% 1 vehicle available 40.7% 41.2% 2 vehicles available 34.0% 33.6% 3 or more vehicles available 15.0% 12.3%
HOUSE HEATING FUEL
Occupied housing units 85,060 84,875 Utility gas 44.6% * 43.0% Bottled, tank, or LP gas 0.7% 0.5% Electricity 48.5% * 46.9% * Fuel oil, kerosene, etc. 5.0% 8.1% * Coal or coke 0.0% 0.0% Wood 0.1% 0.4% Solar energy 0.0% 0.1% Other fuel 0.5% 0.5% No fuel used 0.4% 0.6%
SELECTED CHARACTERISTICS
Occupied housing units 85,060 84,875 Lacking complete plumbing facilities 0.6% * 0.8% * Lacking complete kitchen facilities 0.5% 1.2% * No telephone service available 2.2% 2.3%
OCCUPANTS PER ROOM
Occupied housing units 85,060 84,875 1.00 or less 97.6% 96.3% 1.01 to 1.50 1.5% * 1.6% 1.51 or more 0.9% 2.1% *
VALUE
Owner-occupied units 38,452 39,832 * Less than $50,000 4.2% 1.9% * $50,000 to $99,999 2.8% * 3.5% $100,000 to $149,999 12.3% 13.1% $150,000 to $199,999 24.6% * 23.3% * $200,000 to $299,999 30.0% * 32.6% * $300,000 to $499,999 18.3% * 14.7% $500,000 to $999,999 5.9% 9.4% $1,000,000 or more 1.8% * 1.4% * Median (dollars) 215,100 * 221,400 *
MORTGAGE STATUS
Owner-occupied units 38,452 39,832 *
6 of 9 09/19/2013
Subject Norfolk city, Virginia
2009 Estimate 2012 - 2009Statistical
Significance
2008 Estimate 2012 - 2008Statistical
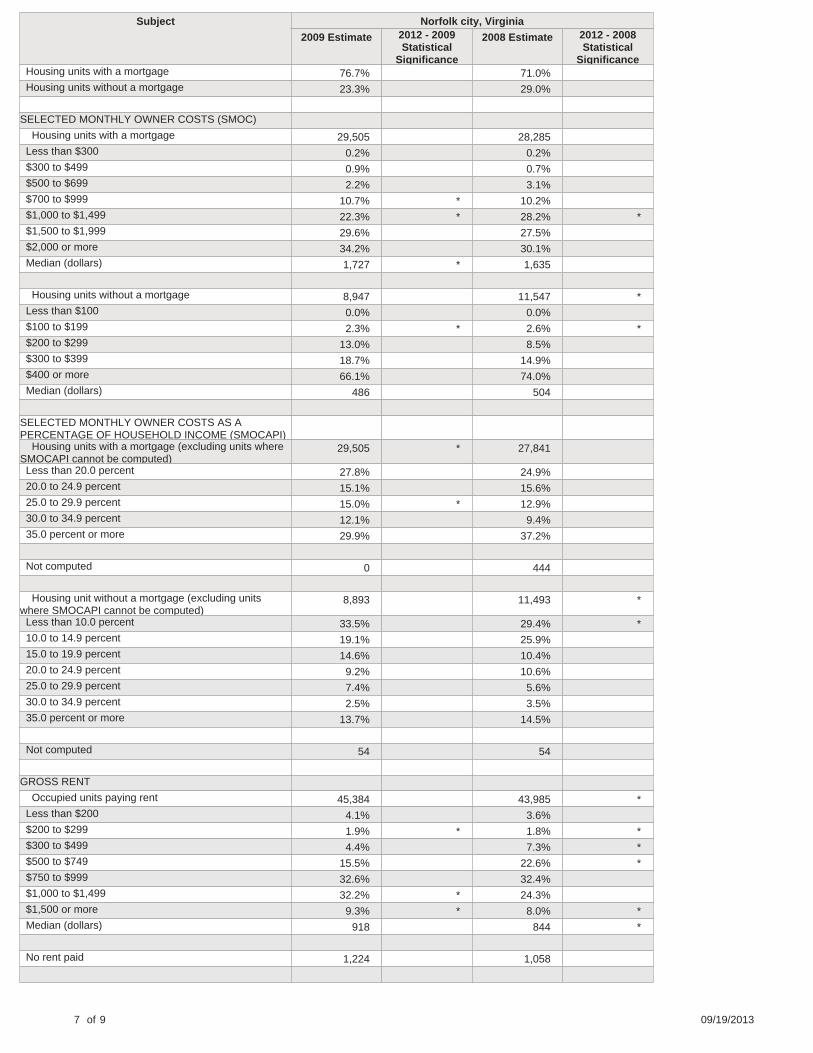
Significance Housing units with a mortgage 76.7% 71.0% Housing units without a mortgage 23.3% 29.0%
SELECTED MONTHLY OWNER COSTS (SMOC)
Housing units with a mortgage 29,505 28,285 Less than $300 0.2% 0.2% $300 to $499 0.9% 0.7% $500 to $699 2.2% 3.1% $700 to $999 10.7% * 10.2% $1,000 to $1,499 22.3% * 28.2% * $1,500 to $1,999 29.6% 27.5% $2,000 or more 34.2% 30.1% Median (dollars) 1,727 * 1,635
Housing units without a mortgage 8,947 11,547 * Less than $100 0.0% 0.0% $100 to $199 2.3% * 2.6% * $200 to $299 13.0% 8.5% $300 to $399 18.7% 14.9% $400 or more 66.1% 74.0% Median (dollars) 486 504
SELECTED MONTHLY OWNER COSTS AS APERCENTAGE OF HOUSEHOLD INCOME (SMOCAPI) Housing units with a mortgage (excluding units whereSMOCAPI cannot be computed)
29,505 * 27,841
Less than 20.0 percent 27.8% 24.9% 20.0 to 24.9 percent 15.1% 15.6% 25.0 to 29.9 percent 15.0% * 12.9% 30.0 to 34.9 percent 12.1% 9.4% 35.0 percent or more 29.9% 37.2%
Not computed 0 444
Housing unit without a mortgage (excluding unitswhere SMOCAPI cannot be computed)
8,893 11,493 *
Less than 10.0 percent 33.5% 29.4% * 10.0 to 14.9 percent 19.1% 25.9% 15.0 to 19.9 percent 14.6% 10.4% 20.0 to 24.9 percent 9.2% 10.6% 25.0 to 29.9 percent 7.4% 5.6% 30.0 to 34.9 percent 2.5% 3.5% 35.0 percent or more 13.7% 14.5%
Not computed 54 54
GROSS RENT
Occupied units paying rent 45,384 43,985 * Less than $200 4.1% 3.6% $200 to $299 1.9% * 1.8% * $300 to $499 4.4% 7.3% * $500 to $749 15.5% 22.6% * $750 to $999 32.6% 32.4% $1,000 to $1,499 32.2% * 24.3% $1,500 or more 9.3% * 8.0% * Median (dollars) 918 844 *
No rent paid 1,224 1,058
7 of 9 09/19/2013

Subject Norfolk city, Virginia
2009 Estimate 2012 - 2009Statistical
Significance
2008 Estimate 2012 - 2008Statistical
SignificanceGROSS RENT AS A PERCENTAGE OF HOUSEHOLDINCOME (GRAPI) Occupied units paying rent (excluding units whereGRAPI cannot be computed)
44,239 43,322
Less than 15.0 percent 9.8% 9.1% 15.0 to 19.9 percent 11.3% 9.9% 20.0 to 24.9 percent 11.3% 13.3% 25.0 to 29.9 percent 14.4% 9.9% * 30.0 to 34.9 percent 9.2% 9.0% 35.0 percent or more 44.0% 48.8%
Not computed 2,369 1,721
Data are based on a sample and are subject to sampling variability. The degree of uncertainty for an estimate arising from sampling variability isrepresented through the use of a margin of error. The value shown here is the 90 percent margin of error. The margin of error can be interpretedroughly as providing a 90 percent probability that the interval defined by the estimate minus the margin of error and the estimate plus the margin oferror (the lower and upper confidence bounds) contains the true value. In addition to sampling variability, the ACS estimates are subject tononsampling error (for a discussion of nonsampling variability, see Accuracy of the Data). The effect of nonsampling error is not represented in thesetables.
The median gross rent excludes no cash renters.
In prior years, the universe included all owner-occupied units with a mortgage. It is now restricted to include only those units where SMOCAPI iscomputed, that is, SMOC and household income are valid values.
In prior years, the universe included all owner-occupied units without a mortgage. It is now restricted to include only those units where SMOCAPI iscomputed, that is, SMOC and household income are valid values.
In prior years, the universe included all renter-occupied units. It is now restricted to include only those units where GRAPI is computed, that is, grossrent and household Income are valid values.
The 2009, 2010, 2011, and 2012 plumbing data for Puerto Rico will not be shown. Research indicates that the questions on plumbing facilities thatwere introduced in 2008 in the stateside American Community Survey and the 2008 Puerto Rico Community Survey may not have been appropriatefor Puerto Rico.
Median calculations for base table sourcing VAL, MHC, SMOC, and TAX should exclude zero values.
Telephone service data are not available for certain geographic areas due to problems with data collection. See Errata Note #93 for details.
While the 2012 American Community Survey (ACS) data generally reflect the December 2009 Office of Management and Budget (OMB) definitions ofmetropolitan and micropolitan statistical areas; in certain instances the names, codes, and boundaries of the principal cities shown in ACS tables maydiffer from the OMB definitions due to differences in the effective dates of the geographic entities.
Estimates of urban and rural population, housing units, and characteristics reflect boundaries of urban areas defined based on Census 2000 data.Boundaries for urban areas have not been updated since Census 2000. As a result, data for urban and rural areas from the ACS do not necessarilyreflect the results of ongoing urbanization.
Source: U.S. Census Bureau, 2012 American Community Survey
Explanation of Symbols:
1. An '**' entry in the margin of error column indicates that either no sample observations or too few sample observations were available tocompute a standard error and thus the margin of error. A statistical test is not appropriate. 2. An '-' entry in the estimate column indicates that either no sample observations or too few sample observations were available to compute anestimate, or a ratio of medians cannot be calculated because one or both of the median estimates falls in the lowest interval or upper interval of anopen-ended distribution. 3. An '-' following a median estimate means the median falls in the lowest interval of an open-ended distribution. 4. An '+' following a median estimate means the median falls in the upper interval of an open-ended distribution. 5. An '***' entry in the margin of error column indicates that the median falls in the lowest interval or upper interval of an open-ended distribution. Astatistical test is not appropriate.
8 of 9 09/19/2013

6. An '*****' entry in the margin of error column indicates that the estimate is controlled. A statistical test for sampling variability is not appropriate. 7. An 'N' entry in the estimate and margin of error columns indicates that data for this geographic area cannot be displayed because the number ofsample cases is too small. 8. An '(X)' means that the estimate is not applicable or not available.


![Norfolk Post (Norfolk, Va.) 1865-07-24 [p ] · 2017-12-16 · ETHE NORFOLK POST.Wished EVERY MOHNINO.Sunday'sExcepted,. NO. _ KOANGKK Stjl _\HE, NORFOLK, V.i., sold to Dealers anel](https://static.fdocuments.us/doc/165x107/5fb4e1db87e67e270302c1c3/norfolk-post-norfolk-va-1865-07-24-p-2017-12-16-ethe-norfolk-postwished.jpg)


![Norfolk southern [norfolk and western] zone 8 (2015)](https://static.fdocuments.us/doc/165x107/5886974c1a28abf6158b76af/norfolk-southern-norfolk-and-western-zone-8-2015.jpg)