Acquisition of MACH Gen, LLCtalenenergy.investorroom.com/download/Talen+Energy... · 2016 EV /...
27
Acquisition of MACH Gen, LLC July 2015 Investor Presentation 2.5 GWs of Efficient Gas-Fired Generation We Generate Energy for a Brighter Tomorrow
Transcript of Acquisition of MACH Gen, LLCtalenenergy.investorroom.com/download/Talen+Energy... · 2016 EV /...
Acquisition of MACH Gen, LLC
July 2015 Investor Presentation
2.5 GWs of Efficient Gas-Fired Generation
We Generate Energy for a Brighter Tomorrow

© Talen Energy Corporation 2015 2
Safe Harbor
Forward Looking Statements:
Any statements made in this presentation about future operating results
or other future events are forward-looking statements under the Safe
Harbor Provisions of the Private Securities Litigation Reform Act of
1995. Actual results may differ materially from such forward-looking
statements. A discussion of factors that could cause actual results or
events to vary is contained in the Supplemental Information to this
presentation and in the Company’s SEC filings, including the factors
discussed under “Risk Factors” in the Company’s Registration
Statement on Form S-1.
© Talen Energy Corporation 2015 3
Agenda
Transaction Highlights
MACH Gen Overview
Financial Considerations
Closing Remarks and Q&A
P. Farr
P. Farr
J. McGuire
P. Farr

© Talen Energy Corporation 2015 4
Creating Value from Day 1

© Talen Energy Corporation 2015 5
Executing on the Growth Strategy
Grow asset base in accretive manner 1
Extend track record of originating transactions 2
Expand presence in attractive markets 3
Further diversify fuel mix 4
Take advantage of cash taxpayer status 5
Strategic Priorities Communicated at Spin 50 Days Ago: MACH Gen:

© Talen Energy Corporation 2015 6
Transaction Highlights
Acquiring 2.5 GW MACH Gen portfolio for $1.175 billion, in a
negotiated deal, including significant tax attributes
Achieving goal of growth in key markets and fuel diversity with high
quality assets
Efficient Siemens 501G machines, with fleet benefits to Talen Energy’s
Ironwood and Lower Mount Bethel stations
Substantial, immediate free cash flow accretion of over 10%
Significant value from optimizing the Harquahala station
Fleet Diversification + Immediate Cash Flow Accretion
(1) Includes $13 million of inventory
(2) Based upon projected 2016E Adjusted Free Cash Flow assuming close by 12/31/2015
(2)
(1)
© Talen Energy Corporation 2015 7
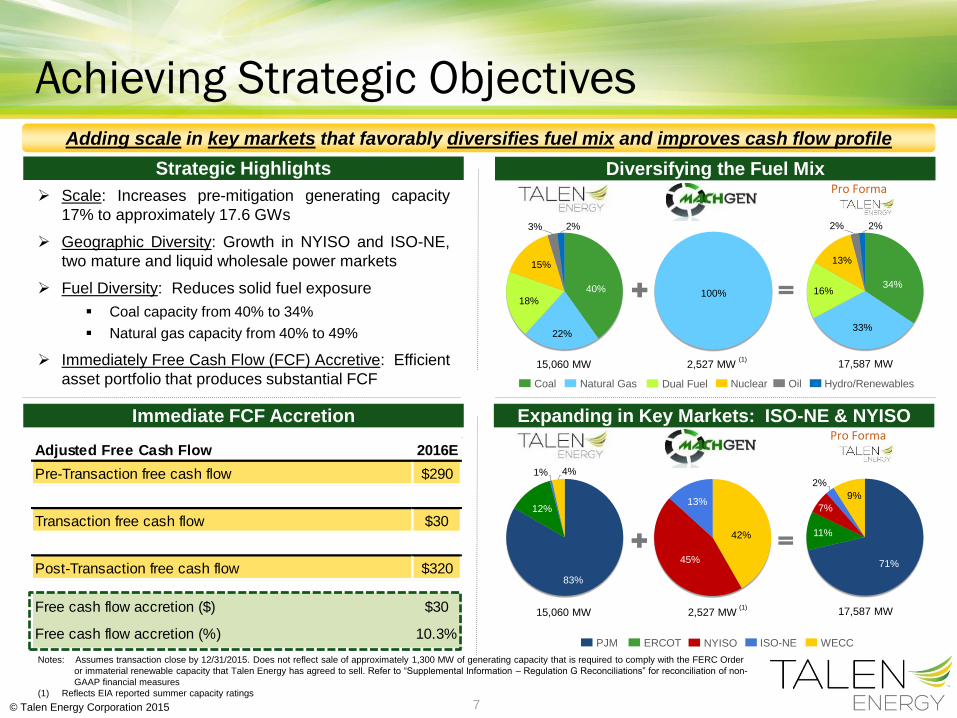
Adjusted Free Cash Flow 2016E
Pre-Transaction free cash flow $290
Transaction free cash flow $30
Post-Transaction free cash flow $320
Free cash flow accretion ($) $30
Free cash flow accretion (%) 10.3%
40%
22%
18%
15%
3% 2%
Pro Forma
34%
33%
16%
13%
2% 2%
Strategic Highlights
Immediate FCF Accretion
Adding scale in key markets that favorably diversifies fuel mix and improves cash flow profile
Scale: Increases pre-mitigation generating capacity
17% to approximately 17.6 GWs
Geographic Diversity: Growth in NYISO and ISO-NE,
two mature and liquid wholesale power markets
Fuel Diversity: Reduces solid fuel exposure
Coal capacity from 40% to 34%
Natural gas capacity from 40% to 49%
Immediately Free Cash Flow (FCF) Accretive: Efficient
asset portfolio that produces substantial FCF
Expanding in Key Markets: ISO-NE & NYISO
Achieving Strategic Objectives
Diversifying the Fuel Mix Pro Forma
15,060 MW 2,527 MW 17,587 MW
Coal Natural Gas Nuclear Oil Hydro/Renewables
15,060 MW 2,527 MW 17,587 MW
Notes: Assumes transaction close by 12/31/2015. Does not reflect sale of approximately 1,300 MW of generating capacity that is required to comply with the FERC Order
or immaterial renewable capacity that Talen Energy has agreed to sell. Refer to “Supplemental Information – Regulation G Reconciliations” for reconciliation of non-
GAAP financial measures
(1) Reflects EIA reported summer capacity ratings
Dual Fuel
PJM ERCOT ISO-NE WECC NYISO
83%
12%
1% 4%
100%
71%
11%
7%
2%
9%
42%
45%
13%
(1)
(1)

© Talen Energy Corporation 2015 8
MACH Gen Overview

© Talen Energy Corporation 2015 9
Athens Millennium Harquahala
Capacity (MW) 1,080 360 1,092
COD June 2004 April 2001 September 2004
Facility Type Combined Cycle Combined Cycle Combined Cycle
Equipment Siemens 501G Siemens 501G Siemens 501G
Configuration 3-1 CT x 1 ST 1 CT x 1 ST 3-1 CT x 1 ST
Heat Rate
(Btu/kWh)7,100 6,975 7,100
Portfolio Highlights
Portfolio Metrics Facilities Overview
MACH Gen Portfolio Diverse Geographic Footprint
3
1 2
AZ
ME
NH
CT NY
MA
RI
VT
1 2 3 2014 Generation – 5,794GWh Capacity – 2,532MW
Attractive low heat rate CCGT portfolio of scale with
over 2.5 GW of generating capacity
Relatively new portfolio with well maintained units
CODs ranging from 2001 - 2004
Proven operating track record – substantial past
investment to improve operations and reliability has
resulted in a 3 year availability factor of over 93%
Well-positioned to benefit from infrastructure
developments and improving market dynamics
23%
46%
31%
Athens Millennium Harquahala
(1) Based on nominal capacity ratings
(1)
43%
43%
14%
(1)
© Talen Energy Corporation 2015 10
Athens Highlights
Substantial Opportunity to Increase Output Compelling Future Outlook
Athens: An Optimization Opportunity Entry into NYISO
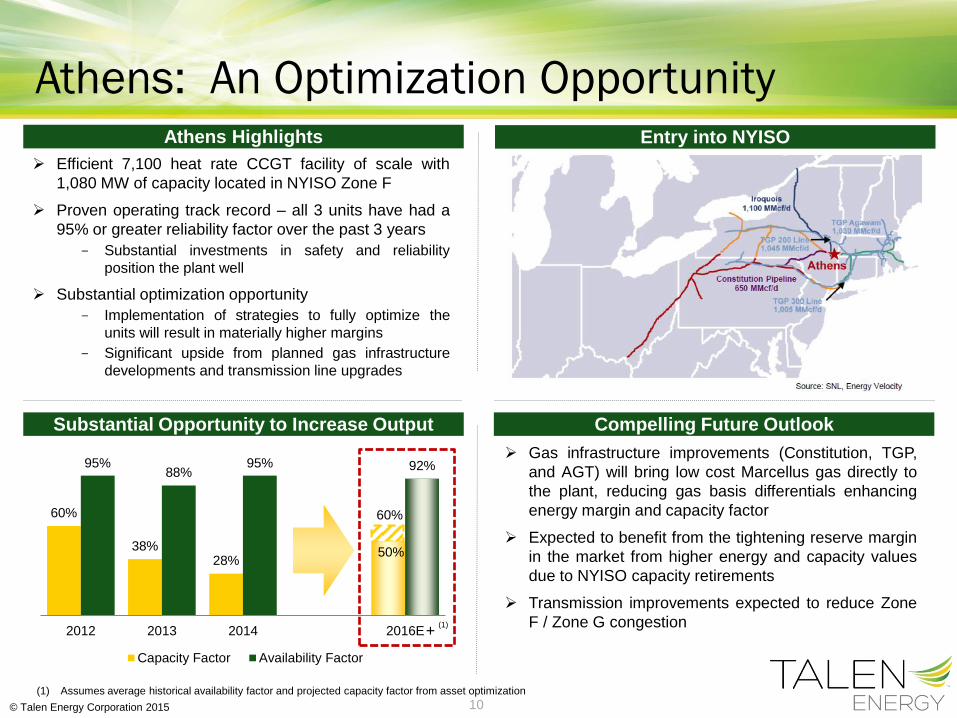
Efficient 7,100 heat rate CCGT facility of scale with
1,080 MW of capacity located in NYISO Zone F
Proven operating track record – all 3 units have had a
95% or greater reliability factor over the past 3 years
- Substantial investments in safety and reliability
position the plant well
Substantial optimization opportunity
- Implementation of strategies to fully optimize the
units will result in materially higher margins
- Significant upside from planned gas infrastructure
developments and transmission line upgrades
Gas infrastructure improvements (Constitution, TGP,
and AGT) will bring low cost Marcellus gas directly to
the plant, reducing gas basis differentials enhancing
energy margin and capacity factor
Expected to benefit from the tightening reserve margin
in the market from higher energy and capacity values
due to NYISO capacity retirements
Transmission improvements expected to reduce Zone
F / Zone G congestion
60%
+ (1)
(1) Assumes average historical availability factor and projected capacity factor from asset optimization
60%
38%28%
50%
95%88%
95% 92%
2012 2013 2014 2016E
Capacity Factor Availability Factor

© Talen Energy Corporation 2015 11
Millennium Highlights
Historically Solid Availability and Output Strong Market Fundamentals & Outlook
Millennium: Highly Attractive CCGT in ISO-NE Adding a well-positioned Asset in ISO-NE
Efficient sub-7,000 heat rate CCGT plant with 360 MW
of capacity located in ISO-NE
Proven operating track record – 97% or greater
reliability factor over the past 3 years
Plant node pricing substantially correlated to Mass
Hub, reducing basis risk
ISO-NE has adopted a number of constructive market
reforms, including capacity performance incentives,
improved day-ahead market modeling and the
adoption of a sloped demand curve, which should drive
long-term pricing to reflect new build costs
Favorable supply and demand dynamics, including the
retirement of aging plants, phase out of nuclear
generation and no significant construction in progress
have resulted in tight capacity markets and a marked
shift in pricing
Tennessee and Algonquin gas transmission pipelines
expected to bring low-cost Marcellus gas to
Massachusetts beginning in 2016, with incremental
improvements scheduled through 2018
65%
47%
58%
89% 88% 90%
2012 2013 2014
Capacity Factor Availability Factor

© Talen Energy Corporation 2015 12
Harquahala Highlights
Multiple Opportunities to Deliver Value
Harquahala: Multiple Paths to Value Location Limits Market Opportunity
Efficient 7,100 heat rate CCGT plant in southwestern
Arizona with 1,092 MW of capacity
Adequate water supply provides competitive advantage
Current market dynamics have limited the operational
capability of a high quality plant
- Sub-20% capacity factors despite very strong
performance at a 99% or greater reliability factor over
the past 3 years
- Produces negative EBITDA and FCF
Well-positioned to capture value as Desert Southwest
faced with 111(d) compliance
$50 million to
>$150 million
Potential partial or full sale to local load serving entity
Achieve fleet wide Long-term Service Agreement (LTSA) savings across
Talen Energy's nine 501G units
New transmission access into California-ISO under development
Move and relocate plant to another site
Monetize station for parts value

© Talen Energy Corporation 2015 13
Financial Considerations

© Talen Energy Corporation 2015 14
Purchase Price $1,175
Less Inventory Value (13)
Net Purchase Price 1,162
2016 EV / EBITDA ($120) 9.7x
Implied $ / kW 459
Implied $ / kW, excluding Harquahala 807
Tax Attribute Value
Net Purchase Price $1,162
Less NPV of Tax Attributes (245)
Adjusted Purchase Price 917
2016 EV / EBITDA ($120) 7.6x
Implied $ / kW 362
Implied $ / kW, excluding Harquahala 637
Harquahala Monetized
Adjusted Purchase Price $917
Less Monetization of Harquahala (50) (150)
Net Price for Athens and Millennium 867 767
2016 EV / EBITDA, excluding Harquahala ($130) 6.7x 5.9x
Implied $ / kW, excluding Harquahala 602 533
Compelling Value
Nominal purchase price of $1,162
million net of inventory implies an
EV / 2016 EBITDA multiple of 9.7x A
Deducting the PV of tax attributes
reduces the asset purchase price
to $917 million which is 7.6x 2016E
EBITDA
B
C
Monetizing Harquahala and
removing its negative EBITDA
contribution results in multiples in
the low-to-mid 6.0x EV / 2016
EBITDA range
Tax attributes and Harquahala offer significant value,
driving the purchase price to a considerable discount
to market multiples
Notes: Market data as of July 17, 2015. Peer multiples based upon EBITDA per FactSet consensus estimates.
Implied $ / kW based on nominal capacity ratings
($ millions)
Peer Trading Multiples 2016 2017
Calpine 8.8x 8.6x
Dynegy 7.5x 7.6x
NRG 8.7x 9.2x

© Talen Energy Corporation 2015 15
($ in millions) Pre-Transaction Post-Transaction
EBITDA:
2016E Adjusted EBITDA $885 $1,005
2016E Adjusted EBITDA, including special items $840 $960
Free Cash Flow:
2016E Adjusted Free Cash Flow $290 $320
2016E Adjusted Free Cash Flow, including special items $263 $293
Projected Net Debt Outstanding at 12/31/2015 $3,700 $4,875
Projected Net Debt / 2016E Adjusted EBITDA 4.2x 4.9x
2016 EBITDA & FCF Projections
Notes: Assumes transaction close by 12/31/2015. Does not reflect sale of approximately 1.3 GW of generating capacity that is required to comply with FERC
order approving Talen Energy transaction. Refer to “Supplemental Information – Regulation G Reconciliations” for reconciliation of non-GAAP
financial measures
(1) Special items include Transition Service Agreements from Talen Energy transaction and restructuring costs
(2) Does not include growth capex of $85 million
(3) Includes projection of $170 million in short-term debt outstanding
(1) (2)
(2)
(3)
(1)

© Talen Energy Corporation 2015 16
Transaction Financing
Purchase price backed by committed acquisition facility
- Sized to accommodate full purchase price should MACH Gen debt not
remain in place
Committed
Acquisition
Facility
Permanent
Financing
Plan
Total $1.175 billion purchase price to be financed with debt
MACH Gen debt may be retained provided waiver on
change of control achieved - Expected balance of approximately $565 million at time of closing
- Cash required at closing dependent upon MACH Gen debt balance
Will consider secured and/or unsecured debt - Final financing plan will take into consideration market conditions,
amount of the existing MACH Gen debt to be retained as well as
expected proceeds from FERC mitigation sales and other pending
divestitures
- May approach market ahead of closing
Strategic and Prudent Use of Balance Sheet

© Talen Energy Corporation 2015 17
Regulatory Approvals and Expected Timeline
Principal Required Approvals
Required Approval Expected Timing
Federal Energy Regulatory Commission (FERC) 3-4 months
NY Public Service Commission 3-4 months
Hart-Scott-Rodino – Federal Trade Commission (FTC) / Department of Justice (DOJ) 1-2 months
(1)
(1) An additional 3-4 months could be added for certain supplementary filings if change of control waiver is not obtained from MACH Gen’s lender
and facility is pledged in support of acquisition financing

© Talen Energy Corporation 2015 18
Closing Remarks

© Talen Energy Corporation 2015 19
Executing Talen Energy’s Strategy
Grow asset base in accretive manner 1
Extend track record of originating transactions 2
Expand presence in attractive markets 3
Further diversify fuel mix 4
Take advantage of cash taxpayer status 5
Strategic Priorities Communicated at Spin 50 Days Ago: MACH Gen:

© Talen Energy Corporation 2015 20
Supplemental Information

© Talen Energy Corporation 2015 21
Transaction Terms and Timing
On July 18, 2015, Talen Energy Supply, LLC entered into an agreement to acquire MACH
Gen, LLC for $1.175 billion including value of existing debt assumed
Transaction &
Purchase Price
Financing
Plan
Regulatory
Approvals
Timing
Federal: FERC and antitrust clearance under Hart-Scott-Rodino
State: New York Public Service Commission
Expected to close by end of 2015
Citi has provided committed debt financing sufficient to fund the purchase price
Considering retaining Mach Gen's existing term loan in combination with new secured or
unsecured debt issued at Talen Energy Supply, LLC
The final financing plan will take into consideration market conditions and the amount of
existing MACH Gen debt to be retained, as well as expected proceeds from FERC
mitigation sales and other pending divestitures
(1) Includes $13 million of inventory
(1)
© Talen Energy Corporation 2015 22
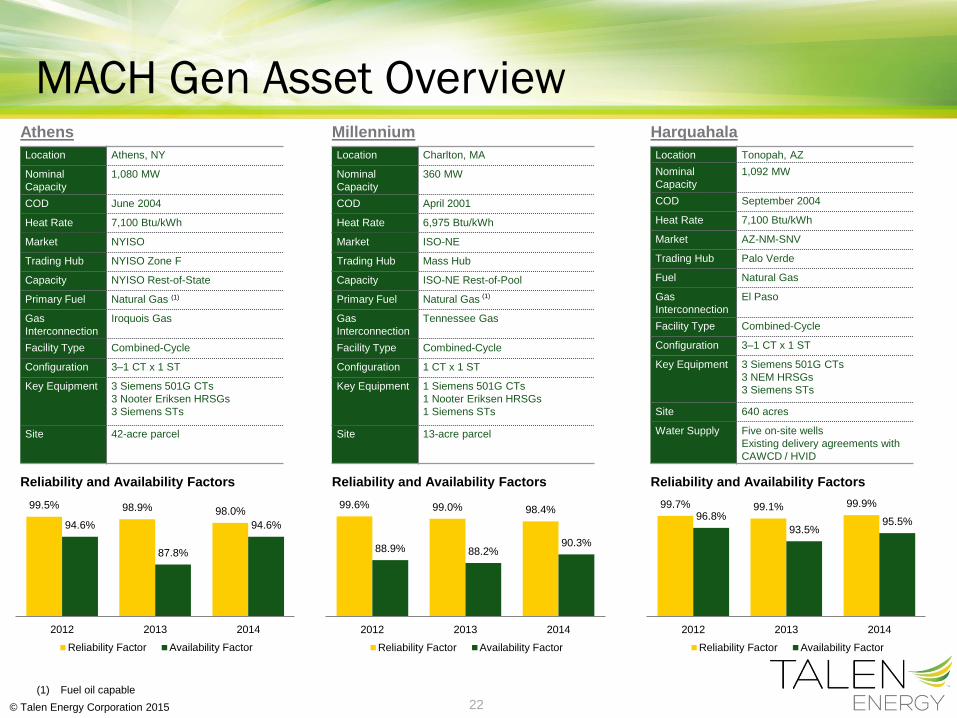
MACH Gen Asset Overview Athens Millennium Harquahala
Location Athens, NY
Nominal
Capacity
1,080 MW
COD June 2004
Heat Rate 7,100 Btu/kWh
Market NYISO
Trading Hub NYISO Zone F
Capacity NYISO Rest-of-State
Primary Fuel Natural Gas
Gas
Interconnection
Iroquois Gas
Facility Type Combined-Cycle
Configuration 3–1 CT x 1 ST
Key Equipment 3 Siemens 501G CTs
3 Nooter Eriksen HRSGs
3 Siemens STs
Site 42-acre parcel
Location Charlton, MA
Nominal
Capacity
360 MW
COD April 2001
Heat Rate 6,975 Btu/kWh
Market ISO-NE
Trading Hub Mass Hub
Capacity ISO-NE Rest-of-Pool
Primary Fuel Natural Gas
Gas
Interconnection
Tennessee Gas
Facility Type Combined-Cycle
Configuration 1 CT x 1 ST
Key Equipment 1 Siemens 501G CTs
1 Nooter Eriksen HRSGs
1 Siemens STs
Site 13-acre parcel
Location Tonopah, AZ
Nominal
Capacity
1,092 MW
COD September 2004
Heat Rate 7,100 Btu/kWh
Market AZ-NM-SNV
Trading Hub Palo Verde
Fuel Natural Gas
Gas
Interconnection
El Paso
Facility Type Combined-Cycle
Configuration 3–1 CT x 1 ST
Key Equipment 3 Siemens 501G CTs
3 NEM HRSGs
3 Siemens STs
Site 640 acres
Water Supply Five on-site wells
Existing delivery agreements with
CAWCD / HVID
Reliability and Availability Factors Reliability and Availability Factors Reliability and Availability Factors
99.5% 98.9% 98.0%
94.6%
87.8%
94.6%
2012 2013 2014
Reliability Factor Availability Factor
99.6% 99.0% 98.4%
88.9% 88.2%90.3%
2012 2013 2014
Reliability Factor Availability Factor
99.7% 99.1% 99.9%
96.8%
93.5%95.5%
2012 2013 2014
Reliability Factor Availability Factor
(1) (1)
(1) Fuel oil capable

© Talen Energy Corporation 2015 23
Regulation G Reconciliations
Adjusted EBITDA
($ in Millions) Pre-Transaction
Midpoint – 2016E
Transaction
Adjustments
Post-Transaction
Midpoint – 2016E
Net Income/(Loss) $105 $2 $107
Income Taxes 56 1 57
Interest Expense 209 81 290
Depreciation & Amortization 422 36 458
EBITDA 792 120 912
Non-Cash Compensation 21 21
ARO 37 37
MTM losses (gains)
NDT losses (gains) (10) (10)
Adjusted EBITDA, including special items 840 120 960
Special items:
TSA costs and allocations 45 45
Adjusted EBITDA $885 $120 $1,005

© Talen Energy Corporation 2015 24
Regulation G Reconciliations
Adjusted Free Cash Flow
($ in Millions) Pre-Transaction
Midpoint – 2016E
Transaction
Adjustments
Post-Transaction
Midpoint – 2016E
Cash from Operations $727 $55 $782
Sustenance Capital Expenditures (464) (25) (489)
Adjusted Free Cash Flow, including special
items 263 30 293
Special items:
TSA costs & allocations (after tax) 27 27
Adjusted Free Cash Flow $290 $30 $320

© Talen Energy Corporation 2015 25
Forward-Looking Information Statement
Statements contained in this presentation, including statements with respect to future earnings, EBITDA results, cash flows, tax
attributes, financing, regulation and corporate strategy are "forward-looking statements" within the meaning of the federal securities
laws. Although Talen Energy Corporation believes that the expectations and assumptions reflected in these forward-looking
statements are reasonable, these statements are subject to a number of risks and uncertainties, and actual results may differ
materially from the results discussed in the statements. Among the important factors that could cause actual results to differ
materially from the forward-looking statements are: market demand and prices for energy, capacity and fuel; weather conditions
affecting customer energy usage and operating costs; competition in power markets; the effect of any business or industry
restructuring; the profitability and liquidity of Talen Energy Corporation and its subsidiaries; new accounting requirements or new
interpretations or applications of existing requirements; operating performance of generating plants and other facilities; unforeseen
difficulties in successfully integrating the MACH Gen power facilities into Talen Energy's portfolio and/or in successfully executing
efforts to optimize the value of the Harquahala plant; unexpected costs or liabilities associated with the MACH Gen power facilities;
the length of scheduled and unscheduled outages at our generating plants; environmental conditions and requirements and the
related costs of compliance, including environmental capital expenditures and emission allowance and other expenses; system
conditions and operating costs; development of new projects, markets and technologies; performance of new ventures; asset or
business acquisitions and dispositions; receipt of necessary governmental permits or approvals; capital market conditions and
decisions regarding capital structure; the impact of state, federal or foreign investigations applicable to Talen Energy Corporation
and its subsidiaries; the outcome of litigation against Talen Energy Corporation and its subsidiaries; stock price performance; the
market prices of equity securities and the impact on pension income and resultant cash funding requirements for defined benefit
pension plans; the securities and credit ratings of Talen Energy Corporation and its subsidiaries; political, regulatory or economic
conditions in states, regions or countries where Talen Energy Corporation or its subsidiaries conduct business, including any
potential effects of threatened or actual terrorism or war or other hostilities; foreign exchange rates; new state, federal or foreign
legislation, including new tax legislation; changes in earnings estimates or buy/sell recommendations by analysts; volatility in market
demand and prices for energy, capacity, transmission services, emission allowances and RECs; competition in retail and wholesale
power and natural gas markets; and the commitments and liabilities of Talen Energy Corporation and its subsidiaries. Any such
forward-looking statements should be considered in light of such important factors and in conjunction with Talen Energy
Corporation's Registration Statement on Form S-1 and its other reports on file with the Securities and Exchange Commission.

© Talen Energy Corporation 2015 26
In this presentation the company presents EBITDA, Adjusted EBITDA and Adjusted EBITDA, including special items,
each of which are non-GAAP financial measures. EBITDA represents net income (loss) before interest expense, income
taxes, depreciation and amortization. Adjusted EBITDA represents EBITDA adjusted for certain items as detailed in the
reconciliation. Adjusted EBITDA, including special items, is Adjusted EBITDA prior to adjustment for items management
considers special including TSA costs, pre-spin PPL charges and restructuring costs. EBITDA, Adjusted EBITDA and
Adjusted EBITDA, including special items, are not intended to represent cash flows from operations or net income (loss)
as defined by U.S. GAAP as indicators of operating performance and are not necessarily comparable to similarly-titled
measures reported by other companies. We believe EBITDA, Adjusted EBITDA and Adjusted EBITDA, including special
items, are useful to investors and other users of our financial statements in evaluating our operating performance
because they provide additional tools to compare business performance across companies and across periods. We
believe that EBITDA is widely used by investors to measure a company’s operating performance without regard to such
items as interest expense, income taxes, depreciation and amortization, which can vary substantially from company to
company depending upon accounting methods and book value of assets, capital structure and the method by which
assets were acquired. Additionally, we believe that investors commonly adjust EBITDA information to eliminate the effect
of restructuring and other expenses, which vary widely from company to company and impair comparability. We adjust for
these and other items as our management believes that these items would distort their ability to efficiently view and
assess our core operating trends.
In summary, our management uses EBITDA, Adjusted EBITDA and Adjusted EBITDA, including special items, as
measures of operating performance to assist in comparing performance from period to period on a consistent basis and
to readily view operating trends, as measures for planning and forecasting overall expectations and for evaluating actual
results against such expectations, and in communications with our Board of Directors, shareholders, creditors, analysts
and investors concerning our financial performance.
Definitions of Non-GAAP Financial Measures
© Talen Energy Corporation 2015 27
Adjusted free cash flow is derived by deducting sustenance capital expenditures and after-tax special items from cash
flow from operations, while adjusted free cash flow, including special items, is derived from adjusted free cash flow prior
to adjustment for after-tax special items. These two non-GAAP measures should not be considered alternatives to cash
flow from operations, which is determined in accordance with GAAP. We believe that adjusted free cash flow and
adjusted free cash flow, including special items, although both non-GAAP measures, are important measures to both
management and investors as indicators of the company’s ability to sustain operations without additional outside
financing beyond the requirement to fund maturing debt obligations. These measures are not necessarily comparable to
similarly-titled measures reported by other companies as they may be calculated differently.
Definitions of Non-GAAP Financial Measures