
Acquisition and Processing of Wider Bandwidth Seismic Data ...
14
minerals Article Acquisition and Processing of Wider Bandwidth Seismic Data in Crystalline Crust: Progress with the Metal Earth Project Mostafa Naghizadeh 1, * , David Snyder 1 , Saeid Cheraghi 1 , Steven Foster 2 , Samo Cilensek 2 , Elvis Floreani 2 and Jeff Mackie 3 1 Harquail School of Earth Sciences, Laurentian University, Sudbury, ON, P3E2C6, Canada; [email protected] (M.N.); [email protected] (D.S.); [email protected] (S.C.) 2 Absolute Imaging Inc., Calgary, AB, T2R1J2, Canada; [email protected] (S.F.); [email protected] (S.C.); [email protected] (E.F.) 3 SAExploration Ltd., Calgary, AB, T2B3M2, Canada; [email protected] * Correspondence: [email protected] Received: 22 January 2019; Accepted: 22 February 2019; Published: date Abstract: The Metal Earth project acquired 927 km of deep seismic reflection profiles from August to November of 2017. Seismic data acquired in this early stage of the Metal Earth project benefited greatly from recent advances in the petroleum sector as well as those in mineral exploration. Vibroseis acquisition with receivers having a 5 Hz response (10 dB down) generated records from a sweep signal starting at 2 Hz, sweeping up to 150 Hz or 200 Hz. Not only does this broadband signal enhance reflections from the deepest to the shallowest crust, but it also helps the use of full waveform inversion (e.g., to mitigate cycle-skipping) and related techniques. Metal Earth regional-scale transects using over 5000 active sensors target mineralizing fluid pathways throughout the crust, whereas higher spatial-resolution reflection and full-waveform surveys target structures at mine camp scales. Because Metal Earth was proposed to map and compare entire Archean ore and geologically similar non-ore systems, regional sections cover the entire crust to the Moho in the Abitibi and Wabigoon greenstone belts of the Superior craton in central Canada. Where the new sections overlap with previous Lithoprobe surveys, a clear improvement in reflector detection and definition is observed. Improvements are here attributed to the increased bandwidth of the signal, better estimates of refraction and reflection velocities used in processing, and especially the pre-stack time migration of the data. Keywords: mineral exploration; seismic reflection methods; hard rock exploration; archean ore systems 1. Introduction Innovative technology for conducting seismic exploration historically derives from petroleum exploration in sedimentary (soft) rock environments, but mineral exploration in crystalline (hard) rock environments requires different emphasis [1]. Major innovations and more incremental technical improvements have occurred simultaneously within the petroleum seismic exploration industry over the past decade and these were adapted into the Metal Earth seismic acquisition program [2]. Metal Earth is dedicated to understanding the processes responsible for the differential metal endowment in Archean greenstone provinces and to do so will, for the first time, map entire ore and non-ore systems at full crust-mantle scale to identify key geological-geochemical-geophysical attributes of metal sources, transport pathways, and economic concentrations. Metal Earth, therefore, requires new observations and data over a broad range of scales, from craton- to deposit-scale and integration of information from Minerals 2019, xx, 0; doi:10.3390/minxx010000 www.mdpi.com/journal/minerals
Transcript of Acquisition and Processing of Wider Bandwidth Seismic Data ...

minerals
Article
Acquisition and Processing of Wider BandwidthSeismic Data in Crystalline Crust: Progress with theMetal Earth Project
Mostafa Naghizadeh 1,* , David Snyder 1, Saeid Cheraghi 1, Steven Foster 2, Samo Cilensek 2,Elvis Floreani 2 and Jeff Mackie 3
1 Harquail School of Earth Sciences, Laurentian University, Sudbury, ON, P3E2C6, Canada;[email protected] (M.N.); [email protected] (D.S.); [email protected] (S.C.)
2 Absolute Imaging Inc., Calgary, AB, T2R1J2, Canada; [email protected] (S.F.);[email protected] (S.C.); [email protected] (E.F.)
3 SAExploration Ltd., Calgary, AB, T2B3M2, Canada; [email protected]* Correspondence: [email protected]
Received: 22 January 2019; Accepted: 22 February 2019; Published: date�����������������
Abstract: The Metal Earth project acquired 927 km of deep seismic reflection profiles from Augustto November of 2017. Seismic data acquired in this early stage of the Metal Earth project benefitedgreatly from recent advances in the petroleum sector as well as those in mineral exploration. Vibroseisacquisition with receivers having a 5 Hz response (10 dB down) generated records from a sweepsignal starting at 2 Hz, sweeping up to 150 Hz or 200 Hz. Not only does this broadband signalenhance reflections from the deepest to the shallowest crust, but it also helps the use of full waveforminversion (e.g., to mitigate cycle-skipping) and related techniques. Metal Earth regional-scale transectsusing over 5000 active sensors target mineralizing fluid pathways throughout the crust, whereashigher spatial-resolution reflection and full-waveform surveys target structures at mine camp scales.Because Metal Earth was proposed to map and compare entire Archean ore and geologically similarnon-ore systems, regional sections cover the entire crust to the Moho in the Abitibi and Wabigoongreenstone belts of the Superior craton in central Canada. Where the new sections overlap withprevious Lithoprobe surveys, a clear improvement in reflector detection and definition is observed.Improvements are here attributed to the increased bandwidth of the signal, better estimates ofrefraction and reflection velocities used in processing, and especially the pre-stack time migration ofthe data.
Keywords: mineral exploration; seismic reflection methods; hard rock exploration; archean oresystems
1. Introduction
Innovative technology for conducting seismic exploration historically derives from petroleumexploration in sedimentary (soft) rock environments, but mineral exploration in crystalline (hard)rock environments requires different emphasis [1]. Major innovations and more incremental technicalimprovements have occurred simultaneously within the petroleum seismic exploration industry overthe past decade and these were adapted into the Metal Earth seismic acquisition program [2]. MetalEarth is dedicated to understanding the processes responsible for the differential metal endowment inArchean greenstone provinces and to do so will, for the first time, map entire ore and non-ore systemsat full crust-mantle scale to identify key geological-geochemical-geophysical attributes of metal sources,transport pathways, and economic concentrations. Metal Earth, therefore, requires new observationsand data over a broad range of scales, from craton- to deposit-scale and integration of information from
Minerals 2019, xx, 0; doi:10.3390/minxx010000 www.mdpi.com/journal/minerals

Minerals 2019, xx, 0 2 of 14
seismic, magnetotelluric (MT), gravity and traditional geological mapping surveys. The primary modeof transect surveying, deep seismic reflection profiling, will build upon previous regional-scale surveysconducted as part of the Lithoprobe and Discover Abitibi projects [3–6]. Acquisition technology issignificantly improved from the early days of Lithoprobe (1990), less so from the time of DiscoverAbitibi (2005). A few seemingly small improvements however now enable very significant newapproaches to analysis and enhance our understanding of mineralization pathways and processes.Here the focus will be solely on the advances adopted in the seismic reflection profiling method,particularly those embracing broader bandwidth data and its migration. In this article, we will onlydiscuss the seismic processing workflow for the crustal scale (R1) seismic data. The processing andanalysis of high-resolution (R2) and full waveform inversion tailored (R3) seismic data is currentlyunderway and will be discussed in future publications.
2. Seismic Data Acquisition
2.1. Improved Bandwidth
Perhaps the most straightforward improvement is in the bandwidth of seismic signal nowrecorded. It has long been known that frequencies higher than 50–70 Hz do not propagate wellinto the deep crust whereas low frequency propagation appears relatively unlimited [7]. The naturalsources such as earthquakes are recorded across all the continents at less than 10 Hz if sufficientlylarge in magnitude. Local or regional seismic surveys using so-called controlled sources typically werelimited to frequencies greater than 10 Hz by the practicalities of the technology (e.g., limitation ofthe Vibroseis sources being able to start production sweep only at 6–8 Hz) and the large amount ofequipment typically required to acquire multi-fold seismic data. That has changed recently.
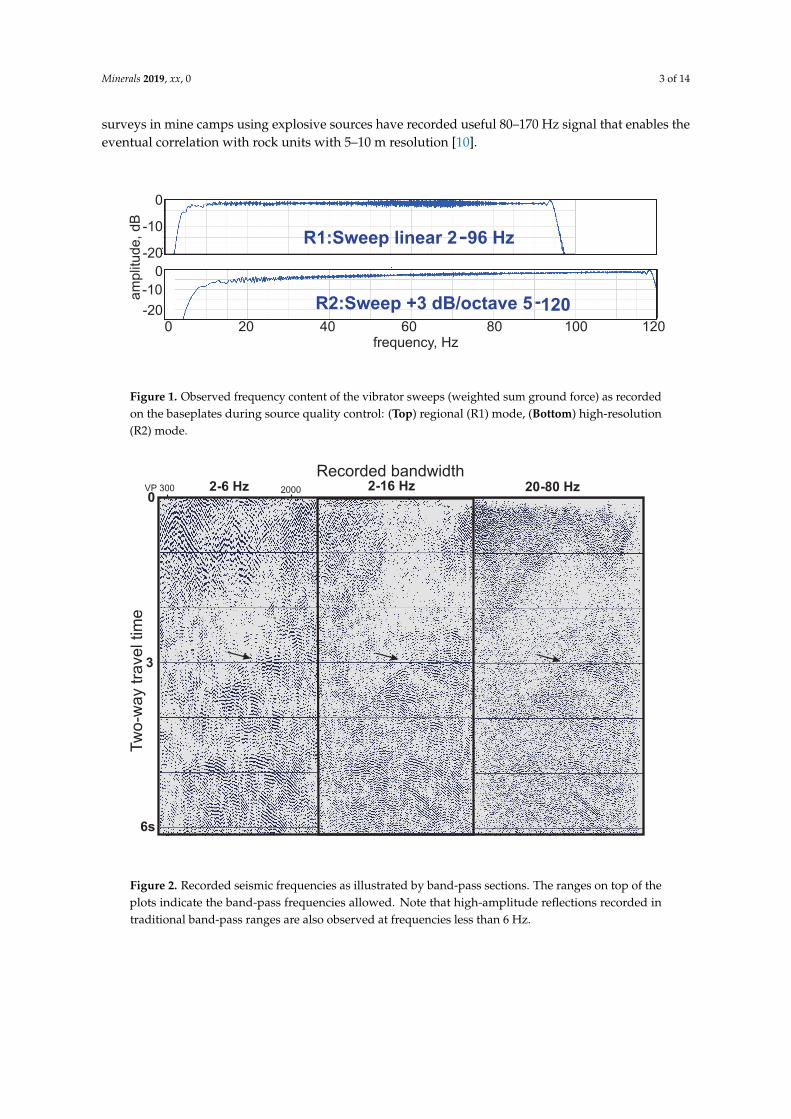
The newest large (61,800 lbs of peak force) vibrator trucks that are typically used as preciselycontrolled seismic sources by the petroleum industry now attain a theoretical bandwidth of 2 Hz to250 Hz (Figure 1). The AHV-IV 364 Commanders contracted by Metal Earth from SAExploration(SAExploration Ltd., Calgary, AB, Canada) attain a peak force at 6.2 Hz, but useful frequencies havebeen recorded as low as 3 Hz (Figure 2). A similar Vibroseis system was used to acquire PolandSPANregional seismic survey (2200 km) using custom broadband sweep of 2–150 Hz in 2011 [8]. Metal Earthused an array of four of these vibrator trucks producing a linear upsweep of 2–96 Hz that was repeatedfour times at each nominal source location. Based on the relatively fast seismic wave speeds previouslyencountered near the surface in these greenstone belts, useful P-wave seismic wavelengths of 50–3000m were thus generated. In a high-resolution acquisition mode (Table 1), an upsweep of 5–120 Hz wasrepeated four times but with a 6.25 m move up between each sweep and these results will be describedelsewhere. Strong, near-source S-wave conversions similar to those of some Discover Abitibi transectsare again observed at the alluvium-basement discontinuity several meters below the surface [9].
Receiver bandwidth has also improved. Metal Earth deployed single SG-5 vertical-component5-Hz geophones within an OYO GSX Wireless nodal recording system. Although these geophones havea 5-Hz natural frequency, the recorded signal is down only a few dB at 3 Hz (Figure 2). In the cable-lessrecording system used, each sensor with its associated recording box and power pack were harvestedwhen that sensor location was no longer required within the specified symmetrical receiver array.Lithoprobe-standard split-spread receiver arrays with 15-km far offsets were used for longer transects.Regional mode surveying used 50 m source and 25 m receiver intervals. For shorter transects, theentire spread remained fixed and active throughout the shooting. Long offsets continue to be valuablefor deep velocity analysis and in order to capture reflections off steeply dipping in-line structures.Wireless receiver spacing of 12.5 m was used in a second acquisition mode, so-called high-resolution2-D transects, and single sweeps at 6.25 m shot spacing makes the nominal common depth point (CDP)intervals of 3 m available if needed for better resolution. With frequencies of 120 Hz recorded to afew kilometers depth, vertical resolution of several tens of meters is theoretically possible. Recent 3-D
Minerals 2019, xx, 0 3 of 14
surveys in mine camps using explosive sources have recorded useful 80–170 Hz signal that enables theeventual correlation with rock units with 5–10 m resolution [10].
R2:Sweep +3 dB/octave 5-120
R1:Sweep linear 2-96 Hz
0 20 40 60 80 100 120frequency, Hz
0
-10
-20
0
-10
-20
am
plit
ud
e, d
B
Figure 1. Observed frequency content of the vibrator sweeps (weighted sum ground force) as recordedon the baseplates during source quality control: (Top) regional (R1) mode, (Bottom) high-resolution(R2) mode.
2-16 Hz 20-80 Hz0
3
6s
Recorded bandwidth2-6 HzVP 300 2000
Tw
o-w
ay tra
ve
l tim
e
Figure 2. Recorded seismic frequencies as illustrated by band-pass sections. The ranges on top of theplots indicate the band-pass frequencies allowed. Note that high-amplitude reflections recorded intraditional band-pass ranges are also observed at frequencies less than 6 Hz.

Minerals 2019, xx, 0 4 of 14
Table 1. Acquisition parameters used in regional, high-resolution, and full-waveform modes.
Parameter Regional (R1) Mode High-Resolution (R2) Mode Full-Waveform (R3)
Record length 12 or 16 s 12 s 12 sSample rate 2 ms 2 ms 2 msSpread size 15 km–0–15 km All live (10–20 km) All live (30–80 km)Roll on/off Yes Yes Yes
Source interval 50 m (4 sweeps); 12.5 m (1 sweep) 25 m (4 sweeps); 6.25 m (1 sweep) As in R1Receiver interval 25 m 12.5 m 25 mVibrator sweep 28 s, 2–96 Hz linear; 4 vibs; 28 s, 5–120 Hz + 3db/octave; 3 vibs; As in R1
2.2. Source Arrays
Source arrays are designed to help reduce the strength of surface waves and other noise generatedby the large trucks used as the seismic source. Array design involves the number of vibrator trucksused, the number of sweeps to be added together as a single effective source, and the distance betweenthe individual vibrator trucks while vibrating. Metal Earth seismic surveys were acquired with 12.5 mand 6.25 shots spacing between each single sweep per station for R1 and R2 acquisition scenarios,respectively (Table 1). It was anticipated that vibrator points (VPs) could be grouped to form largerarrays during the processing if a stronger source signal was required. For example, four neighbouringsweeps could be grouped to form 50 m source intervals. This large spacing between individualsweeps was adapted in order to make possible a higher spatial resolution, but also to mitigate damageto paved roads arising from repeated sweeps in the same location. Three early seismic transectsused source arrays similar to earlier Lithoprobe and Discover Abitibi surveys. The Chibougamautransect was acquired entirely on gravel roads and used four sweeps in one location. The Malarticand the Rouyn-Noranda transects used 1 m move up between each of four sweeps. The use of fourvibrators for every R1 sweep effectively made an 38-m-long source array and thus mitigated some ofthe horizontally propagating seismic noise (Figure 3). Testing at the beginning of the seismic program,on the Chibougamau transect, showed little difference between the 0 m and 6.25 m move up betweeneach sweep in stacked sections using 50 m source intervals.
Refraction
Converted Shear Wave
Surface Waves
ReflectionsReflections
Random Noise
Offset (Km)03691215 -3
Tim
e (S
ec)
0
2
4
6
Figure 3. A shot gather from Metal Earth’s Malartic R1 Survey
2.3. Toward Using Full Waveforms
In addition to operating at regional and high-resolution modes to create traditional CDP gathersand stacks, some transects were augmented so as to be analyzed using the full recorded seismicwaveforms. More commonly referred to as full waveform inversion (FWI) [11,12], this method requires
Minerals 2019, xx, 0 5 of 14
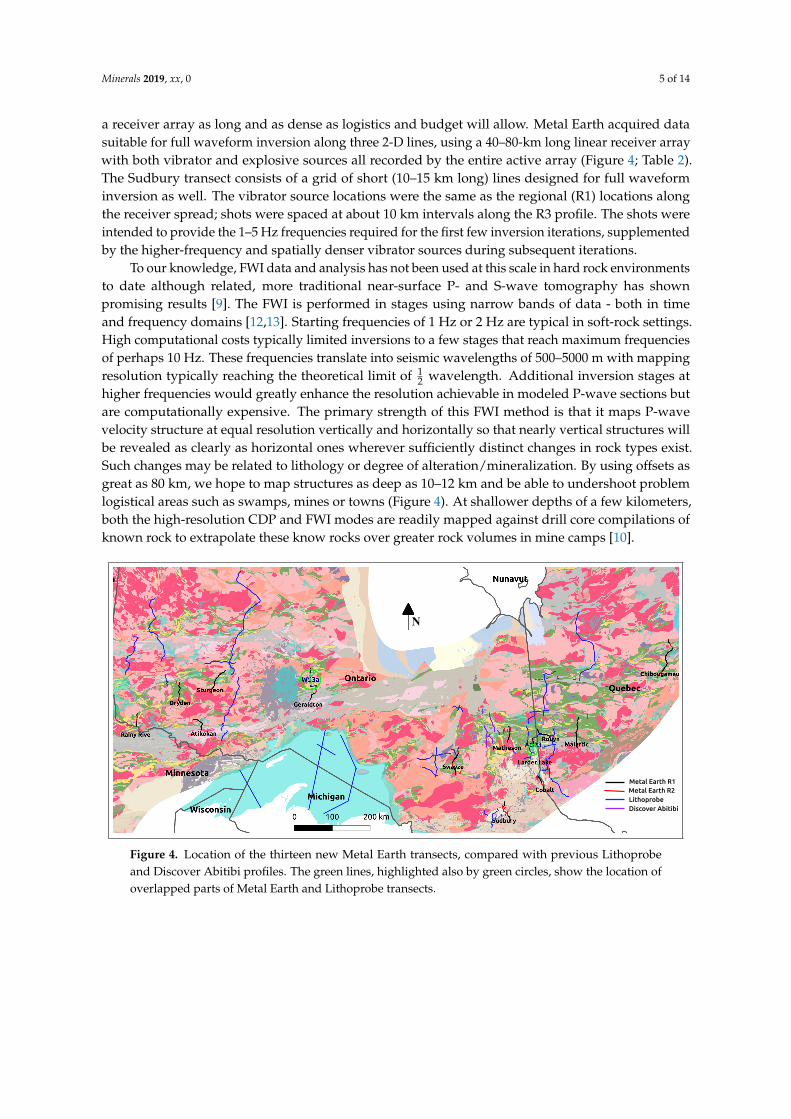
a receiver array as long and as dense as logistics and budget will allow. Metal Earth acquired datasuitable for full waveform inversion along three 2-D lines, using a 40–80-km long linear receiver arraywith both vibrator and explosive sources all recorded by the entire active array (Figure 4; Table 2).The Sudbury transect consists of a grid of short (10–15 km long) lines designed for full waveforminversion as well. The vibrator source locations were the same as the regional (R1) locations alongthe receiver spread; shots were spaced at about 10 km intervals along the R3 profile. The shots wereintended to provide the 1–5 Hz frequencies required for the first few inversion iterations, supplementedby the higher-frequency and spatially denser vibrator sources during subsequent iterations.
To our knowledge, FWI data and analysis has not been used at this scale in hard rock environmentsto date although related, more traditional near-surface P- and S-wave tomography has shownpromising results [9]. The FWI is performed in stages using narrow bands of data - both in timeand frequency domains [12,13]. Starting frequencies of 1 Hz or 2 Hz are typical in soft-rock settings.High computational costs typically limited inversions to a few stages that reach maximum frequenciesof perhaps 10 Hz. These frequencies translate into seismic wavelengths of 500–5000 m with mappingresolution typically reaching the theoretical limit of 1
2 wavelength. Additional inversion stages athigher frequencies would greatly enhance the resolution achievable in modeled P-wave sections butare computationally expensive. The primary strength of this FWI method is that it maps P-wavevelocity structure at equal resolution vertically and horizontally so that nearly vertical structures willbe revealed as clearly as horizontal ones wherever sufficiently distinct changes in rock types exist.Such changes may be related to lithology or degree of alteration/mineralization. By using offsets asgreat as 80 km, we hope to map structures as deep as 10–12 km and be able to undershoot problemlogistical areas such as swamps, mines or towns (Figure 4). At shallower depths of a few kilometers,both the high-resolution CDP and FWI modes are readily mapped against drill core compilations ofknown rock to extrapolate these know rocks over greater rock volumes in mine camps [10].
N
Metal Earth R2LithoprobeDiscover Abitibi
Metal Earth R1
Figure 4. Location of the thirteen new Metal Earth transects, compared with previous Lithoprobeand Discover Abitibi profiles. The green lines, highlighted also by green circles, show the location ofoverlapped parts of Metal Earth and Lithoprobe transects.
Minerals 2019, xx, 0 6 of 14
Table 2. Individual transects of Metal Earth, including both regional and high-resolution modes.
Transect Name Length, km Acquisition Modes Comment
Chibougamau 129.85 R1, R2 × 2 No vibrator move-upMalartic 84.775 R1, R3 Major gap near Malartic Mine/Town
Rouyn-Noranda 84.775 R1, R3 Crooked line; coincident with Lithoprobe AG-21Larder Lake 49 R1, R2, R3 coincident with Lithoprobe AG-23
Cobalt 46.375 R1, R2Matheson 53.95 R1, R2 R1, R2 offsetSwayze 89.35, 11.8 R1, R2 × 2
Geraldton 60.2125 R1, R2 Coincident with Lithoprobe WS-3aSturgeon Lake 73.475 R1
Atikokan 54.1 R1, R2 Two segmentsDryden 74.4 R1, R2 × 2
Rainy River 33.15 R1, R2Sudbury 39, 17, 16, 10 R1, R2, R3 Grid of lines
3. Seismic Data Processing
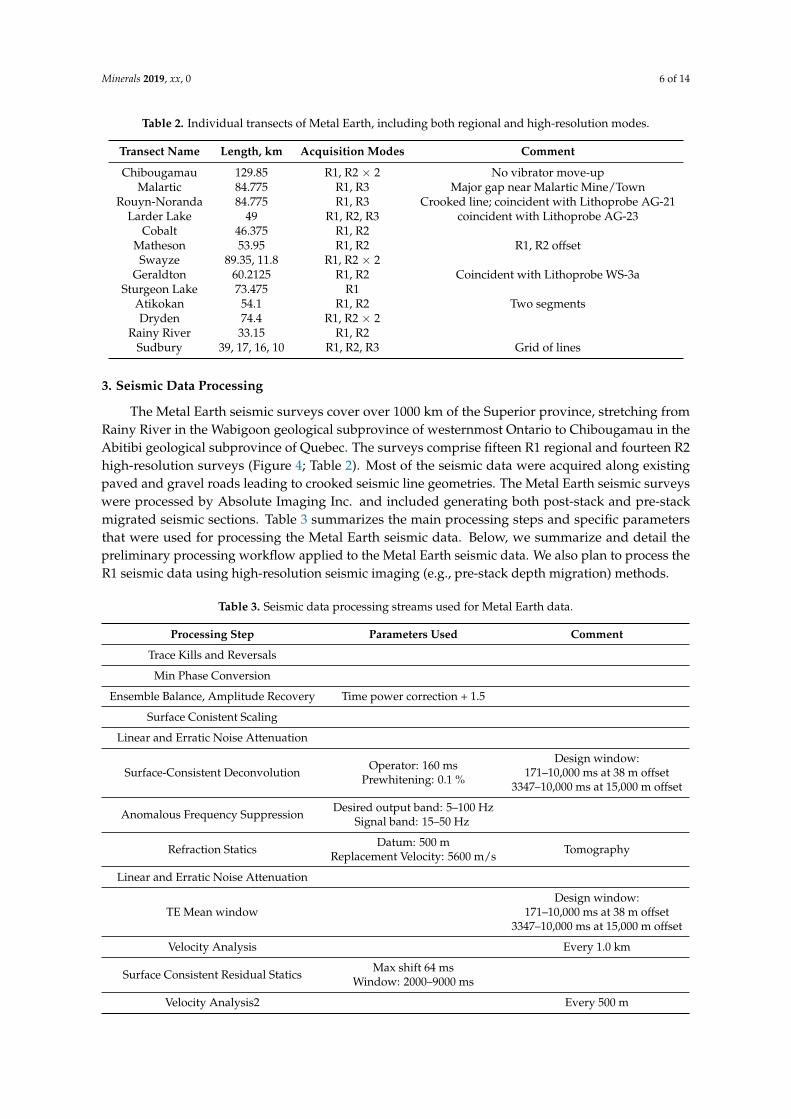
The Metal Earth seismic surveys cover over 1000 km of the Superior province, stretching fromRainy River in the Wabigoon geological subprovince of westernmost Ontario to Chibougamau in theAbitibi geological subprovince of Quebec. The surveys comprise fifteen R1 regional and fourteen R2high-resolution surveys (Figure 4; Table 2). Most of the seismic data were acquired along existingpaved and gravel roads leading to crooked seismic line geometries. The Metal Earth seismic surveyswere processed by Absolute Imaging Inc. and included generating both post-stack and pre-stackmigrated seismic sections. Table 3 summarizes the main processing steps and specific parametersthat were used for processing the Metal Earth seismic data. Below, we summarize and detail thepreliminary processing workflow applied to the Metal Earth seismic data. We also plan to process theR1 seismic data using high-resolution seismic imaging (e.g., pre-stack depth migration) methods.
Table 3. Seismic data processing streams used for Metal Earth data.
Processing Step Parameters Used Comment
Trace Kills and Reversals
Min Phase Conversion
Ensemble Balance, Amplitude Recovery Time power correction + 1.5
Surface Conistent Scaling
Linear and Erratic Noise Attenuation
Surface-Consistent DeconvolutionOperator: 160 ms
Prewhitening: 0.1 %
Design window:171–10,000 ms at 38 m offset
3347–10,000 ms at 15,000 m offset
Anomalous Frequency SuppressionDesired output band: 5–100 Hz
Signal band: 15–50 Hz
Refraction StaticsDatum: 500 m
Replacement Velocity: 5600 m/s Tomography
Linear and Erratic Noise Attenuation
TE Mean windowDesign window:
171–10,000 ms at 38 m offset3347–10,000 ms at 15,000 m offset
Velocity Analysis Every 1.0 km
Surface Consistent Residual StaticsMax shift 64 ms
Window: 2000–9000 ms
Velocity Analysis2 Every 500 m
Minerals 2019, xx, 0 7 of 14
Table 3. Cont.
Processing Step Parameters Used Comment
Surface Consistent Residual StaticsMax shift 48 ms
Window: 1000–9000 ms
Post-Stack Time migrationVelocity Analysis
Normal Move-out & Mute
CDP stack
Time Migration Kirchhoff SummationMigration Angle: 65 degrees
Max Aperture: 15,000 m
Pre-Stack Time migration (PSTM)Velocity Analysis (PSTM) Kirchhoff Summation VP-CDP Distance: ≤ 500 m
Trace Equalization windowRolling Window: 1000 ms
Overlap 50%
Pre Stack Time Migration (PSTM) Kirchhoff SummationMigration Angle: 65 degrees
Max Aperture: 10,000 m
Front-End Muting3/93 1067/758
3554/1871 8028/2778 (m/ms)
CDP Stack
Random Noise Attenuation
TraceEqualization windowRolling Window: 1000 ms
Overlap 50%
3.1. Geometry Check
Except for the first three seismic transects (Chibougamau, Malartic, and Rouyn-Noranda), theMetal Earth seismic surveys were acquired with a single sweep per station at 12.5 m and 6.25 m shotspacing for R1 and R2 acquisition scenarios, respectively. This spreading of sweeps for each nominalsource point was adapted in order to reduce damage to the roads due to repeated sweeps in the samelocation. The shots from these surveys were stacked to generate the nominal shot spacing of 50 m and25 m for R1 and R2 scenarios, respectively. The stacking was applied only for the shot points whilethe receivers were kept in their original field locations. Figure 3 shows a seismic shot record from theMetal Earth’s Malartic R1 survey with reflection signals and various noise types annotated.
Most of the R1 surveys were acquired with live receivers along the entire line. These very longoffset recordings can be problematic for Common Mid-Point (CMP) binning of crooked lines, therefore,during processing the maximum offset for R1 surveys was restricted to 15 km. Figure 5a,b show theVP–CMP distance map for Swayze R1 survey before and after restriction to 15 km offset, respectively.A quality control step was used to identify bad records and discard them from further processing. Thefirst breaks were picked for shot records and analyzed by a geometry estimator to detect the geometryerrors. After correcting any geometry errors, the binning was applied for crooked lines. The binningfor crooked lines sometimes required several iterations to find the optimal binning scenario [14].

Minerals 2019, xx, 0 8 of 14
8400 m
0
4200
6300
2100
3200 m
0
1600
2400
800
a) b)
Dis
tan
ce (
Km
)
0
20
40
60
Dis
tan
ce (
Km
)
0
20
40
60
Distance (Km)0 10 20
Distance (Km)0 10 20
NN
Figure 5. VP-CMP distance maps (meters) for Metal Earth Swayze line. (a) Unlimited offset. (b) Limitedoffset to 15 km.
3.2. Amplitude and Phase Corrections
Balancing the trace amplitudes among the various shots and receivers is necessary for a robustseismic processing work-flow. In order to reduce the variations in amplitude between shot records,an ensemble balance algorithm was used to compute a scalar that balanced all shot record energies.An amplitude recovery with a gain function g(t) = t1.5 was applied to compensate the loss ofamplitude due to wave-front spreading and attenuation. A trace-equalization algorithm was used afterapplying each de-noising and deconvolution step during the processing stream. Trace equalizationwas applied using a single-window, trace-by-trace amplitude balancing algorithm. The seismic recordsfrom Vibroseis sources contain zero-phase data after correlation of the Vibroseis source and recordedsweeps. The Vibroseis data were converted to minimum phase records using a minimum phase filterbefore deconvolution.
3.3. Random and Coherent Noise Attenuation
The Metal Earth seismic shot records contained various types of random and coherent noise(Figure 3). Ideally seismic processing flows should effectively attenuate all types of random noise aswell as coherent noise such as surface waves, converted waves, and first break arrivals; retaining onlyreflected wave signals. In order to locally (both in time and space) target and attenuate high-amplitudelinear and erratic noise, a time-frequency domain de-noising was applied to the data. Several iterationsof harmonic noise suppression were used to attenuate strong 60 Hz signal throughout the data onmost of the lines. A frequency domain filtering was applied to suppress any anomalous (non-sweep)frequencies and achieve consistent amplitudes over the entire frequency domain.

Minerals 2019, xx, 0 9 of 14
3.4. Surface Consistent Deconvolution
The recorded seismic signal is the result of the convolution of the source signal with theinstruments, the geophones and the response of the crustal rocks. The crustal response includessome undesirable effects, such as reverberation, attenuation and ghost events. The objective ofdeconvolution is to estimate these effects as linear filters and then design and apply inverse filtersto remove them [15–17]. Surface Consistent Deconvolution assumes that a seismic wavelet can bedecomposed into its source, receiver, offset and CDP components. Generally, deconvolution performsbest when the design window does not include noise such as ground-roll, air blast, and first breakreverberations. An operator length of 160 ms and pre-whitening of 0.1% were found to be optimal forMetal Earth seismic data.
3.5. Near-Surface Refraction Analysis
Near-surface travel-time irregularities, caused by shallow, low velocity, and unconsolidatedweathering layers, can distort the continuity of primary reflections in seismic records. Field staticcorrections are applied to compensate for the effects of variations in elevation and weathering velocity.The objective is to determine the reflection arrival times which would have been observed if allmeasurements had been made on a flat plane without the presence of weathered or low-velocitymaterial layers. These corrections are based on the refracted first-break seismic P-waves. The firstbreak picks were used to obtain an initial near-surface model and then a refraction tomographymethod [18] was used to calculate the near-surface velocity field. A replacement velocity of 5600 m/sand a flat datum of 500 m were used in the final static calculations. Figure 6 shows the near-surfacevelocity model that was obtained for the Swayze R1 transect.
Distance (Km)40200
Ele
vatio
n (m
)
0
250
500
N S8060
2400 3400 4400 5400 6400
Velocity (m/s)
Figure 6. Near-surface velocity model for Swayze R1 survey estimated using refraction tomography.
3.6. Velocity Analysis and Statics Correction
The velocity analysis used a combination of semblance, super-gather, velocity function stacks,and dynamic stacks. The semblance panel displayed the stack response as a function of time andvelocity in a contour plot. Semblances are computed by performing hyperbolic scans at a specifiednumber of constant velocities between a minimum and maximum stacking velocity on the pre-stackdata. The gather panel displayed a common offset stacked super-gather of a specified number of CDPs.Normal Move-Out (NMO) correction and time-offset mutes were interactively applied during thisanalysis. The initial velocities were picked every 1000 m along the transects, while the second andthird pass velocities were picked every 500 m.
Refraction field statics removed a significant portion of the long wavelength travel-timeirregularities caused by the near-surface weathering layer. Residual static corrections were alsorequired to correct small inaccuracies in the near-surface model. Their application led to a clear

Minerals 2019, xx, 0 10 of 14
improvement in the final processed section. The residual statics were applied in a surface consistentmanner where each trace is cross-correlated with other input traces and time shifts applied to the dataare the sum of shot-consistent and geophone-consistent times. The parameters used for residual staticscorrection are provided in Table 3.
3.7. Post-Stack Kirchhoff Migration
The Metal Earth seismic data were first migrated using a Post-Stack Kirchhoff migration method.Before migration, the velocities and mutes finalized at control points and then interpolated across allCDP gathers. The CDP gathers were then NMO-corrected and stacked using an alpha-trimmed meanstack algorithm (10% of highest and lowest samples were excluded from summation) to generate azero-offset stack. A maximum migration angle of 65 degrees and a maximum aperture of 10,000 mwere used for the post-stack Kirchhoff Migration for all of the transects in the Metal Earth project forconsistency.
3.8. Pre-Stack Kirchhoff Migration
Pre-Stack Time Migration (PSTM) migrates each trace to all output CDP bin centers by accountingexactly for its component surface shot and receiver locations and for any variations in the elevation.Determining the best velocity to use for post-stack time migration is typically based on imagingreflectors that best represent structural geologic features. In contrast, when we run pre-stack timemigration velocity analysis of migrated stack panels (and migrated gather panels) we are not onlylooking at structural fit versus misfit, but also amplitude imaging and energy focusing [19]. In addition,instead of looking at incremental velocity changes of 10% as with the post-stack analysis, we areroutinely finding significant structural and imaging changes with only a 2–3% incremental change invelocity. This significant increase in migration velocity precision means we can obtain a more accuratemigrated image. The PSTM velocity fields were picked from percentage stack panels and percentagemigrated gathers. The migrated stack panels and gathers were generated for 70% to 130% of targetvelocities (with 2% intervals), and were used for the velocity analysis. The estimated velocity field wasextended to gathers using the offset distribution for a given line. The number of output offset planeswere dependent on the number of input offset bins for a given line. A maximum migration angle of65 degrees and a maximum aperture of 10,000 m were used for all lines in the Metal Earth project.
Not all of the data were pre-stack migrated. In some locations, the acquisition geometry wasextremely crooked and resulted in very large VP-CMP distances. These large distances would lead tothe cancellation of off-line energy during the pre-stack migration process resulting in a less optimalresult. Therefore, the VP-CMP distance threshold was limited to 500 m for any pre-stack time migrationdone in order to mitigate this problem. In Figure 5b, the white region around the CMP line depicts theregion in which the CMP distance falls within 0 and 500 m.
3.9. Post-Migration Processing
A limited aperture Tau-P transform was applied to the final stack after both post-stack andpre-stack migration, in order to enhance the coherent seismic events. In order to achieve a well-balancedsection, a trace-by-trace multi-gate trace-equalization filter was used with a window length of 1000 msand 50% overlap between the windows. A combination of pre-stack and post-stack noise suppressionallowed for a reasonably clean and interpretable seismic section. Figure 7a,b show the Post-Stack andPre-Stack migrated sections for Metal Earth’s Swayze R1 survey, respectively. Here, we have plotteda 30 ms long energy attribute of seismic traces for better visualization of the seismic events. Despitethe clear similarities between the sections, pre-stack migration shows higher resolution imaging andseparation of dipping reflectors.

Minerals 2019, xx, 0 11 of 14
a)
1
2
3
4
5
6
Tim
e (s
ec)
3 6 9 12 15 18Distance (km) b)
1
2
3
4
5
6
Tim
e (s
ec)
3 6 9 12 15 18Distance (km)
Figure 7. Post-Stack (a) and Pre-Stack (b) migrated sections for the northern part of Swayze R1 survey.
4. Discussion
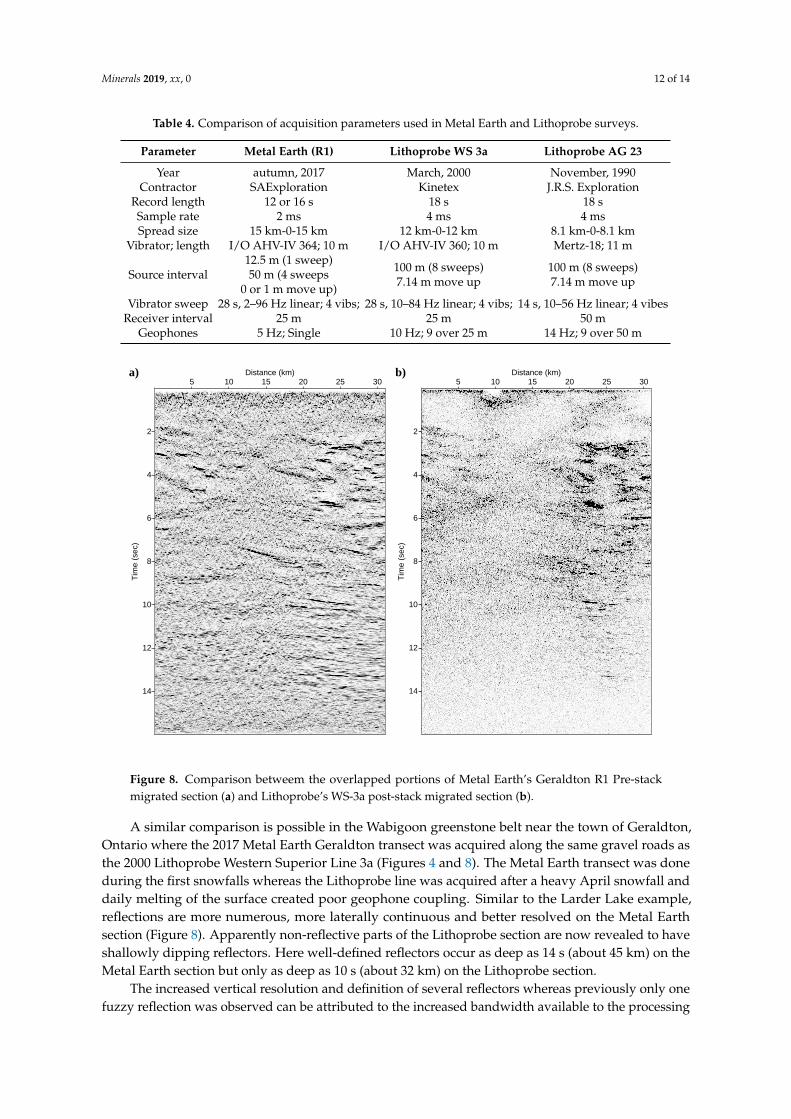
The processing workflow of Metal Earth seismic data focused on robust static solutions, detailedvelocity analysis, minimal trace smoothing, and high-resolution imaging. The overall data qualitywas fairly consistent between various Metal Earth transects. Further high-resolution processing of theseismic data is underway by taking into account the cross-dip corrections and 3D pre-stack imagingof the crooked seismic lines. Some of the Metal Earth seismic transects overlap with some of theLithoprobe seismic lines (Figure 4). Figure 8a,b show the migrated seismic sections along 32 km ofoverlapped sections of the Metal Earth’s Geraldton R1 and Lithoprobe’s WS-3a transects, respectively.Figure 9a,b show the migrated seismic sections along 14 km of overlapped parts of Metal Earth’sLarder Lake R1 and Lithoprobe’s AG-23 transects, respectively. The overlapped parts of these surveysare marked with green lines (highlighted by green circles) on the map in Figure 4. Metal Earth seismicsections show a distinct improvement in frequency content, dip resolution, and continuity of reflectorsin comparison to the Lithoprobe seismic sections in both cases.
It is reassuring that seismic reflection data collected decades apart over the same roads producevery similar reflections but also that the more recent version is a clear improvement in resolution andlateral continuity which are important for the geologic interpretation of the reflections. The 2017 MetalEarth Larder Lake transect coincided with a portion of the 1990 Lithoprobe Abitibi-Grenville line 23transect along Ontario Provincial highway 624 just south of the town of Larder Lake (Figures 4 and 9).A comparison of the acquisition specifications used (Table 4) indicates a significantly wider bandwidthwas used by Metal Earth. Metal Earth also used significantly shorter intervals between geophonesand vibrator points and did not use strings of geophones or form vibrator arrays. The 2017 surveywas done in fine autumn weather whereas the 1990 acquisition occurred after a heavy snowstormand during rain with icy roads (average temperatures from −4 to 0 ◦C). The comparison of similarlyprocessed seismic sections reveals smeared ‘blobs’ of reflectivity on the AG23 section where the newerLarder Lake section resolves listric curves nearly twice the length (Figure 9). Areas with apparently noreflectivity on AG23 now have many layers of reflectors. Significantly, the maximum depth of theselaterally continuous shallowly dipping reflections is 12 s (about 38 km) on the Larder Lake section,but only 9 s (about 30 km) on AG23. Because this deepest zone of reflectors is commonly assumedto represent the Moho, such a large discrepancy is significant. Independent determinations of Mohodepth near Kirkland Lake indicate a depth of 38 km [20].
Minerals 2019, xx, 0 12 of 14
Table 4. Comparison of acquisition parameters used in Metal Earth and Lithoprobe surveys.
Parameter Metal Earth (R1) Lithoprobe WS 3a Lithoprobe AG 23
Year autumn, 2017 March, 2000 November, 1990Contractor SAExploration Kinetex J.R.S. Exploration
Record length 12 or 16 s 18 s 18 sSample rate 2 ms 4 ms 4 msSpread size 15 km-0-15 km 12 km-0-12 km 8.1 km-0-8.1 km
Vibrator; length I/O AHV-IV 364; 10 m I/O AHV-IV 360; 10 m Mertz-18; 11 m
Source interval12.5 m (1 sweep)50 m (4 sweeps
0 or 1 m move up)
100 m (8 sweeps)7.14 m move up
100 m (8 sweeps)7.14 m move up
Vibrator sweep 28 s, 2–96 Hz linear; 4 vibs; 28 s, 10–84 Hz linear; 4 vibs; 14 s, 10–56 Hz linear; 4 vibesReceiver interval 25 m 25 m 50 m
Geophones 5 Hz; Single 10 Hz; 9 over 25 m 14 Hz; 9 over 50 m
a)
2
4
6
8
10
12
14
Tim
e (s
ec)
5 10 15 20 25 30Distance (km) b)
2
4
6
8
10
12
14
Tim
e (s
ec)
5 10 15 20 25 30Distance (km)
Figure 8. Comparison betweem the overlapped portions of Metal Earth’s Geraldton R1 Pre-stackmigrated section (a) and Lithoprobe’s WS-3a post-stack migrated section (b).
A similar comparison is possible in the Wabigoon greenstone belt near the town of Geraldton,Ontario where the 2017 Metal Earth Geraldton transect was acquired along the same gravel roads asthe 2000 Lithoprobe Western Superior Line 3a (Figures 4 and 8). The Metal Earth transect was doneduring the first snowfalls whereas the Lithoprobe line was acquired after a heavy April snowfall anddaily melting of the surface created poor geophone coupling. Similar to the Larder Lake example,reflections are more numerous, more laterally continuous and better resolved on the Metal Earthsection (Figure 8). Apparently non-reflective parts of the Lithoprobe section are now revealed to haveshallowly dipping reflectors. Here well-defined reflectors occur as deep as 14 s (about 45 km) on theMetal Earth section but only as deep as 10 s (about 32 km) on the Lithoprobe section.
The increased vertical resolution and definition of several reflectors whereas previously only onefuzzy reflection was observed can be attributed to the increased bandwidth available to the processing

Minerals 2019, xx, 0 13 of 14
of the more recent survey. Lateral continuity of individual reflectors is undoubtedly increased bythe higher spatial resolution of vibrator, geophone and common depth points available in the lattersurvey. This advantage was further augmented by the use of pre-stack migration. Utilizing FullWaveform Inversion (FWI) and Pre-Stack Depth Migration (PSDM) methods could lead to even higherresolution subsurface images. Lithoprobe transects concentrated their effort in both acquisition andprocessing of the data on the lower crust and upper mantle whereas Metal Earth regional transectsfocused on the upper and middle crust although both strategies sought quality whole-crust seismicsections in general.
a)
2
4
6
8
10
Tim
e (s
ec)
3 6 9 12Distance (km) b)
2
4
6
8
10
Tim
e (s
ec)
3 6 9 12Distance (km)
Figure 9. Comparison betweem the overlapped portions of Metal Earth’s Larder Lake R1 Pre-stackmigrated section (a) and Lithoprobe’s AG-23 post-stack migrated section (b).
5. Conclusions
The 2017 Metal Earth seismic surveys comprised 15 R1 (regional) and 14 R2 (high-resolution)surveys. The survey’s 927 line kilometers of profiles cover Archean Canada from Rainy River near theManitoba-Ontario border in the Wabigoon geological subprovince to Chibougamau in eastern Quebecin the Abitibi geological subprovince. Use of broader bandwidth vibrator sources and geophonesimproved potential resolution of reflectors at depth. More spatially compact source and receiver arrays,spaced at shorter intervals than in previous Lithoprobe surveys, improved lateral reflector definitionand resolution. The processing workflow for the Metal Earth seismic data focused on robust staticsolutions, detailed velocity analysis, minimal trace smoothing, and high-resolution migrations usingwide apertures. The overall data quality was good and fairly consistent among the thirteen MetalEarth transects. These reflection seismic data will play a central and crucial role in understanding thetectonic and geological differences between the Abitibi (metal-endowed) and Wabigoon (less-endowed)subprovinces.
Author Contributions: Seismic Data Acquisition and Design , D.S., J.M., M.N., and S.C. (Saeid Cheraghi); SeismicData Processing, M.N., S.F., S.C. (Samo Cilensek ), E.F., and S.C. (Saeid Cheraghi); writing—original draftpreparation, D.S. and M.N.; writing—review and editing, M.N. and D.S.
Funding: This research was funded by the Canada First Research Excellence Fund (CFREF).

Minerals 2019, xx, 0 14 of 14
Acknowledgments: We thank SAExploration for acquiring and Absolute Imaging Inc. for processing theseismic data.
Conflicts of Interest: The authors declare no conflict of interest.
References
1. Eaton, D.W.; Milkereit, B.; Salisbury, M.H. Hardrock seismic exploration. Geophys. Dev. Ser. 10 Soc.Explor.Geophys. 2003, 10, 1–269.
2. Ten Kroode, F.; Bergler, S.; Corsten, C.; de Maag, J.W.; Strijbos, F.; Tijhof, H. Broadband seismic data—Theimportance of low frequencies. Geophysics 2013, 78, WA3–WA14, doi:10.1190/geo2012-0294.1.
3. Calvert, A.J.; Ludden, J.N. Archean continental assembly in the southeastern Superior Province of Canada.Tectonics 1999, 18, 412–429.
4. Ludden, J.; Hynes, A. The Lithoprobe Abitibi-Grenville transect: Two billion years of crust formation andrecycling in the Precambrian Shield of Canada. Can. J. Earth Sci. 2000, 37, 459–476, doi:10.1139/e99-120.
5. White, D.J.; Musacchio, G.; Helmstaedt, H.H.; Harrap, R.M.; Thurston, P.C.; Van der Velden, A.; Hall, K.Images of a lower-crustal oceanic slab: Direct evidence for tectonic accretion in the Archean western Superiorprovince. Geology 2003, 31, 997–1000, doi:10.1130/G20014.1.
6. Snyder, D.B.; Bleeker, W.; Reed, L.E.; Ayer, J.A.; Houle, M.G.; Bateman, R. Tectonic and metallogenicimplications of regional seismic profiles in the timmins mining camp. Econ. Geol. 2008, 103, 1135–1150,doi:10.2113/gsecongeo.103.6.1135.
7. Boore, D.M.; Atkinson, G.M. Stochastic prediction of ground motion and spectral response parameters athard-rock sites in eastern North America. Bull. Seismol. Soc. Am. 1987, 77, 440–467.
8. Malinowski, M. Deep reflection seismic imaging in SE Poland using extended correlation method applied toPolandSPANTM data. Tectonophysics 2016, 689, 107–114, doi:10.1016/j.tecto.2016.01.007.
9. Snyder, D.B.; Cary, P.; Salisbury, M. 2D-3C high-resolution seismic data from the Abitibi Greenstone Belt,Canada. Tectonophysics 2009, 472, 226–237, doi:10.1016/j.tecto.2008.05.038.
10. Bellefleur, G.; Schetselaar, E.; White, D.; Miah, K.; Dueck, P. 3D seismic imaging of the Lalorvolcanogenic massive sulphide deposit, Manitoba, Canada. Geophys. Prospect. 2015, 63, 813–832,doi:10.1111/1365-2478.12236.
11. Pratt, R.G.; Shin, C.; Hicks, G.J. Gauss-Newton and full Newton methods in frequency-space seismicwaveform inversion. Geophys. J. Int. 1998, 133, 341–362, doi:10.1046/j.1365-246X.1998.00498.x.
12. Virieux, J.; Operto, S. An overview of full-waveform inversion in exploration geophysics. Geophysics 2009,74, WCC1–WCC26, doi:10.1190/1.3238367.
13. Kamei, R.; Miyoshi, T.; Pratt, R.G.; Takanashi, M.; Masaya, S. Application of waveform tomography to acrooked-line 2D land seismic data set. Geophysics 2015, 80, B115–B129, doi:10.1190/geo2014-0537.1.
14. Nedimovic, M.R.; West, G.F. Crooked-line 2D seismic reflection imaging in crystalline terrains: Part 1, dataprocessing. Geophysics 2003, 68, 274–285, doi:10.1190/1.1543213.
15. Cary, P.W.; Lorentz, G.A. Four-component surface-consistent deconvolution. Geophysics 1993, 58, 383–392.16. Taner, M.T.; Koehler, F. Surface consistent corrections. Geophysics 2002, 46, 17–22, doi:10.1190/1.1441133.17. Yilmaz, O. Seismic Data Analysis: Processing, Inversion, and Interpretation of Seismic Data; Society of Exploration
Geophysicists: Tulsa, OK, USA, 2014, doi:10.1190/1.9781560801580.18. Zhang, J.; Toksöz, M.N. Nonlinear refraction traveltime tomography. Geophysics 1998, 63, 1726–1737.19. Gray, S.H.; Etgen, J.; Dellinger, J.; Whitmore, D. Seismic migration problems and solutions. Geophysics 2001,
66, 1622–1640, doi:10.1190/1.1487107.20. Postlethwaite, B.; Bostock, M.G.; Christensen, N.I.; Snyder, D.B. Seismic velocities and composition of the
Canadian crust. Tectonophysics 2014, 633, 256–267, doi:10.1016/j.tecto.2014.07.024.
c© 2019 by the authors. Licensee MDPI, Basel, Switzerland. This article is an open accessarticle distributed under the terms and conditions of the Creative Commons Attribution(CC BY) license (http://creativecommons.org/licenses/by/4.0/).


![Index [ptgmedia.pearsoncmg.com]...EIGRP authentication, 101–102 bandwidth command, 103–104 bandwidth configuration, 102–104 bandwidth-percent command, 104 ip bandwidth-percent-eigrp](https://static.fdocuments.us/doc/165x107/5ed079ce95646c550611f388/index-eigrp-authentication-101a102-bandwidth-command-103a104-bandwidth.jpg)