Acoustical simulation of open-plan offices according to ... · Acoustical simulation of open-plan...
23
Acoustical simulation of open-plan offices according to ISO 3382-3 Jens Holger Rindel & Claus Lynge Christensen Odeon A/S, Scion-DTU Denmark
-
Upload
nguyendien -
Category
Documents
-
view
217 -
download
0
Transcript of Acoustical simulation of open-plan offices according to ... · Acoustical simulation of open-plan...

Acoustical simulation of open-plan offices according to ISO 3382-3
Jens Holger Rindel & Claus Lynge Christensen
Odeon A/S, Scion-DTU
Denmark

Outline
• Introduction
• ISO 3382’s – ISO 3382 part 3
• Factors affecting acoustical performance
• Measurements
• Acoustical parameters• Acoustical parameters
• Open-plan office example
– Absorption
– Screens
– Background noise
• Conclusion
Euronoise Prague 2012

The ISO 3382 family
• Part 1: Performance spaces
• Part 2: Reverberation time in ordinary rooms
• Part 3: Open plan offices
Acoustics -- Measurement of room acoustic parameters
Euronoise Prague 2012

Introduction
• ISO 3382-3: 2012 Acoustics — Measurement of room
acoustic parameters — Part 3: Open plan offices
• New parameters, including:
– Spatial sound distribution of the A-weighted sound pressure level of speechof speech
• Spatial decay rate of speech
– Spatial sound distribution of the speech transmission index• Distraction distance
• Privacy distance
– Background noise level
• Computer simulations instead of measurements
Euronoise Prague 2012
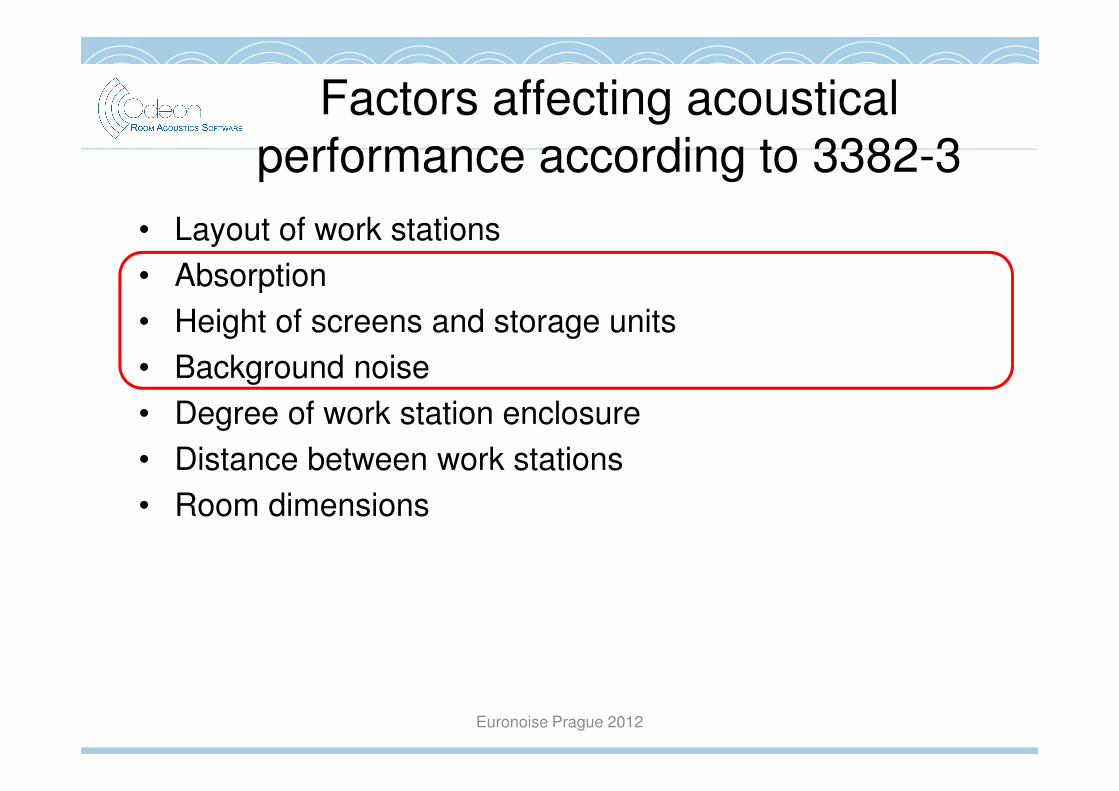
Factors affecting acoustical
performance according to 3382-3
• Layout of work stations
• Absorption
• Height of screens and storage units
• Background noise
• Degree of work station enclosure• Degree of work station enclosure
• Distance between work stations
• Room dimensions
Euronoise Prague 2012

Measurements 3382-3
1. The office must be furnished, but unoccupied
2. Sound source should be omni directional
3. Sources and microphones are placed on work stations,
height 1.2 m above floor
4. A measurement line is made from one source position
Euronoise Prague 2012
4. A measurement line is made from one source position
and a number of receiver positions in different distances
5. Min. 4 receivers, recommended 6-10
6. At least two measurement lines should be used, and the
results are averaged

Calculations
Source power – normal effort unisex speech
At every measurement point:
• SPL(A) in octave bands, 125 – 8000 Hz
• Background noise in octave bands
• STI• STI
– The impulse response method is preferred (as Odeon)
– Average of background noise is used for STI (as Odeon)
Euronoise Prague 2012
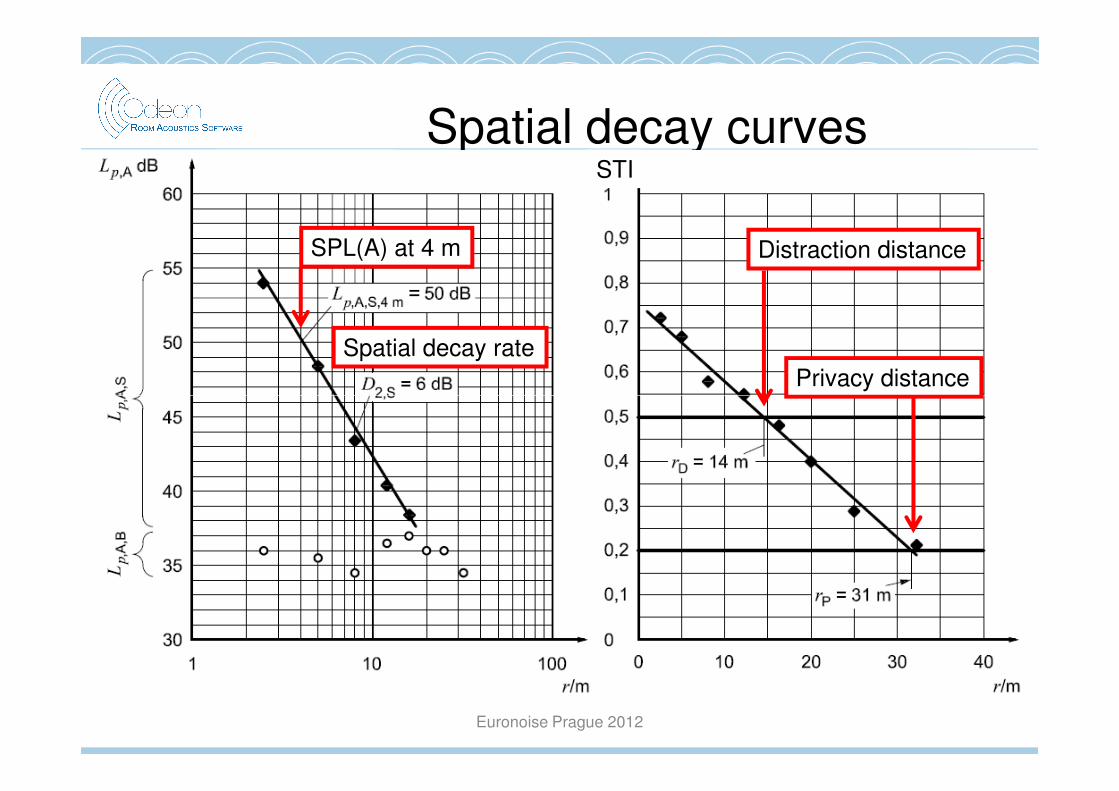
Spatial decay curvesSTI
Spatial decay rate
Distraction distance
Privacy distance
SPL(A) at 4 m
Euronoise Prague 2012

Target values
Parameter Poor Good
Spatial decay rate, D2,S <5 dB >= 7 dB
SPL(A) at 4 metres, Lp, A, S, 4 m > 50 dB <= 48 dB
Distraction distance, rD > 10 m <= 5 m
Euronoise Prague 2012

Simulating ISO 3382-3 in
Odeon 12ß
• Model of room geometry fully furnished
• Full impulse response calculated (hybrid method)
• Diffraction over screens and storrage units etc. included
• Constant background noise easily included (Lp,B)
• SPL(A) and STI parameters can be predicted• SPL(A) and STI parameters can be predicted
• ISO 3382-3 quantities are automatically calculated from
a selected number of receivers
• Average results from at least 2 measurement lines
• Easy to include many workstations/receivers – use > 10?
Euronoise Prague 2012
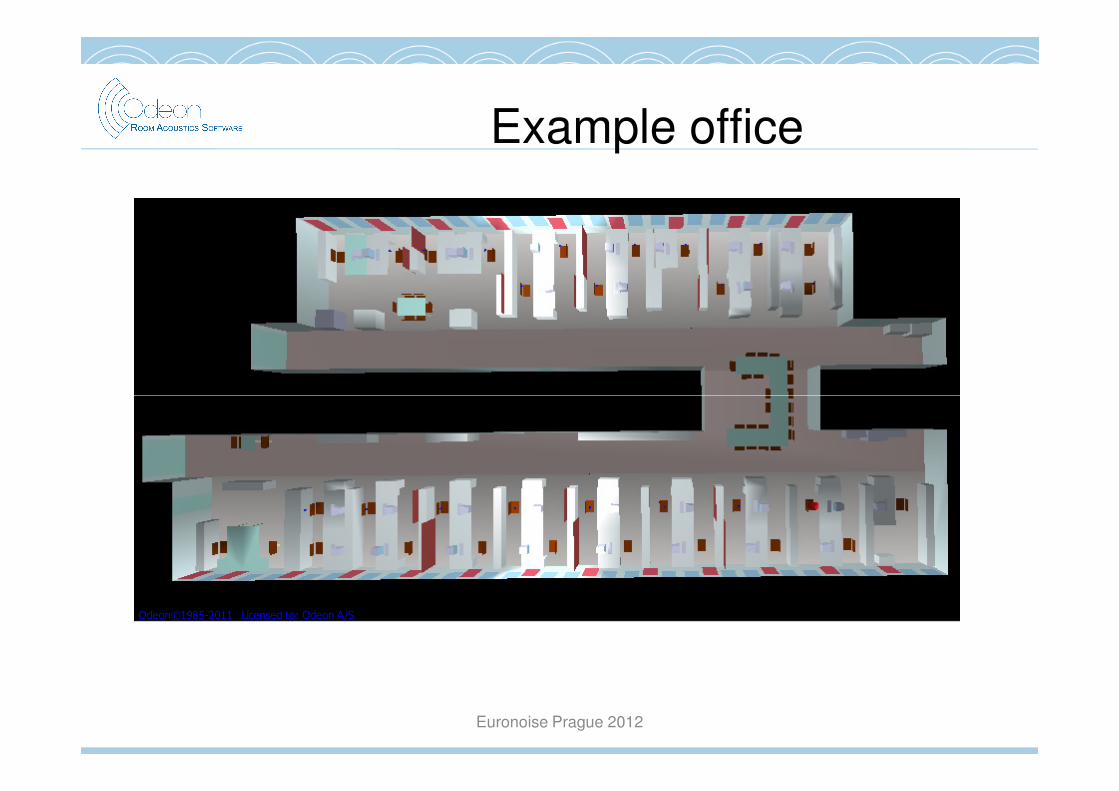
Example office
Euronoise Prague 2012
Odeon©1985-2011 Licensed to: Odeon A/S

View into the ODEON model
Euronoise Prague 2012

1-point diffraction
Euronoise Prague 2012
Diffraction
• Geometric path automatically detected
• Contribution calculated according to Allan D. Pierce

2-point diffraction
Euronoise Prague 2012
Diffraction
• Geometric path automatically detected
• Contribution calculated according to Allan D. Pierce

Measurement lines
• Lines 1 and 2 with 7 mic. positions
• Lines 3 and 4 with 10 mic. Positions
Euronoise Prague 2012
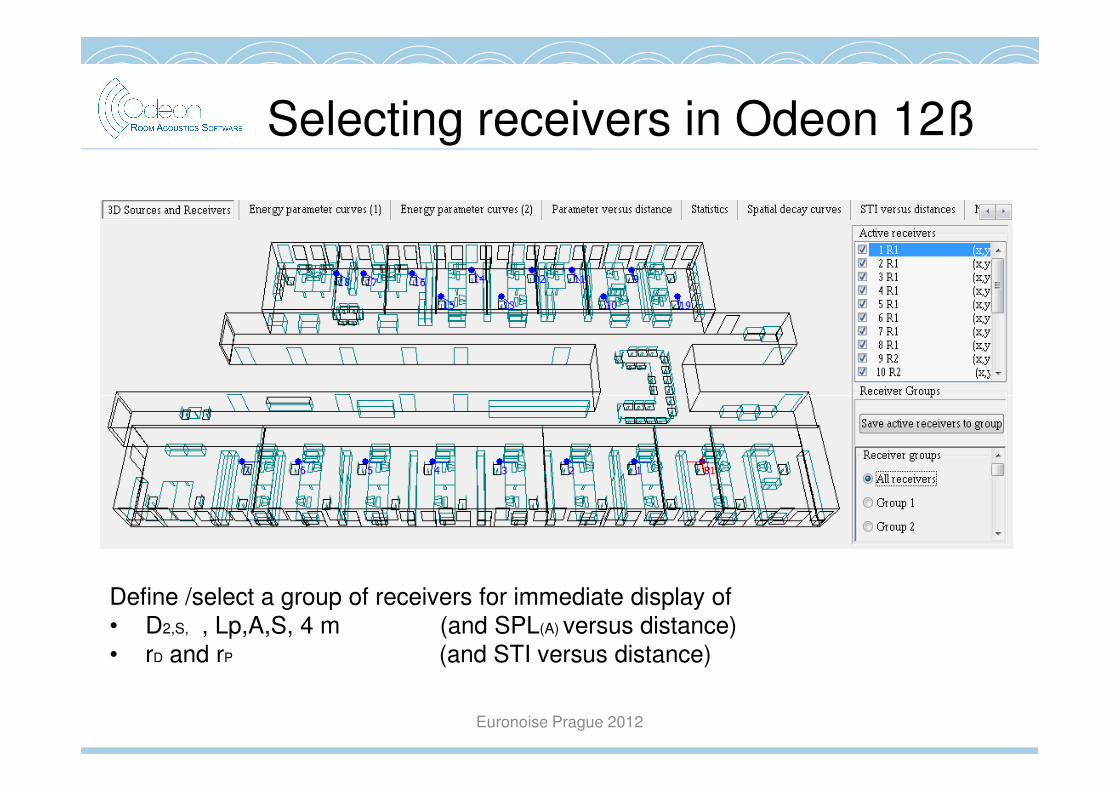
Selecting receivers in Odeon 12ß
Euronoise Prague 2012
Define /select a group of receivers for immediate display of
• D2,S, , Lp,A,S, 4 m (and SPL(A) versus distance)
• rD and rP (and STI versus distance)

Single number quantities - Office 3
Line 1 Line 2 Line 3 Line 4 Average
STI in nearest workstation 0,64 0,67 0,75 0,64 0,68
Distraction distance, rD, in m 8,20 10,14 10,53 7,09 9,0
Privacy distance, r , in m 22,38 24,08 21,70 19,13 21,8
Euronoise Prague 2012
Privacy distance, rP, in m 22,38 24,08 21,70 19,13 21,8
Spatial decay rate of A-weighted SPL of speech, D2,S, in dB 6,05 6,11 6,74 5,12 6,0
A-weighted SPL of speech at 4 metres, Lp,A,S,4 m, in dB 48,5 50,2 50,9 46,0 48,9
Average A-weighted background noise, Lp,A,B, in dB 38 38 38 38 38

Three office versionsOffice 1: As existing, absorption in ceiling
Office 2: Reflective ceiling
Office 3: As no. 1, plus absorbing baffles and 1.25 m screens
Office 1 Office 2 Office 3
T20 (500 - 1000 Hz) in s 0,5 1,1 0,3
Euronoise Prague 2012
STI in nearest workstation 0,71 0,61 0,68
Distraction distance, rD, in m 13,8 10,1 9,0
Privacy distance, rP, in m 33,3 37,8 21,8
Spatial decay rate of A-weighted SPL of speech, D2,S, in dB 4,4 3,8 6,0
A-weighted SPL of speech at 4 metres, Lp,A,S,4 m, in dB 51,0 56,5 48,9
Average A-weighted background noise, Lp,A,B, in dB 38 38 38

Spatial distribution curves, Lp,A
Euronoise Prague 2012
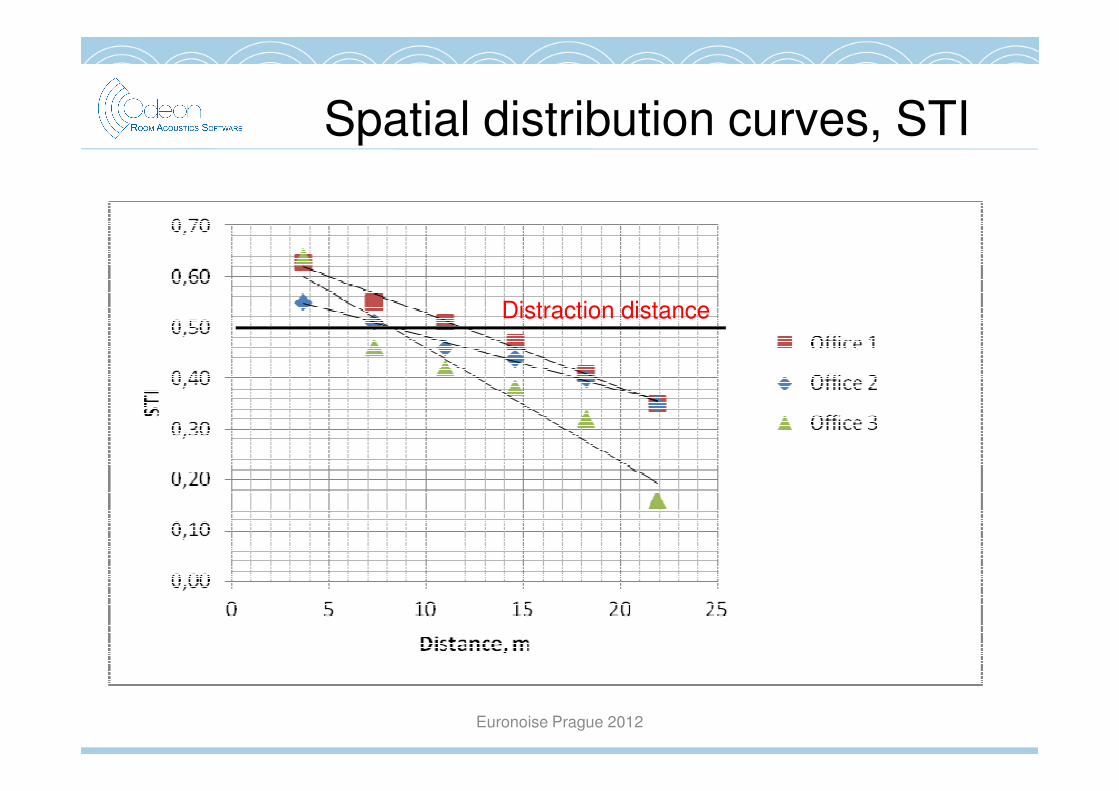
Spatial distribution curves, STI
Distraction distance
Euronoise Prague 2012

Variation of screen height
Office 3, Screen height 1,25 m 1,50 m 1,75 m
STI in nearest workstation 0,68 0,67 0,67
Distraction distance, rD, in m 9,0 8,4 8,0
Privacy distance, rP, in m 21,8 19,8 18,7
Spatial decay rate of A-weighted SPL of speech, D , in dB 6,0 6,6 7,1
Euronoise Prague 2012
Increasing the screen height means:
• rD and rP decrease
• D2,S increases
Spatial decay rate of A-weighted SPL of speech, D2,S, in dB 6,0 6,6 7,1
A-weighted SPL of speech at 4 metres, Lp,A,S,4 m, in dB 48,9 48,6 48,4
Average A-weighted background noise, Lp,A,B, in dB 38 38 38
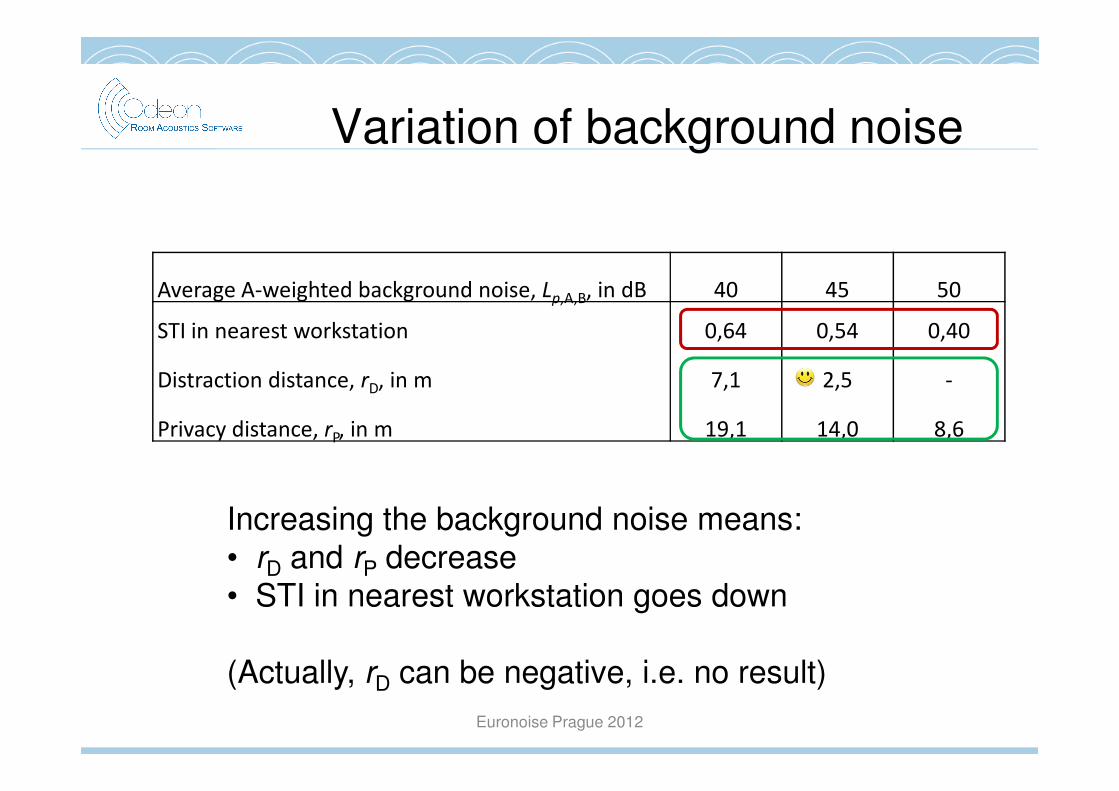
Average A-weighted background noise, Lp,A,B, in dB 40 45 50
STI in nearest workstation 0,64 0,54 0,40
Distraction distance, rD, in m 7,1 2,5 -
Variation of background noise
Privacy distance, rP, in m 19,1 14,0 8,6
Euronoise Prague 2012
Increasing the background noise means:
• rD and rP decrease
• STI in nearest workstation goes down
(Actually, rD can be negative, i.e. no result)
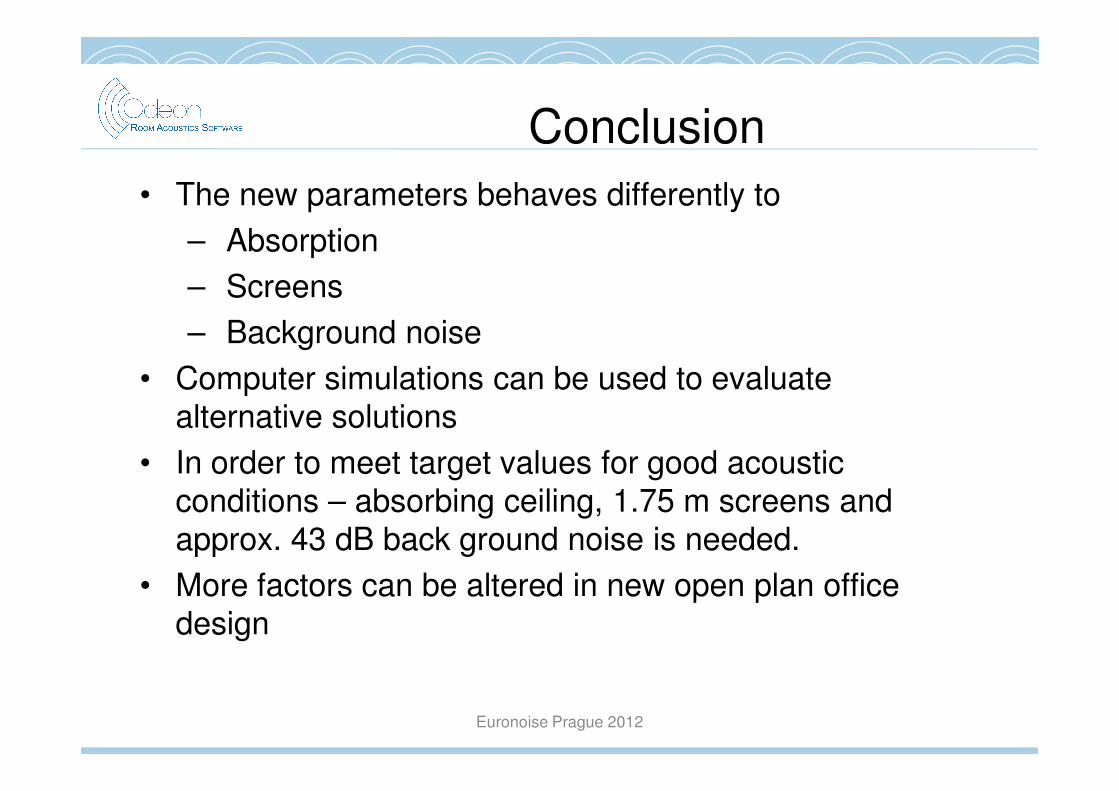
Conclusion
• The new parameters behaves differently to
– Absorption
– Screens
– Background noise
• Computer simulations can be used to evaluate • Computer simulations can be used to evaluate
alternative solutions
• In order to meet target values for good acoustic
conditions – absorbing ceiling, 1.75 m screens and
approx. 43 dB back ground noise is needed.
• More factors can be altered in new open plan office
design
Euronoise Prague 2012