ACOUSTIC EMISSION SENSING OF PIPE-SOIL INTERACTION ...
6
463 DeJong, Schooling and Viggiani ISBN 978-0-7277-6466-9 https://doi.org/10.1680/icsic.64669.463 Published with permission by the ICE under the CC-BY license. (http://creativecommons.org/licenses/by/4.0/) International Conference on Smart Infrastructure and Construction 2019 (ICSIC): Driving data-informed decision-making ACOUSTIC EMISSION SENSING OF PIPE-SOIL INTERACTION: DEVELOPMENT OF AN EARLY WARNING SYSTEM FOR BURIED PIPE DEFORMATION A. Smith 1* , I.D. Moore 2 and N. Dixon 1 1 School of Architecture, Building and Civil Engineering, Loughborough University, Leicestershire, UK 2 GeoEngineering Centre at Queen’s—RMC, Queen’s University, Kingston, ON, Canada * Corresponding author ABSTRACT This paper describes a programme of research that aims to develop a continuous, real-time acoustic emission (AE) monitoring system that can be distributed at discrete locations along buried pipelines to sense pipe/soil interaction and provide early warning of adverse behaviour to enable targeted and timely interventions. Pipe/soil interaction-generated AE propagates as guided waves along pipelines. Novel AE interpretation is allowing the evolution of the pipe/soil interaction behaviour to be characterised, and the rate and magnitude of deformation to be quantified. New understanding of AE propagation and attenuation in buried pipes is enabling source localisation methodologies to be developed. Results from normal faulting experiments performed on buried full-scale steel pipes at the buried infrastructure research facility at Queen’s University, Canada, are presented to demonstrate the potential of the AE technique for early detection of buried pipe deformation. Notation A Attenuation AE ̇ L Acoustic Emission rate per unit length C u Coefficient of uniformity C c Coefficient of curvature D Pipe outside diameter Dr Relative density d 50 Mean particle diameter e Void ratio E Young’s modulus F Frequency I Pipe surface properties J Joint properties and spacing M Wave mode type RDC Ring-down counts are the number of times the AE waveform crosses a voltage threshold level S Soil properties and state t Pipe wall thickness ε ̇ Strain rate Shear strain Volumetric strain q Deviator stress ν Poisson’s ratio ρ Density ρ s Particle density σ´n Normal effective stress τmob Mobilised shear strength 1. Introduction Pipeline networks cover vast geographical areas to transport water, oil and gas, and hence are critical lifelines that society heavily relies on. A significant proportion of pipelines are buried for protection and support; however, this exposes them to potential damage from ground movements. Buried pipelines experience significant strains in response to large soil shearing deformations (e.g. faulting and landslides), which can lead to tensile or buckling failure. Localised pipeline damage can have catastrophic economic, environmental and societal consequences, and the service of entire networks can be terminated (Karamitros et al., 2007; Vazouras et al., 2015; Robert et al., 2016; Smith et al., 2019). There is an urgent need for continuous, remote, real-time monitoring strategies that can be retrofitted to existing assets and embedded in new-builds to provide early warning of this behaviour and enable targeted and timely interventions. These systems need to monitor long lengths (100s km) of pipes that traverse a range of hazards. Acoustic Emission (AE) are high-frequency (>10 kHz) stress waves that propagate through materials surrounding the generation source. AE is generated in soil/structure systems through a suite of mechanisms including: inter-particle friction (rolling and sliding); friction at the interface between the soil and structural element; force chain buckling (e.g. slip-stick behaviour as interlock is overcome and regained) of particle assemblies; and degradation of particle asperities (Smith et al., 2014; Heather-Smith et al., 2018; Smith et al., 2019; Smith and Dixon, 2019). Pipe/soil interaction-generated AE propagates along pipelines as guided waves, which can be measured by sensors coupled to the pipe wall to interpret asset condition and behaviour (Smith et al., 2019). Downloaded by [ LOUGHBOROUGH UNIVERSITY] on [10/07/19]. Published with permission by the ICE under the CC-BY license
Transcript of ACOUSTIC EMISSION SENSING OF PIPE-SOIL INTERACTION ...

463
DeJong, Schooling and ViggianiISBN 978-0-7277-6466-9https://doi.org/10.1680/icsic.64669.463Published with permission by the ICE under the CC-BY license. (http://creativecommons.org/licenses/by/4.0/)
International Conference on Smart Infrastructure and Construction 2019 (ICSIC): Driving data-informed decision-making
wall. The elastic modulus of the pipe was assumed constant for the duration of the drive. However, it is highly likely that the pipe was not fully-cured prior to installation. Application of a time dependant modulus related to the strength gain may provide a more accurate strain – stress correlation for the data
Figure 10. Comparison between total jacking force and face resistance for the initial 25 m of the pilot drive
Figure 11. Comparison between total jacking force and pipe force for the initial 25 m of the pilot drive
7. Conclusions
This paper has provided details of a tunnel drive in which an instrumented pipe section was installed for the purposes of monitoring the effects of pipe jacking on the jacking pipes and their interaction with the surrounding soil. Additional data from the tunnel boring machine control system have been analysed and have shown that the lubrication regime for the drive was very effect, with stresses lower than those quoted in the literature reviewed. It also identified that there are discrepancies between the different force outputs of the system which require further investigation.
8. Acknowledgements
The third author is supported by the Royal Academy of Engineering under the Research Fellowship scheme. The authors gratefully acknowledge the support of Ward and Burke Construction Ltd and Tracey Concrete for their support in casting, and installing the instrumented pipe section.
9. References
British Standards Institution (1995a) BS EN 640:1995, Reinforced concrete pressure pipes and distributed reinforcement concrete pressure pipes (non-cylinder type), including joints and fittings, BSI, London, UK British Standards Institution (1995b) BS EN 641:1995, Reinforced concrete pressure pipes, cylinder type, including joints and fittings, BSI, London, UK British Standards Institution (2012) BS EN ISO 22282-3:2012, Geotechnical investigation and testing. Geohydraulic testing. Water pressure tests in rock, BSI, London, UK British Standards Institution (2018) BS EN ISO 14689:2018-1, Geotechnical investigation and testing. Identification, description and classification of rock. Part 1: Identification and description, BSI, London, UK The British Tunnelling Society and The Institution of Civil Engineers (2010) Specification for Tunnelling, Third Edition, Thomas Telford Ltd, London, UK Concrete Pipe Association of Australasia (2013) CPAA Design Manual, Jacking Design Guidelines, https://tinyurl.com/ydfqq9zm (accessed 01/12/2018) French Society for Trenchless Technology (2006) Microtunneling and Horizontal Drilling: Recommendations, John Wiley & Sons, London. International Society for Rock Mechanics and Rock Engineering (2007) The ISRM Suggested Methods for Rock Characterization, Testing and Monitoring 2007-2014, Springer, Basel, Switzerland Japan Society of Trenchless Technology (1994) Working-Group No. 3, 1994. Microtunneling Jacking Force, Japan, p. 96. Liu SY (2010), Slurry Dewatering in Pipe Jacking Industry, PhD Thesis, University of Leeds, Leeds, U.K. Pellet-Beaucour AL and Kastner R (2002) Experimental and Analytical Study of Friction Forces during Microtunneling Operations, Tunnelling and Underground Space Technology 17(1): 83-97 Pipe Jacking Association (1995), Guide to best practice for the installation for pipe jacks and microtunnels, Pipe Jacking association, London Stein, D. (2005). Trenchless Technology for Installation of Cables and Pipelines, Stein & Partner, Bochum, Germany: Terzaghi K (1943), Theoretical Soil Mechanics, John Wiley & Sons, London
ACOUSTIC EMISSION SENSING OF PIPE-SOIL INTERACTION: DEVELOPMENT OF AN EARLY WARNING SYSTEM FOR
BURIED PIPE DEFORMATION A. Smith1*, I.D. Moore2 and N. Dixon1
1 School of Architecture, Building and Civil Engineering, Loughborough University, Leicestershire, UK 2 GeoEngineering Centre at Queen’s—RMC, Queen’s University, Kingston, ON, Canada
* Corresponding author
ABSTRACT This paper describes a programme of research that aims to develop a continuous, real-time acoustic emission (AE) monitoring system that can be distributed at discrete locations along buried pipelines to sense pipe/soil interaction and provide early warning of adverse behaviour to enable targeted and timely interventions. Pipe/soil interaction-generated AE propagates as guided waves along pipelines. Novel AE interpretation is allowing the evolution of the pipe/soil interaction behaviour to be characterised, and the rate and magnitude of deformation to be quantified. New understanding of AE propagation and attenuation in buried pipes is enabling source localisation methodologies to be developed. Results from normal faulting experiments performed on buried full-scale steel pipes at the buried infrastructure research facility at Queen’s University, Canada, are presented to demonstrate the potential of the AE technique for early detection of buried pipe deformation.
Notation
A Attenuation AEL Acoustic Emission rate per unit length Cu Coefficient of uniformity Cc Coefficient of curvature D Pipe outside diameter Dr Relative density d50 Mean particle diameter e Void ratio E Young’s modulus F Frequency I Pipe surface properties J Joint properties and spacing M Wave mode type RDC Ring-down counts are the number of times the AE waveform crosses a voltage threshold level S Soil properties and state t Pipe wall thickness ε Strain rate 𝜀𝜀𝛾𝛾 Shear strain 𝜀𝜀𝑣𝑣𝑣𝑣𝑣𝑣 Volumetric strain q Deviator stress ν Poisson’s ratio ρ Density ρs Particle density σ´n Normal effective stress τmob Mobilised shear strength
1. Introduction
Pipeline networks cover vast geographical areas to transport water, oil and gas, and hence are critical lifelines that society heavily relies on. A significant proportion of pipelines are buried for protection and support; however, this exposes them to potential damage from ground movements. Buried pipelines experience significant strains in response to large soil shearing deformations (e.g. faulting and landslides), which can lead to tensile or buckling failure. Localised pipeline damage can have catastrophic economic, environmental and societal consequences, and the service of entire networks can be terminated (Karamitros et al., 2007; Vazouras et al., 2015; Robert et al., 2016; Smith et al., 2019). There is an urgent need for continuous, remote, real-time monitoring strategies that can be retrofitted to existing assets and embedded in new-builds to provide early warning of this behaviour and enable targeted and timely interventions. These systems need to monitor long lengths (100s km) of pipes that traverse a range of hazards.
Acoustic Emission (AE) are high-frequency (>10 kHz) stress waves that propagate through materials surrounding the generation source. AE is generated in soil/structure systems through a suite of mechanisms including: inter-particle friction (rolling and sliding); friction at the interface between the soil and structural element; force chain buckling (e.g. slip-stick behaviour as interlock is overcome and regained) of particle assemblies; and degradation of particle asperities (Smith et al., 2014; Heather-Smith et al., 2018; Smith et al., 2019; Smith and Dixon, 2019). Pipe/soil interaction-generated AE propagates along pipelines as guided waves, which can be measured by sensors coupled to the pipe wall to interpret asset condition and behaviour (Smith et al., 2019).
Downloaded by [ LOUGHBOROUGH UNIVERSITY] on [10/07/19]. Published with permission by the ICE under the CC-BY license
464
International Conference on Smart Infrastructure and Construction 2019 (ICSIC)
This paper describes an ongoing programme of research, titled Listening to Infrastructure, which aims to develop a continuous, real-time AE monitoring system that can be distributed at discrete locations along buried pipelines to sense pipe/soil interaction and provide early warning that will enable targeted and timely interventions. The key variables that influence AE generation and propagation in buried infrastructure are described. An overview of the early warning system concept is presented. Results from normal faulting experiments performed on buried full-scale steel pipes at the buried infrastructure research facility at Queen’s University, Canada, are presented to demonstrate the potential of the AE technique for early detection of buried pipe deformation.
2. AE generation
Fundamental laboratory studies on the AE behaviour of soils were carried out in the 1970s, 1980s and 1990s (e.g. Koerner et al., 1981; Tanimoto and Tanaka, 1986). Recent advances have been made in the interpretation of soil/structure interaction behaviour from AE measurements using physical modelling and field experiments for slope instability (Smith et al., 2014; Smith and Dixon, 2015; Smith et al., 2017a; Berg et al., 2018; Dixon et al., 2018) and pile loading (Mao et al., 2015; Mao et al., 2016; Mao et al., 2018) applications.
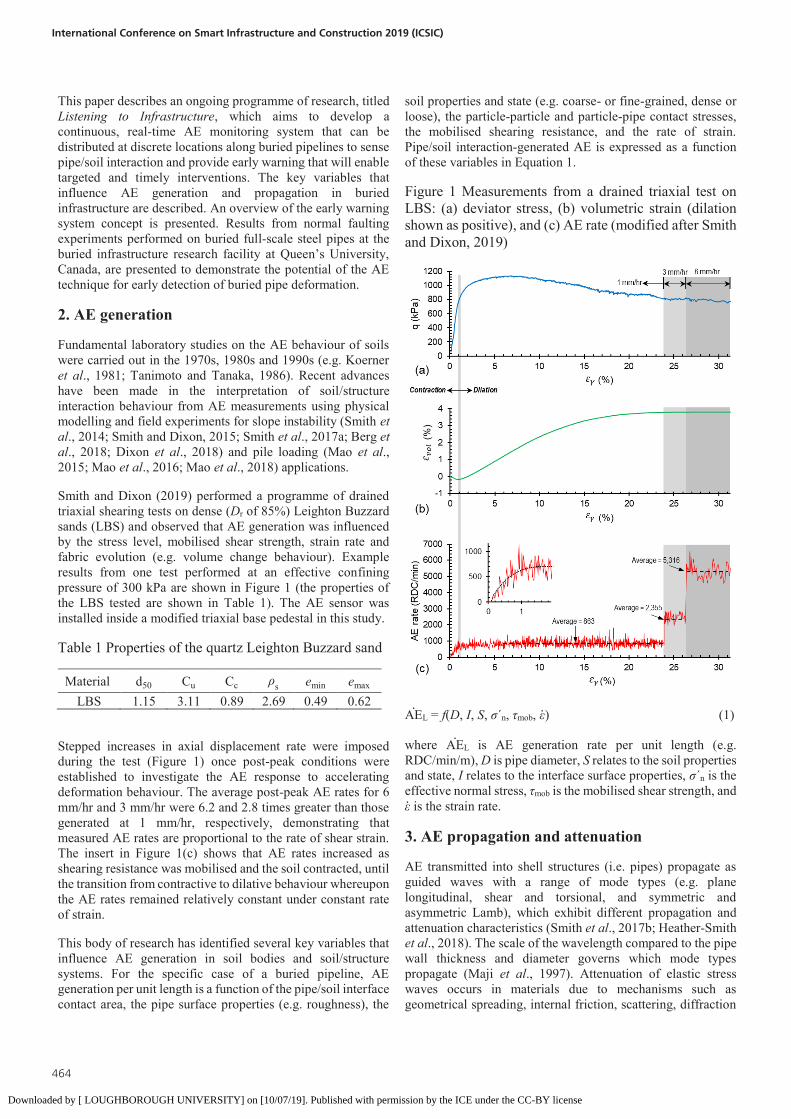
Smith and Dixon (2019) performed a programme of drained triaxial shearing tests on dense (Dr of 85%) Leighton Buzzard sands (LBS) and observed that AE generation was influenced by the stress level, mobilised shear strength, strain rate and fabric evolution (e.g. volume change behaviour). Example results from one test performed at an effective confining pressure of 300 kPa are shown in Figure 1 (the properties of the LBS tested are shown in Table 1). The AE sensor was installed inside a modified triaxial base pedestal in this study.
Table 1 Properties of the quartz Leighton Buzzard sand
Material d50 Cu Cc ρs emin emax LBS 1.15 3.11 0.89 2.69 0.49 0.62
Stepped increases in axial displacement rate were imposed during the test (Figure 1) once post-peak conditions were established to investigate the AE response to accelerating deformation behaviour. The average post-peak AE rates for 6 mm/hr and 3 mm/hr were 6.2 and 2.8 times greater than those generated at 1 mm/hr, respectively, demonstrating that measured AE rates are proportional to the rate of shear strain. The insert in Figure 1(c) shows that AE rates increased as shearing resistance was mobilised and the soil contracted, until the transition from contractive to dilative behaviour whereupon the AE rates remained relatively constant under constant rate of strain.
This body of research has identified several key variables that influence AE generation in soil bodies and soil/structure systems. For the specific case of a buried pipeline, AE generation per unit length is a function of the pipe/soil interface contact area, the pipe surface properties (e.g. roughness), the
soil properties and state (e.g. coarse- or fine-grained, dense or loose), the particle-particle and particle-pipe contact stresses, the mobilised shearing resistance, and the rate of strain. Pipe/soil interaction-generated AE is expressed as a function of these variables in Equation 1.
Figure 1 Measurements from a drained triaxial test on LBS: (a) deviator stress, (b) volumetric strain (dilation shown as positive), and (c) AE rate (modified after Smith and Dixon, 2019)
AEL = f(D, I, S, σ´n, τmob, ε) (1)
where AEL is AE generation rate per unit length (e.g. RDC/min/m), D is pipe diameter, S relates to the soil properties and state, I relates to the interface surface properties, σ´n is the effective normal stress, τmob is the mobilised shear strength, and ε is the strain rate.
3. AE propagation and attenuation
AE transmitted into shell structures (i.e. pipes) propagate as guided waves with a range of mode types (e.g. plane longitudinal, shear and torsional, and symmetric and asymmetric Lamb), which exhibit different propagation and attenuation characteristics (Smith et al., 2017b; Heather-Smith et al., 2018). The scale of the wavelength compared to the pipe wall thickness and diameter governs which mode types propagate (Maji et al., 1997). Attenuation of elastic stress waves occurs in materials due to mechanisms such as geometrical spreading, internal friction, scattering, diffraction
and dispersion. In the case of a buried pipe, the pipeline will have both internal and external environments (e.g. Figure 2) in addition to joints at regular spacings. Boundaries with discontinuities in acoustic impedance also increase attenuation (i.e. loss of AE energy), for example the changes in cross-section at joints and differences in material properties at interfaces with the internal (e.g. water, oil, gas) and external environments (i.e. soil).
A framework to quantify the magnitude of attenuation experienced by AE in buried infrastructure systems is currently being developed using numerical simulations and large-scale experiments (e.g. Smith et al., 2017b; Heather-Smith et al., 2018). This is enabling sensor spacings to be selected for a range of buried infrastructure applications, in addition to source localisation methodologies to be developed (e.g. using the difference in arrival times between modes with known velocities).
This research has identified the key variables that influence AE attenuation in buried pipes and pile foundations. The attenuation magnitude is a function of the cross-sectional geometry (e.g. pipe diameter and wall thickness), the properties of the joints (e.g. threaded or welded), the frequency content of the AE, the propagating mode type(s), and the density, Young’s modulus and Poisson’s ratio of the pipe, the internal environment and the external environment. Consideration should be given to the depth-dependent nature of density, Young’s modulus and Poisson’s ratio in the external environment (i.e. soil). AE attenuation in buried infrastructure is expressed as a function of these variables in Equation 2.
A = f(D, t, J, f, M, ρp, Ep, νp, ρi, Ei, νi, ρe, Ee, νe) (2)
where A is attenuation (dB/m), D is pipe diameter, t is wall thickness, J relates to joint properties and spacings, f is frequency, M relates to the mode type, ρ is density, E is Young’s modulus, and ν is Poisson’s ratio. Subscripts p, i and e refer to the pipe, the internal environment and the external environment, respectively.
Figure 2 Cross-section diagram of a typical buried pipe
4. AE measurement and warning system
Figure 3(a) shows an illustration of the Listening to Infrastructure monitoring concept: the fault-rupture is propagating upwards from the bedrock through the soil body and intersecting the buried pipe. AE is generated by soil deformation and soil/structure interaction, which propagates as guided waves along the pipeline to the monitoring sensors. The monitoring system interprets the AE and sends a warning to decision makers via telemetry. Figure 3(b) shows a flow diagram of the system operation, which will use forms of artificial intelligence (e.g. pattern recognition, neural networks) for automated interpretation of the AE and source localisation.
The AE measurement devices comprise: sensors to convert the mechanical AE waves to voltage waveforms, amplifiers and filters to improve the signal-to-noise ratio, signal analysis, automated interpretation algorithms, data storage and wireless communication. AE signal analysis can be performed using many different parameters and algorithms in both time and frequency domains. Smith and Dixon (2019) demonstrated how combining measurement of both RDC and b-values (i.e. proportion of low and high magnitude events in an AE waveform) could be used to identify the transition from contractive to dilative behaviour, mobilisation of peak shear strength and quantify accelerating deformation behaviour.
Figure 3 Illustration of the Listening to Infrastructure monitoring concept: (a) a fault-rupture deforming a buried pipeline, and (b) a flow diagram of system operation
Downloaded by [ LOUGHBOROUGH UNIVERSITY] on [10/07/19]. Published with permission by the ICE under the CC-BY license

465
This paper describes an ongoing programme of research, titled Listening to Infrastructure, which aims to develop a continuous, real-time AE monitoring system that can be distributed at discrete locations along buried pipelines to sense pipe/soil interaction and provide early warning that will enable targeted and timely interventions. The key variables that influence AE generation and propagation in buried infrastructure are described. An overview of the early warning system concept is presented. Results from normal faulting experiments performed on buried full-scale steel pipes at the buried infrastructure research facility at Queen’s University, Canada, are presented to demonstrate the potential of the AE technique for early detection of buried pipe deformation.
2. AE generation
Fundamental laboratory studies on the AE behaviour of soils were carried out in the 1970s, 1980s and 1990s (e.g. Koerner et al., 1981; Tanimoto and Tanaka, 1986). Recent advances have been made in the interpretation of soil/structure interaction behaviour from AE measurements using physical modelling and field experiments for slope instability (Smith et al., 2014; Smith and Dixon, 2015; Smith et al., 2017a; Berg et al., 2018; Dixon et al., 2018) and pile loading (Mao et al., 2015; Mao et al., 2016; Mao et al., 2018) applications.
Smith and Dixon (2019) performed a programme of drained triaxial shearing tests on dense (Dr of 85%) Leighton Buzzard sands (LBS) and observed that AE generation was influenced by the stress level, mobilised shear strength, strain rate and fabric evolution (e.g. volume change behaviour). Example results from one test performed at an effective confining pressure of 300 kPa are shown in Figure 1 (the properties of the LBS tested are shown in Table 1). The AE sensor was installed inside a modified triaxial base pedestal in this study.
Table 1 Properties of the quartz Leighton Buzzard sand
Material d50 Cu Cc ρs emin emax LBS 1.15 3.11 0.89 2.69 0.49 0.62
Stepped increases in axial displacement rate were imposed during the test (Figure 1) once post-peak conditions were established to investigate the AE response to accelerating deformation behaviour. The average post-peak AE rates for 6 mm/hr and 3 mm/hr were 6.2 and 2.8 times greater than those generated at 1 mm/hr, respectively, demonstrating that measured AE rates are proportional to the rate of shear strain. The insert in Figure 1(c) shows that AE rates increased as shearing resistance was mobilised and the soil contracted, until the transition from contractive to dilative behaviour whereupon the AE rates remained relatively constant under constant rate of strain.
This body of research has identified several key variables that influence AE generation in soil bodies and soil/structure systems. For the specific case of a buried pipeline, AE generation per unit length is a function of the pipe/soil interface contact area, the pipe surface properties (e.g. roughness), the
soil properties and state (e.g. coarse- or fine-grained, dense or loose), the particle-particle and particle-pipe contact stresses, the mobilised shearing resistance, and the rate of strain. Pipe/soil interaction-generated AE is expressed as a function of these variables in Equation 1.
Figure 1 Measurements from a drained triaxial test on LBS: (a) deviator stress, (b) volumetric strain (dilation shown as positive), and (c) AE rate (modified after Smith and Dixon, 2019)
AEL = f(D, I, S, σ´n, τmob, ε) (1)
where AEL is AE generation rate per unit length (e.g. RDC/min/m), D is pipe diameter, S relates to the soil properties and state, I relates to the interface surface properties, σ´n is the effective normal stress, τmob is the mobilised shear strength, and ε is the strain rate.
3. AE propagation and attenuation
AE transmitted into shell structures (i.e. pipes) propagate as guided waves with a range of mode types (e.g. plane longitudinal, shear and torsional, and symmetric and asymmetric Lamb), which exhibit different propagation and attenuation characteristics (Smith et al., 2017b; Heather-Smith et al., 2018). The scale of the wavelength compared to the pipe wall thickness and diameter governs which mode types propagate (Maji et al., 1997). Attenuation of elastic stress waves occurs in materials due to mechanisms such as geometrical spreading, internal friction, scattering, diffraction
and dispersion. In the case of a buried pipe, the pipeline will have both internal and external environments (e.g. Figure 2) in addition to joints at regular spacings. Boundaries with discontinuities in acoustic impedance also increase attenuation (i.e. loss of AE energy), for example the changes in cross-section at joints and differences in material properties at interfaces with the internal (e.g. water, oil, gas) and external environments (i.e. soil).
A framework to quantify the magnitude of attenuation experienced by AE in buried infrastructure systems is currently being developed using numerical simulations and large-scale experiments (e.g. Smith et al., 2017b; Heather-Smith et al., 2018). This is enabling sensor spacings to be selected for a range of buried infrastructure applications, in addition to source localisation methodologies to be developed (e.g. using the difference in arrival times between modes with known velocities).
This research has identified the key variables that influence AE attenuation in buried pipes and pile foundations. The attenuation magnitude is a function of the cross-sectional geometry (e.g. pipe diameter and wall thickness), the properties of the joints (e.g. threaded or welded), the frequency content of the AE, the propagating mode type(s), and the density, Young’s modulus and Poisson’s ratio of the pipe, the internal environment and the external environment. Consideration should be given to the depth-dependent nature of density, Young’s modulus and Poisson’s ratio in the external environment (i.e. soil). AE attenuation in buried infrastructure is expressed as a function of these variables in Equation 2.
A = f(D, t, J, f, M, ρp, Ep, νp, ρi, Ei, νi, ρe, Ee, νe) (2)
where A is attenuation (dB/m), D is pipe diameter, t is wall thickness, J relates to joint properties and spacings, f is frequency, M relates to the mode type, ρ is density, E is Young’s modulus, and ν is Poisson’s ratio. Subscripts p, i and e refer to the pipe, the internal environment and the external environment, respectively.
Figure 2 Cross-section diagram of a typical buried pipe
4. AE measurement and warning system
Figure 3(a) shows an illustration of the Listening to Infrastructure monitoring concept: the fault-rupture is propagating upwards from the bedrock through the soil body and intersecting the buried pipe. AE is generated by soil deformation and soil/structure interaction, which propagates as guided waves along the pipeline to the monitoring sensors. The monitoring system interprets the AE and sends a warning to decision makers via telemetry. Figure 3(b) shows a flow diagram of the system operation, which will use forms of artificial intelligence (e.g. pattern recognition, neural networks) for automated interpretation of the AE and source localisation.
The AE measurement devices comprise: sensors to convert the mechanical AE waves to voltage waveforms, amplifiers and filters to improve the signal-to-noise ratio, signal analysis, automated interpretation algorithms, data storage and wireless communication. AE signal analysis can be performed using many different parameters and algorithms in both time and frequency domains. Smith and Dixon (2019) demonstrated how combining measurement of both RDC and b-values (i.e. proportion of low and high magnitude events in an AE waveform) could be used to identify the transition from contractive to dilative behaviour, mobilisation of peak shear strength and quantify accelerating deformation behaviour.
Figure 3 Illustration of the Listening to Infrastructure monitoring concept: (a) a fault-rupture deforming a buried pipeline, and (b) a flow diagram of system operation
Smith, Moore and Dixon
Downloaded by [ LOUGHBOROUGH UNIVERSITY] on [10/07/19]. Published with permission by the ICE under the CC-BY license

466
International Conference on Smart Infrastructure and Construction 2019 (ICSIC)
5. Full-scale testing of pipe/soil interaction
Full-scale tests were performed at the buried infrastructure research facility at Queen's University, Canada, using a split-box apparatus (Figure 4) to impose differential ground motion (normal faulting) on a steel pipe buried in dry sand in order to investigate the influence of stress level and patterns of deformation on AE generation (the full test series and results are detailed in Smith et al., 2019).
Figure 4 Cross-section of the differential ground movement apparatus with a pipe burial depth of 0.6m
The steel pipe had an outside diameter of 167 mm and wall thickness of 4.5 mm, and was instrumented with AE sensors, strain gauges, fibre optic strain sensing and linear potentiometers. Deformation of the soil surface was measured using an automatic total station. The synthetic olivine sand (properties in Table 2) was compacted in layers to a relative density, Dr, of 85%.
Table 2 Properties of the synthetic olivine sand
Material d50 Cu Cc ρs emin emax Olivine
sand 0.83 2.21 0.96 3.2 0.88 1.13
The fault simulator enables half of the soil block (above the moving floor) to displace downwards relative to the other. At the onset of fault offset (moving floor displacement), a displacement discontinuity develops at the interface between the moving and stationary floor, analogous to bedrock faulting, leading to a highly concentrated shear zone within the soil. With further increments of displacement, this shear zone propagates upwards through the soil body, spreading out so that the shear strains become less localised at the surface (Figure 3(a)).
Pipe/soil interaction is different on each side of the fault. On the stationary side, the pipe experiences a hogging deflection and compresses the soil beneath, and resistance here is controlled by the soil’s bearing capacity. On the moving side, the pipe experiences a sagging deflection and resistance here is controlled by the soil’s uplift capacity. The soil’s bearing capacity is significantly greater than its uplift capacity, and hence the peak uplift resistance is mobilised first. The uplift
failure mechanism resembles an inverted trapezoidal block (Figure 5) and comprises four key stages (Cheuk et al., 2008): (1) mobilisation of peak resistance; (2) gap formation beneath the pipe invert and infilling; (3) post-peak shear band formation; and (4) flow-around soil displacement. Figure 6 shows a photograph of the soil surface at the end of a test. The fault-rupture shear zone is evident above and parallel to the fault, and two visible shear bands, perpendicular to the fault-rupture shear band and parallel to the pipe, emerge at the surface above the pipe in the sagging zone and are characteristic of the uplift failure mechanism.
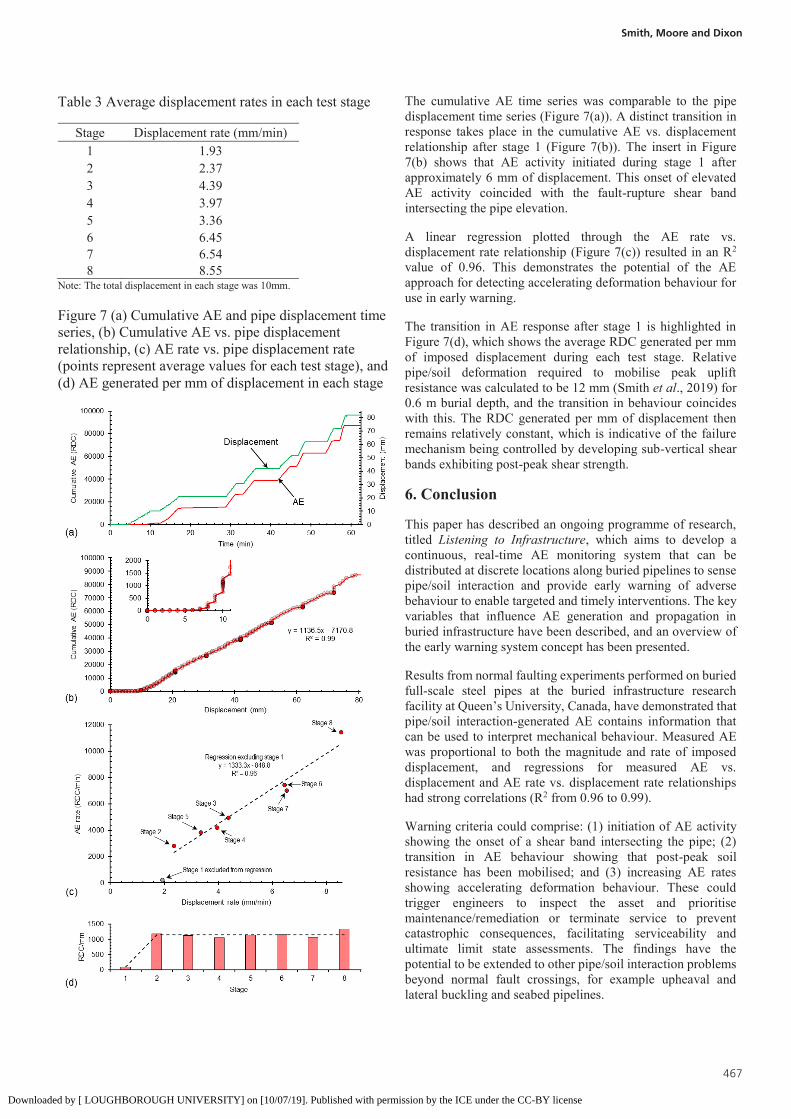
Example results from one test performed at a burial depth of 0.6 m are reported here. Table 3 shows the average displacement rate applied in each 10 mm test increment. Figure 7 shows the AE and vertical downwards pipe displacement measurements.
Figure 5 Illustration of the pipe uplift failure mechanism
Figure 6 Photograph showing the soil surface at the end of the test
Table 3 Average displacement rates in each test stage
Stage Displacement rate (mm/min) 1 1.93 2 2.37 3 4.39 4 3.97 5 3.36 6 6.45 7 6.54 8 8.55
Note: The total displacement in each stage was 10mm.
Figure 7 (a) Cumulative AE and pipe displacement time series, (b) Cumulative AE vs. pipe displacement relationship, (c) AE rate vs. pipe displacement rate (points represent average values for each test stage), and (d) AE generated per mm of displacement in each stage
The cumulative AE time series was comparable to the pipe displacement time series (Figure 7(a)). A distinct transition in response takes place in the cumulative AE vs. displacement relationship after stage 1 (Figure 7(b)). The insert in Figure 7(b) shows that AE activity initiated during stage 1 after approximately 6 mm of displacement. This onset of elevated AE activity coincided with the fault-rupture shear band intersecting the pipe elevation.
A linear regression plotted through the AE rate vs. displacement rate relationship (Figure 7(c)) resulted in an R2 value of 0.96. This demonstrates the potential of the AE approach for detecting accelerating deformation behaviour for use in early warning.
The transition in AE response after stage 1 is highlighted in Figure 7(d), which shows the average RDC generated per mm of imposed displacement during each test stage. Relative pipe/soil deformation required to mobilise peak uplift resistance was calculated to be 12 mm (Smith et al., 2019) for 0.6 m burial depth, and the transition in behaviour coincides with this. The RDC generated per mm of displacement then remains relatively constant, which is indicative of the failure mechanism being controlled by developing sub-vertical shear bands exhibiting post-peak shear strength.
6. Conclusion
This paper has described an ongoing programme of research, titled Listening to Infrastructure, which aims to develop a continuous, real-time AE monitoring system that can be distributed at discrete locations along buried pipelines to sense pipe/soil interaction and provide early warning of adverse behaviour to enable targeted and timely interventions. The key variables that influence AE generation and propagation in buried infrastructure have been described, and an overview of the early warning system concept has been presented.
Results from normal faulting experiments performed on buried full-scale steel pipes at the buried infrastructure research facility at Queen’s University, Canada, have demonstrated that pipe/soil interaction-generated AE contains information that can be used to interpret mechanical behaviour. Measured AE was proportional to both the magnitude and rate of imposed displacement, and regressions for measured AE vs. displacement and AE rate vs. displacement rate relationships had strong correlations (R2 from 0.96 to 0.99).
Warning criteria could comprise: (1) initiation of AE activity showing the onset of a shear band intersecting the pipe; (2) transition in AE behaviour showing that post-peak soil resistance has been mobilised; and (3) increasing AE rates showing accelerating deformation behaviour. These could trigger engineers to inspect the asset and prioritise maintenance/remediation or terminate service to prevent catastrophic consequences, facilitating serviceability and ultimate limit state assessments. The findings have the potential to be extended to other pipe/soil interaction problems beyond normal fault crossings, for example upheaval and lateral buckling and seabed pipelines.
Downloaded by [ LOUGHBOROUGH UNIVERSITY] on [10/07/19]. Published with permission by the ICE under the CC-BY license
467
5. Full-scale testing of pipe/soil interaction
Full-scale tests were performed at the buried infrastructure research facility at Queen's University, Canada, using a split-box apparatus (Figure 4) to impose differential ground motion (normal faulting) on a steel pipe buried in dry sand in order to investigate the influence of stress level and patterns of deformation on AE generation (the full test series and results are detailed in Smith et al., 2019).
Figure 4 Cross-section of the differential ground movement apparatus with a pipe burial depth of 0.6m
The steel pipe had an outside diameter of 167 mm and wall thickness of 4.5 mm, and was instrumented with AE sensors, strain gauges, fibre optic strain sensing and linear potentiometers. Deformation of the soil surface was measured using an automatic total station. The synthetic olivine sand (properties in Table 2) was compacted in layers to a relative density, Dr, of 85%.
Table 2 Properties of the synthetic olivine sand
Material d50 Cu Cc ρs emin emax Olivine
sand 0.83 2.21 0.96 3.2 0.88 1.13
The fault simulator enables half of the soil block (above the moving floor) to displace downwards relative to the other. At the onset of fault offset (moving floor displacement), a displacement discontinuity develops at the interface between the moving and stationary floor, analogous to bedrock faulting, leading to a highly concentrated shear zone within the soil. With further increments of displacement, this shear zone propagates upwards through the soil body, spreading out so that the shear strains become less localised at the surface (Figure 3(a)).
Pipe/soil interaction is different on each side of the fault. On the stationary side, the pipe experiences a hogging deflection and compresses the soil beneath, and resistance here is controlled by the soil’s bearing capacity. On the moving side, the pipe experiences a sagging deflection and resistance here is controlled by the soil’s uplift capacity. The soil’s bearing capacity is significantly greater than its uplift capacity, and hence the peak uplift resistance is mobilised first. The uplift
failure mechanism resembles an inverted trapezoidal block (Figure 5) and comprises four key stages (Cheuk et al., 2008): (1) mobilisation of peak resistance; (2) gap formation beneath the pipe invert and infilling; (3) post-peak shear band formation; and (4) flow-around soil displacement. Figure 6 shows a photograph of the soil surface at the end of a test. The fault-rupture shear zone is evident above and parallel to the fault, and two visible shear bands, perpendicular to the fault-rupture shear band and parallel to the pipe, emerge at the surface above the pipe in the sagging zone and are characteristic of the uplift failure mechanism.
Example results from one test performed at a burial depth of 0.6 m are reported here. Table 3 shows the average displacement rate applied in each 10 mm test increment. Figure 7 shows the AE and vertical downwards pipe displacement measurements.
Figure 5 Illustration of the pipe uplift failure mechanism
Figure 6 Photograph showing the soil surface at the end of the test
Table 3 Average displacement rates in each test stage
Stage Displacement rate (mm/min) 1 1.93 2 2.37 3 4.39 4 3.97 5 3.36 6 6.45 7 6.54 8 8.55
Note: The total displacement in each stage was 10mm.
Figure 7 (a) Cumulative AE and pipe displacement time series, (b) Cumulative AE vs. pipe displacement relationship, (c) AE rate vs. pipe displacement rate (points represent average values for each test stage), and (d) AE generated per mm of displacement in each stage
The cumulative AE time series was comparable to the pipe displacement time series (Figure 7(a)). A distinct transition in response takes place in the cumulative AE vs. displacement relationship after stage 1 (Figure 7(b)). The insert in Figure 7(b) shows that AE activity initiated during stage 1 after approximately 6 mm of displacement. This onset of elevated AE activity coincided with the fault-rupture shear band intersecting the pipe elevation.
A linear regression plotted through the AE rate vs. displacement rate relationship (Figure 7(c)) resulted in an R2 value of 0.96. This demonstrates the potential of the AE approach for detecting accelerating deformation behaviour for use in early warning.
The transition in AE response after stage 1 is highlighted in Figure 7(d), which shows the average RDC generated per mm of imposed displacement during each test stage. Relative pipe/soil deformation required to mobilise peak uplift resistance was calculated to be 12 mm (Smith et al., 2019) for 0.6 m burial depth, and the transition in behaviour coincides with this. The RDC generated per mm of displacement then remains relatively constant, which is indicative of the failure mechanism being controlled by developing sub-vertical shear bands exhibiting post-peak shear strength.
6. Conclusion
This paper has described an ongoing programme of research, titled Listening to Infrastructure, which aims to develop a continuous, real-time AE monitoring system that can be distributed at discrete locations along buried pipelines to sense pipe/soil interaction and provide early warning of adverse behaviour to enable targeted and timely interventions. The key variables that influence AE generation and propagation in buried infrastructure have been described, and an overview of the early warning system concept has been presented.
Results from normal faulting experiments performed on buried full-scale steel pipes at the buried infrastructure research facility at Queen’s University, Canada, have demonstrated that pipe/soil interaction-generated AE contains information that can be used to interpret mechanical behaviour. Measured AE was proportional to both the magnitude and rate of imposed displacement, and regressions for measured AE vs. displacement and AE rate vs. displacement rate relationships had strong correlations (R2 from 0.96 to 0.99).
Warning criteria could comprise: (1) initiation of AE activity showing the onset of a shear band intersecting the pipe; (2) transition in AE behaviour showing that post-peak soil resistance has been mobilised; and (3) increasing AE rates showing accelerating deformation behaviour. These could trigger engineers to inspect the asset and prioritise maintenance/remediation or terminate service to prevent catastrophic consequences, facilitating serviceability and ultimate limit state assessments. The findings have the potential to be extended to other pipe/soil interaction problems beyond normal fault crossings, for example upheaval and lateral buckling and seabed pipelines.
Smith, Moore and Dixon
Downloaded by [ LOUGHBOROUGH UNIVERSITY] on [10/07/19]. Published with permission by the ICE under the CC-BY license

468
International Conference on Smart Infrastructure and Construction 2019 (ICSIC)
7. Acknowledgements
Alister Smith gratefully acknowledges the support of a UK Engineering and Physical Sciences Research Council Fellowship (Listening to Infrastructure, EP/P012493/1). The testing at Queen’s was supported with funds to Ian Moore through a Discovery Grant from the Natural Sciences and Engineering Research Council of Canada and Infrastructure Operating Funds from the Canada Foundation for Innovation.
8. References
Berg N, Smith A, Russell S, Dixon N, Proudfoot D and Take WA (2018) Correlation of acoustic emissions with patterns of movement in an extremely slow-moving landslide at Peace River, Alberta, Canada. Canadian Geotechnical Journal, 55(10): 1475-1488. Cheuk CY, White DJ and Bolton MD (2008) Uplift mechanisms of pipes buried in sand. Journal of geotechnical and geoenvironmental engineering, 134(2): 154-163. Dixon N, Smith A, Flint JA, Khanna R, Clark B and Andjelkovic M (2018) An acoustic emission landslide early warning system for communities in low-income and middle-income countries. Landslides, 10.1007/s10346-018-0977-1. Heather-Smith HJ, Smith A, Dixon N, Flint JA and Wordingham J (2018) Monitoring buried infrastructure deformation using acoustic emissions. 9th European Workshop on Structural Health Monitoring, July 10-13, 2018, Manchester, United Kingdom Karamitros DK, Bouckovalas GD and Kouretzis GP (2007) Stress analysis of buried steel pipelines at strike-slip fault crossings. Soil Dynamics and Earthquake Engineering, 27(3): 200-211. Koerner RM, McCabe WM and Lord AE (1981) Acoustic emission behavior and monitoring of soils. In Acoustic emissions in geotechnical engineering practice (eds V. P. Drnevich and R. E. Gray), ASTM STP 750, pp. 93–141. West Conshohocken, PA, USA: ASTM International. Maji AK, Satpathi D and Kratochvil T (1997) Acoustic emission source location using Lamb wave modes. Journal of engineering mechanics, 123(2): 154-161. Mao W, Aoyama S, Goto S and Towhata I (2015) Acoustic emission characteristics of subsoil subjected to vertical pile loading in sand. Journal of Applied Geophysics, 119: 119-127. Mao W, Aoyama S, Goto S and Towhata I (2016) Behaviour and frequency characteristics of acoustic emissions from sandy ground under model pile penetration. Near Surface Geophysics, 14(6): 515-525. Mao W, Aoyama S and Towhata I (2018) Feasibility study of using acoustic emission signals for investigation of pile spacing effect on group pile behaviour. Applied Acoustics, 139: 189-202. Robert DJ, Soga K and O’Rourke TD (2016) Pipelines subjected to fault movement in dry and unsaturated soils. International Journal of Geomechanics, 16(5): C4016001.
Smith A and Dixon N (2015) Quantification of landslide velocity from active waveguide–generated acoustic emission. Canadian Geotechnical Journal, 52(4): 413-425. Smith A and Dixon N (2019) Acoustic emission behaviour of dense sands. Géotechnique, 10.1680/jgeot.18.p.209 Smith A, Dixon N, Meldrum P, Haslam E and Chambers J (2014) Acoustic emission monitoring of a soil slope: Comparisons with continuous deformation measurements. Géotechnique Letters, 4(4): 255-261. Smith A, Dixon N and Fowmes G (2017a) Early detection of first-time slope failures using acoustic emission measurements: large-scale physical modelling. Géotechnique, 67(2): 138-152. Smith A, Dixon N and Fowmes G (2017b) Monitoring buried pipe deformation using acoustic emission: quantification of attenuation. International Journal of Geotechnical Engineering, 11(4): 418-430. Smith A, Moore ID and Dixon N (2019) Acoustic emission sensing of pipe-soil interaction: Full-scale pipelines crossing a normal fault. Under Review Tanimoto K and Tanaka Y (1986) Yielding of soil as determined by acoustic emission. Soils and foundations, 26(3): 69-80. Vazouras P, Dakoulas P and Karamanos SA (2015) Pipe–soil interaction and pipeline performance under strike–slip fault movements. Soil Dynamics and Earthquake Engineering, 72: 48-65.
Downloaded by [ LOUGHBOROUGH UNIVERSITY] on [10/07/19]. Published with permission by the ICE under the CC-BY license