ACOUSTIC PYROMETERftp.feq.ufu.br/Luis_Claudio/Segurança/Safety/Double/equip/25821_04b.pdf · with...
142
PROCESS VARIABLES—FIELD INSTRUMENTATION 4.47 Although the temperature probes can be made as small as 0.032 inch (0.8 mm), they usually are packaged as 1 / 8-inch (3.2-mm) stainless-steel probe assemblies which are interfaced directly to process vessels or pipes, using off-the-shelf compression fittings. Claimed advantages include immunity to electromagnetic and radio frequency; installation and maintenance are simple. The sensors have been found effective in chemical and food processing and notably in microwav- able food packaging research for gathering data on bumping and splattering of foods during heating. Nonmetallic temperature probes available for such applications have been found to minimize error because of their low thermal conductivity and small size. Sensors can be located up to 914 meters (3000 ft) distant from the optoelectronics module. Similarly conceived sensors are available for pressure measurement and direct refractive index measurement. ACOUSTIC PYROMETER The modulating effect of temperature on the speed of sound dates back to the early studies of Laplace over two centuries ago. Thus temperature can be measured inferentially by measuring the speed of an acoustic wave in a given environment. This principle has been applied to the measurement of furnace exit-gas temperatures. Traditionally such measurements are made by optical and radiation pyrometry or wall thermocouples, or estimated on the basis of heat balance calculations. Exit-gas temperatures are particularly important during boiler start-up so that superheater tubes will not be overheated prior to the establishment of steam flow. If the speed of sound can be determined by measuring the flight time of an acoustic wave between two locations, then the temperature of the measured medium can be determined. Experiments with an acoustic pyrometer for furnace exit gas indicate that temperatures up to 1650 ◦ C (3000 ◦ F ) may be encountered and that acoustic velocities may be in excess of 879 m/s (2880 ft/s) and wavelengths of the order of 1 meter (3.28 ft). As pointed out by some researchers, there still is much work to be done before a sound source is developed that will satisfy all of the conflicting requirements generated by the possible applications for acoustic pyrometers. REFERENCE 1. McMillan, G. K. and Toarmina, C. M., Advanced Temperature Measurement and Control, Instrument Society of America, Research Triangle Park, North Carolina, 1995. FLUID PRESSURE SYSTEMS Pressure measurement not only is critical to the safe and optimum operation of such industrial pro- cesses as air and other gas compression; hydraulic equipment operation; separating operations, such as absorption, desorption, distillation, and filtration; steam generation; and vacuum processing—but other process variables, such as the contents level of tanks (hydrostatic pressure) and flow (differen- tial pressure) can be inferred from pressure measurements. Pressure, of course, is the key to applying
Transcript of ACOUSTIC PYROMETERftp.feq.ufu.br/Luis_Claudio/Segurança/Safety/Double/equip/25821_04b.pdf · with...

P1: xxx
1 September 1999 18:38 chap04combined.tex Chap04combined.sgm MH009v3(1999/07/12)
PROCESS VARIABLES—FIELD INSTRUMENTATION 4.47
Although the temperature probes can be made as small as 0.032 inch (0.8 mm), they usually arepackaged as 1/8-inch (3.2-mm) stainless-steel probe assemblies which are interfaced directly to processvessels or pipes, using off-the-shelf compression fittings. Claimed advantages include immunity toelectromagnetic and radio frequency; installation and maintenance are simple.
The sensors have been found effective in chemical and food processing and notably in microwav-able food packaging research for gathering data on bumping and splattering of foods during heating.Nonmetallic temperature probes available for such applications have been found to minimize errorbecause of their low thermal conductivity and small size. Sensors can be located up to 914 meters(3000 ft) distant from the optoelectronics module.
Similarly conceived sensors are available for pressure measurement and direct refractive indexmeasurement.
ACOUSTIC PYROMETER
The modulating effect of temperature on the speed of sound dates back to the early studies of Laplaceover two centuries ago. Thus temperature can be measured inferentially by measuring the speed of anacoustic wave in a given environment. This principle has been applied to the measurement of furnaceexit-gas temperatures. Traditionally such measurements are made by optical and radiation pyrometryor wall thermocouples, or estimated on the basis of heat balance calculations. Exit-gas temperaturesare particularly important during boiler start-up so that superheater tubes will not be overheated priorto the establishment of steam flow.
If the speed of sound can be determined by measuring the flight time of an acoustic wave betweentwo locations, then the temperature of the measured medium can be determined. Experiments withan acoustic pyrometer for furnace exit gas indicate that temperatures up to 1650◦C (3000◦F ) may beencountered and that acoustic velocities may be in excess of 879 m/s (2880 ft/s) and wavelengths ofthe order of 1 meter (3.28 ft). As pointed out by some researchers, there still is much work to be donebefore a sound source is developed that will satisfy all of the conflicting requirements generated bythe possible applications for acoustic pyrometers.
REFERENCE
1. McMillan, G. K. and Toarmina, C. M., Advanced Temperature Measurement and Control, Instrument Societyof America, Research Triangle Park, North Carolina, 1995.
FLUID PRESSURE SYSTEMS
Pressure measurement not only is critical to the safe and optimum operation of such industrial pro-cesses as air and other gas compression; hydraulic equipment operation; separating operations, suchas absorption, desorption, distillation, and filtration; steam generation; and vacuum processing—butother process variables, such as the contents level of tanks (hydrostatic pressure) and flow (differen-tial pressure) can be inferred from pressure measurements. Pressure, of course, is the key to applying

P1: xxx
1 September 1999 18:38 chap04combined.tex Chap04combined.sgm MH009v3(1999/07/12)
4.48 PROCESS/INDUSTRIAL INSTRUMENTS AND CONTROLS HANDBOOK
pneumatic transmitters and controllers. Further, pressure sometimes is selected over temperature asthe variable to control. Air pressure also activates diaphragm motor valves.
Pressure instrumentation ranges widely from the comparative simplicity of low-cost bourdon- andbellows-actuated gages to some of the contemporary complex and sophisticated pressure sensors-transducers (transmitters) that have appeared in very recent years. Modern pressure transmitters differfrom their historical counterparts mainly in two design respects:
1. Mechanical transducers utilizing links, levers, and pivots, having been replaced by electric andelectro-optic transducers, which permits varying degrees of miniaturization of the force-receivingsensors
2. Introduction of what is commonly termed “smart” or “intelligent” electronics into transmitter de-sign, notably the incorporation of a microprocessor along with other ingenious electronic circuitry
A 1991 survey of users indicates that about one-third of the modernized electronic pressure trans-mitters sold today are of the smart variety, and with an increasing rate of acceptance, even thoughcosts run somewhat higher than for the simpler versions.
It is interesting to note that progress in the pressure transmitter field has stemmed mainly fromdiscoveries and developments in the electronics and computer industries. Because of the dynamics ofthese industries, it would be unrealistic to assume that pressure transmitters or, in fact, any other areasof industrial instrumentation have reached a status that could be identified as mature. Thus the fieldwill remain in a transitory phase for some time to come, which makes selection a continuing difficulttask.
Because a substantial market remains for the historically less sophisticated pressure gages thatincorporate simple mechanics and design, these devices are described in the early portions of thisarticle.
MANOMETERS
FIGURE 1 U-tube manometer.
Because of their inherent accuracy, manometers are used for the direct measure-ment of pressure and vacuum. Although some rugged designs can be used inthe field and on-line, manometers largely serve as standards for calibrating otherpressure-measuring instruments.
U-Tube Manometer. A glass U-tube is partially filled with liquid, and bothends are initially open to the atmosphere (Fig. 1).
When a gage pressure P2 is to be measured, it is applied to the top of one ofthe columns and the top of the other column remains open. When the liquid inthe tube is mercury, for example, the indicated pressure h is usually expressedin inches (or millimeters) of mercury. To convert to pounds per square inch (orkilograms per square centimeter),
P2 = dh
where P2 = pressure, psig (kg/cm2)d = density, lb/in3 (kg/cm3)h = height, inches (cm)
For mercury, the density is 0.490 lb/in3 at 60◦F (15.6◦C), and the conversion of inches of mercury topounds per square inch becomes
P2 = 0.490h
P1: xxx
1 September 1999 18:38 chap04combined.tex Chap04combined.sgm MH009v3(1999/07/12)
PROCESS VARIABLES—FIELD INSTRUMENTATION 4.49
The density of water at 60◦F (15.6◦C) is 0.0361 lb/in3, and if water is used in a manometer, theconversion of inches of water to pounds per square inch becomes
P2 = 0.0361h
The same principles apply when metric units are used. For example, the density of mercury at 15.6◦C(60◦F ) may also be expressed as 0.0136 kg/cm3, and the conversion of centimeters of mercury tokilograms per square centimeters
P2 = 0.0136h
FIGURE 2 Well manometer.
For measuring differential pressure and for static balance,
P2 − P1 = dh
The U-tube manometer principle has also been utilized in industryin an instrument usually called a differential-pressure manometer. Inthis device the tubes are expanded into chambers and a float rideson top of the liquid in one of the chambers. The float positions anoutside pointer through a pressuretight bearing or torque tube.
Well Manometer. In this design one leg is replaced by a large-diameter well so that the pressure differential is indicated only bythe height of the column in the single leg. The ratio of diametersis important and should be as great as possible to reduce the errors
resulting from the change in level in the large-diameter well (Fig. 2).The pressure difference can be read directly on a single scale. For static balance,
P2 − P1 = d
(1 + A1
A2
)h
where A1 = area of smaller-diameter legA2 = area of well
If the ratio of A1/A2 is small compared with unity, then the error in neglecting this term becomesnegligible, and the static balance relation becomes
P2 − P1 = dh
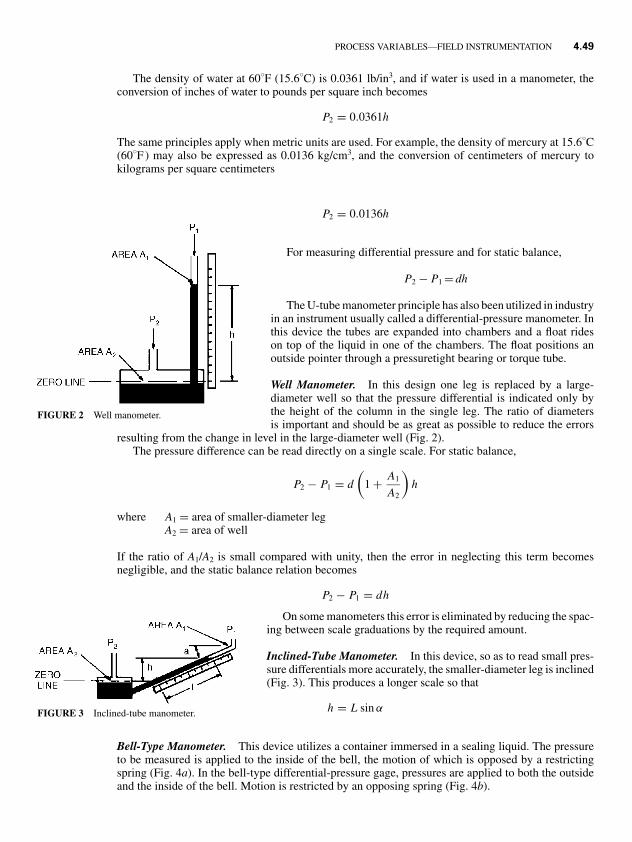
FIGURE 3 Inclined-tube manometer.
On some manometers this error is eliminated by reducing the spac-ing between scale graduations by the required amount.
Inclined-Tube Manometer. In this device, so as to read small pres-sure differentials more accurately, the smaller-diameter leg is inclined(Fig. 3). This produces a longer scale so that
h = L sin α
Bell-Type Manometer. This device utilizes a container immersed in a sealing liquid. The pressureto be measured is applied to the inside of the bell, the motion of which is opposed by a restrictingspring (Fig. 4a). In the bell-type differential-pressure gage, pressures are applied to both the outsideand the inside of the bell. Motion is restricted by an opposing spring (Fig. 4b).

P1: xxx
1 September 1999 18:38 chap04combined.tex Chap04combined.sgm MH009v3(1999/07/12)
4.50 PROCESS/INDUSTRIAL INSTRUMENTS AND CONTROLS HANDBOOK
PRESSURETIGHT SHAFT
BELL
P1 P2
RESTRICTINGSPRING
BELL
h
P
(a) (b)
FIGURE 4 Bell-type manometers. (a) Liquid-sealed bell. (b) Differential-pressure gage.
FIGURE 5 Liquid barometer.
Liquid Barometer. A simple barometer may be constructed from a glass tube that is closed atone end and open at the other. The length of the tube must be greater than 30inches (76.2 cm). The tube is first completely filled with mercury, the open endtemporarily plugged, and then the plugged end placed in a container partially filledwith mercury.
When the plug is removed, the mercury in the tube will drop by a certainamount, creating a vacuum at the top of the tube. The height of the column, asmeasured in Fig. 5 and expressed in inches or millimeters of mercury, will thenbe proportional to the atmospheric pressure.
Absolute-Pressure Manometer. This type of gage comprises a glass U-tubepartially filled with mercury, with the top of one leg evacuated and sealed (Fig.6). The pressure to be measured is applied to the other leg, and h may be read inunits of mercury absolute. To convert to pounds per square inch absolute (psia),
P = 0.490h
FIGURE 6 Absolute-pressure gage (manometer).
where P is absolute pressure in psia. If h is indicated in centimeters,this value may be converted to kilograms per square centimeterabsolute by multiplying by 0.0136.
McLeod Gage (Liquid Manometer). This device is designed forvacuum measurement. It functions essentially as a pressure ampli-fier. If, for example, 100 cm3 (volume V in Fig. 7) of permanentgas is compressed into a section of capillary having a volume of0.1 cm3, the resulting pressure reading is amplified 1000 times. Thisprinciple allows pressure measurements into the 10−6-Torr region,considerably below the 10−2-Torr range of precision manometers.
If we assume that the volume V of gas trapped at the unknownpressure p (in centimeters of mercury for convenience) obeys Boyle’slaw, then pV = (p+ H )A where A, is the cross section of the closed
capillary in square centimeters, and
P = AH2
V − HA

P1: xxx
3 September 1999 0:39 chap04combined.tex Chap04combined.sgm MH009v3(1999/07/12)
PROCESS VARIABLES—FIELD INSTRUMENTATION 4.51
FIGURE 7 Two versions of McLeod gage.
In practice, HA is quite negligible when compared with volume V, with p = 10AH 2/V Torr, and withother values expressed in centimeters.
A conveniently small McLeod gage may have a volume V of 200 cm3, with a capillary cross sectionA of 0.02 cm2 and a length of 10 cm. Thus for H = 0.1 cm, p = 5 × 10⁻⁶ Torr, which would bethe limit of unaided visual resolution and the reading could be wrong by 100 percent. At H = 1 cm,p = 5 × 10⁻⁴ Torr, the possible error becomes 10 percent. For various reasons, the only significantimprovement in accuracy can be achieved by an increase in volume V.
A carefully constructed nonportable gage with a 1300-cm3 volume gives reproducible readingsof ±0.5, ±0.6, ±2, and ±6 percent at pressures of 10−2, 10−3, 10−4, and 10−5 Torr, respectively.The errors for other volumes can be estimated to be no lower than those based on volume pro-portionality. Thus in the previous example with V = 200 cm3 and p = 10−4 Torr, percent error =(1300/200) × 2 = 13 percent, which is in good agreement with the previous rough estimate of 10percent.
Since the measured pressure in a McLeod gage is derived from basic (linear) dimensions, it is theindustrial pressure standard with reference to which all other vacuum gages are calibrated. However,it should be emphasized that only the pressure of permanent gases is measured correctly. On accountof the high compression ratio employed, vapor pressure of a substance of several tenths of a torr wouldnot be detected with condensed liquid occupying negligible volume and not being visible to the eye.A highly portable version of the McLeod gage is shown in Fig. 8.

P1: xxx
3 September 1999 0:39 chap04combined.tex Chap04combined.sgm MH009v3(1999/07/12)
4.52 PROCESS/INDUSTRIAL INSTRUMENTS AND CONTROLS HANDBOOK
FIGURE 8 Portable tilting-type McLeod gage.
ELASTIC-ELEMENT MECHANICAL PRESSURE GAGES
Dating back to the early years of steam power and compressed air and hydraulic technologies, thisclass of pressure sensors uses some form of elastic element whose geometry is altered by changes inpressure. These elements are of four principal types: bellows, bourdon tube, diaphragm, and capsule.
FIGURE 9 Common form of bellows used in pressuregage.
Bellows. This is a thin-wall metal tube with deeply convo-luted sidewalls that permit axial expansion and contraction(Fig. 9). Most bellows are made from seamless tubes, andthe convolutions either are hydraulically formed or mechan-ically rolled. Materials used include brass, phosphor bronze,beryllium copper, Monel, stainless steel, and Inconel. Bellowselements are well adapted to use in applications that requirelong strokes and highly developed forces. They are well suitedfor input elements for large-case recorders and indicators andfor feedback elements in pneumatic controllers.
Bourdon Tube. In the 1852 patent its inventor E. Bourdon described the bourdon tube as a curvedor twisted tube whose transfer section differs from a circular form. In principle, it is a tube closedat one end, with an internal cross section that is not a perfect circle and, if bent or distorted, has theproperty of changing its shape with internal pressure variations. An internal pressure increase causesthe cross section to become more circular and the shape to straighten, resulting in motion of the closedend of the tube, a motion commonly called tip travel. Common forms of bourdon tubes are shown inFig. 10.
A wide range of alloys can be used for making bourdon elements, including brass, phosphorbronze, beryllium copper, Monel, Ni-Span C, and various stainless-steel alloys.

P1: xxx
3 September 1999 0:39 chap04combined.tex Chap04combined.sgm MH009v3(1999/07/12)
PROCESS VARIABLES—FIELD INSTRUMENTATION 4.53
T
P
P
T
P
T
(a) (b) (c)
FIGURE 10 Types of bourdon springs. (a) C-type tube. (b) Spiral tube. (c)Helical tube.
Diaphragm. This is a flexible disk, usually with concentric corrugations, that is used to convertpressure to deflection. (In addition to use in pressure sensors, diaphragms can serve as fluid barriersin transmitters, as seal assemblies, and also as building blocks for capsules.) A diaphragm usually isdesigned so that the deflection-versus-pressure characteristics are as linear as possible over a specifiedpressure range, and with a minimum of hysteresis and minimum shift in the zero point. However,when required, as in the case of an altitude sensor, a diaphragm can be purposely designed to have anonlinear characteristic.
Metals commonly used for making diaphragms are trumpet brass, phosphor bronze, berylliumcopper, stainless steel, NiSpan C, Monel, Hastelloy, titanium, and tantalum. Both linearity and sensi-tivity are determined mainly by the depth and number of corrugations and by the angle of formationof the diaphragm face.
UNDERRANGESTOP
PIVOTOVERRANGE
STOP
PRESSUREOR VACUUM
CAPSULE
FIGURE 11 Use of capsule element in pressure gage.
In many pressure-measuring applications, the process fluidmust not contact or seep into the pressure element in orderto prevent errors due to effects of static head, to isolate thepressure element from corrosive and otherwise fouling fluids,to assist in cleaning (as in the food industry), and to prevent lossof costly or hazardous process fluids. Thus diaphragm seals arecommonly used.
Capsule. A capsule is formed by joining the peripheries oftwo diaphragms through soldering or welding. Two or morecapsules can be joined together (Fig. 11), and thus the totaldeflection of the assembly is equal to the sum of the deflectionsof the individual capsules. Such elements are used in someabsolute pressure gages. These configurations also are used inaircraft applications.
Range of Measurement
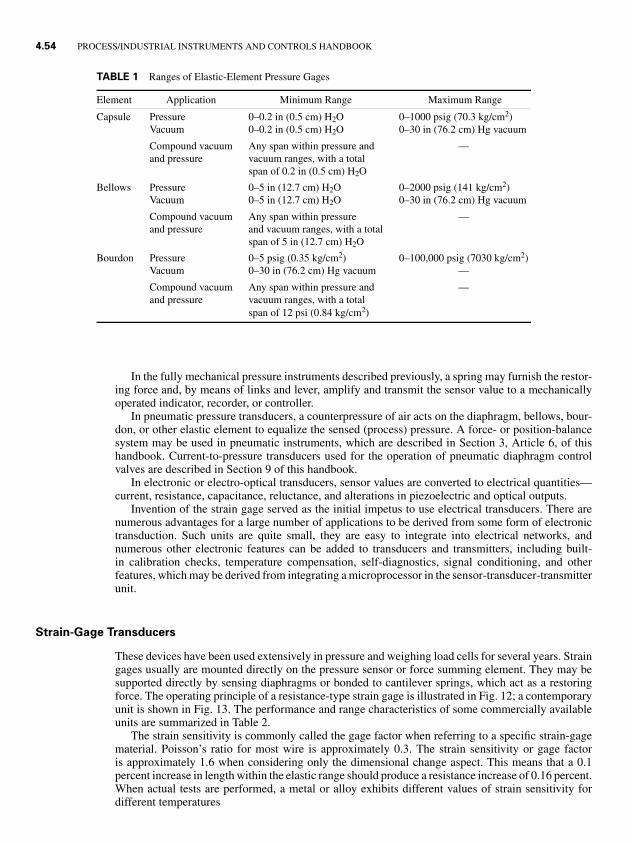
The minimum and maximum pressure ranges of elastic-element mechanical pressure gages are givenin Table 1.
FORCE OR PRESSURE SENSORS, TRANSDUCERSAND TRANSMITTERS
There is a marked distinction between a pressure sensor and a pressure transducer. The sensor providesthe basis of measurement; the transducer converts energy from one form to another.
P1: xxx
3 September 1999 0:39 chap04combined.tex Chap04combined.sgm MH009v3(1999/07/12)
4.54 PROCESS/INDUSTRIAL INSTRUMENTS AND CONTROLS HANDBOOK
TABLE 1 Ranges of Elastic-Element Pressure Gages
Element Application Minimum Range Maximum Range
Capsule Pressure 0–0.2 in (0.5 cm) H2O 0–1000 psig (70.3 kg/cm2)Vacuum 0–0.2 in (0.5 cm) H2O 0–30 in (76.2 cm) Hg vacuum
Compound vacuum Any span within pressure and —and pressure vacuum ranges, with a total
span of 0.2 in (0.5 cm) H2O
Bellows Pressure 0–5 in (12.7 cm) H2O 0–2000 psig (141 kg/cm2)Vacuum 0–5 in (12.7 cm) H2O 0–30 in (76.2 cm) Hg vacuum
Compound vacuum Any span within pressure —and pressure and vacuum ranges, with a total
span of 5 in (12.7 cm) H2O
Bourdon Pressure 0–5 psig (0.35 kg/cm2) 0–100,000 psig (7030 kg/cm2)Vacuum 0–30 in (76.2 cm) Hg vacuum —
Compound vacuum Any span within pressure and —and pressure vacuum ranges, with a total
span of 12 psi (0.84 kg/cm2)
In the fully mechanical pressure instruments described previously, a spring may furnish the restor-ing force and, by means of links and lever, amplify and transmit the sensor value to a mechanicallyoperated indicator, recorder, or controller.
In pneumatic pressure transducers, a counterpressure of air acts on the diaphragm, bellows, bour-don, or other elastic element to equalize the sensed (process) pressure. A force- or position-balancesystem may be used in pneumatic instruments, which are described in Section 3, Article 6, of thishandbook. Current-to-pressure transducers used for the operation of pneumatic diaphragm controlvalves are described in Section 9 of this handbook.
In electronic or electro-optical transducers, sensor values are converted to electrical quantities—current, resistance, capacitance, reluctance, and alterations in piezoelectric and optical outputs.
Invention of the strain gage served as the initial impetus to use electrical transducers. There arenumerous advantages for a large number of applications to be derived from some form of electronictransduction. Such units are quite small, they are easy to integrate into electrical networks, andnumerous other electronic features can be added to transducers and transmitters, including built-in calibration checks, temperature compensation, self-diagnostics, signal conditioning, and otherfeatures, which may be derived from integrating a microprocessor in the sensor-transducer-transmitterunit.
Strain-Gage Transducers
These devices have been used extensively in pressure and weighing load cells for several years. Straingages usually are mounted directly on the pressure sensor or force summing element. They may besupported directly by sensing diaphragms or bonded to cantilever springs, which act as a restoringforce. The operating principle of a resistance-type strain gage is illustrated in Fig. 12; a contemporaryunit is shown in Fig. 13. The performance and range characteristics of some commercially availableunits are summarized in Table 2.
The strain sensitivity is commonly called the gage factor when referring to a specific strain-gagematerial. Poisson’s ratio for most wire is approximately 0.3. The strain sensitivity or gage factoris approximately 1.6 when considering only the dimensional change aspect. This means that a 0.1percent increase in length within the elastic range should produce a resistance increase of 0.16 percent.When actual tests are performed, a metal or alloy exhibits different values of strain sensitivity fordifferent temperatures

P1: xxx
3 September 1999 0:39 chap04combined.tex Chap04combined.sgm MH009v3(1999/07/12)
PROCESS VARIABLES—FIELD INSTRUMENTATION 4.55
FIGURE 12 Basic relation between resistance change and strain in resistance-type straingage. When under stress, the wire changes in length from L1 to L2 and in area from A1 to A2. Theresistance is
R = pL
A
where L = conductor lengthA = cross section areap = resistivity constant
and the strain sensitivity (gage factor) is
S = �R/R
�L/L
where �RR = resistance change
�LL = strain
FIGURE 13 Strain-gage pressure transducer incorporating a force transferrod between diaphragm and double cantilever beam with four foil strain gageson beam. Units are calibrated and temperature-compensated to ensure stabilityover specified ranges, as well as unit interchangeability. Units are available withrequired signal conditioning. (Lucas Schaevitz.)
P1:xxx
3Septem
ber1999
0:39chap04com
bined.texC
hap04combined.sgm
MH
009v3(1999/07/12)
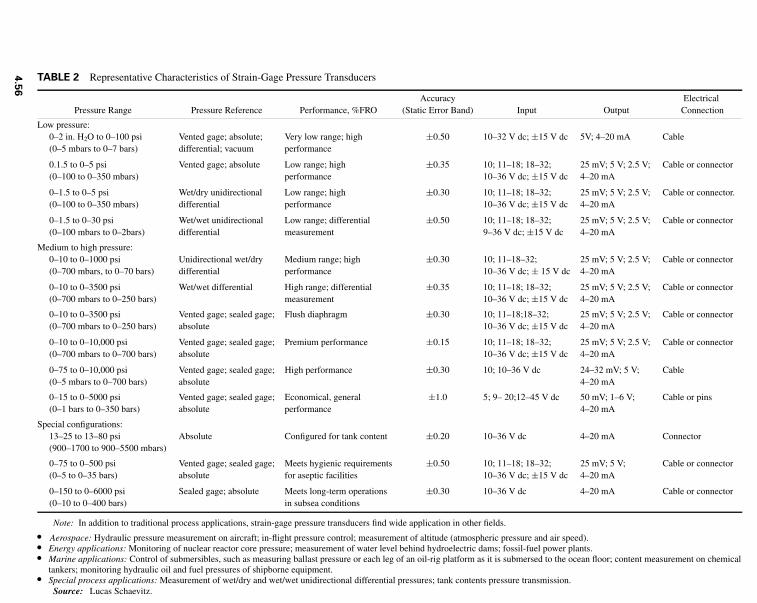
TABLE 2 Representative Characteristics of Strain-Gage Pressure Transducers
Accuracy ElectricalPressure Range Pressure Reference Performance, %FRO (Static Error Band) Input Output Connection
Low pressure:0–2 in. H2O to 0–100 psi Vented gage; absolute; Very low range; high ±0.50 10–32 V dc; ±15 V dc 5V; 4–20 mA Cable(0–5 mbars to 0–7 bars) differential; vacuum performance
0.1.5 to 0–5 psi Vented gage; absolute Low range; high ±0.35 10; 11–18; 18–32; 25 mV; 5 V; 2.5 V; Cable or connector(0–100 to 0–350 mbars) performance 10–36 V dc; ±15 V dc 4–20 mA
0–1.5 to 0–5 psi Wet/dry unidirectional Low range; high ±0.30 10; 11–18; 18–32; 25 mV; 5 V; 2.5 V; Cable or connector.(0–100 to 0–350 mbars) differential performance 10–36 V dc; ±15 V dc 4–20 mA
0–1.5 to 0–30 psi Wet/wet unidirectional Low range; differential ±0.50 10; 11–18; 18–32; 25 mV; 5 V; 2.5 V; Cable or connector(0–100 mbars to 0–2bars) differential measurement 9–36 V dc; ±15 V dc 4–20 mA
Medium to high pressure:0–10 to 0–1000 psi Unidirectional wet/dry Medium range; high ±0.30 10; 11–18–32; 25 mV; 5 V; 2.5 V; Cable or connector(0–700 mbars, to 0–70 bars) differential performance 10–36 V dc; ± 15 V dc 4–20 mA
0–10 to 0–3500 psi Wet/wet differential High range; differential ±0.35 10; 11–18; 18–32; 25 mV; 5 V; 2.5 V; Cable or connector(0–700 mbars to 0–250 bars) measurement 10–36 V dc; ±15 V dc 4–20 mA
0–10 to 0–3500 psi Vented gage; sealed gage; Flush diaphragm ±0.30 10; 11–18;18–32; 25 mV; 5 V; 2.5 V; Cable or connector(0–700 mbars to 0–250 bars) absolute 10–36 V dc; ±15 V dc 4–20 mA
0–10 to 0–10,000 psi Vented gage; sealed gage; Premium performance ±0.15 10; 11–18; 18–32; 25 mV; 5 V; 2.5 V; Cable or connector(0–700 mbars to 0–700 bars) absolute 10–36 V dc; ±15 V dc 4–20 mA
0–75 to 0–10,000 psi Vented gage; sealed gage; High performance ±0.30 10; 10–36 V dc 24–32 mV; 5 V; Cable(0–5 mbars to 0–700 bars) absolute 4–20 mA
0–15 to 0–5000 psi Vented gage; sealed gage; Economical, general ±1.0 5; 9– 20;12–45 V dc 50 mV; 1–6 V; Cable or pins(0–1 bars to 0–350 bars) absolute performance 4–20 mA
Special configurations:13–25 to 13–80 psi Absolute Configured for tank content ±0.20 10–36 V dc 4–20 mA Connector(900–1700 to 900–5500 mbars)
0–75 to 0–500 psi Vented gage; sealed gage; Meets hygienic requirements ±0.50 10; 11–18; 18–32; 25 mV; 5 V; Cable or connector(0–5 to 0–35 bars) absolute for aseptic facilities 10–36 V dc; ±15 V dc 4–20 mA
0–150 to 0–6000 psi Sealed gage; absolute Meets long-term operations ±0.30 10–36 V dc 4–20 mA Cable or connector(0–10 to 0–400 bars) in subsea conditions
Note: In addition to traditional process applications, strain-gage pressure transducers find wide application in other fields.� Aerospace: Hydraulic pressure measurement on aircraft; in-flight pressure control; measurement of altitude (atmospheric pressure and air speed).� Energy applications: Monitoring of nuclear reactor core pressure; measurement of water level behind hydroelectric dams; fossil-fuel power plants.� Marine applications: Control of submersibles, such as measuring ballast pressure or each leg of an oil-rig platform as it is submersed to the ocean floor; content measurement on chemical
tankers; monitoring hydraulic oil and fuel pressures of shipborne equipment.� Special process applications: Measurement of wet/dry and wet/wet unidirectional differential pressures; tank contents pressure transmission.
Source: Lucas Schaevitz.
4.5
6

P1: xxx
3 September 1999 0:39 chap04combined.tex Chap04combined.sgm MH009v3(1999/07/12)
PROCESS VARIABLES—FIELD INSTRUMENTATION 4.57
TABLE 3 Major Types of Resistance Strain Gages
Method of AttachmentBasic Material of Strain Gage to
Common Name of Strain Gage Surface General Application
Unbonded Wire Connected at ends TransducerBonded metallic Wire or foil Epoxy Stress analysis and transducerFlame spray Wire Spray-coated Stress analysisWelded Foil Spot-welded Stress analysisBonded semiconductor Silicon or germanium Epoxy Stress analysis and transducerDiffused semiconductor Silicon Semiconductor diffusion TransducerThin film Metal alloy Sputtering or deposition Transducer
The ideal strain gage would change resistance in accordance with deformations of the surface towhich it is bonded and for no other reason. However, gage resistance is affected by other factors,including temperature. Any resistive change in the gage not caused by strain is referred to as apparentstrain. Apparent strain may be caused by a change in the gage factor due to temperature (thermalcoefficient of the gage factor), by a change in resistance due to temperature (thermal coefficient ofthe resistance), by the stability of the metal, and even by the properties of the adhesive that bonds thegage to the surface being measured. Many improvements in strain-gage materials have been madein recent years, thus reducing the effects of apparent strain. Some common types of resistance straingages and their characteristics are listed in Table 3.
Bonded Strain-Gage Systems. Although increasing the gage factor makes the gage more sensitiveto strain, this also increases the undesirable effects of temperature. Thus small size is preferred so thatthe gage can be placed close to the high-strain area. A high resistance permits larger input voltageexcitation and thus a larger millivolt output with a lower power consumption.
Bonded foil strain gages are made using special metal alloy conductors with high resistivities, highgage factors, and low temperature coefficients. Wire strain gages are not used widely because in orderto obtain 350 ohms by using no. 28 copper wire [0.000126 in2 (0.08 mm2) in cross section], 5360 ft(1633.7 meters) of wire would be needed [350 �/(65 �/1000 ft)]. The metal alloy of a bonded foilstrain gage is formed into a back-and-forth grid to decrease the overall length of the strain gage system(Fig. 14). The length of the grid versus the width is designed to concentrate the strain-sensing gridover the high-strain area. Foil strain gages with gage resistance values of 120, 350, and 1000 ohmsare common, with special gages for use with 4- to 20-mA electronic transmitters having resistancesas high as 5000 ohms.
The sensing grid is tiny and fragile in comparison with the structure to which it is usually attached.Therefore pads for connecting leadwires must be manufactured as part of the strain gage. The straingage is bonded to the specimen surface by a thin layer of epoxy adhesive (Fig. 15), and care must be
FIGURE 14 Representative single bonded-foil strain gage.Dimensions can be of the order of 0.021 × 0.062 in (0.79 ×1.57 mm). Thickness of a single gage may be the order of0.0022 in (0.056 mm). With improved manufacturing tech-niques, the trend is toward smaller dimensions.

P1: xxx
3 September 1999 0:39 chap04combined.tex Chap04combined.sgm MH009v3(1999/07/12)
4.58 PROCESS/INDUSTRIAL INSTRUMENTS AND CONTROLS HANDBOOK
FIGURE 15 Installation of foil strain gage on non-planarsurface. (1) Cylindrical specimen surface; (2) thin adhesivelayer [0.001 inch (0.025 mm)]; (3) strain gage; (4) polymersheet to prevent pressure pad from sticking; (5) pressure pad;(6) metal gaging block that conforms to specimen surface; (7)weight or clamp to apply pressure while adhesive is curing.
taken to ensure a thin, uniform, strong bond. A uniform bonding force applied by a contoured gagingblock is used to exert a constant, even pressure against the strain gage. In summary, when installedand ready for use, the strain-gage system consists of the specimen surface, an effective bond betweengage and specimen, the strain gage, appropriate leads and connectors, and, if needed, a protectivewaterproof coating.
Metallic Strain-Gage Materials. All electrical conductors exhibit a strain-gage effect, but only afew meet the necessary requirements to be useful as strain gages. The major properties of concernare (1) gage factor, (2) resistance, (3) temperature coefficient of gage factor, (4) thermal coefficient ofresistivity, and (5) stability. High-gage-factor materials tend to be more sensitive to temperature andless stable than the lower-gage-factor materials.
Strain-gage materials that have been commonly used in the past include the following:Constantan. Constantan or Advance (copper-nickel alloy) is primarily used for static strain
measurement because of its low and controllable temperature coefficient. For static measurements,under ideal compensation conditions, or for dynamic measurements the alloy may be used from −100to +460◦F (−73.3 to +283◦C). Conservative limits are 50 to 400◦F (10 to 204◦C).
Karma. Karma (nickel-chrome alloy with precipitation-forming additives) provides a wider tem-perature compensation range than Constantan. Special treatment of this alloy gives minimum drift to600◦F (316◦C) and excellent self-temperature compensation characteristics to ∼800◦F (427◦C).
Nichrome V. Nichrome V (nickel-chrome alloy) is commonly used for high-temperature staticand dynamic strain measurements. Under ideal conditions, this alloy may be used for static measure-ments to 1200◦F (649◦C) and for dynamic measurements to 1800◦F (982◦C).
Isoelastic. Isoelastic (nickel-iron alloy plus other ingredients) is used for dynamic tests whereits larger temperature coefficient is of no consequence. The higher gage factor is a distinct advantagewhere dynamic strains of small magnitude are measured.
479PT. 479PT (platinum-tungsten alloy) shows an unusually high stability at elevated temper-atures. It also has a relatively high gage factor for an alloy. A gage of this material is recommendedfor dynamic tests to 1500◦F (816◦C) and static tests to 1200◦F (649◦C).

P1: xxx
3 September 1999 0:39 chap04combined.tex Chap04combined.sgm MH009v3(1999/07/12)
PROCESS VARIABLES—FIELD INSTRUMENTATION 4.59
TABLE 4 Properties of Strain-Gage Materials
Thermal Coefficient ofMaterial Composition, % Gage Factor Resistivity, ◦C−1 × 10⁻⁵
Constantan (Advance) Ni 45, Cu 55 2.1 ±2Isoelastic Ni 36, Cr 8, Mn-Si-Mo 4, Fe 52 3.52 to 3.6 +17Karma Ni 74, Cr 20, Fe 3, Cu 3 2.1 +2Manganin Cu 84, Mn 12, Ni 4 0.3 to 0.47 ±2Alloy 479 Pt 92, W 8 3.6 to 4.4 +24Nickel Pure −12 to −20 670Nichrome V Ni 80, Cr 20 2.1 to 2.63 10Silicon p-Type 100 to 170 70 to 700Silicon n-Type −100 to −140 70 to 700
Semiconductor (Silicon) Strain-Gage Materials. Semiconductor material has an advantage overmetals because its gage factor is approximately 50 to 70 times higher. However, the desirable in-crease in gage factor is partially offset by its greater thermal coefficient of resistivity (the commonterm is temperature effect). Comparatively recently, semiconductor strain gages are gaining in impor-tance, particularly in the manufacture of miniature pressure and force transducers. Micromachinedsilicon assemblies also permit the integration of numerous other functions in a pressure transmitter.Representative properties of strain-gage materials, including semiconductors, are given in Table 4.
Strain-Gage Bonding Agents. The importance of the adhesive that bonds the strain gage to themetal structure under test or as part of a transducer cannot be overemphasized. An ideal adhesiveshould be suited to its intended environment, transmit all strain from the surface to the gage, havehigh mechanical strength, high electrical isolation, low thermal insulation, and be very thin. Also,it should not be affected by temperature changes. The adhesive must provide a strong bond whileelectrically isolating the gage from the surface to which it is attached. Electrical isolation is neededbecause most of the structures to which gages are bonded would electrically short out the elementsif no electrical isolation existed. In a typical strain-gage installation, the electrical isolation betweenthe gage and the specimen surface should be at least 1000 M� at room temperature and 50 voltsdc. Electrical isolation (leakage) becomes a problem with bonding agents at high temperatures andin high-moisture environments. At high temperatures, even ceramic materials begin to exhibit aloss of electrical isolation. This is one of the most severe limitations on strain-gage performance attemperatures above 1200◦F (649◦C).
FIGURE 16 Four-arm Wheatstone bridge circuit. Straingages are inserted at R1, R2, R3, and R4.
Because of the wide variation in properties obtainable with different resin and hardener combi-nations, epoxy resins are an important class of strain-gage adhesives. Alternate attachment methods,
such as the flame spray technique, have been used.
Basic Strain-Gage Bridge Circuit. In order to make use ofthe basic operating principle of the bonded resistance straingage (that is, change in resistance proportional to strain), thestrain-gage input must be connected to an electric circuit capa-ble of measuring small changes in resistance. Since the strain-induced resistance changes are small (typically 0.2 percent forfull-scale output in one active gage), the gages are wired into aWheatstone bridge. A Wheatstone bridge is a circuit designedto accurately measure small changes. It can be used to deter-mine both dynamic and static strain-gage readings. The Wheat-stone bridge also has certain compensation properties.
The Wheatstone bridge detects small changes in a variableby comparing its value with that of a similar variable and thenmeasuring the difference in magnitude, instead of measuringthe magnitude directly. For instance, if four equal-resistancegages are wired into the bridge (Fig. 16) and a voltage is applied
P1: xxx
3 September 1999 0:39 chap04combined.tex Chap04combined.sgm MH009v3(1999/07/12)
4.60 PROCESS/INDUSTRIAL INSTRUMENTS AND CONTROLS HANDBOOK
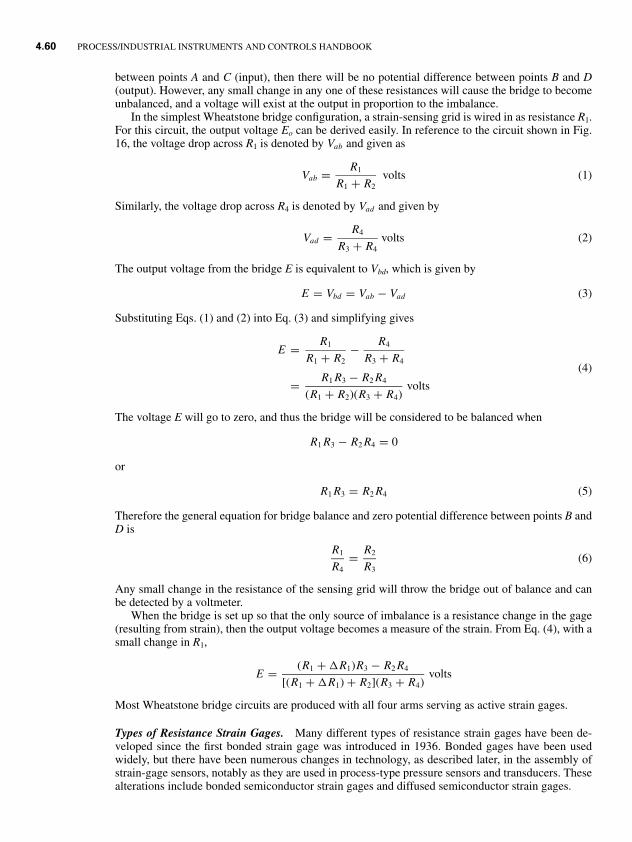
between points A and C (input), then there will be no potential difference between points B and D(output). However, any small change in any one of these resistances will cause the bridge to becomeunbalanced, and a voltage will exist at the output in proportion to the imbalance.
In the simplest Wheatstone bridge configuration, a strain-sensing grid is wired in as resistance R1.For this circuit, the output voltage Eo can be derived easily. In reference to the circuit shown in Fig.16, the voltage drop across R1 is denoted by Vab and given as
Vab = R1
R1 + R2volts (1)
Similarly, the voltage drop across R4 is denoted by Vad and given by
Vad = R4
R3 + R4volts (2)
The output voltage from the bridge E is equivalent to Vbd, which is given by
E = Vbd = Vab − Vad (3)
Substituting Eqs. (1) and (2) into Eq. (3) and simplifying gives
E = R1
R1 + R2− R4
R3 + R4
= R1 R3 − R2 R4
(R1 + R2)(R3 + R4)volts
(4)
The voltage E will go to zero, and thus the bridge will be considered to be balanced when
R1 R3 − R2 R4 = 0
or
R1 R3 = R2 R4 (5)
Therefore the general equation for bridge balance and zero potential difference between points B andD is
R1
R4= R2
R3(6)
Any small change in the resistance of the sensing grid will throw the bridge out of balance and canbe detected by a voltmeter.
When the bridge is set up so that the only source of imbalance is a resistance change in the gage(resulting from strain), then the output voltage becomes a measure of the strain. From Eq. (4), with asmall change in R1,
E = (R1 + �R1)R3 − R2 R4
[(R1 + �R1) + R2](R3 + R4)volts
Most Wheatstone bridge circuits are produced with all four arms serving as active strain gages.
Types of Resistance Strain Gages. Many different types of resistance strain gages have been de-veloped since the first bonded strain gage was introduced in 1936. Bonded gages have been usedwidely, but there have been numerous changes in technology, as described later, in the assembly ofstrain-gage sensors, notably as they are used in process-type pressure sensors and transducers. Thesealterations include bonded semiconductor strain gages and diffused semiconductor strain gages.

P1: xxx
3 September 1999 0:39 chap04combined.tex Chap04combined.sgm MH009v3(1999/07/12)
PROCESS VARIABLES—FIELD INSTRUMENTATION 4.61
FIGURE 17 Strain-gage patterns that have been used successfully. (a) For measurement of strain in adiaphragm, elements 1 and 4 are subjected to compressive radial strains, while elements 2 and 4 are subjectedto tensile tangential strains. (b) Rosette gage that measures srain in three directions simultaneously.
Bonded Foil Strain Gages. Serious commercial attention to the strain gage commenced in the mid-1950s, at which time foil strain gages were produced by a printed-circuit process or by being stampedfrom selected alloys that had been rolled into a thin foil. Foil thicknesses ranged from 0.0001 to 0.002inch (0.00254 to 0.00508 mm). The foil usually was heat-treated before use in order to optimizemechanical properties and the thermal coefficient of resistivity. For a given cross-sectional area, afoil conductor displays a large surface area. The large ratio of surface area to cross section providessuperior mechanical stability under prolonged strain and high-temperature conditions. The largesurface area also provides a good heat-transfer surface between grid and specimen and, therefore,high input-voltage levels are possible without developing severe temperature gradients across theinsulating matrix.
Photoetching permits the manufacture of sensing grids in virtually any two-dimensional pattern.Good practice is to develop a geometric pattern that provides maximum electrical and mechanicalefficiency from the sensing element. Some common configurations that have been used are shown inFig. 17.
Bonded Semiconductor Strain Gages. The principal difference between foil and semiconductorgages is the greater response of semiconductor gages to both strain and temperature. The largeresistance-versus-strain characteristic of a properly oriented semiconductor crystal is due primarilyto the piezoresistive effect. Gage behavior may be accurately described by
�R
R0=
(T0
T
)E(GF) +
(T0
T
)2
E2C2
where R0 = unstressed gage resistance at T (changes as T changes)�R = change in gage resistance from R0
T = temperature, KT0 = 298 K (24.9◦C)E = strain
GF, C2 = constants of particular gage in question
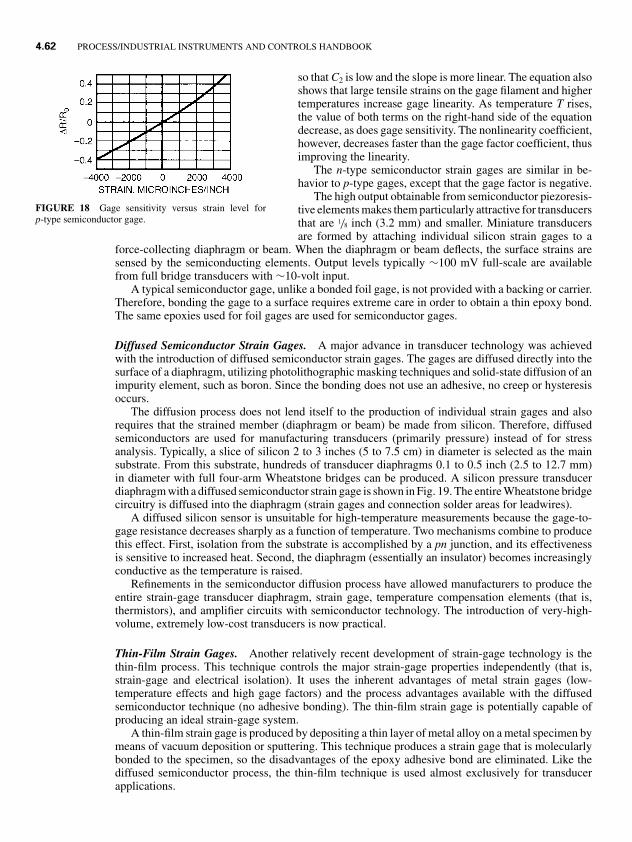
The resistance change due to strain is a parabola for high-resistivity p-type silicon. Pure materialof this resistivity is not used to produce gages because of this severe nonlinearity. As can be seenin the equation, the linearity can be improved by reducing the nonlinearity constant C2. Figure 18shows the behavior of a typical p-type semiconductor strain gage for a material that has been doped
P1: xxx
3 September 1999 0:39 chap04combined.tex Chap04combined.sgm MH009v3(1999/07/12)
4.62 PROCESS/INDUSTRIAL INSTRUMENTS AND CONTROLS HANDBOOK
FIGURE 18 Gage sensitivity versus strain level forp-type semiconductor gage.
so that C2 is low and the slope is more linear. The equation alsoshows that large tensile strains on the gage filament and highertemperatures increase gage linearity. As temperature T rises,the value of both terms on the right-hand side of the equationdecrease, as does gage sensitivity. The nonlinearity coefficient,however, decreases faster than the gage factor coefficient, thusimproving the linearity.
The n-type semiconductor strain gages are similar in be-havior to p-type gages, except that the gage factor is negative.
The high output obtainable from semiconductor piezoresis-tive elements makes them particularly attractive for transducersthat are 1/8 inch (3.2 mm) and smaller. Miniature transducersare formed by attaching individual silicon strain gages to a
force-collecting diaphragm or beam. When the diaphragm or beam deflects, the surface strains aresensed by the semiconducting elements. Output levels typically ∼100 mV full-scale are availablefrom full bridge transducers with ∼10-volt input.
A typical semiconductor gage, unlike a bonded foil gage, is not provided with a backing or carrier.Therefore, bonding the gage to a surface requires extreme care in order to obtain a thin epoxy bond.The same epoxies used for foil gages are used for semiconductor gages.
Diffused Semiconductor Strain Gages. A major advance in transducer technology was achievedwith the introduction of diffused semiconductor strain gages. The gages are diffused directly into thesurface of a diaphragm, utilizing photolithographic masking techniques and solid-state diffusion of animpurity element, such as boron. Since the bonding does not use an adhesive, no creep or hysteresisoccurs.
The diffusion process does not lend itself to the production of individual strain gages and alsorequires that the strained member (diaphragm or beam) be made from silicon. Therefore, diffusedsemiconductors are used for manufacturing transducers (primarily pressure) instead of for stressanalysis. Typically, a slice of silicon 2 to 3 inches (5 to 7.5 cm) in diameter is selected as the mainsubstrate. From this substrate, hundreds of transducer diaphragms 0.1 to 0.5 inch (2.5 to 12.7 mm)in diameter with full four-arm Wheatstone bridges can be produced. A silicon pressure transducerdiaphragm with a diffused semiconductor strain gage is shown in Fig. 19. The entire Wheatstone bridgecircuitry is diffused into the diaphragm (strain gages and connection solder areas for leadwires).
A diffused silicon sensor is unsuitable for high-temperature measurements because the gage-to-gage resistance decreases sharply as a function of temperature. Two mechanisms combine to producethis effect. First, isolation from the substrate is accomplished by a pn junction, and its effectivenessis sensitive to increased heat. Second, the diaphragm (essentially an insulator) becomes increasinglyconductive as the temperature is raised.
Refinements in the semiconductor diffusion process have allowed manufacturers to produce theentire strain-gage transducer diaphragm, strain gage, temperature compensation elements (that is,thermistors), and amplifier circuits with semiconductor technology. The introduction of very-high-volume, extremely low-cost transducers is now practical.
Thin-Film Strain Gages. Another relatively recent development of strain-gage technology is thethin-film process. This technique controls the major strain-gage properties independently (that is,strain-gage and electrical isolation). It uses the inherent advantages of metal strain gages (low-temperature effects and high gage factors) and the process advantages available with the diffusedsemiconductor technique (no adhesive bonding). The thin-film strain gage is potentially capable ofproducing an ideal strain-gage system.
A thin-film strain gage is produced by depositing a thin layer of metal alloy on a metal specimen bymeans of vacuum deposition or sputtering. This technique produces a strain gage that is molecularlybonded to the specimen, so the disadvantages of the epoxy adhesive bond are eliminated. Like thediffused semiconductor process, the thin-film technique is used almost exclusively for transducerapplications.

P1: xxx
3 September 1999 0:39 chap04combined.tex Chap04combined.sgm MH009v3(1999/07/12)
PROCESS VARIABLES—FIELD INSTRUMENTATION 4.63
FIGURE 19 Representative silicon pressure transducer diaphragm with diffused Wheatstonebridge circuit. Many diaphragms are produced from a single slice of silicon crystal. Thestrain-gage elements are situated to measure compressive radial strains and tensile tangentialstrains.
To produce thin-film strain-gage transducers, first an electrical insulation (such as a ceramic) isdeposited on the stressed metal member (diaphragm or beam). Next the strain-gage alloy is depositedon top of the isolation layer. Both layers may be deposited either by vacuum deposition or by sputtering.
In vacuum depositon, the material to be deposited is heated in a vacuum and vapor is emitted. Thevapor deposits on the transducer diaphragm in a pattern determined by substrate masks.
The sputtering technique also employs a vacuum chamber. With this method, the gage or insulatingmaterial is held at a negative potential and the target (transducer diaphragm or beam) is held at a positivepotential. Molecules of the gage or insulating material are ejected from the negative electrode by theimpact of positive gas ions (argon) bombarding the surface. The ejected molecules are acceleratedtoward the transducer diaphragm or beam and strike the target area with kinetic energy several ordersof magnitude greater than that possible with any other deposition method. This produces superioradherence to the specimen.
In order to obtain maximum bridge sensitivity (millivolt output) to minimize heating effects, and toobtain stability, the four strain gages, the wiring between the gages, and the balance and temperaturecompensation components are all integrally formed during the deposition process. This ensures thesame composition and thickness throughout.
The thin-film strain-gage transducer has many advantages over other types of strain-gage trans-ducers. The principal advantage is long-term stability. The thin-film strain-gage circuit is molecularlybonded to the specimen, and no organic adhesives are used which could cause drift with temperatureor stress creep. The thin-film technique also allows control of the strain-gage resistance value. Aresistance as high as 5000 ohms can be produced in order to allow increased input and output voltageswith low power consumption.

P1: xxx
3 September 1999 0:39 chap04combined.tex Chap04combined.sgm MH009v3(1999/07/12)
4.64 PROCESS/INDUSTRIAL INSTRUMENTS AND CONTROLS HANDBOOK
Strain-Gage Bridge Correction Circuits. When static strains or the static component of a varyingstrain are to be measured, the most convenient circuit is the Wheatstone bridge, previously shown inFig. 16. The bridge is balanced (E = 0) when
R1
R4= R2
R3
Now consider a bridge in which all four arms are separate strain gages. Assume that the bridge isinitially balanced, so that R1R3 = R2R4 and E = 0. A strain in the gages will cause a change in eachvalue of resistance R1, R2, R3, and R4 by incremental amounts �R1, �R2, �R3, and �R4, respectively.The voltage output �E of the bridge can be obtained from
E = R1 R3 − R2 R4
(R1 + R2)(R3 + R4)volts
which becomes
�E = (R1 + �R1)(R3 + �R3) − (R2 + �R2)(R4 + �R4)
[(R1 + �R1) + (R2 + �R2)][(R3 + �R3) + (R4 + �R4)]volts
After considerable simplification, this becomes
E = R2/R1
(1 + R2/R1)2
(�R1
R1− �R2
R2+ �R3
R3− �R4
R4
)volts
This latter equation shows that if all four gages experience the same strain, the resistance changeswill cancel out and the voltage change �E will equal zero. On the other hand, if gages R1 and R3 arein tension (�R1 and �R3 positive) and gages R2 and R4 are in compression (�R2 and �R4 negative),then the output will be proportional to the sum of all the strains measured separately. All four-armWheatstone bridge transducers are wired to give two gages in tension and two gages in compression.An example of a four-gage setup for the diaphragm of a pressure transducer is shown in Fig. 20. Thisdesign takes full advantage of the tensile tangential strains developed at the center of the diaphragmand the compressive radial strains present at the edge.
Another advantage of using a four-gage bridge, besides the increased output, is the effect on thetemperature sensitivity. If the gages are located close together, as on a pressure transducer diaphragm,they will be subjected to the same temperature. Therefore the resistance change due to temperature will
FIGURE 20 Representative strian-gage positions on a pressure diaphragm. Orientationstake advantage of the stress distriubtion. The gages are wired into a Wheatstone bridgewith two gages in tension and two in compression.

P1: xxx
3 September 1999 0:39 chap04combined.tex Chap04combined.sgm MH009v3(1999/07/12)
PROCESS VARIABLES—FIELD INSTRUMENTATION 4.65
be the same for each arm of the Wheatstone bridge. If the gage resistance changes due to temperatureare identical, the temperature effects will all cancel out and the output voltage of the circuit will notincrease or decrease due to temperature.
The output voltage of the Wheatstone bridge is expressed in millivolts output per volt input. Forexample, a transducer rated at 3.0 mV/V at 500 psi (∼73 kPa) will have an output signal of 30.00 mVfor a 10-volt input at 500 psi (∼73 kPa) or 36.00 mV for a 12-volt input. Any variation in the powersupply will directly change the output of the bridge. Generally, power supply regulation should be0.05 percent or better.
In production the four strain gages in a Wheatstone bridge never come out to be exactly equalfor all conditions of strain and temperature (even in the diffused semiconductor process). Thereforevarious techniques have been developed to correct the differences in the individual strain gages and tomake the strain-gage bridge easier to use with electronic instrumentation. Four main values normallyneed adjusting (Fig. 21): (1) electrical bridge imbalance, (2) balance shift with temperature, (3) spanor sensitivity shift or bridge output with temperature, and (4) standardization of the bridge, output to agiven millivolts-per-volt value. other transducer characteristics such as accuracy, linearity, hysteresis,acceleration effect, and drift are part of the transducer element design (beam or diaphragm) and cannotbe corrected after the strain-gage bridge has been produced.
Figure 21 shows the circuit diagram of a Wheatstone bridge circuit with adjusting resistors. Onecorner of the bridge (points D and E ) remains “open,” so that the bridge can be adjusted electrically.This means that five leads come from the four gages. The zero-balance adjustment compensates forthe electrical imbalance in the bridge caused by unequal resistances of the strain gages. Depending onwhich leg is unbalanced, Rza is placed between points E and F or between points D and F. The zerobalance changes with temperature, and Rzc is inserted inside the bridge to correct for this change. Asmall piece of nickel wire is selected to provide a resistance change opposite the resistance change of
FIGURE 21 Strain-gage transducer circuit with four active strain-gage elements (R1, R2, R3, and R4). Balance,sensitivity, and thermal compensation resistors are also shown.

P1: xxx
3 September 1999 0:39 chap04combined.tex Chap04combined.sgm MH009v3(1999/07/12)
4.66 PROCESS/INDUSTRIAL INSTRUMENTS AND CONTROLS HANDBOOK
FIXEDRESISTOR
(R1)
FIXEDRESISTOR
(R2)
GAGE "A"
GAGE "B"
(Ra)
(Rb)
E0
POWER INPUT(AC OR DC)
FIGURE 22 Wheatstone bridge circuit utilizing two straingages.
the bridge. Rsc is also a temperature thermistor or sensor whichchanges resistance with temperature to adjust the excitation tothe bridge. The values for Rzc and Rsc have to be selected by run-ning each bridge over its desired temperature range [usually−65 to +300◦F (−54 to +149◦C)]. Rsa is a non-temperature-sensitive resistor, and it is used to adjust the output to a precisemillivolts-per-volt value once all the balance and temperature-sensitive resistors have been inserted within the bridge. Theuser of transducers is not affected because all this circuitryis contained within the transducer and does not interfere withconnections to amplifiers, power supplies, or computers.
A Wheatstone bridge can also be used in applications thatrequire only one or two active strain gages. To compensatefor temperature in two-gage applications, the gages must belocated in adjacent arms of the bridge, as shown in Fig. 22.In placing gages, one must only recognize that the bridge is
unbalanced in proportion to the difference in the strains of the gages located in adjacent arms and inproportion to the sum of the strains of gages located in opposite arms.
Electronics for Strain-Gage Transducers and Transmitters. The full-scale output of a typicalbonded-foil, four-active-element strain-gage bridge with all compensating and adjusting resistorsconnected is ∼20 to 30 mV at 10-volt excitation. An amplifier must be used to obtain the 0- to 5-voltor 4- to 20-mA outputs used in control instrumentation. As a result of the advances in integratedcircuitry, many transducers now have amplifiers that are internally installed within the transducerbody (Fig. 23).
High-gain, low-noise, instrumentation-quality differential operational amplifiers such as the OP-07 make amplification of the strain-gage bridge output for standard 0- to 5-volt transducers and 4-
FIGURE 23 Pressure transducer (diaphragm-beam design) that compares measured pressureto atmospheric (reference) pressure. Welded stainless-steel diaphragms permit use in corrosiveenvironments because strain gages are in environmentally protected chamber. (Sensotec.)

P1: xxx
3 September 1999 0:39 chap04combined.tex Chap04combined.sgm MH009v3(1999/07/12)
PROCESS VARIABLES—FIELD INSTRUMENTATION 4.67
to 20-mA transmitters reliable and easy. These integrated-circuit amplifiers have a high common-mode rejection ratio and are thus well suited for use with Wheatstone bridge circuits. They are alsoinherently well compensated in order to deliver a constant output irrespective of temperature changes.The operational amplifiers used in instruments have controllable gains and zero-balance adjustments.Since the offset of the instrumentation channel’s output is equal to the sum of the offsets in the bridgeand in the amplifier, the combined offset can be adjusted at the amplifier so that the channel delivers0 volts at zero stimulus (pressure, load, torque, and so on) for 0- to 5-volt output transducers or 4-mAat zero stimulus for 4- to 20-mA output transmitters.
The shear-web-element load cell is of a somewhat different configuration. This design is used inmaking high-capacity [50,000-lb (22,650-kg)] load cells for industrial weighing, crane scales, and soon. A shear web connects an outer, stationary hub to an inner, loaded hub. Strain gages detect theshear strain produced in the web. The large diameter of a very high-capacity shear element requiresthat the strain be measured at more than one location. Note the three webs in Fig. 24. This is commonpractice in all types of large transducer elements in order to obtain an average of the total strains onthe element and to eliminate errors caused by minor off-center balancing. The strain gages are wiredso that the user sees only one 350-ohm bridge.
LOAD
SHEAR WEB
PROTECTIVECOVER
T1C1} STRAIN
GAGES
MOUNTINGSURFACE
TOP VIEW WITH PROTECTIVE COVER REMOVED
A
C5 C4
C6C1
T6T1 T2
T3C3
C2SHEARWEB (3)
A
T5T4
C1
C3
C5 T2
T4
T6
T1T3
T5 C2
V
C4C6
+
E
−
FIGURE 24 Pancake (shear-web) load cell. Each arm of the Wheatstone bridge circuit contains onestrain gage from each of the three shear webs. The microstrains from the three webs are added togetherin one bridge circuit to determine the load. (Sensotec.)

P1: xxx
3 September 1999 0:39 chap04combined.tex Chap04combined.sgm MH009v3(1999/07/12)
4.68 PROCESS/INDUSTRIAL INSTRUMENTS AND CONTROLS HANDBOOK
HIGHFREQUENCYOSCILLATOR
C1 C2 C3
L1 L2
LOOSELY COUPLED RECTIFIER
OUTPUT
PRESSURETRANSDUCER
FIGURE 25 Schematic of tuned resonant circuit used in some capacitivepressure transducers.
Capacitive Pressure Transducers
In a traditional capacitance-type (capacitive) transducer, a measuring diaphragm (elastic element)moves relative to one or two fixed plates. Changes in capacitance are detected by an oscillator or bridgecircuit. Generally, capacitive transducers are of low mass and high resolution, and they have goodfrequency response. Limitations have included a requirement for sophisticated signal conditioning,some sensitivity to temperature, and the effects of stray noise on sensor leads. As will be pointed out,much research and development during the past few years has gone forward to improve capacitivetransducer performance—and generally with excellent results. These improvements largely have beenmade by way of testing and substituting new materials and through taking advantage of increasingingenuity in the design and miniaturization of electronic circuitry, notably in the increasing use ofmicroprocessors.
Transducer design concentration has centered on two classes of error sources. (1) Deficienciessuch as in long-term stability, that is, essentially those error sources that cannot be corrected by thebuilt-in electronics. Improved answers to these error sources have been derived essentially by testingand utilizing new materials as, for example, micromachined silicon, ceramics, quartz, and sapphirewhich, by their nature, exhibit minimal hysteresis. (2) Deficiencies that are amenable to improvementby electronic measures, including signal conditioning, calibration, and error self-diagnosis.
FIGURE 26 Response of resonant circuit to constant fre-quency shown as a function of circuit capacity.
In a typical capacitive pressure transducer, as pressure is applied and changes, the distance betweentwo parallel plates varies—hence altering the electric capaci-tance. This capacitive change can be amplified and used to op-erate into phase-, amplitude-, or frequency-modulated carriersystems. A frequency -modulated system using a tuned reso-nant circuit is shown in simple form Fig. 25. In this electriccircuit, the capacitance C3 is part of a tuned resonant circuitL 2C2C3. L1C1 forms part of a stable high-frequency oscilla-tor circuit. The tuned circuit L 2C2C3 is loosely coupled to thecircuit L1C1. The high-frequency potential induced in circuitL 2C2C3 is rectified, and the dc output current of the rectifier isindicated on a microammeter. The response of the tuned circuitL 2C2C3 to a constant frequency is shown in Fig. 26 as a functionof the capacitance C2 + C3 of this circuit. Peak output occursat point A when the circuit is tuned to resonate at the oscilla-tor frequency. This circuit is tuned to its operating point B byincreasing capacitor C2 until the rectifier meter reads approxi-mately 70 percent of maximum. Any small change in pressuretransducer capacitance C3, due to pressure on the diaphragm,affects the response of the circuit according to Fig. 26.
In order to eliminate the effect of cable capacity between the transducer C3 and the tuned circuitL 2C2, a circuit of the type shown in Fig. 27 can be used. In this circuit, a coil L3 is built as an integral partof the capacitive-transducer assembly. The coil L3 is connected in parallel with the transducer capacityC3 to form a tuned circuit with a resonant frequency (for example, 600 kHz). The tuned circuit L3C3

P1: xxx
3 September 1999 0:39 chap04combined.tex Chap04combined.sgm MH009v3(1999/07/12)
PROCESS VARIABLES—FIELD INSTRUMENTATION 4.69
GANG CONDENSERDETECTOR-TUNED CIRCUIT
ELECTRON-COUPLED
OSCILLATOR
DIODEDETECTOR
VOLTAGEAMPLIFIER
DISPLAY
LINK COUPLING
PRESSURETRANSDUCER
L4
L5
L1 L2
C2C1
L3
C3
FIGURE 27 One type of circuit used to eliminate effect of cable capacity betweentransducer C1 and tuned circuit L 2C2.
is close-coupled to the tuned circuit L 2C2 by means of the link coils L4 and L5, which are connectedby means of a low-impedance (70-ohm) untuned cable. The change in cable capacity, such as thatproduced by vibration, is negligible when reflected into the high-impedance tuned circuit. In this way,long cables can be used between the transducer and the electronic unit. The tuning characteristics ofa link-coupled circuit are shown in Fig. 28. The operating range is the linear section noted midwaybetween the maximum and minimum readings obtained with changing capacity.
DECREASING CAPACITY
MAXIMUM
LINEAR SECTION
MINIMUM
DIO
DE
OU
TP
UT
VO
LTA
GE
FIGURE 28 Tuning characteristic of a link-coupled cir-cuit.
A phase-modulated carrier system can be used in combina-tion with transducers that incorporate a radio-frequency match-ing transformer that is tuned with the fixed condenser plate andstray capacitances in the pickup to approximately the oscillatorfrequency and is properly matched to the transducer connect-ing coaxial cable. When pressure is applied to the diaphragm,the increase in capacity lowers the resonant frequency of thecircuit. The resulting change in reactance is coupled back tothe indicator by a suitable transmission line, producing a phasechange in the discriminator. This, in turn, produces an outputvoltage that is a function of the pressure on the diaphragm. Thevoltage can be indicated or recorded by the usual methods.
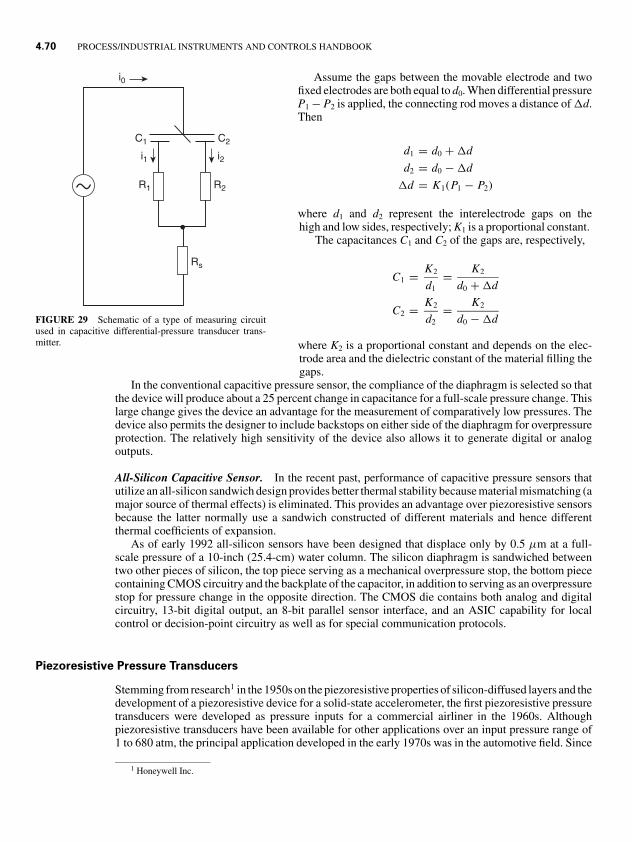
The measuring circuit of a capacitive differential-pressuretransducer transmitter is shown schematically in Fig. 29. Inthis system two process diaphragms (high side and low side)are mechanically attached to a connecting rod. In the middle
of the connecting rod, the movable electrode is attached and held in position by a spring diaphragm.The differential pressure is balanced by the restoring force of the spring diaphragm. Hence the springdiaphragm represents the measuring element. When applying a differential pressure on the system,the movable electrode is shifted and the distances d1 and d2 to the fixed electrodes are changedsimultaneously. As a result of the change in distance between the fixed and movable electrodes,the capacitances of the differential capacitor are also changed. This change is amplified electron-ically and transduced to a 4- to 20-mA dc output signal directly proportional to the differentialpressure.
P1: xxx
3 September 1999 0:39 chap04combined.tex Chap04combined.sgm MH009v3(1999/07/12)
4.70 PROCESS/INDUSTRIAL INSTRUMENTS AND CONTROLS HANDBOOK
i0
i1 i2
C1
R1 R2
C2
Rs
FIGURE 29 Schematic of a type of measuring circuitused in capacitive differential-pressure transducer trans-mitter.
Assume the gaps between the movable electrode and twofixed electrodes are both equal to d0. When differential pressureP1 − P2 is applied, the connecting rod moves a distance of �d.Then
d1 = d0 + �d
d2 = d0 − �d
�d = K1(P1 − P2)
where d1 and d2 represent the interelectrode gaps on thehigh and low sides, respectively; K1 is a proportional constant.
The capacitances C1 and C2 of the gaps are, respectively,
C1 = K2
d1= K2
d0 + �d
C2 = K2
d2= K2
d0 − �d
where K2 is a proportional constant and depends on the elec-trode area and the dielectric constant of the material filling thegaps.
In the conventional capacitive pressure sensor, the compliance of the diaphragm is selected so thatthe device will produce about a 25 percent change in capacitance for a full-scale pressure change. Thislarge change gives the device an advantage for the measurement of comparatively low pressures. Thedevice also permits the designer to include backstops on either side of the diaphragm for overpressureprotection. The relatively high sensitivity of the device also allows it to generate digital or analogoutputs.
All-Silicon Capacitive Sensor. In the recent past, performance of capacitive pressure sensors thatutilize an all-silicon sandwich design provides better thermal stability because material mismatching (amajor source of thermal effects) is eliminated. This provides an advantage over piezoresistive sensorsbecause the latter normally use a sandwich constructed of different materials and hence differentthermal coefficients of expansion.
As of early 1992 all-silicon sensors have been designed that displace only by 0.5 µm at a full-scale pressure of a 10-inch (25.4-cm) water column. The silicon diaphragm is sandwiched betweentwo other pieces of silicon, the top piece serving as a mechanical overpressure stop, the bottom piececontaining CMOS circuitry and the backplate of the capacitor, in addition to serving as an overpressurestop for pressure change in the opposite direction. The CMOS die contains both analog and digitalcircuitry, 13-bit digital output, an 8-bit parallel sensor interface, and an ASIC capability for localcontrol or decision-point circuitry as well as for special communication protocols.
Piezoresistive Pressure Transducers
Stemming from research1 in the 1950s on the piezoresistive properties of silicon-diffused layers and thedevelopment of a piezoresistive device for a solid-state accelerometer, the first piezoresistive pressuretransducers were developed as pressure inputs for a commercial airliner in the 1960s. Althoughpiezoresistive transducers have been available for other applications over an input pressure range of1 to 680 atm, the principal application developed in the early 1970s was in the automotive field. Since
1 Honeywell Inc.

P1: xxx
3 September 1999 0:39 chap04combined.tex Chap04combined.sgm MH009v3(1999/07/12)
PROCESS VARIABLES—FIELD INSTRUMENTATION 4.71
BURIEDPIEZORESISTOR
GOLDCONTACT
WIRELEAD
HERMETICSEAL
TUBE
ETCHEDCAVITY
THIN SILICONDIAPHRAM
FIGURE 30 Cross section of piezoresistive sensing element with wire leads bonded tometal contacts.
that time, uses for piezoresistive pressure transducers in process control and industrial applicationshave increased.
The sensing element consists of four nearly identical piezoresistors buried in the surface of a thin,circular silicon diaphragm. Gold pads attached to the silicon diaphragm surface provide connectionsto the piezoresistors and serve as pads for probe-type resistance measurements or for bonding of wireleads. The thin diaphragm is formed by chemically etching a circular cavity into the surface oppositethe piezoresistors. The unetched portion of the silicon slice provides a rigid boundary constraint for thediaphragm and a surface for mounting to some other member. A cross-sectional view of the sensingelement with wire leads bonded to the metal contacts is shown in Fig. 30.
FIGURE 31 Full-bridge arangement of piezoresistivetransducer. R +� R and R -� R represent actual resistorvalues at applied pressure. R represents resistor value forundeflected diaphragm (P = 0) where all four resistors arenearly equal in value. �R represents change in resistancedue to applied pressure. All four resistors will change byapproximately the same value. Note that two resistors in-crease and two decrease, depending on their orientationwith respect to the crystalline direction of the silicon ma-terial.
Pressure causes the thin diaphragm to bend, inducing astress or strain in the diaphragm and also in the buried resis-tor. The resistor values will change, depending on the amountof strain they undergo, which depends on the amount of pres-sure applied to the diaphragm. Hence a change in pressure(mechanical input) is converted to a change in resistance (elec-trical output). The sensing element converts energy from oneform to another. The resistor can be connected to either a half-bridge or a full Wheatstone bridge arrangement. For pressureapplied to the diaphragm using a full bridge, the resistors cantheoretically be approximated as shown in Fig. 31 (nonam-plified units). The signal voltage generated by the full-bridgearrangement is proportional to the amount of supply voltageV {cc} and the amount of pressure applied, which generatesthe resistance change �R.
A half-bridge configuration used in a signal-conditionedversion of the piezoresistive pressure transducer is shown inFig. 32.
Among the pressure ranges of the transducers most fre-quently used are 0 to 1, 0 to 15, 3 to 15, 0 to 30, 0 to 100,and 0 to 250 psi (1 psi ≈ 6.9 kPa). Repeatability and hystere-sis effects are typically less than 0.1 percent of full-scale, andcombined linearity and hysteresis do not exceed ±1 percent offull-scale output. The operating temperature range for standardunits is from −40 to 125◦C (−40 to 252◦F ).
P1: xxx
3 September 1999 0:39 chap04combined.tex Chap04combined.sgm MH009v3(1999/07/12)
4.72 PROCESS/INDUSTRIAL INSTRUMENTS AND CONTROLS HANDBOOK
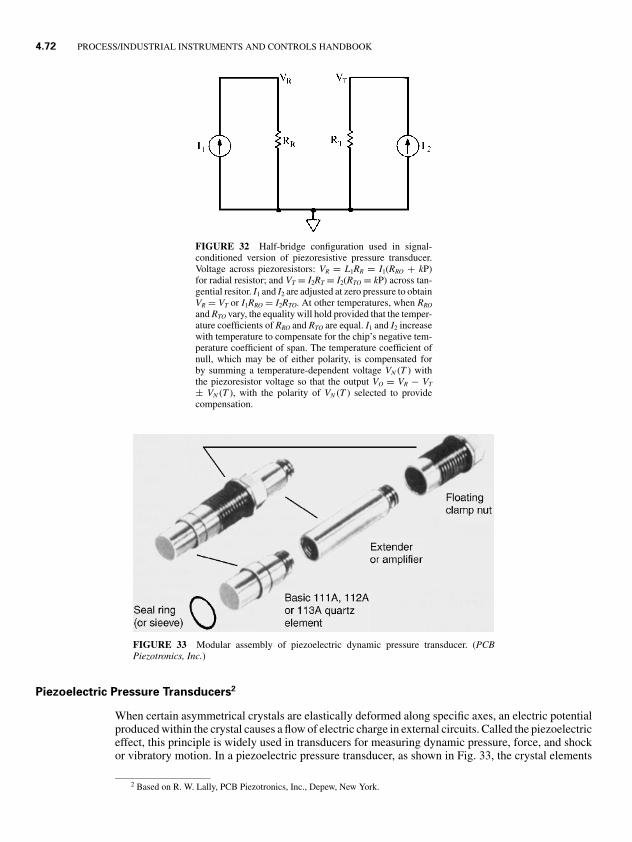
FIGURE 32 Half-bridge configuration used in signal-conditioned version of piezoresistive pressure transducer.Voltage across piezoresistors: VR = L1RR = I1(RRO + kP)for radial resistor; and VT = I2RT = I2(RTO = kP) across tan-gential resitor. I1 and I2 are adjusted at zero pressure to obtainVR = VT or I1RRO = I2RTO. At other temperatures, when RRO
and RTO vary, the equality will hold provided that the temper-ature coefficients of RRO and RTO are equal. I1 and I2 increasewith temperature to compensate for the chip’s negative tem-perature coefficient of span. The temperature coefficient ofnull, which may be of either polarity, is compensated forby summing a temperature-dependent voltage VN (T ) withthe piezoresistor voltage so that the output VO = VR − VT
± VN (T ), with the polarity of VN (T ) selected to providecompensation.
FIGURE 33 Modular assembly of piezoelectric dynamic pressure transducer. (PCBPiezotronics, Inc.)
Piezoelectric Pressure Transducers2
When certain asymmetrical crystals are elastically deformed along specific axes, an electric potentialproduced within the crystal causes a flow of electric charge in external circuits. Called the piezoelectriceffect, this principle is widely used in transducers for measuring dynamic pressure, force, and shockor vibratory motion. In a piezoelectric pressure transducer, as shown in Fig. 33, the crystal elements
2 Based on R. W. Lally, PCB Piezotronics, Inc., Depew, New York.

P1: xxx
3 September 1999 0:39 chap04combined.tex Chap04combined.sgm MH009v3(1999/07/12)
PROCESS VARIABLES—FIELD INSTRUMENTATION 4.73
FIGURE 34 Piezoelectric crystal circuit. (PCB Piezotronics, Inc.)
form an elastic structure which functions to transfer displacement caused by force into an electricsignal proportional to the pressure applied. Pressure acting on a flush diaphragm generates the force.
Piezoelectric pressure transducers historically have used two different types of crystals: (1) naturalsingle crystals, such as quartz and tourmaline, and (2) synthetic polycrystalline ceramic materials, suchas barium titanate and lead zirconate. With the relatively recent development of artificially culturedquartz crystals, the foregoing distinction is no longer clear-cut.
Cultured quartz has the advantage of being readily available and reasonably priced. Near-perfectelasticity and stability, combined with an insensitivity to temperature, make quartz an ideal transduc-tion element. Ultrahigh insulation resistance and low leakage allow static calibration, accounting forthe popularity of quartz in pressure transducers.
Natural tourmaline, because of its rigid, anisotropic nature, offers submicrosecond response inpressure-bar-type blast transducers. Artificial ceramic piezoelectric crystals and electret (permanentlypolarized dielectric material, the analog of a magnet) materials are readily formed into complianttransducer structures for generating and measuring sound pressure.
The charge signal from a piezoelectric pressure transducer is usually converted into a voltage-typesignal by means of a capacitor, according to the law of electrostatics: E = Q/C , where E is the voltagesignal, Q is the charge, and C is the capacitance. This circuit is shown in Fig. 34.
In response to a step-function input, the charge signal stored in the capacitor will exponentiallyleak off through the always finite insulation resistance of the circuit components, precluding staticmeasurements. The initial leakage rate is set by the circuit discharge time constant R × C, where R isthe leakage resistance value, which can be as high as 108 M� in quartz crystals.
Because of the automatic rezeroing action of the discharge circuit, piezoelectric sensors measurerelative pressure, sometimes denoted as psir. They measure pressure relative to the initial level fortransient events and relative to the average level for repetitive phenomena. Sometimes the slow actionof these circuits is mistaken for zero drift by impatient operators.
To prevent the charge signal from quickly leaking off through the recorder or oscilloscope inputresistance, a special isolation amplifier is required between the crystal and the recorder. If the charge-converting capacitance is located at the input of this isolation amplifier, the amplifier is called a voltageamplifier. If the capacitor is in the feedback path, it is called a charge amplifier. Amplifiers are furtherclassified as electrostatic (dc-coupled) or vibration (ac-coupled). The ac-coupling circuitry behavessimilarly to the sensor discharge circuit.
The high-frequency response of piezoelectric sensor systems depends on the resonant behavior ofthe sensor’s mechanical structure, or on electronic low-pass filters in the sensor, amplifier, or recorder.
The advent of microelectronics and charge-operated field-effect transistors (JFET and MOSFET)is continuing to change the design of piezoelectric sensors profoundly. The current practice is topackage the isolation amplifier and signal-conditioning circuitry inside the sensor. These integratedcircuit piezoelectric (ICP) sensors with built-in microelectronics, which operate over a simple two-wire cable, are called “smart” sensors.
To eliminate spurious signals caused by environmental effects, such as temperature and motion,the mechanical structures of some piezoelectric pressure sensors are quite sophisticated. A typicalacceleration-compensated pressure sensor containing an integrated accelerometer to cancel out motion

P1: xxx
3 September 1999 0:39 chap04combined.tex Chap04combined.sgm MH009v3(1999/07/12)
4.74 PROCESS/INDUSTRIAL INSTRUMENTS AND CONTROLS HANDBOOK
FIGURE 35 Acceleration-compensated quartz pressuresensor with built-in microelectronic unity-gain isolationamplifier. (PCB Piezotronics, Inc.)
signals is shown in Fig. 35. Durable conformal coatings ofthe sensor case and diaphragm provide electrical and thermalinsulation. Hermetic seals are electron-beam welded.
Piezoelectric pressure sensors offer several advantages formeasuring dynamic pressures. They are generally small in size,lightweight, and very rugged. One transducer may cover a mea-suring range of greater than 10,000:1 and a frequency rangefrom less than 1 hertz to hundreds of kilohertz with little orno phase shift (time delay). As mentioned previously, piezo-electric sensors cannot measure static or absolute pressures formore than a few seconds, but this automatic elimination of staticsignal components allows unattended, drift-free operation.
Because of their unusual ruggedness, piezoelectric pressuresensors are widely used in difficult applications, such as ballis-tics, blasts, explosions, internal combustion, fuel injection, flowinstabilities, high-intensity sound, and hydraulic or pneumaticpulsations—in connection with problems which may be en-countered in connection with guns, shock tubes, closed bombs,rocket motors, internal-combustion engines, pumps, compres-sors, pipelines, mufflers, and oil exploration imploders.
Resonant-Wire Pressure Transducers3
A wire under tension is caused to oscillate at its resonant (or natural) frequency, and changes in pressureare converted to changes in this frequency. The application of an oscillating wire as a primary meansof detecting force is based on fundamental principles initially outlined by Rayleigh’s equations for abar vibrating in a vacuum. Holst et al. (1979) modified Rayleigh’s equations to fit an oscillating wire.
Their approximation of the resonant frequency fn of a wire in a vacuum is
fn = 1
2l
√T
ρ A+ (12 + π2)
EK2
ρl2+ 1
l
√EK2
ρ
where ρ = density of wire materialA = cross-sectional area of wireT = tension in wireE = modulus of elasticity of wire materialK = radius of gyrationl = length of wire
Practical use of a resonant-wire pressure sensor requires that the wire be in a nonvacuum environ-ment. Fairly rigorous modifications and refinements of the prior equation were made by Holst et al.(1979) to account for this. Simplifying and assuming that length, density, and area remain constantin the range of tension applied to the wire, the result of these modifications can be approximated as
fn ∝ T 2
A representative resonant-wire sensor for differential pressure or liquid-level measurement isshown schematically in Fig. 36; a resonant-wire sensor for measuring gage pressure is shown schemat-ically in Fig. 37. This principle also is used in connection with liquid-level measurement. A blockdiagram of the electronic circuitry of a resonant-wire pressure transducer is presented in Fig. 38.
3 Based on W. H. Burtt, The Foxboro Company (a Siebe Company), Foxboro, Massachusetts.

P1: xxx
3 September 1999 0:39 chap04combined.tex Chap04combined.sgm MH009v3(1999/07/12)
PROCESS VARIABLES—FIELD INSTRUMENTATION 4.75
FIGURE 36 Schematic diagram of differential-pressure sensor that utilizes the resonant-wire principle.A wire under tension is located in the field of a permanent magnet. The wire is an integral part of anoscillator circuit that causes the wire to oscillate at its resonant frequency. One end of the wire is connectedto the closed end of a metal tube, which is fixed to the sensor body by an electrical insulator. The otherend of the wire is connected to the low-pressure diaphragm and loaded in tension by a preload spring.The spaces between the diaphragms and the backup plates, the fluid transfer port, and the metal tube arefilled with fluid. An increasing pressure on the high-pressure diaphragm tends to move the diaphragmtoward its backup plate. The fluid thus displaced moves through the fluid transfer port and tends to pushthe low-pressure diaphragm away from its backup plate. This increases the tension on the wire, raising itsresonant frequency, and increasing the output signal of the transducer. Overrange protection for the wire isprovided by an overrange spring (not shown) that is selected to limit the maximum tension on the wire toabout two-thirds of its yield strength. The diaphragms are protected from overrange by the backup plates.(Foxboro.)
FIGURE 37 Schematic diagram of resonant-wire sensor for measuring gage pressure. (Foxboro.)
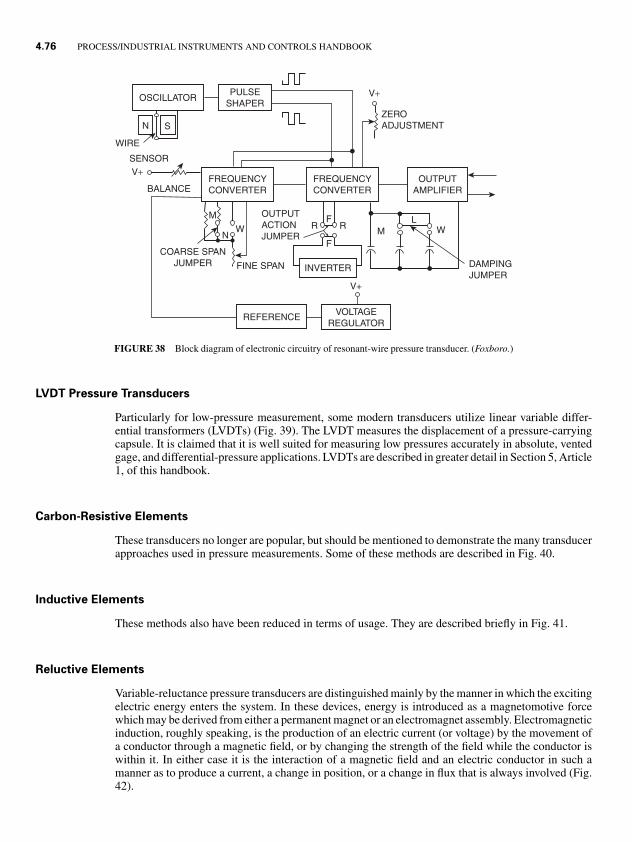
P1: xxx
3 September 1999 0:39 chap04combined.tex Chap04combined.sgm MH009v3(1999/07/12)
4.76 PROCESS/INDUSTRIAL INSTRUMENTS AND CONTROLS HANDBOOK
OSCILLATORPULSE
SHAPER
N S
WIRE
SENSORV+
FREQUENCYCONVERTER
FREQUENCYCONVERTER
OUTPUTAMPLIFIER
LWM
V+
INVERTER
VOLTAGEREGULATOR
REFERENCE
COARSE SPANJUMPER FINE SPAN
W
M F
F
R RN
ZEROADJUSTMENT
BALANCE
V+
OUTPUTACTIONJUMPER
DAMPINGJUMPER
FIGURE 38 Block diagram of electronic circuitry of resonant-wire pressure transducer. (Foxboro.)
LVDT Pressure Transducers
Particularly for low-pressure measurement, some modern transducers utilize linear variable differ-ential transformers (LVDTs) (Fig. 39). The LVDT measures the displacement of a pressure-carryingcapsule. It is claimed that it is well suited for measuring low pressures accurately in absolute, ventedgage, and differential-pressure applications. LVDTs are described in greater detail in Section 5, Article1, of this handbook.
Carbon-Resistive Elements
These transducers no longer are popular, but should be mentioned to demonstrate the many transducerapproaches used in pressure measurements. Some of these methods are described in Fig. 40.
Inductive Elements
These methods also have been reduced in terms of usage. They are described briefly in Fig. 41.
Reluctive Elements
Variable-reluctance pressure transducers are distinguished mainly by the manner in which the excitingelectric energy enters the system. In these devices, energy is introduced as a magnetomotive forcewhich may be derived from either a permanent magnet or an electromagnet assembly. Electromagneticinduction, roughly speaking, is the production of an electric current (or voltage) by the movement ofa conductor through a magnetic field, or by changing the strength of the field while the conductor iswithin it. In either case it is the interaction of a magnetic field and an electric conductor in such amanner as to produce a current, a change in position, or a change in flux that is always involved (Fig.42).

P1: xxx
3 September 1999 0:39 chap04combined.tex Chap04combined.sgm MH009v3(1999/07/12)
PROCESS VARIABLES—FIELD INSTRUMENTATION 4.77
FIGURE 39 Sectional view of low-pressure LVDT-type transducer. Applicable pressureranges are from as low as 2 inches (50 mm) of water to 100 psi (7 bars) full-scale. Typicalapplications include climate control and energy management systems, measurement of liquidlevels in bulk storage tanks and closed pressure vessels. The unit incorporates a NiSpan Ccapsule, which offers low hysteresis and constant scale factor with temperature variation.Deflection of the capsule when pressurized is measured by an LVDT displacement sensorwhose core is directly coupled to the capsule. The electrical output of the LVDT is directlyproportional to core motion, which, in turn, is proportional to pressure applied to the capsule.(Lucas Shaevitz.)
Optical Pressure Transducers
Over many years, optical methods have been used to measure the movement of diaphragms, bellows,or other summing elements in pressure sensors (Figs. 43 and 44). A very recent (1992) fiber-opticpressure transducer is described in Section 7, Article 4, of this handbook.
VACUUM MEASUREMENTby Z. C. Dobrowolski*
Subatmospheric pressure usually is expressed in reference to perfect vacuum or absolute zero pressure.Like absolute zero temperature (the concept is analogous), absolute zero pressure cannot be achieved,but it does provide a convenient reference datum. Standard atmospheric pressure is 14.695 psi absolute,30 inches of mercury absolute, or 760 mmHg of density 13.595 g/cm3 where acceleration due to gravityis g = 980.665 cm/s2. 1 mmHg, which equals 1 Torr, is the most commonly used unit of absolute
* (Deceased). Formerly Chief Development Engineer, Kinney Vacuum Company (a Unit of General Signal), Cannon,Massachusetts.

P1: xxx
3 September 1999 0:39 chap04combined.tex Chap04combined.sgm MH009v3(1999/07/12)
4.78 PROCESS/INDUSTRIAL INSTRUMENTS AND CONTROLS HANDBOOK
RESISTANCEELEMENT
RESISTANCEELEMENT
BOURDONTUBE
PRESSURE
PRESSURE
PRESSURE PRESSURE
PRESSUREDIAPHRAGM
BELLOWS
RESISTANCECOILS
RESISTANCEELEMENT
CONDUCTINGFLUID
CALIBRATEDSPRING
(a)
(e) (f) (g)
(b) (c) (d)
APPLIED PRESSURE
DIAPHRAGM
CARBON GRANULES
FORCE
CARBONDISKS
CARBONSTACKS
BELLOWSPRESSURE
FIGURE 40 Group of resistive pressure transducers used for many years. Illustrations are highly schematic andessentially of historic interest. Other approaches have been miniaturized through the application of solid-state electronics.(a) Bourdon tube. (b) Diaphragm. (c) Bellows. (d ) Differential coil. (e) Carbon pile. (f ) Stacked carbon disk. (g) Carbonstacks with bellows coupling.
FIGURE 41 Various forms of inductive elements that are or have been used in pressure transducer de-signs. (a) Variable-inductance unit. (b) Inductance-ratio element. (c) Mutual-inductance element. (d ) Phaserelationship in mutual-inductance element.

P1: xxx
3 September 1999 0:39 chap04combined.tex Chap04combined.sgm MH009v3(1999/07/12)
PROCESS VARIABLES—FIELD INSTRUMENTATION 4.79
TABLE 5 Range of Operation of Major Vacuum Gages
Principle Gage Type Range, Torr
Direct reading Force measuring:Bourdon, bellows, manometer (oil and mercury), 760−10−6
McLeod capacitance (diaphragm) 760 × 10−6
Indirect reading Thermal conductivity:Thermocouple (thermopile) 10–10−3
Pirani (thermistor) 10–10−4
Molecular friction 10−2–10−7
Ionization:Hot filament 10–10−10
Cold cathode 10−2–10−15
MOVING ARMATURE
OUTPUT
N S
FIGURE 42 Schematic representation of variable-reluc-tance pressure transducer.
pressure. Derived units, the millitorr or micrometer, represent-ing 1/1000 of 1 mmHg or 1 Torr, are also used for subtorrpressures.
In the MKS system of units, standard atmospheric pressureis 750 Torr and is expressed as 100,000 Pa (N/m2) or 100 kPa.This means that 1 Pa is equivalent to 7.5 millitorr (1 Torr =133.3 pascal). Vacuum, usually expressed in inches of mercury,is the depression of pressure below the atmospheric level, withabsolute zero pressure corresponding to a vacuum of 30 inchesof mercury.
When specifying and using vacuum gages, one must con-stantly keep in mind that atmospheric pressure is not constantand that it also varies with elevation above sea level.
Types of Vacuum Gages
Vacuum gages can be either direct or indirect reading. Those that measure pressure by calculating theforce exerted by incident particles of gas are direct reading, while instruments that record pressure bymeasuring a gas property that changes in a predictable manner with gas density are indirect reading.
The range of operation for these two classes of vacuum instruments is given in Table 5. Since thepressure range of interest in present vacuum technology extends from 760 to 10−13 Torr (over 16 ordersof magnitude), there is no single gage capable of covering such a wide range. The ranges of vacuumwhere specific types of gages are most applicable are shown in Fig. 45; pertinent characteristics ofthese gages are given in Fig. 46.
The operating principles of some vacuum gages, such as liquid manometers, bourdon, bellows,and diaphragm gages involving elastic members, were described earlier in this article. The remainingvacuum measurement devices include the thermal conductivity (or Pirani and thermocouple-typegages), the hot-filament ionization gage, the cold-cathode ionization gage (Philips), the spinning-rotor friction gage, and the partial-pressure analyzer.
Pirani or Thermocouple Vacuum Gage
Commercial thermal conductivity gages should not ordinarily be thought of as precision devices.Within their rather limited but industrially important pressure range they are outstandingly useful.The virtues of these gages include low cost, electrical indication readily adapted to remote readings,sturdiness, simplicity, and interchangeability of sensing elements. They are well adapted for useswhere a single power supply and measuring circuit is used with several sensing elements located indifferent parts of the same vacuum system or in several different systems.

P1: xxx
3 September 1999 0:39 chap04combined.tex Chap04combined.sgm MH009v3(1999/07/12)
4.80 PROCESS/INDUSTRIAL INSTRUMENTS AND CONTROLS HANDBOOK
FIGURE 43 Cutaway view of Heise noncontacing opticalsensor.
FIGURE 44 Supersensitive and accurate pressure sensor that utilizes opticalinterferometry.

P1: xxx
3 September 1999 0:39 chap04combined.tex Chap04combined.sgm MH009v3(1999/07/12)
PROCESS VARIABLES—FIELD INSTRUMENTATION 4.81
FIGURE 45 Ranges where certain vacuum gages are most suitable.
The working element of the gages consists of a metal wire or ribbon exposed to the unknownpressure and heated by an electric current (Fig. 47). The temperature attained by the heater is suchthat the total rate of heat loss by radiation, gas convection, gas thermal conduction, and thermalconduction through the supporting leads equals the electric power input to the element. Convectionis unimportant and can be disregarded, but the heat loss by thermal conduction through the gas isa function of pressure. At pressures of approximately 10 Torr and higher, the thermal conductivityof a gas is high and roughly independent of further pressure increases. Below about 1 Torr, on theother hand, the thermal conductivity decreases with decreasing pressure, eventually in linear fashion,reaching zero at zero pressure. At pressures above a few torr, the cooling by thermal conduction limitsthe temperature attained by the heater to a relatively low value. As the pressure is reduced below afew hundred millitorr, the heater temperature rises, and at the lowest pressures, the heater temperaturereaches an upper value established by heat radiation and by thermal conduction through the supportingleads.
Hot-Filament Ionization Vacuum Gage
The hot-filament ionization gage is the most widely used pressure-measuring device for the regionfrom 10−2 to 10−11 Torr. The operating principle of this gage is illustrated in Fig. 48.
A regulated electron current (typically about 10 mA) is emitted from a heated filament. Theelectrons are attracted to the helical grid by a dc potential of about +150 volts. In their passage fromfilament to grid, the electrons collide with gas molecules in the gage envelope, causing a fraction ofthem to be ionized. The gas ions formed by electron collisions are attracted to the central ion collectorwire by the negative voltage on the collector (typically −30 volts). Ion currents collected are on theorder of 100 mA/Torr. This current is amplified and displayed using an electronic amplifier.

P1: xxx
3 September 1999 0:39 chap04combined.tex Chap04combined.sgm MH009v3(1999/07/12)
4.82 PROCESS/INDUSTRIAL INSTRUMENTS AND CONTROLS HANDBOOK
FIGURE 46 Vacuum-gage properties. Four different symbols are used in thischart, ranging from “yes” through “qualified yes” and “qualified no” to “no.” Foreasy and uniform reference, these symbols are made to appear in shaded squaresranging from white (blank) to nearly black (heavy hash marks). This chart allowsone to determine at a glance if the number of disadvantages or gage limitations ishigh or low. The assigned answers are unavoidably somewhat arbitrary. Referenceto specific descriptions is suggested.
This ion current will differ for different gases at the same pressure, that is, a hot-filament ionizationgage is composition-dependent. Over a wide range of molecular density, however, the ion current froma gas of constant composition will be directly proportional to the molecular density of the gas in thegage.
Cold-Cathode Ionization Vacuum Gage
This ingenious gage, invented by Penning, possesses many of the advantages of the hot-filamentionization gage without being susceptible to burnout. Ordinarily an electrical discharge between twoelectrodes in a gas cannot be sustained below a few millitorr pressure. To simplify a complicated setof relationships, this is because the “birthrate” of new electrons capable of sustaining ionization issmaller than the “death rate” of electrons and ions. In the Philips gage this difficulty is overcome bythe use of a collimating magnetic field that forces the electrons to traverse a tremendously increased

P1: xxx
3 September 1999 0:39 chap04combined.tex Chap04combined.sgm MH009v3(1999/07/12)
PROCESS VARIABLES—FIELD INSTRUMENTATION 4.83
FIGURE 47 Pirani gage. (a) Gage in fixed-voltage Wheatstone bridge. (b) Sensingelement.
FIGURE 48 Hot-filament ionization gage (Bayard-Alpert type).
path length before they can reach the collecting electrode. Intraversing this very long path, they have a correspondingly in-creased opportunity to encounter and ionize molecules of gasin the interelectrode region, even though this gas may be ex-tremely rarefied. It has been found possible by this use of amagnetic field and appropriately designed electrodes, as indi-cated in Fig. 49, to maintain an electric discharge at pressuresbelow 10−9 Torr.
Comparison with the hot-filament ionization gage revealsthat, in the hot-filament gage, the source of the inherently lin-ear relationship between gas pressure (more exactly moleculardensity) and gage reading is the fact that the ionizing currentis established and regulated independently of the resulting ioncurrent. In the Philips gage this situation does not hold. Main-tenance of the gas discharge current involves a complicatedset of interactions in which electrons, positive ions, and photo-electrically effective x-rays all play a significant part. It is thusnot surprising that the output current of the Philips gage is notperfectly linear with respect to pressure. Slight discontinuitiesin the calibration are also sometimes found, since the mag-netic fields customarily used are too low to stabilize the gas
discharge completely. Despite these objections, a Philips gage is a highly useful device, particularlywhere accuracy better than 10 or 20 percent is not required.

P1: xxx
3 September 1999 0:39 chap04combined.tex Chap04combined.sgm MH009v3(1999/07/12)
4.84 PROCESS/INDUSTRIAL INSTRUMENTS AND CONTROLS HANDBOOK
FIGURE 49 Philips cold-cathode ionization vacuum gage.
FIGURE 50 Inverted magnetron, a cold-cathode gage,produces electrons by applying a high voltage to unheatedelectrodes. Electrons spiraling in toward the central elec-trode ionize gas molecules, which are collected on thecurved cathode.
The Philips gage is composition-sensitive but, unlike thesituation with the hot-filament ionization gage, the sensitivityrelative to some reference gas such as air or argon is not in-dependent of pressure. Leak hunting with a Philips gage anda probe gas or liquid is a useful technique. Unlike the hot-filament ionization gage, the Philips gage does not involve theuse of a high-temperature filament and consequently does notsubject the gas to thermal stress. The voltages applied in thePhilips gage are of the order of a few thousand volts, whichis sufficient to cause some sputtering at the high-pressure endof the range, resulting in a certain amount of gettering or en-forced take-up of the gas by the electrodes and other parts ofthe gage. Various design refinements have been used to facili-tate periodic cleaning of the vacuum chamber and electrodes,since polymerized organic molecules are an ever-present con-taminant.
The conventional cold-cathode (Philips) gage is used inthe range from 10−2 to 10−7 Torr. Redhead has developed amodified cold-cathode gage useful in the 10−6 to 10− 12 Torrrange (Fig. 50). The operating voltage is about 5000 volts in a1-kG magnetic field.
Spinning-Rotor Friction Vacuum Gage
While liquid manometers (U-tube, McLeod) serve as pressure standards for subatmospheric mea-surements (760 to 10− 5 torr) and capacitance (also quartz) manometers duplicate this range as usefultransfer standards, calibration at lower pressures depends on volume expansion techniques and pre-sumed linearity of the measuring system. The friction gage allows extension of the calibration range

P1: xxx
3 September 1999 0:39 chap04combined.tex Chap04combined.sgm MH009v3(1999/07/12)
PROCESS VARIABLES—FIELD INSTRUMENTATION 4.85
TABLE 6 Characteristics of Partial-Pressure Analyzers
Minimum PartialType Pressure, Torr Resolution,∗ au Magnetic Field
Magnetic sector 10−11 20–150 YesCycloidal 10−11 100–150 YesQuadrupole 10−12 100–300 NoTime of flight 10−12 200 No
∗ Maximum mass number at which a mass number difference of 1 can be observed.
diaphragmwith commoncounterelectrode
brazing preformand spacer
basic substrate
CP-electrodeCR-electrode
P ~ CP − CRCP
FIGURE 51 Construction of a ceramic sensor.
directly down to 10−7 Torr. It measures pressure in a vacuum system by sensing the deceleration of arotating steel ball levitating in a magnetic field (Fig. 51).
Partial-Pressure Analyzers (Vacuum)4
Many applications of high-vacuum technology are more concerned with the partial pressure of par-ticular gas species than with total pressure. Also, “total” pressure gages generally give accuratereadings only in pure gases. For these reasons partial-pressure analyzers are finding increasing ap-plication. These are basically low-resolution, high-sensitivity mass spectrometers which ionize a gassample in a manner similar to that of a hot-filament ionization gage. The resulting ions are thenseparated in an analyzer section, depending on the mass-to-charge ratio of each ion. The ion currentcorresponding to one ion type is then collected, amplified, and displayed. Partial-pressure gages arevery valuable diagnostic tools in both research and production work. The major types are listed inTable 6.
4 Also known as residual gas analyzers (RGAs).

P1: xxx
3 September 1999 0:39 chap04combined.tex Chap04combined.sgm MH009v3(1999/07/12)
4.86 PROCESS/INDUSTRIAL INSTRUMENTS AND CONTROLS HANDBOOK
CAPACITIVE CERAMIC (AI2O3) PRESSURE SENSORS
The capacitive sensor uses an AI2O3 ceramic with between 96 percent and 100 percent pureness.The 96-percent AI2O3 is a polycrystalline isotope material with high density and an average surfaceroughness of better than 0.4 µm (compared with metal membranes that are 0.6 µm). The remaining4 percent consist of SiO2 (silicon dioxide). The 100-percent ceramic is a pure single crystallinesapphire. It is absolutely resistant against chemicals, such as highly concentrated sulfuric acid, nitricacid, sodium hydroxide, or phosphoric acid.
atmospheric pressureceramic substrate
ceramic diaphragmpressure
pressure
gauge pressure cell
absolute pressure cell
FIGURE 52 Function of the ceramic sensor.
The ceramic sensors are based on a capacitive principle andconsist of a body, membrane, and electrodes. On the 1/4-in-thickbody, an inner and outer tantalum electrode is sputtered on. Theother measuring electrode is sputtered on the membrane innerside. The inner electrode of the body is the sensitive measuringelectrode; the outer electrode is the reference electrode. The ref-erence electrode is very close to the joint part of the membraneand body and therefore has a constant capacitance in any caseof varying pressure. The distance between membrane and bodyis well defined to 40 µm. This is accomplished by an active sol-dering that connects membrane and body. The raw sensor signal(0.5–4.5 V) is then measured and conditioned by an application-specific integrated circuit (ASIC) located on the back side of theceramic body. Temperature compensation, calibration, and otherfunctions are realized by a programmed E2 ROM (see Figs. 51and 52).
A ceramic sensor can withstand up to 800 times overpressurewithout suffering from zero drift or measurement errors. Thisbehavior also results in excellent long-term stability, generallybetter than 0.1-percent/12-month stability.
In addition to universal corrosion resistance, this ceramic is absolutely resistant against temperatureshocks, mechanical overloads, and vacuum. This is independent, whether 96-percent polycrystallineceramic or 100-percent monocrystalline ceramic (sapphire) is used. The ceramic sensors are com-patible with most known chemicals. For an extreme medium such as HF (hydroflouric acid), the100-percent-pure ceramic is recommended.
The ceramic membrane ensures that no permeation of media takes place. AI2O3 has a 10−7 smallerdiffusion coefficient than a metal diaphragm. The lack of any metal (nickel in particular) ensures thatthe ceramic sensors are also suitable for applications in which the risk of hydrogen diffusion maycause severe problems with ordinary metal diaphragms.
Self-monitoring of the diaphragm of a differential pressure cell ensures that an immediate alarmcan be generated. A comparison of the total capacitance with an integrated temperature sensor allowsfor continuous self-monitoring of the sensor. For example, if the sensor is damaged and the fill fluidleaks, the total capacitance of the sensor, which is equal to a specific temperature because of thecharacteristics of the fill fluid, will no longer match with a preregistered value for temperature versustotal capacitance (see Fig. 53).
Smart Pressure Transmitters
The description for a smart field device is generally any device that includes a microprocessor.Typically, this means that the device has the capability to provide better accuracy for parameters suchas linearity correction and temperature compensation. The smart transmitter may also be able to workwith more than one measured variable (for example, pressure, temperature).
Several other functions, such as self-diagnostics, semiautomatic calibration, and other beneficialfunctions, are often available. Smart pressure transmitters utilize a digital ASIC microcomputer. The

P1: xxx
3 September 1999 0:39 chap04combined.tex Chap04combined.sgm MH009v3(1999/07/12)
PROCESS VARIABLES—FIELD INSTRUMENTATION 4.87
FIGURE 53 Construction of ceramic differential pressure sensor.
electronics digitize the input signal from the sensor and apply correction coefficients selected from anonvolatile memory. Configuration data are stored in a nonvolatile electrically erasable programmableread-only memory (EEPROM) in the electronics module. These data are retained in the transmitterwhen power is interrupted, so the transmitter is functional immediately on power-up. The outputsection of the electronics converts the data into a 4- to 20-mA signal with a superimposed digitalprotocol or into digital form for pure digital data transmission.
Remote configuration by means of a user interface such as a handheld terminal, personal com-puter is usually needed to configure a field-mounted smart device. Several communication protocolsare in use; the most common protocol today is the HART� protocol (superimposed on the 4- to20-mA signal), which offers an open solution for a number of manufacturers to use the same hand-held terminal for their measuring devices. Another protocol that is gaining popularity is the puredigital protocol such as Foundation Fieldbus and PROFIBUS-PA. One of the advantages of fullydigital signal transmission is that the digital/analog conversion is eliminated, resulting in improvedperformance. Another advantage is that more than one measured variable can be transmitted, togetherwith diagnostic data at high speed (31.25 Kbytes/s) (see Figs. 54–56).
Application of Chemical Seals
Purpose and Theory. A chemical seal is used as a barrier between the media being measured andthe measuring device. The seal, by means of a fill fluid, will transmit the acting pressure to the sensingdevice, which in turn will give an output proportional to the acting pressure. A chemical seal systemconsists of one or two seals, a transmitter or sensing device, a connection between the transmitter andseal, and a fill fluid [see Figs. 57(a) and 57(b)].

P1: xxx
3 September 1999 0:39 chap04combined.tex Chap04combined.sgm MH009v3(1999/07/12)
4.88 PROCESS/INDUSTRIAL INSTRUMENTS AND CONTROLS HANDBOOK
FIGURE 54 HART protocol (superimposed on the 4- to 20-mA signal).
FIGURE 55 Fieldbus with PROFIBUS-PA or FF, up to 32 transmitters per segment.

P1:xxx
3Septem
ber1999
0:39chap04com
bined.texC
hap04combined.sgm
MH
009v3(1999/07/12)
FIGURE 56 Smart transmitter programming data.
4.8
9
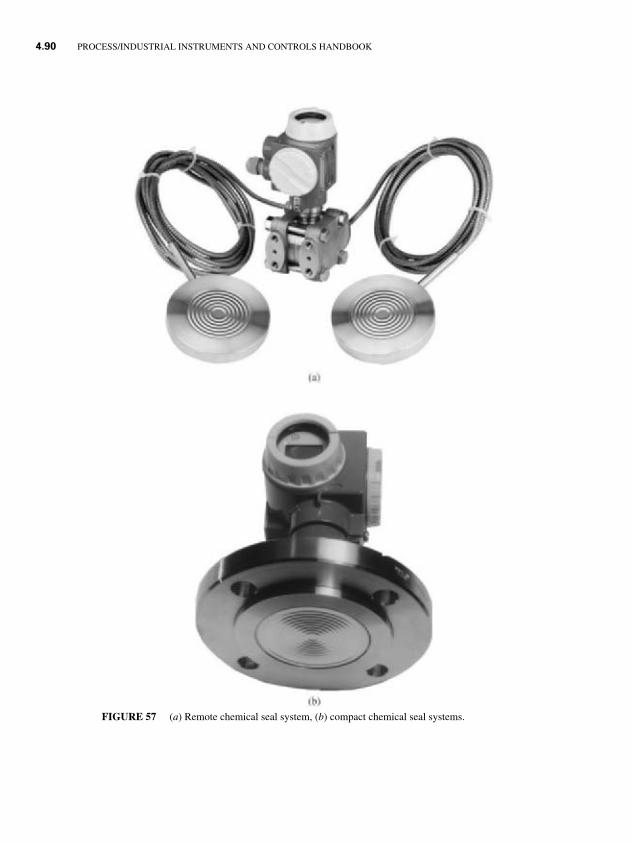
P1: xxx
3 September 1999 0:39 chap04combined.tex Chap04combined.sgm MH009v3(1999/07/12)
4.90 PROCESS/INDUSTRIAL INSTRUMENTS AND CONTROLS HANDBOOK
FIGURE 57 (a) Remote chemical seal system, (b) compact chemical seal systems.

P1: xxx
3 September 1999 0:39 chap04combined.tex Chap04combined.sgm MH009v3(1999/07/12)
PROCESS VARIABLES—FIELD INSTRUMENTATION 4.91
There are many reasons why chemical seals have become so popular. When it is necessary toisolate the transmitter from the process chemical, seals can often solve the problem. The followingconditions usually dictate the use of chemical seals:
� If the product is corrosive, it is usually necessary to use a chemical seal to act as a barrier betweenthe corrosive media and the transmitter.
� When the temperature exceeds the transmitter’s limitations, a seal can be the isolation devicebetween the transmitter and the temperature.
� If the process contains particulates or is highly viscous, then a chemical seal may be necessary toprevent plugging.
� If wet or dry reference legs are not possible because of either condensation or evaporation, then itwill be necessary to use a chemical seal to isolate the transmitter from the conditions within thevessel.
� If sanitary requirements exist, it is necessary to use chemical seals.� If it is not possible to mount the transmitter integral to the measurement point, capillaries can be
used to locate the transmitter at a remote location.
Chemical seals have been in service in industrial applications for years. It is a proven technologythat fits a variety of applications in flow, level, and pressure.
Points to Consider when Choosing Chemical Seals. There are multiple points that need to beaddressed when choosing a chemical seal. These points, listed below, affect the performance, accuracy,and lifetime of the entire chemical seal system. Always keep in mind that the chemical seal systemwill only be as accurate as the chemical seals that are attached to the transmitter.
Materials of Compatibility
If the process is corrosive, the wetted material of the chemical must be taken into consideration. Sealshave been made from practically every type of metal that can be machined and formed. Metals suchas stainless steel and Hastelloy C, for aggressive media, tend to be most common. If an exotic metalis needed, it can usually be provided, but normally at a higher price. It should be understood that thediaphragm of the chemical seal (the measuring element) cannot withstand any corrosion because ofits thickness. Therefore it is imperative that the diaphragm material can withstand the process.
Chemical Seal Hardware
There are normally either one or two basic pieces to a chemical seal. If it is a compact unit, then theonly hardware is the chemical seal itself. If the unit needs to be remote for any number of reasons,then the seal will also have a capillary attached for the hydraulic transfer of the fill fluid.
The four types of basic chemical seals are flanged, extended, threaded, and pancake. There arealso many types of special application seals such as in-line seals, saddle seals, and a full range ofsanitary seals. When a remote chemical seal is used, capillaries transmit the pressure from the sealto the pressure sensor. Capillaries should always be kept at the shortest length possible to reducetemperature effects and response time.
When choosing a capillary, one needs to consider the inside diameter as it will have an effect onthe measurement’s response time and accuracy. The smaller the diameter, the less temperature effectyou will see and the slower the response time. When choosing the correct capillary, decide whetherreduced response time or reduced temperature effect is more important. If reduced temperature effectis more important, then a capillary with the shortest length and smaller diameter would be the bestchoice.

P1: xxx
3 September 1999 0:39 chap04combined.tex Chap04combined.sgm MH009v3(1999/07/12)
4.92 PROCESS/INDUSTRIAL INSTRUMENTS AND CONTROLS HANDBOOK
Fill Fluid
In any chemical seal system there is always a fill fluid. This fluid is perhaps one of the most importantpoints to consider when assembling the system. The fill fluid will affect the safety of the process,accuracy and response time of the measurement, and quality of the product under fault conditions.The following four points need to be considered when choosing a fill fluid.
� Temperature Limitations: Every fill fluid has limitations as to the temperature under which it canoperate. These temperature limitations also change under vacuum conditions. If a fill fluid is notoperated under its limitations, then it will either solidify or vaporize and cause erroneous readingsto occur. Always choose a fill fluid that will handle the most extreme conditions in the process.
� Expansion Coefficient: All fill fluids expand and contract with temperature fluctuations. But justas all materials have their own characteristics, all fill fluids have slightly different expansion co-efficients. The smaller the expansion coefficient, the less effect you will see on the measurementbecause of temperature changes.
� Process Compatibility: Since a chemical seal has a very thin diaphragm in which to sense pressurechanges, there is a great possibility that the seal could be damaged and fill fluid could leak into theprocess. Therefore it is important to make sure that the fill fluid being used is compatible with theprocess and will not affect the quality of it in any way.
� Viscosity: The viscosity of the fill fluid will have a large influence on the response time of themeasurement. The less viscous the product, the better the response time. As the product becomesmore viscous, the response time will also increase. It is also important to remember that as thetemperature decreases, the viscosity will increase (see Fig. 58).
Temperature Effects
One of the most common problems in using a diaphragm seal is the inaccuracy that is caused byfluctuating temperature conditions. Every time the temperature changes, it will either expand orcontract the fill fluid at a rate that is consistent with the fill-fluid thermal expansion coefficient.There are three variables that can be changed to reduce the amount of error caused by temperatureeffects:
� Diameter of Capillary: By reducing the diameter of the capillary, it is possible to decrease thevolume of the fill fluid in the system, thereby reducing the temperature effect. When the diameterof the capillary is reduced it will increase the response time since it will take longer to move thesame amount of volume through a smaller tube.
� Choice of Fill Fluid: If temperature effects will be a problem in the measurement, it is possibleto choose a fill fluid that has a small thermal expansion coefficient. This will also help reducetemperature effects. When choosing a fill fluid, do not forget to look at the other key points such astemperature limitations and viscosity (see Fig. 59).
� Diaphragm Size: If a small-diameter diaphragm is used, a large temperature error could be seenbecause of the fill-fluid expansion or contraction. Smaller diaphragms have a much smaller dis-placement than larger diaphragms. The stiffness of the smaller diaphragms does not allow fortemperature fluctuations without a significant error that is due to temperature changes. Larger di-aphragms are not nearly as stiff and therefore are much more forgiving of expansion or contractionof the fill fluid.
Response Time
Response time can be a significant factor when chemical seal systems with capillaries are used. Ittakes a certain amount of time to transfer a volume of fill fluid from one end of a capillary to another.

P1:xxx
3Septem
ber1999
0:39chap04com
bined.texC
hap04combined.sgm
MH
009v3(1999/07/12)
Fill-Fluid Specifications
Fill Fluid
GlycerineGlycerine / water
Food-grade silicone oil
Vegetable oil
FlurolubeHalocarbonHigh-temperature oil
High-temperature oil
Silicone oil (4 cSt)
Silicone oil dc 200/50
Pabs < 15 psi(°F)
Pabs ≥ 15 psi(°F)
−4 to +392
−4 to +572
−4 to +750
−40 to +392
+60 to −462
+14 to +248
+14 to +400
0 to +572
−40 to +347
−130 to +356N/A
−130 to +176+14 to +212
+14 to +392
+14 to +200
−40 to +176
N/A
N/A
N/A
N/A
Suitable TemperatureRange
Specific Gravity at Temperature
Viscosity at Temperature
Notes
0.96
0.91
1.07
1.07
1.97
1.86
1.26
1.22
0.94
0.97
(°F)
+77
(°F)
+77
+77
+77
+77
+77
+68
+68
+68
+68+68
+77
+77
+68
+68
+68
+68
+68
+68
+68
(cSt)
50
439
39
145
111088
66
350
Standard
Food and beverage
Food and beverage
Food and beverage
Food and beverage
Oxygen and chlorine service
Oxygen and chlorine service
High temperature and high vacuum
High temperature
Low temperature
FIGURE 58 Fill-fluid specifications.
4.9
3

P1: xxx
3 September 1999 0:39 chap04combined.tex Chap04combined.sgm MH009v3(1999/07/12)
4.94 PROCESS/INDUSTRIAL INSTRUMENTS AND CONTROLS HANDBOOK
FIGURE 59 Thermal expansion coefficient of fill fluids.
The two major variables when response time on a chemical seal system is analyzed are capillarydiameter and length and fill-fluid viscosity.
� Capillary Diameter and Length: The smaller the capillary, the longer it will take for the volume offill fluid to be transferred through that capillary to the measuring device. When choosing a capillary,always be sure that the time response matches the demands of the process. Normal size capillariesare usually 2 mm. The length of the capillary should also be kept as short as possible to reduce thevolume of fill fluid. If the fill-fluid volume is reduced, the response time will also be reduced.
� Fill-Fluid Viscosity: The higher the viscosity of the fill fluid, the longer the response time will be.If a fill fluid with a low viscosity is used, there will be a faster response time. But keep in mindthat if a fill fluid with a low viscosity is used, it may or may not meet the requirements for thermalexpansion and operating temperature range that the process demands.
Application Guidelines
Different applications require different installations. The most important point to remember is thatthe sensor range and zero point adjustment of a differential pressure (DP) transmitter allow for theoffset of the negative leg of the chemical seal system. For this reason the transmitter may need to beinstalled at a different height than what is expected. The following diagrams should provide a guideto installing chemical seals in a variety of applications that could be seen in process (see Fig. 60).
Restriction Flow Measurement with Primary Devicesand Differential Pressure Transmitters
The orifice plate is the oldest known method of metering flow. During the Roman Empire, water wasbrought to the homes of the city of Rome by viaducts. A tax was paid to the city and an orifice wasinstalled in the line into the house. The size of the orifice in the line regulated the amount of waterreceived. The tax paid was proportional to the size of the orifice. This was the earliest water meter.Today the orifice/differential pressure meter is still the most widely used flowmeter technology.

P1: xxx
3 September 1999 0:39 chap04combined.tex Chap04combined.sgm MH009v3(1999/07/12)
PROCESS VARIABLES—FIELD INSTRUMENTATION 4.95
FIGURE 60 Installation guidelines for chemical seals.

P1: xxx
3 September 1999 0:39 chap04combined.tex Chap04combined.sgm MH009v3(1999/07/12)
4.96 PROCESS/INDUSTRIAL INSTRUMENTS AND CONTROLS HANDBOOK
The pressure drop across an orifice, nozzle, venturi, or other device with a fixed passage diameterin a pipeline is a function of the flow rate. As the flow rate increases or decreases, the pressuredrop varies exponentially with the change in flow rate. If the flow rate doubles, the pressure dropquadruples. Conversely, if the flow rate decreases by half, the pressure drop decreases to one fourththe drop. When the change in pressure drop is measured, the flow rate is implied. In the early days, anorifice plate was installed in the flow line and a simple U-tube manometer was installed to observe thedifference in pressure across the orifice. The U-tube was typically filled with water. The differencein height of the water in one leg versus the other indicated the pressure differential. Most times itwas measured in inches of water column (in. W.C.). The fill sometimes was mercury, before all thedangers of mercury were as well known as they are today. The U-tube naturally was very long andcumbersome. Differentials of 100 in are still common (see Fig. 61).
As instrumentation changed and improvements were made, a differential transmitter was substi-tuted for the U-tube. Sensing lines conveyed the pressure to both sides of a diaphragm. The higher-pressure side, the upstream side, deflected the diaphragm toward the lower-pressure side. This causedthe output of the transmitter to change its output, which remained proportional to the differentialpressure. The output originally was pneumatic, 3–15 psi. This has now been almost entirely displacedby electronics by a 4–20-mA output. Since the relationship of pressure drop to flow is a geometricone, the pressure drop varies with the square of the flow. Either an internal or external square-rootextractor is required.
Because this is a square relationship, the graduations on the resulting scale must also be spacedon a square relationship, which greatly limits the effective rangeability. This results in having thegraduations at the low end of the scale too close together to be useful. For this reason, the rangeabilityof the differential pressure transmitter is normally considered to be 3:1 (33%–100%).
A simplified formula for determining pressure drop versus flow is
(Q X/QK )2 × �PK = �PX
where QX is the unknown flow rate, QK is the known flow rate that generates a known pressure drop,�PK is the known pressure drop produced at flow rate QK, and �PX is the pressure drop that isproduced at flow rate QX. This formula assumes that the operating conditions of temperature pressure,density, and viscosity are the same as the original conditions for which the orifice bore was selected.The following table shows the differential pressures for various flow rates and illustrates why therangeability of the orifice plate meter is less than that of many other flowmeters.
Q (%) 100 90 80 70 60 50 40 30 20 10
�P (in) 100 81 64 49 36 25 16 9 4 1
DP transmitters are available in either pneumatic or electronic versions and are the most widelyused communicating flowmeters today. The basic transmitter may be used to meter flow, level, orpressure variables, which makes it very versatile. The transmitter detects only the differential acrossthe fixed restriction. It does not know what size the pipe is or what the fluid properties may be. Thismeans that the DP may be mounted in any pipe size to meter any process fluid—liquid or gas—and nothave to have any special features or special calibration. It has been calibrated to detect the expectedpressure differential only. A pressure differential of 100 in W.C. is very common. If the transmitter iscalibrated to have a 20-mA output at 100 in W. C., that is all that is necessary.
The key to making a DP transmitter work for a given application is the proper selection and instal-lation of the differential producer—the orifice plate, most frequently. The calculation of the orificebore is important. The wrong orifice bore cannot be expected to provide accurate flow measurement.
When the orifice bore is calculated, there are certain limits on how large the hole may be. Youwill hear the term beta or beta ratio used. This is only the ratio of the orifice bore (the hole) to theinternal diameter of the pipe. Most users prefer to keep the beta to a maximum of 0.7, although somewill go as high as 0.75. A beta of 0.75 means that if the pipe is a 2-in schedule 40 pipe, in which thepipe I.D. is 2.067 in, the hole will be 1.550 in. The beta may be much less than 0.7 and usually is formost installations. Pressure drop in the overall piping system is very often a large consideration inselecting the pipe size so users tend to keep flow velocity down whenever possible.
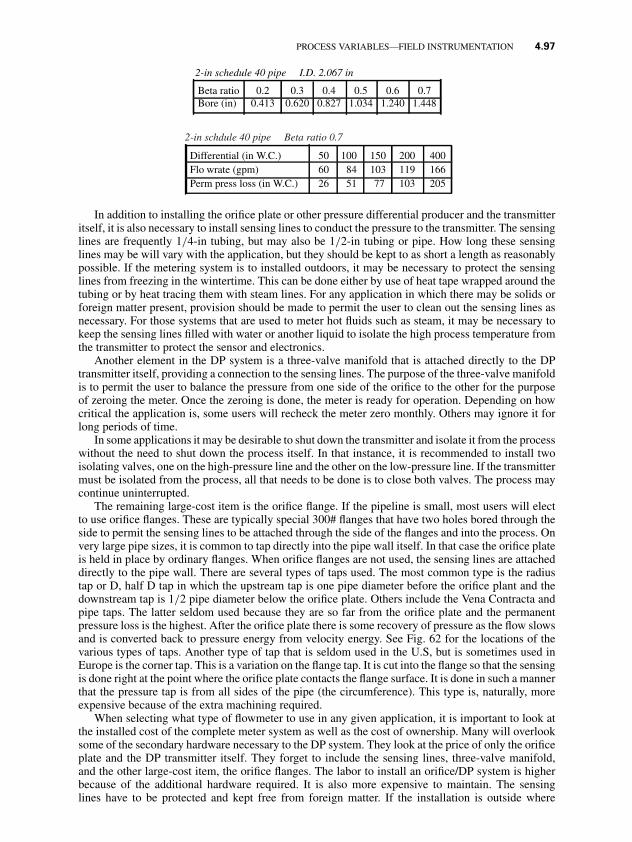
P1: xxx
3 September 1999 0:39 chap04combined.tex Chap04combined.sgm MH009v3(1999/07/12)
PROCESS VARIABLES—FIELD INSTRUMENTATION 4.97
2-in schedule 40 pipe I.D. 2.067 in
Beta ratio 0.2 0.3 0.4 0.5 0.6 0.7Bore (in) 0.413 0.620 0.827 1.034 1.240 1.448
Differential (in W.C.) 50 100 150 200 400Flo wrate (gpm) 60 84 103 119 166Perm press loss (in W.C.) 26 51 77 103 205
2-in schdule 40 pipe Beta ratio 0.7
In addition to installing the orifice plate or other pressure differential producer and the transmitteritself, it is also necessary to install sensing lines to conduct the pressure to the transmitter. The sensinglines are frequently 1/4-in tubing, but may also be 1/2-in tubing or pipe. How long these sensinglines may be will vary with the application, but they should be kept to as short a length as reasonablypossible. If the metering system is to installed outdoors, it may be necessary to protect the sensinglines from freezing in the wintertime. This can be done either by use of heat tape wrapped around thetubing or by heat tracing them with steam lines. For any application in which there may be solids orforeign matter present, provision should be made to permit the user to clean out the sensing lines asnecessary. For those systems that are used to meter hot fluids such as steam, it may be necessary tokeep the sensing lines filled with water or another liquid to isolate the high process temperature fromthe transmitter to protect the sensor and electronics.
Another element in the DP system is a three-valve manifold that is attached directly to the DPtransmitter itself, providing a connection to the sensing lines. The purpose of the three-valve manifoldis to permit the user to balance the pressure from one side of the orifice to the other for the purposeof zeroing the meter. Once the zeroing is done, the meter is ready for operation. Depending on howcritical the application is, some users will recheck the meter zero monthly. Others may ignore it forlong periods of time.
In some applications it may be desirable to shut down the transmitter and isolate it from the processwithout the need to shut down the process itself. In that instance, it is recommended to install twoisolating valves, one on the high-pressure line and the other on the low-pressure line. If the transmittermust be isolated from the process, all that needs to be done is to close both valves. The process maycontinue uninterrupted.
The remaining large-cost item is the orifice flange. If the pipeline is small, most users will electto use orifice flanges. These are typically special 300# flanges that have two holes bored through theside to permit the sensing lines to be attached through the side of the flanges and into the process. Onvery large pipe sizes, it is common to tap directly into the pipe wall itself. In that case the orifice plateis held in place by ordinary flanges. When orifice flanges are not used, the sensing lines are attacheddirectly to the pipe wall. There are several types of taps used. The most common type is the radiustap or D, half D tap in which the upstream tap is one pipe diameter before the orifice plant and thedownstream tap is 1/2 pipe diameter below the orifice plate. Others include the Vena Contracta andpipe taps. The latter seldom used because they are so far from the orifice plate and the permanentpressure loss is the highest. After the orifice plate there is some recovery of pressure as the flow slowsand is converted back to pressure energy from velocity energy. See Fig. 62 for the locations of thevarious types of taps. Another type of tap that is seldom used in the U.S, but is sometimes used inEurope is the corner tap. This is a variation on the flange tap. It is cut into the flange so that the sensingis done right at the point where the orifice plate contacts the flange surface. It is done in such a mannerthat the pressure tap is from all sides of the pipe (the circumference). This type is, naturally, moreexpensive because of the extra machining required.
When selecting what type of flowmeter to use in any given application, it is important to look atthe installed cost of the complete meter system as well as the cost of ownership. Many will overlooksome of the secondary hardware necessary to the DP system. They look at the price of only the orificeplate and the DP transmitter itself. They forget to include the sensing lines, three-valve manifold,and the other large-cost item, the orifice flanges. The labor to install an orifice/DP system is higherbecause of the additional hardware required. It is also more expensive to maintain. The sensinglines have to be protected and kept free from foreign matter. If the installation is outside where

P1: xxx
3 September 1999 0:39 chap04combined.tex Chap04combined.sgm MH009v3(1999/07/12)
4.98 PROCESS/INDUSTRIAL INSTRUMENTS AND CONTROLS HANDBOOK
FIGURE 61 Differential pressure flowmeter. (a) Effect of orifice restriction in creatinga pressure differential across plate and recovery of pressure loss downstream from plate isshown graphically in top view. A liquid manometer is used for illustrative purposes. OtherDP transducers are used in practice. The pressure differential created depends on the type ofrestriction used. With an orifice plate, the flow contraction is abrupt; with a flow nozzle, it ismore gradual. (b) Relationship between measured differential and flow rate is a function of taplocations, the particular type of restriction used, and the associated upstream and downstreampiping. These factors are included in the discharge coefficient, which relates actual flow rateto theoretically calculated rate. (c) Commonly used piping arrangements used for installing aDP flowmeter.

P1: xxx
3 September 1999 0:39 chap04combined.tex Chap04combined.sgm MH009v3(1999/07/12)
PROCESS VARIABLES—FIELD INSTRUMENTATION 4.99
FIGURE 62 Various tap locations.
FIGURE 63 Various orifice configurations.
the ambient temperature may go below freezing in the winter, itmay be necessary to protect the sensing lines from freezing. Theorifice plate’s sharp edge must be maintained. It some DP trans-mitters are overranged, it may become necessary to recalibrate itto be sure it is working properly.
When selecting the location on which to mount the orifice inthe pipeline, it is very important to consider what is in the pipelineupstream of the meter. Any disturbance in the flow stream canhave an adverse effect on the meter’s performance. A single el-bow upstream of the orifice may require 20 or more pipe diam-eters of straight pipe for allowing the flow time to settle downagain, and establish a stable flow profile. If there are two or more
elbows in multiple plains, it can take 100 or more diameters to regain some semblance of the properflow profile. In some installations it may be necessary to install flow conditioning equipment after apipe disturbance to reduce the straight run to something that will fit within the allowable space. Thereare tables and curves published by organizations such as ASME and AGA that will advise the user onjust how much straight pipe is required for any given pipe configuration. These should be consultedbefore the orifice plate is installed to be sure the meter will perform as desired.
FIGURE 64 Typical orifice cross sections.
When there is a possibility that liquid will be present in a gas stream or gas may be present in aliquid stream, there is a possibility that there will be a buildup behind the orifice plate.
This is sometimes avoided by placing the orifice in a vertical run (seeFig. 63). If this is not feasible, special orifice plates are available that donot have the hole bored concentric with the pipe wall, but have an eccentricbore. An alternative is to bore a small weep hole in the plate so that it isadjacent to the pipe wall. This will allow the liquid or gas to pass on downthe pipe without interrupting the flow measurement. There is a question,however, about how effective the weep hole may be.
Since the purpose of any flowmeter is to measure the flow accurately,it is necessary to maintain the meter properly to ensure its performance.The sharp edge of the orifice plate must be maintained. If the edge ispermitted to become rounded, even slightly, it will cause the meter tobecome inaccurate. See below for the effects of degradation of the orificeplates and their subsequent loss of accuracy (see Fig. 64).

P1: xxx
3 September 1999 0:39 chap04combined.tex Chap04combined.sgm MH009v3(1999/07/12)
4.100 PROCESS/INDUSTRIAL INSTRUMENTS AND CONTROLS HANDBOOK
FIGURE 65 Orientation of orifice plates (flow from right to left).
The sharp edge of the orifice plate must butt against the flow, as indicated in Fig. 65. In small linesizes the thickness of the orifice plate, in relation to the pipe size, is too large and causes a shift in theorifice coefficient. To prevent this, either a chamfer or a step bore is included to reduce the land areaof the bore itself. For large pipe sizes, over 3 in, there is no need for a chamfer on the sharp edge. Ifthe orifice plate is installed in the wrong direction, the meter will not be accurate.
In some applications is may be desirable to use a differential producer other than an orifice plate. Inlarge pipeline sizes, it is sometimes desirable to use a venturi to reduce the overall pressure loss. Thecosts associated with pumping large flows, particularly steam flows, can be very high. If, by installinga venturi instead of an orifice plate, the cost of pumping can be greatly reduced, the extra cost of theventuri may be well worth it. When a venturi tube is used, the high-pressure tap is installed just at theentrance of the venturi and the low-pressure tap is installed in the center of the throat of the venturi(the smallest passage in the venturi) (see Fig. 66).
Other types of differential producers are flow nozzles and flow tubes. These are sometimes fabri-cated on the job site, which is likely to require that they be calibrated on site. They are useful whenthere may be some solids present in the flow stream since they would allow the solids to pass ondownstream and not clog up behind an orifice plate (see Fig. 67).
FIGURE 66 Venturi flowmeter.

P1: xxx
1 September 1999 18:38 chap04combined.tex Chap04combined.sgm MH009v3(1999/07/12)
PROCESS VARIABLES—FIELD INSTRUMENTATION 4.101
FIGURE 67 Example of nozzles.
FIGURE 68 Flow tube.
The flow tube is very similar to the flow nozzle in that itpermits foreign objects to pass on down the pipeline withoutclogging up behind the differential producer (see Fig. 68). An-other differential producer is the pitot tube and the averagingpitot tube (see Fig. 69). These are inserted into the pipeline,often through a hot tap that permits the pitot tube to be insertedand removed without shutting down the process flow. Theyare often used in larger pipe sizes to reduce pressure loss andlower the cost of the installation. Note: the illustration of theaveraging Pitot tube shows the high-pressure tap and the low-pressure tap separated for clarity. In actuality they are togetherin a single connnection through the pipe wall.
In some large line sizes, users will not install a special dif-ferentail producer, but instead will install taps on the insideand the outside radii of an existing pipe elbow. While this isnot normally a high-accuracy installation, it does work ade-quately for noncritical measurements for which repeatabilitymay be more important and the large size of the pipe makesthe installation of an orifice plate very costly.
Errors in Orifice Plate System
For many years, the orifice plate/DP transmitter has been the method most often used to measure flowin pipelines. Even though there are now many new, and often better, flowmeters on the market, theold standby orifice plate is still most often used. Because the orifice plate has been widely used for solong, many flowmeter users believe that the orifice plate is always correct and accurate. Many orificeplates are installed and not checked again for years. Although many companies have a program tocheck the calibration of the DP transmitter regularly, they rarely check the orifice plate. On this basis,users are convinced they have a meter that is as accurate as the day it was installed. This is simply nottrue. Below is a list of some of the things that happen to orifice plates and the effects on the accuracyof the meter. This information was developed by testing orifice plate installations. The work was doneby E. J. Burgin at the Florida Gas Transmission Company.

P1: xxx
1 September 1999 18:38 chap04combined.tex Chap04combined.sgm MH009v3(1999/07/12)
4.102 PROCESS/INDUSTRIAL INSTRUMENTS AND CONTROLS HANDBOOK
Condition % Error
Orifice edge beveled 45◦ full circumference (machined):0.010 bevel width −2.20.020 bevel width −4.50.050 bevel width −13.1
Turbulent gas stream:Upstream valve partially closed, straightening vanes in −0.7Upstream valve partially closed, straightening vanes out −6.7Liquid in meter tube 1 in deep in bottom of tube −11.3Grease and dirt deposits in meter tube −11.1
Leaks around orifice plate:1. One clean cut through plate sealing unit
a. cut on top side of plate −3.3b. cut next to tap holes −6.1
2. Orifice plate carrier raised approximately 3/8 infrom bottom (plate not centered) −8.2
Valve lubricant on upstream side of plate:Bottom half of plate coated 1/16 in thick −9.7Three gob-type random deposits 0.0Nine gob-type random deposits −0.6Orifice plate uniformly coated 1/16 in over full face −15.8
Valve lubricant on both sides of plate:Plate coated 1/8 in both sides of full face −17.9Plate coated 1/4 in both sides full face −24.4Plate coated 1/8 in bottom half both sides −10.1
Plate warp tests:Plate warped toward gas flow 1/8 in from flat −2.8Plate warped away from gas flow 1/8 in from flat −0.6Plate warped toward gas flow 1/4 in from flat −9.1Plate warped away from gas flow 1/4 in from flat −6.1
As you can see, the errors introduces by orifice plate wear and tear are not trivial. Bear in mind thatthese potential occurrences are not just remote possibilities—they exist every day in thousands oforifice plated installations.
FIGURE 69 Pitot tube.

P1: xxx
1 September 1999 18:38 chap04combined.tex Chap04combined.sgm MH009v3(1999/07/12)
PROCESS VARIABLES—FIELD INSTRUMENTATION 4.103
Advantages
1. The DP/orifice system has been around for many years; it is well understood by everyone from theprocess engineer to the instrument technician who must maintain it.
2. It is very versatile. You can change the orifice bore (within certain limits) to change the meter’sflow range. The cost differential for one size pipe versus another is relatively small. A 100-inW. C. differential is the same for any pipe size.
3. The same transmitter can be used for measuring level and for measuring gage pressure and flow.
Disadvantages
1. The accuracy of the system is very dependent on how it is installed and maintained.
2. Long straight pipe runs are required, which limits where the meter may be located.
3. Solids in a flow stream may cause the meter to become clogged.
4. The sensing lines must be protected from freezing in winter if the meter is installed outside.
5. The accuracy is affected by wear and tear and damage to restriction.
Orifice Application, Device Selection
The main differences in the applications result from the different media states of aggregation, such asgas, liquid, or steam.
FIGURE 70 Steam installation.
The different states imply three different ways of installation. De-pending on the purity of the fluid, variations are done accordingly. Gen-erally, the impulse pipes should depart from the process pipe at the sameheight and should end at the transmitter at the same height. Thereforethe fluid columns above the transmitter diaphragms have exactly thesame weight and do not bias the DP measurement. Today’s smart DPtransmitters allow generally for a 100% bias adjustment to compensatefor installation effects. To avoid permanent bubbles in liquid applica-tions and liquid stoppers in gas applications, impulse pipes must notrun horizontally—although a minimum of 4◦ angle is required, 10◦ isrecommended.
Steam. With steam, the impulse pipe tappings should be at exactlythe same heights. The transmitter should be installed below the processpipe. This also guarantees that sufficient steam can condense and thatthe impulse pipes and the transmitter are filled with only condensate (seeFig. 70).
Gas. With gases, the impulse pipes should depart to above the processpipe. The transmitter is installed above it. This prevents the impulse pipesand the transmitter from being filled with condensate, which would leadto a DP zero error.
For gas temperatures up to 175◦F, the manifold block and transmit-ter can be mounted directly onto the orifice tappings. These compactversions lower the installation cost significantly (see Fig. 71).
Liquid. The impulse pipes must depart below the process pipe and orifice. This prevents gas bubblesfrom entering the impulse pipes and transmitter to avoid measurement errors (see Fig. 72).
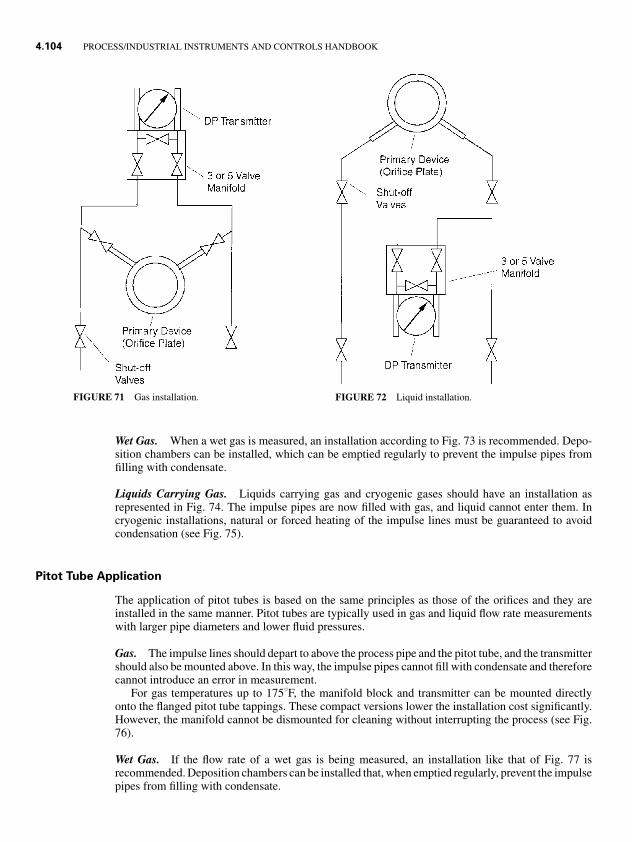
P1: xxx
1 September 1999 18:38 chap04combined.tex Chap04combined.sgm MH009v3(1999/07/12)
4.104 PROCESS/INDUSTRIAL INSTRUMENTS AND CONTROLS HANDBOOK
FIGURE 71 Gas installation. FIGURE 72 Liquid installation.
Wet Gas. When a wet gas is measured, an installation according to Fig. 73 is recommended. Depo-sition chambers can be installed, which can be emptied regularly to prevent the impulse pipes fromfilling with condensate.
Liquids Carrying Gas. Liquids carrying gas and cryogenic gases should have an installation asrepresented in Fig. 74. The impulse pipes are now filled with gas, and liquid cannot enter them. Incryogenic installations, natural or forced heating of the impulse lines must be guaranteed to avoidcondensation (see Fig. 75).
Pitot Tube Application
The application of pitot tubes is based on the same principles as those of the orifices and they areinstalled in the same manner. Pitot tubes are typically used in gas and liquid flow rate measurementswith larger pipe diameters and lower fluid pressures.
Gas. The impulse lines should depart to above the process pipe and the pitot tube, and the transmittershould also be mounted above. In this way, the impulse pipes cannot fill with condensate and thereforecannot introduce an error in measurement.
For gas temperatures up to 175◦F, the manifold block and transmitter can be mounted directlyonto the flanged pitot tube tappings. These compact versions lower the installation cost significantly.However, the manifold cannot be dismounted for cleaning without interrupting the process (see Fig.76).
Wet Gas. If the flow rate of a wet gas is being measured, an installation like that of Fig. 77 isrecommended. Deposition chambers can be installed that, when emptied regularly, prevent the impulsepipes from filling with condensate.

P1: xxx
1 September 1999 18:38 chap04combined.tex Chap04combined.sgm MH009v3(1999/07/12)
PROCESS VARIABLES—FIELD INSTRUMENTATION 4.105
FIGURE 73 Wet gas installation. FIGURE 74 Installation of liquids carrying gas.
In addition, in installations above 25 in in inner pipe diameter, the pitot tube should have acounterbearing. With liquids or high velocities, such an installation is recommended from 20 in.
Pitot tubes should be operated at not more than 25 to 50 percent of their limit differential pressureto prevent them from vibrating under full load (see Fig. 78).
Steam and Gas—Flow Computer Applications
All steam, gas, and liquid applications are uncompensated volumetric and mass flow rate measure-ments for operating conditions. They are not compensated for temperature or pressure, which resultsin variations in density.
To compensate for these variations, a flow computer is necessary. To measure pressure and temper-ature the sensors must be selected according to the ranges and lengths of the application. A separatepressure and temperature sensor must be used.
Today, multivariable DP transmitters are also available. These transmitters have inputs for temper-ature and measure both pressure and DP. The flow computer may be integrated with these transmitters.
An installation for gas and saturated steam can include the parts specified in Fig. 79. For saturatedsteam, only the pressure compensation is required.
BASIC FLOW METERING CONSIDERATIONS
In selecting a flowmeter for any application, there are many different considerations to be made. Onesuch consideration is the purpose the measurement is to serve. Is the measurement for accounting orcustody transfer for which high accuracy and rangeability are very important? Or is the measurementfor control of a process for which accuracy may not be as important as repeatability is the prime

P1: xxx
1 September 1999 18:38 chap04combined.tex Chap04combined.sgm MH009v3(1999/07/12)
4.106 PROCESS/INDUSTRIAL INSTRUMENTS AND CONTROLS HANDBOOK
FIGURE 75 Upstream/downstream straight pipe lengths (ISO 5167) for orifice plate.
FIGURE 76 Transmitter mounted above pitot tube.

P1: xxx
1 September 1999 18:38 chap04combined.tex Chap04combined.sgm MH009v3(1999/07/12)
PROCESS VARIABLES—FIELD INSTRUMENTATION 4.107
FIGURE 77 Installation for wet gas measurement.
concern? Do you require a meter for rate of flow or total flow? Is local indication or a remote signalrequired? If remote output is required, is it to be a proportional signal such as 4–20 mA or is it to bea contact closure to stop or start another device such as a pump or solenoid valve or even a contact towarn of a potential hazard?
Other parameters include the physical properties of the fluid to be metered. Is it a gas or a liquidat the point of measurement? Is it a clean liquid, or is it a slurry? Is it electrically conductive? Whatis the operating temperature and the operating pressure? What flow rate and range of flow rates arethe meter to measure and expected to be able to withstand without failure?
All these parameters have a bearing on flowmeter selection. A great many types of flowmeters areavailable, but each type has some limitations. At this time, the perfect universal flowmeter has yet tobe invented and probably never will be. The degree of satisfaction with the meter’s performance isa function of how well the meter’s capabilities and shortcomings are matched with the requirementsand parameters of the application. Many meter technologies can be used or adapted to fit the purpose,but careful, informed meter selection pays off in performance.
DIFFERENTIAL-PRESSURE FLOWMETERS
Differential-pressure (DP) flowmeters have been used for many decades in numerous applications.In 1732 Henry Pitot invented the Pitot tube, and in 1791 Venturi did his basic work on the venturitube. Venturi developed the mathematical basis and much of the theory now used in contemporaryflowmeter computations. It was not until 1887 that Clemens Herschel developed a commerciallysatisfactory venturi tube.
Demands of the natural gas industry in 1903 led Thomas Weymouth to use a thin-plate, sharp-edged orifice to measure large volumes of gas. Throughout many years, DP flowmeters have enjoyedwide acceptance in the process and utility industries. Standards and vast amounts of engineering datahave been developed by numerous technical organizations, including the American Gas Association,
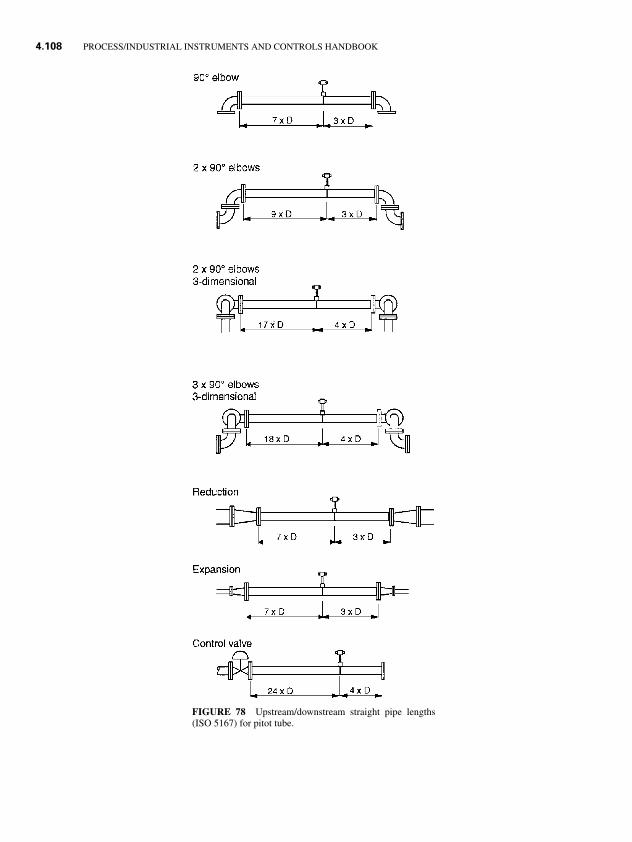
P1: xxx
1 September 1999 18:38 chap04combined.tex Chap04combined.sgm MH009v3(1999/07/12)
4.108 PROCESS/INDUSTRIAL INSTRUMENTS AND CONTROLS HANDBOOK
FIGURE 78 Upstream/downstream straight pipe lengths(ISO 5167) for pitot tube.

P1: xxx
1 September 1999 18:38 chap04combined.tex Chap04combined.sgm MH009v3(1999/07/12)
PROCESS VARIABLES—FIELD INSTRUMENTATION 4.109
FIGURE 79 Installation for gas and saturated steam.
the American Society of Mechanical Engineers, the Instrument Society of America, the AmericanNational Standards Institute, and the National Engineering Laboratory (Germany). Some guidancefor specifying DP flowmeters is given in Table 1, which lists the principal characteristics, includingadvantages and limitations.
Differential Producers
Flow is related to pressure by causing the flowing fluid to pass through some form of restriction in thetransport pipe, which creates a momentary loss of pressure. As will be explained shortly, this pressuredifferential is related mathematically to the flow rate.
VARIABLE-AREA FLOWMETERS
The principle of using differential pressure as a measure of flow rate, as described in the case of theorifice, venturi, and other devices, is also applied in variable-area flowmeters, but with one importantvariation. In the orifice meter there is a fixed aperture (restriction) and the flow rate is indicated as afunction of the differential pressure created. In the case of the variable-area meter there is a variableorifice and a relatively constant pressure drop. Thus the flow rate is indicated by the area of the annular
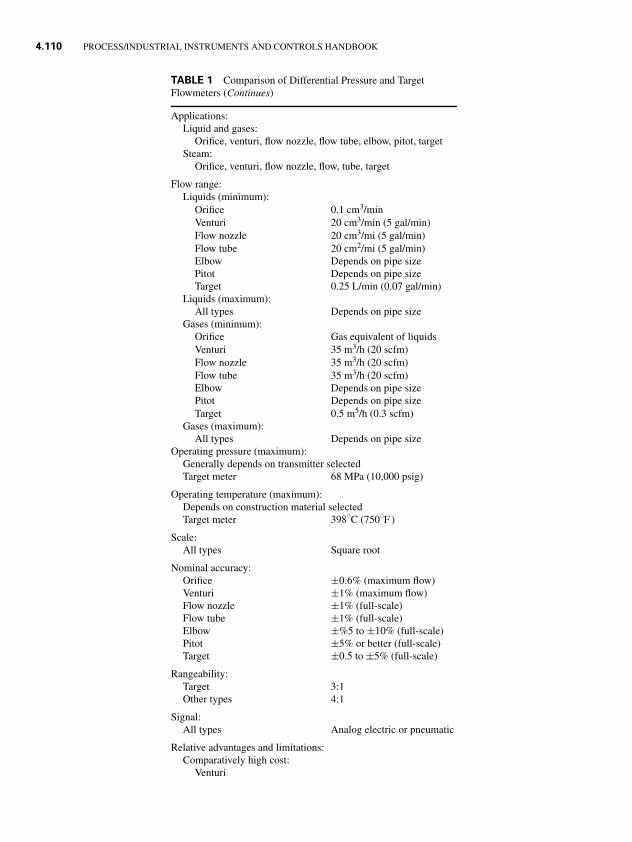
P1: xxx
1 September 1999 18:38 chap04combined.tex Chap04combined.sgm MH009v3(1999/07/12)
4.110 PROCESS/INDUSTRIAL INSTRUMENTS AND CONTROLS HANDBOOK
TABLE 1 Comparison of Differential Pressure and TargetFlowmeters (Continues)
Applications:Liquid and gases:
Orifice, venturi, flow nozzle, flow tube, elbow, pitot, targetSteam:
Orifice, venturi, flow nozzle, flow, tube, target
Flow range:Liquids (minimum):
Orifice 0.1 cm3/minVenturi 20 cm3/min (5 gal/min)Flow nozzle 20 cm3/mi (5 gal/min)Flow tube 20 cm2/mi (5 gal/min)Elbow Depends on pipe sizePitot Depends on pipe sizeTarget 0.25 L/min (0.07 gal/min)
Liquids (maximum):All types Depends on pipe size
Gases (minimum):Orifice Gas equivalent of liquidsVenturi 35 m3/h (20 scfm)Flow nozzle 35 m3/h (20 scfm)Flow tube 35 m3/h (20 scfm)Elbow Depends on pipe sizePitot Depends on pipe sizeTarget 0.5 m5/h (0.3 scfm)
Gases (maximum):All types Depends on pipe size
Operating pressure (maximum):Generally depends on transmitter selectedTarget meter 68 MPa (10,000 psig)
Operating temperature (maximum):Depends on construction material selectedTarget meter 398◦C (750◦F )
Scale:All types Square root
Nominal accuracy:Orifice ±0.6% (maximum flow)Venturi ±1% (maximum flow)Flow nozzle ±1% (full-scale)Flow tube ±1% (full-scale)Elbow ±%5 to ±10% (full-scale)Pitot ±5% or better (full-scale)Target ±0.5 to ±5% (full-scale)
Rangeability:Target 3:1Other types 4:1
Signal:All types Analog electric or pneumatic
Relative advantages and limitations:Comparatively high cost:
Venturi

P1: xxx
1 September 1999 18:38 chap04combined.tex Chap04combined.sgm MH009v3(1999/07/12)
PROCESS VARIABLES—FIELD INSTRUMENTATION 4.111
TABLE 1 (Continued )
Comparatively low cost:Orifice, flow nozzle, flow tube. Pitot, elbow, target
Comparatively easy to install:Orifice, elbow
Same transmitter can be used for variety of pipe sizes:Orifice, flow nozzle, flow tube. Pitot, elbow
Comparatively low pressure loss:Venturi, flow nozzle, flow tube
Good for dirty liquids and slurries:Orifice (if equipped with eccentric or segmental plates), venturi, target meter(especially for hot, tarry, and sediment-bearing materials)
Large and heavy:Venturi
Requires straight runs of piping (upstream, downstream):Orifice, target meter
Limited background engineering data:Flow nozzle, flow tube
Bidirectional flow measurement:Elbow
Minimum upstream straight piping:Elbow
Flow averaging:Pitot
Accuracy limited:Elbow
opening through which the flow must pass. This area is generally read out as the position of a float orobstruction in the orifice.
Frequently referred to as glass-tube flowmeters or rotameters, variable-area flowmeters are de-signed in three general configurations:
1. The tapered-tube meter, in which a float (usually of a density greater than the fluid being measured)is contained in an upright glass tube, which is tapered, that is, the bottom of the tube is of a somewhatsmaller diameter than the top. Thus the area or concentric orifice through which the fluid flows isgreater as the float rises in the tube. The term rotameter arose from early technology when the rotorwas slotted and thus rotated by the flowing fluid. The float is lifted to a position of equilibriumbetween the downward (gravity) force and the upward force caused by the flowing medium. Latertechnology introduced rod- or rib-guided nonrotating floats.
2. The orifice and tapered-plug meter, which is equipped with a fixed orifice mounted in an uprightchamber. The float has a tapered body with the small end at the bottom and is allowed to movevertically through the orifice. The fluid flow causes the float to seek an equilibrium position.
3. The piston-type meter, in which a piston is fitted accurately inside a sleeve and is uncovered topermit the passage of fluid. The flow rate is indicated by the position of the piston.
Schematic diagrams of the different types of variable-area flowmeters are shown in Fig. 1Floats are made from numerous corrosion-resistant materials. For ordinary service, metering tubes
are borosilicate glass. Metal tubes (partial or full) are used for high-pressure and hazardous applica-tions, thus requiring a magnetic coupling to the float position to provide flow-rate indication. Floatdesigns have varied over the years. Earlier meters were affected to some degree by viscosity changes
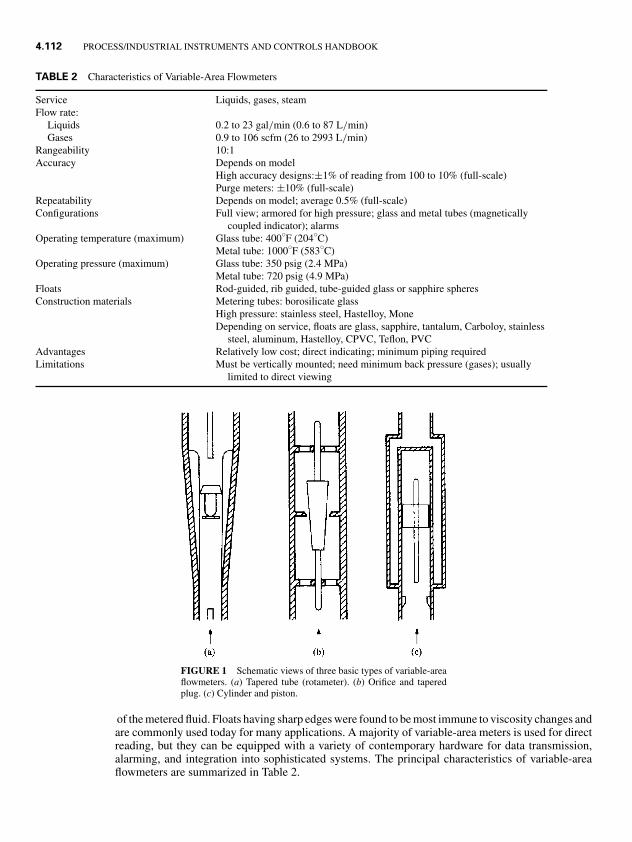
P1: xxx
1 September 1999 18:38 chap04combined.tex Chap04combined.sgm MH009v3(1999/07/12)
4.112 PROCESS/INDUSTRIAL INSTRUMENTS AND CONTROLS HANDBOOK
TABLE 2 Characteristics of Variable-Area Flowmeters
Service Liquids, gases, steamFlow rate:
Liquids 0.2 to 23 gal/min (0.6 to 87 L/min)Gases 0.9 to 106 scfm (26 to 2993 L/min)
Rangeability 10:1Accuracy Depends on model
High accuracy designs:±1% of reading from 100 to 10% (full-scale)Purge meters: ±10% (full-scale)
Repeatability Depends on model; average 0.5% (full-scale)Configurations Full view; armored for high pressure; glass and metal tubes (magnetically
coupled indicator); alarmsOperating temperature (maximum) Glass tube: 400◦F (204◦C)
Metal tube: 1000◦F (583◦C)Operating pressure (maximum) Glass tube: 350 psig (2.4 MPa)
Metal tube: 720 psig (4.9 MPa)Floats Rod-guided, rib guided, tube-guided glass or sapphire spheresConstruction materials Metering tubes: borosilicate glass
High pressure: stainless steel, Hastelloy, MoneDepending on service, floats are glass, sapphire, tantalum, Carboloy, stainless
steel, aluminum, Hastelloy, CPVC, Teflon, PVCAdvantages Relatively low cost; direct indicating; minimum piping requiredLimitations Must be vertically mounted; need minimum back pressure (gases); usually
limited to direct viewing
FIGURE 1 Schematic views of three basic types of variable-areaflowmeters. (a) Tapered tube (rotameter). (b) Orifice and taperedplug. (c) Cylinder and piston.
of the metered fluid. Floats having sharp edges were found to be most immune to viscosity changes andare commonly used today for many applications. A majority of variable-area meters is used for directreading, but they can be equipped with a variety of contemporary hardware for data transmission,alarming, and integration into sophisticated systems. The principal characteristics of variable-areaflowmeters are summarized in Table 2.

P1: xxx
1 September 1999 18:38 chap04combined.tex Chap04combined.sgm MH009v3(1999/07/12)
PROCESS VARIABLES—FIELD INSTRUMENTATION 4.113
MAGNETIC FLOW MEASUREMENT
General
The first magnetic flow-measuring system for closed pipes was developed in 1939 by a Swiss FatherBonaventura Thurlemann.
Magnetic flowmeters have been used for more than 50 years. Their construction and measuringfeatures make them the ideal instruments for flow measurement of aqueous liquids.
The advantages of the instrument are now so well known that there is scarcely a branch of industrythat does not utilize these advantages.
Because of continuing technical improvements in the electronics—advancing from valves throughtransistors to the microprocessor and to its construction (new electrodes and lining materials)—manyversions are now available to the end user to fit specific requirements.
A conventional magnetic flowmeter comprises a sensor that receives a signal from the flowingliquid and a transmitter that converts this signal into a normalized current or pulse per unit of volumeor time.
Magnetic flowmeter prices are comparable to that of orifice plates. Magnetic flowmeters areoffered in both compact and conventional versions. In compact meters the sensor and transmitterform one mechanical unit; the measuring signal is converted into a current or pulse signal directly atthe measuring point.
The latest generation of magnetic flowmeters has a microprocessor as a central control module.This microprocessor has taken over the functions performed in the past by discrete hardware. Withthe microprocessor changes in measuring ranges, time constants, and other parameters are easilyprogrammable with specific limits.
For example, by push button it is possible to change a current output from 0–20 mA to 4–20 mAor pulse value from 1 to 20 gal per pulse. This technique is not only simple and reliable, but it alsosimplifies spare parts’ stocking requirements, since the same electronics are used on all instruments.
Measuring Principle
Faraday’s law of induction is the basis for magnetic flow measurement. When a conductor moves ina magnetic field, then a voltage is generated in this conductor (see Fig. 2);
Ue = B · L · v
where B = the strength of the magnetic field (induction)L = the length of the conductor (distance of electrodes)v = velocity of the conductor (average flow velocity)
FIGURE 2 Magprin.

P1: xxx
1 September 1999 18:38 chap04combined.tex Chap04combined.sgm MH009v3(1999/07/12)
4.114 PROCESS/INDUSTRIAL INSTRUMENTS AND CONTROLS HANDBOOK
FIGURE 3 Formula.
In magnetic flow measurement, the conductor is the flowing electrically conductive liquid.A cross section of liquid generally has no specific velocity. However, calculations show that the
voltage generated between two opposite points on the inner pipe wall islargely independent of the velocity profile. Therefore the formula men-tioned above also relates to liquids if the average flow velocity is substitutedfor v.
The magnetic field is generated by two coils that are energized by eitheran ac power line voltage or by pulsed dc voltage. The induced voltage Ue
is received by two insulated electrodes. The insulation separation of thefluid being measured from the metal pipe is achieved by a lining mate-rial.
Electrode axis, magnetic field, and direction of flow are perpendicularto each other. The induced voltage at the electrodes (U) is proportional tothe induction (B), to the flow velocity (v), and to the distance between the
electrodes (L). Considering that the induction (B) and the distance between the electrodes (L) areconstant values, the equation given in Fig. 3 (see also Fig. 4).
FIGURE 4 Measuring system.
Sensor
A magnetic flowmeter always comprises a nonfer-romagnetic pipe (magnetically nonconductive) witha lining material, one or two coils with a magneticcore, and two measuring electrodes (see Fig. 5).
Construction
The measuring pipe is generally stainless steel (304SS, 1.4301) with flanges to ANSI, DIN, SA, ASA,BS, or JIS standards. Plastic pipes can also be used.
The lining material separates the pipe from the liquid being measured. This is not required onplastic pipes. Standard lining materials, depending on application, temperature, and material beingmeasured, are hard or soft rubber, polyurethane, Teflon, enamel, and ceramic (AI2O3) (see Table onnext page).
FIGURE 5 Theory to practice.

P1: xxx
1 September 1999 18:38 chap04combined.tex Chap04combined.sgm MH009v3(1999/07/12)
PROCESS VARIABLES—FIELD INSTRUMENTATION 4.115
Liner Materials for Magnetic Flowmeters—Common Types
Liner Brand Name Fluid Temp. Industry
EPDM Keltan, Vistalon −58◦ to +248◦F Chemical, mining(soft rubber)
Ebonite, SBR max. 176◦F Chemical, waste, paper,(hard rubber) wastewater, Drinking water
PTFE Teflon −40◦ to +356◦F Chemical, paper, food,heat measurement
PFA Teflon max. 392◦F Chemical, food, water,pharma, general purposes
FEP (bound) Teflon 212◦F Chemical, foodCeramic −40◦ to +392◦F Wastewater, biochemical,
pharmaPU Polyurethane −4◦ to +176◦F Chemical, mining,
wastewaterCR Neoprene, Bayprene max. 176◦F Wastewater,
chlorinated waterPP Polypropylene max. 140◦F Petrochemical,
general purposesNR Natural rubber 176◦F Mining, aggregate,
cement, concretePVDF max. 392◦F Chemical, food, water,
general purposes
The electrodes receive the signals and are therefore insulated from the pipe. The electrodes are incontact with the liquid being measured.
Consequently, corrosion-resistant electrode materials must be used such as stainless steel, hastelloy,tantalum, titanium, platinum/rhodium, and plastics or graphite. Electrode material selection can havea significant impact on the meter’s price.
Application Areas
All aqueous solutions, such as water, effluent, clear sludge, pastes, juices, acids, and others can bemeasured with a magmeter. Select a version that is compatible with the minimum conductivity of theliquid being measured.
Petrochemicals, such as petroleum, benzene, and diesel fuel cannot be measured with the magneticflow principle because of their low conductivity (for example, gasoline = 0.00000001 Ms/cm). Forthese substances, mechanical or other measuring techniques should be selected such as Coriolis orvortex flowmeters.
Accurate flow measurement is not affected by temperature, pressure, density, or viscosity ofthe liquid. The effect of the flow profile on the measurement is minimal, since the magnetic fieldis positioned in such a way that each point within the flow diameter in the area of the electrodescontributes to the measuring voltage (in millivolts). Measuring range full scale (100 percent) spansfrom 0.03 to 33 ft/s (1000:1).
The instrument can be installed at almost any position in the pipe, but vertical mounting is preferred.This prevents asymmetrical buildup on the electrodes and prevents air pockets from insulating theelectrodes. The meter should be installed at a distance of at least 3 to 5 straight pipe diameters afterequipment that generates turbulence (such as valves and restrictions).

P1: xxx
1 September 1999 18:38 chap04combined.tex Chap04combined.sgm MH009v3(1999/07/12)
4.116 PROCESS/INDUSTRIAL INSTRUMENTS AND CONTROLS HANDBOOK
FIGURE 6 Installation hints.
FIGURE 7 Inlet and outlet runs.
Magmeter Installation Tips and Suggestions
Inlet and outlet runs. The sensor should be mountedupstream from fittings liable to generate turbulence;areas around valves, elbows, and T-junctions, for ex-ample (see Fig. 7).
Inlet run : >3 · · · 5 × DNOutlet run : >2 × DN
Mounting location. Correct measurement is pos-sible only when the pipe is full (see Fig. 8). Thefollowing locations should therefore be avoided:
• No installation at the highest point (air accumu-lation);
• No installation immediately before an open pipeoutlet in a downward line. The alternative sug-gestion, however, permits such a location
Partly filled pipes. For inclines, a mounting similarto a drain should be adopted. Do not mount the sensorat the lowest point (risk of solids collecting). Addedsecurity is offered by empty pipe detection (EPD).This option has an extra electrode in the measur-ing pipe. Note: Here too, the inlet and outlet lengthsshould be observed (see Fig. 9).
Download pipe. With the installation suggested below, no partial vacuum is created with suchdownward pipe >5 m long (siphon, vent valve downstream of the sesor). (see Fig. 10).
Installation of pumps. Do not mount the sensors on the suction side of pumps (see Fig. 11). Thereis a risk of vacuum!
Adapters. The sensor can also be mounted in a pipe with a larger nominal diameter when suitableadapters (reducers and expanders) to DIN 28545 are fitted. The resultant increase in the rate of flowincreases the accuracy of measurement with slowly moving fluids.
The nomogram given below can be used to determine the pressure loss caused.Procedure:
1. Determine the ratio of the diameters d/D.
2. From the nomogram, read off the pressure loss at the flow velocity and d/D ratio.
Note: The nomogram applies to fluids with a viscosity similar to that of water (see Fig. 12).
What can be measured with a magnetic flow meter?
Chemicals Acids, alkaline solutions, solvents, cooling liquids (glycol) additivesFood Water, beer, wine, spirits, milk, yogurt, soft cheese, juices, molasses,
sugar, and salt solutions, blood, sausage pulpMetal industry Pump control, cooling water, circulated waterEffluent Effluent, raw sludge, purified sludge, neutralization chemicals, milk
of lime, flocculantsDrinking water Supply water, reservoir and pumping stations, consumptionWood chip Measurement and dosing of glue, pulp stockTextiles Water, chemicals, dyes, bleaching agentsPhotography EmulsionsPower station Differential measurement of cooling circuits, heat quantity measurementAnimal feed Water, molasses, liquid feed
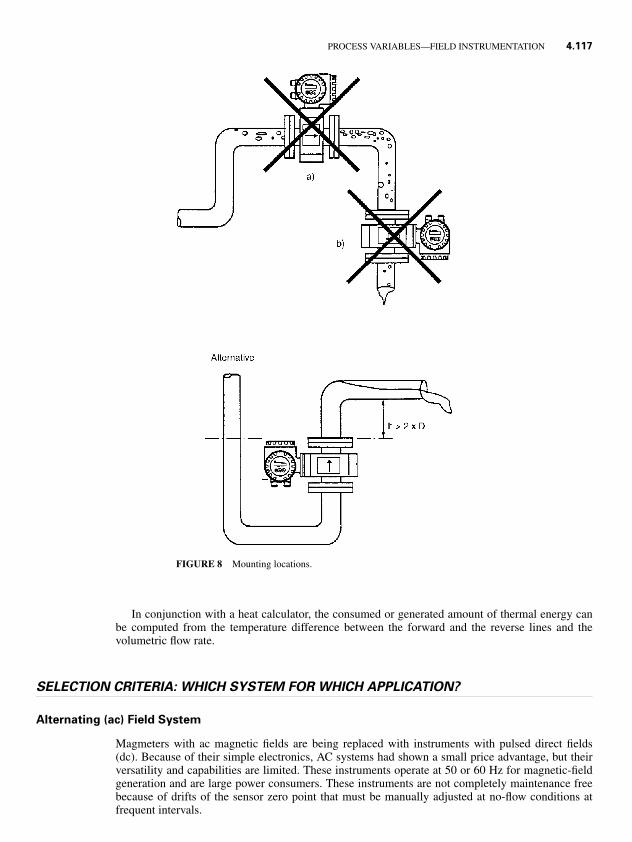
P1: xxx
1 September 1999 18:38 chap04combined.tex Chap04combined.sgm MH009v3(1999/07/12)
PROCESS VARIABLES—FIELD INSTRUMENTATION 4.117
FIGURE 8 Mounting locations.
In conjunction with a heat calculator, the consumed or generated amount of thermal energy canbe computed from the temperature difference between the forward and the reverse lines and thevolumetric flow rate.
SELECTION CRITERIA: WHICH SYSTEM FOR WHICH APPLICATION?
Alternating (ac) Field System
Magmeters with ac magnetic fields are being replaced with instruments with pulsed direct fields(dc). Because of their simple electronics, AC systems had shown a small price advantage, but theirversatility and capabilities are limited. These instruments operate at 50 or 60 Hz for magnetic-fieldgeneration and are large power consumers. These instruments are not completely maintenance freebecause of drifts of the sensor zero point that must be manually adjusted at no-flow conditions atfrequent intervals.

P1: xxx
1 September 1999 18:38 chap04combined.tex Chap04combined.sgm MH009v3(1999/07/12)
4.118 PROCESS/INDUSTRIAL INSTRUMENTS AND CONTROLS HANDBOOK
FIGURE 9 Partly filled pipes.
FIGURE 10 Downward pipe.
FIGURE 11 Installation of pumps.
Pulsed Direct (dc) Field Systems
Because of the automatic zero correction (AUTOZERO) feature, dc systems are particularly suitablefor the following applications:
• liquids for materials with wide temperature and conductivity changes
• widely varying ambient temperatures
• liquids that tend to form a buildup inside the pipe

P1: xxx
1 September 1999 18:38 chap04combined.tex Chap04combined.sgm MH009v3(1999/07/12)
PROCESS VARIABLES—FIELD INSTRUMENTATION 4.119
FIGURE 12 Nomogram.
Because of the high input impedance (1012 ohms) amplifier designs, even buildup of nonconductivematerial will have negligible effects on measuring performance. But too much buildup will cause theentire pipe’s I.D. to be reduced, causing a permanent shift on the readings.
Power consumption is much lower. Therefore it is possible to drive these instruments for a low-voltage supply. Many of the microprocessor-controlled magmeters have a power consumption for alldiameters of 15 VA.

P1: xxx
1 September 1999 18:38 chap04combined.tex Chap04combined.sgm MH009v3(1999/07/12)
4.120 PROCESS/INDUSTRIAL INSTRUMENTS AND CONTROLS HANDBOOK
The Inductive Flowmeter for Special Measurement Problems
Specific advantages of current magmeters have led to their increased use over traditional mechanicalmeasuring devices. Designs are available to operate on very fast running events with short cycle timeswhile achieving excellent repeatability.
The instrument is used in the food, pharmaceutical, and chemical industries in which a requiredvolume fills a specific container. Magmeters are also used in applications in which the noise level isexcessively high such as in slurry measurement or foods with solids, like yogurt with fruit, or soupscontaining vegetables.
Advantages:
� excellent repeatability: ±0.1 percent� cleaning without removing from the line (CIP)� no moving parts and therefore no wear� ability to adjust for any desired volume� internal preset counter (batching)� measurement of tailoff, no costly pressure regulators necessary� simple setup and installation
General magmeter advantages:
� Measurement not affected by physical properties of liquid being measured, such as temperature,pressure, viscosity
� No mechanical moving parts, therefore no wear and tear, maintenance free� No diameter reduction, therefore no additional pressure loss� Ideal for heavily contaminated liquids, sludge, entrained solids—but note velocity (see below)� Wide range of diameters� Excellent linearity over wide dynamic range and accuracies as high as ±0.2 percent� Largely independent of flow profile� Short straight in and out requirements� High measuring reliability—no drift� Can be cleaned in place (CIP)� Bidirectional measurement� Installed ground electrodes eliminate extraneous hardware like grounding rings� Transmitter repair or replacement simple and convenient without shutting down the line, and requires
no sensor recalibration
Limitations
� Only conductive liquids can be measured. Min. cond. 1 µS/cm (µmho), no gas or steam� Buildup in pipes causes error because of reduction in pipe diameter� Temperature and pressure limitations (technical specifications) of various liner materials
Recommended Flow Velocities
Normal liquids 6 to 15 ft/sAbrasives <5 ft/sSludges >5 ft/sHigh percentage of suspended solids >5 ft/s

P1: xxx
1 September 1999 18:38 chap04combined.tex Chap04combined.sgm MH009v3(1999/07/12)
PROCESS VARIABLES—FIELD INSTRUMENTATION 4.121
TURBINE FLOWMETERSby Bill Roeber*
Turbine flowmeters consist of a rotating device, called rotor, that is positioned in the fluid path of aknown cross-sectional area, the body or pipe, in such a manner that the rotational velocity of the rotoris proportional to the fluid velocity. Since the cross-sectional area of the pipe is known, fluid velocitycan be converted directly to volumetric flow rate by counting the number of turbine-wheel revolutionsper unit of time. The following equation relates the conversion from fluid velocity (feet per second)to volumetric flow rate (gallons per minute):
Q = v × A × C
where Q = volumetric flow ratev = fluid velocityA = cross-sectional areaC = constant
k Factor
A turbine flowmeter’s K factor is determined by the manufacturer by displacing a known volume offluid through the meter and summing the number of pulses generated by the meter. This summationof pulses, divided by the known volume of fluid that has passed through the turbine flowmeter, is theK factor. The turbine flowmeter’s K factor is specified to be linear, within a tolerance, over a 10:1range of flow rates. Extended flow ranges (greater than 10:1) normally restrict the user to specificfluid parameters. A representative graph of common turbine flowmeter characteristics is given inFig. 13.
Reynolds Numbers
An important condition affecting the flow measurement is the Reynolds number of the fluid beingmeasured. Reynolds numbers represent a unitless value that defines the ratio of a fluid’s inertial forcesto its drag forces. The Reynolds number equation relating these forces is
R = 3160 × Q × Gt
D × µ
where R = Reynolds numberQ = fluid flow rate, gal/minGt = fluid specific gravityD = inside pipe diameter, inchesµ = liquid viscosity, centipoise (cP)
The fluid flow rate and specific gravity represent inertial forces; the pipe diameter and viscosityare the drag forces. In a typical system the specific gravity and the pipe diameter are constants.Consequently low Reynolds numbers exist when the fluid flow rate is low or the fluid viscosityis high. The problem with measuring the flow of fluids with low Reynolds numbers using turbineflowmeters is that the fluid will have a higher velocity at the center of the pipe than along the pipe’sinside diameter. This results in a K factor that is not constant over the flow rate range of the turbineflowmeter.
∗Great Lakes Instruments, Inc., Milwaukee, Wisconsin.
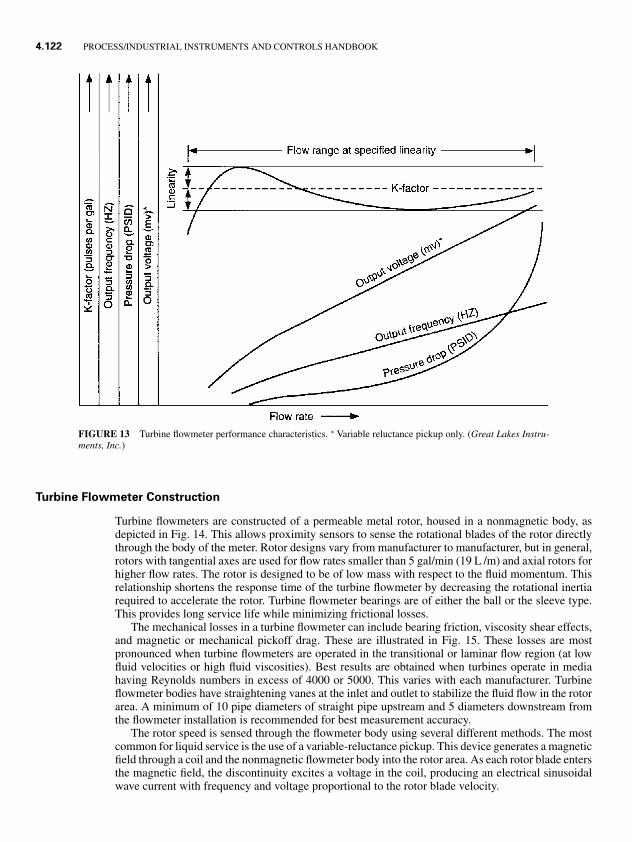
P1: xxx
1 September 1999 18:38 chap04combined.tex Chap04combined.sgm MH009v3(1999/07/12)
4.122 PROCESS/INDUSTRIAL INSTRUMENTS AND CONTROLS HANDBOOK
FIGURE 13 Turbine flowmeter performance characteristics. ∗ Variable reluctance pickup only. (Great Lakes Instru-ments, Inc.)
Turbine Flowmeter Construction
Turbine flowmeters are constructed of a permeable metal rotor, housed in a nonmagnetic body, asdepicted in Fig. 14. This allows proximity sensors to sense the rotational blades of the rotor directlythrough the body of the meter. Rotor designs vary from manufacturer to manufacturer, but in general,rotors with tangential axes are used for flow rates smaller than 5 gal/min (19 L /m) and axial rotors forhigher flow rates. The rotor is designed to be of low mass with respect to the fluid momentum. Thisrelationship shortens the response time of the turbine flowmeter by decreasing the rotational inertiarequired to accelerate the rotor. Turbine flowmeter bearings are of either the ball or the sleeve type.This provides long service life while minimizing frictional losses.
The mechanical losses in a turbine flowmeter can include bearing friction, viscosity shear effects,and magnetic or mechanical pickoff drag. These are illustrated in Fig. 15. These losses are mostpronounced when turbine flowmeters are operated in the transitional or laminar flow region (at lowfluid velocities or high fluid viscosities). Best results are obtained when turbines operate in mediahaving Reynolds numbers in excess of 4000 or 5000. This varies with each manufacturer. Turbineflowmeter bodies have straightening vanes at the inlet and outlet to stabilize the fluid flow in the rotorarea. A minimum of 10 pipe diameters of straight pipe upstream and 5 diameters downstream fromthe flowmeter installation is recommended for best measurement accuracy.
The rotor speed is sensed through the flowmeter body using several different methods. The mostcommon for liquid service is the use of a variable-reluctance pickup. This device generates a magneticfield through a coil and the nonmagnetic flowmeter body into the rotor area. As each rotor blade entersthe magnetic field, the discontinuity excites a voltage in the coil, producing an electrical sinusoidalwave current with frequency and voltage proportional to the rotor blade velocity.

P1: xxx
1 September 1999 18:38 chap04combined.tex Chap04combined.sgm MH009v3(1999/07/12)
PROCESS VARIABLES—FIELD INSTRUMENTATION 4.123
FIGURE 14 Typical axial-rotor [0.5- to 3-inch (12.7- to 76.2-mm)] turbine flowmeterconstruction. (Great Lakes Instruments, Inc.)
FIGURE 15 Standard turbine flowmeter rotor losses. (Rockwell International.)

P1: xxx
1 September 1999 18:38 chap04combined.tex Chap04combined.sgm MH009v3(1999/07/12)
4.124 PROCESS/INDUSTRIAL INSTRUMENTS AND CONTROLS HANDBOOK
Another popular method of sensing rotor speed is with a modulated-carrier electronic pickup. Thistype of pickup is designed to eliminate the physical loss caused by magnetic drag with the variable-reluctance pickup. This is especially important in low-velocity and gas flowmetering applications.The modulated-carrier pickup generates a “carrier” signal of a frequency much higher than that ofthe rotor blade. A coil, which is integral to the high-frequency oscillator, is positioned near the rotor.As each blade passes the coil, eddy-current losses in the coil increase, causing the amplitude of thecarrier signal to decrease until the blade has passed. Filtering out the high-frequency component ofthe carrier retains the “modulated” signal, which is proportional to the fluid velocity.
Turbine Flowmeter Applications
Turbine flowmeters accurately measure flow over a large range of operating conditions. Primary usesinclude flow totalizing for inventory control and custody transfer, precision automatic batching fordispensing and batch mixing, and automatic flow control for lubrication and cooling applications.Typical measurement accuracy is ±0.5 percent of reading over a 10:1 flow range (turn-down ratio)and repeatability within ±0.05 percent of rate. A degradation in performance can be expected if thereare variations in fluid viscosity, swirling of fluid within the pipes, or contamination which causespremature bearing wear. Turbine flowmeters are available for pipe sizes of 0.5 to 24 inches (12.7 to610 mm) and flow ranges to 50,000 gal/min (11,358 m3/h). Working pressures are generally determinedby the inlet and outlet connections. Some designs are capable of working pressures in excess of 10,000psig (68,950 kPa). Temperature limits are imposed by the pickup electronics. Most manufacturersspecify 400◦F (204◦C) standard and extend to greater than 800◦F (427◦C) on special order. Popularend fitting connection styles include NPT, flared tube, flanged, sanitary, ACME, grooved, and wafer.
Paddle-Wheel Flowmeters
The paddle-wheel-type flowmeter, also referred to as an impeller flowmeter, is characterized in muchthe same way as the turbine flowmeter. The rotating portion of the flowmeter, called the rotor orimpeller is positioned into the outside perimeter of the liquid path. As the liquid moves past the rotor,a moment is imposed on the blades of the rotor that are present in the stream. This moment causes therotor to accelerate to a velocity equal to the liquid velocity. Since the cross-sectional area of the pipeis known, the volumetric flow rate can be easily obtained from the liquid velocity. The paddle-wheelflowmeter has inherently lower cost because the same sensing mechanism can be used with severalpipe sizes and hardware configurations. Paddle-wheel flowmeters require a full pipe for operation andmeasure liquid velocities between 0 and 30 ft/s (9.1 m/s). This technology has typical linearity of +1percent of full-scale and a repeatability of ±0.5 percent of full-scale. Operating conditions includepressures up to 2000 psig (139 kPa) and temperatures to 400◦F (204◦C).
Various types of mounting hardware adapt the paddle-wheel flowmeter to installation require-ments. These include T-mounts, as shown in Fig. 16, insertion mounts for use with pipe saddles andweldments, spool pieces for mounting the sensor between pipe flanges, and hot tap hardware, whichallows the insertion sensor to be serviced without depressurizing the system in which it is installed.The characteristics of turbine flowmeters are summarized in Table 3.
OSCILLATORY FLOWMETERS
As with the turbine flowmeter, the oscillatory meters sense a physical property of a moving fluid thatis related to stream velocity. There are two principal meters in this classification, (1) vortex metersand (2) fluidic meters. Vortex meters are classified as vortex shedding or vortex precision types.
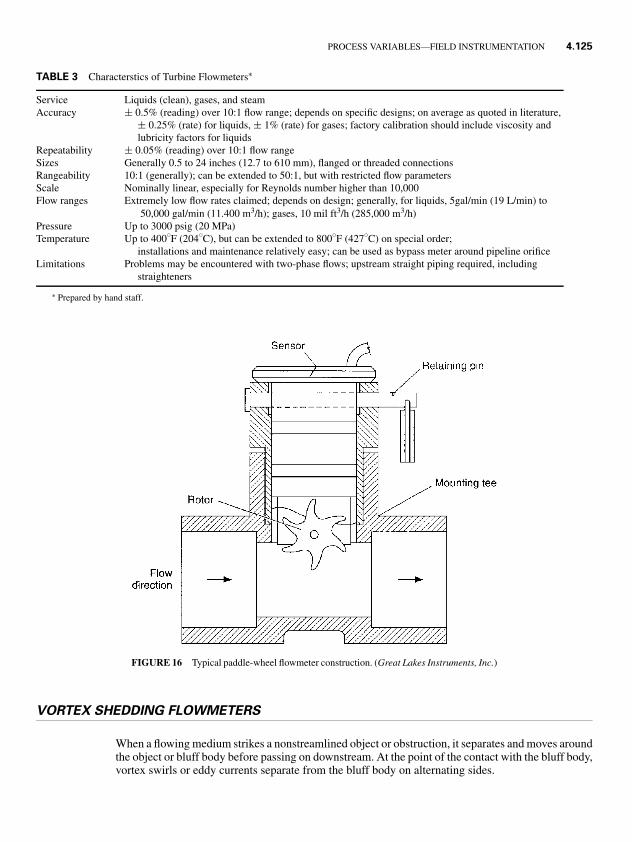
P1: xxx
1 September 1999 18:38 chap04combined.tex Chap04combined.sgm MH009v3(1999/07/12)
PROCESS VARIABLES—FIELD INSTRUMENTATION 4.125
TABLE 3 Characterstics of Turbine Flowmeters∗
Service Liquids (clean), gases, and steamAccuracy ± 0.5% (reading) over 10:1 flow range; depends on specific designs; on average as quoted in literature,
± 0.25% (rate) for liquids, ± 1% (rate) for gases; factory calibration should include viscosity andlubricity factors for liquids
Repeatability ± 0.05% (reading) over 10:1 flow rangeSizes Generally 0.5 to 24 inches (12.7 to 610 mm), flanged or threaded connectionsRangeability 10:1 (generally); can be extended to 50:1, but with restricted flow parametersScale Nominally linear, especially for Reynolds number higher than 10,000Flow ranges Extremely low flow rates claimed; depends on design; generally, for liquids, 5gal/min (19 L/min) to
50,000 gal/min (11.400 m3/h); gases, 10 mil ft3/h (285,000 m3/h)Pressure Up to 3000 psig (20 MPa)Temperature Up to 400◦F (204◦C), but can be extended to 800◦F (427◦C) on special order;
installations and maintenance relatively easy; can be used as bypass meter around pipeline orificeLimitations Problems may be encountered with two-phase flows; upstream straight piping required, including
straighteners
∗ Prepared by hand staff.
FIGURE 16 Typical paddle-wheel flowmeter construction. (Great Lakes Instruments, Inc.)
VORTEX SHEDDING FLOWMETERS
When a flowing medium strikes a nonstreamlined object or obstruction, it separates and moves aroundthe object or bluff body before passing on downstream. At the point of the contact with the bluff body,vortex swirls or eddy currents separate from the bluff body on alternating sides.

P1: xxx
1 September 1999 18:38 chap04combined.tex Chap04combined.sgm MH009v3(1999/07/12)
4.126 PROCESS/INDUSTRIAL INSTRUMENTS AND CONTROLS HANDBOOK
Velocity IncreasePressure Decrease
Velocity DecreasePressure Increase
Flow
Net Pressure
FIGURE 17 Vortex diagram.
When this occurs, the separation or shedding causes an in-crease in pressure and a decrease in velocity on one side ofthe object. Simultaneously, a decrease in pressure with corre-sponding increase in velocity occurs on the other side of theobject. After shedding from one side, the process is reversed,and a swirl or vortex is shed on the other side of the bluff body.The bluff body is sometimes referred to as a shedder bar (seeFig. 17).
In this way the vortex swirls are shed continuously, always180 degrees out of phase with each other. The frequency of theshedding process is determined by the velocity of the materialflowing past the bluff body or shedder bar. Each vortex swirlis of the same volume, without regard to the flowing medium.
The manufacturer performs a wet-flow calibration as part ofthe manufacturing process, during which the meter’s K factoris determined. The K factor indicates how many pulses thereare to a unit of volume, typically either gallon or liter. ThisK factor remains constant over the useful life of the meter
and is determined by the meter body and the shedder bar dimensions. Unless corrosion or erosiondrastically alters those dimensions, the meter will remain accurate. Therefore periodic recalibrationis not required.
Typical vortex frequencies range from as low as one or two cycles per second to thousands ofcycles per second, depending on flowing velocity, flowing medium, and meter size. Meters measuringgas normally have frequencies approximately 10 times the frequency found on meters in liquidapplications. This is because gas-flowing velocities are normally much higher than liquid velocities inthe same size pipeline. Smaller-sized meters normally have higher vortex shedding frequencies thanlarge meters.
Vortex meter output is a linear function. The output signal may be either a 4–20-mA analog or apulse/frequency as required. Accuracies of ±1 percent of rate or better are typical.
Application Guidelines
The vortex meter works well on relatively clean liquids, gas, and steam that do not contain a significantamount of solids. The liquid should also have a relatively low viscosity. The limiting factor for liquidis the Reynolds Number (Re). Typically the vortex meter is completely linear down to Re = 20,000.Below that Re the vortex shedding process becomes less regular. Vortex meters may be used belowthat down to as low as Re = 4000, at a slight loss in accuracy. Below Re = 4000 the vortex meter isnot reliable.
In gas applications, the density of the gas is an important consideration. At a very low flowingvelocity, a low-density gas has very little energy in the vortex swirl. At some point the energy presentis too low for the sensor to detect the presence of flow and the meter goes to a zero flow condition.
For the most part, vortex meter application strengths fall within the same applications traditionallyserved by the orifice plate and differential pressure meter for many years—namely, clean liquids oflow viscosity, gas, and steam.
Vortex Meter Advantages
Accuracy and rangeability are the main advantages of the vortex meter. The rangeability of the typicalvortex meter is 20:1 and sometimes even higher. Ranges of 45:1 are possible, depending on theviscosity of the liquid or the density of the gas (see Figs. 18–20).
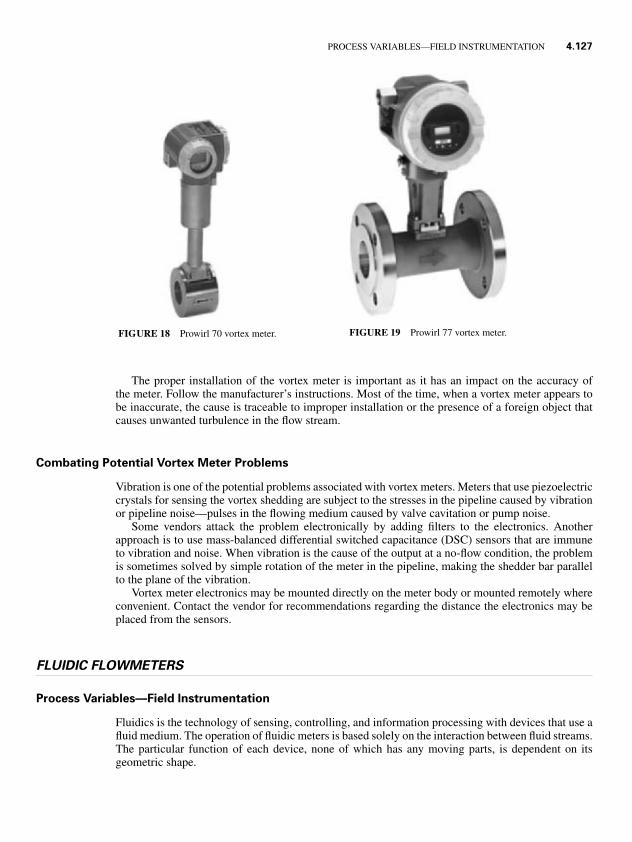
P1: xxx
1 September 1999 18:38 chap04combined.tex Chap04combined.sgm MH009v3(1999/07/12)
PROCESS VARIABLES—FIELD INSTRUMENTATION 4.127
FIGURE 19 Prowirl 77 vortex meter.FIGURE 18 Prowirl 70 vortex meter.
The proper installation of the vortex meter is important as it has an impact on the accuracy ofthe meter. Follow the manufacturer’s instructions. Most of the time, when a vortex meter appears tobe inaccurate, the cause is traceable to improper installation or the presence of a foreign object thatcauses unwanted turbulence in the flow stream.
Combating Potential Vortex Meter Problems
Vibration is one of the potential problems associated with vortex meters. Meters that use piezoelectriccrystals for sensing the vortex shedding are subject to the stresses in the pipeline caused by vibrationor pipeline noise—pulses in the flowing medium caused by valve cavitation or pump noise.
Some vendors attack the problem electronically by adding filters to the electronics. Anotherapproach is to use mass-balanced differential switched capacitance (DSC) sensors that are immuneto vibration and noise. When vibration is the cause of the output at a no-flow condition, the problemis sometimes solved by simple rotation of the meter in the pipeline, making the shedder bar parallelto the plane of the vibration.
Vortex meter electronics may be mounted directly on the meter body or mounted remotely whereconvenient. Contact the vendor for recommendations regarding the distance the electronics may beplaced from the sensors.
FLUIDIC FLOWMETERS
Process Variables—Field Instrumentation
Fluidics is the technology of sensing, controlling, and information processing with devices that use afluid medium. The operation of fluidic meters is based solely on the interaction between fluid streams.The particular function of each device, none of which has any moving parts, is dependent on itsgeometric shape.

P1: xxx
1 September 1999 18:38 chap04combined.tex Chap04combined.sgm MH009v3(1999/07/12)
4.128 PROCESS/INDUSTRIAL INSTRUMENTS AND CONTROLS HANDBOOK
Fluidics received considerable attention from the military in the 1960s as a control medium thatcould not be jammed, as is possible with unprotected electronic devices. The wall attachment fluidphenomenon (also called the Coanda effect) was first discovered in 1926 by Henri Coanda, a Rumanianengineer. The possible industrial application of fluidics was explored in the 1960s with the creationof amplifiers, valves, oscillators, and flowmeters, among other configurations.
Industrial fluidic flowmeters are currently available. These incorporate the principle of the fluidicoscillator (see Fig. 21).
In flowmeter applications, the fluidic oscillator has the advantages of
1. linear output with the frequency proportional to the flow rate,
2. rangeability up to 30:1,
3. being unaffected by shock, vibration, or field ambient-temperature changes,
FIGURE 20 Prowirl family of vortex meters.
FIGURE 21 Operating principles of fluidic flowmeter.

P1: xxx
1 September 1999 18:38 chap04combined.tex Chap04combined.sgm MH009v3(1999/07/12)
PROCESS VARIABLES—FIELD INSTRUMENTATION 4.129
4. calibration in terms of volume flow being unaffected by fluid density changes,
5. no moving points and no impulse lines.
A similar fluidic flowmeter, without diverging sidewalls, uses momentum exchange instead of theCoanda effect and has also proved effective in metering viscous fluids.
Fluidic Operating Principle
The geometric shape of the meter body is such that when flow is initiated, the flowing stream attachesto one of the sidewalls as a result of the Coanda effect. A portion of the main flow is diverted througha feedback passage to a control port.
The feedback flow increases the size of the separation bubble. This peels the main flow streamaway from the wall, until it diverts and locks onto the opposite wall, where the feedback action issimilar. The frequency of the self-induced oscillation is a function of the feedback flow rate. This rateis directly proportional to the flow rate of the mainstream (Moore Products).
Characteristics of Oscillatory Flow Meters
Flow range:Vortex shedding 3 to 5000 gal/min (11 to 19,000 L/min) for liquids
10 mil scfh (283,200 m3/h) for gasesFluidic (Coanda) 1 to 1000 gal/min (4 to 4000 L/min) for liquids
Accuracy:Vortex shedding ±1% (rate) or better for liquids
±2% (rate) for gases
Rangeability:Vortex shedding 20:1 or greaterFluidic (Coanda) up to 30:1
Scale:Vortex shedding Linear (high Reynolds numbers)Fluidic (Coanda) Linear (high Reynolds numbers)
Operating pressure:Vortex shedding Up to 3600 psig (25 MPa)Fluidic (Coanda) up to 600 psig (4 MPa)
Operating temperature:Vortex shedding Up to 750◦F (399◦C)Fluidic (Coanda) 0 to 250◦ (−©18 to 121◦C)
Advantages and limitations:Vortex shedding Requires straight piping
Sensitive to viscosity below minimum Reynolds numberNo moving partsHandles wide range of fluids, including steamRelatively good cost/performance ratio
Fluidic (Coanda) Requires straight pipingSensitive to viscosity below minimum Reynolds numberNo moving partsHandles wide range of liquidsRelatively good cost/performance ratioBypass types available
Size ranges:Vortex shedding 0.5 to 12 in (15 to 300 mm)Fluidic (Coanda) 1 to 4 in (25 to 100 mm)

P1: xxx
1 September 1999 18:38 chap04combined.tex Chap04combined.sgm MH009v3(1999/07/12)
4.130 PROCESS/INDUSTRIAL INSTRUMENTS AND CONTROLS HANDBOOK
MASS FLOW MEASUREMENT
Introduction
Traditionally flow measurement has been accomplished based on the volume of the flowing gas orfluid, even though the meter user may be more interested in the weight (mass) of the gas or liquid.Volumetric flowmeters are subject to ambient and process changes, such as density, that changewith temperature and pressure. Viscosity changes may also affect certain types of volumetric flowsensors.
Mass flow measurement can be categorized as true mass flow measurement or inferential massflow measurement. In the former, the mass flow is measured directly without regard to separatelymeasured density or other physical properties. For inferential measurement, it is necessary to measureproperties of the process such as temperature and pressure of a gas to infer the mass flow. For fluidswith unknown properties, true mass flow measurement will be required.
Certain meters that use heat capacity (thermal mass flowmeters) are sometimes referred to astrue mass flowmeters, since heat capacity is mass specific. But heat capacity is dependent on thefluid, and therefore the meter will read correctly if the fluid properties such as composition and heattransfer properties are known. To complicate the measurement, heat transfer is viscosity dependent.In contrast, a combination of a volumetric flowmeter and a density meter may be less dependent onthe fluid properties.
For a number of years there has been a great interest infinding methods of measuring mass flow directly, rather thancalculations alone to convert volume flow to mass flow. Intoday’s industrial applications there are commonly three waysto determine mass flow.
1. The inferential mass flow measurement—the application ofmicroprocessor-based volumetric flowmeter technology toconventional volumetric meters. Separate sensors respondto velocity or momentum and pressure, temperature, etc.
2. The use of Coriolis flowmeters, which measure mass flowdirectly.
3. The use of thermal mass flowmeters, which determine massflow by measuring heat dissipation between two points inthe pipeline.
h × d
hd = f T × f P
FLOW
RECORD√h × d
f T f P
(c)
h × d
d = f T
h
FLOW
RECORD√h × d
(b)
FLOW
h × d
d = f P
hRECORD√h × d
(a)
FIGURE 22 Method for compensating a volumetricflowmeter for mass flow.
Inferential Mass Flow Measurement(Microprocessor-BasedVolumetric Flowmeters)
As shown in Fig. 22 with a flow computer it isrelatively simple to compensate for a volumet-ric flow meter with a density meter of the vibrat-ing tube type. To compensate for temperature andpressure, it is helpful to know how well the gasfollows the gas laws (how the gas expands or con-tracts with changes in temperature and pressure)for that particular gas.
The pressure- and the temperature-measuringpoints should be located close to the point of

P1: xxx
1 September 1999 18:38 chap04combined.tex Chap04combined.sgm MH009v3(1999/07/12)
PROCESS VARIABLES—FIELD INSTRUMENTATION 4.131
volumetric flow measurements for the best accuracy. In some applications, this could be difficult,depending on the pipe configuration.
Examples of Mass Flow Measurement with Fluids of Known Properties
Flowmeters may have the ability to convert from volumetric flow to mass flow by obtaining additionalinformation from additional measurements. For example, differential pressure devices require a valuefor actual density ρ for both volumetric and mass measurement. This may be obtained with a densitycell (density measurement from a Coriolis mass flowmeter) of some sort or by measurement of theactual pressure p and actual temperature T for a gas and calculation of the actual density ρ when thegas law for that particular gas is known.
With the differential pressure �p and additional sensor specific constants, this then provides a valuefor the mass flow rate Qm. All values for the mass flow rate must be calculated in a flow computer orPLC that contains all these formulas. Today, with more powerful processors, more PLCs take overthis function from flow computers.
Vortex Flowmeter Liquid Mass
FIGURE 23 Required measurements Qv and T; thermal expansion coefficient α, referencetemperature Tref and reference density δref have to be programmed into the flow computer.

P1: xxx
1 September 1999 18:38 chap04combined.tex Chap04combined.sgm MH009v3(1999/07/12)
4.132 PROCESS/INDUSTRIAL INSTRUMENTS AND CONTROLS HANDBOOK
Vortex Flowmeter Gas Mass
FIGURE 24 Required measurements Qv and δ or P and T. Actual density can be calculatedwith the gas characteristics stored or programmed into the flow computer. The Z factor indicateshow different a real gas behaves from an ideal gas under actual conditions that exactly obeythe general gas law ( p × V/ T = constant; 2 = 1).
Differential Pressure Meter Gas Mass
Figure 25 (Required measurements Qv, P, and T ) shows, actual density δ is calculated with steamtables stored in the flow computer, and the actual P and T saturated steam requires either a pressureP or temperature T measurement.

P1: xxx
1 September 1999 18:38 chap04combined.tex Chap04combined.sgm MH009v3(1999/07/12)
PROCESS VARIABLES—FIELD INSTRUMENTATION 4.133
Vortex Flowmeter Steam Mass
FIGURE 25 Required measurements Qv and δ and P and T. Actual density δ can be calculatedwith the gas characteristics stored or programmed into the flow computer (see also vortexmeter). All other additional parameters describe the relationship between the flow rate and themeasured differential pressure KDP, E, KME, and Tcal.
Glossary
Qm = Mass flowQv = Uncorrected volume flowα = Thermal expansion coefficient for fluidδ = Actual density
δref = Reference densityP = Actual pressure
Pref = Reference pressureT = Actual temperature
Tref = Reference temperatureZ = Flowing Z factor
Zref = Reference Z factorTcal = Calibration temperature for DP cell, 294 K (20◦F or 21◦C)
E = Gas expansion factor�P = Differential pressureKDP = DP factorKME = Meter expansion coefficient

P1: xxx
1 September 1999 18:38 chap04combined.tex Chap04combined.sgm MH009v3(1999/07/12)
4.134 PROCESS/INDUSTRIAL INSTRUMENTS AND CONTROLS HANDBOOK
Many other types of volumetric or velocity meters may also be used in combination with densitymeasurement.
Advantages:
� Volumetric flow is known.� Density may be calculated from existing measurements or measured by a density meter.� Mass flow may be programmed by powerful processors in PLCs or flow computers.
Disadvantages:
� Two or more measurements are required, which must be measured at the same location for accuracy.� Accuracy will be affected if the right factors, such as reference density, thermal expansion coef-
ficient, Z factor for gas, gas expansion factor, DP factor, or meter expansion coefficient are notknown—or if the fluid properties change according to the conditions of the fluid.
� Multiple devices increase the risk of failure.� Installation costs are higher.
The relatively high cost of this type of instrumentation, combined with an increasing need forreliable mass flow data, established the need for a direct mass flow instrument that incorporatesCoriolis measurement and thermal measurement.
Coriolis Flowmeter
In comparison with differential pressure meters or positive displacement meters, the use of the Corioliseffect in an industrial flowmeter to measure the mass flow directly is a relatively new technology.The first industrial Coriolis mass flowmeter was introduced in 1972. At that time a Coriolis massflowmeter was very bulky, not very accurate, not reliable, application sensitive, and very expensive.
Today, approximately 13 different suppliers offer a large number of different designs, from a singlestraight tube, to dual straight tubes, to all types of bent single tube or dual tubes. The latest generationof Coriolis mass flowmeters is accurate and reliable (typically 0.1% to 0.3%), and some of the designsare no longer bulky or application sensitive. Coriolis mass flowmeters have a very large installationbase in liquid, slurry, and gas applications, and have been installed in some steam applications.
The success of the Coriolis mass flowmeter is based on the direct measurement of the massflow and is unaffected by variations in fluid properties, such as viscosity, pressure, temperature,and density. In addition to the mass flow measurement, the Coriolis mass flowmeter is capable ofobtaining measurements independent of mass flow, density, and temperature. The cost of a Coriolismass flowmeter is very moderate when one considers the total cost of installation, maintenance, andactual output capabilities.
CORIOLIS FLOWMETER
Principle of Operation
The mass of a body on the Earth is usually determined by weight. Mass can also be determined bymeasurement of the acceleration, which is caused by an external force, as described in Newton’sSecond Law of Motion; force = mass × acceleration. The measuring principle is based on thecontrolled generation of Coriolis forces. These forces are always present when both translational(straight line) and rotational (revolving) movement occur simultaneously (see Fig. 26.)

P1: xxx
1 September 1999 18:38 chap04combined.tex Chap04combined.sgm MH009v3(1999/07/12)
PROCESS VARIABLES—FIELD INSTRUMENTATION 4.135
FIGURE 26 Mass flow figure.
FIGURE 27 Mass flow figure.
The amplitude of the Coriolis force depends on the moving mass �m, its velocity v in the system,and therefore its mass flow.
The measuring principle is based on the controlled generation of Coriolis forces. The sensing metercontains a flow tube (or tubes) such that, in the absence of flow, the inlet and outlet sections vibratein phase with each other. When fluid is flowing, inertial (Coriolis) forces cause a phase shift betweeninlet and outlet sections. Two sensors measure the phase difference, which is directly proportional tomass flow. The amplitude of the Coriolis force depends on the moving mass (process material), itsvelocity in the system, and therefore its mass flow (see Fig. 27).
The Promass (Coriolis mass flowmeter from Endress+Hauser) uses oscillation instead of constantangular velocity ω and one or two parallel measuring tubes. When process fluid is flowing throughthem, they are made to oscillate.
The Coriolis force produced at the measuring tube(s) causes a phase shift in the tube oscillation(see Fig. 28):

P1: xxx
1 September 1999 18:38 chap04combined.tex Chap04combined.sgm MH009v3(1999/07/12)
4.136 PROCESS/INDUSTRIAL INSTRUMENTS AND CONTROLS HANDBOOK
� When there is zero flow, i.e., with the fluid standing still, both phases are equal (1 in the figure), nophase difference.
� When there is flow (mass flow), the tube oscillation is decelerated at the inlet (2) and acceleratedat the outlet (3).
FIGURE 28 Mass flow figure.
As the mass flow rate increases, the phase dif-ference also increases (A − B). The oscillations ofthe measuring tube(s) are determined by electrody-namic sensors at the inlet and the outlet. The mea-suring principle operates independently of temper-ature, density, pressure, viscosity, conductivity, orflow profile.
Density Measurement
The measuring tubes are continuously excited attheir resonant frequency. As the mass and thereforethe density of the oscillating system change [mea-suring tube(s) and fluid], the vibrating frequency isreadjusted. The resonant frequency is thus a func-tion of the density of the fluid, enabling the proces-sor to calculate density independently of the massflow reading. This density information can be pro-vided as an output signal.
Temperature Measurement
The temperature of the measuring tube(s) is deter-mined to calculate the compensation factor that isdue to temperature effects. This signal correspondsto the process temperature and is also an indepen-dently measured value as an available output.
Advantages
� Direct mass flow measurement unaffected by variations in fluid properties� Multiple-variable measuring device (mass flow, density, and temperature). Some transmitters offer
additional measuring variables based on calculation from the three independently measured values,such as percentage of mass flow, percentage volume flow, volume flow, standard volume flow,standard density, degrees Brix, degrees Baume.
� High accuracy (typical: ±0.1% to ±0.3%)� No moving parts; no rotating components� Low maintenance� Available in a range of corrosion-resistant measuring tube material
Disadvantages
� Initial cost for a Coriolis mass flowmeter ranges from moderate to high� Limitation in size—6 in is the biggest size available

P1: xxx
1 September 1999 18:38 chap04combined.tex Chap04combined.sgm MH009v3(1999/07/12)
PROCESS VARIABLES—FIELD INSTRUMENTATION 4.137
� Limitation in process temperature (typically 400◦F or 200◦C)� High-pressure drop at full flow in some designs� Some designs are very bulky� Some designs are sensitive to vibration� Some designs are installation sensitive
Application range
� Mass flow measurement for liquids, gases, and vapors are above the dew point (example superheatedsteam) as well as slurry or suspensions (mixture between liquid and solids as well as liquid andliquid).
� Do not use a Coriolis mass flowmeter to measure solid and gas, liquid and gas, or gas and liquid(saturated steam).
Installation hints
� Since vendors have their own sensor design, the performance of the Coriolis mass flowmeter canbe affected by the selection of the installation location. Contact the vendor for specific installationrequirements.
� Check corrosion compatibility between the fluid and the material used in the Coriolis mass flowme-ter. Check what type of material of construction is used in the process.
� The measuring tubes of a Coriolis mass flowmeter have to be kept full; a partially filled pipemeasurement is not possible.
� To ensure maximum performance of a Coriolis mass flowmeter, a zero point adjustment is recom-mended after installation and process startup. Contact vendor for specific instructions.
� Avoid entrained gas bubbles in a liquid because they affect the performance of the meter. If entrainedgas is present, increase backpressure to dissolve the gas bubbles in the liquid. Some Coriolis massflowmeters are capable of handling gas or air slugs by using smart process data filtering within theprocessor.
� Always install a Coriolis mass flowmeter on the high-pressure side of a pump and as close aspossible to the pump.
� If possible, install the Coriolis mass flowmeter at the lowest point in the process. This guaranteesthe highest backpressure.
� If a Coriolis mass flowmeter is used to measure vapors or steam, ensure that the condensate willnot collect in the measuring tubes.
� If a Coriolis mass flowmeter is used to measure slurry, be aware that some slurries are very abrasive.Since the measuring tubes (compared with the rest of the piping) are very thin, the life of the metercan be reduced. A single full-bore straight tube without a flow splitter will reduce abrasion andtherefore the life of the meter. If the flow velocity is reduced by two, the abrasion factor will bereduced by four.
� If the ability to drain is important (contamination, safety, or to prevent buildup), straight tube metershave advantages over looped tube. Installing the sensor in a vertical pipe or in a horizontal pipeangled slightly upward will ensure that the sensor is completely drained.
� In general, elbows, valves, or pumps downstream of a Coriolis mass flowmeter do not affect theperformance of the meter.
� If plugging is a potential problem, a straight tube sensor design is better because the sensor can becleaned and inspected more easily.
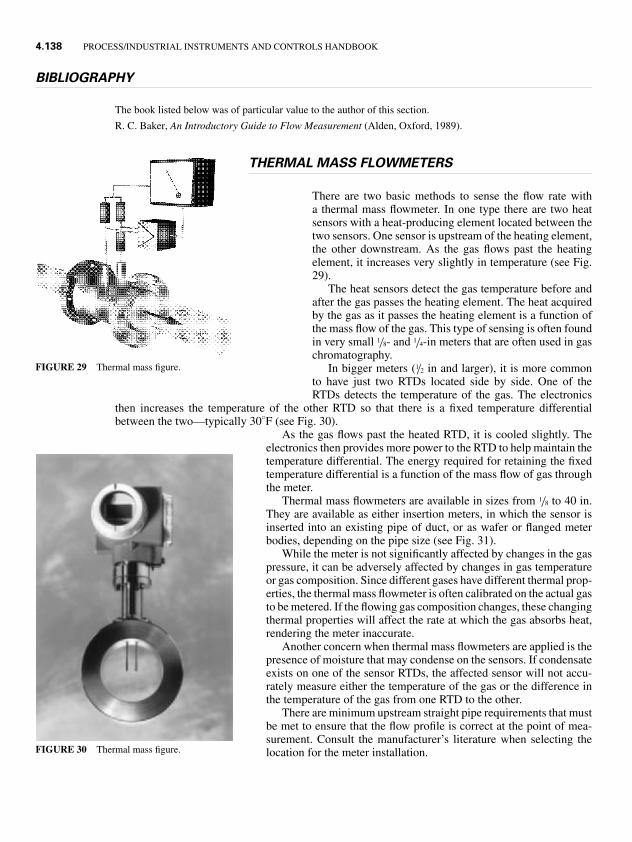
P1: xxx
1 September 1999 18:38 chap04combined.tex Chap04combined.sgm MH009v3(1999/07/12)
4.138 PROCESS/INDUSTRIAL INSTRUMENTS AND CONTROLS HANDBOOK
BIBLIOGRAPHY
The book listed below was of particular value to the author of this section.
R. C. Baker, An Introductory Guide to Flow Measurement (Alden, Oxford, 1989).
FIGURE 29 Thermal mass figure.
THERMAL MASS FLOWMETERS
There are two basic methods to sense the flow rate witha thermal mass flowmeter. In one type there are two heatsensors with a heat-producing element located between thetwo sensors. One sensor is upstream of the heating element,the other downstream. As the gas flows past the heatingelement, it increases very slightly in temperature (see Fig.29).
The heat sensors detect the gas temperature before andafter the gas passes the heating element. The heat acquiredby the gas as it passes the heating element is a function ofthe mass flow of the gas. This type of sensing is often foundin very small 1/8- and 1/4-in meters that are often used in gaschromatography.
In bigger meters (1/2 in and larger), it is more commonto have just two RTDs located side by side. One of theRTDs detects the temperature of the gas. The electronics
then increases the temperature of the other RTD so that there is a fixed temperature differentialbetween the two—typically 30◦F (see Fig. 30).
FIGURE 30 Thermal mass figure.
As the gas flows past the heated RTD, it is cooled slightly. Theelectronics then provides more power to the RTD to help maintain thetemperature differential. The energy required for retaining the fixedtemperature differential is a function of the mass flow of gas throughthe meter.
Thermal mass flowmeters are available in sizes from 1/8 to 40 in.They are available as either insertion meters, in which the sensor isinserted into an existing pipe of duct, or as wafer or flanged meterbodies, depending on the pipe size (see Fig. 31).
While the meter is not significantly affected by changes in the gaspressure, it can be adversely affected by changes in gas temperatureor gas composition. Since different gases have different thermal prop-erties, the thermal mass flowmeter is often calibrated on the actual gasto be metered. If the flowing gas composition changes, these changingthermal properties will affect the rate at which the gas absorbs heat,rendering the meter inaccurate.
Another concern when thermal mass flowmeters are applied is thepresence of moisture that may condense on the sensors. If condensateexists on one of the sensor RTDs, the affected sensor will not accu-rately measure either the temperature of the gas or the difference inthe temperature of the gas from one RTD to the other.
There are minimum upstream straight pipe requirements that mustbe met to ensure that the flow profile is correct at the point of mea-surement. Consult the manufacturer’s literature when selecting thelocation for the meter installation.

P1:xxx
1Septem
ber1999
18:38chap04com
bined.texC
hap04combined.sgm
MH
009v3(1999/07/12)
PRO
CE
SSV
AR
IAB
LE
S–FIEL
DFLOW APPLICATION MATRIX
4.1
39

P1:xxx
1Septem
ber1999
18:38chap04com
bined.texC
hap04combined.sgm
MH
009v3(1999/07/12)
4.1
40

P1: xxx
1 September 1999 18:38 chap04combined.tex Chap04combined.sgm MH009v3(1999/07/12)
PROCESS VARIABLES—FIELD INSTRUMENTATION 4.141
FIGURE 31 Thermal mass figure.
ULTRASONIC FLOWMETERS
Ultrasonic or acoustic flowmeters are of two principal types: (1) Doppler-effect meters and (2) transit-time meters. In both types the flow rate is deduced from the effect of the flowing process stream onsound waves introduced into the process stream. In clamp-on designs, these meters make it possibleto measure the flow rate without intruding into the stream, and thus are classified as noninvasive.But even in configurations in which transducers are contained in shallow wells, the flowmeters areessentially nonintrusive.
The principles of ultrasonic flow measurement have been known for many years, but only withinthe past few decades have these meters made measurable penetration into the flowmeter field. This lagin acceptance has been variously explained, but the general consensus is that too many designs wereintroduced too soon—prematurely and without testing them against adverse plant environments—tothe point that for several years ultrasonic flowmeters had somewhat of a tarnished image. Ultrasonicflowmeters have numerous innate advantages over most of the traditional metering methods: linearity,wide rangeability without an induced pressure drop or disturbance to the stream, achievable accuracycomparable to that of orifice or venturi meters, bidirectionality, ready attachment to the outside ofexisting pipes without shutdown, comparable if not overall lower costs, attractive features whichcan make a product prone to overselling. Within the last few years, ultrasonic flow measurementtechnology has found a firmer foundation, and most experts now agree that these meters will occupya prominent place in the future of flowmetering.
Doppler-Effect (Frequency-Shift) Flowmeters
In 1842 Christian Doppler predicted that the frequencies of received waves were dependent on themotion of the source or observer relative to the propagating medium. His predictions were promptlychecked for sound waves by placing the source or observer on one of the newly developed railroadtrains. Over a century later, the concept was first considered for application in the measurement offlowing streams.
For the principle to work in a flowmeter, it is mandatory that the flowing stream contain sonicallyreflective materials, such as solid particles or entrained air bubbles. Without these reflectors, the

P1: xxx
1 September 1999 18:38 chap04combined.tex Chap04combined.sgm MH009v3(1999/07/12)
4.142 PROCESS/INDUSTRIAL INSTRUMENTS AND CONTROLS HANDBOOK
Doppler system will not operate. In contrast, the transit-time ultrasonic flowmeter does not dependon the presence of reflectors.
The basic equations of a Doppler flowmeter are
� f = 2 fT sin θVF
VS(1)
and, by Snell’s law,
sin θT
VT= sin θ
VS(2)
Simultaneously solving Eqs. (1) and (2) gives
VF = � f
fT
VT
sin θT= k� f (3)
where VT = sonic velocity of transmitter materialθT = angle of transmitter sonic beamK = calibration factor
VF = flow velocity�F = Doppler frequency changeVS = sonic velocity of fluidfT = transmission frequencyθ = angle of fT entry in liquid
Doppler-effect flowmeters use a transmitter that projects a continuous ultrasonic beam at about0.5 MHz through the pipe wall into the flowing stream. Particles in the stream reflect the ultrasonicradiation that is detected by the receiver. The frequency of the radiation reaching the receiver isshifted in proportion to the stream velocity. The frequency difference is a measure of the flow rate.The configuration shown in Fig. 32 utilizes separated dual transducers mounted on opposite sides ofthe pipe. Other possible configurations are illustrated in Fig. 33. In essence the Doppler-effect metermeasures the beat frequency of two signals. The beat frequency is the difference frequency obtainedwhen two different frequencies (transmitted and reflected) are combined.
When the measured fluid contains a large concentration of particles or air bubbles, it is said tobe sonically opaque. The more opaque the liquid, the greater the number of reflections that originatenear the pipe wall, a situation exemplified by heavy slurries. It can be noted from the flow profile ofFig. 32 that these reflectors are in the low-flow-rate region. In contrast, the preponderance of particlereflectors will occur in the center of the pipe (where the flow rate is highest) when the fluid is less
FIGURE 32 Principle of Doppler-effect ultrasonic flowmeter with separated opposite-side dualtransducers.

P1: xxx
1 September 1999 18:38 chap04combined.tex Chap04combined.sgm MH009v3(1999/07/12)
PROCESS VARIABLES—FIELD INSTRUMENTATION 4.143
(a) (b) (c)
FLOW FLOW FLOW
FIGURE 33 Configurations of Doppler-effect ultrasonic flowmeter. (a) Single transducer.(b) Tandem dual transducer. (c) Separate dual transducers installed on same side of pipe.
sonically opaque. Where there are relatively few reflective particles in a stream, there is a tendency forthe ultrasonic beam to penetrate beyond the centerline of the pipe and to detect slow-moving particleson the opposite side of the pipe. Because the sonic opacity of the fluid may be difficult to predict inadvance, factory calibration is difficult.
It will be noted from Fig. 32 that the fluid velocity is greatest near the center of the pipe and lowestnear the pipe wall. An average velocity occurs somewhere between these two extremes. Thus thereare numerous variables, characteristic of a given fluid and of a specific piping situation, that affect theinteractions between the ultrasonic energy and the flowing stream. Should a measured fluid have arelatively consistent flow profile and include an ideal concentration and distribution of particles, thesequalities add to the fundamental precision of measurement and thus simplify calibration. Variousdesigns are used to minimize interaction inconsistencies. For example, separation of transmitters andreceivers makes it possible to restrict the zone in the pipe at which the principal concentration ofinteraction occurs. This zone usually occurs in the central profile region of the pipe less affected byvariations in sonic opacity than the region near the pipe wall.
Transit-Time Ultrasonic Flowmeters
With this type of meter, air bubbles and particles in the flowing stream are undesirable because theirpresence (as reflectors) interferes with the transmission and receipt of the ultrasonic radiation applied.However, the fluid must be a reasonable conductor of sonic energy (Fig. 34). At a given temperatureand pressure, ultrasonic energy will travel at a specific velocity through a given liquid. Since the fluidis flowing at a certain velocity (to be measured), the sound will travel faster in the direction of flow andslower against the direction of flow. By measuring the differences in arrival time of pulses traveling ina downstream direction and pulses traveling in an upstream direction, this �T can serve as a measureof fluid velocity. Transit-time or �T flowmeters transmit alternately upstream and downstream andcalculate this time difference. The operation is illustrated by the following equations:
VF = (TU − TD)Vs
sin θ
Vs cos θ
d= �tVs
sin θ
1
TL(4)
FIGURE 34 Principle of transit-time ultrasonic flowmeter, clamp-on type. Transducersalternately transmit and receive bursts of ultrasonic energy.

P1: xxx
1 September 1999 18:38 chap04combined.tex Chap04combined.sgm MH009v3(1999/07/12)
4.144 PROCESS/INDUSTRIAL INSTRUMENTS AND CONTROLS HANDBOOK
By Snell’s law,
Vs
sin θ= VC
sin α= K (5)
VF = K�t
TL(6)
where TU = upstream transit timeTD = downstream transit timeTL = zero-flow transit timeVs = liquid sonic velocityd = pipe inside diameter
VF = liquid flow velocityα = angle between transducer and pipe wall
VC = transducer sonic velocity
In the clamp-on transit-time flowmeter, where the transducers are strapped to the outside of thepipe, the sonic echo is away from the receiver and thus the device can retransmit sooner and operatefaster. Clamp-on meters are installed on a normal section of piping, which is particularly attractive forretrofit applications. Other designs make use of what are called wetted transducers, which are mountedwithin the pipe. In both designs, of course, the transducers are installed diagonally to the flow, thatis, not directly across from each other. Wetted transducers are usually installed in a shallow well, butbecause there are no projections beyond the pipeline wall, they are still considered nonintrusive. Thereis no significant disturbance to the general flow profile. However, slight, localized eddy currents mayform in the vicinity of the wells. To avoid eddy currents, at least one manufacturer puts the transducerswithin the wells, forming what is termed an epoxy window. This results in completely filling the streamside of the well, making it essentially flush with the inner pipe wall.
In another design (dual-path ultrasonic flowmeter), two pairs of transducers are installed in the pip-ing. The upstream and downstream propagation times between each pair of transducers are integratedin a microprocessor-based electronics package to determine the flow rate.
POSITIVE-DISPLACEMENT FLOWMETERS
Positive-displacement (PD) flowmeters measure flow directly in quantity (volume) terms instead ofindirectly or inferentially as rate meters do. In several rather ingenious ways, the PD meter separatesthe flow to be measured into different discrete portions or volumes (not weight units) and, in essence,counts these discrete volumes to arrive at a summation of total flow. Fundamentally, PD meters do nothave a time reference. Their adaptation to rate indication requires the addition of a time base. Similarly,by making appropriate corrections for changes in density resulting from pressure, temperature, andcomposition changes, PD meters can serve to indicate flow in terms of mass or weight.
Although inferential rate-type flowmeters appear most frequently in process control loops, de-partments of facilities concerned with materials accounting (receiving, shipping, inter- and intraplanttransfers, distribution, and marketing) largely depend on PD flowmeters. Also, in recent years therehas been growing acceptance of PD flowmeters for use in automatic liquid batching and blendingsystems. Utilities and their consumers are among the largest users of PD flowmeters, with millions ofunits in use for distributing and dispensing water, gas, gasoline, and other commodities. Where PDmeters are used to dispense these commodities, they are subject to periodic testing and inspection byvarious governmental weights and measures agencies. Accuracy requirements vary with type of meterand service. Usually water meters for domestic service and small industrial plants require an accuracyof only ±2 percent and gas meters ±1 percent, whereas meters associated with retail gasoline anddiesel fluid pumping have a tolerance (when new or after repair) of only 3.5 cm3 in 5 gal (19.9 L).Routine tests permit a tolerance of 7 cm3 in some states.

P1: xxx
1 September 1999 18:38 chap04combined.tex Chap04combined.sgm MH009v3(1999/07/12)
PROCESS VARIABLES—FIELD INSTRUMENTATION 4.145
FIGURE 35 Sectional view of representative nutating-disk flowmeter. Each cycle(complete movement) of the measuring disk displaces a fixed volume of liquid. There isonly one moving part in the measuring chamber, the disk. Liquid enters the inlet port andfills the space above and below the disk in a nutating motion until the liquid dischargesfrom the outlet port. The motion of the disk is controlled by a cam which keeps the lowerface in contact with the bottom of the measuring chamber on one side, while the upperface of the disk is in contact with the top of the chamber on the opposite side. Thusthe measuring chamber is sealed off into separate compartments, which are successivelyfilled and emptied, each compartment holding a definite volume. The motion is smoothand continuous with no pulsations. The liquid being measured form a seal between thedisk and the chamber wall through capillary action, thus minimizing leakage or slip-pageand providing accuracy even at low flow rates.
Nutating-Disk Meter
The nutating-disk meter is probably the most commonly encountered flowmeter found throughoutthe world for commercial, utility, and industrial applications. The meter is of particular importancein the measurement of commercial and domestic water. Although there are some proprietary designdifferences, the fundamental operation of the nutating-disk meter is shown in Fig. 35. In most water-metering situations the meter commonly incorporates a digital integrated readout of the “speedometer”style. Meters of this general type for industrial process use, such as in batching and blending, mayincorporate a number of accessories. Among the common sizes are 0.5 inch (13 mm), which candeliver up to 20 gal/min (76 L /min), 0.75 inch (19 mm), 1 inch (25 mm), 1.5 inches (38 mm), and 2inches (51 mm), which can deliver up to 160 gal/min (606 L/min).
Industrial nutating-disk meters provide accurate measurements for low-flow rates and are relativelyeasy to install and maintain. Depending on the construction materials used, the nutating-disk metercan handle a wide range of chemicals, including caustics. The useful temperature range is from −150to 120◦C (−238 to 248◦F ).
Oscillating-Piston Meter
In principle, the oscillating-piston meter is similar to the nutating-disk meter, with the importantdifference that mechanical motion takes place in one plane only (no wobble). In one design∗ the
*Brooks Instrument Division, Emerson Electric Company, Hatfield, Pennsylvania.

P1: xxx
1 September 1999 18:38 chap04combined.tex Chap04combined.sgm MH009v3(1999/07/12)
4.146 PROCESS/INDUSTRIAL INSTRUMENTS AND CONTROLS HANDBOOK
measuring chamber consists of five basic parts: (1) top head, (2) bottom head, (3) cylinder, (4)division plate, and (5) piston. The only moving part in the measuring chamber is the piston, whichoscillates smoothly in a circular motion between the two plane surfaces of the top and bottom heads.The division plate separates the inlet ports A and the outlet ports B. The piston is slotted to clearthe division plate, which also guides the travel of the piston in its oscillating motion. A gear traintransmits the piston motion to the register. The major components and operation of the meter areshown in Fig. 36.
The piston has a significantly smaller circumference than the chamber. This provides for max-imum liquid area displacement for each oscillation. A small differential pressure across the meterproduces motion of the piston within the measuring chamber. In order to obtain oscillating motion,two restrictions are placed on the movement of the piston. First, the piston is slotted vertically tomatch the size of a partition plate fixed to the chamber. This plate prevents the piston from spinningaround its central axis and also acts as a seal between the inlet and outlet ports of the chamber. Second,
FIGURE 36 Principle of operation of oscillating-piston meter. (Brooks Instrument Di-vision, Emerson Electric Company.)

P1: xxx
1 September 1999 18:38 chap04combined.tex Chap04combined.sgm MH009v3(1999/07/12)
PROCESS VARIABLES—FIELD INSTRUMENTATION 4.147
the piston has a center vertical pin which is confined to a circular track that is part of the chamber.Differential pressure across the meter causes the piston to sweep the chamber wall in the directionof flow. This oscillating motion displaces liquid from the inlet to the outlet port in a continuousstream.
To further prevent unmeasured liquid from passing through the chamber, the piston has a horizontalpartition or web. This web is perforated to promote balanced buoyancy of the piston within the chamberand a linear flow pattern of liquid through the meter. A drive bar and shaft are positioned throughthe top of the chamber so that, as the piston oscillates, the piston pin drives the bar and shaft in acircular or spinning motion. This rotating shaft is the driving link between the piston and the registeror readout unit. Sizes range from 0.75 to 2 inches (19 to 51 mm), with capacity ranging from 5 to 150gal/min (19 to 570 L /min).
Fluted Rotor Meter
Meters of this type are used in the flow measurement of crude and refined petroleum products anda variety of other commercial fluids. Frequently they are used on product loading racks and smallpipelines. Usually the meters are equipped with direct readouts and often with ticket printers to provideauthentically recorded documents for liquid-transfer transactions (Fig. 37).
Oval-Shaped Gear Flowmeters
In these meters, precision-matched oval-shaped gears are used as metering elements (Fig. 38). Metersizes (connections) range from 1/2 to 1, 11/2, 2, 3 and 4 inches (∼1.3 to 2.5, 3.8, 5.1, 7.6, and 10.2 cm),with capacity ranges for different fluids as follows:
FIGURE 37 Operating principle of a Brooks BiRotor possitive-displacement flowmeter. As the product entersthe intake of the measuring unit chamber, the two rotors divide the product into precise segments of volumemomentarily and then return these segments to the outlet of the measuring unit chamber. During what may bereferred to as “liquid transition,” the rotation of the two rotors is directly proportional to the liquid throughput. Agear train, located outside the measuring unit chamber, conveys mechanical rotation of the rotors to a mechan-ical or electronic register for totalization of liquid throughput. (Brooks Instrument Division, Emerson ElectricCompany.)

P1: xxx
1 September 1999 18:38 chap04combined.tex Chap04combined.sgm MH009v3(1999/07/12)
4.148 PROCESS/INDUSTRIAL INSTRUMENTS AND CONTROLS HANDBOOK
Cold water 0.2—1.4 to 110—705 gal/min (U.S.) 0.8—5.3 to 416.4—2668.7 L/minHot water 0.3—1.0 to 132—484 gal/min 1.1—3.8 to 499.7—1832.1 L/minLiquefied petroleum gas (LPG) 0.4—1.6 to 176—837 gal/min 1.5—6.1 to 666.2—3168.4 L/minGasoline (0.3—0.7 cP) 0.3—1.6 to 132—837 gal/min 1.1—6.1 to 499.7—3168.4 L/minKerosene (0.7—1.8 cP) 0.2—1.6 to 110—837 gal/min 0.8—6.1 to 416.4—3168.4 L/minLight oil (2—4 cP) 0.1—1.9 to 705—1010 gal/min 0.4—7.2 to 2668.7—3826.3 L/minHeavy oil (5—300 cP) 0.04—1.9 to 44—1010 gal/min 0.2—7.2 to 166.6—3826.3 L/min
FIGURE 38 Sectional schematic of oval gear flowmeter,showing how a crescent-shaped gap captures the precisevolume of liquid and carries it from inlet to outlet. (BrooksInstrument Division, Emerson Electric Company.)
In meter application engineering, three basic viscosity clas-sifications are taken into consideration: (1) standard-viscosityclass from 0.2 to 200 cP, (2) medium-viscosity class from 300to 500 cP, and (3) high-viscosity class above 500 cP. Tests haveshown that a meter calibrated on a 1-cP product and then ap-plied to a 100-cP product does not shift more than 1.2 percentabove the initial calibration. Normally, where the viscosity is100 cP or greater, there is no significant shift in accuracy. Oval-gear PD meters are sized for maximum flow so that the pressuredrop is less than 15 psi (103 kPa).
Normal operating pressure ranges from 255 to 710 psi (1758to 4895 kPa), depending on whether steel or stainless-steelflanges are used. The maximum operating temperature is 230◦F(110◦C), but special meters are available for higher tempera-tures. The lower limit is 0◦F (−18◦C). Housings, rotors, andshafts are constructed of type 316 stainless steel or type Alloy20 (CN-7M stainless steel). Bushings are of hard carbon.
Meters are available with numerous accessories, includingan electric-impulse contactor, which is used to open and closean electric circuit at intervals proportional to the number ofunits measured.
Other Positive-Displacement Meters
In the lobed-impeller meter shown in Fig. 39 two rotors revolve with a fixed relative position inside acylindrical housing. The measuring chamber is formed by the wall of the cylinder and the surface ofone-half of one rotor. When the rotor is in vertical position, a definite volume of fluid is contained inthe measuring compartment. As the impeller turns, owing to the slight pressure differential betweeninlet and outlet ports, the measured volume is discharged through the bottom of the meter. This actiontakes place four times for a complete revolution, the impeller rotating in opposite directions and at aspeed proportional to the volume of fluid flow. Meters of this design can handle from 8 gal/min (30
FIGURE 39 Lobed-impeller flowmeter.

P1: xxx
1 September 1999 18:38 chap04combined.tex Chap04combined.sgm MH009v3(1999/07/12)
PROCESS VARIABLES—FIELD INSTRUMENTATION 4.149
FIGURE 40 Sliding-vane rotary meter. FIGURE 41 Retracting-vane rotary meter.
L /min) to 25,000 barrels/h. They perform well at temperatures up to 400◦F (204◦C) and pressures upto 1200 psi (8276 kPa). They are used for gases and a wide range of light to viscous fluids, includingasphalts, and are best suited to high rates of flow.
In the sliding-vane rotary meter, vanes are moved radially as cam followers to form the measuringchamber (Fig. 40). Another version, the retracting-vane type, is shown in Fig. 41.
OPEN-CHANNEL FLOW MEASUREMENTS
An open channel is any conduit in which a liquid, such as water or wastes, flows with a free surface.Immediately evident examples are rivers, canals, flumes, and other uncovered conduits. Certain closedconduits, such as sewers and tunnels, when flowing partially full (not under pressure), also may beclassified as open channels. Two measurement units are used in measuring open-channel flows: (1)units of discharge and (2) units of volume. The discharge (or rate of flow) is defined as the volume ofliquid that passes a certain reference section in a unit of time. This may be expressed, for example, ascubic feet per second, gallons per minute, or millions of gallons per day. In irrigation the units usedare the acre-foot [defined as the amount of water required to cover 1 acre to a depth of 1 foot (43,560ft3), or the hectare-meter (10,000 m3)].
To determine open-channel flows, a calibrated device is inserted in the channel to relate the free-surface level of liquid directly to the discharge. These devices sometimes are called head-area metersand are used extensively for the allocation of irrigation water as well as in municipal sewage andindustrial wastewater facilities.
Weirs
A weir is a barrier in an open channel over which liquid flows. The edge or surface over which theliquid flows is called the crest; the overflowing sheet of liquid is the nappe. The top of the weir hasan opening, which may be of different dimensions and geometry (Fig. 42).
Of the various types of weirs, the three most commonly used are shown in Fig. 43. Weir calculationstend to be complex and reference to a source, such as Stevens Hydrographic Data Book (Leopolid &Stevens, Beaverton, Oregon—revised periodically), is suggested.
Parshall Flumes
These devices are available for measuring open-channel flows up to 1500 million gal/day (5.7 millionm3/day). The size of a flume is designated by the width W of the throat, which may range from 1 inch(2.5 cm) to 40 ft (12 meters) (Fig. 44). Generally economy of construction dictates that the smalleststandard throat size be selected, provided it is consistent with the depth of the channel at maximumflow and permissible head loss. As a general rule, the throat size should be one-third to one-half thewidth of the channel. Prefabricated flumes often can be a cost advantage (Fig. 45).

P1: xxx
1 September 1999 18:38 chap04combined.tex Chap04combined.sgm MH009v3(1999/07/12)
4.150 PROCESS/INDUSTRIAL INSTRUMENTS AND CONTROLS HANDBOOK
FIGURE 42 Basic forms of weirs. (a) Sharp-crested weirs, which are useful only as a means of measuring flowingwater. (b) Non-sharp-crested weirs, which are incorporated into hydraulic structures as control or regulating devices,with measurement of flow as a secondary function. When the weir has a sharp upstream edge so that the nappesprings clear of the crest, it is called a sharp-crested weir. The nappe, immediately after leaving a sharp-crestedweir, suffers a contraction along the horizontal crest, called crest contraction. If the sides of the notch have sharpupstream edges, the nappe also is contracted in width and the weir is said to have end contractions. With sufficientside and bottom clearance dimensions of the notch, the nappe undergoes maximum crest and end contractions, andthe weir is said to be fully contracted.
α
D
E
HMAX.
60° Q = 1.46 H5/2
90° Q = 2.52 H2.47
(a)
E
L
D HMAX.
Q = 3.33(L − .2H)H3/2
(L > 3HMAX.)
(b) (c)
E
HMAX.
Q = 3.367 LH3/2
L(L > 3HMAX.)
D
FIGURE 43 Weirs commonly used. (a) V-notch. (b) Rectangular. (c) Cipolleti. Occasionally, other weirs,such as hyperbolic (Sutro), broad-crested, and round-crested, are used.
Open-Flow Nozzle (Kennison)
The Kennison nozzle shown in Fig. 46 is an unusually simple device for measuring flows throughpartially filled pipes. The nozzle copes with low flows, wide flow ranges, and liquids containingsuspended solids and debris. Because of its high-accuracy, nonclogging design and excellent head-versus-flow characteristics, the Kennison nozzle is well suitedfor the measurement of raw sewage,

P1: xxx
1 September 1999 18:38 chap04combined.tex Chap04combined.sgm MH009v3(1999/07/12)
PROCESS VARIABLES—FIELD INSTRUMENTATION 4.151
FIGURE 44 Parshall flume.
raw and digested sludge, final effluent, and trade wastes. Nozzle sizes range from 6 inches (15 cm)with a capacity of 90 gal/min (equivalent to 493 m3/day) up to 36 inches (91.4 cm) with a capacity of14,000 gal/min (equivalent to 75,700 m3/day).
BULK-SOLIDS FLOW MEASUREMENT
In many industries, for the control of inventory, maintaining throughput rates, and materials balances,and in batching for recipe control, it is essential to measure the flow of bulk solids carefully. Althoughwith some very uniform solids, flow may be measured in terms of volume, and volumetric feedersare available, but with some sacrifice of accuracy, in gravimetric devices, measurements are made on

P1: xxx
1 September 1999 18:38 chap04combined.tex Chap04combined.sgm MH009v3(1999/07/12)
4.152 PROCESS/INDUSTRIAL INSTRUMENTS AND CONTROLS HANDBOOK
the basis of weight. Here flow measurement is expressed in weight (pounds or kilograms) per unit oftime (minutes or hours). Thus, in essence, a belt conveyor scale is a mass flowmeter. For many years,prior to the introduction of strain-gage load cells and high-technology sensors, conveyor belts werecoupled to mechanical weigh scales.
FIGURE 45 Rigid one-piece prefrabicated fiberglassParshall flume. Advantages include smooth surface, di-mensional accuracy and stability, with no external brac-ing needed, long life, and reduction of installation costs.Dimensions shown are for available large size.
Belt-Conveyor Weighers
Load-weighing devices can be installed on practi-cally any size length and shape of conveyor—from12-inch (30.5-cm)-wide belts, handling as little as1 lb (0.45 kg)/min at a minimum belt speed of1 ft (30.5 cm), to 120-inch (3-meter)-wide belts,handling as much as 20,000 tons (18,145 metrictons)/hour at speeds of up to 1000 ft/min (305m/min). The basic design of a belt conveyor weigheris shown in Fig. 47.
Wherever possible, the scale should be installedwhere it will not be subjected to conveyor influ-ences that cause a “lifting effect” of the belt offthe weigh-platform section. Belt tensions and beltlift have more influence on accuracy than any otherfactor. It is important that the material (load) travelat the same velocity as the belt when crossing theweigh platform and not be in a turbulent state, asit is when leaving a feed hopper or chute. Thebest test for accuracy involves carefully weighinga batch of material and passing this exact weightseveral times over the belt scale. Another testingmethod is using a chain that is very uniform andmatches closely the weight of the solid materialnormally weighed. Some manufacturers guaran-tee their product to weigh within ±0.5 percentof the totalized weight (when properly installed).The National Institute of Standards and Technol-ogy (NIST) has developed a standard certificationcode for conveyor scales.
FIGURE 46 Kennison nozzle. (Leeds & Northrup, BIFProducts.)
In proportioning various solids and liquids, beltfeeders and flow controllers, including controlled-volume pumps, can be integrated into a total dig-itized blending system. Microprocessor technol-ogy has been available for continuous weighingfor several years. The microprocessor provides ac-curacy, automation, and flexibility features not fea-sible with previous analog and digital systems. Thebasic difference is that the microprocessor doesthings sequentially, using its memory and an in-
struction set (software), whereas analog and digital systems accomplish these tasks continuously byway of various electrical circuits (hardware).
In addition to belt-type weighers, the basic principle can be applied to screw feeders, sometimesused for very dry materials that tend to flush and flood. So-called solids flowmeters are also available.These are not true gravimetric devices, but rather, utilize impact or centrifugal force to generate a signalthat is proportional to material flow. These devices are capable of providing long-term repeatability

P1: xxx
1 September 1999 18:38 chap04combined.tex Chap04combined.sgm MH009v3(1999/07/12)
PROCESS VARIABLES—FIELD INSTRUMENTATION 4.153
INTEGRATORRATESIGNAL
RATECONTROLLER
SCR
CONTROLSIGNAL
MULTIPLIER
WEIGHBRIDGESPEED
FIXEDGATE
MOTOR
FIGURE 47 Gravimetric weigh-belt feeder with true rate control systemwhere there are no inferred constants. Weight × speed = flow rate.
STORAGE BIN WITHWEIGHING SYSTEM
SIGNAL CONDITION
PREFEED SCREW
INTERMEDIATE GUIDE CHUTE
FLOWMETERWITH CURVED
MEASURINGPLATE
TO PROCESS
FEEDBACK
DEMAND
DRIVECONTROL
FIGURE 48 Flow-rate control system utilizing a solids flowmeter with an in-linecalibration system. (Schenck Weighing Systems.)
in the 2 to 3 percent range (Fig. 48). In another gravimetric type (loss-in-weight feeder), a weighhopper and metering screw are supported on load cells. As the metering screw delivers material fromthe system, the resultant load-cell signal decreases proportionately with time. The differential dG /dtproduces the true feed rate F, as is shown graphically in Fig. 49.
Nuclear radiation methods also have been applied to weighing materials on a moving belt.
TYPES OF LEVEL MEASUREMENT SYSTEMS
A wide variety of level measurement systems are available to address the broad spectrum of applica-tions, accuracy needs, installation requirements, and practices. Measurement technologies are madeavailable in different versions to address a wide range of measurement needs or sometimes to addressjust one specific application. This subsection will attempt to define some of the general selectionconsiderations of many available technologies, the general forms of these technologies, and some oftheir general advantages and disadvantages. As always, one must consult the specifications from the

P1: xxx
1 September 1999 18:38 chap04combined.tex Chap04combined.sgm MH009v3(1999/07/12)
4.154 PROCESS/INDUSTRIAL INSTRUMENTS AND CONTROLS HANDBOOK
FIGURE 49 Gravimetric feeder using loss-in-weight principle. (Schenck Weighing Systems.)
various manufacturers for specific products and users’ experiences in different installations to trulydetermine their applicability to measurement situations.
The family of level measurement systems can be divided into many categories: liquids or solids levelmeasurement, point or continuous level measurement, electromechanical or electrical/electromagneticlevel measurement, or contacting or noncontacting /nonintrusive level measurement.
For this subsection the focus is on the technologies of level measurement so the information willbe presented in the following format:
� General considerations in level measurement technology selection
Density and viscosity
Chemical composition
Ambient temperature
Process temperature
Process pressure
Regulated environments
Process agitation
Vapor, mist, and dust
Interfaces and gradients

P1: xxx
1 September 1999 18:38 chap04combined.tex Chap04combined.sgm MH009v3(1999/07/12)
PROCESS VARIABLES—FIELD INSTRUMENTATION 4.155
Process conductivity and dielectric constants
Vibration
Material buildup or stickiness
Static charge
Humidity/moisture
Repeatability, stability and accuracy requirements� Electromechanical level measurement and detection systems
Floats for level detection and measurement of liquids
Displacers for level detection and measurement of liquids
Level detection of solids using rotating paddles
Level measurement of liquids and solids using plumb bob� Electronic/electromagnetic energy level measurement and detection systems
Level detection of liquids by use of conductivity
Level detection of liquids by use of vibrating forks resonance or rod attenuation
Level detection of solids by use of vibrating fork or rod attenuation
Level detection of liquids by use of ultrasonic gap
Level detection of liquids by use of thermodispersion
Level measurement of liquids by use of bubblers
Level measurement of liquids by use of hydrostatic pressure
Ultrasonic level detection and measurement of liquids and solids
Capacitance level detection and measurement of liquids and solids
Radar level detection and measurement of liquids and solids
Level detection and measurement of liquids and solids by use of time-domain reflectometry
Level measurement of liquids by use of magnetostrictive
Level measurement of liquids by use of laser
Level detection and measurement of liquids and solids by use of radiometric
Level measurement of liquids and solids by use of weighing
Level detection by use of optics
Level detection in liquids by use of ultrasonic tank resonance
GENERAL CONSIDERATIONS IN LEVEL MEASUREMENTTECHNOLOGY SELECTION
The selection of the right level measurement solution is based on not only the choice of measure-ment technology but also the application and installation requirements. Unfortunately one universaltechnology that can address all level measurement requirements has yet to be discovered. So usersand specifying engineers must address their level measurement needs from a broad array of techno-logies.
One has to review not only the capability of the measurement but also its survivability in aparticular environment. Some measurement technologies must come into direct contact with themeasured material.
Other technologies are noncontacting or even nonintrusive and do not touch the measured mate-rial. This can have direct bearing on how much maintenance may be required or the economic impact

P1: xxx
1 September 1999 18:38 chap04combined.tex Chap04combined.sgm MH009v3(1999/07/12)
4.156 PROCESS/INDUSTRIAL INSTRUMENTS AND CONTROLS HANDBOOK
caused by failure of the measurement to provide correct information. Often the cost of a particu-lar technology is much different when viewed from a total lifetime cost of ownership perspective.Purchase, installation, maintenance, and training costs all play a part in determining this.
The quality of level information required must also be reviewed. As in most measurement choicesthe quality required is determined by what is necessary to achieve targeted control capabilities or gaineconomically beneficial information. In other words the type of level measurement selected shouldproduce the quality of level information required. The quality of level information is determined notonly by the specifications of the measurement instrument but also by how the environment and themethod of installation influence the measurement instrument.
Following are some general considerations one needs to take when selecting a level measurementdevice.
Density and Viscosity
Viscosity and density considerations affect the selection of many liquid level switches and continuouslevel transmitters. High-viscosity materials can cause mechanical technology switches to stick or hangup. The forces on probes and sensors from high-density materials can cause damage. An agitatedliquid material may cause high lateral forces on a measurement probe when the viscosity or thedensity increases. The level information from some level measurement technologies is influenced bydensity changes. Bubblers, displacers, and hydrostatic instruments measure the hydrostatic head of aliquid. When the density of the measured liquid increases, given a fixed level, the indicated level willincorrectly show an increase.
The force from the shifting of solids may exceed the design of a measurement probe if the densityincreases from increased moisture or a change in composition. Noncontacting measurement devicesgenerally are not affected by density and viscosity changes.
Chemical Composition
Measurement technologies must not only provide correct measurement of the particular material, givenits chemical nature, but they need to be able to survive as instruments. The chemical characteristics of amaterial may change because of steps in the process. These characteristics, such as dielectric constant,conductivity, pH, etc., affect the different measurement technologies in different ways. Capacitancemeasurements are affected by changes of conductivity and/or dielectric constant, especially in thearea between the conductive and the nonconductive states. Noncontacting ultrasonic measurementmay not have to deal with direct contact with the measured material, but the transducer may haveto contend with corrosive vapors or gases in the process vessel. A material compatibility table canbe used to determine whether the measurement sensor materials of construction are suitable for theservice. The effect of chemical composition on the measurement technology measurement capabilitymay often be less with noncontacting technologies (i.e., radar, ultrasonic, gamma) but it should notbe assumed that this is always the case.
Ambient Temperature
The temperature that the measurement instrument itself is exposed to must be reviewed. Cold or hottemperatures may damage, disable, or compromise the information from a measurement instrument.An optical level switch may be designed for proper operation up to 120◦F ambient with a given limitof 150◦F process temperature. If the level switch is mounted in an area where the outside temperaturecan exceed the 120◦F ambient because of both radiated and transferred heat, the electronics in theswitch may fail or report incorrect information. The quality of level information from a hydrostaticmeasurement may be compromised when remote seals are used to contact the process material. Theexpansion and the contraction of fill fluids within capillaries/impulse tubes connecting the process seal

P1: xxx
1 September 1999 18:38 chap04combined.tex Chap04combined.sgm MH009v3(1999/07/12)
PROCESS VARIABLES—FIELD INSTRUMENTATION 4.157
with the pressure sensor may cause level changes to be reported when ambient temperature changestake place.
Process Temperature
The process temperature that the measurement instrument is exposed to must also be reviewed.Naturally the measurement instrument materials of construction will dictate the maximum temperatureallowed before damage occurs. The ambient temperatures may be fine for the instrument, but theprocess temperature may affect the level information. A hydrostatic sensor exposed to large changein process temperature may not be able to compensate immediately, thus giving a temporary offset tothe level reported. The temperature of the fill fluid within the hydrostatic sensor can affect its density.If not compensated for, offsets in indicated pressure (level) can occur.
Process Pressure
The impact of static pressure and pressure changes (and vacuum) on the level information has to betaken into consideration. There are two aspects to be noted:
� The pressure rating of the instrument must at least match the process pressure in the tank. If avacuum is present, the instrument needs a vacuum rating.
� The measuring principle must not be affected by the process pressure. Example: A hydrostaticmeasurement will not work properly in a tank with a head pressure. The obvious remedy, usingdifferential pressure, will work only if the ratio between the hydrostatic pressure caused by theproduct and the head pressure does not exceed certain limits.
Regulated Environments
Measurements may often be required in environments where special regulations are in force. Instal-lations where there is hazardous gas or dust often require a technology that is classified as meetingthe requirements. National Electrical Code installation guidelines may have to be followed. Certifi-cates from recognized agencies such as Factory Mutual (FM), Underwriters Laboratories (UL), andCanadian Standards Association (CSA) may be required. Some industries and even companies havespecific requirements that the level technology used must fulfill. For example, the dairy industryrequires measurement devices to meet 3A sanitary standards.
Process Agitation
Many process liquids must be agitated all or part of the time. Mixing blade movements may precludeusing a contacting probe like capacitance. Some severe agitation may produce wavy or vortexlikesurfaces. Noncontacting-type measurements like ultrasonic and radar may not get reliable signalsback from these surfaces to provide reliable level information.
Vapor, Mist and Dust
The space above a liquid or solids material may contain some vapor, mist or dust. This becomes im-portant when noncontacting measurements with laser, microwave, radar, and ultrasonic technologiesare considered. The presence of enough dust and mist can attenuate the acoustic or electromagneticsignals to the point that measurement is unreliable. Ultrasonic measurements can be affected by thepresence of vapor and/or changes in temperature of the vapor if the speed of sound is changed.

P1: xxx
1 September 1999 18:38 chap04combined.tex Chap04combined.sgm MH009v3(1999/07/12)
4.158 PROCESS/INDUSTRIAL INSTRUMENTS AND CONTROLS HANDBOOK
Interfaces or Gradients
Level measurements of interfaces between two dissimilar liquids, liquids and foam, and liquids andsolids require careful analysis. Oil and water are a common example of a dissimilar liquids interface.Under some conditions, radar and time-domain reflectometry technologies can be used to detect theinterface at the point of change from one low dielectric to another high dielectric liquid. Capacitanceinstruments can sometimes be used to measure one of the liquids and ignore the other if one isconductive/high dielectric and the other is nonconductive/low dielectric. Some types of ultrasonictechnologies can detect the transition at which the speed of sound or reflection of acoustic energyis related to the interface location. Measurement technologies that are less affected by changes inphysical properties (i.e., density only) like gamma and magnetostrictive sometimes can be used.
Often the transition between the two liquids is not well defined. There may be an emulsion layer orgradient that makes the definition of the interface more difficult to determine. The characteristics of theindividual liquids may not be constant, making it difficult to use some level measurement technologies.Conductivity, dielectric constants, and acoustic, optical, and density variations may prove challengingto different measurement technologies. Liquid/foam interfaces can also be influenced by changes inthese same parameters. Ultrasonic and radar measurements can be compromised by the presence offoam on a liquid if too little acoustic or microwave energy is reflected off the surface. Often levelswitch technologies are used that ignore the foam and react to the liquid. Vibration and ultrasonic gapswitches can work here. Liquid/solid interfaces are also influenced by changes in the density of thesolids.
Process Conductivity and Dielectric Constants
Conductive and capacitance measurements are dependent on predictable conductivity and dielectricconstants of the measured materials. Selection of the proper probe is also affected. When conductivityand dielectric changes are unpredictable and cannot be compensated for, then another level technologyshould be used.
Vibration
Vibrations might be present for different reasons, from engine-borne vibrations caused by pumps oragitators to vibrating silo bottoms for easier material flow in solids. These vibrations usually do notcause major problems; nevertheless, a few considerations are to be made:
� Is there a chance for the vibration to interfere with the measurement itself? (Unlikely, since onlyfew measuring principles depend on vibrations; only if the external vibrations occur in the samefrequency and amplitude range as the device specific vibrations might an influence be noted.)
� Do the vibrations apply any unusual forces to the sensor element? If so, the instrument might bedamaged over time.
� Are any strong vibrations applied to the sensor electronics? If so, a remote electronics might haveto be considered. It has to be mounted at a point where no vibrations are present.
Material Buildup or Stickiness
Material buildup may make certain level systems fail or work less reliably. The question to be asked isalways what kind of buildup can be expected in the process. Buildup must not always be a coating onthe sensor (contacting principles); another form of appearance may be condensation (which can alsoaffect noncontacting principles); material can also stick to the tank walls (causing wrong readings oflevel transmitters) or cause bridging between two elements of a sensor. Buildup can be addressed bydifferent technologies in different ways (refer to the respective chapters).

P1: xxx
1 September 1999 18:38 chap04combined.tex Chap04combined.sgm MH009v3(1999/07/12)
PROCESS VARIABLES—FIELD INSTRUMENTATION 4.159
Static Charge
Electrostatic charges/discharges are often generated during transport (pumping, pneumatic conveying,etc.) of nonconductive materials. These electrostatic charges can easily get a big as a couple of 10 kV.A sudden discharge through the sensor (for example, a capacitance probe) may apply an electricalenergy to the sensor electronics high enough to destroy components, particularly semiconductors. Onecan avoid, or at least minimize, problems with electrostatic discharge (ESD) (1) by choosing a suitablemeasurement principle that is not subject to ESD or (2) by taking steps to reduce the electrostaticpotential in the vessel and filling system (ground electrodes, etc.).
Humidity/Moisture
Some bulk solids can have variations in moisture content that are seasonal, composition related,or from different sources. Capacitance measurements, for example, can be affected as the change inmoisture content also changes the dielectric constant of the solids. Depending on process temperatures,moisture may also cause condensation at the coldest point in the tank (typically the tank cover/ceiling).A measurement principle has to be selected that is not affected by condensation or changes in thematerial properties.
Repeatability, Stability, and Accuracy Requirements
In many cases, the repeatability of a measurement and the stability of the output signal is a biggerconcern than the absolute accuracy. An accuracy of 0.2% under very specific laboratory conditionsdoes not mean too much if the output drifts up and down in the real application. The main concern ofan instrument manufacturer therefore is to design a product in a way that makes it extremely stable byitself and that makes it as insensitive as possible to external influences. Nevertheless, there is still theneed for the user to select the right measuring principle, since a good instrument in a bad applicationwill not perform as expected. Therefore any efforts put into the design of an instrument may be invain if it ends up being used in a process that does not fit.
ELECTROMECHANICAL LEVEL MEASUREMENTAND DETECTION SYSTEMS
Although newer electronic level measurement technologies have displaced some of the electrome-chanical level measurement instruments, there are many applications for which they are best suited.Level measurement systems based on the conductivity or capacitance of the product or on its relativedensity that use displacer or pressure methods can be less reliable in bulk solids because of the effectsof the variable conditions. These effects are as follows:
� Changes in the humidity content or composition of a product affect its electrical properties.� Changes in relative density and bulk density that are due to the settling of the product affect the
mechanical properties of the product.
The presence of foam, turbulence, air bubbles, and particles in suspension and high viscosity inliquid measurements should also be taken into consideration. Over the years, four type of mechanicalmeasurement systems have been developed to cope with these disruptive factors. They are
� floats� displacers� rotating elements� electromechanical plumb-bob systems

P1: xxx
1 September 1999 18:38 chap04combined.tex Chap04combined.sgm MH009v3(1999/07/12)
4.160 PROCESS/INDUSTRIAL INSTRUMENTS AND CONTROLS HANDBOOK
FLOAT
HERMETICALLYSEALEDMAGNETICREED SWITCH
PERMANENTMAGNET
FIGURE 1 How a typical float switch works.
FIGURE 2 Typical float switches.
Level Detection and Measurement of Liquidsby Use of Floats
Level detection of liquids is often done with a float-type level switch. The float moves on a mechanicalarm or sliding pole and activates a switch when the level moves it upward. Sometimes the floatsthemselves contain a small magnet that changes the state of a reed switch when the liquid levelmoving up moves it into position (Figs. 1 and 2).
The simplest form of a float system for level measurement consists of a float, a small cable, twopulleys, and a weight that is suspended on the outside of the open tank. A scale is mounted on theoutside of the tank, and the level of the tank contents is indicated by the position of the weight alongthe scale. In view of the requirements regarding mounting in sealed tanks, reading, and accuracy, thecurrent industrial systems that use the float method are good examples of mechanical and electronicengineering, making them the most accurate level measuring systems for applications in very largestorage tanks.
The advantages of this method are that it is relatively simple, suitable for various products, and veryaccurate. The disadvantages are that it requires a certain amount of mechanical equipment, especiallyin pressure vessels.
Level Detection and Measurement of Liquids by Use of Displacers
The displacement method is based on the difference between the weight of the displacement body andthe upward force exerted by the medium on this body. The upward force depends on the volume of thedisplacement body, the relative density of the medium, and the level of the medium. For given volumesand relative densities, the upward force will depend on only the level of the medium. Obviously thedisplacement body must be heavier than the medium to be displaced.

P1: xxx
1 September 1999 18:38 chap04combined.tex Chap04combined.sgm MH009v3(1999/07/12)
PROCESS VARIABLES—FIELD INSTRUMENTATION 4.161
The differential force is transmitted to a measuring transducer by means of a torque rod system inorder to maintain a seal. The transmitter used with the displacement transducer or force transducerprovides a 4–20-mA output. The displacement body is often mounted in a bypass pipe, which hasthe advantage of allowing any calibration and monitoring to be independent of the process involved.Also, the level of the product in the bypass pipe is somewhat more stable, resulting in a measurementthat is not oversensitive. If the displacement body is mounted directly on the process tank, then it isadvisable to mount it inside a guide tube or stilling well. The height of the separation layer betweentwo products of different relative densities can also be measured with the displacement body method.The obvious advantage of this method is that the absolute level does not change.
The advantage of this method is accuracy. The disadvantages are that it is dependent on relativedensity and requires a significant amount of mechanical equipment.
Level Detection of Solids by Use of Rotating Paddles
Level is detected by the change in inertia of a rotating paddle depending on whether the paddle is inthe air or in contact with a product.
FIGURE 3 Paddle wheel switches.
An example of a practical application is a paddle mounted on a shaft projectinginto a silo, driven by a small synchronous motor through a reduction gear. Whenthe paddle encounters resistance from the product, then the rotating drive systemsupported on bearings will move. Two microswitches, positioned to detect thismovement, will change over. When the product no longer exerts a resistanceagainst the paddle, the drive mechanism will return to its original position, andone contact will restart the motor, while the other will indicate the change inlevel. (Fig. 3).
The rotary level switch is used in simple processes and in cases in whichproduct buildup is likely, since this type of switch is not generally sensitive tobuildup. They are usually mounted horizontally in a silo at the desired switchingpoint. The paddle is designed for mounting from the outside of the silo througha 11/4- or 11/2 in socket.
The standard paddle may be too small for use with light products, which would not provideadequate resistance. In cases like this, a proportionally larger paddle should be used, but this wouldhave to be mounted from inside the silo.
The product fill stream should not be directly on top of the shaft, and, when used as a minimumlevel limit switch, particular attention should be to the maximum load on the shaft. An appropriatesolution to these problems may be to erect a protective screen above the paddle.
Level Measurement of Liquids and Solids by Use of a Plumb Bob
Level is measured when the surface of the product is plumbed from the top of the silo and, comparedwith the silo height, the difference is the product level. The plumb bob consists of a sensing weight,suspended inside the silo, on a tape or wire wound on a motor-driven reel. When the start is initiatedmanually or automatically by means of a time relay, the counter is automatically reset to the totalsilo height and the motor lowers the sensing weight into the silo. A measuring wheel, driven by themeasuring tape, sends a pulse corresponding to the distance traveled. This is then subtracted from thereading on the counter. As the weight contacts the surface of the product, the tape will go slack. Thisis sensed, and the motor is reversed. The counter stops generating pulses and the measuring tape iswound back onto the reel. The weight then remains at the top of the silo, and the counter remains setto the last measured height until a signal is given for the measurement to be repeated.
This type of measurement system is suitable for level measurements of bulk materials and liquidsin tall narrow silos and large storage tanks. The operating principle makes the plumb bob an efficientand inexpensive method for use with coarse-ground bulk materials, e.g., lime, stone, or coal. Theaccuracy is relatively high for tall silos and versions with accuracies of 1 mm are used in commodity

P1: xxx
1 September 1999 18:38 chap04combined.tex Chap04combined.sgm MH009v3(1999/07/12)
4.162 PROCESS/INDUSTRIAL INSTRUMENTS AND CONTROLS HANDBOOK
storage tanks. Care must be taken to make sure the motor-driven wheel has the strength to pull up theplumb bob if it is buried or coated with product.
ELECTRONIC/ELECTROMAGNETIC LEVEL DETECTIONAND MEASUREMENT SYSTEMS
Level measurement and detection systems for which electronic and electromagnetic principles are usedhave grown considerably. Advances in microprocessor/software, mechanical design, and measurementtechniques have made it possible to develop measurement systems that can now do economically ina process plant what was possible only in the laboratory and at great expense.
Level Detection of Liquids by Use of Conductivity
This method is suitable only for level measurement in conductive liquids. The difference in conduc-tivity of a partially insulated electrode is measured when the probe is covered and not covered withthe conductive product. The metal wall of the tank can be used as the other electrode, or a secondelectrode can be inserted into the tank. Additional electrodes of different lengths can be added todetect other levels.
The advantages of this method are simple, inexpensive and suitable for dual or multiple pointcontrol. The disadvantages are probe cannot become contaminated with grease or other deposits andhas limited suitability for products of varying conductivity (Fig. 4).
The principle for this form of level measurement is that the presence of a product will cause achange in the resistance between two conductors. A practical application of this principle is as follows.An indication of the level of electrically conductive products in a metal tank, or other container, canbe obtained very simply by means of a probe insulated from the vessel and a conductivity amplifier.When the product is not in contact with the probe, the electrical resistance between the probe and thetank wall will be very high or even infinite. When the level of the product rises to complete the circuitwith the probe and the tank wall, the resistance will be relatively low.
The calibration of conductivity switches is relatively simple. The production process should havebeen in operation, so there would be some natural contamination, or parallel resistance, caused bythe buildup. The switch point is then chosen for a probe with an immersion of approximately 5 cm,then adjusted so the relay is energized. When the level subsequently drops and exposes the probe, therelay will deenergize.
L0 L1 L2 L0 L1 L2 L3 L4
Stop (Start)Start (Stop)
High AlarmLatchingfor control
Low Alarm
FIGURE 4 Conductivity switches.

P1: xxx
1 September 1999 18:38 chap04combined.tex Chap04combined.sgm MH009v3(1999/07/12)
PROCESS VARIABLES—FIELD INSTRUMENTATION 4.163
≈ ∆f
Oscillator Receiver
Frequency shift tuningforkPiezo crystal oscillatesforksSolution causes areduction in resonantfrequencySecond crystal detectsfrequency change
Principle of operation
FIGURE 5 Example of frequency shift tuning fork, used for measurement of liquidsand slurries. ( Photo courtesy of Endress & Hauser.)
Level Detection of Liquids by Use of Vibrating Forks Resonanceor Rod Attenuation
The vibrating fork level limit switch consists of a symmetrical vibration fork with tines, which arewider at their ends. There is a thin membrane at the base of the vibrating fork which forms part ofthe process connection/mounting, so only a single stainless steel probe projects into the process. Thevibrating fork is driven to its resonant frequency in air through the membrane by a piezoelectric crystal(Fig. 5).
The vibrating fork is designed so that when immersed in a liquid, there will be a shift in its resonantfrequency of approximately 10% to 20%. The natural resonant frequency is picked up by a receivercrystal, and the shift in resonant frequency is detected by a reference circuit.
The vibrating tuning fork has a number of notable characteristics:
� no moving parts, thus no maintenance� insensitive to appreciable buildup, strong flow, turbulence, air bubbles or particles in suspension� can be mounted in any position� small and can be mounted in a 1-in or smaller mounting boss

P1: xxx
1 September 1999 18:38 chap04combined.tex Chap04combined.sgm MH009v3(1999/07/12)
4.164 PROCESS/INDUSTRIAL INSTRUMENTS AND CONTROLS HANDBOOK
� no calibration required� suitable for products with high viscosity
Some examples of applications are
� as dry-run safety devices in monopumps: fruit pulps, sauces, and syrups� as minimum level monitoring system in processing plants� as prelevel and high-level alarms in degassing tank for process water� as minimum lubrication oil level safety devices in gear boxes and crank cases� as condition indicators for the addition of subsequent components in mixing vessels� as leak detectors in cellars, document stores, and computer rooms
Level Detection of Solids by Use of Vibrating Fork or Rod Attenuation
This type of system typically consists of two tines mounted on a membrane with a natural resonanceof approximately 120 Hz (Fig. 6). Two piezoelectric crystals are mounted on the membrane. One ofthese crystals is driven by a 120-Hz oscillator, causing the system to resonate when the product doesnot cover the tines. When the product comes in contact with the tines or rod it causes an attenuationof the vibration that is detected by the second piezoelectric crystal (Fig. 7).
FIGURE 6 Correct installation of tuning fork.

P1: xxx
1 September 1999 18:38 chap04combined.tex Chap04combined.sgm MH009v3(1999/07/12)
PROCESS VARIABLES—FIELD INSTRUMENTATION 4.165
FIGURE 7 Example of amplitude shift tuning fork, used for measurement ofsolids. ( Photo courtesy of Endress & Hauser.)

P1: xxx
1 September 1999 18:38 chap04combined.tex Chap04combined.sgm MH009v3(1999/07/12)
4.166 PROCESS/INDUSTRIAL INSTRUMENTS AND CONTROLS HANDBOOK
LOGICLOGIC
Alarm
UncoveredCovered
Transmit
Receive
FIGURE 8 Covered and uncovered ultrasonic gap switches.
Level Detection of Liquids by Use of Ultrasonic Gap
An ultrasonic gap switch consists of transmit and receive piezoelectric crystals positioned in a probewhere a liquid can move freely between them (Fig. 8). The transmit crystal emits acoustic pulses inthe 500–1000-MHz range. When no liquid is in the gap this acoustic emission is not coupled to thereceive crystal. As the liquid fills this gap the acoustic energy is conducted to the receive crystal andindicates level detection. Process temperatures exceeding 300◦F and pressures over 2000 psi can beaddressed by some versions. An advantage is that there are no moving parts to hang up or wear outand no routine maintenance requirements. A disadvantage is anything that can compromise the gap,such as plugging or crystalline buildup (Fig. 8).
Level Detection of Liquids by Use of Thermodispersion
This technique relies on the detection of the dispersion or removal of heat from a slightly heatedelement. A probe containing two temperature sensors and heating element is inserted in the vessel atthe point level indication is desired (Fig. 9). A change in the rate of heat removal occurs when the liquidlevel makes contact with the liquid. The temperature sensors measure this change in heat transfer andprovide an indication. An advantage of this approach is independence from material characteristicssuch as conductivity and dielectric constant. A disadvantage is susceptibility to coatings and buildup.
Level Measurement of Liquids by Use of Bubblers
In this method, the total hydrostatic pressure within a tank is measured by insertion of a narrow tubeinto the liquid and application of compressed air to the pipe so that the liquid column in the pipe

P1: xxx
1 September 1999 18:38 chap04combined.tex Chap04combined.sgm MH009v3(1999/07/12)
PROCESS VARIABLES—FIELD INSTRUMENTATION 4.167
FIGURE 9 Thermal dispersion switch.
is pushed down and air bubbles are just formed in the liquid. These bubbles give the method itsname. The pressure of the air in the pipe is now equal to the pressure of the liquid column and canbe measured with a pressure transducer, which converts the pressure into an electrical signal. Thecompressed air can be supplied from the main air utility by means of a reducing valve or by using aminiature compressor.
The advantage of this method is simple assembly, suitable for corrosive substances. The disad-vantages are that it requires air lines and air consumption, there is a danger of buildup of medium onthe bubble pipe, and it is not suitable for use in pressurized vessels.
Level Measurement by Use of Pressure Transmitters
Principle. The principle for level measurement by use of pressure transmitters is based on themeasurement of the hydrostatic pressure produced by a column of liquid at a given height. Thepressure is calculated with the following formula:
P = h · ρ · g
where P = pressureh = height of the liquid columng = acceleration due to gravityρ = relative density
From this formula, it is evident that if the specific gravity of the medium does not vary, theonly variable in the formula will be the height h. Therefore the pressure measured will be directlyproportional to height h, the level of the liquid in the tank (see Fig. 10).
This diagram also illustrates that the pressure measured is equal to the pressure of the liquid columnplus the surface pressure.
In tanks open to the atmosphere, the pressure on the surface of the liquids will be equal to theatmospheric pressure. Most pressure sensors compensate for atmospheric pressure. If the pressure onthe surface of the liquid is greater or smaller than atmospheric pressure, then a differential pressuresensor can be used and, in this case, the pressure acting on the surface is subtracted from the totalpressure, leaving only the pressure that is due to the column of liquid.
The SI unit of pressure is the Pascal (Pa), but pressure can also be expressed in psi or head of aliquid column.
Examples of pressure conversions:
1 Pascal = 1 N/m2
14,504 psi = 100 kPA

P1: xxx
1 September 1999 18:38 chap04combined.tex Chap04combined.sgm MH009v3(1999/07/12)
4.168 PROCESS/INDUSTRIAL INSTRUMENTS AND CONTROLS HANDBOOK
FIGURE 10 Pressure transmitters.
1 bar = 10 m head of water
14,504 psi = 401.47 in H2O
Mounting. A pressure sensor is exposed to the pressure the system has to measure. Therefore it isusually mounted at or near the bottom of the tank. If the sensor cannot be mounted directly in theside of the tank at the appropriate depth, it can be mounted from the top of the tank and lowered tothe appropriate depth on the end of a rod or cable (see Fig. 10). Cable-extended versions are alsoavailable for use in deep wells and reservoirs.
If the sensor is to be mounted on extension nozzles or long pipes, care must be taken to ensurethat the medium will not crystallize or congeal in the pipe. If this is allowed to happen, the pressurewill no longer be transmitted to the membrane and thus cannot be measured. To prevent this, either adifferent mounting system should be chosen or the nozzle or pipe could be heated.
Figures 11–17 show examples of recommended mounting of pressure and differential pressure(DP) transmitters for level measurement.
For applications in corrosive products in which a standard stainless-steel diaphragm is not suf-ficiently resistant, pressure transmitters are available with Monel, Hastelloy, tantalum, or ceramicmembranes. The remaining part of the sensor body/flange can be made of virtually any corrosion-resistant material.
Should these special models still not meet corrosion resistance requirements, one solution wouldbe to use the bubble tube principle (see Fig. 18). This involves connecting one end of a suitable plastictube to a small compressor and reducing valve, while the other end is placed into the liquid by meansof a standard pressure sensor. The compressor exerts sufficient enough pressure to exceed the pressureof the liquid column, causing bubbles to escape.
This creates a backpressure in the tube equal to the pressure exerted by the liquid column. The backpressure is measured by the pressure sensor. With this system the liquid level is measured without

P1: xxx
1 September 1999 18:38 chap04combined.tex Chap04combined.sgm MH009v3(1999/07/12)
PROCESS VARIABLES—FIELD INSTRUMENTATION 4.169
FIGURE 11 Flange-mounted device, open tank.
FIGURE 12 Impulse pipe connection, open tank.
FIGURE 13 Flange-mounted device, closed tank.

P1: xxx
1 September 1999 18:38 chap04combined.tex Chap04combined.sgm MH009v3(1999/07/12)
4.170 PROCESS/INDUSTRIAL INSTRUMENTS AND CONTROLS HANDBOOK
FIGURE 14 Impulse pipe connection, closed tank.
−
+
Max.
Min.
Mount the transmitter directlyon the tank.The tapping for the negative sidemust be above the maximum levelto be measured.Install the pressure piping with acontinuous fall of at least 10%.A condensation trap ensuresconstant pressure on the negative side.
Horizontal Run
CondensateTrap
Shut-offValve
Flange Mounted DeviceClosed Tank with Steaming Liquid
e.g. Trapand DrainCock
FIGURE 15 Flange-mounted device, closed tank with steaming liquid.
the equipment coming into contact with the liquid, eliminating product corrosiveness problems.Advantages of the bubble pipe method are its simple assembly and suitability for corrosive substances.Disadvantages include the requirement for air lines and air consumption and the danger of buildup ofmedium on the bubble pipe, which render the method as unsuitable for use in pressurized vessels.
Today, more and more bubbler systems are being replaced by top-mounted rod- or cable-suspendedpressure sensors.

P1: xxx
1 September 1999 18:38 chap04combined.tex Chap04combined.sgm MH009v3(1999/07/12)
PROCESS VARIABLES—FIELD INSTRUMENTATION 4.171
FIGURE 16 Impulse pipe connection, closed tank with steaming liquid.
FIGURE 17 DP transmitter with remote diaphragm seals, closed tank.
Electronic DP Measurement
To minimize potential measurement errors associated with the use of dry or wet impulse pipes ortemperature-related errors on remote seals, in certain applications electronic DP measurement maybe an alternative.
To obtain an electronic DP measurement, two gage pressure transmitters are used. One transmitteris placed at the bottom of the tank to measure the height of the liquid column plus pressure (seeFig. 19). The second transmitter is located at the top of the tank where it measures the head pressure

P1: xxx
1 September 1999 18:38 chap04combined.tex Chap04combined.sgm MH009v3(1999/07/12)
4.172 PROCESS/INDUSTRIAL INSTRUMENTS AND CONTROLS HANDBOOK
FIGURE 18 (Bubble pipe connection.)
FIGURE 19 Electronic DP measurement.
only (see Fig. 19). The two 4- to 20-mA signals can then simply be subtracted (level = A − B) toobtain the actual level measurement.
The formula is usually accomplished with a PLC or math module. To maintain accuracy andresolution of measurement, it is recommended only for applications for which there is a 1 : 6 maximumratio of hydrostatic pressure to head pressure.

P1: xxx
1 September 1999 18:38 chap04combined.tex Chap04combined.sgm MH009v3(1999/07/12)
PROCESS VARIABLES—FIELD INSTRUMENTATION 4.173
Calibration
One of the practical advantages of pressure sensors is undoubtedly the fact that they are so easy tocalibrate. The empty 0% reading is taken for an uncovered pressure sensor at atmospheric pressureand a certain level or x m head of water is chosen for the full 100% reading. This can be achievedwith a pressure calibrator.
Level Detection and Measurement of Liquids and Solidsby Use of Ultrasonic
Ultrasonic level measurement technology is based on the fact that sound travels through a mediumwith a known propagation speed, depending on the density and the temperature of that medium. Thepulse time of flight (PTOF ) method used in this kind of instrumentation utilizes a short ultrasonicpulse generated by a transducer. This pulse travels through the medium (typically air or a similar gasmix) and is reflected back to the transducer when it hits the surface of the material to be measured.The time it takes from emitting the signal to receiving the reflection is measured and then used (basedon the known propagation speed of the sound wave) to calculate the distance to the level surface andthe level height (based on the programmed calibration values of the system).
This noncontact form of measurement is ideal for many industrial applications for which corrosiveconditions, changing product characteristics, and other factors make contacting level measurementdevices less suitable. In water and wastewater applications, ultrasonic level measuring systems canbe used to measure open channel flow, differential level across screens, and wet well level. Ultrasoniclevel systems are used in solids applications for accurate measurement of hopper level and bulk storageinventory.
The measurement system consists of a transducer or sensor, mounted on the tank or silo, and either aremote measurement transmitter or transmitter electronics built into the sensor (compact instruments)(Figs. 20 and 21). These compact systems offer many advantages, including simple installation, on-sitecalibration, and low prices. They can be very effective in applications like conveyor-belt monitoring,pump control, two-point control, and distance measurement (Fig. 22). However, the remainder ofthis discussion of ultrasonic level measurement will focus on traditional ultrasonic level measuringsystems (sensor and remote transmitter). The basic considerations and physical facts apply to bothtypes of instrumentation.
FIGURE 20 Ultrasonic sensors are available in a variety of sensors and constructed of variousmaterials to suit the application.
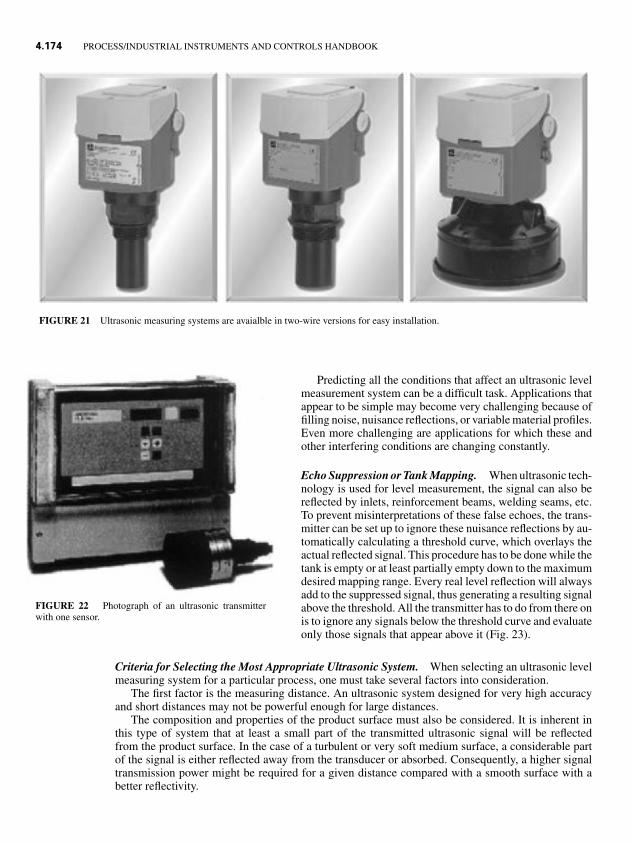
P1: xxx
1 September 1999 18:38 chap04combined.tex Chap04combined.sgm MH009v3(1999/07/12)
4.174 PROCESS/INDUSTRIAL INSTRUMENTS AND CONTROLS HANDBOOK
FIGURE 21 Ultrasonic measuring systems are avaialble in two-wire versions for easy installation.
FIGURE 22 Photograph of an ultrasonic transmitterwith one sensor.
Predicting all the conditions that affect an ultrasonic levelmeasurement system can be a difficult task. Applications thatappear to be simple may become very challenging because offilling noise, nuisance reflections, or variable material profiles.Even more challenging are applications for which these andother interfering conditions are changing constantly.
Echo Suppression or Tank Mapping. When ultrasonic tech-nology is used for level measurement, the signal can also bereflected by inlets, reinforcement beams, welding seams, etc.To prevent misinterpretations of these false echoes, the trans-mitter can be set up to ignore these nuisance reflections by au-tomatically calculating a threshold curve, which overlays theactual reflected signal. This procedure has to be done while thetank is empty or at least partially empty down to the maximumdesired mapping range. Every real level reflection will alwaysadd to the suppressed signal, thus generating a resulting signalabove the threshold. All the transmitter has to do from there onis to ignore any signals below the threshold curve and evaluateonly those signals that appear above it (Fig. 23).
Criteria for Selecting the Most Appropriate Ultrasonic System. When selecting an ultrasonic levelmeasuring system for a particular process, one must take several factors into consideration.
The first factor is the measuring distance. An ultrasonic system designed for very high accuracyand short distances may not be powerful enough for large distances.
The composition and properties of the product surface must also be considered. It is inherent inthis type of system that at least a small part of the transmitted ultrasonic signal will be reflectedfrom the product surface. In the case of a turbulent or very soft medium surface, a considerable partof the signal is either reflected away from the transducer or absorbed. Consequently, a higher signaltransmission power might be required for a given distance compared with a smooth surface with abetter reflectivity.

P1: xxx
1 September 1999 18:38 chap04combined.tex Chap04combined.sgm MH009v3(1999/07/12)
PROCESS VARIABLES—FIELD INSTRUMENTATION 4.175
FIGURE 23 Tank mapping function illustrated. This powerful feature can solve many appli-cation dilemmas.
The presence or absence of foam has to be taken into account. A layer of foam on the liquid surfacemay (depending on its density) cause the signal to reflect off the foam surface (dense, thick foam),cause a complete signal absorption (soft, thick foam), or may not affect the signal in any significantway (light, thin foam).
In bulk solids, the grain size plays an important role. If the bulk material is composed of finegranules, then less energy will be reflected, so a greater transmission power is required for achievingthe same distance measurement.
Both the signal transmitted from the sensor and the reflected signal must pass through the atmo-sphere in the tank or silo. All the factors, which are likely to weaken or interfere with the signalby absorption or reflection, must be carefully examined so the most appropriate system can be se-lected. These factors include the presence of dust, steam, pressure, temperature, and variations in thecomposition of gases.
Ultrasonic measurement systems are not sensitive to pressure variations. There will be no signifi-cant changes in the sound propagation speed. However, there are two limitations. First, the specifiedmaximum pressure is purely a mechanical limitation. At very high pressures, the sensor may not beable to function because of the forces exerted on it. On the other hand, the system cannot operate atextremely low pressures because the air, or gas, will not be able to transmit the sound signal properlywhen a partial vacuum develops.
Variations in temperature will affect the sound velocity. Each transducer should be fitted with atemperature sensor that then electronically compensates for temperature variations of the air or gas.However, since temperature can be measured at only one point, certain variations may result becauseof temperature layers (different temperatures at the medium and the sensor).
The gas composition must also be considered. The propagation speed of sound waves will varyin air and in other gases or vapors. The transmitter will always process the signal on the basis ofthe speed of sound in air. Adjustments can be made when calibrating the system to compensate fordifferent propagation speeds, but accurate readings can be achieved only based on the assumptionthat these gas properties are constant for the given application and do not change over the time.
Mounting. For best performance and maximum range, the sensor must be mounted in the bestpossible position for the ultrasonic level measuring system to perform optimally. The sensor must be

P1: xxx
1 September 1999 18:38 chap04combined.tex Chap04combined.sgm MH009v3(1999/07/12)
4.176 PROCESS/INDUSTRIAL INSTRUMENTS AND CONTROLS HANDBOOK
mounted in a position where there are no obstructions between the product surface and the sensor.Access ladders, immersion elements, stirrers, pump inlets, or a stream of falling product can allproduce interference echoes. These can often be avoided by simply choosing a different position.The sensor should be in a location that maximizes its returned echo signal and minimizes vesselobstructions in its line of sight. Although an individual sensor has a constant, definable output beam,the more important consideration is the line-of-sight-reflected echo.
Minimizing vessel obstructions in the line of sight is accomplished by consideration of the geometryof both the vessel and the resulting reflected echoes. On vessels that have coned bottoms or dished(round) tops, positioning the sensor away from the vessel center is recommended to eliminate echotravel paths not related to the level.
Maximizing the returned level echo is generally accomplished by avoiding sensor mounts thateither sight into the fill stream or position the sensor so that a large part of its output beam is lost intothe vessel wall.
The position of the sensor must also comply with other requirements. The blocking distance (blindspace, dead space, etc.) is the area directly below the sensor in which level cannot be sensed. Eachtime the sensor pulses, it must stop ringing before it can listen for a returned signal. This waitingperiod translates into a specific distance, the blocking distance, which is inherent to the sensor modelspecified. The product level must not be allowed within this distance.
Advantages/Disadvantages. The main advantages of an ultrasonic system are that it has a noncon-tacting principle, it has no influences from changes of the material properties, its sensor is not subjectto wear and tear, and it has a wide range of applications. The disadvantages are that it is sensitive toinconsistent gas concentrations in the free space between sensor and product, foam has to be takeninto consideration, and it is not suitable for high temperatures and pressures.
Level Detection and Measurement of Liquids and Solidsby Use of Capacitance
Capacitance level measurement systems measure the overall capacitance of a capacitor formed by(typically, but not necessarily) the tank wall and a probe (rod/cable) (Fig. 24). This capacitancechanges depending on the degree of coverage of the probe with the material to be measured.
A capacitor is an electrical component capable of storing a certain electrical charge. It basicallyconsists of two metal plates separated by an insulator known as a dielectric. The electrical size
FIGURE 24 Capacitance level measuring principle.

P1: xxx
1 September 1999 18:38 chap04combined.tex Chap04combined.sgm MH009v3(1999/07/12)
PROCESS VARIABLES—FIELD INSTRUMENTATION 4.177
(capacitance) of a capacitor depends on (1) the surface area of the plates, (2) the distance of the plates,and (3) the dielectric constant of the material between the plates. While the surface area and the distanceof the plates will be individually different from measuring point to measuring point [depending on thedesired indication range (probe length)], they will remain constant for a given application. The onlyvariable left is the dielectric constant of the medium. When the process material replaces the emptyspace or air (dielectric constant 1) in the vessel, the capacitance of the capacitor increases (the higherthe level, the bigger the capacitance). All liquids or solids have a dielectric constant higher than one(1). The transmitter electronics registers the change in capacitance. This change is converted to anelectrical signal and used to provide an output for a switch point or a continuous level system.
To achieve a reliable measurement, the dielectric constant of the process material must be constant.If the material in a tank is changed against a material with a different dielectric constant, a recalibrationis required for standard probes. More expensive self-compensating systems are available, but cannotalways be applied.
The main applications for capacitance probes are level limit detection (point level) in liquids orsolids and continuous measurement in liquids. Continuous measurement in solids is not recommended,since solids have the tendency to change their moisture contents, which affects the dielectric constant,which in turn leads to an unstable, drifting, nonreliable measurement.
FIGURE 25 Example of function of a fully insulatedprobe.
Fully and Partially Insulated Probes
Two major versions of capacitance probes are avail-able, regardless of the individual construction (rod,cable, or specially shaped sensor electrode). Thesetwo versions are (1) fully insulated probes, with thesensing element completely coated with an insula-tion material (Fig. 25), and (2) partially insulatedprobes, with the sensing element still isolated fromground (which is a requirement), but, besides that, ismade of blank metal. The fully insulated probe pro-vides a galvanic separation to the process material,while the partially insulated probe is in direct gal-vanic contact. The required probe type for a givenapplication can be selected from Table 1.
TABLE 1 Required Probe Type for a Given Application
Application Fully Insulated Partially Insulated
Point level, tip sensitive, process √ √
material nonconductivePoint level, adjustable switch point, √ √
process material nonconductivePoint level, tip sensitive, process √ √
material conductivePoint level, adjustable switch point, √ Not suitable
process material conductiveContinuous level, process √ √
material nonconductiveContinuous level, process √ Not suitable
material conductiveProcess material with extremely Limited suitability √
low dielectric constantProcess material chemically √ Only with special probe materials
aggressive

P1: xxx
1 September 1999 18:38 chap04combined.tex Chap04combined.sgm MH009v3(1999/07/12)
4.178 PROCESS/INDUSTRIAL INSTRUMENTS AND CONTROLS HANDBOOK
Capacitance Probes and Ground References
A capacitance system always requires a reference potential (the second plate of the capacitor).Depending on the probe design, this reference is already built into the probe, or a separate reference
(typically the tank wall, but also an additionally mounted reference electrode) is used. Since a metaltank is usually connected to ground potential, this reference is often referred to as ground reference.Some manufacturers state that no ground reference is required, mainly for point level probes. Theseprobes do use a ground reference as well, but it is already built into the probe; thus the statementshould be “no additional ground reference required.”
Because of the higher mechanical requirements for the manufacturing of a probe with a groundreference being built in or for making an additional ground reference electrode, these systems aremore expensive than plain rod or cable versions. Hence the question arises of when the extra moneyshould be spent for a probe with an integral or separate ground reference and when a standard probecan be used.
Here are some guidelines:
� In tanks made of nonconductive materials, a built-in or external ground reference is definitelyrequired. Reason: Without a reference, the system will not respond properly and may give erraticreadings.
� For a continuous measurement of nonconductive liquids in horizontal cylindrical tanks, tanks witha cone bottom or tanks with any irregular shape or with built-in items (like cooling or heating coils),a ground reference parallel to the probe is required, even if the tank is made from metal. Reason:The distance between the tank wall (or any internal installations) and the probe is not constantover the length of the probe, therefore the capacitance change per length unit (i.e., pF/in) variesdepending on the level height. As a consequence, the measurement will be nonlinear.
� Level measurement (continuous) or detection (point level) in materials with very low dielectricconstants can be considerably improved with built-in or external ground references mounted parallelto the probe. Reason: These references are much closer to the probe, and the capacitance changeper length unit (i.e. pF/in) will be higher compared with that of a system without an additionalreference. Consequently, the indication becomes more reliable; sometimes the presence or absenceof a ground reference determines whether a system can be calibrated at all.
Capacitance Probes and Buildup
Buildup on a capacitance probe may be a serious source of trouble, depending on how thickly itcoats the probe and how conductive it is. It can keep point level systems from properly switchingand it might lead to a wrong level indication (offset) in continuous measurements. The influence ofbuildup on continuous systems can be minimized with two different approaches, which may be usedin combination:
� Using a dead section at the upper couple of inches (between the sensing element and the processconnection) prevents condensation, which typically occurs close to the tank ceiling or in nozzles,from influencing the measurement.
� If the sensing element of the probe is coated itself, particularly if the buildup is conductive, theselection of a higher measuring frequency considerably reduces the effect on the output signal(example: use a frequency of 1 MHz rather than 33 kHz). Systems with high frequencies areusually limited to shorter probes (rod probes rather than cable probes)
In applications that involve an extreme level of buildup, an alternative measurement technology shouldbe considered.
For point level systems, buildup can again be handled in two different ways.
� Use a dead section (see above).

P1: xxx
1 September 1999 18:38 chap04combined.tex Chap04combined.sgm MH009v3(1999/07/12)
PROCESS VARIABLES—FIELD INSTRUMENTATION 4.179
FIGURE 26 Example of capacitance probe with active guard.
FIGURE 27 Illustration of a capacitance probe showing active guard.
� Use a compensation electrode that is an integral part of the probe (active guard, active compensa-tion against buildup, driven shield). This electrode actively compensates for changing amounts ofbuildup, allowing the capacitance switch to work, even if the probe is completely coated (Fig. 26).
In a standard probe configuration (without active guard) the measuring loop consists of a high-frequency (HF ) oscillator, probe, and impedance of the product. The switching of a level device iscaused by the change of high impedance (no product) to low impedance (product at the probe). Incase of heavy buildup that remains on the probe while the real level is gone, the level switch is shortcircuited and will still “see” the level.
A probe with an active guard system actually consists of two HF loops, one for the actual probeand one with a controlled signal for the guard (Fig. 27).
If any buildup is formed, the controller keeps the signal (amplitude and phase) of the guard onthe same level as the signal at the probe. There is a current between the guard and ground, but nocurrent between the probe and guard (since they are on equal potential); therefore there is no levelindicated. If a real level is present, there is a current between the probe and ground, so the switch willbe activated.
Installation and Application Considerations
Some important considerations have been mentioned above already (like dielectric constant andconductivity of the material to be measured, the tank material, buildup, etc.). Some other aspectsshould be taken into account as well:
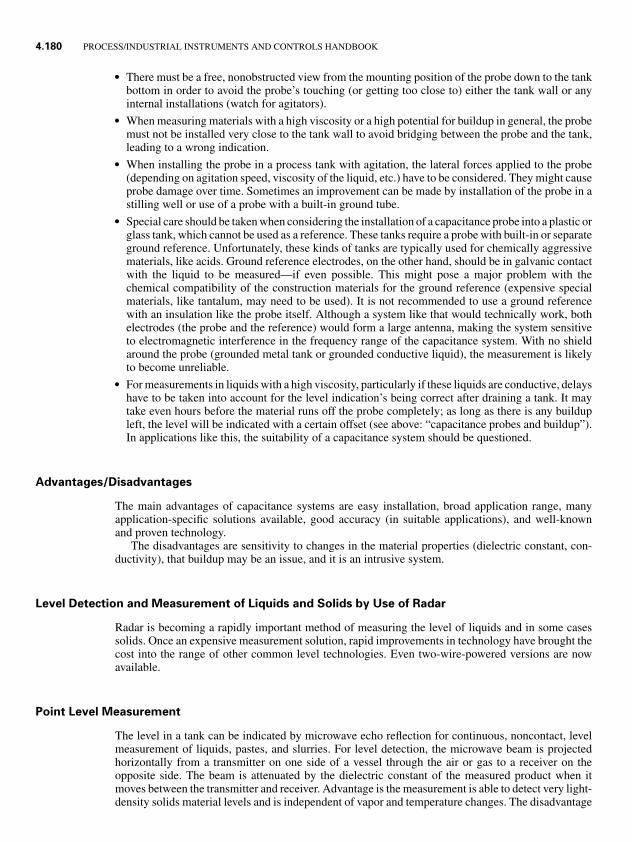
P1: xxx
1 September 1999 18:38 chap04combined.tex Chap04combined.sgm MH009v3(1999/07/12)
4.180 PROCESS/INDUSTRIAL INSTRUMENTS AND CONTROLS HANDBOOK
� There must be a free, nonobstructed view from the mounting position of the probe down to the tankbottom in order to avoid the probe’s touching (or getting too close to) either the tank wall or anyinternal installations (watch for agitators).
� When measuring materials with a high viscosity or a high potential for buildup in general, the probemust not be installed very close to the tank wall to avoid bridging between the probe and the tank,leading to a wrong indication.
� When installing the probe in a process tank with agitation, the lateral forces applied to the probe(depending on agitation speed, viscosity of the liquid, etc.) have to be considered. They might causeprobe damage over time. Sometimes an improvement can be made by installation of the probe in astilling well or use of a probe with a built-in ground tube.
� Special care should be taken when considering the installation of a capacitance probe into a plastic orglass tank, which cannot be used as a reference. These tanks require a probe with built-in or separateground reference. Unfortunately, these kinds of tanks are typically used for chemically aggressivematerials, like acids. Ground reference electrodes, on the other hand, should be in galvanic contactwith the liquid to be measured—if even possible. This might pose a major problem with thechemical compatibility of the construction materials for the ground reference (expensive specialmaterials, like tantalum, may need to be used). It is not recommended to use a ground referencewith an insulation like the probe itself. Although a system like that would technically work, bothelectrodes (the probe and the reference) would form a large antenna, making the system sensitiveto electromagnetic interference in the frequency range of the capacitance system. With no shieldaround the probe (grounded metal tank or grounded conductive liquid), the measurement is likelyto become unreliable.
� For measurements in liquids with a high viscosity, particularly if these liquids are conductive, delayshave to be taken into account for the level indication’s being correct after draining a tank. It maytake even hours before the material runs off the probe completely; as long as there is any buildupleft, the level will be indicated with a certain offset (see above: “capacitance probes and buildup”).In applications like this, the suitability of a capacitance system should be questioned.
Advantages/Disadvantages
The main advantages of capacitance systems are easy installation, broad application range, manyapplication-specific solutions available, good accuracy (in suitable applications), and well-knownand proven technology.
The disadvantages are sensitivity to changes in the material properties (dielectric constant, con-ductivity), that buildup may be an issue, and it is an intrusive system.
Level Detection and Measurement of Liquids and Solids by Use of Radar
Radar is becoming a rapidly important method of measuring the level of liquids and in some casessolids. Once an expensive measurement solution, rapid improvements in technology have brought thecost into the range of other common level technologies. Even two-wire-powered versions are nowavailable.
Point Level Measurement
The level in a tank can be indicated by microwave echo reflection for continuous, noncontact, levelmeasurement of liquids, pastes, and slurries. For level detection, the microwave beam is projectedhorizontally from a transmitter on one side of a vessel through the air or gas to a receiver on theopposite side. The beam is attenuated by the dielectric constant of the measured product when itmoves between the transmitter and receiver. Advantage is the measurement is able to detect very light-density solids material levels and is independent of vapor and temperature changes. The disadvantage

P1: xxx
1 September 1999 18:38 chap04combined.tex Chap04combined.sgm MH009v3(1999/07/12)
PROCESS VARIABLES—FIELD INSTRUMENTATION 4.181
FIGURE 28 Radar device installed in a storage tank.
is the requirement for nonmetallic vessel walls or windows and vulnerability to buildup of materialor moisture, which can cause false level indications.
Continuous Level Measurement
A microwave level transmitter, sometimes referred to as a radar level gage, uses a radar (PTOF ) orfrequency-modulated continuous-wave (FMCW) measurement methods and operates in a frequencyband approved for industrial use. The low beam power used by the transmitter allows safe installationin metallic and nonmetallic vessels, with no risk to humans or the environment. The technical speci-fications of each radar level gage should be consulted carefully, as some units require a site license,from the FCC, before installation (Fig. 28).
Microwave or radar level measurement can be applied in storage, buffer, and process tanks in whichtemperature gradients, inert-gas blankets, and vapors are present. It can be used on bypass pipes andstilling wells as a substitute for mechanical systems. It provides reliable measurement under difficultconditions, such as when the dielectric constant of the medium is less than 1.9 or vortices are present.
Selection Criteria
Microwave measurements are virtually independent of temperature, pressure, and the presence ofdust or vapor. Only the dielectric constant of the product must exhibit a minimum value, which isdependent on the measuring range. The selection of a suitable system is dependent on the application.

P1: xxx
1 September 1999 18:38 chap04combined.tex Chap04combined.sgm MH009v3(1999/07/12)
4.182 PROCESS/INDUSTRIAL INSTRUMENTS AND CONTROLS HANDBOOK
FIGURE 29 (a)Four-wire radar level gage with horn antenna, (b) four-wire radargauge with Teflon rod antenna.
level
(a) (b)
The antenna size and configuration are determined by the measuring range desired, process conditions,dielectric constant, agitation, and foam (Fig. 29).
Installation Guidelines
The microwave pulse should, if possible, arrive unhindered at the product surface. The followingguidelines should be considered:
� The transmitter axis must lie perpendicular to the product surface.� The front edge of the antenna horn must project into the tank.� Avoid a central position on the tank, keeping away from fittings such as pipes when possible.� Avoid measuring through the filling stream or into the vortex.� For synthetic tanks like fiberglass, PVC, polypropylene, or unleaded glass, the transmitter can be
mounted outside the tank, providing a totally nonintrusive measurement.
Where operating conditions require avoiding high temperatures or preventing buildup on the antenna,it is recommended that the antenna be installed with a safety gap above the maximum product level.Also, if the tank temperature is high, a high-temperature version with heat barrier can be used.
An advantage of radar is its broad applicability on most liquids and measurement independent ofpressure, temperature, vapor, and (to a degree) product dielectric constant. A disadvantage is that themeasurement may be lost because of heavy agitation of the liquid or the formation of foam.
Level Detection and Measurement of Liquids and Solids by Useof Time-Domain Reflectometry
Microimpulse time-domain reflectometry, or MiTDR, is a technology only recently available forindustrial measurement and control. The principle of this technology is to launch an extremely shortmicrowave impulse on a waveguide, which can be a cable or rod. This waveguide, or probe, contains

P1: xxx
1 September 1999 18:38 chap04combined.tex Chap04combined.sgm MH009v3(1999/07/12)
PROCESS VARIABLES—FIELD INSTRUMENTATION 4.183
FIGURE 30 Time-domain reflectometry measuring principle.
the signal in a close area around the cable or rod. Since no real signal emission takes place, the signalis not affected by any adverse process conditions. The measurement effect is the time differencebetween launching the microimpulse and receiving a reflection from the level surface.
The above-mentioned reflection happens when the signal around the waveguide or probe hits anarea with a dielectric constant different from the area where it came from (example: from air witha dielectric constant of 1 to the material to be measured with a dielectric constant of 1.8 or higher).The reflected pulse travels back up the probe to the pulse sampler where it is detected and timed. Anyunreflected portion travels on to the end of the probe to provide an empty signal.
Each point along the probe is sampled for its pulse reflection behavior. The information accumu-lated over the sampling cycle is captured and passed onto signal processing. The signal produced bythe change in dielectric constant at the air/product interface is identified (Fig. 30).
Typical applications of MiTDR level measurement in liquids are storage, buffer, or low-agitationprocess measurements. The system is not suitable for highly agitated liquids. Typical applications insolids are measurements in narrow or tall bins with very dusty and/or light materials. It can be used tomeasure a wide variety of bulk solids including minerals, plastics, agricultural products, foodstuffs,pharmaceuticals, and solid fuels.
The advantages of MiTDR level measurements are disregard of the presence of vapors, steam,dust, gas layers, buildup, temperature changes, pressure changes, acoustic noise, changing density ofthe material to be measured, changing dielectric constant of the material to be measured, and changingconductivity of the material to be measured.
Some disadvantages of this measuring system are that it does come in contact with the processand is an intrusive form of measurement.
Level Measurement of Liquids by Use of Magnetostrictive
A magnetostrictive system consists of a magnetostrictive wire in a probe and a donut-shaped floatcontaining a permanent magnet. The float is the only moving part and travels up and down the probe.When a current pulse is induced from the end of the magnetostrictive wire, a donut-shaped magneticfield emanates down the wire. As this magnetic field interacts with the magnetic field of the permanent

P1: xxx
1 September 1999 18:38 chap04combined.tex Chap04combined.sgm MH009v3(1999/07/12)
4.184 PROCESS/INDUSTRIAL INSTRUMENTS AND CONTROLS HANDBOOK
4
8
5
6
3
2
7
1
FIGURE 31 Magnetostrictive level measurement.
magnet in the float, a return pulse is sent down the wire. The electronics measures the time betweenthe initial current pulse and the return pulse and calculates the location of the float and thus the level(Fig. 31).
Probes are typically available as rigid rods for tanks up to 25 ft and flexible cable for tanks upto 75 ft high. Magnetostrictive measurement systems claim accuracies of 0.02 in and repeatabilityof 0.0001. A variety of float materials and sizes are used for different applications. Advantages arehigh accuracy and independence from material characteristics such as conductivity and dielectricconstants. Disadvantages are limitations to relatively clean liquids and anything that would cause thefloat to hang up on the probe.
Level Measurement of Liquids by Use of Laser
A laser can be directed at a shallow angle to the surface of a highly reflective liquid. A series ofphotocells are placed in the path of the reflected beam. As the level moves up and down, the reflectedbeam moves in step with it. A common application for laser level measurement system is on theforehearth of a molten glass furnace. The advantages are no contact with the process and very precisemeasurement of small level movements. A certain degree of dust and smoke can be tolerated. Thedisadvantages are limited applicability and sometimes a costly installation.
Level Detection and Measurement of Liquids and Solidsby Use of Radiometric
Level measurement systems that use gamma or neutron radiation sources provide a means to obtainlevel information without any intrusion in the vessel. Gamma radiation is a form of electromagneticradiation emitted from certain elements as a result of transitions in the nucleus of the atom.
Point Level Measurement. A beam of gamma rays is emitted at an exit angle of approximately10◦s from a source holder containing a radiation source. A gamma radiation detector is positionedon the vessel opposite the source with electrical connections to a level switch. The strength of theradiation source is calculated so that when the tank is empty, the detector transmits just enough pulses

P1: xxx
1 September 1999 18:38 chap04combined.tex Chap04combined.sgm MH009v3(1999/07/12)
PROCESS VARIABLES—FIELD INSTRUMENTATION 4.185
to the switching amplifier to energize the relay. As the level rises, the radiation will be attenuated,the detector will no longer transmit enough pulses, and the relay will deenergize. Thus the systemprovides level detection without coming into contact with the product and is external to the tank orreactor.
Gamma radiation level measurement systems are used in situations in which probes or othertransducers cannot be placed inside a tank or reactor. Some examples are use with very corrosive orextremely adhesive products, in reactors or furnaces at very high pressures and/or temperatures, andwith very coarse and abrasive bulk materials such as ores, limestone, coal, and basalt.
The four principal components of any level detection or measurement system that uses gammaradiation are:
1. radioactive source
2. source holder
3. detector
4. amplifier
The radioactive source, for industrial purposes, is usually cobalt 60 or cesium 137. These areartificial isotopes that emit pure gamma radiation, no alpha or beta particles or neutrons. The cobalt60 source is used in the form of metal discs, while cesium 137 is in the form of small beads. In bothcases, the radioactive material is fully enclosed in two sealed stainless-steel capsules to contain theradioactivity, preventing leakage in the event of mishandling the source. Neutron sources are used invery large or thick-walled vessels.
The source is placed in a source holder to ensure that the radiation is emitted only in the requireddirection. Like a light source, a radioactive source emits radiation in all directions, although forlevel detection only a fine beam of radiation is directed toward the detector. The holder consists ofa hermetically welded steel spherical capsule, which is filled almost completely with lead. The highrelative density of lead and the ease with which it can be processed make lead the best shieldingmaterial. The steel casing provides adequate protection not only against mechanical damage, but alsoin the event of fire. Lead fuses at a temperature as low as 325◦C, but maintains its shielding properties,even when molten. The eccentric rotating mechanism enables the source to be turned on and off.This means that cleaning or maintenance operations can be carried out in the tank without the needto remove the radioactive source. The plug-in source housing can be locked in either the on or theoff position. The complete locking mechanism is protected against dust and dirt ingress by cap andO-ring seal. As it is linked to the source carrier, the position of the cap indicates whether the sourceis on or off.
The detector used in gamma radiation point level measurement is usually a Geiger–Muller tube,more commonly called the Geiger counter. This consists of a glass tube with an anode and cathode.The tube is filled with an inert gas quenched with a small quantity of halogen and protected bya sealed metal casing. The counter is connected by means of a high-value resistor to a voltage of+400 V.
With no radioactivity present, the tube is a perfect insulator and no current flows in the circuit.When the tube is exposed to radioactive energy, the inert gas is ionized and, because of the highpotential, there is a primary discharge of electrons. The speed of these primary electrons releases asecondary discharge known as an electron avalanche.
The current pulse is produced, and the number of pulses emitted is directly proportional to thestrength of the radiation at the tube. As these low-current pulses cannot be transmitted over longdistances, the detector casing also houses a preamplifier. The preamplifier circuit board also containsa high-voltage oscillator to supply the required anode voltage to the tube. The pulses produced aresuperimposed onto the supply current flowing in the two-core supply line to the amplifier. Thereare various models of detectors available, the differences being in the sensitivity and their use inflammable atmospheres.
Continuous Level Measurement. Continuous level measurement that uses gamma radiation alsouses the four main components mentioned in the preceding section. The main differences among thesecomponents will be noted here.

P1: xxx
1 September 1999 18:38 chap04combined.tex Chap04combined.sgm MH009v3(1999/07/12)
4.186 PROCESS/INDUSTRIAL INSTRUMENTS AND CONTROLS HANDBOOK
The standard source holder, as discussed above, is used, except that the exit angle used is wider, 20◦
or 40◦. The radiation beam leaving the aperture is symmetrical, and thus the standard source holdermust be mounted at an angle equivalent to half the exit angle. To prevent any premature attenuation,the source holder must be mounted directly opposite the highest measuring point. In the case of a talltank with a small diameter, because of the limitation of the output angle, it may be necessary to usetwo identical sources and holders, the radiation from each covering a section of the detector.
The detector in analog measurement consists of a type of scintillation counter/photomultiplier orion chamber, housed in a steel protective casing. The effective detection length obviously dependson the level range to be measured and the possible methods of installation. Detectors are availablein lengths from 1 to 20 ft. If one detector is inadequate, then two detectors may be connected to oneamplifier to extend the range.
The use of a rod-type scintillation counter has the advantage of allowing the use of a point source.It combines the advantage of the high sensitivity of scintillation crystals (compared with Geigercounters) with the safety and economy of the point source. It is, as the name implies, a rod of opticallypure plastic within which scintillation crystals are uniformly distributed. In the presence of gammaradiation, the scintillation crystals emit flashes of light, which are then detected by a photomultiplierat the base of the rod and converted into electrical pulses.
The advantages of gamma are ease of installation outside of the vessel and independence fromtemperature, pressure, and material composition variations inside vessel. The disadvantages are highcosts and the cost and liability of radioactive source disposal.
Level Measurement of Liquids and Solids by Use of Weighing
C
BDAE
+ Output
+ InputShield
− Input− Output
F
FFIGURE 32
This indirect level measurement method is suitable for liquids and bulksolids. It consists of mounting the whole tank or silo on load cells orattaching strain transducers. The weight transducers are mostly based onthe strain-gage principle (Fig. 32).
The advantages are very accurate level measurement for products withconstant relative density and the fact that the system measures contentsrather than level. The disadvantages are that installation cost is usuallyhigher than other methods and the system requires large amounts ofmechanical equipment to eliminate false weighing forces and can bevery costly. If there is buildup on the vessel walls this can be falselyinterpreted as an increased level.
Level Measurement of Liquids by Use of Optics
B C A
PulseGenerator
AmplifierAC
Amplifier
Detector
DCAmplifier
OutputSignal
InfraredEmitting Diode
Photodetector
FIGURE 33 Typical optical switch.
Single-probe optical technology can be applied to detect the levelof clean liquids. A probe made of glass or clear plastic has a conicalend that is positioned to make contact with the process liquid. Thelight source is directed from the other end of the probe. Whenliquid comes in contact with the probe, the index of reflectionchanges and the resultant change in light intensity is detected by aphotocell. The advantages are low cost and low power operation.The disadvantage is that the system is limited to clean liquids thatdo not build up or coat the probe.
Another optical technology is the beam breaker. An infraredlight source is positioned on one side of a vessel or containerand a photocell on the other at the point detection of the leveldesired. When the material reaches this point, the light reachingthe photocell is attenuated and an indication is given. Anotherapproach is to mount the light source and detector next to eachother in a probe and insert them into the vessel (Fig. 33).

P1: xxx
1 September 1999 18:38 chap04combined.tex Chap04combined.sgm MH009v3(1999/07/12)
PROCESS VARIABLES—FIELD INSTRUMENTATION 4.187
The advantages are low cost and independence of conductivity and dielectric constant changes.The disadvantages are susceptibility to coatings and the requirement to put windows in the vesselwall in external installations (unless made of a transparent material).
Level Detection of Liquids by Use of Ultrasonic Tank Resonance
The tank resonance principle utilizes the fact that any object vibrating in its own resonance frequencywill stop vibrating as soon as there are no more acceleration forces applied. This is not a sudden stop;it takes a certain time for the vibration to decay. This time again depends on the specific properties ofthe vibrating object and on the dampening force applied to it.
In a practical application, an ultrasonic transducer is attached to the wall of a tank at the positionof the desired alarm point in a way that ensures a good acoustical coupling to that tank wall. Atwo-point calibration is performed then, with the tank being empty at the sensor position for thefirst calibration point, and the tank being filled above the sensor position for the second point. Thetransmitter electronics stores an acoustical profile of the tank wall (only looking at the area close tothe sensor).
To generate this profile, the system first checks the resonance frequency of the tank wall, both forthe free (empty) and the covered (full) situation. It then applies a short ultrasonic pulse with exactlythis resonance frequency to the tank wall and measures the time it takes for the tank wall to stopvibrating after the sending of the pulse has been finished. This time will be longer for a free (notdampened) tank wall than for a covered (dampened) one. The time difference is the means for thesystem to determine the presence or absence of a liquid at the sensor position (Fig. 34).
Since the resonance frequency of a tank wall depends on the construction material as well as onthe wall thickness, instruments for universal use are typically offered with different transducer typesin order to accommodate all frequencies up into the megahertz range.
Installation of the transducers can be done by either bolting them to the tank (spot-welded bolts,rails), using tensioning bands around the tank, or using glue to hold the sensor in place. While the firstoption would be applicable to only metal tanks, the other two mounting methods can also be used onplastic and glass tanks (Fig. 35).
Certain application considerations are to be made:
� the process temperature (refer to instrument specifications)� the viscosity of the liquid (if the viscosity is too high, the liquid will not properly run off the tank
wall, thus leading to a false full indication)� the overall buildup potential of the medium (crystalline buildup or any other hard residues are not
allowed)
FIGURE 34 Ultrasonic resonance principle.

P1: xxx
1 September 1999 18:38 chap04combined.tex Chap04combined.sgm MH009v3(1999/07/12)
4.188 PROCESS/INDUSTRIAL INSTRUMENTS AND CONTROLS HANDBOOK
FIGURE 35 Endress & Hauser Nivopuls can be strapped, bolted, or glued to the outside of the tank fornonintrusive level measurement.
� gas bubbles forming at the inside of the tank (decoupling the tank wall from the liquid)� process pressure or changing product parameters have no influence on the measurement
The main advantages of the tank resonance principle are that it is nonintrusive (therefore, thereare no issues with chemical compatibility), it has fast and easy installation and setup, and it hasan excellent retrofit option for additional alarm points in existing applications for which no tankopenings are available (certified pressurized tanks, glass-lined tanks, plastic or glass tanks, etc.). Thedisadvantages are that it has a relatively high instrument cost compared with that of a simple intrusiveswitch (but the cost savings for the installation have to be taken into account!), it is sensitive to buildupat the tank wall, and it may not work in highly aerated liquids (if gas bubbles collect at the tank wall).
INDUSTRIAL WEIGHINGAND DENSITY SYSTEMS
INDUSTRIAL SCALES
For centuries the underlying principle of the steelyard, that is, determining weight through the useof levers and counterweights, persisted. Modern industrial and commercial scales as recently as the