ACO Technical Assistance: Finances and … 2, 2017 ACO Technical Assistance: Finances and...
98
June 2, 2017 ACO Technical Assistance: Finances and Infrastructure for Value Based Payment Readiness
Transcript of ACO Technical Assistance: Finances and … 2, 2017 ACO Technical Assistance: Finances and...

June 2, 2017
ACO Technical Assistance: Finances and Infrastructure for Value Based Payment
Readiness

Agenda
Time Topic Facilitator
9:30 –10:00
Welcome and Introductions
Review of the VBP TA Series and Goals for Today
Ellen Hafer, Mass League
10:00 –11:00
Overview of VBP, Drivers of Revenue and Financial Dilemma
Peter Epp
11:00 –12:30
Defining the Tasks; Defining the Responsibilities Lisa Whittemore
12:30 –1:30
LUNCH
1:30 – 3:00 Detailed Walkthrough of the Financial Model Peter Epp
3:00 – 3:30 Wrap Up and Implications for Next Steps Peter Epp; Lisa Whittemore
2

Agenda
3
Goals for Today
Overview of VBP, Drivers of Revenue and Financial Dilemma
Defining the Tasks; Defining the Responsibilities
Detailed Walkthrough of the Financial Model
Wrap Up and Implications for Next Steps

Four-Part Series on Value Based Payment Readiness: Overview
4
Overview of Readiness Roadmap:
How to Succeed in New
Environment
• Setting the tone for change
• Review of roadmap
• Building the pyramid: risk
stratification
Elements for Success – Finances and
Infrastructure:
• Negotiation strategies
• Funds flow, infrastructure
investments and levels of risk
• Quality and incentive model
Elements for Success –
Population Management:
• Empanelment/engagement
• Enrollment
• Best practices to achieve quality,
outcomes improvements
• Health risk assessments and
follow-up
Elements for Success: ACO Risk
Stratification and Coding for
Improvement
• Coding in new MassHealth
environment
• Approaches to risk stratification for
financial and quality improvements
• Role of social determinants

Goals for Today
5
• Develop knowledge and capacity at CHCs for financial management in the Value Based Payment context
• Bring together financial, administrative and clinical leaders to think about shared accountability
• Build knowledge of choices related to service delivery, member supports and associated costs
• Build skills and awareness for negotiations with ACOs and MCOs

Agenda
6
Goals for Today
Overview of VBP, Drivers of Revenue and Financial Dilemma
Defining the Tasks; Defining the Responsibilities
Detailed Walkthrough of the Financial Model
Wrap Up and Implications for Next Steps

Introduction
7
To prepare for payment reform, health centers must:
• Improve cost efficiencies today and revenue cycle management
– Create positive operating margins
– Generate reserves
• Create business processes and reporting necessary for success in the future
Health centers require a financial modeling process that:
‒ Manages current financial performance of baseline operations AND
‒ Layers on top the financial impact of Value Based Payment (VBP)
Fee-for-service Value Based Payment

Improving the Current Baseline Financial Performance
8
Due to the peaks-and-valleys in the timing of VBP payments and their uncertainties, health centers current baseline operations need to exhibit positive operating performance
The current budget model, and its underlying drivers, need to be managed to enhance revenue and create cost efficiencies
Operating Revenue:
‒ Measure uncompensated care versus grant subsidies
‒ Enhance net patient services revenue per visit:• Payor mix of visits
• Bad debt % (collection rates)
• Coding
• Provider productivity

Improving the Current Baseline Financial Performance
9
Operating Expenses:
The following variables impact the all-inclusive cost per visit and must be managed to improve financial performance:
• Salary levels, benefit packages and staffing mix
• Support staff ratios (direct care versus patient support)
• Amount of enabling and ancillary services
• Administrative/overhead infrastructure
• Provider productivity/clinician capacity
Capital Link’s Performance Evaluations Profiles provide noteworthy benchmarks for identifying cost efficiency opportunities!
$ 1,542,100
⁼ $ 154.21 per visit10,000 visits

Improving the Current Baseline Financial Performance
10
Below are selected financial metrics from Capital Link’s
Performance Evaluation Profile, displaying the
Massachusetts 50th percentiles (medians)
Capital Link’s Performance Evaluations Profiles provide noteworthy benchmarks for identifying cost efficiency opportunities!
2013 2014 2015
Days Cash on Hand 42 42 40
Current Ratio 2.5:1 2.3:1 2.3:1
Net Patient Revenue per Visit $ 140 $ 146 $ 152
Operating Revenue per Visit $ 213 $ 226 $ 264
Operating Expense per Visit $ 224 $ 225 $ 251
Operating Margin (0.4%) 0.4% 0.4%
Physician Productivity 2,824 2,596 2,398
Mid-level Productivity 2,226 2,155 1,922

VBP Arrangements – “The 3-Legged Stool”
11
VBP arrangements contain a hybrid of several different payment methodologies to incentivize and tie together desired behaviors
The key components of VBP arrangements include: Base Compensation Models
• Fee-for-service• Partial capitation
Care Coordination Fee PMPM Quality Incentive Payments Global Payments/Budgets
• Surplus-sharing/Risk-sharing• Global capitation
Care Coordination
Qu
alit
y In
ce
ntiv
e P
ay
me
nts

VBP Arrangements
12
Preparation for VBP requires an understanding of the key metrics that drives each payment methodology
− Quality and risk-adjusting embedded through-out
Payment Model Key Metric
Base Compensation Move from “per visit” to “per patient” (capitation)
Care Coordination New core competencies and cost
Quality Incentive Payments Measuring performance metrics
Global Budgets/Payment Monitoring the total health care spend (and quality)

VBP – Quality Metrics & Incentive Payments
13
“Value-inspired” metrics, of late, revolve around the following areas:
• Patient quality measures
• Process measures
• Population health metrics
• Patient satisfaction measures
• Access
• Efficiency
Measurement and payment thresholds include -
• Event based
• Population based
– Maintenance
– Improvement

VBP – Quality Metrics & Incentive Payments
14
Understand metrics being measured• Discussion of metrics selected
• Calculation of the metric (including data elements)
• Identify benchmarks
• Evaluate current performance and anticipated future performance
Project revenue based on anticipated performance and benchmarks
• Fixed payment per measure for improvement
• Fixed payment per measure for maintenance
• Incremental bonus based on movement of metric
• Composite scoring across multiple metrics
• Amount of surplus-sharing/risk-sharing payments earned

VBP – Quality Metrics & Incentive Payments
15
Types and how payment determined
Type of Payment Formula to Earn Payment Examples
Fixed amount paid for improvement of metric
Improvement of metric from one quartile to another
Various HEDIS measures
Fixed amount paid for maintenance of metric
Maintain metric that currently exceeds the specific
percentile
Various HEDIS measures
Incremental bonus based on size of movement in metric
Amount of payment increases incrementally based on size of
% change
Reduction in urgent/non-emergent ER use
Composite scoring across multiple metrics
Negotiated set of metrics assigned points; % earned based on number of points scored versus total points
available
Numerous HEDIS measures defined that, as a group, determine
payment

VBP – Quality Metrics & Incentive Payments
16
Sample Efficiency Metrics (TennCare’s PCMH Demo):

VBP – Quality Metrics & Incentive Payments
17
Sample Quality Metrics (TennCare’s PCMH Demo):

VBP – Quality Metrics & Incentive Payments
18
Example of composite scoring formula
• Analysis of metric
• Comparison to benchmark (1 point for meeting benchmark)
MeasureCurrent Actual
Year One Year Two
Improve % Metric Improve % Metric
Comprehensive Diabetes Care (#1)
40.00% 25% 50.00% 15% 57.50%
Measure Benchmark (Threshold)
Projected Score
Year One Year Two
Comprehensive Diabetes Care (#1)
≥ 50% 1 1

VBP – Quality Metrics & Incentive Payments
19
Example of composite scoring formula (continued)
• Composite scoring and amount of payment
• Some payors may set a minimum score before QIP payments will be made
• Quality scores may also impact potential surplus-sharing distributions
Year One Year Two
Total Actual Points – all measures 3 5
Total Available Points (10 metrics) 10 10
% of Total Attained 30% 50%
Maximum QIP Pool Available $ 500,000 $ 500,000
Total Projected QIP Payment $ 125,000 $ 250,000

VBP - Global Budgets/Payments
20
Example Calculation of Surplus-Sharing/Risk-Sharing Amounts:
Actual Expense vs. Benchmark Scenario A Scenario B
Actual Expenses:
Fee for Service $42,500,000 $47,500,000
Capitation (Health Center) $5,000,000 $4,000,000
Total Actual Expense $47,500,000 $51,500,000
Target Spend/Benchmark $50,000,000 $50,000,000
Surplus/(Loss) $2,500,000 ($1,500,000)
Shared-Surplus Arrangement (50%) $1,250,000 N/A
Risk-Sharing Arrangement (60% upside; 30% downside)
$1,500,000 ($450,000)

VBP – Surplus/Risk-Sharing
21
Example revenue projection
$ PMPM
# of Member
Months Total Amount
Targeted Spend/Benchmark $500.00 100,000 $50,000,000
Actual Spend (Projected) $475.00 100,000 $47,500,000
Projected Surplus (Deficit) $25.00 $2,500,000
Surplus-Sharing % 50%
Amount Available for Distribution $1,250,000
Quality Score 75%
Adjusted Distribution for Quality Score $937,500

Surplus/Risk-Sharing – Key Considerations
22
Key items which impact success: Panel formation
Enrollment
Attribution
Development of overall budget Utilization assumption based (bottom up) – “Paid Claims”
Historic baseline or revenue based (top down) – “Medical Loss Ratio”
Protections against outliers Stop Loss
Carve-Outs
Risk Corridors
Reserves
Quality modifiers/adjusters

New York – Total Cost of Care Benchmarking Guideline
23

Budget/Benchmark Setting
24
Setting a Budget Target (using historical claims data):
Service Description
Expected
Utilization Unit Cost
Cost Per Patient
Per Year
Inpatient Care 1 $3,000 per discharge $ 3,000
Emergency Room 5 $300 per visit 1,500
Specialty Care 2 $250 per visit 500
Primary Care 2 $100 per visit 200
Behavioral Health Care 1 $100 per visit 100
Laboratory 8 $25 per lab test 200
Radiology 2 $100 per xray 200
Pharmacy 12 $25 per script 300
TOTAL – Per Member per Year $6,000 PMPY
TOTAL – Per Member per Month ($6,000 / 12 months) $500 PMPM
What factors can be impacted to reduce the Total Cost of Care?
Differs based on Health Condition of
Patient

Case Study: MCO Surplus Sharing
Baseline (Target) Calculation (1/1/2013 – 12/31/2013)
Type of Service Admits/Visits
A/V per 1000
Amount Paid Cost perA/V PMPM
Inpatient 360 169 $2,817,435 $7,826 $110.19
O/P Facility – ED 2,381 1,117 $494,354 $208 $19.33
O/P Facility – Surgery 79 37 $145,548 $1,842 $5.69
O/P Facility – Other 5,599 2,628 $1,104,074 $197 $43.18
O/P Facility Subtotal 8,059 3,782 $1,743,976 $216 $68.20
Professional – Primary Care 4,423 2,076 $55,774 $13 $2.18
Professional – Specialty Care 15,346 7,202 $1,606,835 $105 $62.84
Dental 1,856 871 $0 $0 $0.00
Vision 343 161 $0 $0 $0.00
Prescription 31,233 14,658 $2,264,304 $72.50 $88.50
Other Services (e.g., Home Health) 701 329 $0 $0 $0.00
Grand Total 62,321 29,247 $8,488,323 $331.96

Case Study: MCO Surplus Sharing
Surplus Calculation (1/1/2014 – 12/31/2014)
Change from Baseline experience
Type of Service Admits/Visits
A/V per 1000
Amount Paid Cost perA/V PMPM
Inpatient 248 121 $2,057,460 $8,296 $83.64
O/P Facility – ED 1,934 943 $429,540 $222 $17.46
O/P Facility – Surgery 50 24 $83,045 $1,661 $3.38
O/P Facility – Other 6,904 3,368 $955,824 $138 $38.85
O/P Facility Subtotal 8,888 4,336 $1,468,209 $165 $59.69
Professional – Primary Care 3,246 1,583 $39,256 $12 $1.60
Professional – Specialty Care 14,962 7,299 $1,307,260 $87 $53.14
Dental 1,962 962 $0 $0 $0.00
Vision 528 258 $0 $0 $0.00
Prescription 30,928 15,087 $1,932,026 $62 $78.54
Other Services (e.g., Home Health) 0 0 $0 $0 $0.00
Grand Total $6,804,411 $276.60

Using Third-Party Claims Data
27
• Analyze the high cost and high utilizing members
• Combine Claims data files– Determine the Total Cost of Care by patient and PMPM– Determine Total Cost of Care for patients with like conditions (e.g., all
diabetic patients regardless of comorbidities)
• Stratify the high cost/high utilizing members and develop plans to better manage care and reduce the Total Spend– Clinical interventions to manage utilization– Outreach efforts/patient engagement– Specialty referral practices and high cost specialists
• Link to EHR/PMS, ED Use and High Risk Member Reports
• Analyze “systemic” anomalies– Physician practice patterns – cost and outcomes– Specialty referral practices and high cost/low quality specialists– Care locations

VBP – New Core Competencies
28
Improved coding and clinical documentation• Traditional coding (claims)
• Enhanced coding and documentation (EHR)
• Social determinants of health
Managing patient centered care (per patient)
Data analytics (including business intelligence)
Care management/delivery• HIT/HIE
Partnerships and collaboration
MCO contracting
Financial management systems

Care Coordination Fees
29
One of the foundational elements of most, if not all, VBP arrangements is the need for effective care coordination and management
Third party payors are sometimes including care coordination fees in their VBP arrangements, however health centers need to sell the value of the care coordination proposal
− Stand-alone fee PMPM− Advance against future shared-savings distributions
Development of a proposed care coordination fee:− What services are required?− What services should be provided at the health center sites versus reside
at the ACO/IPA level?− How to “cost-out” care coordination services?

Care Coordination Services
30
What care coordination/management services are required to be successful under VBP?
* May be provided by the ACO/IPA
Service Type Health Center ACO/IPA
Care Managers √
Care Management Central Support and Technology
√
Data Analytics Technology and Support
√* √
Health Informatics √* √
Quality Improvement √ √
Others ??? ???

Care Coordination Costs – Health Center
31
Example calculation of cost of care coordination services − Total cost and PMPM
Service Type Costing MethodologyCost
Estimate
Care Managers (blended staffing) 4.00 FTE X $60,000 $ 240,000
Quality Improvement 1.00 FTE X $75,000 75,000
Health Informatics 1.00 FTE X $75,000 75,000
Support Staff 1.00 FTE X $30,000 30,000
Care Management/Data Analytics Technology Solutions
Covered by ACO/IPA (charged to the center?)
???
Others TBD ???
TOTAL ANNUAL COSTS $ 420,000
Number of Member Months 10,000 members X 12 mos. 120,000
COST PMPM $ 3.50

Care Coordination Costs – ACO
32
Example calculation of cost of care coordination services − Total cost and PMPM
Service Type Costing MethodologyCost
Estimate
Care Management Central Support 2.00 FTE X $60,000 $ 120,000
Support Staff 1.00 FTE X $30,000 30,000
Others TBD ???
Overhead 15% of direct costs 22,500
Care Managers Paid directly to centers ???
Care Management Technology Solution $3.00 PMPM 3,600,000
TOTAL ANNUAL COSTS $ 3,772,500
Number of Member Months 100,000 members X 12 mos. 1,200,000
COST PMPM $ 3.14

Why Form an ACO/IPA?
33
• Share infrastructure and realize cost efficiencies
• Quality improvements through sharing of best practices
• Pool resources to attract talent
• Expansion of geographic reach/market share
• Pool members to spread insurance risk in VBP arrangements and improve bargaining position with third party payors
• Expansion of service offerings and improve care coordination
• Improved access to capital resources (e.g. DSRIP)

Funds Flow Within the ACO/IPA
34
Hospitals
DSRIP Incentive
Payments
ACOs
Physicians FQHCs LTC Providers
MassHealth / MCOs

Funds Flow Within the ACO/IPA
35
ACO/IPAs cash flow projections• What services will the ACO/IPA provide on behalf of its members?• Reserves?
– Working capital– VBP reserve requirements
• What revenue sources are available to the ACO/IPA to defray the cash needs?
• Distribution methodology of quality incentive/VBP surplus payments to members
Payments to ACO/IPA members• Pass-through of care coordination/quality incentive payments• Surplus-sharing/Risk-sharing allocations
– Attributed lives– Quality scores
– Participation and engagement
– Other

Overview – ACO Distribution Methodologies
36
Distribution methodologies developed often change over time as experience with VBP matures
In developing a distribution methodology, the following hierarchy is often utilized
1st Investment in reserves
2nd Repayment of capital
3rd Performance incentive payments
Investment in Reserves – setting aside cash for future investments, maintenance of minimum cash balances and/or establishment of reserves for VBP arrangements
Repayment of Capital – based on Board decision-making, additional paid-in capital may be repaid
− In its entirety before performance incentive payments begin OR
− In pre-defined amounts over a specific period of time

Performance Incentive Payments –Distribution Methodologies
37
Example of Separate Pools each with its own, distinct distribution methodology
− Allocation %’s between pools may change over time (e.g. weighted heavier to participation in earlier years as VBP capacity is built, transitioning to performance as VBP experience increases)
− Distribution of participation pool (e.g. 20%)
− Distribution of performance pool (e.g. 80%)
− Additional Decision Point – How to address undistributed funds
Total Pool X% Allocated to
Participation PoolX
AttributedMembers as %
of TotalX
Participation Score
=Participation
Payment
Total Pool X% Allocated to
Performance PoolX
AttributedMembers as %
of TotalX
Quality Score
=Performance
Payment

Performance Incentive Payments –Distribution Methodologies
38
Example of Aggregate Pool with one, single distribution formula
− Additional Decision Point – How to address undistributed funds
Total Pool XAttributed
Members as % of Total
X Quality Score X% Reduction in
Total Cost of Care
=Participation
Payment

DSRIP Funds Flow
39
DSRIP Funding Levels (Statewide)
• $1.8B over 5 years (eff. July 1, 2017)
• Payments to Commonwealth contingent upon hitting pre-defined metrics and milestones
• To be replaced with savings generated from VBP in 5 years

DSRIP Funds Flow
40
ACO Funding Stream:
Uses:
‒ Infrastructure and start-up
‒ On-going/operational costs
‒ Flexible services (not currently covered by MassHealth)
‒ Transitional funding for certain safety net hospitals currently funded through the Delivery System Transformation Initiatives program
Award Calculation:
‒ ACO start-up and on-going support
• Funded based on proportional size of attributed members at a $ PMPY
• Safety Net PMPY increase for ACOs with high % of safety net providers
• ACO Model PMPY increase for advanced ACO models
• MassHealth to designate a portion for investment in primary care
‒ Glide Path for Certain Safety Net Hospitals based on MassHealth guidance
‒ Flexible services – PMPY amount fixed across all 5 DSRIP years

DSRIP Funds Flow
41
ACO Funding Stream (cont’d): Decision Rights on Spending:
‒ ACO start-up and ongoing support• MassHealth to develop guidance on allocation of dollars for safety net “glide
path” funding and PC investment dollars• Balance allocated at the ACO’s discretion
‒ Flexible services funding is “use it or lose it” and allocated at the ACO’s discretion
Accountability to the State:‒ ACOs will have accountability for the total cost of care of their attributed
members in DY1‒ An increasing amount of DSRIP funds will be at risk over the 5 year DSRIP
period (0-20%) based on an accountability score including the following variables:
• Avoidable hospital utilization• Reduction in State spending• Attaining quality metrics
• Progress towards integration across physical health, behavioral health and LTSS

DSRIP Funds Flow
42
What to expect: During the governance development, committees will be formed -
‒ Executive
‒ Finance (budget and funds flow)
‒ Clinical
‒ Workforce
‒ Technology
Projects will be developed to accomplish the goals of DSRIP and population health management
Discussions will ensue with regards to what services to be performed at the ACO versus those to be delegated down to the ACO’s members
The Funds Flow of the DSRIP waiver dollars will follow the responsibilities and participation in projects
Generally DSRIP funds will be paid based on performance, so the timing of fund distributions may occur after-the-fact

The VBP Dilemma
43
The timing of potential new revenue streams under VBP are not aligned with the costs for successful participation in VBP
Payment Model
Timing of Cost
Timing of RevenueOne-time,
UpfrontOn-going,
Operational
Base Compensation√
Through-out the year as services are provided
Care Coordination√ √
Through-out the year as services are provided
Quality Incentive Payments
√ √6-9 months after the end of the measurement period
GlobalBudgets/Payment
√ √6-9 months after the end of the measurement period

VBP – Financial and Operational Considerations
44
What is this going to cost?
• Identify new services to be provided
• Evaluate whether to “go this alone” versus “join forces”
• Develop a 3-year financial model, including cash flow
• Quantify a range of capital requirements
• Identify outside funding sources to offset capital needs and reserves
What is the return on investment
• Understand financial requirements of participation in VBP arrangements
• Develop sound assumptions based on available data
• Utilize financial model to inform ACO/MCO negotiations

Agenda
45
Goals for Today
Overview of VBP, Drivers of Revenue and Financial Dilemma
Defining the Tasks; Defining the Responsibilities
Detailed Walkthrough of the Financial Model
Wrap Up and Implications for Next Steps

Re-visiting the Pyramid – Thinking about Population Needs
46
PATIENT POPULATION INTERVENTION
BH CPs…
High Risk
Moderate Risk
Low Risk
No or Limited Risk
Attributed Members/Not Yet Patients Engagement and Outreach
Risk Management
Risk Mitigation
Revenue Management
Expense Management
Care Management
Care Coordination
Complex Care Management
Wellness Initiatives
High Need, High Cost
Chronic Conditions
Well Populations
Elevated Need, Elevated Cost
High Risk
Moderate Risk
Low Risk
No or Limited Risk
Risk Management
Risk Mitigation
Revenue Management

Population Health Management: Different Perspectives – Payers and Providers
Providers and payers have different perspectives of the activities that are included in utilization management, case management, and chronic condition management.
The highly regulated nature of the health insurance industry presently requires that payers maintain oversight of functions that they shift to providers.
The current process for function oversight is tightly managed and highly controlled which poses challenges to making it scalable across a large network.
There is a significant change management challenge in sharing accountability between payers and providers. Clear communication of the driving factors behind the strategy to shift accountability will need top-down executive reinforcement as well as bottom-up operational buy-in
Not all providers within your ACO have the same capacity, expertise, or desire to perform these functions.

Three Truths
48
• There are a set of tasks that need to be done for the ACO to function and achieve triple-aim goals and for members to be supported
• These tasks need to be done either locally (in health centers) or centrally by the ACO or the MCO
• Decisions about who does the tasks have significant financial implications – Revenue impact
– Care efficiency and effectiveness
– Effective financial strategies

Ancillary services (e.g. lab)
Process Algorithms/
EBM Guidelines
Telemedicine
QA for network providers
Patient billingfor servicesrendered
Preventive Care
Capacity or access
management
Outpatientcare
ACO: financial/data management
Compliance management
Provider function Payer function
Plan billing (MCO
function)
Utilization management
Disease management
Quality measures /
analytics
Care management
Physician credentialing& privileging
Member enrollment
HIE / connectivity
Physician performance/
quality management
Wellness programs
Pre-auth for non-
formulary
Medical monitoring
Compliance enhancement
Provider process &
quality improvement
State and Federal
Advocacy
Medical management
Care enhancement
Network management
Admin. services
Member acquisition/
management
Quality/informatics
Member Engagement
Member services
Alternative payment
structures
Provider management
servicesCare delivery Pharmacy
Claims processing/
payment
Risk-pooling
Care coordination
Scheduling services
Inpatient care
Data warehousing
Formulary management
Provider contracting /
network participation
VBP Payer/Provider Service Continuum: Assess ACO Participants Current State
49

Payer Administrative Services
50
Plan billing (MCO
function
Admin.
services
Member services
Claims processing/
payment
Risk-pooling
• Basic administrative functions of a health plan: paying claims, actuarial risk calculations, benefit administration
• Member service: Basic health plan customer service
** For Model A ACOs, these functions done by
MCO; for Model B ACOs, these functions done by Mass Health.

Network Management
51
QA for network providers
Physician credentialing& privileging
Network management
Alternative payment
structures
Provider contracting /
network participation
• Network of primary care providers, specialty providers, hospitals, rehab facilities, ancillary services, behavioral health providers
• Traditionally health plans have not had a lot of non-medical services that may be important to care for your members
• Maintaining the quality of the network is important to members’ care and has long been a task done by health plans
• Monitoring performance on risk based contracts

Enrolling and Retaining Members
52
Member enrollment
State and Federal Advocacy
Member acquisition/
management
Member engagement
• Member enrollmento In the MCO or MassHealth AND
o With the ACO
• Marketing strategies and resources
• Growth strategy
• Work with State and Federal entities to ensure adequate program funding

Pharmacy Benefit Management
53
Pre-auth for non-formulary
Medical monitoring
Compliance enhancement
Pharmacy
Formulary management
• Pharmacy network• Developing and implementing
formulary including knowledge about costs
• Prior authorization process for primary care AND specialty providers
• Compliance

Care Delivery
54
Ancillary services (e.g. lab)
Telemedicine
Preventive Care
Outpatientcare
Care delivery
Inpatient care
Core services for taking care of members:
• Inpatient care, specialty care, primary care, BH care
• Labs and ancillary services
• Preventive Care, diagnoses
Is mostly outside any PMPM – Billing still done Fee for Service

Provider Management Services
55
Capacity or access management
Compliance management
Provider management
services
Patient billingfor services
rendered
ACO: financial/data management
Scheduling services
• Scheduling with providers
• Access management
• Billing
• Compliance
• ACO monitoring of performance

Care Enhancement
56
Care enhancement
Process algorithms/EBM
guidelines
Provider process & quality
improvement
Care coordination
Improving how care is delivered to members:• Care Coordination• Transitions of Care• Applying Evidence-Based Medicine
Interventions• Quality Improvement Efforts including
transparent data sharing efforts

Quality and Informatics
57
Quality measures /
analytics
HIE / connectivity
Physician performance/
quality management
Quality/informatics
Data warehousing
• Data!
o What data are you going to receive?
• HIE and connectivity between systems
• Quality measures and analytics
• Quality directory and sharing results
• Predictive Analytics for Risk Stratification

Medical Management
58
Utilization management
Disease management
Care management
Wellness programs
Medical management • Managing patients care
outside of the traditional visit
• Developing and maintaining staffing patterns to support this care
• Ensuring your assigned members are receiving the right care at the right time

Ancillary services (e.g. lab)
Process Algorithms/
EBMguidelines
Telemedicine
QA for network providers
Patient billingfor servicesrendered
Preventive Care
Capacity or access
management
Outpatientcare
ACO: financial/data management
Compliance management
Provider function Payer function
Plan billing (MCO
function)
Utilization management
Disease management
Quality measures /
analytics
Care management
Physician credentialing& privileging
Member enrollment
HIE / connectivity
Physician performance/
quality management
Wellness programs
Pre-auth for non-
formulary
Medical monitoring
Compliance enhancement
Provider process &
quality improvement
State and Federal
Advocacy
Medical management
Care enhancement
Network management
Admin. services
Member acquisition/
management
Quality/informatics
Member engagement
Member services
Alternative payment
structures
Provider management
servicesCare delivery Pharmacy
Claims processing/
payment
Risk-pooling
Care coordination
Scheduling services
Inpatient care
Data warehousing
Formulary management
Provider contracting /
network participation
VBP Payer/Provider Service Continuum: Thinking about roles differently
59

Exercise: Determining the Provider Role (local)/Provider Role (Central or ACO)/
Payer Role?
Task Provider Role (if any)
ACO Role (if any)
MCO Role (if any)
Care Coordination
EBM/ Clinical Protocols
Quality Improvement
Data Warehousing
HIE/ Connectivity
Quality Measures/ Analytics
ACO Financial Data Management
HEALTH MANAGEMENT ASSOCIATES 60

Exercise: Determining the Provider Role (local)/Provider Role (Central or ACO)/
Payer Role?
Task Provider Role (if any)
ACO Role (if any)
MCO Role (if any)
Member Enrollment
Member Engagement
Provider Performance
Wellness Programs
Telemedicine
Formulary Development and Management
Formulary Compliance Enhancement
HEALTH MANAGEMENT ASSOCIATES 61

Exercise: Determining the Provider Role (local)/Provider Role (Central or ACO)/
Payer Role?
Task Provider Role (if any)
ACO Role (if any)
MCO Role (if any)
Utilization Management• Inpatient• Procedures
Care Management• Complex• Transitions of Care• Chronic Condition
Disease Management• Registry
Management• Active Engagement
HEALTH MANAGEMENT ASSOCIATES 62

Exercise Part 2
For each of the areas where you identified a provider role, which are your priorities?
What resources do you need to meet these goals?
How will you share accountability with the ACOs?
Where can you leverage resources through partnering with the ACO or the MCO?
HEALTH MANAGEMENT ASSOCIATES 63
PRIORITIES = Strategies you can deploy to ensure your patients receive the care
they need within the ACO + the resources required to deploy those models +factor in negotiating with ACO OR MCO to ensure those factors are met

Agenda
64
Goals for Today
Overview of VBP, Drivers of Revenue and Financial Dilemma
Defining the Tasks; Defining the Responsibilities
Detailed Walkthrough of the Financial Model
Wrap Up and Implications for Next Steps

Value Based Payment Financial Model
65
• Develop a financial model Prepare 3-year financial model, including cash flow
Decide on the services required to be provided for success under VBP
– In-house (personnel) versus outsourced (ACO vs. MSO)
– On-going versus one-time
Develop a cost projection based on services required
Project potential revenues under VBP arrangements
– Understand and develop “best estimates” for key assumptions
– Utilize financial model to inform VBP negotiations
Project opportunities under DSRIP
Estimate potential capital requirements
Other funding sources (e.g. Foundations; HRSA QI awards, reserves/existing operating surpluses)

WARNING! WARNING!
66
THE CONTENTS OF THE FOLLOWING FINANCIAL MODEL ARE BASED ON GROSS ASSUMPTIONS AND INTENDED TO
PROVIDE PARTICIPANTS WITH AN UNDERSTANDING OF THE KEY DRIVERS OF FINANCIAL PERFORMANCE UNDER
VBP AND COULD BE HARMFUL TO YOUR HEALTH!
THE FINANCIAL MODEL AND ITS RESULTS WILL CHANGE AS CHCs DECIDE ON THEIR INFRASTRUCTURE NEEDS AND
ACO/MCO ARRANGEMENTS NEGOTIATED.
ACTUAL RESULTS WILL VARY SIGNIFICANTLY!

Services to Be Provided Under VBP
67
Services
Decide on the services required to be provided for success under VBP
– Improved coding and clinical documentation
– Managing patient centered care (per patient)
– Data analytics (including business intelligence)
– Care management/delivery (HIT/HIE)
– Partnerships and collaboration
– MCO contracting
– Financial management systems
In-house (personnel) versus outsourced (ACO vs. MSO)
On-going versus one-time

Care Coordination/ Management Services –Staffing Model
68
Costs must be assigned to care coordination services identified Example - care managers Care manager capacity (productivity) Patient utilization
Number of care managers required = # of patients ÷ average panel size
• Panel sizes may be impacted based on risk-stratification of patients

Care Coordination Management Fees –Case Study
69
ABC MCO is looking to construct a VBP arrangement with CHC-ACO− ABC MCO has not historically paid providers for care
management/coordination services
CHC-ACO is looking to negotiate a care coordination PMPM with ABC MCO to include care management fees to be paid to member health centers as well as central support services
‒ Care management fees to be paid separately, directly, to health centers and CHC-ACO by ABC-MCO
‒ Health centers will directly employ the care managers
CHC-ACO has compiled data to assist with developing a cost estimate for the provision of these services
Task – Calculate the total annual cost and cost PMPM of care coordination services at both the ACO-level and individual health center level

Care Coordination Management Fees –Case Study (Assumptions)
70
CHC-ACO projects average ABC MCO covered lives = 50,000
CHC-ACO has identified 3 risk-categories of its patients and required level of case management services− Condition A – 40,000 members, 1 unit per member per year− Condition B – 5,000 members, 2 units per member per year− Condition C – 5,000 members, 5 units per member per year
Average capacity per care manager FTE = 5,000 units
Support staff ratios:− 1.00 FTE HC support staff for every 5.00 FTE care managers− 1.00 FTE ACO care management central support for every 10.00 FTE care
managers (no part-time; round-up)− 1.00 FTE ACO support staff for every 2.00 FTE care management central
support staff (no part-time; round-up)

Care Coordination Management Fees – Case Study (Assumptions, Continued)
71
Personnel costs:− Care managers (blended skill sets)= $50,000/FTE− Support staff = $20,000/FTE− Care management central support - $75,000
Care management technology outsourced through an MCO at the ACO-level for $5.00 PMPM
Overhead calculated at 10% excluding the cost of MCO services

Basic Assumptions in the Financial Model
72
Amounts are hypothetical and included to demonstrate the flow of the financial model and highlight the key drivers of performance
Patients
– The number of patients served is projected flat over the 3-year period (25,000 patients) and by month, pro-rated
» Used for staffing
– 50% (12,500 patients) are considered participating in the DSRIP/VBP program
» Used for payment
Payments from ACO
‒ $4 PMPM for care coordination/management services
‒ Participation in VBP arrangement
‒ DSRIP funding for participation in projects

Staffing Assumptions
73
Assess the need for oversight and technical support
Assess the need for care management/ coordination staff
‒ Staffing ratios differ by:
• Populations served
• Risk stratification of patients
• Staff type
VBP Oversight and Technical Support:Position FTE Salary
QI Coordinator 1.00 65,000
Data Analyst 1.00 45,000
Care Coordination/Care Management Function:
CM Ratios:Population Total Pop Low Risk Medium Risk High Risk
General Population 25,000 100% TBD TBD
Special Population -
Health Homes -
TOTAL 25,000 25,000 TBD TBD
FTE Calculation: Salary
Ratios 12,500 TBD TBD
RN CMs 2.00 2.00 0.00 0.00 85,000
Ratios 10,000 TBD TBD
CHWs 2.50 2.50 0.00 0.00 35,000
Ratios 12,500 TBD TBD
LCSWs 2.00 2.00 0.00 0.00 55,000
Projected Annual Salary Increases:
Year Two 3.00%
Year Three 3.00%
Please note that the above staffing ratios do not reflect actual data but are purely included as an example. These ratios need to be developed!

Salary Projections
74
Salaries for participation in VBP should include:
‒ Direct care services
‒ Oversight and technical support
Salaries should be projected to link to changes in patients utilizing appropriate staffing ratios
Additional staff may be required for DSRIP projectsYear One:
Description Jan Feb Mar Apr May Jun Jul Aug Sep Oct Nov Dec Totals
Salaries and wages:
QI Coordinator
FTE 1.00 1.00 1.00 1.00 1.00 1.00 1.00 1.00 1.00 1.00 1.00 1.00 1.00
Salary 5,417 5,417 5,417 5,417 5,417 5,417 5,417 5,417 5,417 5,417 5,417 5,417 65,000
RN Case Managers
FTE 2.00 2.00 2.00 2.00 2.00 2.00 2.00 2.00 2.00 2.00 2.00 2.00 2.00
Salary 14,167 14,167 14,167 14,167 14,167 14,167 14,167 14,167 14,167 14,167 14,167 14,167 170,000
Community Health Workers
FTE 2.50 2.50 2.50 2.50 2.50 2.50 2.50 2.50 2.50 2.50 2.50 2.50 2.50
Salary 7,292 7,292 7,292 7,292 7,292 7,292 7,292 7,292 7,292 7,292 7,292 7,292 87,500
LCSWs
FTE 2.00 2.00 2.00 2.00 2.00 2.00 2.00 2.00 2.00 2.00 2.00 2.00 2.00
Salary 9,167 9,167 9,167 9,167 9,167 9,167 9,167 9,167 9,167 9,167 9,167 9,167 110,000
Data Analyst
FTE 1.00 1.00 1.00 1.00 1.00 1.00 1.00 1.00 1.00 1.00 1.00 1.00 1.00
Salary 3,750 3,750 3,750 3,750 3,750 3,750 3,750 3,750 3,750 3,750 3,750 3,750 45,000
Total salaries and wages 39,792 39,792 39,792 39,792 39,792 39,792 39,792 39,792 39,792 39,792 39,792 39,792 477,500

Other Expense Projections
75
Fringe benefits should be projected at the health centers historical fringe rate (e.g. 20%)
Contracted Services
‒ ACO/MCO services – services to be provided by the ACO relative to performance under VBP are forecasted to be borne by the ACO
• If costs are to be passed along from the ACO to the health center, these must be budgeted as well
‒ DSRIP expenses – budget expenditures anticipated as a result of projects and other requirements for participation in DSRIP
‒ Outsourced Technology Solution – budgeted $.25 PMPM
• Other technology and data analytics projected to reside at the ACO
Program Administration/Overhead – budgeted at 15% of direct costs
Other

Revenue Projections -- VBP
76
Care management/coordination payments PMPM
‒ Model assumes a $4 PMPM
‒ This may come through the ACO out of DSRIP or MCO/MassHealth funding for these services
• Could also be paid directly from the MCO/MassHealth
• It is anticipated that if these funds are paid by DSRIP, that they would eventually be paid out of future shared savings generated under VBP
Surplus-sharing arrangements
‒ MCO/MassHealth projected to make surplus distributions to the ACO
‒ ACO to distribute surplus to its members based on an ACO distribution methodology
• In general, ACOs distribute funds based on attributed members and quality
• For purposes of the financial model, the amount of distribution to the FQHC will be based on –
‒ The projected % of the FQHC’s attributed members to total ACO members AND
‒ A projection of the FQHC’s quality scores

ACO – Surplus/ Risk Sharing
77
Revenue projection – complicated and various assumptions
Targeted Spend/Benchmark – Use of historic claims versus Medical Loss Ratio (MLR)
Projection of actual spend
Surplus-sharing and risk-sharing %s
Impact of quality scores on distribution amount
Timing of payments – interim versus annual

Key Assumptions – ACO Framework and Benchmarks
78
VBP Arrangement
‒ Surplus-sharing arrangement in Years One and Two (50%), transitioning to risk-sharing in Year Three (70% upside; 30% downside)
‒ Interim surplus calculation performed after 4 months of midpoint with final reconciliation paid 7 months after contract period ends
Benchmarks Benchmark set on a PMPM basis based on historical claims
experience (estimated for example purposes)
Future benchmarks projected based on projected savings, averaging the prior 2 years actual spend PMPM
Year
Projected Savings
%
Benchmark
PMPM
PMPM After
Savings
Next Year's
Benchmark
PMPM (@50%)
Yr. 1 2% $400.00 $392.00 $396.00
Yr. 2 3% $396.00 $380.24 $388.12
YR. 3 2% $388.12 $372.64 $380.38

ACO – Surplus/ Risk Sharing, Year 1
79
Number of
Description ACO Members PMPM Amount
83,333 50%
Targeted Benchmark $400.00 400,000,000
Projected Actual Spend $392.00 392,000,000
Projected ACO Surplus 8,000,000
Total ACO Surplus Available Surplus Only 50% 4,000,000
Projected Distribution (d) Quality Modifier 100% 4,000,000
Projected Payment Dates - 10/31/XXX1 40% 1,600,000
7/31/XXX2 60% 2,400,000
4,000,000
Notes:
(d) FQHC specific quality score will be used to adjust FQHC-specific distribution projection.
Year One

CHC – Surplus/ Risk Sharing Allocation (Year One)
80
Interim Final Total
Total ACO Projected Distribution 1,600,000 2,400,000 4,000,000
% of Members Attributed to FQHC (a) 15.00% 15.00% 15.00%
ACO Distribution Adjusted by Membership 240,000 360,000 600,000
FQHC-Specific Quality Score 50.00% 50.00% 50.00%
Projected FQHC Distribution 120,000 180,000 300,000
Payment Dates 10/31/XXX1 7/31/XXX2
Notes:
(a) % of Massachusetts FQHC members as a % of total ACO members:
FQHC-Specific Members 12,500
ACO Total Members 83,333
FQHC Members as % of Total Members 15.00%
Year One

FQHC Quality Score (Year One)
81
Measurement Period > Base Benchmark
Quality Measure Actual Improve % Score 50th %tile Year One
Measure A 45.00% 15.00% 51.75% 60.00% 0
Measure B 35.00% 15.00% 40.25% 50.00% 0
Measure C 45.00% 5.00% 47.25% 40.00% 1
Measure D 65.00% 15.00% 74.75% 85.00% 0
Measure E 40.00% 10.00% 44.00% 45.00% 0
Measure F 60.00% 10.00% 66.00% 55.00% 1
Measure G 30.00% 10.00% 33.00% 45.00% 0
Measure H 30.00% 10.00% 33.00% 30.00% 1
Measure I 45.00% 10.00% 49.50% 45.00% 1
Measure J 35.00% 5.00% 36.75% 30.00% 1
Total Points Earned 5
Maximum Points 10
Quality Score 50.00%
Quality Metrics - Actual and Projected
Year One Projected Score

Revenue Projections, Other
82
DSRIP
‒ Projected to cover DSRIP projected expenses
• This may not be the case as DSRIP funding is often earned based on performance and meeting metrics
‒ To be received 3 months after each 6-month reporting period
Other Revenue (not projected)
‒ Potential additional patient service revenue to be generated from new care team members (RN Care Managers, LCSWs)
• Depends on services provided
• Whether payors will reimburse for care management services (e.g. Medicare)
‒ HRSA Quality Improvement awards
• This same team and its objectives are aligned with HRSA’s quality measures and their efforts could result in additional grant funding

Monthly Financial Projection (Year One)
83
Year One:
Description Jan Feb Mar Apr May Jun Jul Aug Sep Oct Nov Dec Totals
MCO/MassHealth 12,500 12,500 12,500 12,500 12,500 12,500 12,500 12,500 12,500 12,500 12,500 12,500 150,000
TOTAL MEMBERS 12,500 12,500 12,500 12,500 12,500 12,500 12,500 12,500 12,500 12,500 12,500 12,500 150,000
Operating Revenue:
Care Management Fee (PMPM) 50,000 50,000 50,000 50,000 50,000 50,000 50,000 50,000 50,000 50,000 50,000 50,000 600,000
Surplus/Risk-sharing 120,000 120,000
Other - DSRIP 75,000 75,000
TOTAL OPERATING REVENUE 50,000 50,000 50,000 50,000 50,000 50,000 50,000 50,000 125,000 170,000 50,000 50,000 795,000
Operating Expenses
Salaries and wages 39,792 39,792 39,792 39,792 39,792 39,792 39,792 39,792 39,792 39,792 39,792 39,792 477,500
Fringe benefits @ 20% 7,958 7,958 7,958 7,958 7,958 7,958 7,958 7,958 7,958 7,958 7,958 7,958 95,500
Total Personnel Costs 47,750 47,750 47,750 47,750 47,750 47,750 47,750 47,750 47,750 47,750 47,750 47,750 573,000
Contracted services
ACO/MSO costs -
DSRIP Project Implementation 12,500 12,500 12,500 12,500 12,500 12,500 12,500 12,500 12,500 12,500 12,500 12,500 150,000
Oursourced Technology Solution 3,125 3,125 3,125 3,125 3,125 3,125 3,125 3,125 3,125 3,125 3,125 3,125 37,500
Total Contracted Services 15,625 15,625 15,625 15,625 15,625 15,625 15,625 15,625 15,625 15,625 15,625 15,625 187,500
Prog Admin/Overhead @ 15% 9,506 9,506 9,506 9,506 9,506 9,506 9,506 9,506 9,506 9,506 9,506 9,506 114,075
TOTAL OPERATING EXPENSES 72,881 72,881 72,881 72,881 72,881 72,881 72,881 72,881 72,881 72,881 72,881 72,881 874,575
SURPLUS (LOSS) (22,881) (22,881) (22,881) (22,881) (22,881) (22,881) (22,881) (22,881) 52,119 97,119 (22,881) (22,881) (79,575)
Cumulative Surplus (Loss) (22,881) (45,763) (68,644) (91,525) (114,406) (137,288) (160,169) (183,050) (130,931) (33,813) (56,694) (79,575)
The VBP/QI “department” should be viewed as its own profit center!

Annual Cash Flows – Years One through Three
84
Description Amount PMPM Amount PMPM Amount PMPM
MCO/MassHealth 150,000 150,000 150,000
TOTAL MEMBER MONTHS 150,000 150,000 150,000
Operating Revenue:
Care Management Fee (PMPM) 600,000 $4.00 600,000 $4.00 600,000 $4.00
Surplus/Risk-sharing 120,000 $0.80 463,680 $3.09 945,809 $6.31
Other - DSRIP 75,000 $0.50 125,000 $0.83 50,000 $0.33
TOTAL OPERATING REVENUE 795,000 $5.30 1,188,680 $7.92 1,595,809 $10.64
Operating Expenses
Total salaries and wages 477,500 $3.18 491,825 $3.28 506,580 $3.38
Fringe benefits @ 20% 95,500 $0.64 98,365 $0.66 101,316 $0.68
Contracted services
ACO/MSO Costs - $0.00 - $0.00 - $0.00
DSRIP Project Implementation 150,000 $1.00 100,000 $0.67 - $0.00
Outsourced Technology Solution 37,500 $0.25 37,500 $0.25 37,500 $0.25
Program Admin/Overhead @ 15% 114,075 $0.76 109,154 $0.73 96,809 $0.65
TOTAL OPERATING EXPENSES 874,575 $5.83 836,844 $5.58 742,205 $4.95
SURPLUS (LOSS) (79,575) ($0.53) 351,837 $2.35 853,604 $5.69
Year One Year Two Year Three

Monthly Cumulative Cash Position –Years One through Three
85
Year One Year Two Year Three
Jan (22,881) (99,312) 260,411
Feb (45,763) (119,049) 248,561
Mar (68,644) (63,786) 286,710
Apr (91,525) (83,523) 274,860
May (114,406) (103,260) 263,009
Jun (137,288) (122,997) 251,159
Jul (160,169) 37,266 664,829
Aug (183,050) 17,529 652,978
Sep (130,931) 47,792 641,128
Oct (33,813) 311,735 1,149,567
Nov (56,694) 291,998 1,137,716
Dec (79,575) 272,262 1,125,866
The VBP Dilemma – Need for upfront capital and maintain a reserve!

Monthly Cumulative Cash Position – Reduced Care Management Fee
86
Care Management Fee at $3 PMPM
Year One Year Two Year Three
Jan (35,381) (261,812) (52,089)
Feb (70,763) (294,049) (76,439)
Mar (106,144) (251,286) (50,790)
Apr (141,525) (283,523) (75,140)
May (176,906) (315,760) (99,491)
Jun (212,288) (347,997) (123,841)
Jul (247,669) (200,234) 277,329
Aug (283,050) (232,471) 252,978
Sep (243,431) (214,708) 228,628
Oct (158,813) 36,735 724,567
Nov (194,194) 4,498 700,216
Dec (229,575) (27,739) 675,866

Monthly Cumulative Cash Position – No Interim Settlement
87
Year One Year Two Year Three
Jan (22,881) (219,312) (23,269)
Feb (45,763) (239,049) (35,119)
Mar (68,644) (183,786) 3,030
Apr (91,525) (203,523) (8,820)
May (114,406) (223,260) (20,671)
Jun (137,288) (242,997) (32,521)
Jul (160,169) 37,266 664,829
Aug (183,050) 17,529 652,978
Sep (130,931) 47,792 641,128
Oct (153,813) 28,055 629,277
Nov (176,694) 8,318 617,427
Dec (199,575) (11,419) 605,576

Financial and Operational – Key Considerations
88
Key assumptions in financial model to “refine”
Services provided – by FQHC versus ACO
Populations served (risk stratification)
Staff required and staffing ratios
DSRIP projects – cost versus revenue
Care coordination/management revenue PMPM
ACO distributions from MCO VBP arrangements
– ACO distribution methodology
– MCO surplus-sharing model
Other revenue opportunities

Financial and Operational – Key Considerations
89
ACO payment models/distribution methodologies
DSRIP
• Negotiate for DSRIP waiver funds specifically impacted/earmarked for
health centers
• Bump in DSRIP award PMPM for safety net providers
• Funds earmarked by MassHealth for investment in primary care
• Actively engage in conversations concerning services provided at the ACO
versus locally at provider sites
• Care coordination/management services
• Stay active in the development of the budget and funds flow methodology
• Projects the health center will impact (know your cost)
• Workforce
• Technology
• If a care coordination/management PMPM fee is developed, understand
your cost and how it will transition to VBP

Financial and Operational – Key Considerations
90
ACO payment models/distribution methodologies
MCO/MassHealth surplus distribution methodology
– Make sure your “value” is recognized (attributed members, quality)
– Understand dollars that are retained before the total pool available for
distribution is determined
– Stay involved in discussions on the design of the distribution
methodology
‒ Separation of pools (e.g. participation versus performance)
‒ Distribution formulae
‒ Attributes (attributed lives, quality, participation, etc.)
– Evaluate the reasonableness of the quality benchmarks
– Stay active in VBP contract negotiations with MCOs/MassHealth as
they impact your financial model!
Financial and Operational – Key Considerations
91
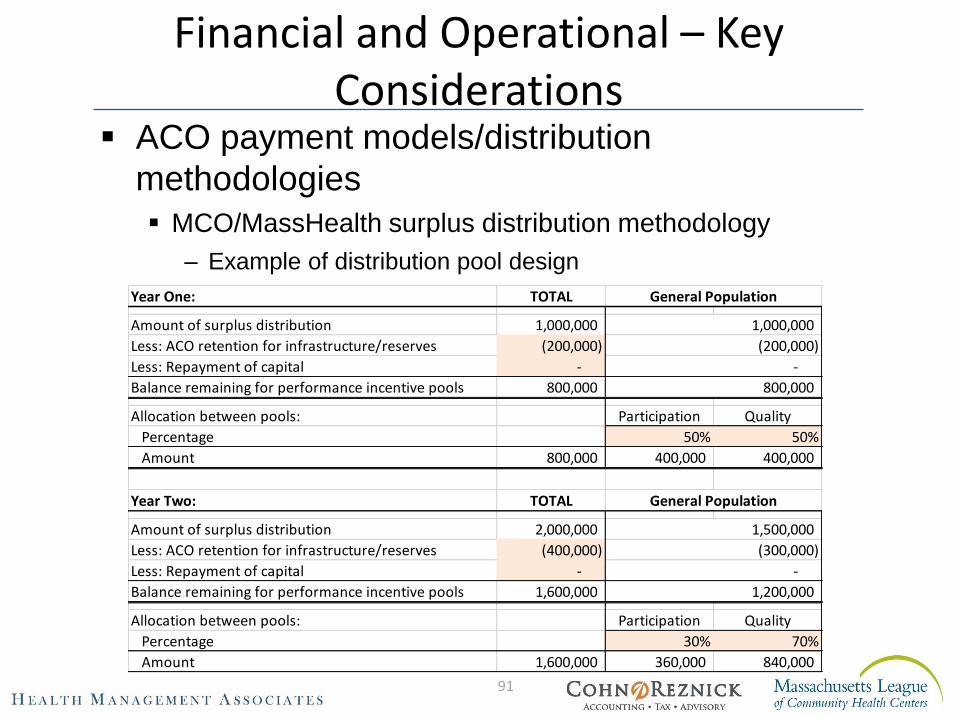
ACO payment models/distribution
methodologies
MCO/MassHealth surplus distribution methodology
– Example of distribution pool design
Year One: TOTAL
Amount of surplus distribution 1,000,000
Less: ACO retention for infrastructure/reserves (200,000)
Less: Repayment of capital -
Balance remaining for performance incentive pools 800,000
Allocation between pools: Participation Quality
Percentage 50% 50%
Amount 800,000 400,000 400,000
Year Two: TOTAL
Amount of surplus distribution 2,000,000
Less: ACO retention for infrastructure/reserves (400,000)
Less: Repayment of capital -
Balance remaining for performance incentive pools 1,600,000
Allocation between pools: Participation Quality
Percentage 30% 70%
Amount 1,600,000 360,000 840,000
(300,000)
-
1,200,000
General Population
General Population
1,500,000
1,000,000
(200,000)
-
800,000

Financial and Operational – Key Considerations
92
ACO payment models/distribution methodologies
MCO/MassHealth surplus distribution methodology
– Example of distribution formulae
‒ Participation Pool
‒ Performance/Quality Pool
Attribute 1 - Attribute 2 - Attribute 3 -
Y Y Y 33.3% 33.3% 33.3% 100.0%
#1
Attribute Score
TotalHealth Center
FQHC A
Attribute Met?
#3#2
# of
Members
% of Total
Members
Amount
Available
Participation
Score
Amount
Earned
12,500 19.3% 77,101$ 100.0% 77,101$
64,850 100.0% 400,000$ 400,000$
Health Center
FQHC A
Total
# of
Members
% of Total
Members
Amount
Available
Quality
Score
Total Amount
to be
Distributed
12,500 19.3% 115,652$ 50.0% 57,826$
64,850 100.0% 600,000$ 222,679$ Total
Health Center
FQHC A

Financial and Operational – Key Considerations
93
Use financial model to inform MCO/MassHealth VBP
negotiations
Utilize key assumptions in financial model around surplus-sharing and
risk-sharing arrangements when developing negotiation strategies
– Monthly care management/infrastructure fee (PMPM)
– Benchmarks
– Use of historic claims data versus Medical Loss Ratios (MLRs)
– Future adjustments to benchmarks
– Surplus-sharing and risk-sharing %s
– Transitioning from surplus- to risk-sharing
– Quality adjusters/modifiers
– Risk mitigating factors
– Reserves versus risk corridors, carve-outs and stop-loss
– Timing of payments
– Interim versus final distributions

The DSRIP Path to Payment Reform
94
CHCs must:
Decide where they “fit” within the current, proposed construct of ACOs and DSRIP Value-Based Payment models
– Ownership versus participating provider
Strategize on how to bring their value to discussions with ACOs/MCOs and have a say in payment reform
Get involved with governance and stay active in committee meetings
‒ Workforce decisions
‒ Funds flow – DSRIP waiver and VBP distributions
Be involved with the ACO meetings and the discussions with MCOs/MassHealth on Value-Based Payment
Continually update the financial model and refine assumptions
Monitor reserves and needs for capital

Financial Management Systems
95
Current financial health and positive operating performance
Reserves
Strong financial systems and internal controls
Financial modeling
What are the new services and infrastructure required?
What will it cost – upfront versus ongoing?
What resources are available to fund these costs?
What potential revenue streams are available?
What are the key assumptions that drive success?
What are the working capital needs?
What is the ROI?
Utilize the financial model to inform VBP negotiations!

Agenda
96
Goals for Today
Overview of VBP, Drivers of Revenue and Financial Dilemma
Defining the Tasks; Defining the Responsibilities
Detailed Walkthrough of the Financial Model
Wrap Up and Implications for Next Steps

Next Session
97
• July 14, 2017: Elements for Success, Population Management

Contact Information
98
Lisa Whittemore, Principal
Myra Sessions, Senior Consultant
Peter Epp, Partner