Acme United Corporation (ACU) - Lark · PDF file · 2015-06-23Acme United...
16
Lark Research Stephen P. Percoco P.O. Box 768, Norwood, MA 02062 (781) 762-1476 www.larkresearch.com [email protected] Acme United Corporation (ACU) Primary Report (updated for Q4 results and revised projections) February 26, 2015 Acme is a leading U.S. producer of scissors and measuring products, such as rulers. Over the past few years, it has increased its market position through acquisitions, especially in the first‐aid kit market. In 2011, it acquired the net assets of Pac‐Safety Equipment. In 2012, it bought the net assets of C‐Thru Ruler. In 2014, it completed its largest acquisition to date: the net assets of privately‐held First Aid Only. With acquisitions and internal growth, Acme’s revenues and profits grew at compounded annual rates of 12.6% and 11.0%, respectively, from 2009 to 2014. In 2014, both revenues and profits increased by nearly 20%. Management expects continued double‐digit growth in 2015. Despite the cost of acquisitions, Acme has kept its debt burden manageable. It has spent $18 million on acquisitions since 2011. Although its total debt has increased from $13.5 million to $24.1 million, retained earnings have kept pace. As a result, Acme’s ratio of debt‐to‐total capitalization has been essentially flat at 38.0% in 2014, compared with 38.7% in 2011, and its interest coverage ratio (EBITDA‐ to‐interest expense) has increased from 13.0 in 2011 to 18.4 in 2014. In 2015, assuming no additional acquisitions, Acme should generate $125 million in revenues, up 16.7% from $107.2 million in 2014. About half of the increase will come from a full year’s revenue from First Aid Only, the balance from organic growth across Acme’s product lines. Net income is projected to increase 21% from $4.8 million in 2014 to $5.8 million in 2015 and earnings per share should rise 15% from $1.36 to $1.57 per share. At the current share price of $19.25, Acme’s 2014 price‐earnings multiple is 14.2 and its 2015 P/E is 12.3, both well below major market averages. The stock is thinly traded. 40% of outstanding shares and nearly 50% of beneficial shares are held by insiders (mostly CEO Walter Johnsen and COO Paul Olschan) and three institutions which hold stakes in excess of 5%. The low valuation suggests skepticism about whether the company can sustain its earnings growth. If it can, then the stock should deliver a total return about 17% in 2015, which is equivalent to projected EPS growth of about 15.4% plus the current 1.9% dividend yield. If the market gains greater confidence in the sustainability of Acme’s earnings, multiple expansion could result in a total return in excess of 17% for 2015 Although Acme has a solid balance sheet, it is a small company competing in some segments against giants like Fiskars, 3M, Honeywell, Cintas and McKesson. In the long run, it may be better positioned to compete as part of a larger organization with access to significantly greater financial resources. Common Stock Performance Rating: 1; Safety Rating: C- Russell 2000: 1235.11 Shares Outst. (mil.) Common Stock 2/25/15 Price Div. per Share Div. Yield Tangible Book Val. Proj ’14 EPS 2014 P/E Proj. ’15 EPS 2015 P/E 3.29 Acme United (NYSE Mkt: ACU) $19.25 $0.36 1.9% $7.62 $1.36 14.2 $1.57 12.3
Transcript of Acme United Corporation (ACU) - Lark · PDF file · 2015-06-23Acme United...

Lark Research Stephen P. Percoco P.O. Box 768, Norwood, MA 02062 (781) 762-1476 www.larkresearch.com [email protected]
Acme United Corporation (ACU)
Primary Report (updated for Q4 results and revised projections) February 26, 2015
Acme is a leading U.S. producer of scissors and measuring products, such as rulers. Over the past few
years, it has increased its market position through acquisitions, especially in the first‐aid kit market. In
2011, it acquired the net assets of Pac‐Safety Equipment. In 2012, it bought the net assets of C‐Thru
Ruler. In 2014, it completed its largest acquisition to date: the net assets of privately‐held First Aid Only.
With acquisitions and internal growth, Acme’s revenues and profits grew at compounded annual rates
of 12.6% and 11.0%, respectively, from 2009 to 2014. In 2014, both revenues and profits increased by
nearly 20%. Management expects continued double‐digit growth in 2015.
Despite the cost of acquisitions, Acme has kept its debt burden manageable. It has spent $18 million on
acquisitions since 2011. Although its total debt has increased from $13.5 million to $24.1 million,
retained earnings have kept pace. As a result, Acme’s ratio of debt‐to‐total capitalization has been
essentially flat at 38.0% in 2014, compared with 38.7% in 2011, and its interest coverage ratio (EBITDA‐
to‐interest expense) has increased from 13.0 in 2011 to 18.4 in 2014.
In 2015, assuming no additional acquisitions, Acme should generate $125 million in revenues, up 16.7%
from $107.2 million in 2014. About half of the increase will come from a full year’s revenue from First
Aid Only, the balance from organic growth across Acme’s product lines. Net income is projected to
increase 21% from $4.8 million in 2014 to $5.8 million in 2015 and earnings per share should rise 15%
from $1.36 to $1.57 per share.
At the current share price of $19.25, Acme’s 2014 price‐earnings multiple is 14.2 and its 2015 P/E is
12.3, both well below major market averages. The stock is thinly traded. 40% of outstanding shares and
nearly 50% of beneficial shares are held by insiders (mostly CEO Walter Johnsen and COO Paul Olschan)
and three institutions which hold stakes in excess of 5%. The low valuation suggests skepticism about
whether the company can sustain its earnings growth. If it can, then the stock should deliver a total
return about 17% in 2015, which is equivalent to projected EPS growth of about 15.4% plus the current
1.9% dividend yield. If the market gains greater confidence in the sustainability of Acme’s earnings,
multiple expansion could result in a total return in excess of 17% for 2015
Although Acme has a solid balance sheet, it is a small company competing in some segments against
giants like Fiskars, 3M, Honeywell, Cintas and McKesson. In the long run, it may be better positioned to
compete as part of a larger organization with access to significantly greater financial resources.
Common Stock Performance Rating: 1; Safety Rating: C- Russell 2000: 1235.11
Shares Outst. (mil.) Common Stock
2/25/15Price
Div. perShare
Div. Yield
Tangible Book Val.
Proj ’14 EPS
2014 P/E
Proj. ’15 EPS
2015 P/E
3.29 Acme United (NYSE Mkt: ACU) $19.25 $0.36 1.9% $7.62 $1.36 14.2 $1.57 12.3

Lark Research Acme United Primary Report
Page 2/16 February 26, 2015
Overview
Acme United Corporation is the successor to the Acme Shear Company, which was incorporated in
Connecticut in 1882 and purchased a few years later by the Wheeler brothers, who moved the company
to Bridgeport.
A grandson of the founder, Henry Wheeler, became president of the Company in 1941. Shortly after
World War II, the company established a UK subsidiary to sell into the European market. By 1946, Acme
Shear had become the world’s largest scissors company. Mr. Wheeler expanded Acme’s business into
medical products (scissors, hemostats, scalpels and first aid kits) in 1965. The company went public in
1968 on the American Stock Exchange and still trades on the successor to the Amex, NYSE Market,
under the symbol “ACU.”
In the 1970s, Acme acquired the Wescott Rule Company, a leading manufacturer of rulers and other
measuring products. Acme Shear then changed its name to Acme United Corporation. Later on, Acme
expanded its operations into Canada with the acquisition of a Toronto‐based measuring tools
manufacturer, also coincidentally named Acme.
In the mid‐1980s, Acme suffered a major blow when American Home Products, its primary customer for
medical products, decided to end its relationship and bring production in‐house. Acme then embarked
upon an unsuccessful acquisition program in an attempt to compensate for the loss of business. As
losses began to mount, its share price fell by nearly 90% to $3 in the early 1990s, putting significant
pressure on its Board of Directors.
In the mid‐1990s, after terminating its relationships with the remaining members of the Wheeler family,
the Board hired Walter Johnsen, a former venture capitalist and private equity banker at Smith Barney,
as President and CEO. Mr. Johnsen had recently cashed out of a successful LBO investment in Marshall
Products, a medical equipment supplier and had joined Acme’s Board a year before becoming CEO.
Along with his new position, Mr. Johnsen became a major shareholder in Acme.
Soon after Mr. Johnsen’s arrival, Acme sold its hospital products business (but retained the first aid kit
business, which still operates under the Physicians CARE brand name). It cut costs in the scissors and
cutting tools business sharply by closing seven manufacturing plants in the U.S. and shifting production
overseas (to China). The reduction in production costs helped Acme to expand its existing relationships
with Staples and United Stationers, among others, and win new business in the student (i.e. educational)
market with mass merchandisers like Wal‐Mart and Target.
After returning to profitability, Acme acquired in 2004 Clauss Cutlery, a maker of scissors, utility knives
and other cutting tools for the floral and industrial markets. With this acquisition, Acme expanded its
distribution to industrial suppliers, like Fastenal and Grainger. In 2007, it bought out of bankruptcy the
brand names and intellectual property of Camillus Cutlery, a maker of knives, machetes and other
cutting tools primarily for the outdoorsman’s market.
In 2011, Acme began to expand its presence in the first aid kit market by acquiring for $3.1 million the
net assets of Norwalk CT‐based Pac‐Kit Safety Equipment Company, a manufacturer of first aid kits for
the industrial, transportation and marine markets. Pac‐Kit is known for its high level of customer
service, including tailoring kits to meet customer needs (e.g. first‐aid kits for oil & gas drillers) and for
quick order fulfillment. Pac‐Kit had sales of $5.4 million in 2010. Under Acme, Pac‐Kits sales have

Acme United Primary Report Lark Research
February 26, 2015 Page 3/16
tripled, in part by expanding branded and private‐label sales to and through distributors like Grainger
and McMaster‐Carr.
In June 2012, Acme purchased the net assets of the C‐Thru Ruler Company, a supplier of drafting,
measuring, lettering and stenciling products, for $1.5 million. The C‐Thru product lines acquired by Acme
had generated sales of $2.7 million in 2011. Among C‐Thru’s products are transparent rulers,
protractors, triangles and curves. The acquisition also expanded Acme’s product offerings in cutting and
measuring tools serving the craft, home, hardware and office distribution channels.
In February 2014, Acme acquired the net assets of Vancouver WA‐based and privately‐held First Aid
Only for $13.8 million. FAO sells Smart Compliance© first aid kits, refills and safety products that help a
broad range of companies meet OSHA requirements.
FAO has a refill system called Smart Tag, which alerts customers to the need to reorder items within the
kit and gives them the information that they need to complete the automated reordering process
quickly and efficiently, with minimal input from FAO personnel. Much of the cost savings from this low
overhead reordering system is passed on to customers.
FAO had sales of $17.3 million in 2013. The acquisition has been accretive. With FAO, Acme sees
opportunities for growth and also for reducing costs. For example, Acme will begin to consolidate some
of the operations of Physicians CARE, Pac‐Kit and FAO into FAO’s Vancouver WA facilities.
Acme’s brands are highlighted below:

Lark Research Acme United Primary Report
Page 4/16 February 26, 2015
Business Segments
Acme United organizes and reports its business segments according to geographies. Its three segments
are the United States, Canada and Europe. The U.S. is Acme’s largest segment by far, accounting for
85% of net sales (for the nine month period ended September 30, 2014, the latest figures available) and
91.5% of operating income.
Although Acme has a much smaller presence in Canada, its operations there are more profitable, as
evidenced a higher operating margin and also by a higher return on assets. Most likely, Canada
generates higher investment returns for Acme because it is not burdened by corporate overhead.
Acme’s European operations have been hovering around breakeven for the past four years and were
consistently unprofitable before that. Were it not for the achievement of profitability in 2012 and 2013,
the company might have decided to close it down. However, Acme services the European operations of
some of its U.S. mass market customers, like Staples, so it plans to stay. It believes it is just one mass
market customer away from being consistently profitable there. An economic rebound in Europe could
also boost sales and profitability. In 2014, Acme’s sales in Europe fell 10%, so the segment probably
posted a loss for the full year.

Acme United Primary Report Lark Research
February 26, 2015 Page 5/16
While the company’s classification of business segments along geographic lines seems both reasonable
and practical, the first aid kit business now generates $35 million in annual revenues as a result of recent
acquisitions, equal to about a third of the company’s 2014 revenues. At that level, it makes sense for
Acme to begin reporting its segment results under a different classification: by business in addition to
geographies. The two segments would be (a) Cutting and Measuring Tools and (b) First Aid Kits (or
Safety Products).
Most companies that break down segments according to business lines also report sales (and often
profits) by geographies. Although Acme is a small company, it should not be too much trouble for it to
do likewise.
New Business Initiatives
Beyond the acquisitions and the associated expansion of product lines, Acme has been a leader in the
use of titanium and non‐stick coatings in its cutting products. In recent years, the company has
introduced a couple of lines of garden tools – one under its Clauss brand (with patented AirShoc
ergonomic grips), the other under the (licensed) Scott Miracle‐Gro brand. These products include
pruners (with replaceable blades), snips, loppers, saws, knives, scissors and shears.
Besides titanium, the company has used and continues to experiment with variations in coatings
technology, including titanium carbonitride and other metals, such as chromium. The goal is to produce
cutting tools with stronger blades that operate more smoothly. For example, a Clauss AirShoc pruner
promises a blade five times harder than steel that stays sharper longer, can be replaced without tools
and whose performance will not be impeded by adhesives, saps and other residues. Its Wescott iPoint
Orbit battery‐powered pencil sharpener, which uses titanium blades, has been a great success. Acme
also has high hopes for a recently launched putty knife with non‐stick coating.
To date, most of these products have been well received in the marketplace, but some have not worked
as well as advertised. This is a promising area for Acme with good growth potential, but it remains a
work‐in progress.
Competition
In scissors, Acme competes with Fiskars and 3M (under the Scotch brand) as well as a number of
smaller, regional producers. In other cutting tools, the company faces a large number of competitors,
including Fiskars and smaller regional firms, like Felco, Wallace and H.B. Smith. The sportsman’s knives
market is fragmented, with a few well‐known brands, including Remington.
In first aid, safety and over‐the‐counter medicines, Acme has major competitors across its product lines.
These include Cintas, Zee Medical, Honeywell (North Safety) and McKesson, as well as many smaller
local and regional companies.
Properties
In August 2013, Acme acquired a 340,000 sq. ft. warehousing and distribution facility on 33 acres in
Rocky Mount, NC for $2.8 million. It bought the property from a company that was liquidating its
operations under Chapter 7 of the bankruptcy code. By all accounts, this was a bargain price, equal to
$8.24 per sq. ft. and less than $85,000 per acre.

Lark Research Acme United Primary Report
Page 6/16 February 26, 2015
Acme has consolidated its warehousing and distribution operations for the cutting and measuring tools
businesses into this facility. It invested $1.4 million to bring the facility up to its specifications and exited
two other facilities, a leased warehouse with 135,000 sq. ft. and a 40,000 sq. ft. facility in Fremont NC
that it owned. Last April, the company reported that it had sold the Fremont plant for $850,000 and
recorded a gain of $200,000 on sale.
The Rocky Mount facility nearly doubles the amount of space available to Acme, providing considerable
additional space for warehousing, distribution, offices and manufacturing.
Major Shareholders
Nearly 50% of Acme’s outstanding shares are held either by insiders or major institutional shareholders.
The most recent listing, which includes insider holdings as of February 25, 2014 and major institutional
shareholders as of December 31, 2014, is given in the table below:
Acme United Corporation Major Shareholders
Shares Owned
Shares Under Option
Shares Beneficially
Owned
% of Class, Owned
Shares Only
% of Class Beneficially
Owned Walter C. Johnsen, Chairman and CEO 343,720 225,700 569,420 10.5% 16.2% North Star Investment Management 441,036 0 441,036 13.4% 13.4% First Wilshire Securities Management 257,866 0 257,866 7.8% 7.8% Brian S. Olschan, President and COO 39,576 173,200 212,776 1.2% 6.1% Bard Associates 169,568 0 169,568 5.2% 5.2% Other directors and officers 66,488 215,525 282,013 2.0% 8.1% TOTALS 1,318,254 615,425 1,932,679 40.1% 49.5%
Based upon 3,289,455 shares outstanding as of November 3, 2014. For Mr. Johnsen, Mr. Olschan and other directors and officers, their % of
class, including beneficially owned shares, is calculated by dividing total shares beneficially owned by the sum of total shares outstanding plus
the shares that they hold under option. Thus, Mr. Johnsen’s % of class beneficially owned equals 569,420 divided by the sum of 3,289,455 plus
225,700. The resulting percent of class calculation of 16.2% represents the equity stake in Acme that Mr. Johnsen would own if he (and only
he) exercised all of his shares under option. Shareholdings (including shares under option) for directors and officers were obtained from
Acme’s 2014 proxy (from amounts outstanding as of February 25, 2014). Shareholdings from major institutional shareholders are from 13G and
13G/A SEC filings as of December 31, 2014.
Financials
Acme’s financial performance over the four‐year period ended December 31, 2014 has been remarkably
consistent. Revenues and earnings have grown at a double‐digit clip, due to acquisitions and organic
growth; while profit margins have improved slightly. Revenues increased by 13.5% compounded from
2011 to 2014, while net income grew 19.4% and EPS by 14.3%. In 2014, revenues increased 19.7%, net
income by 19.6% and EPS by 11.5%.

Acme United Primary Report Lark Research
February 26, 2015 Page 7/16
Acme United Corporation and Subsidiaries Summary Financial Data: 2011‐2014
12 Months 12 Months 12 Months 12 Months 31-Dec-11 31-Dec-12 31-Dec-13 31-Dec-14
Net sales 73,302 84,370 89,577 107,222 Cost of goods sold 46,977 54,623 57,753 69,037 Gross profit 26,325 29,746 31,824 38,185 as % of net sales 35.9% 35.3% 35.5% 35.6%
SG&A expense 22,040 24,386 25,945 30,792 as % of net sales 30.1% 28.9% 29.0% 28.7%
Operating income 4,285 5,361 5,879 7,393 as % of net sales 5.8% 6.4% 6.6% 6.9%
Interest: Interest expense (404) (444) (502) (491) Interest income 150 179 152 17 Interest expense, net (255) (264) (350) (474) Other expense (4) (99) (35) (117)
Income bef. inc. tax exp. 4,026 4,997 5,494 6,802 as % of net sales 5.5% 5.9% 6.1% 6.3%
Income tax expense 1,215 1,448 1,491 2,014 Income tax rate 30.2% 29.0% 27.1% 29.6%
Net income 2,811 3,549 4,003 4,788 as % of net sales 3.8% 4.2% 4.5% 4.5%
Earnings per share: Basic $ 0.91 $ 1.14 $ 1.26 $ 1.48 Diluted $ 0.91 $ 1.13 $ 1.22 $ 1.36
Wtd. avg. shares outstanding Basic 3,100 3,116 3,168 3,240 Diluted 3,100 3,133 3,283 3,526

Lark Research Acme United Primary Report
Page 8/16 February 26, 2015
Acme United Corporation and Subsidiaries Summary Financial Data: 2011‐2014
Actual Actual Actual Estimated 12 Months 12 Months 12 Months 12 Months
31-Dec-11 31-Dec-12 31-Dec-13 31-Dec-14
Operating income 4,285 5,361 5,879 7,393 Depreciation 795 862 934 1,202 Amortization 183 228 271 457 EBITDA 5,264 6,450 7,084 9,052
Purchase of PP&E (941) (681) (4,592) (2,001) Proceeds from sale of PP&E 0 0 0 773 Purchase of patents/trademarks (102) (133) (102) (159) Acquisition of assets (3,127) (1,474) 0 (13,806) Payment rec'd on mort. rec. 0 0 1,727 0 EBITDA after capex & acq. 1,094 4,162 4,117 (6,141)
Cash paid for income taxes (1,293) (1,021) (1,821) (2,014) Cash paid for interest (390) (436) (505) (491) Adjustments (121) (470) 427 0 Stock comp. expense 428 428 490 451 Other inc. statement items 145 80 117 (300) Chg. in oper. assets & liabs. (1,970) (6,305) 684 (1,659) Net cash flow bef. financing (2,106) (3,561) 3,508 (10,154)
Dividends (772) (1,090) (729) (1,160) Net borrowings 4,046 6,751 (1,408) 1,236 Purchase of treasury stock (133) (439) 0 0 Issuance of common stock 287 172 529 890 Foreign exchange (70) 63 (7) (170) Net change in cash 1,252 1,897 1,894 (9,358)
EBITDA 5,264 6,450 7,084 9,052 Interest expense 404 444 502 491 Interest coverage 13.0 14.5 14.1 18.4
Acme’s EBITDA has grown steadily over the past few years. From 2011 to 2014, it grew at a
compounded annual rate of 19.8%. In 2014, EBITDA increased 27.8% to $9.1 million.
Capital expenditures increased significantly in 2013, due to the purchase of the Rocky Mount, NC
warehouse and distribution facility. Renovations to that facility have kept capital expenditures higher
than the historical average in 2014, but well below the total for 2013.
Except for 2012, Acme has generated sufficient cash from operations (and after all investments except
acquisitions) to cover its dividend. In 2012, the company experienced a sharp increase in working
capital (especially receivables and inventory) that is probably due mostly to ramping up operations (and
expanding distribution) for newly‐acquired operations.
Acme United Primary Report Lark Research
February 26, 2015 Page 9/16
Acme United Corporation and Subsidiaries Summary Financial Data: 2011‐2014
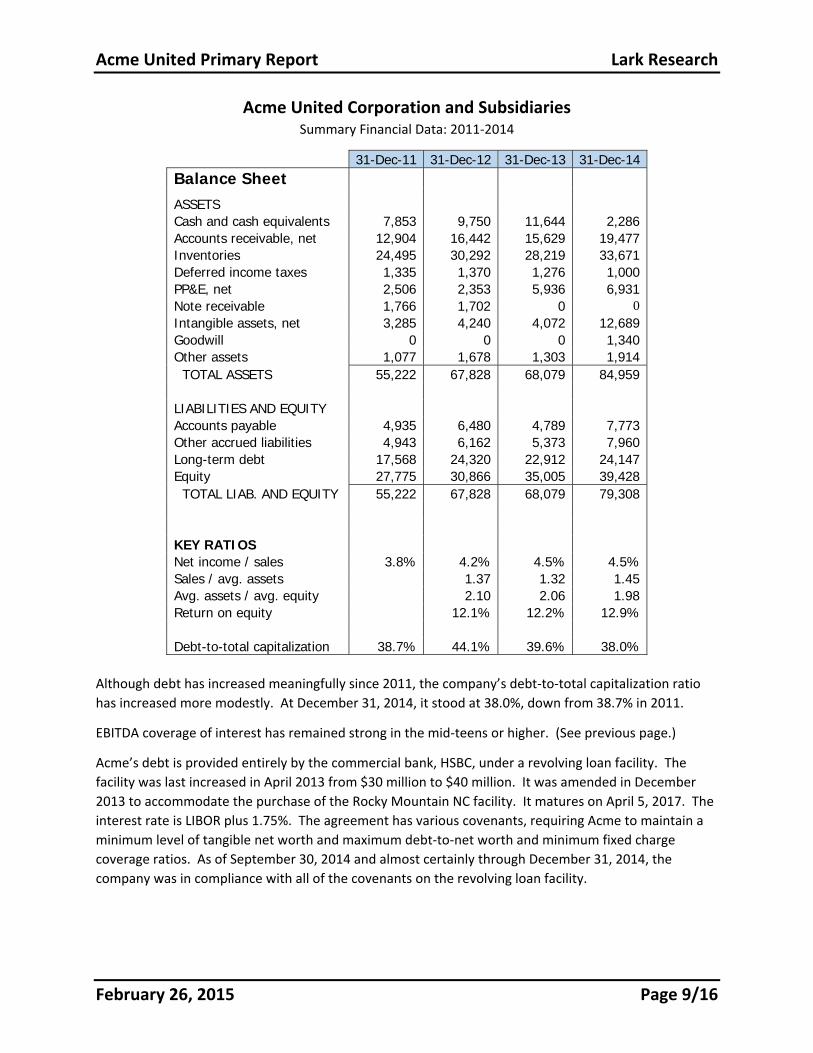
31-Dec-11 31-Dec-12 31-Dec-13 31-Dec-14 Balance Sheet
ASSETS Cash and cash equivalents 7,853 9,750 11,644 2,286 Accounts receivable, net 12,904 16,442 15,629 19,477 Inventories 24,495 30,292 28,219 33,671 Deferred income taxes 1,335 1,370 1,276 1,000 PP&E, net 2,506 2,353 5,936 6,931 Note receivable 1,766 1,702 0 0 Intangible assets, net 3,285 4,240 4,072 12,689 Goodwill 0 0 0 1,340 Other assets 1,077 1,678 1,303 1,914 TOTAL ASSETS 55,222 67,828 68,079 84,959
LIABILITIES AND EQUITY Accounts payable 4,935 6,480 4,789 7,773 Other accrued liabilities 4,943 6,162 5,373 7,960 Long-term debt 17,568 24,320 22,912 24,147 Equity 27,775 30,866 35,005 39,428 TOTAL LIAB. AND EQUITY 55,222 67,828 68,079 79,308
KEY RATIOS Net income / sales 3.8% 4.2% 4.5% 4.5% Sales / avg. assets 1.37 1.32 1.45 Avg. assets / avg. equity 2.10 2.06 1.98 Return on equity 12.1% 12.2% 12.9% Debt-to-total capitalization 38.7% 44.1% 39.6% 38.0%
Although debt has increased meaningfully since 2011, the company’s debt‐to‐total capitalization ratio
has increased more modestly. At December 31, 2014, it stood at 38.0%, down from 38.7% in 2011.
EBITDA coverage of interest has remained strong in the mid‐teens or higher. (See previous page.)
Acme’s debt is provided entirely by the commercial bank, HSBC, under a revolving loan facility. The
facility was last increased in April 2013 from $30 million to $40 million. It was amended in December
2013 to accommodate the purchase of the Rocky Mountain NC facility. It matures on April 5, 2017. The
interest rate is LIBOR plus 1.75%. The agreement has various covenants, requiring Acme to maintain a
minimum level of tangible net worth and maximum debt‐to‐net worth and minimum fixed charge
coverage ratios. As of September 30, 2014 and almost certainly through December 31, 2014, the
company was in compliance with all of the covenants on the revolving loan facility.

Lark Research Acme United Primary Report
Page 10/16 February 26, 2015
Projections
Acme United Corporation and Subsidiaries Summary Financial Data
Actual and Projected: 2013‐2015
Actual Actual Actual Projected 3 Months 3 Months 12 Months 12 Months 31-Dec-13 31-Dec-14 31-Dec-14 31-Dec-15
Net sales 21,379 24,667 107,222 125,128 Cost of goods sold 14,004 15,691 69,037 80,582 Gross profit 7,375 8,976 38,185 44,546 as % of net sales 34.5% 36.4% 35.6% 35.6%
SG&A expense 6,612 7,872 30,792 35,662 as % of net sales 30.9% 31.9% 28.7% 28.5%
Operating income 763 1,104 7,393 8,884 as % of net sales 3.6% 3.5% 6.9% 7.1%
Interest: Interest expense (122) (136) (491) (550) Interest income 13 5 17 40 Interest expense, net (109) (131) (474) (450) Other expense (19) (39) (117) (75)
Income bef. inc. tax exp. 635 934 6,802 8,324 as % of net sales 3.0% 2.9% 6.3% 6.9%
Income tax expense 111 245 2,014 2,490 Income tax rate 17.5% 26.2% 29.6% 30.0%
Net income 524 689 4,788 5,809 as % of net sales 2.5% 2.8% 4.5% 4.6%
Earnings per share: Basic $ 0.16 $ 0.21 $ 1.48 $ 1.76 Diluted $ 0.15 $ 0.19 $ 1.36 $ 1.57
Wtd. avg. shares outstanding Basic 3,189 3,287 3,240 3,300 Diluted 3,395 3,625 3,526 3,700
Projections for 2015 assume the benefit from the acquisition of First Aid Only in April 2014 as well as a
high level (of approximately 10%) of organic growth in the rest of the business. Profit margins and cost
ratios are assumed to be relatively stable. Under these assumptions, 2015 earnings per share are
projected to be $1.57, up 15.4% from 2014.

Acme United Primary Report Lark Research
February 26, 2015 Page 11/16
Acme United Corporation and Subsidiaries Summary Financial Data
Actual and Projected: 2013‐2015
Actual Estimated Estimated Projected 3 Months 3 Months 12 Months 12 Months 31-Dec-13 31-Dec-14 31-Dec-14 31-Dec-15
Operating income 763 1,104 7,393 8,884 Depreciation 261 300 1,202 1,200 Amortization 69 112 457 500 EBITDA 1,093 1,516 9,052 10,584
Purchase of PP&E (1,198) (582) (2,001) (1,200) Proceeds from sale of PP&E 0 0 773 500 Purchase of patents/trademarks (35) (40) (159) (160) Acquisition of assets 0 0 (13,806) 0 Payment rec'd on mort. rec. 0 0 0 0 EBITDA after capex and acq. (140) 666 (6,141) 9,724
Cash paid for income taxes (442) (245) (2,014) (2,490) Cash paid for interest (123) (136) (491) (550) Adjustments 427 0 Stock compensation expense 102 0 451 600 Other income statement items (8) (34) (300) (35) Changes in oper. assets and liabs. 2,365 2,602 (1,659) (5,171) Net cash flow before financing 2,180 3,081 (10,154) 2,078
Dividends (256) (392) (1,160) (1,320) Net borrowings (2,119) (6,197) 1,236 1,056 Purchase of treasury stock 0 0 0 0 Issuance of common stock 21 0 890 900 Foreign exchange 7 (20) (170) 0 Net change in cash (166) (3,528) (9,358) 2,714
EBITDA 1,093 1,516 9,052 10,584 Interest expense 122 136 491 550 Interest coverage 9.0 11.1 18.4 19.2
Under these projections, EBITDA is expected to grow 16.9% to $10.6 million in 2015, after rising 27.8%
to $9.1 million in 2014.
Excluding the cost of the First Aid Only acquisition in 2014, cash flow from operations and after net
capital expenditures is expected to be sufficient to cover total dividend payments in both 2014 and
2015. According to these projections, there is sufficient room to increase the dividend again in 2015.

Lark Research Acme United Primary Report
Page 12/16 February 26, 2015
Acme United Corporation and Subsidiaries Summary Financial Data
Actual and Projected: 2013‐2015
Actual Actual Actual Projected 31-Dec-13 31-Dec-14 31-Dec-14 31-Dec-15
Balance Sheet
ASSETS Cash and cash equivalents 11,644 2,286 2,286 5,000 Accounts receivable, net 15,629 19,477 19,477 23,000 Inventories 28,219 33,671 33,671 38,000 Deferred income taxes 1,276 1,000 1,000 1,000 PP&E, net 5,936 6,931 6,931 6,431 Note receivable 0 Intangible assets, net 4,072 12,689 12,689 12,349 Goodwill 0 1,340 1,340 1,340 Other assets 1,303 1,914 1,914 2,000 TOTAL ASSETS 68,079 84,959 84,959 89,120
LIABILITIES AND EQUITY Accounts payable 4,789 7,773 7,773 9,000 Other accrued liabilities 5,373 7,960 7,960 9,500 Long-term debt 22,912 24,147 24,147 25,203 Equity 35,005 39,428 39,428 45,417 TOTAL LIABILITIES AND EQUITY 68,079 79,308 79,308 89,120
KEY RATIOS Net income / sales 2.5% 2.8% 4.5% 4.6%Sales / Avg. total assets 1.23 1.20 1.45 1.49 Avg. total assets / avg. total equity 2.00 2.09 1.98 1.99 Return on equity 6.0% 7.0% 12.9% 13.7%
Debt-to-total capitalization 39.6% 38.0% 38.0% 35.7%
Alternatively, these projections anticipate that Acme’s debt will increase only slightly, from $24.1 million
in 2014 to $25.2 million in 2015. Actually, net of cash, Acme’s debt is expected to drop from $21.9
million in 2014 to $20.2 million in 2015. Despite the projected slight increase in debt, Acme’s ratio of
debt‐to‐total capitalization is expected to decline from 38.0% at the end of 2014 to 35.7% at the end of
2015.

Acme United Primary Report Lark Research
February 26, 2015 Page 13/16
Valuation
Acme United Corporation and Subsidiaries Valuation Metrics as of the Market Close on February 25, 2015
Recent price $ 19.25 52-week range $ 14.96 - $ 20.50 Dividend $ 0.36 Yield 1.9% Dividend payout 26.5% Shares outstanding 3,289 thousands Market cap. 63,322 thousands
EPS PE 2014A 1.36 14.2 2015E 1.57 12.3
Per Share Multiple Free cash flow $ 1.59 12.1 Book value 11.99 1.6 Tangible book 7.72 2.5 Sales (ttm) 32.60 0.6
Capitalization Book Market Debt 24,147 24,147 Equity 39,428 63,322 Total 66,575 87,469 % debt 38.0% 27.6%
Enterprise value to TTM Multiple EBITDA 9,052 9.7 Sales 107,222 0.8
At the closing share price on February 24, ACU was valued at 14.2 times 2014 earnings and 12.3 times
projected 2015 earnings, both well below market averages. (By comparison, the S&P 500 is valued at
18.8 times estimated 2014 operating earnings and 17.9 times projected 2014 operating earnings. It is
also valued at 20.5 times estimated 2014 “as reported” earnings and 18.9 times projected 2015 as
reported earnings. The discount probably reflects a liquidity premium for S&P 500 companies and
perhaps market uncertainty about whether ACU can continue to deliver double‐digit earnings growth.
On other measures, such as price‐to‐book, price‐to‐tangible book and EBITDA‐to‐enterprise value, ACU
also looks relatively cheap (compared with most other companies), but earnings growth will likely be the
primary driver of ACU’s share price performance in 2015 and beyond.

Lark Research Acme United Primary Report
Page 14/16 February 26, 2015
Technicals
After an advance that led to an intraday peak of $20.40 on December 31, 2014, ACU’s shares have
traded sideways for most of 2015. With the fall from the early peak in 2015, ACU’s shares are down
3.3% year‐to‐date, compared with a 2.5% gain in the Russell 2000 small cap index. This period of
consolidation is welcome after the strong advance that ACU had in 2014. (ACU’s stock had a total return
of 37% in 2014, much better than the Russell 2000’s 3.5% return.)
Given that ACU’s forward P/E multiples are below market averages, the stock has the potential to
outperform again in 2015, provided that ACU’s financial performance meets my expectations. The stock
can deliver a total return of 17%, which would consist of a share price gain of 15% (equal to projected
earnings growth) plus ACU’s dividend yield of 2%. If the market awards ACU a higher earnings multiple
during the course of the year, the total return on the stock would exceed 17%.
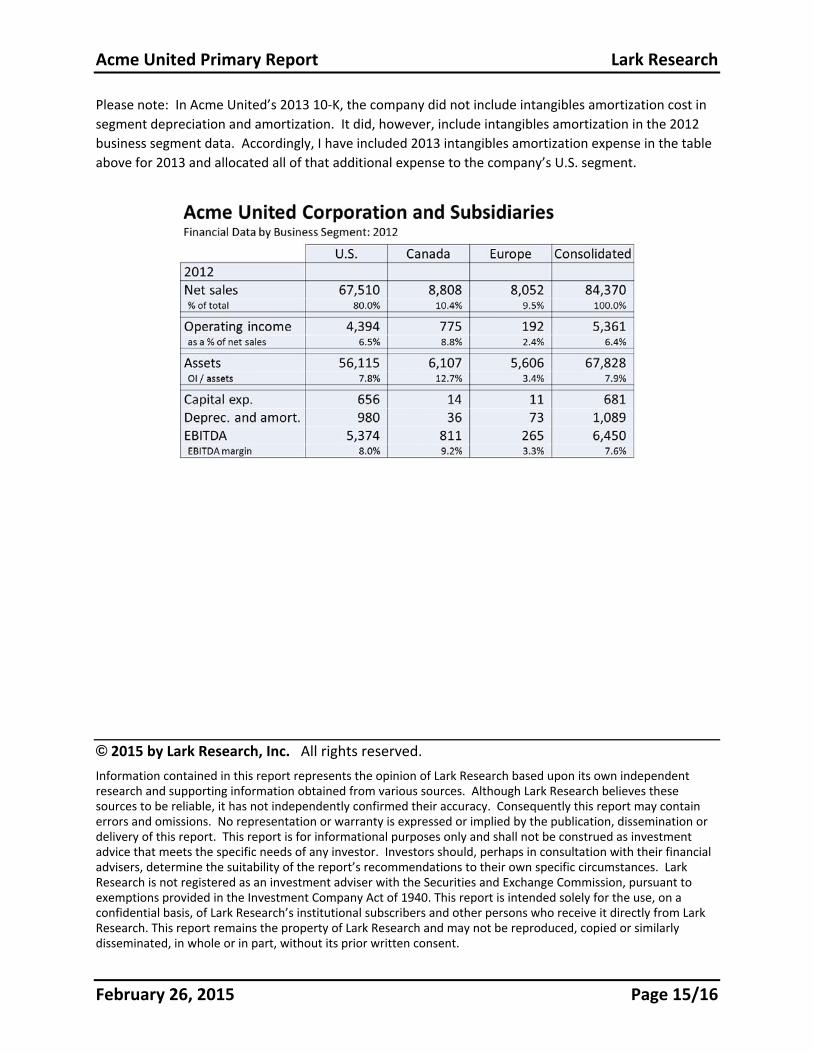
Business Segment Financial Data: 2013 vs. 2012
Acme United Primary Report Lark Research
February 26, 2015 Page 15/16
Please note: In Acme United’s 2013 10‐K, the company did not include intangibles amortization cost in
segment depreciation and amortization. It did, however, include intangibles amortization in the 2012
business segment data. Accordingly, I have included 2013 intangibles amortization expense in the table
above for 2013 and allocated all of that additional expense to the company’s U.S. segment.
© 2015 by Lark Research, Inc. All rights reserved.
Information contained in this report represents the opinion of Lark Research based upon its own independent research and supporting information obtained from various sources. Although Lark Research believes these sources to be reliable, it has not independently confirmed their accuracy. Consequently this report may contain errors and omissions. No representation or warranty is expressed or implied by the publication, dissemination or delivery of this report. This report is for informational purposes only and shall not be construed as investment advice that meets the specific needs of any investor. Investors should, perhaps in consultation with their financial advisers, determine the suitability of the report’s recommendations to their own specific circumstances. Lark Research is not registered as an investment adviser with the Securities and Exchange Commission, pursuant to exemptions provided in the Investment Company Act of 1940. This report is intended solely for the use, on a confidential basis, of Lark Research’s institutional subscribers and other persons who receive it directly from Lark Research. This report remains the property of Lark Research and may not be reproduced, copied or similarly disseminated, in whole or in part, without its prior written consent.
Lark Research Acme United Primary Report
Page 16/16 February 26, 2015
(This page was intentionally left blank.)