Acknowledgement - of Planning Commission
230
This document is intellectual property of Centre for Global Development Research Private Limited, New Delhi prepared with the help of SER Grant extended by the Planning Commission of India. No part of the document can be copied without a written permission of CGDR Page i Acknowledgement The Centre for Global Development Research (CGDR) is extremely thankful to the Socio‐Economic Research Davison of the Planning Commission, Government of India for assigning this important and prestigious study. We also thankful to officials of Planning Commission including Members, Adviser (HUD), Adviser (SER), Deputy Secretary (SER), and Senior Research Officer (SER) for their interest in the study and necessary guidance at various stages of the study. We are also extremely thankful to those who have helped in facilitating the survey and providing information. In this context we wish to thank the Chief Minister of Delhi; local leaders including Members of Parliament; Members of Legislative Assembly of Delhi; Councillors of Municipal Corporation of Delhi and New Delhi Municipal Corporation; Pradhans and community leaders of slums across Delhi. Special thanks are due to the officials of JJ slum wing, MCD, Punarwas Bhawan, New Delhi; officials of Sewer Department of MCD; various news reporters and Social workers for their contribution and help in completing the research. We are also highly thankful to officials of numerous non‐government organisations for their cooperation with the CGDR team during the course of field work. We acknowledge with gratitude the intellectual advice from Professor K.P. Kalirajan on various issues related to the study. Thanks are also due to Mr. S. K. Mondal for his contribution in preparation of this report. We are also thankful to Ms Mridusmita_Bordoloi for her contribution in preparing case studies. This report is an outcome of tireless effort made by the staff of CGDR led by Mr. Indrajeet Singh. We wish to specially thank the entire CGDR team. The acknowledgement would remain incomplete without thanking Dr. Kanhaiya Singh who volunteered to guide the study at all stages and ensured a successful completion of the report with so much of detail about the slum life in Delhi and sound strategies to rehabilitate them. Finally, but not the least, we are extremely thankful to all the respondents, who took out time to answer lengthy questionnaires. We are extremely confident that this report would go a long way in helping the policy makers in their effort of making Delhi a ‘world class city’. The report would also be helpful to academicians and researchers in understanding the problems of urban poor at large and especially in the context of National Capital. Chhaya Singh Director (CGDR)
Transcript of Acknowledgement - of Planning Commission

This document is intellectual property of Centre for Global Development Research Private Limited, New Delhi prepared with the help of SER Grant extended by the Planning Commission of India. No part of the document can be copied without a written permission of CGDR
Page i
Acknowledgement The Centre for Global Development Research (CGDR) is extremely thankful to the Socio‐Economic Research Davison of the Planning Commission, Government of India for assigning this important and prestigious study.
We also thankful to officials of Planning Commission including Members, Adviser (HUD), Adviser (SER), Deputy Secretary (SER), and Senior Research Officer (SER) for their interest in the study and necessary guidance at various stages of the study.
We are also extremely thankful to those who have helped in facilitating the survey and providing information. In this context we wish to thank the Chief Minister of Delhi; local leaders including Members of Parliament; Members of Legislative Assembly of Delhi; Councillors of Municipal Corporation of Delhi and New Delhi Municipal Corporation; Pradhans and community leaders of slums across Delhi.
Special thanks are due to the officials of JJ slum wing, MCD, Punarwas Bhawan, New Delhi; officials of Sewer Department of MCD; various news reporters and Social workers for their contribution and help in completing the research. We are also highly thankful to officials of numerous non‐government organisations for their cooperation with the CGDR team during the course of field work.
We acknowledge with gratitude the intellectual advice from Professor K.P. Kalirajan on various issues related to the study. Thanks are also due to Mr. S. K. Mondal for his contribution in preparation of this report. We are also thankful to Ms Mridusmita_Bordoloi for her contribution in preparing case studies. This report is an outcome of tireless effort made by the staff of CGDR led by Mr. Indrajeet Singh. We wish to specially thank the entire CGDR team.
The acknowledgement would remain incomplete without thanking Dr. Kanhaiya Singh who volunteered to guide the study at all stages and ensured a successful completion of the report with so much of detail about the slum life in Delhi and sound strategies to rehabilitate them.
Finally, but not the least, we are extremely thankful to all the respondents, who took out time to answer lengthy questionnaires.
We are extremely confident that this report would go a long way in helping the policy makers in their effort of making Delhi a ‘world class city’. The report would also be helpful to academicians and researchers in understanding the problems of urban poor at large and especially in the context of National Capital.
Chhaya Singh Director (CGDR)

Slums of Delhi
October 2011 Page ii
Table of Contents Acknowledgement i
Table of contents iii
List of figures x
List of tables xii
List of annexure xv
Executive Summary ES‐i
1 Introduction 1
1.1 Slums in Delhi 2
1.2 Need for a socio‐economic study 2
1.3 Objectives of the proposed study 3
1.4 Scope of the proposed study 3
1.5 Structure of the report 3
2 Methodology 5
2.1 Secondary survey 5
2.2 Primary survey 5
2.2.1 Sampling and sample selection 6
2.2.2 Sample description 7
3 Delhi slum clusters: a profile 9
3.1 Growth of slums in Delhi 9
3.1.1 Distribution of existing slum clusters and slum population across regions of Delhi 11
3.1.2 Growth of existing slum clusters across regions of Delhi over time 11
3.2 Economic value of slum clusters 14
3.2.1 Land ownership of slum clusters 14
3.2.2 Property rental in and around slums 14
3.3 Infrastructure facilities in slum clusters 15
3.3.1 Roads 16
3.3.2 Street light 16
3.3.3 Common toilet facility 17
3.3.4 Drinking water 18
3.3.5 Accessibility to amenities 19
3.4 Sanitation and waste disposal 20
3.4.1 Sanitation: cleaning and sweeping 20
3.4.2 Waste collection inside slum clusters and disposal 21
3.4.3 Drainage and waste water disposal 22
3.5 Medical facilities and interventions 22
3.5.1 Household illness and treatment 23
3.5.2 Immunisation and heath check up camps 25
3.5.3 Coverage/ penetration of immunisation camps 25
3.5.4 Coverage/ penetration of health check up camps 26
3.6 Literacy improvement program 27
3.7 Crime and law and order problems 27
3.8 Organisations (government and non government) working in slum clusters 28
3.9 Awareness about slum improvement programs 31
3.10 Summary and conclusion 31
4 People and social structure 34

This document is intellectual property of Centre for Global Development Research Private Limited, New Delhi prepared with the help of SER Grant extended by the Planning Commission of India. No part of the document can be copied without a written permission of CGDR
Page iii
4.1 Who are the slum migrants? 34
4.1.1 Most slum migrants are villagers and a few are slum hoppers 34
4.1.2 Eighty five per cent of slum migrants come from Uttar Pradesh and Bihar 35
4.1.3 Seventy per cent of slum migrants come from 35 backward districts 36
4.1.4 Varying stretch of slum life 37
4.2 Identity proofs of slum dwellers 38
4.2.1 Ration card holders 38
4.2.2 Photo card holders 39
4.3 Household characteristics 39
4.3.1 Household head 40
4.3.2 Household size 41
4.3.3 Child worker in households 42
4.4 Demography structure of slum population 42
4.4.1 Age distribution 42
4.4.2 Gender distribution 43
4.4.3 Marital status 44
4.5 Social and religious structure of slum clusters 46
4.5.1 Overwhelming population of slum belong to majority religion 46
4.5.2 Majority slum population belongs to deprived class of society 46
4.6 Education and awareness about value of education 47
4.6.1 School going children 48
4.6.2 Affordability as major constraint to higher education 53
4.7 Awareness and affordability about social security 54
4.7.1 Healthcare related security 54
4.7.2 General medical insurance 54
4.7.3 Employees state insurance corporation (ESIC) facility 54
4.7.4 Smart card 54
4.7.5 Life insurance policy 56
4.7.6 Pension 56
4.8 Social problems of slum life 57
4.9 Concluding observations 58
5 Housing condition and amenities 60
5.1 Housing conditions 60
5.1.1 Type of dwellings 60
5.1.2 Construction floors 62
5.1.3 Number of rooms 62
5.1.4 Floor areas 63
5.2 Household amenities 64
5.2.1 Household source of drinking water 64
5.2.2 Household electricity supply 65
5.2.3 Cooking space and cooking fuel 66
5.2.4 Household toilet 67
5.2.5 Waste water disposal 68
5.3 Concluding observations 69
6 Occupation and means of livelihood 70
6.1 Status of employment and means of income of household heads 70

Slums of Delhi
October 2011 Page iv
6.1.1 Occupations of household heads 71
6.2 Status of gainful employment in population and resulting dependency 72
6.2.1 Employment pattern in the entire population 72
6.2.2 Dependency ratio 74
6.3 Distance of work place 74
6.4 Type of job markets for slum dwellers 75
6.5 Concluding observations 77
7 Cost of dwelling ownership of slum dwelling 78
7.1 Dwelling ownership 78
7.2 Cost incurred in owning a slum dwelling 79
7.3 Distribution of houses by cost of owning 80
7.3.1 Pucca houses 80
7.3.2 Semi ‐ pucca houses 80
7.3.3 Kutcha houses 82
7.4 Current purchasing price of slum dwelling 82
7.5 Concluding remarks 83
8 Drivers of migration to slum life 85
8.1 Rural‐urban influx and insecure tenure 85
8.1.1 Land less labour move from rural sector to cities 86
8.1.2 Disparate search of jobs and livelihood 87
8.2 Population pushed to poverty find shelter in slums 87
8.2.1 Unaffordable accommodation 88
8.3 Potential employment avenues provide confidence 88
8.4 Concluding remarks 89
9 Economic gains to slum migrants 91
9.1 Satisfaction based direct indicators of gains 91
9.1.1 Coming to Delhi and leading life from slum was a right decision 91
9.1.1.1 Reasons for satisfaction 92
9.1.1.2 Reasons for dissatisfaction 93
9.1.2 Desire to go back 93
9.1.3 Attractions of slum life 94
9.1.4 Benefits of welfare measures 94
9.2 Economic indicators of gains 95
9.2.1 Increase in household income 95
9.2.2 Increase in household assets 96
9.2.3 Increase in household consumption expenditure 96
9.2.4 Increase in savings 100
9.3 Concluding remarks 101
10 Willingness to move and willingness to pay for resettlement 102
10.1 General unwillingness to move away from present locality 102
10.1.1 Causes of poor willingness to move to faraway place 103
10. 2 Uncertainties of slum life: a problem of tenure 104
10.2.1 Jittery future plans 104
10.2.2 Only a few can move out of their own effort 104
10.3 Willingness to pay against resettlement 107
10.3.1 Average affordability: the amount a household would be willing to pay 108
10.3.1.1 Average view of households 108
10.3.1.2 Average view of community leaders 108
10.3.2 Distribution of the amounts the households would be willing to pay 109

This document is intellectual property of Centre for Global Development Research Private Limited, New Delhi prepared with the help of SER Grant extended by the Planning Commission of India. No part of the document can be copied without a written permission of CGDR
Page v
10.3.2.1 Views of the household heads on monthly instalments 109
10.3.2.2 Views of the household heads on affordable one‐time payment towards resettlement 110
10.3.2.3 Views of community heads on monthly instalment 111
10.3.2.4 Views of community heads on affordable one‐time payment towards resettlement 112
10.4 Conclusions and remarks 113
11 Government plans for slum 114
11.1 Planning process for Delhi and slum development 114
11.1.1 Master plans for Delhi: journey from mpd‐62 to mpd‐2021 114
11.2 National housing & habitat policy‐2007 117
11.3 Government schemes covering slum rehabilitation 117
11.3.1 Delhi government action for slum development: Bhagidari with slum Dwellers 118
11.3.2 Jawaharlal Nehru Urban Renewal Mission (JNNURM) 118
11.3.3 Rajiv Awas Yojana (RAY) 119
11.3.4 Other policies concerning slum development 120
11.4 Concluding remarks 121
12 Global case studies of slum rehabilitation 122
12.1 Slum reduction in developing countries 122
12.1.1 Slums redevelopment or resettlement? 123
12.2 Case study ‐ 1: Dharavi redevelopment project (DRP), Mumbai, India 124
12.2.1 Slum rehabilitation authority (SRA) 124
12.2.2 Dharavi rehabilitation project (drp) 126
12.3 Case study ‐ 2: Kibera‐Soweto slum upgrading project, Nairobi, Kenya 133
12.3.1 Informal settlements (slums) in Kibera, Nairobi 133
12.3.2 Kibera‐Soweto slum upgrading project 134
12.4 Case study ‐ 3: Orangi pilot project, Orangi town, Karachi, Pakistan 136
12.4.1 Orangi township, Pakistan’s largest slum 136
12.4.2 Orangi pilot project (OPP) 137
12.4.3 Lessons from OPP 138
12.5 Case study ‐ 4: integrated social inclusion programme”, Santo Andre, brazil 138
12.5.1 Urbanization strategy: Santo André more equal (SAMI) 139
12.5.2 Project details 140
12.5.3 Strategic principles behind success of the social inclusion programme 141
12.6 Case ‐ 5: slum eradication in Singapore 141
12.6.1 Slums in Singapore 142
12.6.2 How Singapore succeeded in slum eradication 142
12.7 Conclusion 144
13 Cost benefit framework and rehabilitation strategy 145
13.1 Cost benefit framework and rationale for slum rehabilitation strategies 146
13.1.1 Social responsibilities of government and role of slums 146
13.1.2 Contribution of slum to private sector and responsibility of private sector towards slum rehabilitation
147
13.1.3 Slums act as Natural growth centre for poor 147
13.1.4 Slum Dwellers have gone a long way, now they need at least a small but modern shelter with best amenities
147
13.2 Lesson from Global experience of rehabilitation 148
13.3 Complexities involved in rehabilitation strategies 149
13.3.1 Community related complexities in rehabilitation project 149

Slums of Delhi
October 2011 Page vi
13.3.2 Slum cluster related complexities in choice of rehabilitation scheme 150
13.3.3 Problem of Transit Accommodation 152
13.4 Precautions Required in slum development Programs to avoid defeatist outcome 152
13.4.1 Avoid Horizontal slums getting converted into vertical slums 152
13.4.2 Avoid Lack of planning in provisioning of basic eco system such as light and ventilation 152
13.4.3 Avoid Non‐durable quality of materials used and poor construction quality 152
13.4.4 Avoid ignoring the basic requirements of slum dwellers 153
13.4.5 Avoid shifting of financial burden on the inhabitants due to relocation/ rehabilitation 153
13.5 Alternative Approaches to Rehabilitation 153
13.5.1 Summary of Basic Methods of Rehabilitation and Experiences 157
13.5.2 Economics of Spacious and Standard High Rise Rehabilitation Program: Planning for a Land Scarce City
161
13.6 Strategies for successful slum reduction 166
13.6.1 Create a database of slum dwellers through systematic census 167
13.6.2 Solving the problem of transit accommodation 168
13.6.3 Awareness and advocacy 168
13.6.4 Long‐term political commitment 169
13.6.5 Policy reform and institutional strengthening 169
13.6.6 Implementation and monitoring 169
13.6.7 Scaling‐up 170
13.7 Conclusion 170
14 Key findings 171
14.1 General condition of slums in Delhi 171
14.1.1 Slum population in Delhi is still increasing but its share in total population has come down 171
14.1.2 Slums occupy very high value land 172
14.1.3 Most slums are well connected and within sort distance of work place 172
14.1.4 Most slums suffer from inadequate garbage disposal system, sanitation and healthcare 172
14.1.5 A large proportion of people still use open space for toilet and suffer from lack of water supply 172
14.2 General condition of slum dwellers: people & social structure 173
14.2.1 Eighty per cent of the slum migrants come from backward districts of Uttar Pradesh and Bihar 173
14.2.2 Majority of the slum population belongs to deprived class of the society 173
14.2.3 More than half of the households have BPL status 173
14.2.4 Most slum dwellers are landless people from rural sector and they come in search of job and livelihood
173
14.2.5 Unaffordable accommodation is the primary reason of moving to slums 173
14.2.6 Despite relatively poor literacy households heads tend to give importance to education and discriminate less between girl and boy child
174
14.2.7 Poor social security for medical 174
14.2.8 Close to average size of household but densely populated 174
14.2.9 Adverse female to male ratio 174
14.3 Housing conditions & amenities 174
14.3.1 Majority of slum houses are pucca in construction but they lack basic amenities 174
14.3.2 Uncertainty and fear of demolition loom large 174
14.3.3 Most slum dwellers survive on unorganised job market and have high dependency ratio 174
14.3.4 Slum dwellers have invested substantial amount for shelter 175
14.4 Economic gains to slums migrants 175
14.4.1 Majority slum dwellers think it to be right decision to migrate 175
14.4.2 Cheaper electricity and affordable food products available through pds are main supports to slum dwellers
176
14.4.3 Welfare activities by government is more but satisfaction is more with non government organisations
176
14.4.4 Slum dwellers have increased their real income and expenditure manifolds after leaving the 176

This document is intellectual property of Centre for Global Development Research Private Limited, New Delhi prepared with the help of SER Grant extended by the Planning Commission of India. No part of the document can be copied without a written permission of CGDR
Page vii
native place
14.5 Willingness to move and willingness to pay for resettlement 176
14.6 Complexities involved in rehabilitation strategies 177
14.7 Lesson from global experience of rehabilitation 177
14.8 A cost benefit framework to analyse the alternative rehabilitation strategies 178
14.8.1 Alternative Methods of Rehabilitation and Experiences 178
14.8.2 Economics of Spacious and Standard High Rise Rehabilitation Program: Planning for a Land Scarce City
181
15 Recommendations 184
15.1 Issues requiring immediate attention 184
15.1.1 Need to provide common toilets in adequate numbers in each slum 184
15.1.2 Need to provide common dust bin in adequate numbers in all slums 184
15.1.3 Need to depute sweepers in all slums 185
15.1.4 Need to increase exposure to medical facilities in and around slums 185
15.1.5 Need to increase the intensity of immunization programmes and health check up camps for slums
185
15.1.6 Need to provide street light in all slums 185
15.1.7 Need to increase awareness about medical insurance related schemes among slum dwellers 185
15.1.8 Need to convert slums in to slums of hope 186
15.1.9 Need to prevent slums to become slum of despair 186
15.2 Issues in sustained development and rehabilitation 186
15.2.1 Create a database of slum dwellers through systematic census 186
15.2.2 Invite high value award winning architectural competition for flats and Rehabilitation complex
187
15.2.3 Increase floor space ratio 187
15.2.4 Avoid settlement to become ghettos 187
15.2.5 Avoid ‘totally market‐driven scheme’: it can lead to a potential nightmare 188
15.2.6 Strategise slum reduction 188
15.3 Prevent city from future slums 189
15.3.1 Fix responsibility for any upcoming slum 189
15.3.2 Conduct studies to understand the size and characteristics of migrants 190
15.3.3 Build temporary shelters for migrating people 190
15.3.4 Encourage industrial complexes to build accommodation for labour and temporary allotment 191
15.4 Potential rehabilitation strategies 191
15.4.1 Alternative strategies of rehabilitation 192
15.4.2 Affordable housing 193
15.4.3 Standard High Rise Rehabilitation Program: Planning for a Land Scarce City 193
References 195
Annexure 198

Slums of Delhi
October 2011 Page viii
List of Figures
3.1 Growth of slum population in Delhi with respect to its total population 10
3.2 Growth of existing slum clusters by number across regions of Delhi over time 13
3.3 Growth of existing slum size by number of households across regions of Delhi over time 13
4.1 Contribution of 241 districts in slum household population 36
4.2 Distribution of households by years of stay in the slum 38
4.3 Presents distribution of estimated number of children up to 14 years of age by gender 44
4.4 Percentage of children of 5‐14 years of age by enrolment status in school 49
4.5 Distribution of reasons for discontinuing studies by children in 5‐14 years age 50
4.6 Distribution of present status of children not studying at present 51
4.7 Distribution of estimated households on their comments on value of education in terms of prospect for employment
52
4.8 Distribution of estimated number of households on their comments on level up to which education is desirable for females & males
52
4.9 Distribution of estimated number of households by their planning to impart higher education (ITI, diploma, engineering degree, MBA etc) for female & male child
53
4.10 Distribution of estimated number of households by their affordability to impart higher than elementary education for their children
53
4.11 Percentage of households having medical facility related insurance 55
4.12 Distribution of households having awareness, possession and use of about smart card facility provided by the government
55
4.13 Distribution of households with, life insurance policy 56
4.14 Percentage of households receiving pension, and type of pension 57
4.15 Distribution of household head by type of arrangement made for child’s future 57
5.1 Distribution of households by type of house in the slum 61
5.2 A kutcha (left) and a pucca (right) dwelling in a slum of Delhi 61
5.3 A semi pucca dwelling with cooler fitted in wall (left) and a multi storied pucca slum dwelling (right) 62
5.4 Distribution of households by source of drinking water 64
5.5 Distribution of households without electricity 65
5.6 Distribution of households by without kitchen in the slum house 66
5.7 Percentage of households by type of fuel used for cooking 67
5.8 Percentage of households without toilet 67
5.9 Distribution of households by the ways waste water is disposed 68
6.1 Distribution of household head by activity status 71
6.2 Estimated dependency ratio (gainfully employed population to total population) in Delhi slums across regions
74
6.3 Primary job market for slum dwellers in Delhi 76
6.4 Secondary job market for slum dwellers in Delhi 76
7.1 Estimated share of households with jhuggi ownership across regions of Delhi 79
8.1 Percentage of households without land ownership at native place 86
9.1 Percentage of households considering it to be right decision to have moved out of their native place
92
9.2 Annual per capita expenditure on food and non food item 90

This document is intellectual property of Centre for Global Development Research Private Limited, New Delhi prepared with the help of SER Grant extended by the Planning Commission of India. No part of the document can be copied without a written permission of CGDR
Page ix
9.3 Distribution of annual per capita expenditure on food and non food item 98
10.1 Distribution of households who would opt for an accommodation farAway from their present location
103
10.2 Distribution of households by the way it will affect the households 103
10.3 Percentage of household head planning to move out of the slum 105
10.4 Distribution of household head who plan to move out of the slum by type ofAccommodation they could afford
105
10.5 Average affordability according to household 108
10.6 Average affordability according to community leaders 109
13.1 Survey implementation strategies 168

Slums of Delhi
October 2011 Page x
List of Tables
2.1 Total number of all identified slums, slums selected, total number of reported households, listing of 10,123 households and number of selected sample households
8
2.2 Distribution of slums by zone 8
3.1 Number of jhuggi households, population and growth rate 10
3.2 Distribution of current slums and slum population by zone 11
3.3 Dynamics of distribution of existing slums and slum population across regions and time horizon 12
3.4 Distribution of slums by land status 14
3.5 Average cost (INR ) of purchasing one room in slum; average rent (INR)for one room in slum & average rent (INR) of 2 BHK in the surrounding slum locality
15
3.6 Distribution of slum roads by type of construction 16
3.7 Percentage of slums having street light 17
3.8 Distribution of slums with toilet facility inside the slum by provider of the facility 17
3.9 Percentage of slums having access to drinking water by provider 18
3.10 Distribution of slums having irregular supply of drinking water 19
3.11 Average distance of amenities, infrastructure and services from the slum 20
3.12 Distribution of slum by regular visits by MCD sweepers for cleaning and picking up garbage from the slum
21
3.13 Percentage of slum having common dust bin and distribution of such slums by frequency of visit of MCD truck
22
3.14 Distribution of slums with and without drainage system for disposal of waste water from the slum 22
3.15 Percentage of slums having government dispensary inside the slum, and average number of immunization and health check up camps conducted by the government during 2009‐10
23
3.16 Distribution of population reporting illness by type of chronic & other diseases 24
3.17 Distribution of population reporting illness by treatment place 25
3.18 Percentage of slums having government dispensary inside the slum and facility of immunisation 26
3.19 Distribution of slums by type of health check‐up camps conducted by the govt 26
3.20 Percentage of slums covered under literacy improvement programs conducted during the last one year
27
3.21 Distribution of slums by type of law and order 28
3.22 Participation of major organisations in slums across region 29
3.23 Coverage of major organisations through social activities in slums across region
30
3.24 Satisfaction level for charitable organizations and government programs 30
4.1 Percentage of households living in slum for the first time or more and distribution by earlier stay 34
4.2 Distribution of slum households by their state of origin 35
4.3 Top 35 districts forming source of migration to slum clusters 37
4.4 Distribution of Households with Ration card and by type of ration card 39
4.5 Distribution of households with photo i‐cards, smart cards and households using smart card 39
4.6 Distribution of household head by gender and age‐groups 40
4.7 Distribution of household head by gender and level of education 41
4.8 Average household size and distribution of households by family size 41
4.9 Distribution of households with number of child workers in the family 42
4.10 Percentage distribution of estimated number of population by gender and age group 43
4.11 Distribution of slum population by gender 44
4.12 Ratio of female to male (female per 100 male) by age groups 44
4.13 Distribution of population by marital status, gender & age groups 45
4.14 Distribution of population by marital status across gender and regions 45

This document is intellectual property of Centre for Global Development Research Private Limited, New Delhi prepared with the help of SER Grant extended by the Planning Commission of India. No part of the document can be copied without a written permission of CGDR
Page xi
4.15 Distribution of households by religion & zone 46
4.16 Distribution of households by social group 47
4.17 Percentage distribution of estimated population by qualification, gender & age groups 48
4.18 Distribution of school going children up to 18 yrs of age & percentage of school going children to total children up to 18 yrs.
49
4.19 Distribution of estimated number of households by their affordability to impart higher than elementary education for their children & likely source of finance
54
4.20 Percentage of households reporting five biggest problems of slum life they hate most 58
5.1 Distribution of estimated number of Households with one storey, two storey and three storey structure
62
5.2 Average number of rooms in slum dwellings 63
5.3 Floor‐wise average covered area 63
5.4 Distribution of households without electricity facility in the slum house 66
5.5 Distribution of without separate toilet and alternative means for toilet 68
6.1 Distribution of households by broad occupation groups of household head 72
6.2 Distribution of estimated population by occupation groups & gender 73
6.3 Percentage of households by distance in km of the place of work of hh head 75
7.1 Average expenditure incurred in owning a pucca, semi‐pucca and kutcha house 80
7.2 Distribution of households by amount spent on owning a pucca house till now 81
7.3 Distribution of households by amount spent on owning a semi‐pucca house till now 81
7.4 Distribution of households by amount spent on purchase /construction of kutcha house till now 82
7.5 Average cost of purchasing one room and average rent for one room in slum 83
8.1 Percentage of households by reasons for migration to the present slum 87
8.2 Distribution of households by place of origin 88
8.3 Distribution of households by reasons for shifting from the previous residence 88
8.4 Pattern of potential employment avenue (all slum clusters) 89
9.1 Distribution of households reporting right decision to leave their native place & the way they have gained
92
9.2 Percentage of households reporting it to be a wrong decision to leave their native place & important reasons
93
9.3 Percentage households by their willingness to go back to native place and reasons there of 94
9.4 Percentage households reporting five best things of slum life 94
9.5 Average annual income per person based on the estimates of population at 1999‐00 prices (INR) 96
9.6 Percentage of households by ownership of household assets and zone 96
9.7 First, second, third and fourth quintiles of distribution of MPCE in rural sector Bihar, UP and all‐India vis‐à‐vis CGDR estimates for Delhi slums
97
9.8 Household consumption expenditure during current year and at the time of leaving native place 99
9.9 Quantity and value of annual average consumption of selected food items. Per capita per person 100
9.10 Household savings before & after leaving native place (at constant 1999‐00 prices) 101
9.11 Average annual income and expenditure per person (INR) by the households across native states (1666 households) at constant 1999‐00 prices
101
10.1 Expectations about continuance of slums and the future plans 104
10.2 Distribution of households by affordability for own accommodation (only those households who have indicated to be planning to move in own house)
106

Slums of Delhi
October 2011 Page xii
10.3 Distribution of households by source of potential finance for purchasing a house outside slum 107
10.4 Distribution of households by monthly instalment a household on an average can pay (views of households)
110
10.5 Distribution of affordability with respect to down payment for 25 yards flat (views of households) 111
10.6 Distribution of slums reporting the affordability of people living slum towards monthly instalment for a plot of land / flat (INR)
112
10.7 Distribution of slums reporting the affordability per family towards resettlement scheme if launched by the government (INR) views of community leaders
112
11.1 JNNRUM cumulative physical progresses (as on February 2010) 118
11.2 State‐wise DPRs received and approved under basic service to the urban poor (BSUP) (status on 15‐02‐2011, INR values in crore)
120
13.1 Approximate distribution of slums by household population range in slums 151
13.2 Approximate distribution of area covered by households by slum locations 151
13.3 Alternatives obtained through simulated Surplus Generation with changing SFI and Feasible Building height for different floor areas of dwellings and contribution from slum dwellers
164
13.4 Indicative cost and benefits of resettlement under alternative structure of buildings with limited variables only (example ‐1)
165
13.5 Indicative cost and benefits of resettlement under alternative structure of buildings with limited variables only (example ‐2)
166
This document is intellectual property of Centre for Global Development Research Private Limited, New Delhi prepared with the help of SER Grant extended by the Planning Commission of India. No part of the document can be copied without a written permission of CGDR
Page xiii
List of Annexure
A1 List of map location with 477 slums 198
A1 Map with slum locations 213
A2 List of sample slums surveyed 214
A3 List of slums established during 1922 to 1947 216

INTRODUCTION
This document is intellectual property of Centre for Global Development Research Private Limited, New Delhi prepared with the help of SER Grant extended by the Planning Commission of India. No part of the document can be copied without a written permission of CGDR
Page 1
Chapter 1
Introduction
Slum is a commonly used term for thickly populated urban areas with dilapidated and substandard housing and squalor. Britannica Concise Encyclopaedia defines slum as densely populated area of substandard housing, usually in a city, characterized by unsanitary conditions and social disorganization. The Census (2001) of India has defined Slum as “a compact area of at least 300 populations or about 60-70 households of poorly built congested tenements, in unhygienic environment usually with inadequate infrastructure and lacking in proper sanitary and drinking water facilities. The slum population in India was counted as 42.58 million during 2001 census spread over 640 cities/ towns, which was 15 per cent of the urban population and 23.1 per cent of the cities/ towns’ population reporting slum.
The life in slums is human disaster, yet the slum population is growing with alarming rate all over the world but more so in developing countries. In a report titled “The Challenge of Slums”, the United Nations Human Settlements Program (UN-HABITAT 2003) reported that one billion people —approximately one third of the world’s urban dwellers and a sixth of all humanity, live in slums. India alone constitute about one third of the global slum population. The report has warned that the population of the world's slums will double to two billion people within 30 years. “The Challenge of Slums” argues for intervention by national governments to check the rapid unplanned urban expansion which is already a human disaster.
The key reasons behind the growth of slums are migration of disadvantaged rural population to economically more affluent cities in search of jobs and livelihood. Such migrants, finding it difficult to afford accommodation in regular areas of cities tend to occupy space in unattended government land and existing slums adding more pressure on urban space. In the process rapid urbanization feeds to miseries and growth of slum population, particularly, in absence of adequate transformation of the cities in terms of availability of infrastructure and affordable accommodation.
In the developed countries, considerable effort has been put in place to fight the menace of slum. England passed the first legislation for building low-income housing to certain minimum standards in 1851 and laws for slum clearance were first enacted in 1868. In the U.S., laws concerning slum development with adequate ventilation, fire protection, and sanitation in urban housing were passed in the late 1800s. However, even today the developed countries also continue to face the problem.
Slums of Delhi
October 2011 Page 2
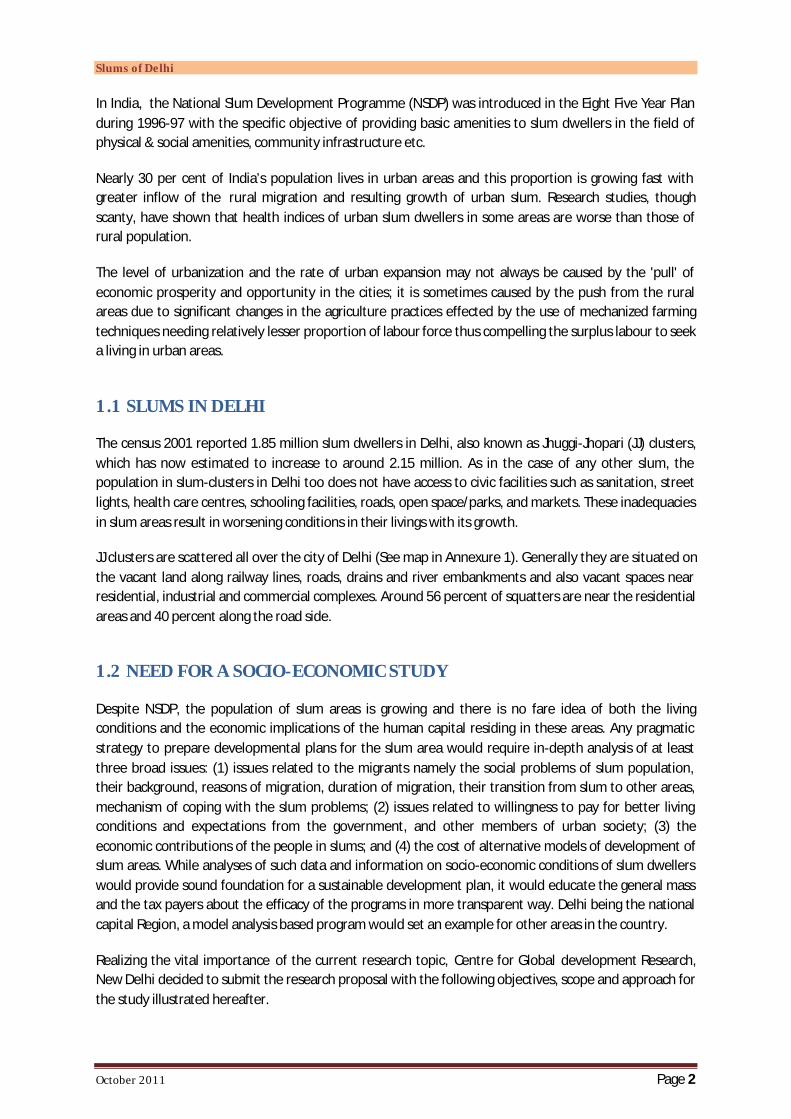
In India, the National Slum Development Programme (NSDP) was introduced in the Eight Five Year Plan during 1996-97 with the specific objective of providing basic amenities to slum dwellers in the field of physical & social amenities, community infrastructure etc.
Nearly 30 per cent of India’s population lives in urban areas and this proportion is growing fast with greater inflow of the rural migration and resulting growth of urban slum. Research studies, though scanty, have shown that health indices of urban slum dwellers in some areas are worse than those of rural population.
The level of urbanization and the rate of urban expansion may not always be caused by the 'pull' of economic prosperity and opportunity in the cities; it is sometimes caused by the push from the rural areas due to significant changes in the agriculture practices effected by the use of mechanized farming techniques needing relatively lesser proportion of labour force thus compelling the surplus labour to seek a living in urban areas.
1.1 SLUMS IN DELHI
The census 2001 reported 1.85 million slum dwellers in Delhi, also known as Jhuggi-Jhopari (JJ) clusters, which has now estimated to increase to around 2.15 million. As in the case of any other slum, the population in slum-clusters in Delhi too does not have access to civic facilities such as sanitation, street lights, health care centres, schooling facilities, roads, open space/parks, and markets. These inadequacies in slum areas result in worsening conditions in their livings with its growth.
JJ clusters are scattered all over the city of Delhi (See map in Annexure 1). Generally they are situated on the vacant land along railway lines, roads, drains and river embankments and also vacant spaces near residential, industrial and commercial complexes. Around 56 percent of squatters are near the residential areas and 40 percent along the road side.
1.2 NEED FOR A SOCIO-ECONOMIC STUDY
Despite NSDP, the population of slum areas is growing and there is no fare idea of both the living conditions and the economic implications of the human capital residing in these areas. Any pragmatic strategy to prepare developmental plans for the slum area would require in-depth analysis of at least three broad issues: (1) issues related to the migrants namely the social problems of slum population, their background, reasons of migration, duration of migration, their transition from slum to other areas, mechanism of coping with the slum problems; (2) issues related to willingness to pay for better living conditions and expectations from the government, and other members of urban society; (3) the economic contributions of the people in slums; and (4) the cost of alternative models of development of slum areas. While analyses of such data and information on socio-economic conditions of slum dwellers would provide sound foundation for a sustainable development plan, it would educate the general mass and the tax payers about the efficacy of the programs in more transparent way. Delhi being the national capital Region, a model analysis based program would set an example for other areas in the country.
Realizing the vital importance of the current research topic, Centre for Global development Research, New Delhi decided to submit the research proposal with the following objectives, scope and approach for the study illustrated hereafter.

INTRODUCTION
This document is intellectual property of Centre for Global Development Research Private Limited, New Delhi prepared with the help of SER Grant extended by the Planning Commission of India. No part of the document can be copied without a written permission of CGDR
Page 3
1.3 OBJECTIVES OF THE PROPOSED STUDY
While analyzing the data and information on socio-economic conditions of slum dwellers in selected localities of Delhi NCR, the principal objective of the proposed study is to prepare a framework of social cost benefit analysis to evaluate alternative strategies aimed at developing the India’s capital in to a World Class Model City free of slums.
Placed within this context, the present study is aimed at portraying a broad socio-economic profile of slum dwellers leading to a comprehensive social cost benefit analysis. It would analyze the costs associated with alternative strategies for rehabilitation of slum areas with adequate provisioning of pollution-free environment with basic amenities such as safe drinking water, health care facilities, electricity, sanitation, and work opportunities for displaced dwellers near their resettlements.
1.4 SCOPE OF THE PROPOSED STUDY
The scope of the proposed study would include explanation on the origin and creation, definition, character, theories of slums, historical conditions, demographic conditions in Delhi especially the growth of slums in Delhi during the last half centuries, the facilities provided by the local bodies and governments in slum areas of Delhi, policy for the development of slums, etc. There are approximately 319 katras in the walled city area with about 3000 buildings or properties. These areas are very old and notified as slums but do not resemble the state of slums found in other parts of Delhi outside the walled city. Therefore, such clusters are excluded from the scope of this study.
The study would assess the socio-economic status of slum dwellers by analyzing the available facilities including basic requirements of housing, drinking water, toilet facilities, sewerage system, drainage system, health and education facilities in slum areas.
An attempt shall be made to explain the absence of required level of infrastructure in the National Capital Territory of Delhi and the satisfaction level of various facilities enjoyed by the slum people in Delhi.
Finally, a framework to carry out comprehensive social cost benefit analysis of slum rehabilitation would be developed and presented for future study and analysis under alternative strategies with required facilities such as schools, health care centres, markets, electricity, drinking water, etc.
1.5 STRUCTURE OF THE REPORT
The entire report is structured in 14 Chapters including chapters on introduction and conclusions. The methodology of the study is primary survey through structured questionnaires and a detail discussion including sample description is presented in Chapter 2. To start the substantial part of the report, a detailed profile of 477 slum clusters covering about 4.34 lakh households is presented in Chapter 3. The

Slums of Delhi
October 2011 Page 4
profile discusses the growth of slums in Delhi, the slum level infrastructure, amenities and interventions by government and non-government organisations. The rest of the analysis is based in detailed data collected from 2024 households and listing data collected from 10123 households. Information about the people and their social structure, demographics, education and health related issues are discussed in Chapter 4. Housing Condition and Amenities inside the houses including kitchen, toilets and type of construction are presented in Chapter 5. Occupation and Means of Livelihood of slum dwellers is discussed in Chapter 6. The slum dwellers have made considerable investment for constructing their shelters and at times it appears that slum houses are also expensive. This issue is discussed in Chapter 7 on Cost of Dwelling Ownership. There are well causes of slum formation but the intensity of these causes may vary. In the case of Delhi Slums, the drivers are discussed in Chapter 8 on drivers of migration to slum life. The slum migrants have been able to improve their living conditions in several ways which is revealed through satisfaction based direct indications and indirect economic indicators. Such indicators are discussed in Chapter 9 on economic gains to slum migrants. It is also interesting to understand whether slum dwellers want to move out of the current location and whether there is any capacity to pay for resettlement. These questions are answered in Chapter 10 on willingness to move and willingness to pay for resettlement. There are a number of government plans to benefit slum life and some of these are discussed in Chapter 11 on government plans for slum. Slum rehabilitation is global problem and examples from elsewhere can provide important insight and help in designing a more sustainable system. Five such cases have been discussed in Chapter 12 on global case studies of slum rehabilitation. Based on the analysis in Chapters 3-12, Strategies of rehabilitation are discussed in Chapter 13 while key finding are presented in Chapter 14. Chapter 15 concludes with recommendations.

METHODOLOGY
This document is intellectual property of Centre for Global Development Research Private Limited, New Delhi prepared with the help of SER Grant extended by the Planning Commission of India. No part of the document can be copied without a written permission of CGDR.
Page 5
Chapter 2
Methodology
The study has two interlinked objectives. The first objective to understand the socioeconomic condition of slum dwellers in Delhi and the second part is to present the alternative forms of rehabilitation such that the leaving condition of people residing in slums could be improved. The secrets of trustworthy and authentic study results lie in the adoption of systematic approach, efficient planning and careful implementation of strategies through the use of best expertise. Literature review on slum rehabilitation and synthesis of such alternatives has been attempted to find out possibility frontiers for Delhi slums. The entire study expands over information collection from slums of Delhi, preparation of instruments for household survey, collection of primary data, translating the unit level qualitative response into quantitative data, data creation for analyses, interpreting the data/information into analytical structure and finally preparing reports presenting the findings from the survey to the clients. The methodology for the proposed study involves the secondary survey as well as on the primary survey.
2.1 SECONDARY SURVEY:
The secondary survey involve the collection of data and information from published literature, reports, write-ups, seminar and conference papers, census reports including the basic statistics available with Municipal Corporation Delhi (Slum Department), Delhi Development Authority (DDA), Government of NCT of Delhi, Union Ministry of Urban Development (GOI) and UNDP/UNESCO. The data and information procured from these sources is scanned and analyzed for correlations with primary survey data.
2.2 PRIMARY SURVEY:
The primary data and information is collected from the selected respondents and it comprised of containing socio-economic data on household identification, age group of family members, literacy standards of members of selected household, occupation, income and income sources, household expenditure, health problems, possession of assets, including crucial data and information related to problems, constraints and inadequacies faced by slum dwellers.
Slums of Delhi
October 2011 Page 6
Qualitative information and conclusive opinions related to alternative rehabilitation strategies and related problems are accumulated through literature survey, collection of case studies and discussions with officials directly responsible for the development of slums.
In addition to selected households, primary survey also focuses on views of community leaders and voluntary organizations, providers of existing services in the areas like dispensaries, consumer stores/shops and agencies for disposal of wastes and sanitations, etc.
2.2.1 Sampling and Sample Selection:
Given the limited resources, this study is based on two per cent of total number of slum clusters covering about 0.5 per cent of total households (4.34 lakh) living in slums spread over different location in Delhi NCR. Results of sample surveys are less accurate than the results obtained from the studies of entire population due to inevitable errors in sampling process, the size of the sample and multidimensional heterogeneity, which are difficult to control. The size of the sample is constrained by the resources as well as willingness of the respondents to share information. Random selection of samples produces minimum error. Therefore, attempts are made to randomise the sample selection process to reduce systematic biases. At the same time in a geographically dispersed area, it may be pragmatic to select samples from all the areas to give a minimum representation. However, attempt has been made to reach almost entire slum cluster of Delhi for creating a broad based region wise profile of slums. The following activities are involved in sampling process.
(1) Profile related data pertaining to 474 slum clusters spread across Delhi City area has been collected and computerized. These clusters capture approximately 4.34 lakh households residing in slums.
(2) Out of 474 slums clusters 65 clusters have been selected for surveying 2024 household. Sample selection of slums is based on geographical location, population in slums and the years of existence.
(3) In order to make random selection of 2024 households, about 10123 households have been listed.
(4) Detailed survey of 2024 households has been done and the complete list of the slum clusters surveyed is attached at Annexure-II.
SLUM LISTING: ENUMERATION OF SLUMS THROUGH LISTING SHEET BY VISITS EACH WARD
Personal visits were made by experienced and qualified Investigators to locate the Slums through information gathered from official, unofficial and enquiry on the spot in a structured listing sheet containing certain basic information like name and address of the slum with land mark, number of households, year of slum settlement from other place, place from where shifted and so on. This led to a Census or enumeration of all slums currently existing at in Delhi during the period. In all 477 Slums have been identified in 5 zones comprising of 4.33 Households with reported population of 21.60 lakh.

METHODOLOGY
This document is intellectual property of Centre for Global Development Research Private Limited, New Delhi prepared with the help of SER Grant extended by the Planning Commission of India. No part of the document can be copied without a written permission of CGDR.
Page 7
SLUM PROFILE:
The Profile of all listed 474 slums were canvassed in a structured questionnaire containing information spread over 5 sections viz. demography; infrastructure and facilities; amenities and services; problems encountered total population and government intervention.
SELECTION OF SAMPLE CLUSTERS:
In order to make the sample representative in terms of available parameters 474 slums were arranged and stratified in (1) five Zones: Central, East, North, South and West; (2) year of their establishment: 1900-1947, 1948-1970, 1971-1990, 1991-2008; and (3) household population range: 0-100, 101-1000, 1001-5000, 5,001-10,000, 10,000 and above. This gives 100 possible sets to choose a slum from each of them. However, our sample households are limited to about 2000 which are to be chosen in proportion to the population with a minimum sample size of 2. Applying this constraint the number of stratum had to be collapsed to 65. Thus, from 65 striatum 65 slums have been selected.
SELECTION OF SAMPLE SIZE FOR HOUSEHOLD CANVASSING OF HOUSEHOLD SCHEDULE:
Once sample slums have been selected, the household sample size has been drawn in proportion to the population of the respective stratum such that the total households sum to 2024.
HOUSEHOLD SELECTION AND HOUSEHOLD SURVEY:
Random selection of household has been done following listing of 10,120 households spread over 65 slums in proportion to the sample size of the households. While carrying out listing, houses have been selected randomly from all directions of the slum. Thus an even representation of households is ensured. The actual numbers may vary in plus minus 5.
2.2.2 Sample Description
Table 2.1 presents the distribution of 477 slums obtained through enumeration of all slums (as far as possible) and 65 Sample Slums selected for conducting the Household survey. Table 2.1 also presents the distribution of estimated 433738 households obtained from interview based listing, and 10123 households listed from the selected sample slums for sample selection and 2024 sample households selected for Household survey.
The distribution of 477 identified Slums by Zone is presented in Table 2.2. From the ranking of the slums by numbers, it is found that maximum number of Slums numbering 133 (27.88 per cent) is located in the West Zone, followed by South 128 (26.83 per cent), 87 in East (18.24 per cent), 68 (14.26) in North and 61 (12.79) in Central.

Slums of Delhi
October 2011 Page 8
TABLE 2.1: TOTAL NUMBER OF ALL IDENTIFIED SLUMS, SLUMS SELECTED, TOTAL NUMBER OF REPORTED HOUSEHOLDS, LISTING OF 10123 HOUSEHOLDS AND NUMBER OF SELECTED SAMPLE HOUSEHOLDS Sl. No.
Zone Total Slums Identified through personal visits
Number of Sample Slums for HH Survey
Total number of Households reported in Slum Profile
Households listed for Sample survey
Number of HHs Selected for HH survey
Percentage of Selected sample Slums to total slums identified
Percentage of sample households listed out of total reported number of HHs
Percentage of Sample Households to total HHs Listed
(1) (2) (4) (5) (7) (2/1) (5/4) (7/5) 1 Centra
l 61 6 23662 594 119 9.38 2.51 20.03
2 East 87 20 85408 2029 405 23.26 2.38 19.96 3 North 68 6 79128 1930 386 9.09 2.44 20.00 4 South 128 16 140164 3465 693 12.60 2.47 20.00 5 West 133 17 105376 2105 421 12.98 2.00 20.00 All 477 65 433738 10123 2024 13.71 2.33 19.99 Source: CGDR research
TABLE 2.2: DISTRIBUTION OF SLUMS BY ZONE Sl. No.
Zone Number of slums cluster identified through personal visits
Distribution of slums across zones
Rank of zone by number of slums
1 Central 61 12.79 5 2 East 87 18.24 3 3 North 68 14.26 4 4 South 128 26.83 2 5 West 133 27.88 1 All 477 100.00 ---- Source: CGDR research
The details of all the 65 slums taken as sample are presented in Annexure-II.

DELHI SLUM CLUSTERS: A PROFILE
This document is intellectual property of Centre for Global Development Research Private Limited, New Delhi prepared with the help of SER Grant extended by the Planning Commission of India. No part of the document can be copied without a written permission of CGDR.
Page 9
Chapter 3
Delhi Slum Clusters: A Profile Locating slum clusters and collecting general information about the population living in such slums is the first and important exercise in this study where community leaders and physical observation has been important source for data generation besides household surveys. Thus, the discussion in this chapter is based on general interaction with slum heads, community leaders, and physical observations by the researchers.
3.1 GROWTH OF SLUMS IN DELHI
As per Census 2001, Delhi State had 4.20 lack Jhuggi Households with a population of 21.5 lakh (Figure 3.1 and Table 3.1). This means during 2001 16.88 per cent of the Delhi population lived in slums. But this is an improvement over 1997 status when more than a quarter populations lived in slums. The situation appears to have improved over time in terms of percentage of population living in slums. The estimates of the current study indicate that the share of population living in slums has come down to 14.46 per cent of about 15.3 million strong populations even though the absolute number of people living in slums has increased to 22.14 lakh.
As per the present survey, the number of Jhuggi households is estimated at 4.34 lakh with a population of 22.14 lakh. These figures have been arrived at based on structured interviews of slum head and leaders of various social groups and religion from 477 slums clusters, detailed listing of 10,124 sample households and comprehensive survey of 2024 households. As discussed earlier 477 slum clusters have been located by physical verification of each locality in Delhi and are approximately equivalent to 860 JJ clusters reported by the MCD. The total numbers of JJ households come out approximately similar in both cases. As per Municipal Corporation of Delhi (MCD) records there were in all 860 JJ Clusters in Delhi during 2001 census. This has been arrived on the basis of the Slums demarcated by 9 land owning agencies like DDA; Railways; L&DO & CPWD; NDMC; MCD; Slum & JJ Department, MCD; Gram Sabha; Cantonment Area, Others (PWD, I&F), P&T, Delhi Govt and Central Government Agencies. On the other hand, the present survey, focussed on land ownership in terms of government owned or private owned due to constraints of identification. It may be noted that during 2001– 10 several Jhuggi clusters have been demolished, rehabilitated / relocated while at the same time, some new juggles have come up. However, the listing of Jhuggi clusters indicates a net increase of 3 per cent over 2001.

Slums of Delhi
October 2011 Page 10
FIGURE 3.1: GROWTH OF SLUM POPULATION IN DELHI WITH RESPECT TO ITS TOTAL POPULATION
TABLE 3.1: NUMBER OF JHUGGI HOUSEHOLDS, POPULATION AND GROWTH RATE Sl. No.
Year Jhuggi HHS (Lakh)
Slum Population (Lakh)
Total Population (lakh)
Share of Delhi Population living in slums (per cent)
Jhuggi HHS (CAGR)
Growth in Population of Delhi (CAGR)
1 1951 0.1 0.6 14.4 4.4 2 1973 1.0 4.9 40.1 12.3 11.0 10.0 3 1983 1.1 5.7 61.7 9.2 1.0 1.5 4 1990 2.6 13.0 81.1 16.0 13.1 12.5 5 1997 6.0 30.0 108.5 27.6 12.7 12.7 6 2001 4.3 21.5 127.4 16.9 ‐8.0 ‐8.0 7 2010 4.4 21.6 153.1 14.1 0.1 0.3 (Source: (1) Slum Department, Municipal Corporation of Delhi (Figures from 1951 to 2001); (2) CGDR Survey 2010 & Research
The Status of Jhuggi HHs and Population from 1951 to 2010 presented in Table 3.1 indicate that number of slums increased steadily from o.13 lakh in 1951 to 6 lakh in 1997. The maximum number of increase was witnessed during 1990‐1997 when net increase in JJ Households touched 3.4 lack and slum population increased by hopping 17 lakh. Thereafter, the number of reported slum households declined to 4.3 lakh and remained more or less the same at 4.34 lakh in 2010 as per the slum census conducted by CGDR. The compound annual average growth rate per annum in slums was reported as the highest in the year 1990 over 1983 at 12.58 percent and again 12.75 per cent per annum in 1997 over the year 1990. The share of slum population to total population of Delhi in 1951 was 4.60 per cent the same increased to 15.57 per cent in 2001 and slightly declined to 14.27 per cent in 2010.
1951 1973 1983 1990 1997 2001 2010
Share of Slum Population (per cent) 4.17 12.22 9.24 16.03 27.65 16.88 14.46
Slum Population (Lakhs) 0.6 4.9 5.7 13 30 21.5 22.14
Total Populataion (Lakh) 14.4 40.1 61.7 81.1 108.5 127.4 153.1
0
20
40
60
80
100
120
140
160
180

DELHI SLUM CLUSTERS: A PROFILE
This document is intellectual property of Centre for Global Development Research Private Limited, New Delhi prepared with the help of SER Grant extended by the Planning Commission of India. No part of the document can be copied without a written permission of CGDR.
Page 11
3.1.1 Distribution of existing slum clusters and slum population across regions of Delhi
The distribution of 477 identified Slum clusters by Zone is presented in Table 3.2. From the ranking of the slums by numbers, it is found that maximum number of Slums numbering 133 (27.88 per cent) is located in the western Zone, followed by southern Zone 128 (26.83 per cent), 87 in East (18.24 per cent), 68 (14.26 per cent) in North and 61 (12.79) in Central Delhi. An exhaustive list of all slums with certain basic information gathered through canvassing o f a listing sheet is provided in Annexure 3.1.
TABLE 3.2: DISTRIBUTION OF CURRENT SLUMS AND SLUM POPULATION BY ZONE Region Slums Slum HHs Slum Population Rank
Number Share (per cent)
Number Share (per cent)
Number Share (per cent)
By Slums By Slum HHs
By Slum Population
Central 61 12.8 23662 5.5 126742 5.9 5 5 5 East 87 18.2 85408 19.7 410065 19.0 3 3 3 North 68 14.3 79128 18.2 361585 16.7 4 4 4 South 128 26.8 140164 32.3 713119 33.0 2 1 1 West 133 27.9 105376 24.3 551090 25.5 1 2 2 Total 477 100.0 433738 100.0 2162601 100.0 Source: CGDR research
3.1.2 Growth of existing slum clusters across regions of Delhi over time
Distribution of Slums by year of Establishment is presented in Table 3.3 and Figures 3.2 to 3.3. Out of 477 Slums identified, 382 (about 80 per cent) are those which came up during the period 1972 to 1991; 11.32 per cent slums came up during 1948‐71, and 4.61 per cent during 1992‐2008. Nineteen slums (4.01 per cent) came up prior to independence during the period 1990 to 1947. Out of these 19 slums, 14 are located in the Central zone. The list of Slums with slum name, locality and year which came up during 1900 to 1947 is presented in Annexure 3.2. Some of these slums are more than 90 years old. Since then, several Jhuggi Clusters which came up much after independence were rehabilitated in resettlement colonies but nothing happened to these old landmarks.

Slums of Delhi
October 2011 Page 12
Table 3.3: dynamics of distribution of existing slums and slum population across regions and time horizon Period Slums Slum HHs
Central East North South West Total Central East North South West TotalDistribution across time period for each region
1922‐1931 0.00 0.00 1.47 0.00 0.00 0.21 0.00 0.00 0.25 0.00 0.00 0.001932‐1941 14.75 0.00 1.47 0.00 1.50 2.52 1.34 0.00 6.32 0.00 3.33 14.751942‐1951 11.48 0.00 2.94 0.78 0.75 2.31 3.96 0.00 4.68 0.42 0.14 11.481952‐1961 1.64 3.45 7.35 3.13 2.26 3.35 8.45 5.30 1.76 3.64 7.56 1.641962‐1971 11.48 6.90 4.41 7.81 5.26 6.92 15.59 18.46 1.45 6.35 7.73 11.481972‐1981 39.34 44.83 39.71 48.44 45.11 44.44 43.14 44.24 56.34 45.18 35.29 39.341982‐1991 18.03 42.53 32.35 38.28 38.35 35.64 14.73 30.76 18.63 44.09 37.94 18.031992‐2001 3.28 2.30 8.82 0.78 6.02 3.98 12.78 1.23 10.55 0.21 7.98 3.282002‐2011 0.00 0.00 1.47 0.78 0.75 0.63 0.00 0.00 0.03 0.11 0.02 0.00 100 100 100 100 100 100 100 100 100 100 100 100
Distribution across regions for each period1922‐1931 0.00 0.00 100.00 0.00 0.00 100 0.00 0.00 100.00 0.00 0.00 0.001932‐1941 75.00 0.00 8.33 0.00 16.67 100 3.60 0.00 56.63 0.00 39.77 75.001942‐1951 63.64 0.00 18.18 9.09 9.09 100 17.43 0.00 68.84 10.94 2.79 63.641952‐1961 6.25 18.75 31.25 25.00 18.75 100 9.53 21.58 6.65 24.30 37.94 6.251962‐1971 21.21 18.18 9.09 30.30 21.21 100 9.80 41.88 3.05 23.64 21.63 21.211972‐1981 11.32 18.40 12.74 29.25 28.30 100 5.29 19.57 23.09 32.80 19.26 11.321982‐1991 6.47 21.76 12.94 28.82 30.00 100 2.38 17.96 10.08 42.25 27.33 6.471992‐2001 10.53 10.53 31.58 5.26 42.11 100 14.31 4.97 39.49 1.42 39.81 10.532002‐2011 0.00 0.00 33.33 33.33 33.33 100 0.00 0.00 10.26 76.92 12.82 0.00
Source: CGDR research
It may be noted that the time period indicated in Table 3.3 and Figures 3.2 & 3.3 show the period in which these slum clusters came into existence but the number of households are the value of current status. Thus, a comparison of Figure 3.2 and Figure 3.3 would tell the way slum clusters have grown in number and household population during each period. Clearly, during the peak period of 1972‐91, household population in west increased from 37185 to 39984 even while number of slums has fallen from 60 to 51. Clearly, it appears people have moved from demolished slum clusters to other clusters particularly in western region or alternatively, slums in western region have attracted more residents during this period as compared to other regions.
Slum clusters in southern region appear to have saturated and there is hardly any net addition neither in terms of number of slum clusters nor in terms of households. Nevertheless, southern region remain home of most slum dwellers with more than 33 per cent share (Table 3.2).
Out of 4.9 per cent slums which came in existence during 1992‐2001, about 39.5 per cent occupied space in northern zone, 39.8 per cent in eastern zones, and 14.3 per cent in central zone. However, more recently during 2002‐2011 very few slums have appeared and 76.9 per cent of them occupied space in southern zone. Recent past has witnessed appearance of newer slum in central, eastern and western zone where

DELHI SLUM CLUSTERS: A PROFILE
This document is intellectual property of Centre for Global Development Research Private Limited, New Delhi prepared with the help of SER Grant extended by the Planning Commission of India. No part of the document can be copied without a written permission of CGDR.
Page 13
FIGURE 3.2: GROWTH OF EXISTING SLUM CLUSTERS BY NUMBER ACROSS REGIONS OF DELHI OVER TIME
Source: CGDR research
FIGURE 3.3: GROWTH OF EXISTING SLUM SIZE BY NUMBER OF HOUSEHOLDSACROSS REGIONS OF DELHI OVER TIME
Source: CGDR research
1922‐1931 1932‐1941 1942‐1951 1952‐1961 1962‐1971 1972‐1981 1982‐1991 1992‐2001 2002‐2011
Central 9 7 1 7 24 11 2
East 3 6 39 37 2
North 1 1 2 5 3 27 22 6 1
South 1 4 10 62 49 1 1
West 2 1 3 7 60 51 8 1
Total 1 12 11 16 33 212 170 19 3
0
50
100
150
200
250
1922‐1931 1932‐1941 1942‐1951 1952‐1961 1962‐1971 1972‐1981 1982‐1991 1992‐2001 2002‐2011
Central 318 937 2000 3690 10207 3485 3025
East 4530 15767 37787 26274 1050
North 200 5000 3700 1396 1150 44578 14738 8346 20
South 588 5100 8900 63330 61796 300 150
West 3511 150 7965 8144 37185 39984 8412 25
Total 200 8829 5375 20991 37651 193087 146277 21133 195
0
50000
100000
150000
200000
250000
Slums of Delhi
October 2011 Page 14
3.2 ECONOMIC VALUE OF SLUM CLUSTERS
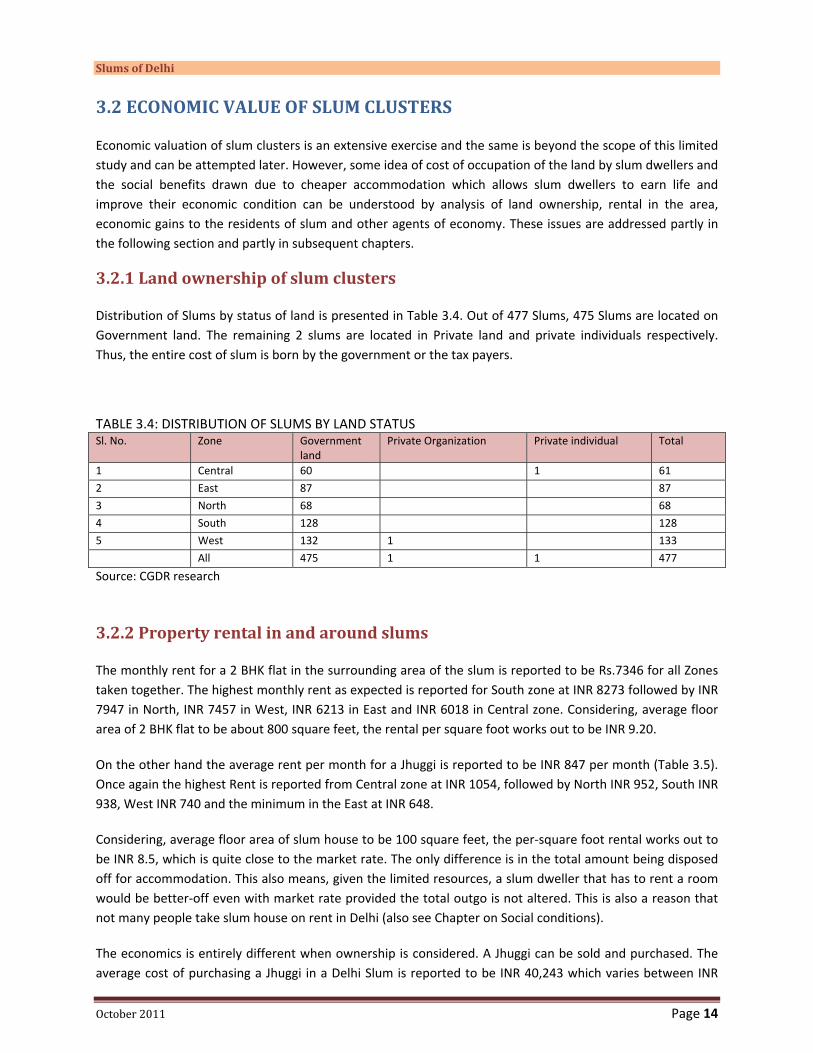
Economic valuation of slum clusters is an extensive exercise and the same is beyond the scope of this limited study and can be attempted later. However, some idea of cost of occupation of the land by slum dwellers and the social benefits drawn due to cheaper accommodation which allows slum dwellers to earn life and improve their economic condition can be understood by analysis of land ownership, rental in the area, economic gains to the residents of slum and other agents of economy. These issues are addressed partly in the following section and partly in subsequent chapters.
3.2.1 Land ownership of slum clusters
Distribution of Slums by status of land is presented in Table 3.4. Out of 477 Slums, 475 Slums are located on Government land. The remaining 2 slums are located in Private land and private individuals respectively. Thus, the entire cost of slum is born by the government or the tax payers.
TABLE 3.4: DISTRIBUTION OF SLUMS BY LAND STATUS Sl. No. Zone Government
land Private Organization Private individual Total
1 Central 60 1 61
2 East 87 87
3 North 68 68
4 South 128 128
5 West 132 1 133
All 475 1 1 477
Source: CGDR research
3.2.2 Property rental in and around slums
The monthly rent for a 2 BHK flat in the surrounding area of the slum is reported to be Rs.7346 for all Zones taken together. The highest monthly rent as expected is reported for South zone at INR 8273 followed by INR 7947 in North, INR 7457 in West, INR 6213 in East and INR 6018 in Central zone. Considering, average floor area of 2 BHK flat to be about 800 square feet, the rental per square foot works out to be INR 9.20.
On the other hand the average rent per month for a Jhuggi is reported to be INR 847 per month (Table 3.5). Once again the highest Rent is reported from Central zone at INR 1054, followed by North INR 952, South INR 938, West INR 740 and the minimum in the East at INR 648.
Considering, average floor area of slum house to be 100 square feet, the per‐square foot rental works out to be INR 8.5, which is quite close to the market rate. The only difference is in the total amount being disposed off for accommodation. This also means, given the limited resources, a slum dweller that has to rent a room would be better‐off even with market rate provided the total outgo is not altered. This is also a reason that not many people take slum house on rent in Delhi (also see Chapter on Social conditions).
The economics is entirely different when ownership is considered. A Jhuggi can be sold and purchased. The average cost of purchasing a Jhuggi in a Delhi Slum is reported to be INR 40,243 which varies between INR

DELHI SLUM CLUSTERS: A PROFILE
This document is intellectual property of Centre for Global Development Research Private Limited, New Delhi prepared with the help of SER Grant extended by the Planning Commission of India. No part of the document can be copied without a written permission of CGDR.
Page 15
48279 to INR 28496 in five zones. The maximum is in the Central zone INR 48279 followed by North INR 44603; South INR 44109; and East 43471 respectively. In the West zone, it is reported to be the lowest at INR 28435. Considering, again average floor area of slum house to be 100 square feet, the per square foot cost of owning works out to be about INR 400, which is extremely cheap by any standards for Delhi.
Above analysis indicates the average outer limit of expenditure a slum dweller would be interested to incur on owning a shelter, and still survive with the current state of livelihood in Delhi. Such outer limit varies with the locality of slum clusters in the range of about INR 285 per square foot to about INR 483 per square foot.
In addition the localities of slums command huge property prices, which is anywhere in the range of INR 7000 per square feet to INR 90000 per square feet. Thus, the lands occupied by slum dwellers can fetch such a value that any market based plan of developing slums in to attractive residential cum market complex could be attractive and the same can be implemented out through open bit process.
TABLE 3.5: AVERAGE COST (INR ) OF PURCHASING ONE ROOM IN SLUM; AVERAGE RENT (INR)FOR ONE ROOM IN SLUM & AVERAGE RENT (INR) OF 2 BHK IN THE SURROUNDING SLUM LOCALITY Sl. No. Zone Cost of 1 Room in
Slum Rent for 1 Room in Slum
Rent for 2 BHK in surrounding Area (INR)
Average Property price (INR/Sq Ft)
1 Central 48279 1054 6018 50948 2 East 43471 648 6213 7624 3 North 44603 952 7947 59000 4 South 44109 938 8273 36922 5 West 28496 740 7457 16007 All 40243 847 7346 30914 Source: CGDR research
3.3 IFRASTRUCTURE FACILITIES IN SLUM CLUSTERS
It is clear from the foregoing discussion, a large part of Delhi lives in slum clusters and any effort by the government to improve the living condition in Delhi cannot complete unless proper care is taken of such population. It is also an irony that the government first allows such slums to occupy space, expand and then give legitimate identification of domicile to the residents. With proper domicile, the slum dwellers become integral part of democratic process and through their voting rights they start commanding bargaining power with political parties and local government. The political protection and development of the area is natural corollary. However, this does not mean that all slum clusters are equally fortunate in obtaining the facility. A comparative analysis of infrastructure facilities inside slum clusters across regions of Delhi is discussed below.

Slums of Delhi
October 2011 Page 16
3.3.1 Roads
The lanes of slum clusters have all kinds of structure, from cement concrete road to just kutcha road. Distribution of slum roads by type of construction is presented in Table 3.6. Out of 477 slums, 244 (51.15 per cent) slums have roads of mixed type, which includes cement concrete road, and bitumen road and kutcha roads. 31.24 per cent of slums clusters have cement concreter roads; and 13.00 per cent slums have metal roads and 1.47 per cents have both metal and cemented roads. Only about 3.14 per cent slum clusters have kutcha roads.
Clearly, the quality of roads inside slums is not too bad. The highest share of kutcha roads is 6.56 per cent in central region and a little investment could improve the road condition in the left out slums as well.
TABLE 3.6: DISTRIBUTION OF SLUM ROADS BY TYPE OF CONSTRUCTION Sl. No. Zone Metal Cement concrete Kutcha Both metal and cemented Mixed All Total 1 Central 21.31 19.67 6.56 4.92 47.54 100.00 2 East 14.94 66.67 3.45 0.00 14.94 100.00 3 North 7.35 25.00 1.47 1.47 64.71 100.00 4 South 21.09 40.63 3.13 0.00 35.16 100.00 5 West 3.01 7.52 2.26 2.26 84.96 100.00 Total 13.00 31.24 3.14 1.47 51.15 100.00 Source: CGDR research
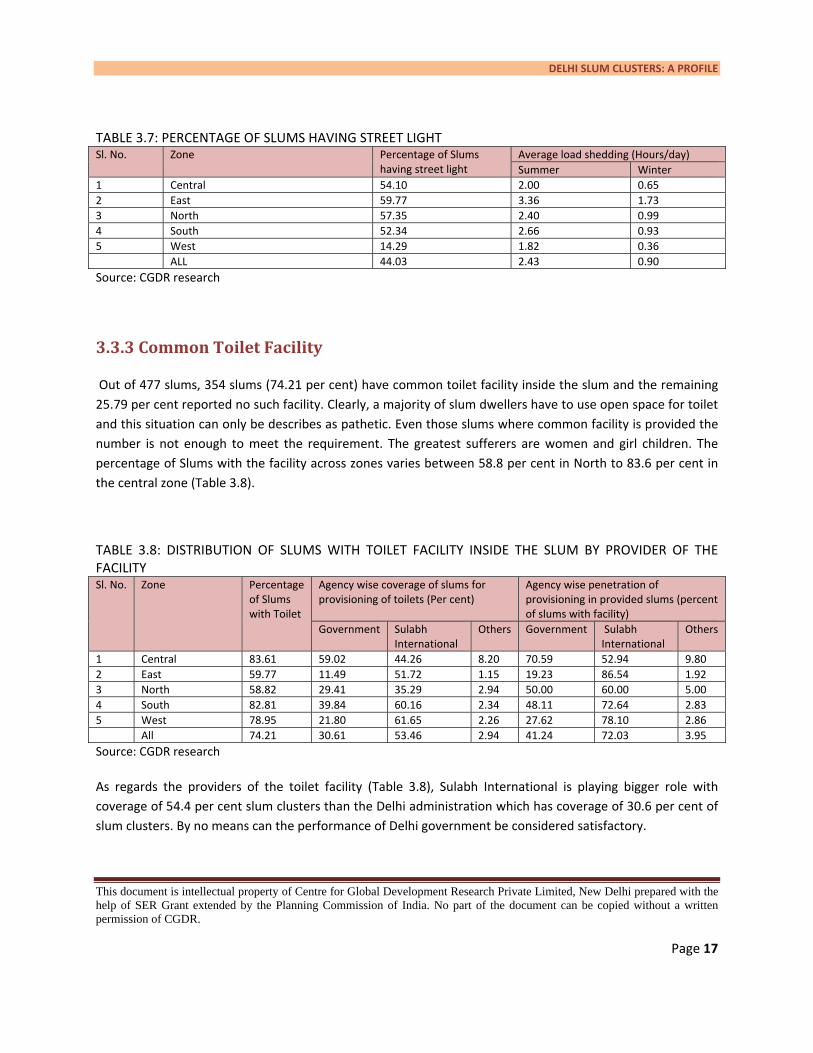
3.3.2 Street Light
It is well known fact that Poor Street Light or absence of street light is one of the important facilitator of criminal activities inside slums. Status of slum clusters with respect to street lighting is presented in Table 3.7. Out of 477 slums, only 44 percent have street lighting inside the slum and the remaining 56 per cent reported no street lighting. Across regions, the percentage varies from 59.9 per cent in eastern region to 14 per cent in western region of Delhi.
Thus, there is considerable scope of improvement in providing street light in slum clusters and different models of their upkeep can be tried including community participation.
The extent of load shedding during summer and winter is reasonable across all regions of Delhi slums and it compares well with general condition in Delhi. The average number of hours of load shedding during summer and winter by zone is also presented in Table 3.7. In the overall, the average hours of load shedding in a slum is reported be 2.43 during summer and 0.90 in winter. The maximum 3.36 hours of load shedding was reported from slums in East Delhi and minimum of 1.82 hours in West Delhi during summer. During winter, maximum 1.73 hrs load shedding was again reported from East Zone and minimum 0.36 hours from West Zone.
DELHI SLUM CLUSTERS: A PROFILE
This document is intellectual property of Centre for Global Development Research Private Limited, New Delhi prepared with the help of SER Grant extended by the Planning Commission of India. No part of the document can be copied without a written permission of CGDR.
Page 17
TABLE 3.7: PERCENTAGE OF SLUMS HAVING STREET LIGHT Sl. No. Zone Percentage of Slums
having street light Average load shedding (Hours/day) Summer Winter
1 Central 54.10 2.00 0.65 2 East 59.77 3.36 1.73 3 North 57.35 2.40 0.99 4 South 52.34 2.66 0.93 5 West 14.29 1.82 0.36 ALL 44.03 2.43 0.90 Source: CGDR research
3.3.3 Common Toilet Facility
Out of 477 slums, 354 slums (74.21 per cent) have common toilet facility inside the slum and the remaining 25.79 per cent reported no such facility. Clearly, a majority of slum dwellers have to use open space for toilet and this situation can only be describes as pathetic. Even those slums where common facility is provided the number is not enough to meet the requirement. The greatest sufferers are women and girl children. The percentage of Slums with the facility across zones varies between 58.8 per cent in North to 83.6 per cent in the central zone (Table 3.8).
TABLE 3.8: DISTRIBUTION OF SLUMS WITH TOILET FACILITY INSIDE THE SLUM BY PROVIDER OF THE FACILITY Sl. No.
Zone
Percentage of Slums with Toilet
Agency wise coverage of slums for provisioning of toilets (Per cent)
Agency wise penetration of provisioning in provided slums (percent of slums with facility)
Government Sulabh International
Others Government Sulabh International
Others
1 Central 83.61 59.02 44.26 8.20 70.59 52.94 9.80 2 East 59.77 11.49 51.72 1.15 19.23 86.54 1.92 3 North 58.82 29.41 35.29 2.94 50.00 60.00 5.00 4 South 82.81 39.84 60.16 2.34 48.11 72.64 2.83 5 West 78.95 21.80 61.65 2.26 27.62 78.10 2.86 All 74.21 30.61 53.46 2.94 41.24 72.03 3.95 Source: CGDR research
As regards the providers of the toilet facility (Table 3.8), Sulabh International is playing bigger role with coverage of 54.4 per cent slum clusters than the Delhi administration which has coverage of 30.6 per cent of slum clusters. By no means can the performance of Delhi government be considered satisfactory.

Slums of Delhi
October 2011 Page 18
Across zones, Delhi administration is more active in central where it has covered 59.0 per cent of slums and least active in eastern zone where common toilets provided by it is just about 11.5 per cent. On the other hand Sulabh International has more equitable presence across all regions.
3.3.4 Drinking Water
Provisioning of safe drinking water is one of the most important duties of the government. Table 3.9 presents status of slums with drinking water facility. Out of 477 slums, 455 slums (95.39 per cent) have one or the other provision of drinking water and only 4.61 per cent reported not having any such facility. People in such slums clusters manage from adjacent localities. However, the provisioning of running drinking water is through common or share taps and there is no provision of household level supply.
The distribution of slum clusters by source of water supply is also presented in table 3.9. In the overall, Delhi Jal Board is the main supplier of water and it has laid pipelines in 83.65 slum clusters, while 8.39 per cent slum clusters are provided water through water tankers. 9.22 per cent slum clusters have private tube well and 5.87 per cent have public tube wells.
TABLE 3.9: PERCENTAGE OF SLUMS HAVING ACCESS TO DRINKING WATER BY PROVIDER Sl. No.
Zone Percentage of slums having water supply
Agency wise coverage of slums for provisioning of Drinking waters (Per cent)
Agency wise penetration of provisioning in provided slums (percent of slums with facility)
DJB Pipeline
DJB Tanker
Tube well (Private)
Tube well (Public)
DJB Pipeline
DJB Tanker
Tube well (Private)
Tube well (Public)
1 Central 93.44 88.52 6.56 4.92 3.28 94.74 7.02 5.26 3.51 2 East 95.40 83.91 5.75 13.79 4.60 87.95 6.02 14.46 4.82 3 North 92.65 89.71 4.41 7.35 4.41 96.83 4.76 7.94 4.76 4 South 98.44 78.13 16.41 15.63 10.16 79.37 16.67 15.87 10.32 5 West 94.74 83.46 5.26 3.01 4.51 88.10 5.56 3.17 4.76 Total 95.39 83.65 8.39 9.22 5.87 87.69 8.79 9.67 6.15 Source: CGDR research
REGULARITY OF SUPPLY OF DRINKING WATER
Another important issue with provisioning of drinking water is the regularity with which it is made available. Out of 477 slums, only 211 (44.23 per cent) reported regular supply. The maximum number of slums reporting irregular supply varies between 66.92 per cent in West to 36.78 per cent in East Zone (Table 3.10).
Only about 14.29 slum clusters have reported three times water supply in 24 hours; in 76.69 per cent of the slum clusters water supply is reported to be two times in 24 hours; and 3.38 per cent slum clusters get water only once a day. About 1.88 per cent slums get water alternate day and 2.63 uncertain about the arrival of water.
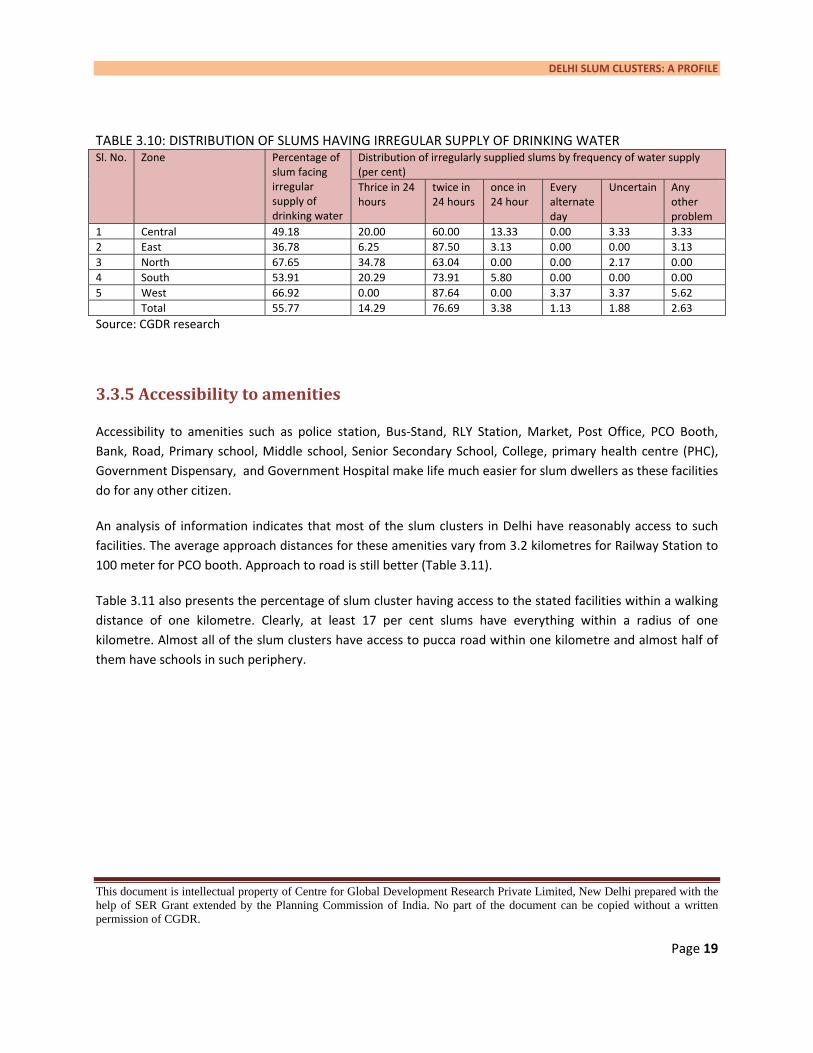
DELHI SLUM CLUSTERS: A PROFILE
This document is intellectual property of Centre for Global Development Research Private Limited, New Delhi prepared with the help of SER Grant extended by the Planning Commission of India. No part of the document can be copied without a written permission of CGDR.
Page 19
TABLE 3.10: DISTRIBUTION OF SLUMS HAVING IRREGULAR SUPPLY OF DRINKING WATER Sl. No.
Zone
Percentage of slum facing irregular supply of drinking water
Distribution of irregularly supplied slums by frequency of water supply (per cent) Thrice in 24 hours
twice in 24 hours
once in 24 hour
Every alternate day
Uncertain Any other problem
1 Central 49.18 20.00 60.00 13.33 0.00 3.33 3.33 2 East 36.78 6.25 87.50 3.13 0.00 0.00 3.13 3 North 67.65 34.78 63.04 0.00 0.00 2.17 0.00 4 South 53.91 20.29 73.91 5.80 0.00 0.00 0.00 5 West 66.92 0.00 87.64 0.00 3.37 3.37 5.62 Total 55.77 14.29 76.69 3.38 1.13 1.88 2.63 Source: CGDR research
3.3.5 Accessibility to amenities
Accessibility to amenities such as police station, Bus‐Stand, RLY Station, Market, Post Office, PCO Booth, Bank, Road, Primary school, Middle school, Senior Secondary School, College, primary health centre (PHC), Government Dispensary, and Government Hospital make life much easier for slum dwellers as these facilities do for any other citizen.
An analysis of information indicates that most of the slum clusters in Delhi have reasonably access to such facilities. The average approach distances for these amenities vary from 3.2 kilometres for Railway Station to 100 meter for PCO booth. Approach to road is still better (Table 3.11).
Table 3.11 also presents the percentage of slum cluster having access to the stated facilities within a walking distance of one kilometre. Clearly, at least 17 per cent slums have everything within a radius of one kilometre. Almost all of the slum clusters have access to pucca road within one kilometre and almost half of them have schools in such periphery.

Slums of Delhi
October 2011 Page 20
TABLE 3.11: AVERAGE DISTANCE OF AMENITIES, INFRASTRUCTURE AND SERVICES FROM THE SLUM Facility Average Distance (kilometre) of Amenities,
Infrastructure and services from the Slum Percentage of slum having amenities within one Km
Central East North South West All Central East North South West All Police Station 1.3 1.1 1.1 1.4 1.2 1.3 16.4 49.4 27.9 32 22.6 30.0 Bus‐Stand 0.5 0.4 0.9 0.5 1 0.7 83.6 81.6 66.2 76.6 41.4 67.1 RLY Station 1.2 4.5 3.6 2.9 3.3 3.2 34.4 10.3 17.7 39.1 21.8 25.4 Nearest town 1.1 1 0.8 1.3 1 1.1 34.4 60.9 57.4 30.5 27.8 39.6 Post Office 1.1 1.2 1.1 1.4 0.7 1.1 34.4 54 30.9 30.5 59.4 43.4 PCO Booth 0.1 0.2 0.0 0.0 0.0 0.1 98.4 93.1 100 98.4 100 98.1 Bank 0.9 1.2 1.2 1.5 0.8 1.1 41 52.9 30.9 35.2 45.1 41.3 Kutcha Road 0.0 0.0 0.0 0.0 0.0 0.0 98.4 100 100 99.2 100 99.6 Pucca Road 0.1 0.0 0.0 0.1 0.0 0.0 98.4 100 100 99.2 99.3 99.4 Prmy school 1 1.2 1.1 1.3 0.7 1.1 34.4 55.2 38.2 39.1 66.9 49.1 Middle school 1 1.4 1.1 1.5 0.8 1.2 32.8 47.1 38.2 38.3 66.2 47.0 S. Sec School 1.3 1.5 1.3 1.7 0.8 1.3 24.6 44.8 38.2 35.9 65.4 44.7 College 2.2 3.5 3.2 3.1 2.5 2.9 21.3 6.9 14.7 28.1 15 17.8 PHC Centre 1.1 0.4 1.1 0.7 0.9 0.8 29.5 83.9 26.5 58.6 36.8 48.9 Govt. Dispensary 1.2 1.3 1.2 1.5 0.9 1.2 29.5 49.4 19.1 31.3 36.1 34.0 Govt. Hospital 2.5 2.4 2.9 3.1 1.5 2.4 21.3 17.2 7.4 26.6 12.8 17.6 Source: CGDR research
3.4 SANITATION AND WASTE DISPOSAL
Proper system of cleaning roads, disposal of garbage and waste water is an essential facility required for maintaining hygienic condition of residents. In absence of such facilities several problems detrimental to health conditions of residents arise including water logging, smell, mosquitoes, and insects. Therefore an attempt is made to present conditions of slum clusters with respect to sanitation and waste disposal.
3.4.1 Sanitation: Cleaning and sweeping
Distribution of households by regular visits by MCD Sweepers for cleaning and picking up garbage from the slum is presented in Table 3.12. Out of 477 Slum clusters, only about 43.61 per cent reported regular visit by MCD sweepers. Thus, 56.39 per cent of slum clusters are not visited by MCD sweepers. At regional level, maximum attention is given to slum clusters in central zone where 70.49 per cent of slum clusters are visited by MCD sweepers and minimum attention is given to western region where only 16.54 per cent slums have reported visits by MCD sweepers.
In absence of support from MCD, the slum clusters have their own alternative mechanism, which include private sweepers, disposal to nearest dustbin, throwing on roadside and other means. Among this disposal to nearest dustbin is most common, which followed with throwing the garbage by the side of roads. Use of dust bin varies from 93.46 slums in western region to 13.33 per cent in central region. Practice of throwing on roadside is reported heavily in almost all regions except West.

DELHI SLUM CLUSTERS: A PROFILE
This document is intellectual property of Centre for Global Development Research Private Limited, New Delhi prepared with the help of SER Grant extended by the Planning Commission of India. No part of the document can be copied without a written permission of CGDR.
Page 21
TABLE 3.12: DISTRIBUTION OF SLUM BY REGULAR VISITS BY MCD SWEEPERS FOR CLEANING AND PICKING UP GARBAGE FROM THE SLUM Sl. No.
Zone
Percentage of slums having regular visits of MCD Sweepers for cleaning and picking up garbage
Distribution of slums having alternative mechanism of daily garbage disposed in absence of public system (per cent) private Sweeper Disposal to
nearest dustbin Thrown on roadside
Others
1 Central 70.49 26.67 13.33 53.33 6.67 2 East 43.68 4.35 59.42 36.23 0.00 3 North 47.06 10.64 63.83 25.53 0.00 4 South 57.03 0.00 58.97 30.77 10.26 5 West 16.54 0.93 93.46 2.80 2.80 All 43.61 4.69 70.76 21.66 2.89 Source: CGDR research
3.4.2 Waste collection inside slum clusters and disposal
One of the important system of garbage collection and system is to provide common dust bin inside the slum clusters and dispose the same by deploying trucks to landfill areas.
In respect of provisioning of common dust bin inside the Slum, out of total 477 Slums, 258 (54.09 per cent) reported absence of such facility. Importantly, more than 90.98 per cent slums located in the west are without a common dust bin. In other Zones Slums without any common dust bin varies between 56.32 per cent in East to 26.23 per cent in Central Zone. In Central Zone, more than 74 per cent of the slums reported having a common dust bin (Table 3.13).
It may be noted that the condition of waste collection is worst in western region because they neither have benefit of sweepers nor have been provided with dust bins inside the slum cluster area. Most people use dust bin outside the slum area, which would be causing too much of inconvenience.
The percentage of slums getting services of MCD Truck at different frequencies is also presented in Table 3.13. Out of 219 Slums, which have dust bin inside slum cluster, 55.25 per cent reported daily visit, 30.14 per cent reported twice a week, 8.22 per cent weekly visit and 6.39 per cent irregular visit.
In West, 91.67 per cent slum clusters reported daily visit of MCD trucks for garbage collection, but the number of beneficiary slums in western region reporting dust bin inside slum is very small.
In other zones the visit of MCD trucks is reported to vary between 65.79 per cent in East to 44.44 per cent in North zone.

Slums of Delhi
October 2011 Page 22
TABLE 3.13: PERCENTAGE OF SLUM HAVING COMMON DUST BIN AND DISTRIBUTION OF SUCH SLUMS BY FREQUENCY OF VISIT OF MCD TRUCK Sl. No. Zone Percentage of slum with
common dust bin provided by the MCD
Distribution of Slum by frequency of visit by MCD truck Daily Twice a week Weekly Irregular
1 Central 73.77 60.00 37.78 0.00 2.22 2 East 43.68 65.79 10.53 7.89 15.79 3 North 52.94 44.44 44.44 0.00 11.11 4 South 68.75 47.73 32.95 17.05 2.27 5 West 9.02 91.67 0.00 0.00 8.33 All 45.91 55.25 30.14 8.22 6.39 Source: CGDR research
3.4.3 Drainage and waste water disposal
In terms of drainage system for waste water disposal, the situation is much better. It is heartening to find that out of 477 slums 93.50 per cent reported having drainage system inside the slum. Across zones, percentage of slums with drainage system varies between 88.52 per cent in Central to 96.09 per cent in South (Table 3.14). A little effort by the local government with well targeted investment the situation can be improved further for all slum clusters.
TABLE 3.14: DISTRIBUTION OF SLUMS WITH AND WITHOUT DRAINAGE SYSTEM FOR DISPOSAL OF WASTE WATER FROM THE SLUM Sl. No.
Zone Drainage system in the Slum Number of slum clusters Slums reporting existence of
drainage system Percentage of Slums reporting existence of drainage system
1 Central 61 54 88.52
2 East 87 83 95.40
3 North 68 64 94.12
4 South 128 123 96.09
5 West 133 122 91.73
Total 477 446 93.50
Source: CGDR research
3.5 MEDICAL FACILITIES AND INTERVENTIONS
The condition of slum clusters in general is poor in terms of medical facility. Out of 477 slums about 89 per cent are without any government dispensary inside the slum (Table 3.15). Only 11 per cent have some form of government dispensary. The availability of dispensary facility varies between 24.14 per cent in East and only 2.94 per cent in North. In absence of this facility, the slum dwellers have to visit Private Doctors or unqualified quacks for minor ailment and have to pay high fees for consultation and medicine. However, in the absence of government dispensaries attempt is made to help the residents through specific camps for immunisation and health check up (Table 3.15 to 3.17).

DELHI SLUM CLUSTERS: A PROFILE
This document is intellectual property of Centre for Global Development Research Private Limited, New Delhi prepared with the help of SER Grant extended by the Planning Commission of India. No part of the document can be copied without a written permission of CGDR.
Page 23
TABLE 3.15: PERCENTAGE OF SLUMS HAVING GOVERNMENT DISPENSARY INSIDE THE SLUM, AND AVERAGE NUMBER OF IMMUNIZATION AND HEALTH CHECK UP CAMPS CONDUCTED BY THE GOVERNMENT DURING 2009‐10 Sl. No. Zone Total
Numbers of Slums
Percentage of slums with government dispensary inside the slum
Immunization Programs (mostly pulse polio)
Number of Health Check‐up camps (mostly GHC and eye check up)
1 Central 61 11.48 5 1.55 2 East 87 24.14 4.95 1.79 3 North 68 2.94 4.94 1.53 4 South 128 9.38 5 1.5 5 West 133 8.27 4.98 3.29 All 477 11.11 4.98 1.91 Source: CGDR research
3.5.1 Household illness and treatment
Figure 3.4 presents percentage of persons reporting illness during the last three months preceding the survey. At the aggregate level about 0.5 per cent households have reported illness with maximum incidence reported illness from west zone at 5.4 per cent and least from north and south zone at 0.2 per cent. It may be mentioned that western zone is seriously lacking in garbage handling facilities and cleanliness, which is reflected in highest incidence of illness.
Percentage distribution of population reporting illness by type of chronic & other disease is presented in Table 3.16. In case of those suffering from chronic disease, 62.5 percent reported TB, 11.4 per cent asthma, incidence of arthritis, heart attack and stone has been reported by 7.3 per cent each; while 4 per cent reported cancer. Incidence of TB is high in all the 5 regions.
In case of other (non‐chronic) diseases, 57 per cent reported suffering from fever, 23 per cent dengue, 4 per cent malaria, 4 per cent jaundice and remaining 12 per cent reported cough & cold, cataract and chicken pox.
Percentage distribution of persons reporting illness by place of treatment is presented in Table 3.17. It is observed that 67.4 per cent got treatment from government hospital/ dispensary, 18.7 per cent from private OPD, 9. 8. Per cent from private doctor & 4.1 per cent from chemist shop. Across zones treatment from government hospital and dispensary vary between 82.1 per cent in east, 81.9 per cent in central to 47.5 per cent in the west. This indicates the extent of dependency of the dwellers on government provided health services.
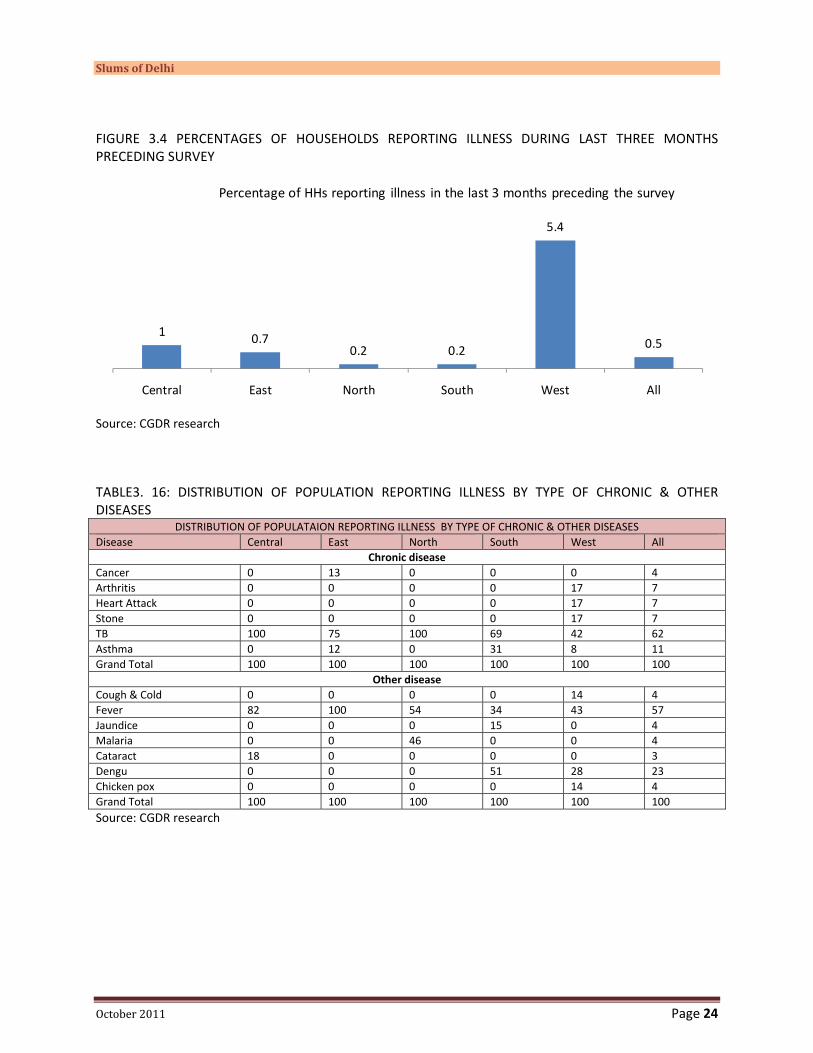
Slums of Delhi
October 2011 Page 24
FIGURE 3.4 PERCENTAGES OF HOUSEHOLDS REPORTING ILLNESS DURING LAST THREE MONTHS PRECEDING SURVEY
Source: CGDR research
TABLE3. 16: DISTRIBUTION OF POPULATION REPORTING ILLNESS BY TYPE OF CHRONIC & OTHER DISEASES
DISTRIBUTION OF POPULATAION REPORTING ILLNESS BY TYPE OF CHRONIC & OTHER DISEASES Disease Central East North South West All
Chronic disease Cancer 0 13 0 0 0 4 Arthritis 0 0 0 0 17 7 Heart Attack 0 0 0 0 17 7 Stone 0 0 0 0 17 7 TB 100 75 100 69 42 62 Asthma 0 12 0 31 8 11 Grand Total 100 100 100 100 100 100
Other disease Cough & Cold 0 0 0 0 14 4 Fever 82 100 54 34 43 57 Jaundice 0 0 0 15 0 4 Malaria 0 0 46 0 0 4 Cataract 18 0 0 0 0 3 Dengu 0 0 0 51 28 23 Chicken pox 0 0 0 0 14 4 Grand Total 100 100 100 100 100 100 Source: CGDR research
1 0.70.2 0.2
5.4
0.5
Central East North South West All
Percentage of HHs reporting illness in the last 3 months preceding the survey

DELHI SLUM CLUSTERS: A PROFILE
This document is intellectual property of Centre for Global Development Research Private Limited, New Delhi prepared with the help of SER Grant extended by the Planning Commission of India. No part of the document can be copied without a written permission of CGDR.
Page 25
TABLE 3.17: DISTRIBUTION OF POPULATION REPORTING ILLNESS BY TREATMENT PLACE DISTRIBUTION OF POPULATION REPORTING ILLNESS BY TREATMENT PLACE
Region Private Doctor Medicine from Chemist shop
Private OPD Government Dispensary/Hospital
Grand Total
Central 0.0 18.1 0.0 81.9 100.0 East 0.0 0.0 17.9 82.1 100.0 North 0.0 31.4 0.0 68.6 100.0 South 10.4 0.0 11.6 78.0 100.0 West 21.0 0.0 31.5 47.5 100.0 All 9.8 4.1 18.7 67.4 100.0 Source: CGDR research
3.5.2 Immunisation and Heath check up Camps
Immunization and health check up camps are the two major sources of medical support for slum residents Data on average number of such camps conducted by the government for the last one year (2009‐10) is presented in Table 3.15. It may be noted that the immunisation program predominantly includes pulse polio; and to some extent Hepatitis‐B, chicken pox etc. Similarly the health check up program mainly includes general health check up (GHC), eye test, dental inspection, malaria, HIV, and Khasra.
The average number of immunization program (mostly pulse polio) in all slum clusters taken together was 4.98 per slum during 2009‐10 while the number of health camps is 1.91. Across Zones, in case of the former the average number lies between 4.94 in northern region to 5.00 in southern region. The same in case of health check up lies between 1.50 in south to 3.29 in west. However, as indicated in Table 3.15, the response to specific intervention namely Hepatitis‐B or Eye check up is poor.
3.5.3 Coverage/ penetration of immunisation camps
Distribution of Slums by type of Immunization Programs conducted in the last one year is also presented in Table 3.18. In case of Pulse Polio, 100 percent coverage has been reported. As regards Hepatitis B, Chicken pox, measles, plague the coverage is only 1.05 per cent, 1.26 per cent, 0.63 per cent and 0.21 per cent respectively. All of these covered only East zones.

Slums of Delhi
October 2011 Page 26
TABLE 3.18: PERCENTAGE OF SLUMS HAVING GOVERNMENT DISPENSARY INSIDE THE SLUM AND FACILITY OF IMMUNISATION Sl. No. Zone Total
Numbers of Slums
Percentage of slum receiving immunization programs conducted in the last one year (2009‐10) Pulse Polio Chickenpox Hepatitis Measles Heja
1 Central 61 100.00 0.00 0.00 0.00 0.00 2 East 87 100.00 6.90 5.75 3.45 1.15 3 North 68 100.00 0.00 0.00 0.00 0.00 4 South 128 100.00 0.00 0.00 0.00 0.00 5 West 133 100.00 0.00 0.00 0.00 0.00 All 477 100.00 1.26 1.05 0.63 0.21 Source: CGDR research
3.5.4 Coverage/ penetration of health check up camps
A detailed analysis of health check up and purpose wise camp coverage is presented in Table 3.19, which shows the percentage of slums covered under a particular check up camp during 2009‐10 as narrate by the head of slums. In this respect the coverage is very poor in all most all type of preventive measure.
At the aggregate level, the coverage varies between 0.21 for Asthma to 21.59 percent for GHC. In case of Malaria, Eye camp and GHC the coverage is to the extent of 5.6 per cent, 8.18 per cent and 21.59 per cent respectively.
The coverage under Malaria check up camp varied between 19.67 per cent in central zone to zero per cent in East and North. For Asthma, only south zone reported coverage of 0.78 per cent slums. Dental camp was organized in East and South zones with coverage of 4.60 and 0.78 per cent of the total slums in those zones respectively.
Ear camp was organized in only East with 2.30 per cent coverage. In respect of Eye camp, the situation is relatively better with 8.18 per cent coverage in the overall varying between 0.75 per cent in west to 13.24 per cent in the North.
TABLE 3.19: DISTRIBUTION OF SLUMS BY TYPE OF HEALTH CHECK‐UP CAMPS CONDUCTED BY THE GOVT Percentage of Slums covered under check‐up camps during last year Sl. No Zone Central East North South West All Total Slums 61 87 68 128 133 477 1 AIDS 0.00 11.49 1.47 1.56 0.00 2.73 2 TB 0.00 1.15 0.00 3.13 0.00 1.05 3 Malaria 19.67 0.00 0.00 10.94 0.75 5.66 4 Asthma 0.00 0.00 0.00 0.78 0.00 0.21 5 Dental 0.00 4.60 0.00 0.78 0.00 1.05 6 Ear 0.00 2.30 0.00 0.00 0.00 0.42 7 Eye 4.92 10.34 13.24 13.28 0.75 8.18 8 GHC 29.51 24.14 17.65 15.63 24.06 21.59 9 Diabetics 4.92 0.00 0.00 0.00 0.00 0.63 Source: CGDR research

DELHI SLUM CLUSTERS: A PROFILE
This document is intellectual property of Centre for Global Development Research Private Limited, New Delhi prepared with the help of SER Grant extended by the Planning Commission of India. No part of the document can be copied without a written permission of CGDR.
Page 27
3.6 LITERACY IMPROVEMENT PROGRAM
It is generally felt that several of the problems associate with slum life can be linked to prevalent illiteracy and therefore, intervention through improvement in literacy of residents have multifarious benefits. However, the extent of intervention is disappointing across all regions of Delhi slum clusters.
Table 3.20 provide the share of slum clusters benefitted by various education related government programs conducted during 2009‐10 such as adult literacy and general awareness through Anganwadi institution under integrated child development program. Table 3.18 also includes cretche services provided by other agencies which help in early education of babies of working women.
In the case of Adult literacy the overall coverage is only 1.68 per cent, varying between zero per cent in North and South zone slums to 8.20 per cent in central zone. Anganwari program covered 35.01 per cent slums at the aggregate level varying between 13.79 per cent in East to as high as 61.72 per cent in the south zone. The presence of Crèche for working women was reported from only 9.85 percent slums in the overall varying between 4.51 in West to 15.63 per cent in South
TABLE 3.20: PERCENTAGE OF SLUMS COVERED UNDER LITERACY IMPROVEMENT PROGRAMS CONDUCTED DURING THE LAST ONE YEAR Sl. No. Zone Total Slums
(number) Percentage of slums covered Adult literacy Anganwari Crèche for working
women 1 Central 61 8.20 39.34 9.84 2 East 87 2.30 13.79 5.75 3 North 68 0.00 39.71 14.71 4 South 128 0.00 61.72 15.63 5 West 133 0.75 18.80 4.51 All 477 1.68 35.01 9.85 Source: CGDR research
3.7 CRIME AND LAW AND ORDER PROBLEMS
Feed back on the law and order situation in the slum was gathered from the cross section of the slum dwellers. Out of 477 slums, 220 slum clusters (46.12 per cent) reported existence of one or other type of law and order problem in their respective slum. The same varies between 10.53 per cent in the West to as high as 67.65 per cent in North, 59.02 in Central and 55.17 per cent in East Zone (Table 3.21).
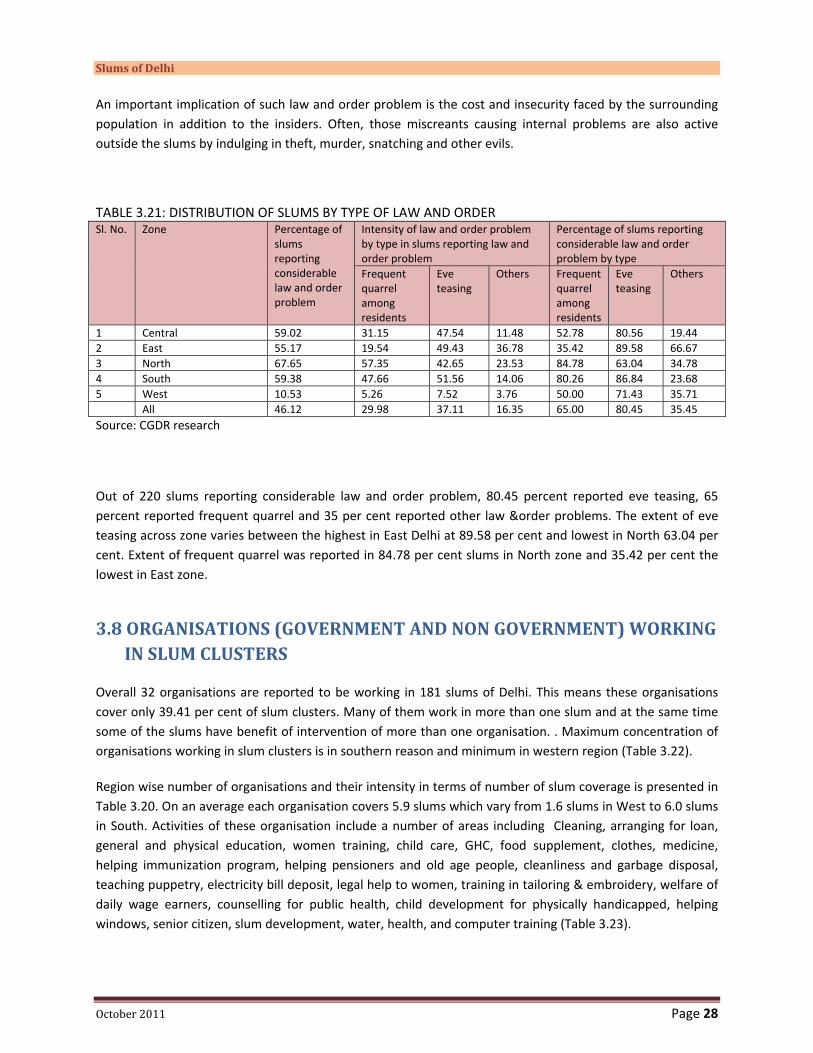
Slums of Delhi
October 2011 Page 28
An important implication of such law and order problem is the cost and insecurity faced by the surrounding population in addition to the insiders. Often, those miscreants causing internal problems are also active outside the slums by indulging in theft, murder, snatching and other evils.
TABLE 3.21: DISTRIBUTION OF SLUMS BY TYPE OF LAW AND ORDER Sl. No. Zone Percentage of
slums reporting considerable law and order problem
Intensity of law and order problem by type in slums reporting law and order problem
Percentage of slums reporting considerable law and order problem by type
Frequent quarrel among residents
Eve teasing
Others Frequent quarrel among residents
Eve teasing
Others
1 Central 59.02 31.15 47.54 11.48 52.78 80.56 19.44 2 East 55.17 19.54 49.43 36.78 35.42 89.58 66.67 3 North 67.65 57.35 42.65 23.53 84.78 63.04 34.78 4 South 59.38 47.66 51.56 14.06 80.26 86.84 23.68 5 West 10.53 5.26 7.52 3.76 50.00 71.43 35.71 All 46.12 29.98 37.11 16.35 65.00 80.45 35.45 Source: CGDR research
Out of 220 slums reporting considerable law and order problem, 80.45 percent reported eve teasing, 65 percent reported frequent quarrel and 35 per cent reported other law &order problems. The extent of eve teasing across zone varies between the highest in East Delhi at 89.58 per cent and lowest in North 63.04 per cent. Extent of frequent quarrel was reported in 84.78 per cent slums in North zone and 35.42 per cent the lowest in East zone.
3.8 ORGANISATIONS (GOVERNMENT AND NON GOVERNMENT) WORKING IN SLUM CLUSTERS
Overall 32 organisations are reported to be working in 181 slums of Delhi. This means these organisations cover only 39.41 per cent of slum clusters. Many of them work in more than one slum and at the same time some of the slums have benefit of intervention of more than one organisation. . Maximum concentration of organisations working in slum clusters is in southern reason and minimum in western region (Table 3.22).
Region wise number of organisations and their intensity in terms of number of slum coverage is presented in Table 3.20. On an average each organisation covers 5.9 slums which vary from 1.6 slums in West to 6.0 slums in South. Activities of these organisation include a number of areas including Cleaning, arranging for loan, general and physical education, women training, child care, GHC, food supplement, clothes, medicine, helping immunization program, helping pensioners and old age people, cleanliness and garbage disposal, teaching puppetry, electricity bill deposit, legal help to women, training in tailoring & embroidery, welfare of daily wage earners, counselling for public health, child development for physically handicapped, helping windows, senior citizen, slum development, water, health, and computer training (Table 3.23).
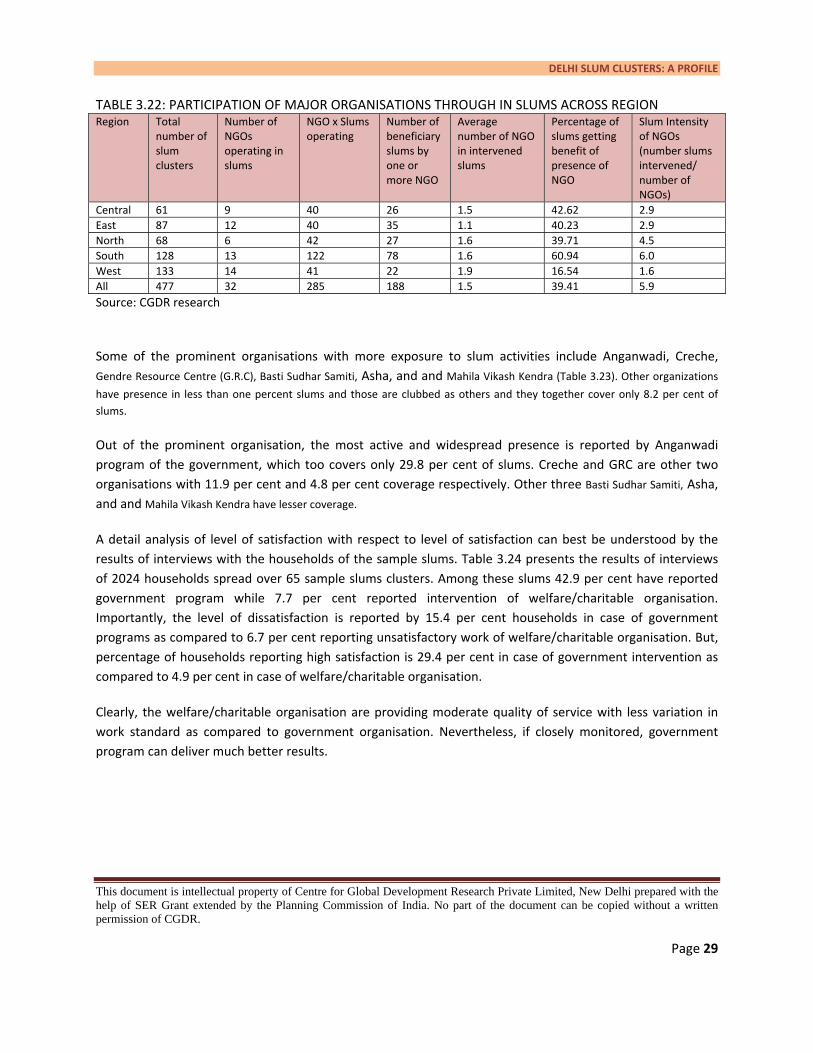
DELHI SLUM CLUSTERS: A PROFILE
This document is intellectual property of Centre for Global Development Research Private Limited, New Delhi prepared with the help of SER Grant extended by the Planning Commission of India. No part of the document can be copied without a written permission of CGDR.
Page 29
TABLE 3.22: PARTICIPATION OF MAJOR ORGANISATIONS THROUGH IN SLUMS ACROSS REGION Region Total
number of slum clusters
Number of NGOs operating in slums
NGO x Slums operating
Number of beneficiary slums by one or more NGO
Average number of NGO in intervened slums
Percentage of slums getting benefit of presence of NGO
Slum Intensity of NGOs (number slums intervened/ number of NGOs)
Central 61 9 40 26 1.5 42.62 2.9 East 87 12 40 35 1.1 40.23 2.9 North 68 6 42 27 1.6 39.71 4.5 South 128 13 122 78 1.6 60.94 6.0 West 133 14 41 22 1.9 16.54 1.6 All 477 32 285 188 1.5 39.41 5.9 Source: CGDR research
Some of the prominent organisations with more exposure to slum activities include Anganwadi, Creche, Gendre Resource Centre (G.R.C), Basti Sudhar Samiti, Asha, and and Mahila Vikash Kendra (Table 3.23). Other organizations
have presence in less than one percent slums and those are clubbed as others and they together cover only 8.2 per cent of slums.
Out of the prominent organisation, the most active and widespread presence is reported by Anganwadi program of the government, which too covers only 29.8 per cent of slums. Creche and GRC are other two organisations with 11.9 per cent and 4.8 per cent coverage respectively. Other three Basti Sudhar Samiti, Asha, and and Mahila Vikash Kendra have lesser coverage.
A detail analysis of level of satisfaction with respect to level of satisfaction can best be understood by the results of interviews with the households of the sample slums. Table 3.24 presents the results of interviews of 2024 households spread over 65 sample slums clusters. Among these slums 42.9 per cent have reported government program while 7.7 per cent reported intervention of welfare/charitable organisation. Importantly, the level of dissatisfaction is reported by 15.4 per cent households in case of government programs as compared to 6.7 per cent reporting unsatisfactory work of welfare/charitable organisation. But, percentage of households reporting high satisfaction is 29.4 per cent in case of government intervention as compared to 4.9 per cent in case of welfare/charitable organisation.
Clearly, the welfare/charitable organisation are providing moderate quality of service with less variation in work standard as compared to government organisation. Nevertheless, if closely monitored, government program can deliver much better results.

Slums of Delhi
October 2011 Page 30
TABLE 3.23: COVERAGE OF MAJOR ORGANISATIONS THROUGH SOCIAL ACTIVITIES IN SLUMS ACROSS REGION Sl. No.
Name of NGO Percentage of Slums in which a particular NGO is reported to be present
Major Activities
Central East North South West All 1 Anganwadi 32.8 10.3 33.8 58.6 11.3 29.8 Child education and development, Food
supplement, general health check‐up and gender awareness
2 Creche 10.3 14.7 16.4 6.0 11.9 Creche for working women, and training to women
3 Gendre Resource Centre (G.R.C)
1.6 9.2 1.5 9.4 0.8 4.8 All types of social work, education related programs, child education, women training etc., GHC
4 Basti Sudhar Samiti
0.0 2.3 5.9 1.6 0.8 1.9 Children Education, cleaning of garbage from slums, waste water management, arrange for loans , work for education and health
5 Asha 3.3 0.0 0.0 0.0 3.0 1.3 Polio drops, counseling and guidance to Pregnant Women.
6 Mahila Vikash Kendra
1.6 2.3 2.9 0.0 0.0 1.0 Social work, women education & training
7 Others (28 in number)
6.6 10.3 2.9 8.6 9.8 8.2 Cleaning, arranging for loan, general and physical education, women training, child care, GHC, food supplement, clothes, medicine, helping immunization program, helping pensioners and old age people, cleanliness and garbage disposal, teaching puppetry, electricity bill deposit, legal help to women, training in tailoring & embroidery, welfare of daily wage earners, counseling for public health, child development for physically handicapped, helping windows, senior citizen, slum development, water, health, and computer training
All (32 NGO) 42.6 40.2 39.7 60.9 16.5 39.4 Number of slums 61 87 68 128 133 477 Source: CGDR research
TABLE 3.24: SATISFACTION LEVEL FOR CHARITABLE ORGANIZATIONS AND GOVERNMENT PROGRAMS Zone Charitable /
Welfare Organization
Government welfare programs in their Slums
Satisfaction level Charitable organizations Government programs
Yes Yes
Very
Satisfactory
Satisfactory
Unsatisfactory
All
Very
Satisfactory
Satisfactory
Unsatisfactory
All
Central 34.1 50.2 5.1 76.9 17.9 100 67.3 14.8 17.9 100 East 2.8 93.5 20.7 58.6 20.7 100 40.4 51.4 8.2 100 North 12.7 53 7 93 0 100 6.8 84.8 8.5 100 South 3.9 23.7 0 95.9 4.1 100 24.2 38.3 37.4 100 West 6.6 17.8 0 100 0 100 16.5 62.5 21 100 All 7.7 42.9 4.9 88.4 6.7 100 29.4 55.2 15.4 100 Source: CGDR research. This analysis is based on 2024 households spread across 65 sample slum clusters

DELHI SLUM CLUSTERS: A PROFILE
This document is intellectual property of Centre for Global Development Research Private Limited, New Delhi prepared with the help of SER Grant extended by the Planning Commission of India. No part of the document can be copied without a written permission of CGDR.
Page 31
3.9 AWARENESS ABOUT SLUM IMPROVEMENT PROGRAMS
While preparing the dataset for existing slum clusters, questions were asked about some of prominent programs of the government related to slum development and slum rehabilitation by their official names. In particular enquiry was made to assess awareness about Balmiki Awas Yojana (BAY), National Slum Development Programme (NSDP), Environment Improvement Programme (EIUS), Basti Service to Urban Poor (BSUP), Swarna Jayanti Sahari Yojona (SJASRI), In‐situ rehabilitation program, and any other programme. The result is surprisingly poor. The prominent people in slums such as slum head or local leaders do not know about such programs by their name or intervention. Considering poor awareness of the residents, no further analysis is presented with regards to these programs in context of existing slum clusters. However, all these programs would be referred to while discussing the strategies of slum rehabilitation in subsequent chapters.
3.10 SUMMARY AND CONCLUSION
In Delhi, the capital of India, 477 slum clusters have been identified through personal visits by the CGDR Investigators. Estimates indicate that the of population living in slums has come down to 14.46 per cent in 2010 as against 16.88 per cent in 2001 even though the number of population living in slums has increased to 22.14 percent from 21.5 lakh.
Out of 477 slums, 475 are located in government land and only 2 are owned by private individual and private organisation. The entire cost of slum habitation is borne by the government & tax payers, more so in terms of the revenue that could be generated from alternative use of such vast areas of land located in prime locations of Delhi.
Maximum number of Slum Clusters numbering 133 (27.88 per cent) are located in western zone and the minimum at 61 (12.79 per cent) at central zone.
19 slums of which 14 are located in Central zone, came up prior to independence during 1900 to 1947 but have not been rehabilitated so far where as slums came up much later have been rehabilitated.
The rental per sq ft for a 2BHK flat in the surrounding residential colonies of the slums is estimated at INR 9.20 per square feet. The rental in a slum on an average works out to INR 8.5 per square feet, which is quite close to the market rate. This means, given the limited resources, a slum dweller has to rent a room would be better off even with market rate, provided the total outgo is not altered. This is the reason many people live on a rented slum house.

Slums of Delhi
October 2011 Page 32
A Jhuggi can be sold and purchased. The average price of purchasing a jhuggi in Delhi is INR 40,243.
The quality of roads inside the slums is not that bad. 51.5 per cent slums have roads of mixed type which includes cement concrete road, bitumen road and kutcha roads. 31.24 per cent slums have cemented concrete roads. Only 3.14 per cent slums have kutcha roads.
Only 44 per cent of the total 477 slums have street lighting inside the slums causing inconvenience for the slum dwellers that do not have such facility.
The extent of load shedding in the slum is more or less similar to the rest of the public in general staying in authorized residential colonies. The average number of hours of load shedding during summer is reported at 2.43 during summer and 0.90 in winter.
Out of 477 slums, 354 (74.21 per cent) have common toilet facility inside the slum and the remaining 25.79 per cent reported no such facility. Sulabh International is playing a bigger role with coverage of 54.4 per cent slums than the Delhi Administration with coverage of 30.6 per cent.
Out of 477 slums, 455 (95.39 per cent) have one or the other source of drinking water and only 4.61 per cent reported not having any such facility. Such persons fetch water from the adjacent localities.
Out of 477 slums, only 211 (44.23 per cent) reported regular water supply by Delhi Jal board. In 55.77 per cent not receiving regular supply, the frequency of water supply is reported by 76.69 per cent, twice daily in 24 hour & thrice daily reported by 14.29 per cent.
Most of the amenities, infrastructure and services like bus stand , railway station, post office, pucca road, schools collages, PHC, Govt. Dispensary etc are located in the close proximity of the most of the slums. At least 17 per cent of slums have everything within a radius of one kilometre.
Out of 477 slums, only 43.61 percent reported regular visit by MCD sweepers. In 45.91 slums have common dust bins inside the slum provided by the MCD. Across zones, the condition of waste collection is worst in western region as thy neither have adequate benefit of sweepers nor have been provided with common dust bin inside the slum by MCD.
For waste water disposal, 93.50 per cent of the slums have reported having drainage system inside the slum.
Out of 477 slums, about 89 per cent are without any government dispensary inside the slum. In absence of government dispensary, provisions are there to help slum residents through specific health camps for immunisation and health checkups.
The extent of intervention in respect literacy improvement programme initiated at the government level is disappointing.
Out of 477 slums, 46.12 percent reported existence of one or the other type law and order problem like frequent quarrel among residents, eve teasing and others. Frequent quarrel have been reported by 65 per cent, eve teasing by 80.45 per cent and others 35.45 per cent.

DELHI SLUM CLUSTERS: A PROFILE
This document is intellectual property of Centre for Global Development Research Private Limited, New Delhi prepared with the help of SER Grant extended by the Planning Commission of India. No part of the document can be copied without a written permission of CGDR.
Page 33
36 organisations are reported to be working in 188 (39.41 per cent) slums out of 477 total slums. Activities of these organisation include Slum cleanliness, arranging for loan, general and physical education, women training, child care, GHC, food supplement, clothes, medicine, helping immunization program, helping pensioners and old age people etc.
The satisfaction level with respect charitable organisations & Government programs reported by 2024 household spread over 65 slums, 42.9 per cent have reported government programme and 7.7 per cent reported intervention of welfare/ charitable organisations. The level dissatisfaction is reported by 15.4 per cent households in case of government interventions programs as compared to 6.7 per cent reporting unsatisfactory work of welfare / charitable organisations. But, percentage of households reporting high satisfaction is 29.4 per cent in case of government intervention as compared to 4.9 per cent in case of welfare/charitable organisation.

Slums of Delhi
October 2011 Page 34
Chapter 4
People and Social Structure The survey data indicates, people residing in slum households have migrated from as many as 237 districts (1312 villages) spread over 20 states across India. However the distribution is highly skewed as discussed later in this chapter. Similar diversification can be observed in social structure, education, gender distribution, and social security across regions of Delhi and within region. Therefore, it is important to understand the people social structure in some detail to facilitate better decision in policy making. Moreover, it is also true that most of the people residing in slum are not habitual of living in such environment rather; many of them aspire to lead a better and more dignified life, an issue discussed in detail in subsequent chapters.
4.1 WHO ARE THE SLUM MIGRANTS?
People residing in slums dwellings have diverse background and native identity. Many of them had resided in Delhi itself, while others came directly to find place in current slum. Even those who came from Delhi, their native place may or may not be Delhi as discussed in Chapter 4 also.
4.1.1 Most slum migrants are villagers and a few are slum hoppers
Almost 95 per cent of the households have reported staying in a slum for the first time (Table 4.1). Across regions this percentage varies between 70.8 and 97.8 per cent with minimum being reported in central zone where percentage of people having lived in slum before moving to the current slum is as high as 29.2 per cent.
TABLE 4.1: PERCENTAGE OF HOUSEHOLDS LIVING IN SLUM FOR THE FIRST TIME OR MORE AND DISTRIBUTION BY EARLIER STAY Zone
Percentage of households staying in a slum for the first time
Percentage of households staying first time in a slum by earlier place of residence
Percentage of households by number of slums they have stayed before coming to the present one Number of Slums
Rented house
Own House in a city
Village All 1 2 3 5 10 All
Central 70.8 51.3 4.8 43.8 100 95.4 4.6 0 0 0 100 East 97.8 28 1 71 100 92.3 0 7.7 0 0 100 North 94.2 14.2 7.9 77.9 100 82.7 0 3.1 11.1 3.1 100 South 97.4 9.4 3.3 87.3 100 91.4 5.5 3.1 0 0 100 West 97.6 8.1 3.6 88.3 100 90.6 0 9.4 0 0 100 All 95.4 15.5 3.8 80.7 100 90.4 2.7 3.7 2.5 0.7 100 Source: CGDR research

People and Social Structure
This document is intellectual property of Centre for Global Development Research Private Limited, New Delhi prepared with the help of SER Grant extended by the Planning Commission of India. No part of the document can be copied without a written permission of CGDR.
Page 35
Among the 95 per cent of the slum households staying in a slum for the first time, 80.7 percent of the households have migrated to the slum from Village, 15.5 percent were staying in a rented accommodation and 3.8 per cent had own house in the city before coming to the slum. Across zones, households coming from village vary between 43.8 per cent in Central to 88.3 per cent in West Zone. However, in central zone 51.3 per cent of the households stayed in rented accommodation before coming to the slum.
Among the 4.6 percent households (19,965 households in absolute terms) who have lived in other slums before settling in current slum 90.4 per cent have lived in only one slum previously, 2.7 per cent in two slums, 3.7 per cent in 3 slums, 2.5 per cent in five slums and 0.7 per cent in 10 slums. Thus the number of slum hoppers is limited and most of the residents like a stable place survive.
4.1.2 Eighty five per cent of slum migrants come from Uttar Pradesh and Bihar
Table 4.2 presents the distribution of slum households by their native State. The estimates indicate 61.5 per cent of the households have migrated from 68 districts of Uttar Pradesh (UP) which tops the list among states. Bihar comes at the second position with 23.7 per cent households from 36 districts. Rajasthan is in the third place with 5.7 per cent households from 21 districts, Madhya Pradesh (MP) comes in the fourth place with 4.6 percent of the households from 25 districts and Haryana ranks at the fifth position with 1.3 per cent households from 13 districts. Clearly, majority of slum migrants belong to most under‐developed states of the country and at the same time they come from rural sector to improve their destiny.
TABLE 4.2: DISTRIBUTION OF SLUM HOUSEHOLDS BY THEIR STATE OF ORIGIN Rank State Distribution across States Distribution across Region
Central East North South West All Central East North South West All 1 Uttar Pradesh 76.5 66.5 72.8 62.6 47.8 61.5 1.7 20.6 21.6 35.6 20.5 100 2 Bihar 15.9 19.3 19.2 25.6 27.6 23.7 0.9 15.6 14.8 37.9 30.8 100 3 Rajasthan 3.8 3.7 2.4 4.0 11.9 5.7 0.9 12.4 7.7 24.2 54.8 100 4 Madhya Pradesh 0.0 6.8 2.9 2.1 7.6 4.6 0.0 28.3 11.6 16.3 43.8 100 5 Haryana 0.8 0.7 0.8 1.9 1.1 1.3 0.8 10.4 11.9 53.2 23.7 100 6 Chhattisgarh 0.0 0.5 0.2 0.6 1.4 0.7 0.0 13.0 6.1 27.8 53.1 100 7 West Bengal 0.8 0.4 0.5 1.0 0.7 0.7 1.6 10.2 11.6 49.7 26.9 100 8 Jharkhand 0.8 0.5 0.5 0.6 0.1 0.4 2.7 24.0 20.2 46.2 6.9 100 9 Nepal 0.0 0.3 0.1 0.3 0.6 0.3 0.0 16.2 3.3 29.7 50.8 100 10 Punjab 0.0 0.2 0.2 0.2 0.5 0.3 0.0 15.6 12.5 25.5 46.4 100 11 Uttarakhand 0.0 0.2 0.1 0.3 0.2 0.2 0.0 21.0 5.0 48.6 25.4 100 12 Orissa 0.0 0.1 0.0 0.3 0.1 0.2 0.0 15.5 0.0 70.1 14.5 100 13 Maharashtra 0.0 0.2 0.2 0.1 0.0 0.1 0.0 31.0 38.0 31.0 0.0 100 14 Gujarat 0.0 0.0 0.1 0.1 0.1 0.1 0.0 0.0 22.4 54.3 23.3 100 15 Pakistan 1.4 0.0 0.0 0.2 0.0 0.1 24.6 0.0 0.0 75.4 0.0 100 16 Andhra Pradesh 0.0 0.2 0.1 0.1 0.0 0.1 0.0 42.6 13.9 30.3 13.1 100 17 Himachal Pradesh 0.0 0.1 0.0 0.0 0.1 0.1 0.0 41.1 0.0 24.4 34.5 100 18 J&K 0.0 0.0 0.1 0.0 0.1 0.1 0.0 0.0 22.7 20.2 57.1 100 Other 0.0 0.3 0.0 0.1 0.1 0.1 0.0 44.3 0.0 24.4 31.3 100 All 100 100 100 100 100 100 1.4 19.1 18.2 35.0 26.4 100 Source: CGDR research

Slums of Delhi
October 2011 Page 36
A section of slum dwellers also belong to rich neighbouring states such as Haryana and Punjab. Even people from Nepal and Pakistan have been found to locate their residence in Slums of Delhi (Table 4.2). Most people with Pakistani native are located in Central region and appear to have come long back. While migrants from UP and Bihar are broadly evenly distributed across regions, others locate themselves more in specific regions. For example migrants from Rajasthan, Chhattisgarh, Punjab, Nepal, J&K and MP locate mostly in West.
4.1.3 Seventy per cent of slum migrants come from 35 backward districts
As noted earlier, slum households in Delhi have migrated from 237 districts spread over 20 states in India, 12 districts of Nepal and 1 district of Pakistan. However, about 70 per cent household come from just about 35 districts (Figure 4.1 and Table 4.3). Among top 35 districts, six belong to Bihar and the rest are located in UP.
At the district level, the highest percentage of households have migrated from Balia (UP) with 5.13 per cent share followed by Azamgarh (UP) 5.03 per cent, Siwan (Bihar) 4.84 per cent, Gonda (UP) 3.95 percent, and Deoria (UP) 3.31 per cent (Table 4.3). Aligarh, Gazipur, Gorakhpur, Bulandshahar, and Pratapgarh are other districts of UP from where migrants to slum come in large numbers.
Besides Siwan, other districts of include Madhubani, West Champaran, Begusarai, and Darbangha. In the third highest state Rajasthan in terms of number of migrated households, migration from district Dausa has been the highest followed by Jaipur, Alwar, Kasrauli and Sawai Madhopur.
FIGURE 4.1: CONTRIBUTION OF 241 DISTRICTS IN SLUM HOUSEHOLD POPULATION
Source: CGDR research
0.00
1.00
2.00
3.00
4.00
5.00
6.00
0.00
20.00
40.00
60.00
80.00
100.00
120.00
1 11 21 31 41 51 61 71 81 91 101
111
121
131
141
151
161
171
181
191
201
211
221
231
241
Percen
tage
share o
f distric
t in total slum
popu
lation
Cummulative
Share (p
er ce
nt)
District Serial Number in order of reducing share
Cummulative Share of Top districts Share of Top district

People and Social Structure
This document is intellectual property of Centre for Global Development Research Private Limited, New Delhi prepared with the help of SER Grant extended by the Planning Commission of India. No part of the document can be copied without a written permission of CGDR.
Page 37
TABLE 4.3: TOP 35 DISTRICTS FORMING SOURCE OF MIGRATION TO SLUM CLUSTERS Rank Source District State Estimate of region wise household population Share of
district Cumulative Share Central East North South West All
1 Balia Uttar Pradesh 0 2231 1436 11759 4273 19700 5.13 5.13 2 Azam Garh Uttar Pradesh 447 5676 5583 2658 4972 19336 5.03 10.16 3 Siwan Bihar 400 3980 3624 5394 5208 18606 4.84 15.00 4 Gonda Uttar Pradesh 41 2733 1698 7897 2823 15192 3.95 18.95 5 Deoria Uttar Pradesh 232 1351 3350 2359 5412 12704 3.31 22.26 6 Aligarh Uttar Pradesh 291 2056 5701 2564 1015 11627 3.03 25.28 7 Gazipur Uttar Pradesh 41 1492 3498 4403 1859 11292 2.94 28.22 8 Gorakhpur Uttar Pradesh 81 1931 2146 4337 2290 10786 2.81 31.03 9 Madhubani Bihar 44 1843 1206 5131 2261 10484 2.73 33.75 10 Bulandshahar Uttar Pradesh 44 1883 3146 3834 479 9385 2.44 36.20 11 Pratapgarh Uttar Pradesh 81 1408 1275 3631 2343 8739 2.27 38.47 12 West Champaran Bihar 0 1072 699 4474 2258 8503 2.21 40.68 13 Basti Uttar Pradesh 81 2468 574 2127 2198 7448 1.94 42.62 14 Chhatarpur Uttar Pradesh 0 1976 678 850 3935 7440 1.94 44.56 15 Jaunpur Uttar Pradesh 81 2963 1593 1483 887 7007 1.82 46.38 16 Mathura Uttar Pradesh 41 683 1187 4054 768 6733 1.75 48.13 17 Allahabad Uttar Pradesh 41 1394 558 2032 2702 6726 1.75 49.88 18 Begusarai Bihar 136 1708 501 2852 1116 6314 1.64 51.52 19 Etah Uttar Pradesh 203 1005 1539 2347 1079 6172 1.61 53.13 20 Dausa Rajasthan 0 382 157 712 4120 5370 1.40 54.53 21 Muzaffarpur Bihar 139 254 1024 2138 1555 5110 1.33 55.86 22 SultanPur Uttar Pradesh 0 790 355 1991 1873 5008 1.30 57.16 23 Kanpur Uttar Pradesh 0 1254 1052 1624 966 4896 1.27 58.43 24 Agra Uttar Pradesh 125 924 434 2471 721 4674 1.22 59.65 25 Darbhanga Bihar 0 703 637 1865 1431 4636 1.21 60.86 26 Faizabad Uttar Pradesh 0 1512 283 940 1458 4194 1.09 61.95 27 Mau Uttar Pradesh 44 351 536 2503 747 4181 1.09 63.04 28 Patna Bihar 46 463 775 1182 1662 4129 1.07 64.11 29 Jaipur Rajasthan 81 558 158 1723 1546 4066 1.06 65.17 30 Meerut Uttar Pradesh 44 2165 701 992 78 3980 1.04 66.20 31 Badaun Uttar Pradesh 131 390 1341 1854 238 3954 1.03 67.23 32 Samstipur Bihar 0 378 551 1440 1205 3573 0.93 68.16 33 Bareilly Uttar Pradesh 84 1353 606 922 275 3241 0.84 69.01 34 Sitapur Uttar Pradesh 0 400 2095 211 369 3075 0.80 69.81 35 Varanasi Uttar Pradesh 0 935 670 1011 436 3052 0.79 70.60 Source: CGDR research
4.1.4 Varying Stretch of Slum life
Figure 4.2 presents the distribution of households by number of years of stay in the slum. About 1/3 households (30.3 per cent) are staying in the slum from 16‐20 years, 16.9 per cent 21‐25 years , 20 per cent for 26‐30 years .
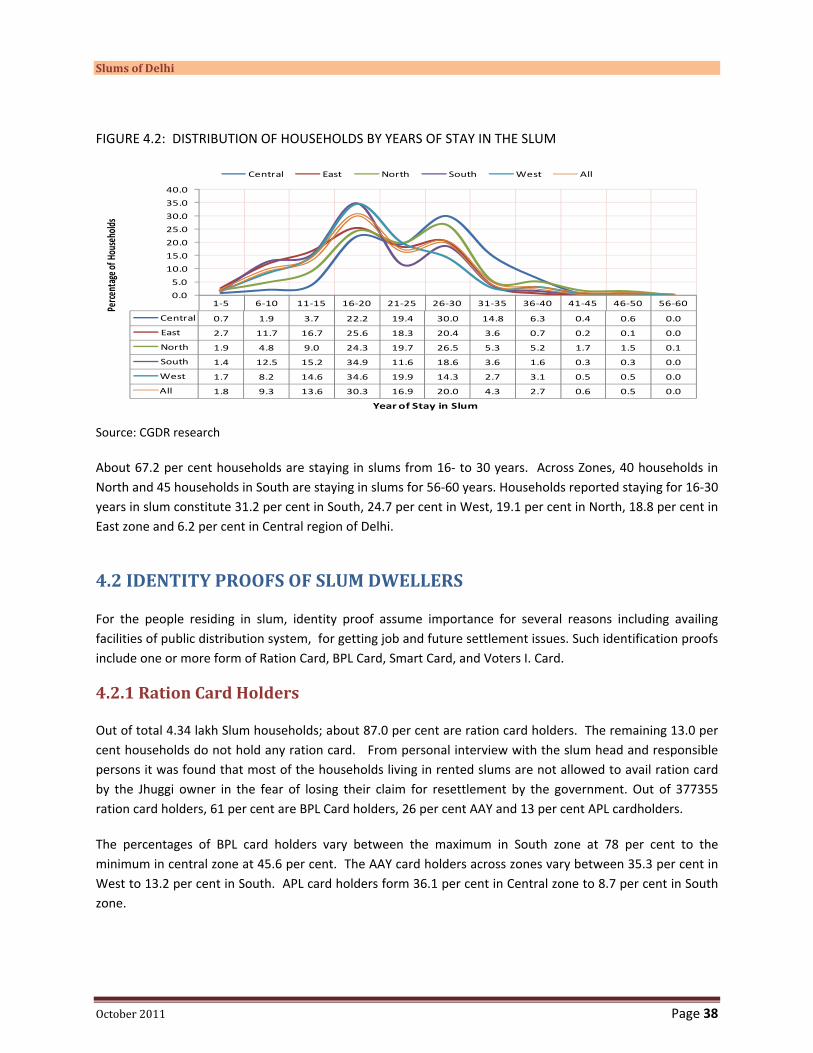
Slums of Delhi
October 2011 Page 38
FIGURE 4.2: DISTRIBUTION OF HOUSEHOLDS BY YEARS OF STAY IN THE SLUM
Source: CGDR research
About 67.2 per cent households are staying in slums from 16‐ to 30 years. Across Zones, 40 households in North and 45 households in South are staying in slums for 56‐60 years. Households reported staying for 16‐30 years in slum constitute 31.2 per cent in South, 24.7 per cent in West, 19.1 per cent in North, 18.8 per cent in East zone and 6.2 per cent in Central region of Delhi.
4.2 IDENTITY PROOFS OF SLUM DWELLERS
For the people residing in slum, identity proof assume importance for several reasons including availing facilities of public distribution system, for getting job and future settlement issues. Such identification proofs include one or more form of Ration Card, BPL Card, Smart Card, and Voters I. Card.
4.2.1 Ration Card Holders
Out of total 4.34 lakh Slum households; about 87.0 per cent are ration card holders. The remaining 13.0 per cent households do not hold any ration card. From personal interview with the slum head and responsible persons it was found that most of the households living in rented slums are not allowed to avail ration card by the Jhuggi owner in the fear of losing their claim for resettlement by the government. Out of 377355 ration card holders, 61 per cent are BPL Card holders, 26 per cent AAY and 13 per cent APL cardholders.
The percentages of BPL card holders vary between the maximum in South zone at 78 per cent to the minimum in central zone at 45.6 per cent. The AAY card holders across zones vary between 35.3 per cent in West to 13.2 per cent in South. APL card holders form 36.1 per cent in Central zone to 8.7 per cent in South zone.
1‐5 6‐10 11‐15 16‐20 21‐25 26‐30 31‐35 36‐40 41‐45 46‐50 56‐60
Central 0.7 1.9 3.7 22.2 19.4 30.0 14.8 6.3 0.4 0.6 0.0
East 2.7 11.7 16.7 25.6 18.3 20.4 3.6 0.7 0.2 0.1 0.0
North 1.9 4.8 9.0 24.3 19.7 26.5 5.3 5.2 1.7 1.5 0.1
South 1.4 12.5 15.2 34.9 11.6 18.6 3.6 1.6 0.3 0.3 0.0
West 1.7 8.2 14.6 34.6 19.9 14.3 2.7 3.1 0.5 0.5 0.0
All 1.8 9.3 13.6 30.3 16.9 20.0 4.3 2.7 0.6 0.5 0.0
0.0
5.0
10.0
15.0
20.0
25.0
30.0
35.0
40.0
Perce
ntage o
f Hou
seho
lds
Year of Stay in Slum
Central East North South West All

People and Social Structure
This document is intellectual property of Centre for Global Development Research Private Limited, New Delhi prepared with the help of SER Grant extended by the Planning Commission of India. No part of the document can be copied without a written permission of CGDR.
Page 39
TABLE 4.4: DISTRIBUTION OF HOUSEHOLDS WITH RATION CARD AND BY TYPE OF RATION CARD Zone
Total Households
Number of HOUSEHOLDS with Ration cards
Type of Ration Card (share of ration card holding)
Numbers Row per cent
Col per cent
BPL AAY APL All
Central 25002 22071 88.3 5.8 45.6 18.3 36.1 100 East 85408 78408 91.8 19.7 56.3 30.4 13.3 100 North 79128 75320 95.2 18.2 57.8 31.5 10.8 100 South 139814 111632 79.8 32.2 78.0 13.2 8.7 100 West 104386 89923 86.1 24.1 50.6 35.3 14.0 100 All 433738 377355 87.0 100 61.0 26.0 13.0 100 Source: CGDR research
4.2.2 Photo Card Holders
Photo identity cards include voter card and smart card. Out of 4.33 lakh households, 93.8 per cent are estimated to have photo identity cards. Only 6.2 per cent of the Head of the HH are without a photo I card (Table 4.5).
The maximum number of smart card holders is found in North with 22.6 per cent with Smart card. The households without a smart card across other zones vary between 1.6 per cent in Central zone to 12.7 per cent in West zone. At the aggregate level out of the 10 per cent of the households reporting possession of Smart card, only 21 per cent reported to have used it and the remaining 79 per cent have not used it.
4.5: DISTRIBUTION OF HOUSEHOLDS WITH PHOTO I‐CARDS, SMART CARDS AND HOUSEHOLDS USING SMART CARD Zone Percentage of Households with Photo I
Cards Percentage of HOUSEHOLDS with Smart Cards
Central 93.6 1.6 East 97.1 2.6 North 97.7 22.6 South 94.7 7.0 West 87.2 12.7 All 93.8 10.0 Source: CGDR research
4.3 HOUSEHOLD CHARACTERISTICS
The household characteristics are compared across regions of Delhi with respect to characteristics of household head (HHH), family size and child labour in the household.
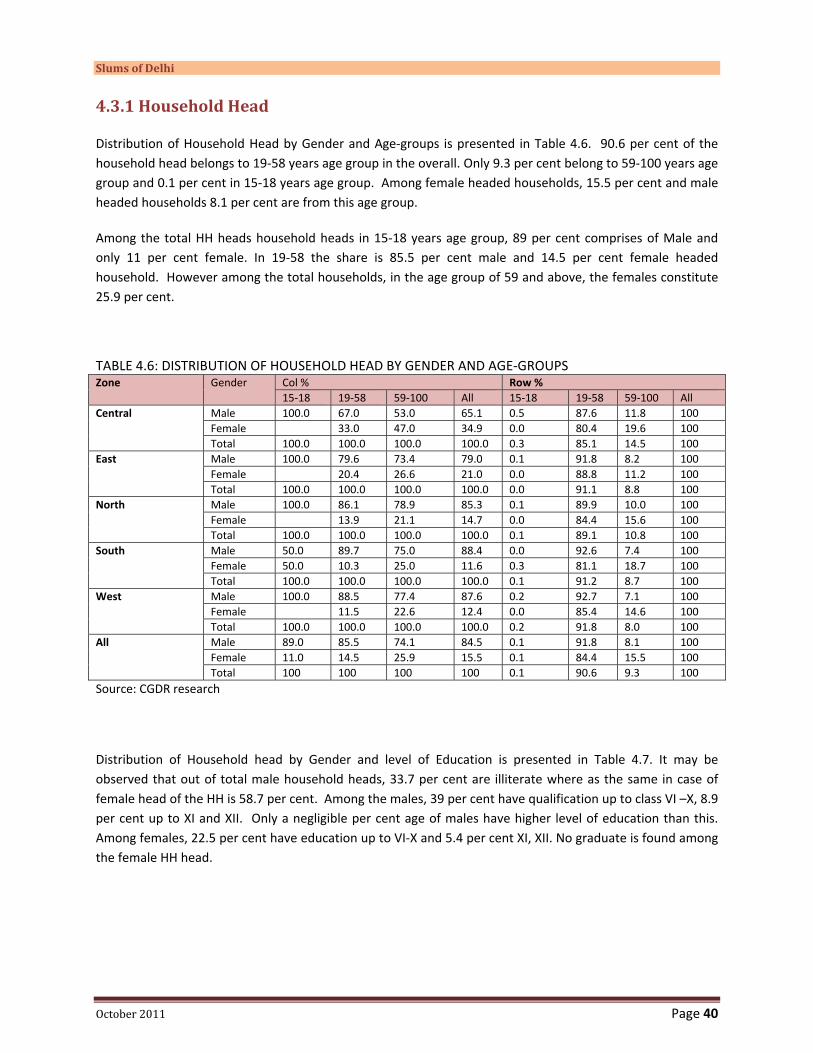
Slums of Delhi
October 2011 Page 40
4.3.1 Household Head
Distribution of Household Head by Gender and Age‐groups is presented in Table 4.6. 90.6 per cent of the household head belongs to 19‐58 years age group in the overall. Only 9.3 per cent belong to 59‐100 years age group and 0.1 per cent in 15‐18 years age group. Among female headed households, 15.5 per cent and male headed households 8.1 per cent are from this age group.
Among the total HH heads household heads in 15‐18 years age group, 89 per cent comprises of Male and only 11 per cent female. In 19‐58 the share is 85.5 per cent male and 14.5 per cent female headed household. However among the total households, in the age group of 59 and above, the females constitute 25.9 per cent.
TABLE 4.6: DISTRIBUTION OF HOUSEHOLD HEAD BY GENDER AND AGE‐GROUPS Zone Gender Col % Row %
15‐18 19‐58 59‐100 All 15‐18 19‐58 59‐100 All Central Male 100.0 67.0 53.0 65.1 0.5 87.6 11.8 100
Female 33.0 47.0 34.9 0.0 80.4 19.6 100 Total 100.0 100.0 100.0 100.0 0.3 85.1 14.5 100
East Male 100.0 79.6 73.4 79.0 0.1 91.8 8.2 100 Female 20.4 26.6 21.0 0.0 88.8 11.2 100 Total 100.0 100.0 100.0 100.0 0.0 91.1 8.8 100
North Male 100.0 86.1 78.9 85.3 0.1 89.9 10.0 100 Female 13.9 21.1 14.7 0.0 84.4 15.6 100 Total 100.0 100.0 100.0 100.0 0.1 89.1 10.8 100
South Male 50.0 89.7 75.0 88.4 0.0 92.6 7.4 100 Female 50.0 10.3 25.0 11.6 0.3 81.1 18.7 100 Total 100.0 100.0 100.0 100.0 0.1 91.2 8.7 100
West Male 100.0 88.5 77.4 87.6 0.2 92.7 7.1 100 Female 11.5 22.6 12.4 0.0 85.4 14.6 100 Total 100.0 100.0 100.0 100.0 0.2 91.8 8.0 100
All Male 89.0 85.5 74.1 84.5 0.1 91.8 8.1 100 Female 11.0 14.5 25.9 15.5 0.1 84.4 15.5 100 Total 100 100 100 100 0.1 90.6 9.3 100
Source: CGDR research
Distribution of Household head by Gender and level of Education is presented in Table 4.7. It may be observed that out of total male household heads, 33.7 per cent are illiterate where as the same in case of female head of the HH is 58.7 per cent. Among the males, 39 per cent have qualification up to class VI –X, 8.9 per cent up to XI and XII. Only a negligible per cent age of males have higher level of education than this. Among females, 22.5 per cent have education up to VI‐X and 5.4 per cent XI, XII. No graduate is found among the female HH head.

People and Social Structure
This document is intellectual property of Centre for Global Development Research Private Limited, New Delhi prepared with the help of SER Grant extended by the Planning Commission of India. No part of the document can be copied without a written permission of CGDR.
Page 41
TABLE 4.7: DISTRIBUTION OF HOUSEHOLD HEAD BY GENDER AND LEVEL OF EDUCATION Zone
Gender
Level of Education Illiterate Class I to V Class VI ‐ X Class XI, XII Graduate All
Central
Male 51.2 21.2 22.2 5.4 0.0 100.0 Female 76.1 17.3 6.2 0.5 0.0 100.0 Total 59.9 19.9 16.6 3.7 0.0 100.0
East
Male 35.0 19.8 36.3 8.8 0.0 100.0 Female 51.8 12.1 28.4 7.7 0.0 100.0 Total 38.6 18.2 34.7 8.6 0.0 100.0
North
Male 31.9 24.3 39.2 4.6 0.0 100.0 Female 57.1 12.0 28.5 2.4 0.0 100.0 Total 35.6 22.5 37.6 4.2 0.0 100.0
South
Male 24.8 15.8 46.0 13.4 0.1 100.0 Female 54.5 13.9 26.3 5.3 0.0 100.0 Total 28.2 15.6 43.7 12.4 0.1 100.0
West
Male 43.1 16.1 34.1 6.7 0.0 100.0 Female 62.9 13.8 15.0 8.2 0.0 100.0 Total 45.6 15.8 31.8 6.9 0.0 100.0
All
Male 33.7 18.4 39.0 8.9 0.0 100.0 Female 58.7 13.5 22.5 5.4 0.0 100.0 Total 37.6 17.6 36.4 8.3 0.0 100.0
Source: CGDR research
4.3.2 Household size
In Table 4.8, the distribution of households with family members Up to 5, 6‐10, 11‐15 and above 15 members is presented. Sixty‐two percent of the households have a family size up to 5 members, 36.8 per cent with 6‐10 members, and only 0.8 per cent with 11‐15 members. Only 0.1 per cent households in the North have reported having 15‐18 members.
TABLE 4.8: AVERAGE HOUSEHOLD SIZE AND DISTRIBUTION OF HOUSEHOLDS BY FAMILY SIZE Zone Total
HOUSEHOLDS Average household size
Distribution of households by family size Up to 5 members
6‐10 Members 11‐15 members
Above 15, up to 18
All
Central 25002 5.4 58.4 39.8 1.8 0 100 East 85408 5.0 63.9 35.2 0.9 0 100 North 79128 5.2 58 41 0.9 0.1 100 South 139814 5.3 58.4 40.9 0.7 0 100 West 104386 4.8 70.9 28.6 0.5 0 100 All 433738 5.1 62.4 36.8 0.8 0 100 Source: CGDR research
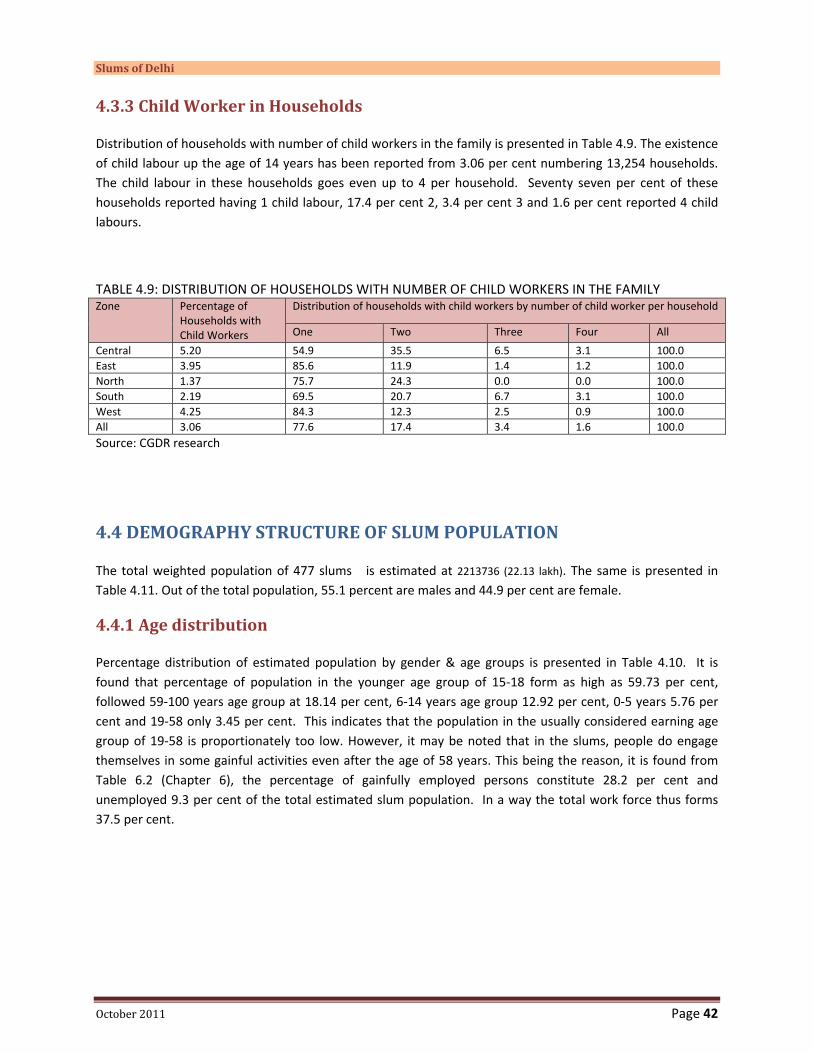
Slums of Delhi
October 2011 Page 42
4.3.3 Child Worker in Households
Distribution of households with number of child workers in the family is presented in Table 4.9. The existence of child labour up the age of 14 years has been reported from 3.06 per cent numbering 13,254 households. The child labour in these households goes even up to 4 per household. Seventy seven per cent of these households reported having 1 child labour, 17.4 per cent 2, 3.4 per cent 3 and 1.6 per cent reported 4 child labours.
TABLE 4.9: DISTRIBUTION OF HOUSEHOLDS WITH NUMBER OF CHILD WORKERS IN THE FAMILY Zone Percentage of
Households with Child Workers
Distribution of households with child workers by number of child worker per household
One Two Three Four All
Central 5.20 54.9 35.5 6.5 3.1 100.0 East 3.95 85.6 11.9 1.4 1.2 100.0 North 1.37 75.7 24.3 0.0 0.0 100.0 South 2.19 69.5 20.7 6.7 3.1 100.0 West 4.25 84.3 12.3 2.5 0.9 100.0 All 3.06 77.6 17.4 3.4 1.6 100.0 Source: CGDR research
4.4 DEMOGRAPHY STRUCTURE OF SLUM POPULATION
The total weighted population of 477 slums is estimated at 2213736 (22.13 lakh). The same is presented in Table 4.11. Out of the total population, 55.1 percent are males and 44.9 per cent are female.
4.4.1 Age distribution
Percentage distribution of estimated population by gender & age groups is presented in Table 4.10. It is found that percentage of population in the younger age group of 15‐18 form as high as 59.73 per cent, followed 59‐100 years age group at 18.14 per cent, 6‐14 years age group 12.92 per cent, 0‐5 years 5.76 per cent and 19‐58 only 3.45 per cent. This indicates that the population in the usually considered earning age group of 19‐58 is proportionately too low. However, it may be noted that in the slums, people do engage themselves in some gainful activities even after the age of 58 years. This being the reason, it is found from Table 6.2 (Chapter 6), the percentage of gainfully employed persons constitute 28.2 per cent and unemployed 9.3 per cent of the total estimated slum population. In a way the total work force thus forms 37.5 per cent.

People and Social Structure
This document is intellectual property of Centre for Global Development Research Private Limited, New Delhi prepared with the help of SER Grant extended by the Planning Commission of India. No part of the document can be copied without a written permission of CGDR.
Page 43
TABLE 4.10: PERCENTAGE DISTRIBUTION OF ESTIMATED NUMBER OF POPULATION BY GENEDER AND AGE GROUP Age Gender Central East North South West All 0‐5 Male 4.07 5.99 6.72 4.60 5.47 5.45 6‐14 12.00 15.92 10.52 14.39 13.84 13.68 15‐18 60.89 57.96 58.10 60.14 59.33 59.18 19‐58 4.12 2.11 5.12 3.42 2.87 3.39 59‐100 18.93 18.02 19.54 17.45 18.49 18.30 Total 100 100 100 100 100 100 0‐5 Female 8.80 6.32 6.83 4.37 7.00 6.14 6‐14 11.49 13.64 10.32 12.90 10.93 11.98 15‐18 61.25 59.06 59.47 61.17 60.99 60.41 19‐58 5.10 3.04 4.93 3.66 2.24 3.53 59‐100 13.36 17.93 18.45 17.91 18.84 17.94 Total 100 100 100 100 100 100 0‐5 Total 6.31 6.14 6.77 4.50 6.15 5.76 6‐14 11.76 14.91 10.43 13.73 12.55 12.92 15‐18 61.06 58.45 58.71 60.60 60.06 59.73 19‐58 4.59 2.53 5.04 3.52 2.59 3.45 59‐100 16.29 17.98 19.05 17.65 18.65 18.14 Total 100 100 100 100 100 100 Source: CGDR research
4.4.2 Gender Distribution
Distribution of slum population by gender is presented in Table 4.11. It is found that in the total estimated 22.13 lakh population, 55.1 per cent are Males and 44.9 per cent are females. The percentage of population above 18 years is 45.6 per cent. Among Males the percentage of it is as high as 76.4 percent and among Females it is as low as 8.7 per cent. The percentage of adult Males form 31.2 per cent of the total Male population and percentage of adult Females form 26.1 percent of the total female population. Male child up to 18 years from 23.9 percent to total male population and percentage of Female child form 18.8 per cent of total female population.
The ratio of Female to Male per 100 Males by age groups is presented in Table 4.12. Across all ages the ratio of Females per 100 Males is estimated at 80.28. Across age groups, the ratio is fairly better in 0‐5 year’s age group at 90.55. In case of Central & West Zone the ratio is even higher than that of Males to the extent of 195 and 101 respectively. This holds a positive signal as regards gender biasness is concerned. Even in the 19‐58 years age group higher Female to Male ratio is reported from Central and East zone to the extent of 111 & 114 respectively. Among children 56.31 percent are Boys and 43.69 percent are girls (Figure 4.3)

Slums of Delhi
October 2011 Page 44
TABLE 4.11: DISTRIBUTION OF SLUM POPULATION BY GENDER Zone Total
Population
Distribution by gender and adulthood Distribution by gender Percentage of population above 18 years
Adult Male
Adult Female
Male Child up to 18 yrs
Female child up to 18 yrs
Total Male
Total Female
Male Female All
Central 134176 33.8 31.5 17.9 16.8 51.6 48.4 69.3 9.3 40.3 East 430639 32.7 27.9 21.9 17.4 54.6 45.4 73.6 7.7 43.2 North 413986 33.3 28.2 21.7 16.8 55.1 44.9 75.4 11.1 45.9 South 736830 29.4 23.2 26.9 20.5 56.3 43.7 78.4 5.6 46.3 West 498102 30.2 25.6 24.5 19.7 54.7 45.3 79.1 11.4 48.1 All 2213736 31.2 26.1 23.9 18.8 55.1 44.9 76.4 8.7 45.6 Source: CGDR research
TABLE 4.12: RATIO OF FEMALE TO MALE (FEMALE PER 100 MALE) BY AGE GROUPS Central East North South West All 0‐5 194.71 84.01 82.41 75.85 100.69 90.55 6‐14 86.21 68.10 79.47 71.50 62.11 70.31 15‐18 90.54 81.00 82.92 81.14 80.86 81.94 19‐58 111.37 114.48 77.97 85.36 61.42 83.66 59‐100 63.49 79.13 76.48 81.84 80.14 78.70 All 90.00 79.49 81.01 79.77 78.66 80.28 Source: CGDR research
FIGURE 4.3: DISTRIBUTION OF ESTIMATED NUMBER OF CHILDREN UP TO 14 YEARS OF AGE BY GENDER
Source: CGDR research
4.4.3 Marital Status
Table 4.13 presents the distribution of population by marital status, gender & age groups. In the total estimated population, 47.80 per cent are married. At the gender level 45.33 per cent males and 50.86 per cent females are married. About 0.32 per cent males and 0.74 per females are either separated or divorced. About 0.68 per cent males and 0.09 per cent females are abandoned. Percentage of widower among males is 0.25 per cent and among females it is 3.43 per cent.
Central East North South West All
Girls 44 42.57 42.75 43.69 45.27 43.69
Boys 56 57.43 57.25 56.31 54.73 56.31
Distribution of children of age 5‐14 year by gender

People and Social Structure
This document is intellectual property of Centre for Global Development Research Private Limited, New Delhi prepared with the help of SER Grant extended by the Planning Commission of India. No part of the document can be copied without a written permission of CGDR.
Page 45
The concept of living together is taking place even in slums. The same is reported at 0.13 per cent among male 0.13 per cent and 0.02 per cent among females. Across age groups, no case of child marriage in the 0‐14 age group has been reported. However, among males in the 15‐18 years 0.85 per cent is reported married and among females the same is 4.05. This is again not the legal age for marriage being 18 years for girls and 21 years for boys.
TABLE 4.13: DISTRIBUTION OF POPULATION BY MARITAL STATUS, GENDER & AGE GROUPS Gender Marital Status Percentage distribution by age group
0‐14 15‐18 19‐58 59‐100 All Male Married 0.85 71.39 90.29 45.33
Separated / Divorced 0.27 0.42 1.06 0.32 Abandoned 0.86 5.05 0.68 Windowed 0.25 3.13 0.25 Living together 0.22 0.00 0.13 Unmarried / without live‐in partner 100 98.88 26.86 0.48 53.28 All 100 100 100 100 100
Female Married 4.05 80.25 59.92 50.86 Separated / Divorced 0.17 1.12 1.23 0.74 Abandoned 0.00 0.11 0.61 0.09 Windowed 0.21 3.56 35.83 3.43 Living together 0.00 0.04 0.00 0.02 Unmarried / without live‐in partner 100 95.56 14.92 2.40 44.85 All 100 100 100 100 100
Total Married 2.18 75.37 76.46 47.80 Separated / Divorced 0.23 0.74 1.14 0.51 Abandoned 0.00 0.52 3.03 0.42 Windowed 0.09 1.74 18.03 1.67 Living together 0.00 0.14 0.00 0.08 Unmarried / without live‐in partner 100 97.50 21.49 1.35 49.53 All 100 100 100 100 100
Source: CGDR research
TABLE 4.14: DISTRIBUTION OF POPULATION BY MARITAL STATUS ACROSS GENDER AND REGIONS Gender Row Labels Central East North South West All Male Married 35.3 45.1 44.8 48.1 44.8 45.3
Separated / Divorced 0.6 0.0 0.2 0.1 0.9 0.3 Abandoned 2.8 0.3 0.3 0.6 0.8 0.7 Windowed 0.3 0.3 0.3 0.3 0.1 0.3 Living together 0.0 0.0 0.3 0.0 0.3 0.1 Unmarried / without live‐in partner 61.0 54.3 54.2 50.8 53.1 53.3 All 100 100 100 100 100 100
Female Married 34.2 52.0 50.6 53.4 51.5 50.9 Separated / Divorced 2.8 0.2 0.5 0.3 1.4 0.7 Abandoned 0.7 0.0 0.1 0.0 0.1 0.1 Windowed 8.5 3.7 3.4 2.9 2.6 3.4 Living together 0.0 0.0 0.0 0.0 0.1 0.0 Unmarried / without live‐in partner 53.8 44.1 45.4 43.4 44.4 44.9 All 100 100 100 100 100 100

Slums of Delhi
October 2011 Page 46
Gender Row Labels Central East North South West All Total
Married 34.8 48.2 47.4 50.5 47.8 47.8 Separated / Divorced 1.6 0.1 0.3 0.2 1.1 0.5 Abandoned 1.8 0.2 0.2 0.4 0.5 0.4 Windowed 4.2 1.8 1.7 1.4 1.2 1.7 Living together 0.0 0.0 0.2 0.0 0.2 0.1 Unmarried / without live‐in partner 57.6 49.8 50.3 47.5 49.2 49.5 All 100 100 100 100 100 100
Source: CGDR research
4.5 SOCIAL AND RELIGIOUS STRUCTURE OF SLUM CLUSTERS
Generally, slums present a mix of all hues of society but the representation is at variance with the general population which indicate the prevalent deprivation level in respective group with respect to other in general population. It can be an important indicator of the social disparities which continue to exist in our society.
4.5.1 Overwhelming Population of Slum belong to majority religion
Table 4.15 presents distribution of Households by religion and zone. Hindu community constitute 87.5 per cent, Muslims 12.1 per cent, Christens 0.1 per cent, Sikhs o.2 per cent and others a negligible percentage. However across zones the composition does vary to some extent. Muslims are mostly concentrated in Central zone with a share of 49.3 percent in the total households in the zone followed by 14.5 per cent in North zone. The presence of Christen community is reported only from Central and South zone to the extent of 0.2 per cent and 0.3 per cent respectively in these zones. Sikhs are found in maximum number in Central zone at 1.0 per cent of the total slum households in this zone.
TABLE 4.15: DISTRIBUTION OF HOUSEHOLDS BY RELIGION & ZONE Zone Hindu Muslim Christian Sikh Other All Central 49.3 49.3 0.2 1.0 0.2 100.0 East 87.3 12.3 0.0 0.4 0.0 100.0 North 85.1 14.5 0.0 0.4 0.0 100.0 South 91.2 8.3 0.3 0.1 0.0 100.0 West 93.8 6.2 0.0 0.0 0.0 100.0 All 87.5 12.1 0.1 0.2 0.0 100.0 Source: CGDR research
4.5.2 Majority slum population belongs to deprived class of society
Distribution of households by social groups is presented in Table 4.16. It is found that the relationship between caste and poverty still hold good in the country. At the aggregate level, SCs form 47.0 per cent, OBC 35.2 per cent, ST 2.6 per cent and the remaining 15.2 per cent are from the General category. Highest percentage of SCs is reported from North with 51.7 per cent and the lowest in central region at 35.7 per cent.

People and Social Structure
This document is intellectual property of Centre for Global Development Research Private Limited, New Delhi prepared with the help of SER Grant extended by the Planning Commission of India. No part of the document can be copied without a written permission of CGDR.
Page 47
As regards OBC’s highest percentage is reported from Central at 48.7 per cent and the lowest from North at 31.9 per cent.
From the distribution of households by caste & religion it is observed that among Hindus 53.5 per cent of the total households belong to SC, 30.5 per cent OBC, 2.9 per cent ST and the remaining 13.1 per cent in General category. In case of Muslims OBCs account for the majority of the households at 70.2 per cent, SC only 0.7 per cent, ST 0.4 per cent and General category 28.7 per cent. Among Christians all households are from General category. Among the Sikh’s 34.5 per cent are OBC, 12.4 per cent SC and 53.1 per cent in General category
TABLE 4.16: DISTRIBUTION OF HOUSEHOLDS BY SOCIAL GROUP Zone SC ST OBC General All Central 35.7 0.7 48.7 14.9 100.0 East 47.1 1.1 33.4 18.3 100.0 North 51.7 2.0 31.9 14.3 100.0 South 47.4 3.1 34.7 14.8 100.0 West 45.4 3.8 36.7 14.1 100.0 All 47.0 2.6 35.2 15.2 100.0 Hindu 53.5 2.9 30.5 13.1 100.0 Muslim 0.7 0.4 70.2 28.7 100.0 Christian 0.0 0.0 0.0 100.0 100.0 Sikh 12.4 0.0 34.5 53.1 100.0 Other 0.0 0.0 0.0 100.0 100.0 Source: CGDR research
.
4.6 EDUCATION AND AWARENESS ABOUT VALUE OF EDUCATION
Table 4.17 presents the percentage of estimated population by level of education age groups and gender. In the overall, 32.91 per cent of the total population are illiterate. Among the Males the percentage is 24.20 as against 43.77 in case of Females.
Among the children of three to five years age group, about 1/3rd are enrolled in school which reveals good awareness towards education among the slum inhabitants. It is heartening to note that there is no discrimination against female child.
Among 6‐14 years age group, 57.95 per cent are in Class I‐V and 34.14 per cent in Class VI‐X. In all, 92.09 per cent are going to school & remaining 7 per cent are not having any formal education. In this age group also there is not much difference between percentage of boys and girls having education in respective classes.

Slums of Delhi
October 2011 Page 48
In the 15‐18 years age group, percentage of illiterates among the males and the females is almost the same being 12.31 for males and 12.89 for females. Percentage of boys and girls in class XI & XII is also alike at 12.31 & 12.89 per cent respectively.
It is found that extent of Illiteracy is relatively more in higher age groups with wide gender variation. The extent of illiteracy in 19‐58 years among males is 27.21 percent and females 56.13 per cent. In 59‐100 the same is 61.61 for males and 84.32 per cent for females.
In 19‐58 years age group, among males 9.33 per cent are with XI & XII qualification & among females the same is 3.56 per cent. Graduates and diploma holders among males form 3.16 per cent and among females 1.79 per cent. Post graduates among males are 0.34 per cent and among females o.04 per cent.
TABLE 4.17: PERCENTAGE DISTRIBUTION OF ESTIMATED POPULATION BY QUALIFICATION, GENDER & AGE GROUPS Qualification Gender Percentage distribution by age group and gender
3‐5 6‐14 15‐18 19‐58 59‐100 TotalIlliterate Male 69.34 6.98 12.31 27.21 61.61 24.20Class I‐V 30.66 59.07 9.69 18.00 15.09 24.87 Class VI to X 33.95 62.94 41.96 20.56 41.03 Class XI & XII 15.05 9.33 2.18 7.79 Graduate/ Diploma 3.16 0.56 1.91 Post graduate 0.34 0.00 0.20All 100.00 100.00 100.00 100.00 100.00 100.00Illiterate Female 69.13 9.08 12.89 56.13 84.32 43.77Class I‐V 30.87 56.54 11.91 15.50 8.47 22.99 Class VI to X 34.39 59.47 22.98 5.42 27.93 Class XI & XII 15.73 3.56 1.79 4.20 Graduate/ Diploma 1.79 0.00 1.09 Post graduate 0.04 0.00 0.02All 100.00 100.00 100.00 100.00 100.00 100.00Illiterate Total 69.24 7.90 12.55 40.22 71.95 32.91Class I‐V 30.76 57.95 10.61 16.88 12.08 24.03 Class VI to X 34.14 61.50 33.42 13.66 35.20 Class XI & XII 15.33 6.74 2.00 6.19 Graduate/ Diploma 2.54 0.30 1.55 Post graduate 0.20 0.00 0.12All 100.00 100.00 100.00 100.00 100.00 100.00
Source: CGDR research
4.6.1 School Going Children
Percentage of School going children up to the age of 18 years to total population and percentage of school going children to total children up to 18 years is presented in Table 4.18. The percentage of School going children to total children up to 18 years from 60.3 per cent. The percentage to college going children in total population is about 2.45 per cent.

People and Social Structure
This document is intellectual property of Centre for Global Development Research Private Limited, New Delhi prepared with the help of SER Grant extended by the Planning Commission of India. No part of the document can be copied without a written permission of CGDR.
Page 49
TABLE 4.18: DISTRIBUTION OF SCHOOL GOING CHILDREN UP TO 18 YRS OF AGE & PERCENTAGE OF SCHOOL GOING CHILDREN TO TOTAL CHILDREN UP TO 18 YEARS Zone Percentage of Children up to
18 years to total population Percentage of school going children to total Children up to 18 yrs
Percentage of college going
Central 34.7 53.2 2.13
East 39.4 64.7 4.54
North 38.5 65.9 0.93
South 47.4 58.7 2.56
West 44.2 57.1 1.85
All 42.7 60.3 2.45
Source: CGDR research
LOW GENDER DISCRIMINATION IN ENROLMENT
Figure 4.4 presents distribution of Children up to 14 years by enrolment status in school. In the overall, 83.22 percent children, 83.64 percent of total boys and 82.68 percent of total girls are presently studying at school which is as very encouraging sign. Never enrolled in school consists of 12.56 percent of total boys and 12.74 percent of total girls. Enrolled but dropped out is 3.80 percent for boys and 4.58 percent for girls.
FIGURE 4.4: PERCENTAGE OF CHILDREN OF 5‐14 YEARS OF AGE BY ENROLMENT STATUS IN SCHOOL
Source: CGDR research
Boys Girls
Studying at present 83.64 82.68
Enrolled But Dropped Out 3.80 4.58
Never Enrolled in school 12.56 12.74
0.0
20.0
40.0
60.0
80.0
100.0
120.0Enrollment Status

Slums of Delhi
October 2011 Page 50
HIGH GENDER DISCRIMINATION TOWARDS HIGHER EDUCATION IN DROPOUT CASES
From Figure 4.4 it was found that 12.56 per cent of Boys and 12.74 per cent of the Girls never enrolled in the schools. Enrolled but dropped out was reported at 3.80 percent for Boys and 4.58 per cent for Girls, dropped out from schools. Such children form 16.78 percent numbering 66,667 out of total 3, 97,257 children in 5‐14 years age group. For those 66,667 children, the reasons for not enrolling or discontinuing studies were asked. The same is presented in Table 4.5. For 67.04 percent of Boys and 55.98 percent of Girls, ’developed disinterest ‘was assigned as a reason, ‘not allowed to continue studies by parents’ was reported in respect of 15.17 per cent of the Boys and almost double at 33.39 per cent in respect of Girls.
FIGURE 4.5: DISTRIBUTION OF REASONS FOR DISCONTINUING STUDIES BY CHILDREN IN 5‐14 YEARS AGE
Source: CGDR research
HIGH UNEMPLOYMENT/ DOING NOTHING AMONG YOUTH
Figure 4.6 present distribution of present status of Children not studying at present. Ninety‐two percent of the Boys and 89.89 girls are not doing anything at present; 7.24 percent Boys and 9.46 percent Girls are helping in household work and 0.54 percent Boys and 0.65 percent Girls are working for earning.
Boys Girls
Any other reasons specify 1.1 1.45
Had to earn for the family 16.68 9.18
Not allowed to continue by parents 15.17 33.39
Developed disinterest 67.04 55.98
0.020.040.060.080.0100.0120.0
Reasons of Drop out

People and Social Structure
This document is intellectual property of Centre for Global Development Research Private Limited, New Delhi prepared with the help of SER Grant extended by the Planning Commission of India. No part of the document can be copied without a written permission of CGDR.
Page 51
FIGURE 4.6: DISTRIBUTION OF PRESENT STATUS OF CHILDREN NOT STUDYING AT PRESENT
Source: CGDR research
HIGH AWARENESS ABOUT IMPORTANCE OF SCHOOL EDUCATION AMONG PARENTS FOR EMPLOYMENT BUT NOT FOR
HIGHER EDUCATION
Distribution of estimated households based on their comments about value of Education in terms of prospect for employment is presented in the Figure 4.7. About 91 percent of the estimated households reported in the positive that education has value in terms of prospect for employment. The same varies between 85.2 per cent in Central to 93.2 per cent in west.
Distribution of estimated number of households on their comments on level up to which education is desirable for Females & Males is presented in Figure 4.8. About 24 percent per cent of the households are of the opinion that for Females it is desirable to study at least up to 10th class and same was reported by 25.5 per cent of the households in case of Males.
Minimum desirable education up to 12th class is reported by 37 per cent of the households in case of females and 36 per cent of the households for males.
Minimum education desirable up to graduation is reported by 37.1 percent in case of females and 36.8 per cent in case of males. There is not much difference in the household’s comments on the level of education desirable for females and males. This indicates that the slum dwellers of Delhi have overcome the gender bias attitude mostly found among the people in backward and rural areas. This is a positive sign
Boys Girls
Working for earning 0.54 0.65
Helping in household work 7.24 9.46
Doing Nothing 92.22 89.89
Non‐Studying Children

Slums of Delhi
October 2011 Page 52
FIGURE 4.7: DISTRIBUTION OF ESTIMATED HOUSEHOLDS ON THEIR COMMENTS ON VALUE OF EDUCATION IN TERMS OF PROSPECT FOR EMPLOYMENT
Source: CGDR research
FIGURE 4.8: DISTRIBUTION OF ESTIMATED NUMBER OF HOUSEHOLDS ON THEIR COMMENTS ON LEVEL UP TO WHICH EDUCATION IS DESIRABLE FOR FEMALES & MALES
Source: CGDR research
LOW PRIORITY FOR HIGHER EDUCATION
Response with respect to planning to impart higher education such as master’s degree, engineering, diploma, master of business administration, and ITI, to both female & male children is very low. However, this attitude is alike for both genders. Only 8.5 per cent of the households have plan to impart higher education to female child and the same is 9 per cent in case of male child
85.2
92.8
89.790.8
93.2
91.2
Central East North South West All
Affirmative Response to Value of Education for Employment
Females Males
Professional courses 0.3 0.3
Post‐ Graduation 1.1 0.9
Graduate 37.1 36.8
12th 37 36
11th 0.3 0.2
10th 23.9 25.5
2nd 0.2 0.2
0.020.040.060.080.0100.0120.0
Desired Education Level

People and Social Structure
This document is intellectual property of Centre for Global Development Research Private Limited, New Delhi prepared with the help of SER Grant extended by the Planning Commission of India. No part of the document can be copied without a written permission of CGDR.
Page 53
FIGURE 4.9: DISTRIBUTION OF ESTIMATED NUMBER OF HOUSEHOLDS BY THEIR PLANNING TO IMPART HIGHER EDUCATION (ITI, DIPLOMA, ENGINEERING DEGREE, MBA ETC) FOR FEMALE & MALE CHILD
Source: CGDR research
4.6.2 Affordability as Major Constraint to higher education
Table 4.20 presents the distribution of estimated number of households by their affordability to impart higher elementary children. Only 6.9 per cent of the households could afford higher education. These households were asked the source of finance for the same. About 68 percent reported self arrangement from own sources, 11.2 households from their own bank deposits, 18.5 per cent from bank loan and 2.2 percent with loans from friends and relatives.
FIGURE 4.10: DISTRIBUTION OF ESTIMATED NUMBER OF HOUSEHOLDS BY THEIR AFFORDABILITY TO IMPART HIGHER THAN ELEMENTARY EDUCATION FOR THEIR CHILDREN
Source: CGDR research
8.5
9
Female Child Male Child
Willing to Impart Higher Education
1.7
5.7
10.3
7 6.5 6.9
Central East North South West All
Percentage Reporting affordability to impart higher education

Slums of Delhi
October 2011 Page 54
TABLE 4.19: DISTRIBUTION OF ESTIMATED NUMBER OF HOUSEHOLDS BY THEIR AFFORDABILITY TO IMPART HIGHER THAN ELEMENTARY EDUCATION FOR THEIR CHILDREN & LIKELY SOURCE OF FINANCE Zone Percentage of
HS with affordability
Source of Finance Bank Deposits Bank loan Self Loan from Friends
and relatives All
Central 1.7 0 51.8 48.2 0 100 East 5.7 17.9 32.4 44.7 5.1 100 North 10.3 0 11.2 88.8 0 100 South 7 25.4 25 47.4 2.2 100 West 6.5 0 6.1 90.9 3 100 All 6.9 11.2 18.5 68.1 2.2 100 Source: CGDR research
4.7 AWARENESS AND AFORDABILITY ABOUT SOCIAL SECURITY
In general the economic situation of poor people does permit to think too long in to future due to high day to day constraints. The awareness about future security is poor among rural population and the same continues when they come to live in slums. However, with improvement in economic condition they take conscious decision about the next priority and it appears that people care more about the children education rather than their own future. Moreover, many social security systems are misunderstood and also they are associated with outflow which has dividend only in exigencies. Such eventualities may or not be easy to priorities for very low income population. Yet, as indicated below there are definite exceptions to this attitude.
4.7.1 Healthcare Related Security
Figure 4.11 shows the percentage of people covering themselves with one or the other health related scheme. It is found that only 1.6 per cent of the total Households has Medical Insurance cover, 5.03 per cent have Smart Card varying between 1.62 per cent in Central to 10.84 per cent in West. Only 4.7 per cent of the Households are entitled to ESI facility
4.7.2 General Medical Insurance
Only 1.6 per cent of the total households have Medical Insurance cover. This is has links to awareness as well affordability. Poor people have to care more about day‐to‐day needs rather than unforeseen exigencies. Planning for such exigencies can be better with the help of government.
4.7.3 Employees State Insurance Corporation (ESIC) Facility
4.7 percent of the total households are entitled to ESI facility. This reflects on the plight of unorganised labour, where employers are not obliged to provide medical cover. There should be some provision that individual could also be member of ESI facilities by paying nominal premium.
4.7.4 Smart Card
Figure 4.12 presents distribution of households having awareness, possession and use of Smart Card facility provided by the government. As regards awareness of the provision of Smart Card facility provided by the

People and Social Structure
This document is intellectual property of Centre for Global Development Research Private Limited, New Delhi prepared with the help of SER Grant extended by the Planning Commission of India. No part of the document can be copied without a written permission of CGDR.
Page 55
government, only 10.64 per cent are reportedly aware of it. However, across zones, highest percentage of households aware is reported from West Zone at 18.47 per cent and lowest at 1.62 per cent from Central zone. Only 5.03 per cent of the total households have received Smart card, varying between highest in West at 10.84 to the lowest in East at 1.37 per cent. Only 0.76 per cent of the Households have used Smart Card
FIGURE 4.11: PERCENTAGE OF HOUSEHOLDS HAVING MEDICAL FACILITY RELATED INSURANCE
Source: CGDR research
FIGURE 4.12: DISTRIBUTION OF HOUSEHOLDS HAVING AWARENESS, POSSESSION AND USE OF ABOUT SMART CARD FACILITY PROVIDED BY THE GOVERNMENT
Source: CGDR research
Central East North South West All
Medical Insurance 1.7 4.1 0.2 0.9 1.5 1.6
Smart Card 1.62 1.37 5.86 3.06 10.84 5.03
ESI 1.7 2.9 6 3.9 6.8 4.7
0
2
4
6
8
10
12
Medical Facility Related Security
Central East North South West All
Aware 1.62 7.88 8.59 9.26 18.47 10.64
Received 1.62 1.37 5.86 3.06 10.84 5.03
Used 0.00 0.23 0.62 0.78 1.47 0.76
02468101214161820
Smart Card

Slums of Delhi
October 2011 Page 56
4.7.5 Life Insurance Policy
Figure 4.13 presents distributions of households with and without having an L.I.C. Policy. With a policy was reported by 15.4 percent of the households & 0.6 per cent held but discontinued
FIGURE 4.13: DISTRIBUTION OF HOUSEHOLDS WITH, LIFE INSURANCE POLICY
Source: CGDR research
.
4.7.6 Pension
Figure 4.14 presents distribution of HH Head receiving and not receiving Pension. Only 3.14 per cent are receiving pension and 96.9 percent are not. O.73 per cent of the HHH are receiving Widow Pension, 0.14 per cent Family pension, 2.08 per cent Old Age Pension, and 0.19 per cent receiving Employer Pension
Figure 4.15 the distribution of HH head having made any arrangement for Child’s future. In the overall, only 3.41 per cent of the HHH have made some arrangement. Out of 1.48 per cent have Bank deposits, 0.15 Employees Provident Fund (EPF), 1.73 per cent has LIC and 0.05 per cent has Pension to support it.
Central East North South West All
LIC Policy Holders 6 9.7 16.9 19.2 16 15.4
Held but discontinued 1.6 0.3 0.3 0.8 0.7 0.6
0
5
10
15
20
25
Life Insurance
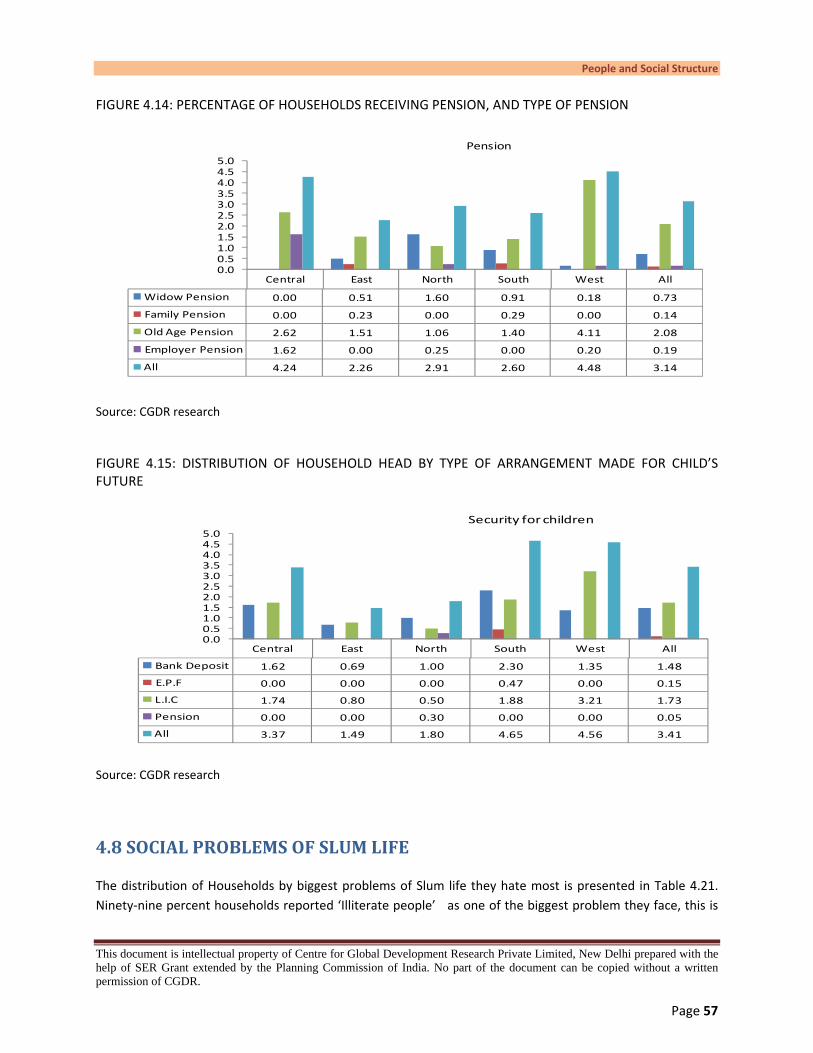
People and Social Structure
This document is intellectual property of Centre for Global Development Research Private Limited, New Delhi prepared with the help of SER Grant extended by the Planning Commission of India. No part of the document can be copied without a written permission of CGDR.
Page 57
FIGURE 4.14: PERCENTAGE OF HOUSEHOLDS RECEIVING PENSION, AND TYPE OF PENSION
Source: CGDR research
FIGURE 4.15: DISTRIBUTION OF HOUSEHOLD HEAD BY TYPE OF ARRANGEMENT MADE FOR CHILD’S FUTURE
Source: CGDR research
4.8 SOCIAL PROBLEMS OF SLUM LIFE
The distribution of Households by biggest problems of Slum life they hate most is presented in Table 4.21. Ninety‐nine percent households reported ‘Illiterate people’ as one of the biggest problem they face, this is
Central East North South West All
Widow Pension 0.00 0.51 1.60 0.91 0.18 0.73
Family Pension 0.00 0.23 0.00 0.29 0.00 0.14
Old Age Pension 2.62 1.51 1.06 1.40 4.11 2.08
Employer Pension 1.62 0.00 0.25 0.00 0.20 0.19
All 4.24 2.26 2.91 2.60 4.48 3.14
0.00.51.01.52.02.53.03.54.04.55.0
Pension
Central East North South West All
Bank Deposit 1.62 0.69 1.00 2.30 1.35 1.48
E.P.F 0.00 0.00 0.00 0.47 0.00 0.15
L.I.C 1.74 0.80 0.50 1.88 3.21 1.73
Pension 0.00 0.00 0.30 0.00 0.00 0.05
All 3.37 1.49 1.80 4.65 4.56 3.41
0.00.51.01.52.02.53.03.54.04.55.0
Security for children

Slums of Delhi
October 2011 Page 58
followed by ‘quarrel on petty matters’ reported by 53.0 percent of the households, 41.0 reported threat by ‘Govt. Authority Officials’, 33 per cent ‘Eve Teasing’ and 22 percent ‘Use of Abusive Language’. Across zones, Eve Teasing has been reported the maximum at 52 per cent in West, 41.0 percent in South and 26.0 percent in North.
Incidence of ‘Gambling’ has been reported by maximum number of households being 46.7 percent in West, & 36.3 percent in South. ‘Eve Teasing’ has been reported by 51.8 percent in West, 40.8 percent in South and 26 percent in North. ‘Abusive Language’ has been reported by 52 percent in East and 48 percent in Central Zone. ‘Threat by Government Officials’ have been reported by 41 percent Households in the overall and across zones, the same form 59.2 percent in East, 56.7 percent in Central, 33.0 and 34 percent in North and South zone respectively.
TABLE 4.20: PERCENTAGE OF HOUSEHOLDS REPORTING FIVE BIGGEST PROBLEMS OF SLUM LIFE THEY HATE MOST Biggest Problems Central East North South West AllAbusive Language 48.29 52.24 21.68 7.15 10.08 21.76
Electricity problem 0.00 0.57 0.25 0.00 0.94 0.38
Eve teasing 16.00 10.24 26.38 40.82 51.75 33.36
Gambling 11.58 11.04 12.71 36.28 46.72 28.10
Illiterate People 96.46 99.44 99.25 98.31 100.00 99.00
Lake of hygiene 0.00 0.29 0.00 0.00 0.57 0.19
Quarrel on Petty Maters 65.10 63.99 54.80 46.33 49.11 53.11
Sound Pollution 0.93 0.00 0.00 0.00 0.00 0.05
Theft 0.00 0.00 0.25 0.16 0.39 0.19
Threat by Government Officinal 56.73 59.22 33.24 34.49 37.43 41.12
water problem 0.00 0.00 0.25 0.00 0.37 0.14
Source: CGDR research
4.9 CONCLUDING OBSERVATIONS
Slum dwellers hail from diverse background native origins. Many of them had resided in Delhi before moving to slums, while others came directly to the current slum. Even those who came from Delhi, their native place appears to be mostly out of Delhi. As per the survey results, 86 per cent of the slum dwellers hail from 68 districts of U.P. and 36 districts of Bihar. Majority of 67.2 per cent of the Households are staying in the slum for 16 to 30 years. In the total households 87.0 per cent are ration card holders comprising of BPL, AAY and APL card holders. The remaining 13 per cent do not possess any ration card which puts a question mark on their residential status. The percentage of total BPL Households constitute 53.07 per cent which is much higher than the all India average figure for percentage of people below poverty lines. The prevalence of child labour has been reported from 3.06 per cent of the HOUSEHOLDS. The ratio of females to is fairly proportionate & even in certain zones higher female to male ratio has been observed. Although there is hardly any case of child marriage reported from any slum, marriage of males below 18 years & females below the age of 21 has been reported to the extent of 0.85 per cent and 4.05 per cent respectively have been reported which is against the law of the land. It is found that the relationship between caste and poverty is still hold good in the country. In the total households, SC’s form 47.0 per cent, OBC 35.2 per cent, ST 2.6 per cent and the remaining 15.2 per cent are from the General category. It is more heartening to find that there

People and Social Structure
This document is intellectual property of Centre for Global Development Research Private Limited, New Delhi prepared with the help of SER Grant extended by the Planning Commission of India. No part of the document can be copied without a written permission of CGDR.
Page 59
is no discrimination in providing this opportunity to female child which becomes evident from the fact that among the female child in this age group 30.87 per cent are going to school, close to 30.87 per cent in respect of male child. The value of education in terms of prospect o for employment has been acknowledged by majority of 91 percent of the Households. However, only about 7 per cent of the Households expressed affordability to impart higher education to their children.
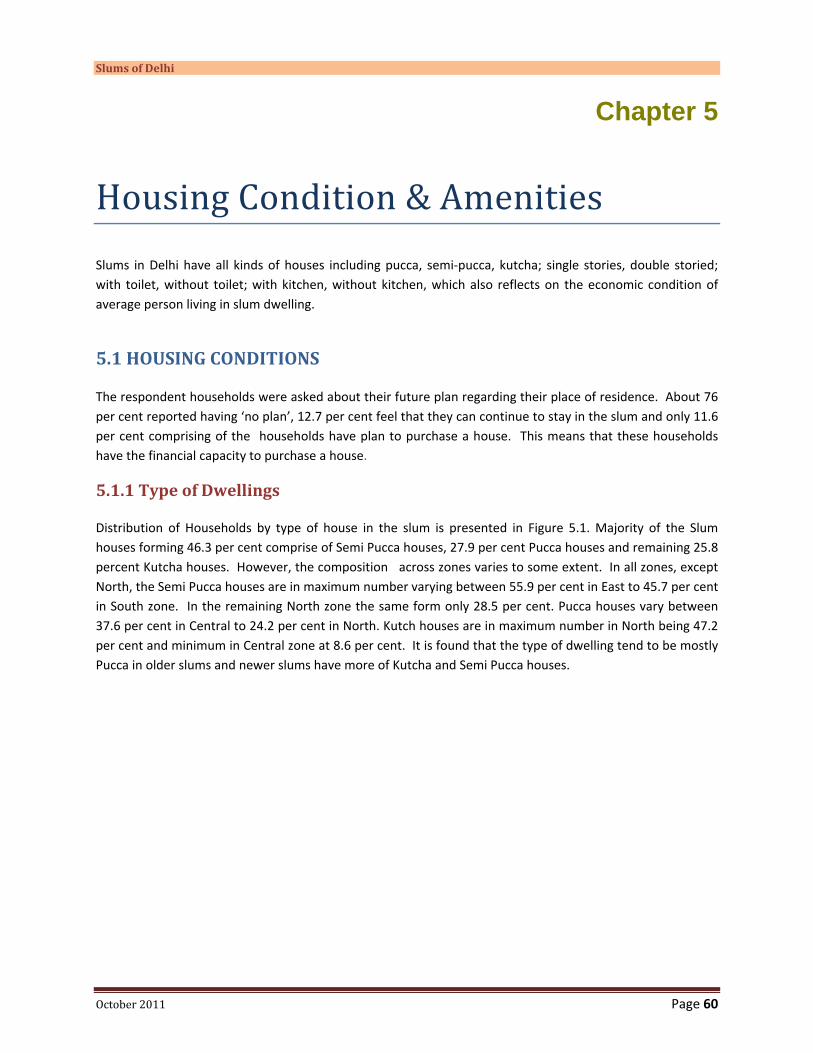
Slums of Delhi
October 2011 Page 60
Chapter 5
Housing Condition & Amenities Slums in Delhi have all kinds of houses including pucca, semi‐pucca, kutcha; single stories, double storied; with toilet, without toilet; with kitchen, without kitchen, which also reflects on the economic condition of average person living in slum dwelling.
5.1 HOUSING CONDITIONS
The respondent households were asked about their future plan regarding their place of residence. About 76 per cent reported having ‘no plan’, 12.7 per cent feel that they can continue to stay in the slum and only 11.6 per cent comprising of the households have plan to purchase a house. This means that these households have the financial capacity to purchase a house.
5.1.1 Type of Dwellings
Distribution of Households by type of house in the slum is presented in Figure 5.1. Majority of the Slum houses forming 46.3 per cent comprise of Semi Pucca houses, 27.9 per cent Pucca houses and remaining 25.8 percent Kutcha houses. However, the composition across zones varies to some extent. In all zones, except North, the Semi Pucca houses are in maximum number varying between 55.9 per cent in East to 45.7 per cent in South zone. In the remaining North zone the same form only 28.5 per cent. Pucca houses vary between 37.6 per cent in Central to 24.2 per cent in North. Kutch houses are in maximum number in North being 47.2 per cent and minimum in Central zone at 8.6 per cent. It is found that the type of dwelling tend to be mostly Pucca in older slums and newer slums have more of Kutcha and Semi Pucca houses.
HOUSING CONDITION AND AMINITIES
This document is intellectual property of Centre for Global Development Research Private Limited, New Delhi prepared with the help of SER Grant extended by the Planning Commission of India. No part of the document can be copied without a written permission of CGDR
Page 61
FIGURE 5.1: DISTRIBUTION OF HOUSEHOLDS BY TYPE OF HOUSE IN THE SLUM
Source: CGDR research: based on household survey of 2024 households
FIGURE 5.2: A KUTCHA (LEFT) AND A PUCCA (RIGHT) DWELLING IN A SLUM OF DELHI
Central East North South West All
Kutcha 8.6 14 47.2 29.8 17.8 25.8
Semi Pucca 53.8 55.9 28.5 45.7 51 46.3
Pucca 37.6 30.1 24.2 24.5 31.2 27.9
Housing Condition

Slums of Delhi
October 2011 Page 62
FIGURE 5.3: A SEMI PUCCA DWELLING WITH COOLER FITTED IN WALL (LEFT) AND A MULTISTORIED PUCCA SLUM DWELLING (RIGHT)
5.1.2 Construction floors
Table 5.1 presents the distribution of estimated number of households with single storey, two storeys and three storeys. About 92 per cent of the slums houses are built on the ground floor only; about 8 per cent have two floors and a negligible 0.09 per cent houses have three floors. Highest number of two story slum houses was reported in Central zone being 29.61 per cent followed by 11.55 per cent in West zone. Once again, the older the slum the higher is the number of two story houses. It may be due to natural expansion of family size over years causing increase in demand for additional space.
TABLE 5.1: DISTRIBUTION OF ESTIMATED NUMBER OF HOUSEHOLDS WITH ONE STOREY, TWO STOREY AND THREE STOREY STRUCTURE Zone One storey Two Storey Three Storey All Central 70.39 29.61 0.00 100 East 95.62 4.38 0.00 100 North 94.63 4.87 0.50 100 South 94.74 5.26 0.00 100 West 88.45 11.55 0.00 100 All 91.97 7.93 0.09 100 Source: CGDR research
5.1.3 Number of rooms
Average number of rooms in a slum house is reported at 1.14 varying between 1.09 in East to 1.32 in Central. Average number of rooms in the ground floor is 1.05 varying between 1.03 in Central to 1.09 in North. The average number of rooms in the first floor is only 0.12 varying between 0.07 in North to 0.32 in Central zone.
Slum houses with second floor were reported only from North zone. The average number of room for the same is estimated at 0.01 (Table 5.2).

HOUSING CONDITION AND AMINITIES
This document is intellectual property of Centre for Global Development Research Private Limited, New Delhi prepared with the help of SER Grant extended by the Planning Commission of India. No part of the document can be copied without a written permission of CGDR
Page 63
TABLE 5.2: AVERAGE NUMBER OF ROOMS IN SLUM DWELLINGS Average of
ROOMS_TOTAL_GF Average of ROOMS_TOTAL_FF
Average of ROOMS_TOTAL_SF
Average of ROOMS_TOTAL
Central 1.03 0.32 0.00 1.32 East 1.04 0.08 0.00 1.09 North 1.09 0.07 0.01 1.15 South 1.04 0.10 0.00 1.10 West 1.04 0.18 0.00 1.16 Grand Total 1.05 0.12 0.00 1.14 Source: CGDR research
5.1.4: Floor Areas
Floor‐wise average covered area (sq ft) is presented in Table 5.3. The covered area, on an average of ground floor is estimated at 100 sq ft, ranging between 93 sq. ft in Central to 106 sq ft in North zone. For those with first floor the average size is estimated at 85 sq ft. ranging between 79 sq ft in central to 106 sq ft in East. The covered area of those with second floor is estimated at 56 sq ft ranging between 50 and 65 sq ft. The total covered area of all floors taken together is estimated at 108 sq ft. ranging between 101 in East to 119 sq ft in central zone. The average Toilet size in GF of is 12 sq ft, 1st floor 18 sq ft and in the overall 13 sq ft only. The average size of Kitchen in GF is 27 Sq ft & 1st Floor 16 sq ft.
TABLE 5.3: FLOOR‐WISE AVERAGE COVERED AREA Floor‐wise average covered area (sq ft) Avenage toilet size (sq ft) Average kitchen size (sq ft)
Zone Ground Floor
Fist Floor
Second Floor
All Ground Floor
Fist Floor
Second Floor
All Ground Floor
Fist Floor
Second Floor
All
Central 93 79 50 119 6 6
East 97 106 50 101 12 20 14 12 16 14
North 106 93 65 116
South 102 83 107 10 10 42 42
West 96 79 50 106 14 18 17 14 16 23
All 100 85 56 108 12 18 13 27 16 29
Source: CGDR research
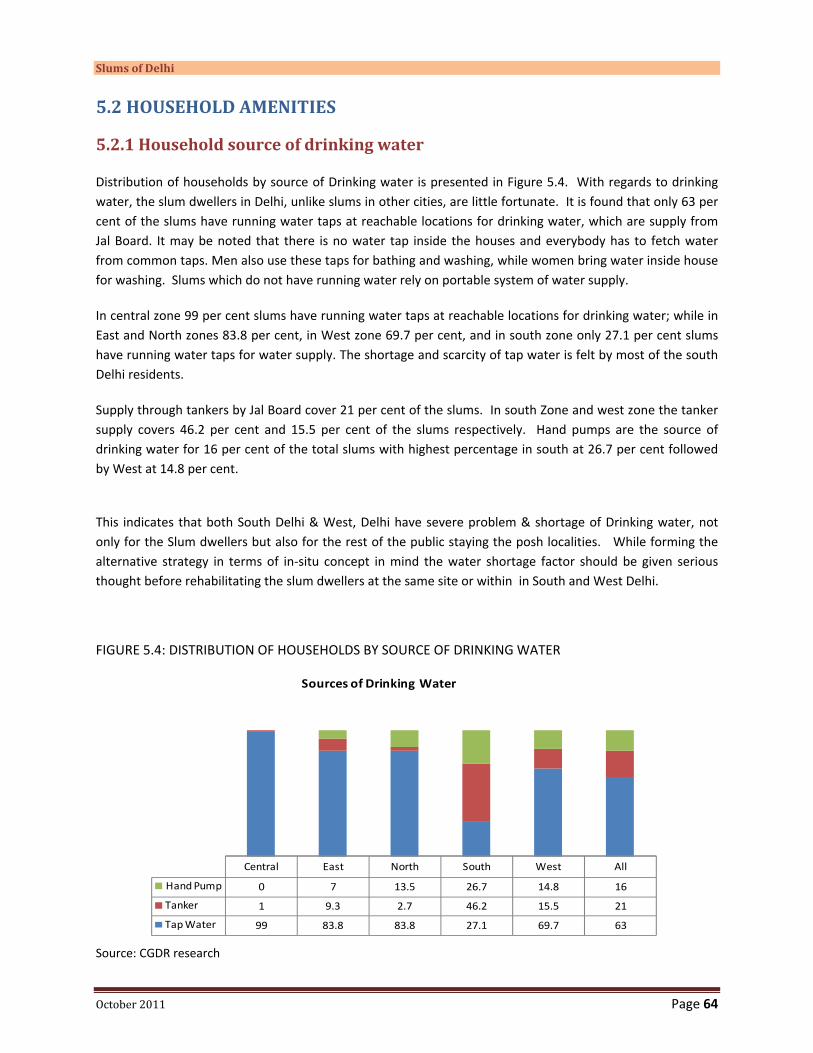
Slums of Delhi
October 2011 Page 64
5.2 HOUSEHOLD AMENITIES
5.2.1 Household source of drinking water
Distribution of households by source of Drinking water is presented in Figure 5.4. With regards to drinking water, the slum dwellers in Delhi, unlike slums in other cities, are little fortunate. It is found that only 63 per cent of the slums have running water taps at reachable locations for drinking water, which are supply from Jal Board. It may be noted that there is no water tap inside the houses and everybody has to fetch water from common taps. Men also use these taps for bathing and washing, while women bring water inside house for washing. Slums which do not have running water rely on portable system of water supply.
In central zone 99 per cent slums have running water taps at reachable locations for drinking water; while in East and North zones 83.8 per cent, in West zone 69.7 per cent, and in south zone only 27.1 per cent slums have running water taps for water supply. The shortage and scarcity of tap water is felt by most of the south Delhi residents.
Supply through tankers by Jal Board cover 21 per cent of the slums. In south Zone and west zone the tanker supply covers 46.2 per cent and 15.5 per cent of the slums respectively. Hand pumps are the source of drinking water for 16 per cent of the total slums with highest percentage in south at 26.7 per cent followed by West at 14.8 per cent.
This indicates that both South Delhi & West, Delhi have severe problem & shortage of Drinking water, not only for the Slum dwellers but also for the rest of the public staying the posh localities. While forming the alternative strategy in terms of in‐situ concept in mind the water shortage factor should be given serious thought before rehabilitating the slum dwellers at the same site or within in South and West Delhi.
FIGURE 5.4: DISTRIBUTION OF HOUSEHOLDS BY SOURCE OF DRINKING WATER
Source: CGDR research
Central East North South West All
Hand Pump 0 7 13.5 26.7 14.8 16
Tanker 1 9.3 2.7 46.2 15.5 21
Tap Water 99 83.8 83.8 27.1 69.7 63
Sources of Drinking Water

HOUSING CONDITION AND AMINITIES
This document is intellectual property of Centre for Global Development Research Private Limited, New Delhi prepared with the help of SER Grant extended by the Planning Commission of India. No part of the document can be copied without a written permission of CGDR
Page 65
5.2.2 Household electricity supply
Distribution of households without electricity connection in the house in presented in Table 5.4. It appears that Delhi slum dwellers are quite privileged as compared to most of the slums in other mega cities in India in respect of facility of electricity. Figure 5.5 indicates that only 4.2 per cent households in Delhi Slums are without electricity facility varying between only 0.9 per cent in South to 10.5 per cent in Central zone.
With regard to type of electricity connection, out of 95.8 per cent reporting electricity connection, 91.6 per cent have meter connection and 2.3 per cent have connection at Flat rates. The remaining 6.1 per cent comprising of 25, 278 households connection from over head wire has been reported.
Out of 25,278 households with over head wire connection 50.9 per cent are in the North, 25.4 per cent in the East and 22.4 per cent in the West. This should be a serious concern for the authorities and immediate preventive measures need to be taken to prevent theft of electricity being a public utility service
The average bi‐monthly bill with meter connection is estimated at INR 254 varying between INR 203 in the West to INR 293 in the North.
FIGURE 5.5: DISTRIBUTION OF HOUSEHOLDS WITHOUT ELECTRICITY
Source: CGDR research
10.5
3.3
8.3
0.9
4.6 4.2
Central East North South West All
Without Electricity

Slums of Delhi
October 2011 Page 66
TABLE 5.4: DISTRIBUTION OF HOUSEHOLDS WITHOUT ELECTRICITY FACILITY IN THE SLUM HOUSE Zone Without Distribution of households with electricity connection in the house
With Electricity Connection
Meter Flat rates Over head wire All Average bi‐monthly bill with meter connection
Central 10.5 89.5 98.5 0.0 1.5 100 212 East 3.3 96.7 90.3 2.0 7.8 100 235 North 8.3 91.7 79.4 2.9 17.7 100 293 South 0.9 99.1 98.0 2.0 0.0 100 259 West 4.6 95.4 91.1 3.2 5.7 100 203 All 4.2 95.8 91.6 2.3 6.1 100 245 Source: CGDR research
5.2.3 Cooking Space and Cooking Fuel
Figure 5.6 presents the distribution of households with and without separate space for cooking. More than ninety‐nine percent of the households are having no kitchen. None of the slum households in North, South and West zone have any kitchen. In Central and East the slum households without kitchen form 99.4 and 97.7 per cent respectively.
Type of energy used for cooking throws enough light on the economic condition of the slum dwellers. It is found that majority of slum dwellers, 72.4 per cent are still dependent on Kerosene as fuel for cooking. The percentage varies across zones from 86.9 per cent in central to 54.1 per cent in East. However, fairly a good per cent of 24.6 are using LPG as well. This varies widely across zones being 40.7 per cent in east, 21.8 in South, 21.1 in North, 20.8 in west and the minimum at 8.9 per cent in Central zone. Coal and Firewood is still used as fuel by 1.1 per cent and 1.3 per cent of the households respectively. Cow dung is used by 0.5 per cent of the households.
FIGURE 5.6: DISTRIBUTION OF HOUSEHOLDS BY WITHOUT KITCHEN IN THE SLUM HOUSE
Source: CGDR research
99.4
97.7
100.0 100.0 100.0
99.5
Central East North South West All
Without kitchen

HOUSING CONDITION AND AMINITIES
This document is intellectual property of Centre for Global Development Research Private Limited, New Delhi prepared with the help of SER Grant extended by the Planning Commission of India. No part of the document can be copied without a written permission of CGDR
Page 67
FIGURE 5.7: PERCENTAGE OF HOUSEHOLDS BY TYPE OF FUEL USED FOR COOKING
. Source: CGDR research
5.2.4 Household Toilet
About 94.8 per cent of the households are without toilet in their slum house. The same varies across zones between 98.5 per cent in the North and to 92.8 per cent in the West (Figure 5.8 and Table 5.5). 60.8 per cent of the households without toilet have access to Sulabh, 11.9 per cent have access to common toilet and the rest 27. 2 per cent defecate in the open causing unhygienic conditions around the slum locality. It is heartening to note that Sulabh International provide a major relief to the slum dwellers. Of the 5.2 per cent of the slum dwellers who have toilet inside their slum house, 47.2 per cent have septic tank, 42.7 per cent have flush system and the rest 10 per cent have service latrine (Table 5.5).
FIGURE 5.8: PERCENTAGE OF HOUSEHOLDS WITHOUT TOILETS
Source: CGDR research
Central East North South West All
Cow Dung 0 1.4 0.3 0.2 0.4 0.5
LPG 8.9 40.7 22.1 21.8 20.8 24.6
Kerosene 86.9 54.1 74.5 76.6 76.7 72.4
Coal 3.4 2.6 1.1 0.5 0.4 1.1
Firewood 0.8 1.1 2 0.9 1.7 1.3
Type of Fuel Used for Cooking
96.6 96.3
98.5
93.0 92.8
94.8
Central East North South West All
Without Tiolet
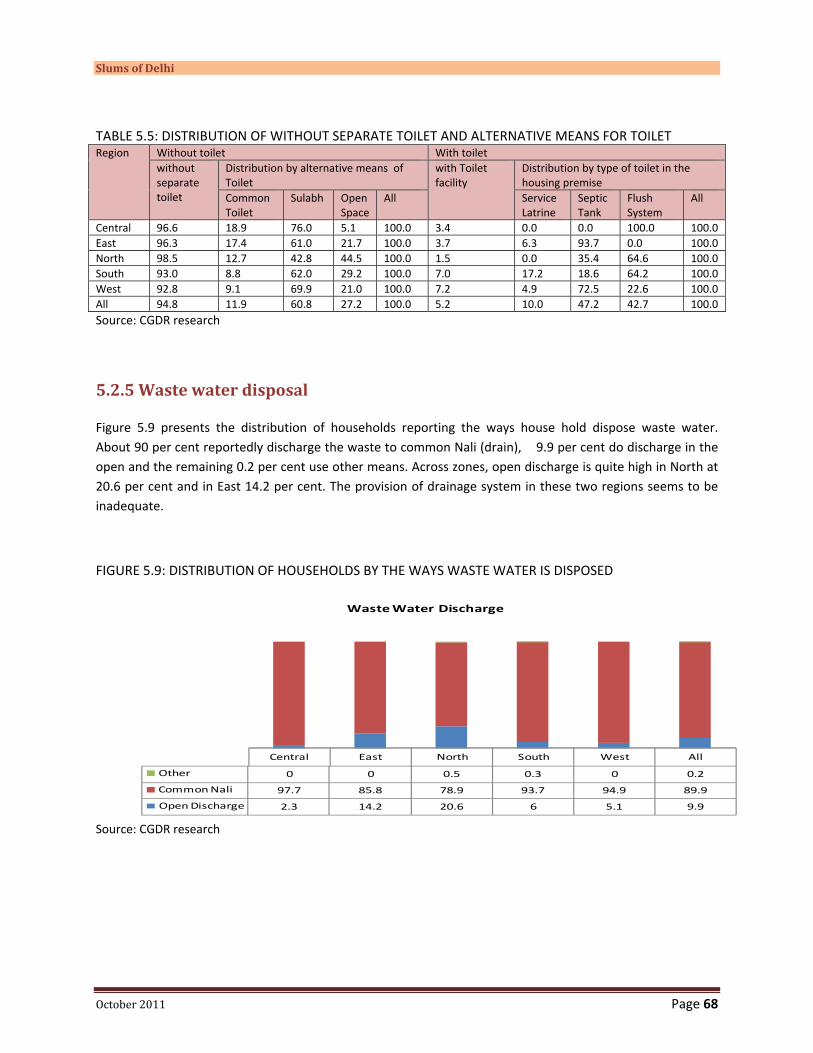
Slums of Delhi
October 2011 Page 68
TABLE 5.5: DISTRIBUTION OF WITHOUT SEPARATE TOILET AND ALTERNATIVE MEANS FOR TOILET Region Without toilet With toilet
without separate toilet
Distribution by alternative means of Toilet
with Toilet facility
Distribution by type of toilet in the housing premise
Common Toilet
Sulabh Open Space
All Service Latrine
Septic Tank
Flush System
All
Central 96.6 18.9 76.0 5.1 100.0 3.4 0.0 0.0 100.0 100.0 East 96.3 17.4 61.0 21.7 100.0 3.7 6.3 93.7 0.0 100.0 North 98.5 12.7 42.8 44.5 100.0 1.5 0.0 35.4 64.6 100.0 South 93.0 8.8 62.0 29.2 100.0 7.0 17.2 18.6 64.2 100.0 West 92.8 9.1 69.9 21.0 100.0 7.2 4.9 72.5 22.6 100.0 All 94.8 11.9 60.8 27.2 100.0 5.2 10.0 47.2 42.7 100.0 Source: CGDR research
5.2.5 Waste water disposal
Figure 5.9 presents the distribution of households reporting the ways house hold dispose waste water. About 90 per cent reportedly discharge the waste to common Nali (drain), 9.9 per cent do discharge in the open and the remaining 0.2 per cent use other means. Across zones, open discharge is quite high in North at 20.6 per cent and in East 14.2 per cent. The provision of drainage system in these two regions seems to be inadequate.
FIGURE 5.9: DISTRIBUTION OF HOUSEHOLDS BY THE WAYS WASTE WATER IS DISPOSED
Source: CGDR research
Central East North South West All
Other 0 0 0.5 0.3 0 0.2
Common Nali 97.7 85.8 78.9 93.7 94.9 89.9
Open Discharge 2.3 14.2 20.6 6 5.1 9.9
Waste Water Discharge
HOUSING CONDITION AND AMINITIES
This document is intellectual property of Centre for Global Development Research Private Limited, New Delhi prepared with the help of SER Grant extended by the Planning Commission of India. No part of the document can be copied without a written permission of CGDR
Page 69
5.3 Concluding observations
The average covered area of the slum house per HH is just about 108 sq ft. To stay with a family of average size of 5.1 with all households belongings in such a tiny space depicts the miserable life the slum dwellers lead. As regards housing condition about 46.3 per cent live in pucca house, 27.9 per cent in semi pucca and 25.8 per cent in kutcha house. On the top of it 99 per cent of the households do not have separate kitchen and 94.8 per cent are without any toilet inside the house. For cooking, 72.4 per cent dependent on kerosene and only 24.6 per cent use LPG. A certain percentage of households are even dependent on fire wood, coal and cow dung. But there are reasons for some cheer as well, about ninety six per cent of the slums households have electricity connection and 63 per cent of them have access to common running tap water from Delhi Jal Board.
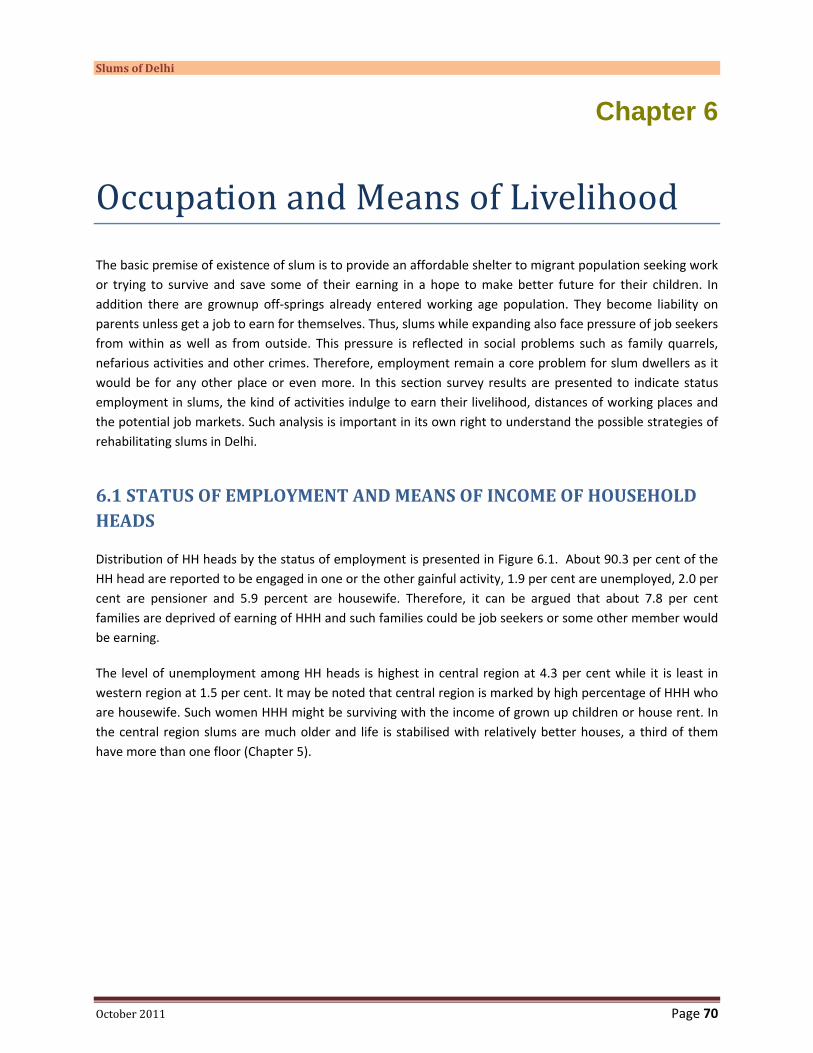
Slums of Delhi
October 2011 Page 70
Chapter 6
Occupation and Means of Livelihood The basic premise of existence of slum is to provide an affordable shelter to migrant population seeking work or trying to survive and save some of their earning in a hope to make better future for their children. In addition there are grownup off‐springs already entered working age population. They become liability on parents unless get a job to earn for themselves. Thus, slums while expanding also face pressure of job seekers from within as well as from outside. This pressure is reflected in social problems such as family quarrels, nefarious activities and other crimes. Therefore, employment remain a core problem for slum dwellers as it would be for any other place or even more. In this section survey results are presented to indicate status employment in slums, the kind of activities indulge to earn their livelihood, distances of working places and the potential job markets. Such analysis is important in its own right to understand the possible strategies of rehabilitating slums in Delhi.
6.1 STATUS OF EMPLOYMENT AND MEANS OF INCOME OF HOUSEHOLD HEADS
Distribution of HH heads by the status of employment is presented in Figure 6.1. About 90.3 per cent of the HH head are reported to be engaged in one or the other gainful activity, 1.9 per cent are unemployed, 2.0 per cent are pensioner and 5.9 percent are housewife. Therefore, it can be argued that about 7.8 per cent families are deprived of earning of HHH and such families could be job seekers or some other member would be earning.
The level of unemployment among HH heads is highest in central region at 4.3 per cent while it is least in western region at 1.5 per cent. It may be noted that central region is marked by high percentage of HHH who are housewife. Such women HHH might be surviving with the income of grown up children or house rent. In the central region slums are much older and life is stabilised with relatively better houses, a third of them have more than one floor (Chapter 5).

OCCUPATION AND MEANS OF LIVELHOOD
This document is intellectual property of Centre for Global Development Research Private Limited, New Delhi prepared with the help of SER Grant extended by the Planning Commission of India. No part of the document can be copied without a written permission of CGDR
Page 71
FIGURE 6.1: DISTRIBUTION OF HOUSEHOLD HEAD BY ACTIVITY STATUS
Central East North South West All
House Wife 17.9 10.4 5.8 3.0 3.2 5.9
Unemployed 4.3 1.8 2.3 1.6 1.5 1.9
Pensioner 4.1 2.5 2.8 1.1 1.5 2.0
Employed 73.7 85.2 89.1 94.3 93.8 90.3
Employment Status of Household Heads
Source: CGDR research
6.1.1 Occupations of household heads
About 90 professions can be enumerated where people engage themselves, which include inter alia Accountant, Anganwari worker, Agriculture, Artist, NGO Worker, Auto Driver, Aaya, Barber, Beautician, Black Smith, Bookstall owner, Bread supply, Business, Car Mechanic, Carpenter, Chat Shop, Clinic, Cobbler, Compounder, Conductor, Contractor, Cook, Dai Maker, Designer, Dhobi, Dhol maker, Doctor, Domestic Servant, Driver, Electrician, Engineer, Fruit Shop, Gardener, Government Service, Hakeem, Halwai, Handicraft, Hawker, House Wife, Kabadi wala, Labour, LIC Agent, milk shop, Mobile Shop, Motor Mechanic, Nurse, Own Shop, Painter, Pensioner, Photographer, Plumber, Postman, Private Service, Rickshaw Puller, Salesman, Security Guard, Self Employee, Shop keeper, Social Worker, Supervisor, Sweeper, Tailor, Tea Shop, Teacher, Tutor, Welder, Mason, Begger, Astrologist, Press Man (Dhobi), Vegetable Hawker, Office Boy, PCO Booth, Priest, Tonga Driver, Dhaba, Porter, Embroidery work, Courier, Lathe Operator, Cargo Operator, Book Binding, Rickshaw Mechanic, Pad binding, and Transport Worker.
Distribution of household head by broad occupation groups is presented in Table 6.1. Despite the fact that slum dwellers engage themselves in a variety of gainful activities, some professions are highly common which characterise the job profile of slum population.
About 41.0 per cent of the HHH are engaged as Skilled / Semi‐skilled and other non‐agricultural labour, 23.4 per cent are in private service, 4.1 per cent shops owners, pensioners and retired 2.0 per cent, unemployed 1.9 percent, housewife 5.9 per cent and the remaining 11.7 per cent are engaged in other activities.

Slums of Delhi
October 2011 Page 72
TABLE 6.1: DISTRIBUTION OF HOUSEHOLDS BY BROAD OCCUPATION GROUPS OF HOUSEHOLD HEAD Rank Occupation Central East North South West All Cumulative Total 1 Labor 32.4 32.8 51.5 40.3 42.7 41.0 41.0 2 Private service 12.8 19.1 11.8 30.7 28.6 23.4 64.4 3 House Wife 17.9 10.4 5.8 3.0 3.2 5.9 70.3 4 Shop keeper 2.0 4.3 3.6 3.3 5.8 4.1 74.4 5 Tailor 1.9 4.1 1.9 2.3 1.2 2.3 76.7 6 Driver 1.5 2.5 2.6 2.7 1.3 2.2 78.9 7 Pensioner 4.1 2.5 2.8 1.1 1.5 2.0 80.9 8 Domestic Servant 5.2 2.9 2.1 0.8 1.1 1.8 82.6 9 Hawker 0.2 1.7 2.3 0.9 2.1 1.6 84.2 10 Petty Shop 0.6 0.8 0.9 1.6 2.3 1.4 85.6 11 Mason 0.4 0.8 4.4 0.5 0.8 1.3 86.9 12 Government Service 0.0 2.2 0.1 1.9 0.8 1.3 88.2 13 Rickshaw Puller 2.7 1.2 1.8 0.3 0.8 1.0 89.2 14 Security Guard 0.0 0.8 0.8 1.4 0.7 0.9 90.1 15 Dhobi 3.1 0.9 0.2 0.1 1.4 0.7 90.9 16 Salesman 0.0 2.8 0.1 0.5 0.0 0.7 91.6 17 Carpenter 0.5 0.4 0.5 1.0 0.7 0.7 92.3 18 Painter 0.9 0.6 0.8 0.5 0.5 0.6 92.9 19 Tea Shop 0.5 0.7 0.1 0.4 0.6 0.5 93.3 20 Sweeper 0.2 0.3 0.0 0.9 0.3 0.4 93.7 21 Rag picker 0.0 0.2 0.1 1.0 0.1 0.4 94.1 22 Barber 0.2 0.3 0.3 0.3 0.5 0.4 94.5 23 Teacher 0.0 1.1 0.1 0.3 0.0 0.3 94.8 24 Electrician 0.2 0.6 0.5 0.2 0.1 0.3 95.1 25 Handicraft 2.4 0.0 0.1 0.0 0.0 0.2 95.3 Other 5.9 4.3 2.7 2.5 1.4 2.8 98.1 Unemployed 4.3 1.8 2.3 1.6 1.5 1.9 100 Source: CGDR research
6.2 STATUS OF GAINFUL EMPLOYMENT IN POPULATION AND RESULTING DEPENDENCY
While employment pattern of household head is important to capture the earning potential of the household, it does not reflect on the pressure the earning members face in supporting the family. A better idea can be obtained by examining the employment status of the HHs and the resulting dependency. For this purpose, pensioners and renters which are very small in proportions are excluded from gainfully employment.
6.2.1 Employment pattern in the entire population
Table 6.2 presents distribution of estimated population by 15 broad Occupation groups, Gender & Zone. At the aggregate level, 28.2 percent are gainfully employed, 46.4 per cent among males and only 5.5 per cent among females. Unemployed persons form 9.3 per cent of the total population, 13.5 per cent among males and 3.9 per cent among females.

OCCUPATION AND MEANS OF LIVELHOOD
This document is intellectual property of Centre for Global Development Research Private Limited, New Delhi prepared with the help of SER Grant extended by the Planning Commission of India. No part of the document can be copied without a written permission of CGDR
Page 73
TABLE 6.2: DISTRIBUTION OF ESTIMATED POPULATION BY OCCUPATION GROUPS & GENDER Sl. No. Occupation Gender Central East North South West All A1 Non‐agricultural laborer Male 24.3 19.7 19.8 20.9 23.4 21.3 A2 Service (Government/Private) 13.3 17.5 16.1 16.6 13.5 15.7 A3 Business / Small shop 2.2 3.9 5.0 4.2 5.9 4.6 A4 Small artisan and cottage industry 0.3 0.3 0.0 0.6 0.3 0.3 A5 Self Employed/ Professional 1.9 3.0 0.9 2.1 0.9 1.7 A6 Drivers, Cleaners, Rickshaw Puller 7.1 2.4 2.7 2.5 1.9 2.6 A7 Domestic Servant 0.9 0.2 0.1 0.1 0.0 0.1 A Gainfully Employed 50.0 47.0 44.6 46.9 45.9 46.4 B1 Pensioner / Retired 0.9 0.9 3.3 1.7 1.2 1.7 B2 Housewife 0.0 0.0 0.0 0.0 0.0 0.0 B3 Student 25.8 35.6 25.4 29.8 31.4 30.2 B4 Unemployed 18.6 9.8 17.1 13.9 12.1 13.5 B5 Others 4.6 6.7 9.6 7.6 9.4 8.1 C All Males 100 100 100 100 100 100 A1 Non‐agricultural laborer Female 1.8 2.0 1.9 1.3 0.9 1.5 A2 Service (Government/Private) 0.3 0.6 1.6 0.8 0.8 0.9 A3 Business / Small shop 3.2 0.6 0.5 0.5 1.5 0.9 A4 Small artisan and cottage industry 0.0 0.0 0.0 0.5 0.3 0.2 A5 Self Employed/ Professional 0.2 0.3 0.1 0.1 0.1 0.2 A6 Drivers, Cleaners, Rickshaw Puller 0.3 0.0 0.1 0.0 0.1 0.1 A7 Domestic Servant 4.0 2.3 1.6 1.6 1.3 1.8 A Gainfully employed 9.9 5.8 5.8 4.7 4.9 5.5 B1 Pensioner / Retired 1.4 0.8 1.7 1.3 0.7 1.1 B2 Housewife 52.5 53.0 55.5 55.0 51.7 53.8 B3 Student 21.3 28.8 26.0 27.0 27.3 26.9 B4 Unemployed 5.9 3.5 2.1 4.1 4.9 3.9 B5 Others 9.1 8.2 8.9 7.8 10.4 8.8 C All Females 100 100 100 100 100 100 A1 Non‐agricultural laborer Total 13.6 11.9 11.8 12.2 13.5 12.5 A2 Service (Government/Private) 7.2 10.0 9.6 9.6 7.9 9.1 A3 Business / Small shop 2.7 2.5 3.0 2.6 4.0 3.0 A4 Small artisan and cottage industry 0.2 0.2 0.0 0.5 0.3 0.3 A5 Self Employed/ Professional 1.1 1.8 0.5 1.2 0.6 1.0 A6 Drivers, Cleaners, Rickshaw Puller 3.9 1.3 1.6 1.4 1.1 1.5 A7 Domestic Servant 2.4 1.1 0.8 0.7 0.6 0.9 A Gainfully Employed 30.9 28.7 27.2 28.2 27.9 28.2 B1 Pensioner / Retired 1.2 0.8 2.6 1.5 1.0 1.4 B2 Housewife 24.9 23.5 24.8 24.4 22.8 23.9 B3 Student 23.7 32.6 25.7 28.5 29.6 28.7 B4 Unemployed 12.6 7.0 10.4 9.6 8.9 9.3 B5 Others 6.7 7.3 9.3 7.7 9.8 8.4 C All 100 100 100 100 100 100 Source: CGDR research

Slums of Delhi
October 2011 Page 74
Out of the entire population, housewives form 23.9 per cent, students 28.7 per cent, pensioner 1.4 percent and others 8.4 percent. At the aggregate level 28.2 per cent population is gainfully employed, 12.5 per cent are non‐agricultural labourers, 9.1 per cent in service, business/ small shop 3.0 per cent. Among males, 21.3 percent are non agricultural labourers, 15.7 per cent are in service & 4.6 per cent in business / small shop. Among females 1.5 per cent is non‐agricultural labourers, 1.8 cent domestic servant.
6.2.2 Dependency Ratio
Average dependency ratio works out to be 3.54 with highest in north and lowest in central region. The high dependency ratio also creates economic constraints on slum dwellers and at times reflects poor awareness about family planning. However, this also indicates that the employment level in slums is not as high one would expect and there are large a number of empty hands who indulge in several unsocial activities.
FIGURE 6.2: ESTIMATED DEPENDENCY RATIO (GAINFULLY EMPLOYED POPULATION TO TOTAL POPULATION) IN DELHI SLUMS ACROSS REGIONS
3.23
3.48
3.67
3.543.59
3.54
Central East North South West All
Dependecy Ratio
Source: CGDR research
6.3 DISTANCE OF WORK PLACE
On the issue of rehabilitating the slum dwellers it is advocated from several quarters specially the social activists that the slum dwellers should be rehabilitated in the same area or in a close proximity on the plea that they earn their livelihood by working at places close to their slum. In case they are thrown off to far flung area they would lose their livelihood or have to spend a lot on travelling.
In this context, the distribution of HH head by distance of their place of work from the slum assumes importance (Table 6.3). It is found that 11.0 per cent of the HH head appear to be working next door. About 45.8 per cent travel 1‐5 kms distance, 2.4 per cent 6‐10 kms distance. But it is also found that a big chunk of the working HH head do not have any specific place where they travel regularly for their livelihood. Such persons form 38.5 per cent comprising of daily wage earners and drivers.
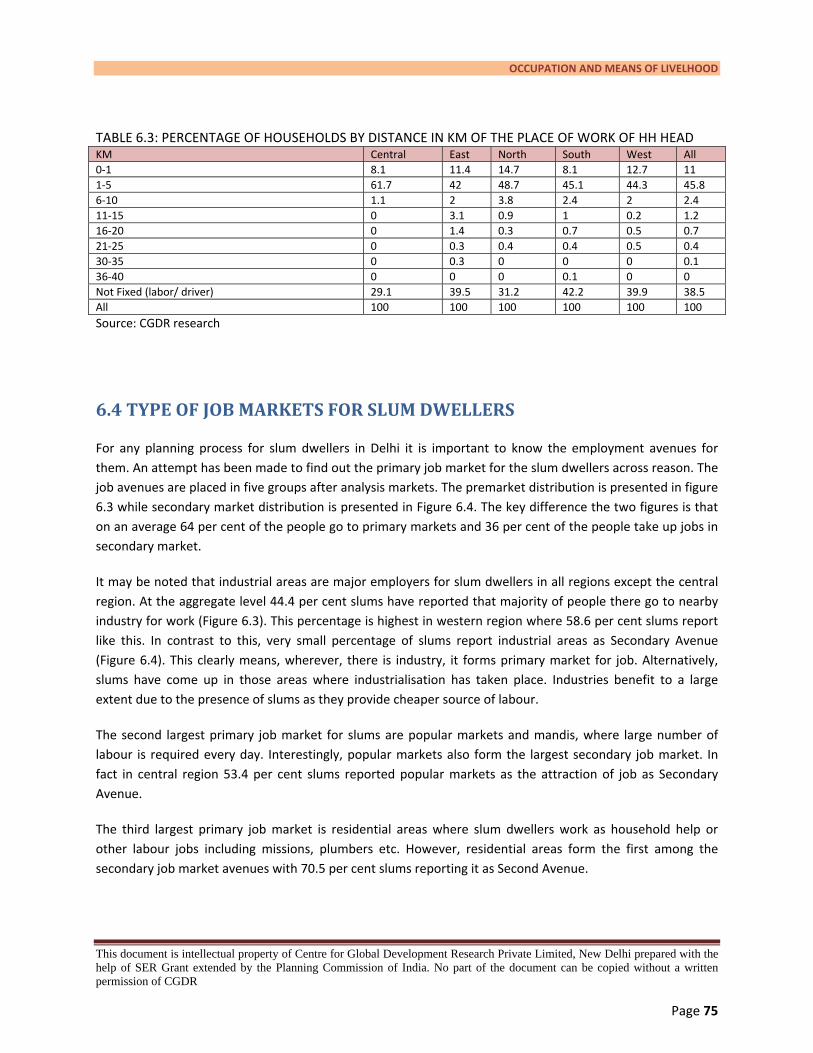
OCCUPATION AND MEANS OF LIVELHOOD
This document is intellectual property of Centre for Global Development Research Private Limited, New Delhi prepared with the help of SER Grant extended by the Planning Commission of India. No part of the document can be copied without a written permission of CGDR
Page 75
TABLE 6.3: PERCENTAGE OF HOUSEHOLDS BY DISTANCE IN KM OF THE PLACE OF WORK OF HH HEAD KM Central East North South West All 0‐1 8.1 11.4 14.7 8.1 12.7 11 1‐5 61.7 42 48.7 45.1 44.3 45.8 6‐10 1.1 2 3.8 2.4 2 2.4 11‐15 0 3.1 0.9 1 0.2 1.2 16‐20 0 1.4 0.3 0.7 0.5 0.7 21‐25 0 0.3 0.4 0.4 0.5 0.4 30‐35 0 0.3 0 0 0 0.1 36‐40 0 0 0 0.1 0 0 Not Fixed (labor/ driver) 29.1 39.5 31.2 42.2 39.9 38.5 All 100 100 100 100 100 100 Source: CGDR research
6.4 TYPE OF JOB MARKETS FOR SLUM DWELLERS
For any planning process for slum dwellers in Delhi it is important to know the employment avenues for them. An attempt has been made to find out the primary job market for the slum dwellers across reason. The job avenues are placed in five groups after analysis markets. The premarket distribution is presented in figure 6.3 while secondary market distribution is presented in Figure 6.4. The key difference the two figures is that on an average 64 per cent of the people go to primary markets and 36 per cent of the people take up jobs in secondary market.
It may be noted that industrial areas are major employers for slum dwellers in all regions except the central region. At the aggregate level 44.4 per cent slums have reported that majority of people there go to nearby industry for work (Figure 6.3). This percentage is highest in western region where 58.6 per cent slums report like this. In contrast to this, very small percentage of slums report industrial areas as Secondary Avenue (Figure 6.4). This clearly means, wherever, there is industry, it forms primary market for job. Alternatively, slums have come up in those areas where industrialisation has taken place. Industries benefit to a large extent due to the presence of slums as they provide cheaper source of labour.
The second largest primary job market for slums are popular markets and mandis, where large number of labour is required every day. Interestingly, popular markets also form the largest secondary job market. In fact in central region 53.4 per cent slums reported popular markets as the attraction of job as Secondary Avenue.
The third largest primary job market is residential areas where slum dwellers work as household help or other labour jobs including missions, plumbers etc. However, residential areas form the first among the secondary job market avenues with 70.5 per cent slums reporting it as Second Avenue.

Slums of Delhi
October 2011 Page 76
Offices and other avenues are small contributors to the job market for slum dwellers.
FIGURE 6.3: PRIMARY JOB MARKET FOR SLUM DWELLERS IN DELHI
Centeral East North South West All
Other 8.2 6.9 1.5 1.6 0.0 2.9
Offices 3.3 0.0 4.4 18.0 1.5 6.3
Popular Markets & Mandi 50.8 31.0 36.8 24.2 20.3 29.6
Industrial Area 23.0 46.0 42.6 39.8 58.6 44.4
Residential Area 14.8 16.1 14.7 16.4 19.5 16.8
Primary Job Markets
Source: CGDR research
FIGURE 6.4: SECONDARY JOB MARKET FOR SLUM DWELLERS IN DELHI
Centeral East North South West All
Other 0.0 0.0 3.4 7.1 ‐5.9 3.5
Offices 0.0 0.0 5.1 0.8 5.9 1.5
Popular Markets & Mandi 53.4 15.9 35.6 13.5 11.8 24.0
Industrial Area 0.0 0.0 1.7 0.8 0.0 0.6
Residential Area 46.6 84.1 54.2 77.8 88.2 70.5
Secondry Job Markets
Source: CGDR research

OCCUPATION AND MEANS OF LIVELHOOD
This document is intellectual property of Centre for Global Development Research Private Limited, New Delhi prepared with the help of SER Grant extended by the Planning Commission of India. No part of the document can be copied without a written permission of CGDR
Page 77
6.5 Concluding observations
There is a school of thought that believes that job avenue can be created after relocating the slum dwellers. This is flawed thinking because the development of slums is other way out. People start residing in temporary hutments near the job avenues either during the construction period of the said job avenue or with protection from the job providers and local leaders and administration as a source of cheaper labour. It is also important to note that slum dwellers cannot afford to travel long distances for job as it is too costly for them. The very fact that these slum dwellers have to survive a hard life requires cost cutting at each stage. This is true at least in the case of Delhi.
As indicated in Chapter 4, about 61 per cent of the households have migrated from 68 districts of Uttar Pradesh (UP) which tops the list among states. Bihar comes at the second position with 24 per cent households from 36 districts. Seventy per cent of slum migrants come from 35 backward districts. It holds ample testimony to the fact that it is basically poverty, unemployment & deprivation that has compelled these people to desert their native place and migrate to slum life in Delhi. This being the reason, It is advocated from several quarters that the slum dwellers should be rehabilitated in the same area or in a close proximity on the plea that they earn their livelihood by working at places close to their slum. This has also been acknowledged in the concept of in‐situ rehabilitation of slum dwellers in the National Housing Policy 2007. The survey results indicate that 45.8 per cent of the HH head travel a distance of just 1‐5 kms to reach their place of work, which mainly constitutes of nearest residential area, nearest market & nearest industrial area.

Slums of Delhi
October 2011 Page 78
Chapter 7
Costs of Ownership of Slum Dwelling Slum houses are constructed in small increments as and when the funds are available and with increasing confidence of the community about possibility of continuing. Slum dwellers are more confident in investing in their houses if the slum is fairly older. Government efforts to improve the life in slum by provisioning of infrastructure such as permanent roads, street lights, water pipe lines or electricity connection encourages the residents to take risk and go ahead to construct a better house. It is also worth recalling that average floor areas also vary considerably across regions and several households go to the extent of constructing multi‐storied houses. During the survey, the respondents have provided the total expenditure over time that has gone into the shelter. In this context it is also noticed that several slums get relocated after demolition at about the same place or little here and there. In that case the cost of reconstruction gets added up on account of owning a slum house. This happens more in the case of vulnerable slums which are also dominated by kutcha and semi‐pucca houses. The kutcha houses also get destroyed during rain and fire and such dwellers end up incurring higher cost on their shelter than the semi‐pucca or even pucca house owners. This anomaly is reflected in the survey data presented in this chapter.
In addition, slum houses are sold and rented like any other property. The cost varies from one region to other and also within slum cluster depending on the type of structure and proximity to other facilities. It is also important to note that many of the dwelling owners do not reside themselves in the slums and use the premises for renting. However, as mentioned earlier, such tenants are not allowed to acquire identification proofs which could be used to claim the ownership. This chapter therefore starts with the estimates of households claiming ownership of a slum dwelling and those living as tenants and then go on to reflect on the cost of construction and purchase price of dwellings in different regions. The values are determined based on interviews with the sample population taken randomly from all the regions. It is important to gather the knowledge about the cost of ownership of dwellings to take a view on the likely losses to slum dwellers in case of demolition. In addition such cost also proxy an important component of the opportunity cost a slum dweller would fix if they have to leave the place.
7.1 DWELLING OWNERSHIP
The estimates based on sample survey indicate that about 97.9 per cent of the slum houses are self occupied (Figure 7.1). Only 2.1 percent are occupied by tenants. On the other hand, share of households without ration card is about 13 per cent and a large proportion of these could be tenants. Therefore, there is a doubt that slum house owners might have instructed the tenants to declare themselves as owners or even tenants might be tempted to declare false ownership in the hope of claiming ownership in resettlement.

COST OF DWELLING OWNERSHIP
This document is intellectual property of Centre for Global Development Research Private Limited, New Delhi prepared with the help of SER Grant extended by the Planning Commission of India. No part of the document can be copied without a written permission of CGDR
Page 79
Attempt was made to verify this anomaly. And, it has been reported that most of the HHs without ration card are tenants. Thus, a much higher percentage of HHs reporting ownership of dwelling may be due to the fact that the tenants do not want to reveal their real status.
Any rehabilitation program would face the challenge of identification and therefore, it is important to freeze the problem of ownership upfront. This problem flags the importance to be given to identification of the unique ownership of dwelling using biometric survey of owners, exact census of houses, and then strict consistency examination to avoid (1) repeat of house against more than one claimant and (2) repeat of biometric information indicating ownership of more than one slum house. The limited scope of this study did not permit to address these problems and the same can be undertaken in a separate study.
FIGURE 7.1: ESTIMATED SHARE OF HOUSEHOLDS WITH JHUGGI OWNERSHIP ACROSS REGIONS OF DELHI
7.2 COST INCURRED IN OWNING A SLUM DWELLING
The distribution of households by type of house in the slum indicates that 27.9 percent of the households live in Pucca houses, which varies between 37.6 percent in central to 24.2 percent in North. On an average 46.3 per cent households live in Semi‐pucca houses which varies between 55.9 per cent in East to 28.5 per cent in the North; and 25.8 per cent slum households live in kuttcha houses, which varies between 47.2 per cent in the North to 8.6 per cent in the central zone (Table 7.1). This distribution affects the average cost of ownership of slum houses across regions.
10099.4 99.8
98
94.6
97.9
Central East North South West All
Jhuggi Ownership

Slums of Delhi
October 2011 Page 80
Table 7.1 presents the average expenditure incurred in owning a house in slum. On an average, an amount of INR 96748 is spent for a Pucca house varying between INR 119348 in the central region to INR 80351 in the East. For a Semi‐pucca house on an average INR 46617 has been spent varying between INR 47796 in South to INR 43819 in the central zone. For kutcha house the average amount spent is INR 18222 varying between INR 15544 in West to INR 24699 in the East.
TABLE 7.1: AVERAGE EXPENDITURE INCURRED IN OWNING A PUCCA, SEMI‐PUCCA AND KUTCHA HOUSE Average expenditure incurred in construction/owning of
house by type (INR) Distribution of Houses by Type
Zone Pucca Semi‐Pucca Kutcha All Pucca Semi Pucca Kutcha All Central 119348 43819 20920 70374 37.6 53.8 8.6 100 East 80351 45273 24699 52905 30.1 55.9 14 100 North 91396 47053 19230 44747 24.2 28.5 47.2 100 South 96384 47796 16254 49628 24.5 45.7 29.8 100 West 108791 46960 15544 62133 31.2 51 17.8 100 All 96748 46617 18222 53061 27.9 46.3 25.8 100 Source: CGDR research
7.3 DISTRIBUTION OF HOUSES BY COST OF OWNING
The summary provided in Table 7.1 does not reflect the variation of ownership cost within a construction type and across regions. In order to get a better idea of the costs, distribution of households falling under different cost‐ranges is discussed below for each type of construction.
7.3.1 Pucca Houses
Distribution of households by expenditure range for pucca construction is presented in Table 7.2. About one third (31.4 percent) of the pucca households have spent in the range of INR 26500 to INR 51499 and 24.3 per cent of the pucca households have spent between INR 51500 to INR 76500. About 20.5 per cent pucca households have spent in the range of INR 76 500 to INR 101499. Thus, about 76.9 per cent of pucca households have spent less that INR 101500. The remaining 23 per cent of the pucca households have spent in the range of INR 101500 to INR 351500.
Clearly, there are many households with good economic conditions and they have invested on shelter liberally. It can also be noticed that most of the costly houses exist in western region and southern regions.
7.3.2 Semi Pucca Houses
Distribution of semi‐pucca households by expenditure range is presented in Table 7.3. Nearly 32.3 per cent of the Semi‐pucca households have spent in the range of INR 11500 to INR 31499 and most of these houses are located in South and West.
Another 34.6 per cent of the semi‐pucca households have spent INR 31500 to INR 61499. About 28.4 per cent owners of semi‐pucca households have spent in the range of INR 61500 to INR 81499. Remaining 2.9 per cent

COST OF DWELLING OWNERSHIP
This document is intellectual property of Centre for Global Development Research Private Limited, New Delhi prepared with the help of SER Grant extended by the Planning Commission of India. No part of the document can be copied without a written permission of CGDR
Page 81
have incurred cost in the range of INR 81500 to INR 101500. Thus, more than 67 per cent owners of semi‐pucca houses have spent as much as the costs of owning a pucca house but they could not do so because of insecurity and need to keep the house look like temporary.
Clearly, a large number of semi‐pucca house owners must have rebuild their houses several times and they are hesitant in converting to pucca construction both because of affordability as also insecurity.
TABLE7.2. DISTRIBUTION OF HOUSEHOLDS BY AMOUNT SPENT ON OWNING A PUCCA HOUSE TILL NOW Cost incurred (Range INR) Distribution by range of cost incurred Distribution across regions Range Average Central East North South West All Central East North South West All 26500‐51499 43922 21.6 40.5 33.4 29.4 27.6 31.4 5.5 28.0 17.2 27.2 22.1 100 51500‐76499 65190 14.4 27.5 21.1 29.7 20.7 24.3 4.7 24.5 14.0 35.3 21.4 100 76500‐101499 91230 31.2 17.1 26.0 17.1 20.6 20.5 12.1 18.1 20.5 24.1 25.2 100 101500‐126499 117400 0.9 1.2 1.8 3.0 2.1 2.0 3.5 12.9 14.5 43.0 26.0 100 126500‐151499 148333 9.0 4.3 3.4 4.6 7.6 5.5 13.2 17.2 10.0 24.6 35.0 100 151500‐176499 162654 0.9 1.2 2.2 0.1 1.5 1.1 6.4 24.0 31.9 3.7 34.0 100 176500‐201499 198194 10.6 2.1 4.7 6.6 6.1 5.5 15.3 8.3 13.8 34.8 27.8 100 201500‐226499 220000 0.0 0.0 0.0 0.0 0.3 0.1 0.0 0.0 0.0 0.0 100.0 100 226500‐251499 249778 2.7 1.7 3.2 4.6 3.6 3.3 6.5 11.3 15.4 39.9 26.9 100 251500‐276499 262500 0.0 0.0 0.0 0.3 0.1 0.1 0.0 0.0 0.0 75.9 24.1 100 276500‐301499 298846 8.7 4.4 4.2 4.4 9.3 5.9 11.7 16.0 11.3 21.7 39.3 100 301500‐326499 310000 0.0 0.0 0.0 0.0 0.1 0.0 0.0 0.0 0.0 0.0 100.0 100 326500‐351499 350000 0.0 0.0 0.0 0.0 0.4 0.1 0.0 0.0 0.0 0.0 100.0 100 All 96748 100 100 100 100 100 100 8 21.7 16.2 29 25.1 100 Source: CGDR research
TABLE 7.3: DISTRIBUTION OF HOUSEHOLDS BY AMOUNT SPENT ON OWNING A SEMI‐PUCCA HOUSE TILL NOW Cost incurred (Range INR) Distribution by range of cost incurred Distribution across regions Range Average Central East North South West All Central East North South West All 11500‐21499 20003 21.3 9.2 8.8 14.0 15.8 13.2 10.9 16.8 7.6 33.6 31.0 100 21500‐31499 27307 23.2 21.0 20.0 18.5 16.8 19.1 8.2 26.4 11.9 30.5 22.9 100 31500‐41499 37403 7.0 22.5 19.5 5.5 15.4 13.9 3.4 39.0 16.1 12.6 28.9 100 41500‐51499 49026 20.2 17.2 21.4 29.1 20.6 22.5 6.1 18.4 10.9 40.9 23.8 100 51500‐61499 58680 8.2 10.4 5.4 9.0 8.1 8.6 6.5 29.0 7.1 32.9 24.4 100 61500‐71499 68345 2.8 8.5 5.0 3.8 5.3 5.4 3.6 38.0 10.7 22.1 25.6 100 71500‐81499 76136 13.8 7.5 15.4 18.8 15.4 14.4 6.5 12.5 12.1 41.1 27.7 100 81500‐91499 89153 3.5 3.7 4.6 1.3 2.7 2.8 8.5 32.1 18.7 15.3 25.4 100 91500‐101499 95000 0.0 0.1 0.0 0.0 0.1 0.0 0.0 51.3 0.0 0.0 48.7 100 All 46617 100 100 100 100 100 100 6.8 24.1 11.4 31.6 26.1 100 Source: CGDR research

Slums of Delhi
October 2011 Page 82
7.3.3 Kutcha Houses
The owners of kutcha houses have spent anything between INR 1500 to INR 4200 (Table 7.4). About 30.3 per cent of them have spent in the range of INR 1500 to INR 11499 and another 40.8 per cent have spent INR11500 to INR 21499. Thus, around 71.1 per cent kutcha house owners have spent anything below INR 21400.
However, a fairly large proportion, 27.0 per cent of kutcha house owners has spent anything between INR 21500 to INR 41499, which is as much as the cost of ownership of semi‐pucca or even pucca houses. This anomaly is the result of insecurity; movements; destruction of houses due to various reasons including demolitions, natural calamity etc. The proportion of such victims is more in North and South zones.
TABLE 7.4: DISTRIBUTION OF HOUSEHOLDS BY AMOUNT SPENT ON PURCHASE /CONSTRUCTION OF KUTCHA HOUSE TILL NOW Cost incurred (Range INR) Distribution by range of cost incurred Distribution across regions Range Average Central East North South West All Central East North South West All 1500‐11499 7414 40.4 12.0 18.9 44.1 33.8 30.3 2.6 4.2 21.4 53.8 18.0 100 11500‐21499 16837 3.8 27.8 54.5 28.9 52.4 40.8 0.2 7.3 45.6 26.1 20.7 100 21500‐31499 27443 11.9 20.3 9.1 9.0 5.1 9.7 2.4 22.6 32.1 34.4 8.5 100 31500‐41499 32669 43.9 39.9 17.5 18.0 8.7 19.2 4.5 22.3 31.2 34.7 7.3 100 All 18222 100 100 100 100 100 100 2 10.7 34.2 37 16.1 100 Source: CGDR research
7.4 CURRENT PURCHASING PRICE OF SLUM DWELLING
The above analysis shows that the cost of owning and residing in a slum dwelling is not a good indicator of prevailing cost of a dwelling in slum if someone has to buy one. It is in this context that interview based data is generated to understand the value of slum houses in exiting state and the same is presented in Table 7.5.
The average cost of purchasing a one room Jhuggi in a Slum is reported to be INR 40243, which varies between INR 48279 to INR 28496 across zones. The maximum cost is reported in the central zone with INR. 48279 followed by North INR 45500, South INR 44109 and East INR 43047 respectively. West zone is reported to be the lowest at INR 28435.
Average rent per month for a Jhuggi is reported to be INR 847. Once again the highest rent is reported from central zone at INR 1054 followed by North INR 952, South INR 938, West INR 740 and the minimum in the East at INR 648.
Data on cost of one room and cost spent on arranging/construction of a house in slum is also compared in Table 7.5. It may be noted that slum houses have more space than one room in terms of additional floors, some amenities and encompass the maintenance cost over time. Therefore, the two values are not exactly comparable. Nevertheless both values have importance in their own right. The purchase price represents a

COST OF DWELLING OWNERSHIP
This document is intellectual property of Centre for Global Development Research Private Limited, New Delhi prepared with the help of SER Grant extended by the Planning Commission of India. No part of the document can be copied without a written permission of CGDR
Page 83
minimum value that a new slum entrant should be willing to pay for a good accommodation. On the other hand the cost incurred on accommodation represents the social loss of demolition of slum house.
Clearly, purchase price of slum room is not small and any slum seeker person should be willing to pay at least this much for an alternative better accommodation. Similarly, the social loss of demolition is also not small and government should be ready to compensate the same or adjust this cost in case an alternative accommodation is planned.
TABLE 7.5: AVERAGE COST OF PURCHASING ONE ROOM AND AVERAGE RENT FOR ONE ROOM IN SLUM Sl. No. Zone Cost of 1 Room in Slum
(INR) Monthly Rent for 1 Room in Slum (INR)
Average expenditure incurred in construction/owning of house (INR)
1 Central 48279 1054 70374 2 East 43471 648 52905 3 North 44603 952 44747 4 South 44109 938 49628 5 West 28496 740 62133 All 40243 847 53061 Source: CGDR research
7.5 CONCLUDING REMARKS
Slum houses are constructed in small increments as and when the funds are available and with increasing confidence of the community about possibility of continuing. Slum dwellers are more confident in investing in their houses if the slum is fairly older. Slum houses are also sold and rented like any other property. The cost varies from one region to other and also within slum cluster depending on the type of structure and proximity to other facilities.
It is also important to note that many of the dwelling owners do not reside themselves in the slums and use the premises for renting. The estimates based on sample survey indicate that about 97.9 per cent of the dwelling owners reside themselves. Only 2.1 percent households reported as tenants. However, from investigation at the time of visits to the slums, it has been reported that most of the HHs without ration card are tenants, which indicates that such tenants could be 11 per cent. Therefore any rehabilitation program would face the challenge of identification and therefore, it is important to freeze the problem of ownership upfront by using biometric survey of owners, exact census of houses, and strict consistency examination.

Slums of Delhi
October 2011 Page 84
Data on cost of one room and cost spent on arranging/construction of a house are not exactly comparable. Nevertheless both values have importance in their own right. The purchase price represents a minimum value that a new slum entrant should be willing to pay for a good accommodation. On the other hand the cost incurred on accommodation represents the social loss of demolition of slum house.
Clearly, purchase price of slum room is not small and any slum seeker person should be willing to pay at least this much for an alternative better accommodation. In case of monthly instalments, a slum house seeker should be willing to pay as much as the rental of a room in slum.
Similarly, the social loss of demolition is also not small and government should be ready to compensate the same or adjust this cost in case an alternative accommodation is planned.

DRIVERS OF MIGRANTS TO SLUM LIFE
This document is intellectual property of Centre for Global Development Research Private Limited, New Delhi prepared with the help of SER Grant extended by the Planning Commission of India. No part of the document can be copied without a written permission of CGDR
Page 85
Chapter 8
Drivers of Migration to Slum Life People residing in slums dwellings have diverse background and they have migrated due to various reasons. A few of them even had resided in better localities of Delhi, while others came directly to find place in current slum. Discussion in Chapter 4 indicates even those who came from Delhi, their native place may or may not be Delhi and, majority of slum migrants belong to most under‐developed states of the country. At the same time they come from rural sector in a hope to improve their destiny.
This is also the effect of poor growth in agriculture sector of the economy and shrinking per capita avenues of job prospects in rural sector. On the other hand developments in growth centres marked by the expansion of cities population, services and industry need cheaper labour, which is abundantly available in rural sector. Ironically, the incoming labour cannot afford the costly accommodation in cities in absence of proper intervention by the government and the employers of this labour force. As a result this labour starts residing in temporary hutments, which develop in to slums or they find cheaper accommodation in existing slums. This gives a natural drives to the expansion of slums which come as rescue for the poor people searching jobs.
In western World and old cities slums have also been reported to have been developed due to division of properties in to small fragments and transfer of dwelling from rich to poor, which deteriorated after the original dwellers, moved on to new and better parts of the city. The condition of the old homes declined as they were progressively subdivided and rented out to lower income people. This kind of slums can be found in old city areas but the difference is that people own tenure in these cases where as dwellers in slums build on encroached land do not have tenure. This report is more about later type of slums and abstracts the first type.
8.1 RURAL – URBAN INFLUX AND INSECURE TENURE
The above phenomenon is not unique to Delhi slums. UN‐HABITAT’s projections show that by 2030, Africa will cease to be a rural continent, as more than half of its population will be in cities in towns – this in a matter of one generation. Over the last 40 years, Latin America has experienced such a rapid rate of urbanisation that today, 75 per cent of the population lives in urban areas. The rapidity and enormous

Slums of Delhi
October 2011 Page 86
volume of this rural‐to‐urban migration intensifies slum formation. City planning and management systems are unable to adequately cope with the massive population influx. The lack of secure tenure is a primary reason why slums persist. Without secure tenure, slum dwellers have few ways and little incentive to improve their surroundings. Secure tenure is often a precondition for access to other economic and social opportunities, including credit, public services, and livelihood opportunities. Study after study confirms that, in slums where residents enjoy secure tenure to land and housing – whether formal or informal – community‐led slum improvement initiatives are much more likely to be undertaken and, in fact, succeed. Slum formation is also closely linked to economic cycles, trends in national income distribution, and in more recent years, to national economic development policies. The Report finds that the cyclical nature of capitalism, increased demand for skilled versus unskilled labour, and the negative effects of globalisation – in particular, global economic booms and busts that ratchet up inequality and distribute new wealth unevenly – contribute to the enormous growth of slums.1
The UN Habitat report notes that, in the past, the global economic cycles were responsible for creating the famous slum areas of major cities in today’s developed world and they are very likely to do the same again in the developing world. In this study also there are enough evidence as discussed below to support this hypothesis.
8.1.1 Land less labour move from rural sector to cities
Figure 8.1 presents distribution of households without land ownership at native place. In this respect, 90.4 per cent reported in the negative. Across various region of Delhi, percentage of landless migrants varies between 86.7 per cent in North to 98.9 per cent in the Central. These landless people have nothing to lose and therefore, any increase in their income is additional gain and slum life is not a constraint for them as their rural background help then to bear the hardship and survive.
FIGURE 8.1: PERCENTAGE OF HOUSEHOLDS WITHOUT LAND OWNERSHIP AT NATIVE PLACE
Source: CGDR research
1 Twenty First Session of the Governing Council of UN Habitat, 16 ‐ 20 April 2007, Nairobi, Kenya, URL: http://www.unhabitat.org/downloads/docs/4625_51419_GC%2021%20What%20are%20slums.pdf
98.9
92.4
86.7
90.888.7
90.4
Central East North South West All
Landless

DRIVERS OF MIGRANTS TO SLUM LIFE
This document is intellectual property of Centre for Global Development Research Private Limited, New Delhi prepared with the help of SER Grant extended by the Planning Commission of India. No part of the document can be copied without a written permission of CGDR
Page 87
8.1.2 Disparate Search of Jobs and livelihood
Table 8.1 presents distribution of HH head by reasons of migration to Delhi. Eighty seven per cent of these HH heads came in search of a job, 9.5 per cent with a relative, 1.9 per cent with a job agent and 0.8 percent reported other reasons. Thus, it is the search of livelihood that is behind the motivation to sustain a slum life for the landless labour from rural India.
TABLE 8.1: PERCENTAGE OF HOUSEHOLDS BY REASONS FOR MIGRATION TO THE PRESENT SLUM Zone In Search of Job Thorough a job agent With a relative other All Central 72.8 0 23.1 4 100 East 73.7 5 18.8 2.5 100 North 88.9 1.5 9 0.6 100 South 94.5 0.5 4.6 0.4 100 West 89.1 2 8.9 0 100 All 87.8 1.9 9.5 0.8 100 Source: CGDR research
8.2 POPULATION PUSHED TO POVERTY FIND SHELTER IN SLUMS
As discussed above, economic cycle as also the cycle of circumstances in personal life force marginal labour to change the life style. Under adverse circumstances, the marginal labour moves to poverty zone and is forced to take up cheaper accommodation available in slums leading to expansion of slums. Distribution of households by their place of residence before coming to current slum is presented in Table 8.2. About 78.1 percent of the households have reported their previous residence to be outside Delhi, which varies between 80.7 per cent in the West to 17.0 per cent in central zone. Thus a sizable share of 21.9 per cent of the total 4.34 lakh households stayed in Delhi itself. Out of these 21.9 per cent people, only 16.0 percent lived in another slum, 22.8 per cent had their own accommodation somewhere in Delhi and 61.2 per cent reported staying in rented accommodation in a colony. Thus, it can be inferred that slums provide refuse to a lot of such people who are pushed to poverty due to one or other reasons. Thus, economic cycle is another reason of slum expansion and the policy of government must be alive to such problems.
It may also be noted that all rural migrants may not be going to slums straight away. They might be starting with some accommodation and if that is found to be unaffordable, they might move to slums. Thus, several possibilities of slum expansion exist simultaneously.

Slums of Delhi
October 2011 Page 88
TABLE 8.2: DISTRIBUTION OF HOUSEHOLDS BY PLACE OF ORIGIN Zone Total House
Hold From Outside Delhi
From within Delhi
percentage of households who stayed in Delhi by previous residence Another slum Own
accommodation Rented in a colony
All
Central 25002 17.0 83.0 16.7 41.4 42 100 East 85408 83.1 16.9 13.1 33.8 53.1 100 North 79128 84.0 16.0 32.7 21.9 45.4 100 South 139814 80.6 19.4 15.2 14.1 70.7 100 West 104386 80.7 19.3 7.9 7.9 84.1 100 All 433738 78.1 21.9 16 22.8 61.2 100 Source: CGDR research
8.2.1 Unaffordable accommodation
Table 8.3 presents distribution of households for shifting from the previous residence. About 90.0 percent of the households said that they have left the earlier place of residence as they were not able to afford at the earlier place of residence, 3.9 per cent shifted in search of employment, 1.5 per cent for medical treatment, 0.3 percent due to loss of agricultural land / property and 2.3 per cent as they were asked to vacate the house.
TABLE 8.3: DISTRIBUTION OF HOUSEHOLDS BY REASONS FOR SHIFTING FROM THE PREVIOUS RESIDENCE Table 4.10. Distribution of households by reasons for shifting from the previous residence Row Labels Search of
Employment Could not afford earlier place of residence
to Seek Medical Treatment
Loss of Agricultural land/property
Reasons of anonymity
Asked to Vacate by the house
any other
All
Central 3.2 77 6.9 0 0 0 12.9 100 East 0 98.2 0.5 0 0 0.8 0.4 100 North 0.9 97.7 0.9 0 0 0.5 0 100 South 3 87.1 2 1.1 1.5 4.3 1.1 100 West 8.7 84.1 1.5 0 2.6 2.6 0.5 100 All 3.9 89.9 1.5 0.3 1.3 2.3 0.9 100 Source: CGDR research
8.3 POTENTIAL EMPLOYMENT AVENUES PROVIDE CONFIDENCE
It has been made strong point that migrant accommodate in slums because it provide cheaper shelter but it should also be the case that migrants being mostly unskilled, should find jobs that can be done with physical ability alone or mostly. This issue is examined through interview of slum heads and other influential people of slums. The issue is whether there are potential job avenues near slums. In the previous chapter it has been argued that slums come up near a job avenue under construction or through protection of interest groups who need the cheaper labour for their work or household help. However, once a slum is well established for some time, it starts attracting other dwellers because of dual reason of (1) available job market nearby and cheaper accommodation. This logic gets support from the data in Table 8.4, where pattern of potential

DRIVERS OF MIGRANTS TO SLUM LIFE
This document is intellectual property of Centre for Global Development Research Private Limited, New Delhi prepared with the help of SER Grant extended by the Planning Commission of India. No part of the document can be copied without a written permission of CGDR
Page 89
employment avenues for all slum clusters is presented. Distribution of potential job avenues is presented for each region and for period of establishment of slums. The following inferences can be drawn:
Daily wagers form the most potential job description for the slum dwellers, which account for 47.49 per cent of job avenues. Another, 20.65 per cent potential exists as regular private company job and 13.52 per cent Job Avenue exist as household help. Thus, about 80 per cent of job covered by the above three sectors can be easily done by the rural labour and it forms a big motivator to move out of rural life.
TABLE 8.4: PATTERN OF POTENTIAL EMPLOYMENT AVENUE (ALL SLUM CLUSTERS) Region/ Year
of Establishment
Distribution of potential employment avenues Government Private
Regular Business Household
help Daily Wager
Mason Electrician Plumbing Others
Central 2.79 31.34 6.36 16.02 29.92 3.11 0.92 0.87 8.67 East 2.23 15.55 5.82 17.57 42.14 4.66 1.40 1.52 9.11 North 0.47 26.40 1.44 9.82 51.46 1.76 0.96 0.90 6.79 South 1.57 26.86 7.37 17.91 33.96 3.79 1.67 1.26 5.62 West 1.50 3.11 0.79 6.30 79.96 0.45 0.36 1.19 6.34 All 1.71 20.65 4.35 13.52 47.49 2.75 1.06 1.15 7.31
By Year of Establishment 1922‐1931 5.00 60.00 10.00 2.00 5.00 2.00 1.00 0.00 15.00 1932‐1941 2.92 13.42 1.75 35.83 11.83 4.33 0.08 0.08 29.75 1942‐1951 4.55 36.82 6.36 14.55 24.18 3.91 2.18 1.82 5.64 1952‐1961 1.75 30.00 2.69 12.88 33.19 7.25 1.44 2.31 8.50 1962‐1971 0.91 25.30 6.97 12.03 40.55 3.12 1.36 1.55 8.21 1972‐1981 1.34 15.95 4.90 12.18 53.80 2.66 1.04 1.40 6.74 1982‐1991 2.11 19.16 3.45 12.56 53.42 2.05 0.88 0.66 5.69 1992‐2001 0.26 13.84 2.11 19.74 52.21 1.58 2.11 2.53 5.63 2002‐2011 0.00 23.33 0.00 5.00 70.00 0.67 0.33 0.00 0.67 Source: CGDR research
8.4 CONCLUDING REMARKS
Three social objectives of government are paramount: (1) Food for all to survive; (2) shelter for all; and (3) clothing for all. However, these entire objectives would be automatically fulfilled if all hands have job and means to earn. Ironically, expansion of slums is a conduit towards this objective but living conditions in slums are pathetic and crowded.
In the first place the built up of slum must not be allowed. If it can be stopped, the influx of rural population towards urban centres would be market determined at market price. The presence of slums distorts the

Slums of Delhi
October 2011 Page 90
market price of labour and might be resulting in super profits to private sector. In that sense not only the government, but the agents of nearby job market should also contribute in rehabilitation of slum dwellers who have served in meeting the business objectives.

ECONOMIC GAINS TO SLUM MIGRANTS
This document is intellectual property of Centre for Global Development Research Private Limited, New Delhi prepared with the help of SER Grant extended by the Planning Commission of India. No part of the document can be copied without a written permission of CGDR and Planning Commission.
Page 91
Chapter 9
Economic Gains to Slums Migrants Slums work as interface between twin goal of supporting deprived life style on the one hand and supply of cheap labour for industrial and services growth. In the process both gain, the slum dweller is able to generate surplus to enhance his life style while employers gain in terms of competitiveness and profits which are circulated in economy for multiplication. In order to examine whether the economic condition of slum dwellers have actually changed, before‐after analysis is carried on a number of economic indicators including consumption, assets ownership, indebtedness, and savings. In addition certain perception based direct indicators are also examined such willingness to go back to native land and factors which motivate them to continue in slum life.
9.1 SATISFACTION BASED DIRECT INDICATORS OF GAINS
Perception of people supported by reasons to believe can be an important measure of gains or loss of a particular event. In the present case over all assessment of gains or loss to society by moving out of rural sector and leading a slum life can best be done by asking direct questions and getting direct answers such as willingness to go back to native place and the reasons of doing so or willingness to continue and the reasons of doing so. In this section the answer to these questions are ponder with and it appears that society has gained through the channel of slum life.
9.1.1 Coming to Delhi and leading life from Slum was a right decision
The households were asked if it was a right or wrong decision to have moved out of their native place. The same is presented in Figure 9.1. About 95 per cent think that it was a right decision. These households were further asked the ways they have gained by leaving their native place. Similarly, reason of dissatisfaction was asked to those who feel it to be a wrong decision. The same is presented in Table 9.1 and 9.2 respectively and discussed below.

Slums of Delhi
October 2011 Page 92
FIGURE 9.1: PERCENTAGE OF HOUSEHOLDS CONSIDERING IT TO BE RIGHT DECISION TO HAVE MOVED OUT OF THEIR NATIVE PLACE
Source: CGDR research
9.1.1.1 REASONS FOR SATISFACTION
Among those who feel it to be a right decision to leave native place, about 98 per cent have said that they have gained by way of improving their financial condition and 52 per cent feel education of children has improved. Better food is reported by 61.3 per cent, 33.8 per cent reported better health, 29.6 per cent acquired more land, and 0.9 percent reported to have acquired more assets like automobiles. 1.8 per cent could possess more consumer durables and 1.0 per cent could build a better house in native place. Thus, there is wide ranging gain which forms the basis of thinking that moving to Delhi was a right decision despite slum life. This is a huge social gain and supports the objective function of the government and serves the same purpose as programs such as MGNREGA.
TABLE 9.1: DISTRIBUTION OF HOUSEHOLDS REPORTING RIGHT DECISION TO LEAVE THEIR NATIVE PLACE & THE WAY THEY HAVE GAINED Zone Right
decision Percentage of HHs reporting the way they have gained by the decision to leave the native place Better Financial Condition
Better Education of children
Better Food
Better Health
More Land
More assets like automobile
More Consumer Durables
Better house in native place
All
Central 98.4 100 6.9 11.2 4.1 1.8 0 0 0 100 East 98.2 96.2 35.8 60.9 19.3 27.9 0.9 2.6 0.8 100 North 93.5 97.3 51.9 68.8 42.9 41 1.3 1.9 0.3 100 South 95.9 97.9 68.6 69.9 46 32.7 1.1 1.4 1.2 100 West 91.2 98.3 54.8 56.4 30.1 25.1 0.4 1.9 1.5 100 All 94.9 97.7 52 61.3 33.8 29.6 0.9 1.8 1 100 Source: CGDR research
98.4 98.2
93.5
95.9
91.2
94.9
Central East North South West All
Migration to Delhi despite slum life was right decision
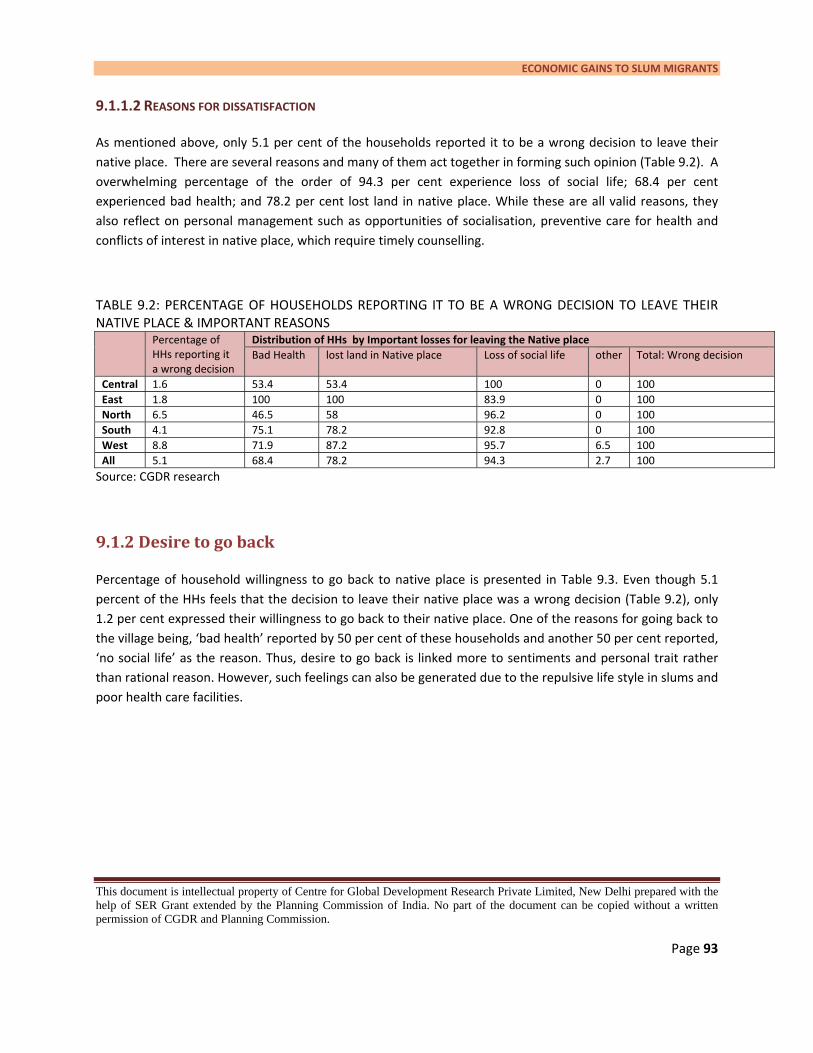
ECONOMIC GAINS TO SLUM MIGRANTS
This document is intellectual property of Centre for Global Development Research Private Limited, New Delhi prepared with the help of SER Grant extended by the Planning Commission of India. No part of the document can be copied without a written permission of CGDR and Planning Commission.
Page 93
9.1.1.2 REASONS FOR DISSATISFACTION
As mentioned above, only 5.1 per cent of the households reported it to be a wrong decision to leave their native place. There are several reasons and many of them act together in forming such opinion (Table 9.2). A overwhelming percentage of the order of 94.3 per cent experience loss of social life; 68.4 per cent experienced bad health; and 78.2 per cent lost land in native place. While these are all valid reasons, they also reflect on personal management such as opportunities of socialisation, preventive care for health and conflicts of interest in native place, which require timely counselling.
TABLE 9.2: PERCENTAGE OF HOUSEHOLDS REPORTING IT TO BE A WRONG DECISION TO LEAVE THEIR NATIVE PLACE & IMPORTANT REASONS Percentage of
HHs reporting it a wrong decision
Distribution of HHs by Important losses for leaving the Native place Bad Health lost land in Native place Loss of social life other Total: Wrong decision
Central 1.6 53.4 53.4 100 0 100 East 1.8 100 100 83.9 0 100 North 6.5 46.5 58 96.2 0 100 South 4.1 75.1 78.2 92.8 0 100 West 8.8 71.9 87.2 95.7 6.5 100 All 5.1 68.4 78.2 94.3 2.7 100 Source: CGDR research
9.1.2 Desire to go back
Percentage of household willingness to go back to native place is presented in Table 9.3. Even though 5.1 percent of the HHs feels that the decision to leave their native place was a wrong decision (Table 9.2), only 1.2 per cent expressed their willingness to go back to their native place. One of the reasons for going back to the village being, ‘bad health’ reported by 50 per cent of these households and another 50 per cent reported, ‘no social life’ as the reason. Thus, desire to go back is linked more to sentiments and personal trait rather than rational reason. However, such feelings can also be generated due to the repulsive life style in slums and poor health care facilities.

Slums of Delhi
October 2011 Page 94
TABLE 9.3: PERCENTAGE HOUSEHOLDS BY THEIR WILLINGNESS TO GO BACK TO NATIVE PLACE AND REASONS THERE OF Zone Percentage of HHs willing to
go back to Native Place Percentage of HHS by reasons for going back to their native place
Yes Bad Health No Social Life All Central 0 East 0.3 100.0 0.0 100 North 0.7 33.3 66.7 100 South 0.2 0.0 100.0 100 West 1.2 50.0 50.0 100 All 0.5 45.7 54.3 100 Source: CGDR research
9.1.3 Attractions of Slum Life
Despite several disadvantages of slum life, Delhi slums do offer some attractions as well which work as considerable help in carrying the day to day life. Table 9.4 presents Distribution of HHs reporting, ‘best things of Slum life’, they like the most. ‘Cheaper electricity’ has been reported as one of the biggest advantages of slum life by about 56.9 percent of the households. This is followed by ‘cheaper Food Items’ which is felt by 39.3 per cent of the households. 29.1 percent appreciate ‘cheaper water supply’ and 28.6 percent reporting, ‘subsidy for children’s education’ as one of the best things of slum life.
TABLE 9.4: PERCENTAGE HOUSEHOLDS REPORTING FIVE BEST THINGS OF SLUM LIFE Aspects Central East North South West All Cheaper Electricity 63.1 65.9 40.6 52.4 66.5 56.9 Employment Potential 12.9 10.3 40.9 19.5 14.8 20.1 Cheaper Food Product 17.1 15 38.4 51.4 49.3 39.3 Cheaper Water Supply 11.6 11.1 14.8 38.5 46.3 29.1 Low rent 0 0 0 0 0.2 0 Subsidiary Child Education 14.5 15.7 54.5 30.1 21 28.6 Source: CGDR research
9.1.4 Benefits of Welfare Measures
Slum dwellers also enjoy benefits of several types of welfare activities conducted by government and non‐government organisations, which provide an additional support for betterment of slum life.
As indicated in earlier chapters, particularly Chapter 3 on slum profile about 36 NGO’s are working in slums providing welfare help in a number of areas such as education, health, legal advice, counselling, welfare of women and children and general support.
Eighty‐eight percent of the households said that they are satisfied by the intervention, 5.9 per cent very satisfied and 6.7 per cent reported dissatisfied.
Across zones households reporting presence of one or the other welfare activity of government and the percentage of positive response vary between 93.5 per cent in the East to 17.8 per cent in the West. These

ECONOMIC GAINS TO SLUM MIGRANTS
This document is intellectual property of Centre for Global Development Research Private Limited, New Delhi prepared with the help of SER Grant extended by the Planning Commission of India. No part of the document can be copied without a written permission of CGDR and Planning Commission.
Page 95
households were asked if the services provided through those programmes were satisfactory or not. About 55 percent of these households reported satisfactory, 29.4 per cent very satisfactory and 15.4 per cent reported unsatisfactory. Such facilities may or may not be available outside slums and form important part of the aggregate gains to slum dwellers.
9.2 ECONOMIC INDICATORS OF GAINS
Economic indicators including increase in income, consumption, assets ownership, and savings. Similarly, decrease in indebtedness also is an indicator of social gain. These are indirect indicators. Some people can argue all these gains to be direct indicators but changes in a factor does not make sense if overall satisfaction is not attained and therefore these factors can best be called as means to total social gains. If these indicators support the direct indicators, it provides a reason to believe that the social objectives are getting achieved. The following discussion aims to carry out this which is highlighted by a comparative analysis with the conditions prevailing before migration in real terms.
9.2.1 Increase in Household income
Table 9.5 presents average annual income per person by source during current & before coming to the Slum at 1999‐00 prices. The annual average per capita income per person at native place is estimated at INR 1856 which increased by 317 per cent to INR 7748.
By source, income from salary increased by 1493 per cent, income from self employment by 878 per cent, income from business, trade, petty shops etc. by 672 per cent, wage income by 168.60 per cent and other sources like pension etc. by 673 per cent.
The composition of income by source also changed drastically. Wage income formed 82.59 percent of total income in native place which came down to 53.14 percent currently; income from salary was only 9.54 percent at native place which increased to as high as 36.42 percent; income from business/ trade/ petty shops etc was 2.49 percent at Native place which increased to 4.60 percent; income from other sources like pension etc. increased from 0.34 percent at native place to 0.64 percent currently.
Thus, there is perceptible change in income of all category of working people and reflects on the social gain due to the existence of slums as provider of shelter to the migrating population. If this shelter was not available migrants would not have survived and continued to toil to reach the current level of income.

Slums of Delhi
October 2011 Page 96
TABLE 9.5: AVERAGE ANNUAL INCOME PER PERSON BASED ON THE ESTIMATES OF POPULATION AT 1999‐00 PRICES (INR) Sl. No Source Current Native
Place Percentage Change
Distribution of Income Current Native Place
1 Agriculture income 54.94 0.00 2.70 2 Business/trade/petty shops etc 356.49 46.20 671.62 4.60 2.49 3 Self employment 375.72 38.41 878.18 4.85 2.07 4 Salary income 2821.68 177.13 1493.00 36.42 9.54 5 wage income 4117.01 1532.78 168.60 53.14 82.59 6 Rent, Interest & Dividends 15.32 0.20 0.00 7 Transfer Income 12.28 0.16 0.00 8 Other Sources like Pension etc 49.33 6.38 673.20 0.64 0.34 All 7747.82 1855.85 317.48 100 100 Source: CGDR research
9.2.2 Increase in Household assets
Increase in asset holding is another important indicator of gains to slum migrants. Table 9.6 presents percentage of HHs by ownership of HH assets across zones during current period and at the time of leaving native place. It may be observed that there is a much larger change in the ownership of assets by the HHS during current and at native place. Currently all households own a Fan but at native place only 11.4 percent had fans. About 87.15 per cent currently own colour television as against 0.5 per cent in native place. 73.77 per cent own bicycle as against 8.82 per cent in native place; about 44.12 per cent households own, radio/ transistor as against 5.1 percent at native place. About 26.29 percent households currently own refrigerator as against 0.06 per cent in native place. Modern communication system, the mobile phone is owned by 82.83 per cent households. The average no of assets per HH has increased considerably and this is another indicator of wellbeing due to the transitory role played by the slum accommodation.
TABLE 9.6: PERCENTAGE OF HOUSEHOLDS BY OWNERSHIP OF HOUSEHOLD ASSETS AND ZONE Household Assets
Current Native Place Central East North South West All Central East North South West All
Fan 100 100 100 100 100 100 0.00 10.51 13.62 12.09 10.49 11.40 Bicycle 68.89 76.95 65.33 73.69 79.03 73.77 4.44 16.95 3.10 9.15 7.42 8.82 Radio/ Transistor 28.89 40.34 53.87 39.71 47.57 44.12 0.00 12.20 1.55 4.41 4.35 5.10 Tape recorder 15.56 10.51 29.41 25.98 21.74 22.63 0.00 3.39 0.00 2.61 2.30 2.10 Television b/w 6.67 2.37 8.98 3.27 3.84 4.44 2.22 6.44 4.33 6.54 5.12 5.64 Television (color) 80.00 88.81 84.52 87.09 89.00 87.15 0.00 1.36 0.62 0.49 0.00 0.54 Refrigerator9 40.00 37.29 28.79 20.59 23.27 26.29 0.00 0.00 0.31 0.00 0.00 0.06 Mobile phone 62.22 85.76 80.19 83.17 84.65 82.83 2.22 1.36 0.00 0.16 0.26 0.42 Computer 0.00 0.00 0.62 0.49 0.00 0.30 0.00 0.00 0.00 0.00 0.00 0.00 Two wheeler 8.89 1.69 1.55 0.65 0.51 1.20 0.00 1.36 0.00 0.16 0.00 0.30 House/flat/plot 0.00 0.00 0.62 0.00 0.77 0.30 0.00 0.34 0.00 0.16 0.00 0.12 Four wheeler 0.00 0.00 0.00 0.00 0.77 0.18 0.00 0.00 0.00 0.00 0.00 0.00 Washing machine 6.67 1.36 0.93 0.82 1.02 1.14 0.00 0.00 0.00 0.00 0.00 0.00 Telephone 4.44 1.02 0.00 0.16 0.77 0.54 0.00 0.00 0.00 0.00 0.00 0.00 Any other(specify) 2.22 2.71 0.31 0.49 0.77 0.96 0.00 0.00 0.00 0.33 0.00 0.12 Source: CGDR research

ECONOMIC GAINS TO SLUM MIGRANTS
This document is intellectual property of Centre for Global Development Research Private Limited, New Delhi prepared with the help of SER Grant extended by the Planning Commission of India. No part of the document can be copied without a written permission of CGDR and Planning Commission.
Page 97
9.2.3 Increase in Household Consumption Expenditure
Comparison of level of consumption assessed by the 64th round of NSSO Consumer Expenditure Survey is done with the estimated Consumer Expenditure in Delhi slums at constant 1999‐2000 prices and the same is presented in Table 9.7. Because of the fact that most migrants come from Rural UP and Bihar, the NSSO figures for rural UP and Bihar are used as comparators. The results indicate, that slum dwellers have improved from 9.6 per cent to 65.8 per cent across quintiles groups of UP and Bihar. The average gain is 11.8 per cent in the case of UP and 27.2 per cent gain in the case of Bihar. Thus slum dwellers are better‐off compared to average population from where they come from and this is a strong indicator of social benefit.
TABLE 9.7: FIRST, SECOND, THIRD AND FOURTH QUINTILES OF DISTIBUTION OF MPCE IN RURAL SECTOR BIHAR, UP AND ALL‐INDIA VIS‐À‐VIS CGDR ESTIMATES FOR DELHI SLUMS Quintile NSSO (2007‐08) at 1999‐00 prices CGDR (2010) at 1999‐00 prices
Bihar (Rural) UP (Rural) All India (Rural) Delhi Slum EXP Exp Q1 293 323 338 354 Q2 354 391 422 491 Q3 426 468 522 612 Q4 536 606 690 889 Average MPCE (INR) 431 490 556 548 Source: CGDR research
Per capita annual expenditure on food and non‐food items at 1990‐00 prices is presented in Figures 9.2 & 9.3 and Table 9.8. Two observations are revealing. Food expenditure has increased from INR 1345.81 to INR 3869.87, while non‐food expenditure has increased from INNR 666.41 to INR 2705.24 (Figure 9.2), which means expenditure on food increased by 2.88 times and non‐food by 4.06 times. The overall increase is 3.27 times.
Thus, share of non‐food expenditure has increase drastically from 33.11 per cent to 44.15 per cent (Figure 9.3). This is an important indicator of well being of people which reflects on spare income for other than food items. This amply supports the ‘Engels Law’ which states that as HH income increases the share of expenditure on non‐food too increases and on food declines because the HH are left with more surplus after meeting their basic needs on food items.

Slums of Delhi
October 2011 Page 98
FIGURE 9.2: ANNUAL PER CAPITA EXPENDITURE ON FOOD AND NON FOOD ITEM
Source: CGDR research
FIGURE 9.3: DISTRIBUTION OF ANNUAL PER CAPITA EXPENDITURE ON FOOD AND NON FOOD ITEM
Source: CGDR research
Table 9.8 presents detailed consumption expenditure during the current year and at the native place at 1999‐00
prices again. Within food items, the increase is highest for outside eating which has increased by 1706 per cent followed by processed food by 696 per cent, beverages 511 per cent, Meat, fish and eggs by 343 per cent, Milk and milk products 341 per cent, edible oil and vanaspati 129 per cent. The expenditure on cereal like rice, pulse has witnessed much lower rate of increase to the extent of 49.66 per cent for rice and 112.63 per cent for pulses. These have been a fall in the expenditure on coarse cereals to the extent of 96.47 per cent. This indicates that those living in slums have obviously better off in terms of expenditure on food of superior nature than their stay at native place.
TOTAL FOOD Total Non‐food Total
Current 3869.97 2705.24 6575.21
Native Place 1345.81 666.41 2012.22
Current Native Place
Total Non‐food 41.15 33.11
TOTAL FOOD 58.86 66.88
0
20
40
60
80
100
120
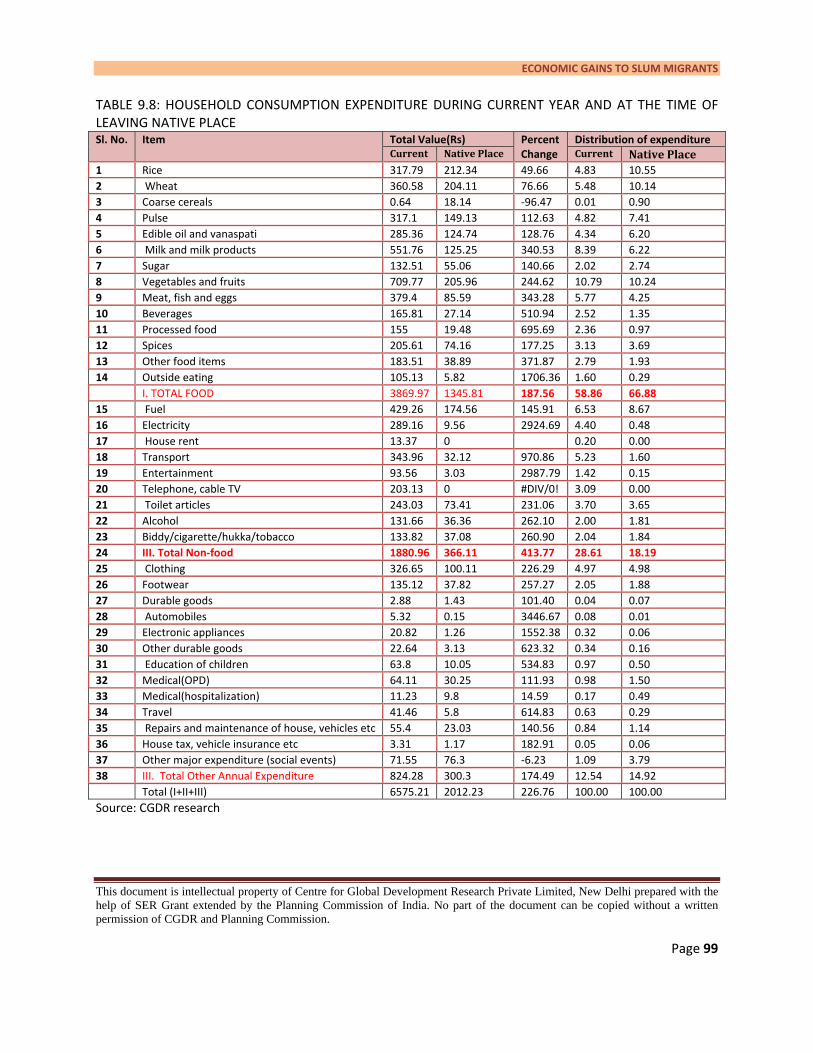
ECONOMIC GAINS TO SLUM MIGRANTS
This document is intellectual property of Centre for Global Development Research Private Limited, New Delhi prepared with the help of SER Grant extended by the Planning Commission of India. No part of the document can be copied without a written permission of CGDR and Planning Commission.
Page 99
TABLE 9.8: HOUSEHOLD CONSUMPTION EXPENDITURE DURING CURRENT YEAR AND AT THE TIME OF LEAVING NATIVE PLACE Sl. No. Item Total Value(Rs) Percent
Change Distribution of expenditure
Current Native Place Current Native Place 1 Rice 317.79 212.34 49.66 4.83 10.55 2 Wheat 360.58 204.11 76.66 5.48 10.14 3 Coarse cereals 0.64 18.14 ‐96.47 0.01 0.90 4 Pulse 317.1 149.13 112.63 4.82 7.41 5 Edible oil and vanaspati 285.36 124.74 128.76 4.34 6.20 6 Milk and milk products 551.76 125.25 340.53 8.39 6.22 7 Sugar 132.51 55.06 140.66 2.02 2.74 8 Vegetables and fruits 709.77 205.96 244.62 10.79 10.24 9 Meat, fish and eggs 379.4 85.59 343.28 5.77 4.25 10 Beverages 165.81 27.14 510.94 2.52 1.35 11 Processed food 155 19.48 695.69 2.36 0.97 12 Spices 205.61 74.16 177.25 3.13 3.69 13 Other food items 183.51 38.89 371.87 2.79 1.93 14 Outside eating 105.13 5.82 1706.36 1.60 0.29 I. TOTAL FOOD 3869.97 1345.81 187.56 58.86 66.88 15 Fuel 429.26 174.56 145.91 6.53 8.67 16 Electricity 289.16 9.56 2924.69 4.40 0.48 17 House rent 13.37 0 0.20 0.00 18 Transport 343.96 32.12 970.86 5.23 1.60 19 Entertainment 93.56 3.03 2987.79 1.42 0.15 20 Telephone, cable TV 203.13 0 #DIV/0! 3.09 0.00 21 Toilet articles 243.03 73.41 231.06 3.70 3.65 22 Alcohol 131.66 36.36 262.10 2.00 1.81 23 Biddy/cigarette/hukka/tobacco 133.82 37.08 260.90 2.04 1.84 24 III. Total Non‐food 1880.96 366.11 413.77 28.61 18.19 25 Clothing 326.65 100.11 226.29 4.97 4.98 26 Footwear 135.12 37.82 257.27 2.05 1.88 27 Durable goods 2.88 1.43 101.40 0.04 0.07 28 Automobiles 5.32 0.15 3446.67 0.08 0.01 29 Electronic appliances 20.82 1.26 1552.38 0.32 0.06 30 Other durable goods 22.64 3.13 623.32 0.34 0.16 31 Education of children 63.8 10.05 534.83 0.97 0.50 32 Medical(OPD) 64.11 30.25 111.93 0.98 1.50 33 Medical(hospitalization) 11.23 9.8 14.59 0.17 0.49 34 Travel 41.46 5.8 614.83 0.63 0.29 35 Repairs and maintenance of house, vehicles etc 55.4 23.03 140.56 0.84 1.14 36 House tax, vehicle insurance etc 3.31 1.17 182.91 0.05 0.06 37 Other major expenditure (social events) 71.55 76.3 ‐6.23 1.09 3.79 38 III. Total Other Annual Expenditure 824.28 300.3 174.49 12.54 14.92 Total (I+II+III) 6575.21 2012.23 226.76 100.00 100.00 Source: CGDR research

Slums of Delhi
October 2011 Page 100
Within non‐food items maximum increase was found in case of automobiles by 344 per cent followed by entertainment by 2988 per cent, electricity by 2945 per cent and electronic appliances by 1552 per cent, other
durable goods 623 per cent indicating an improvement in the quality of Slum dwellers after coming to the present slum. The composition of expenditure in terms of percentage distribution of food and non‐food expenditure incurred to total expenditure has also undergone a major change for better.
It may be argued that the changes in expenditure itself do not always reflect upon the change in the quality of life due to the price factor although this issue is already addressed above by taking consumption in real term. Nevertheless, in order to re‐assert the point variations in quantity terms has been presented for selected products in Table 9.9.
There has been 167 per cent increase in the rice consumption, 186 per cent increase in wheat consumption. Consumption of pulse; Edible oil and vanaspati; milk and milk products; and sugar have increased by 183 per cent, 182 per cent, 298 per cent and 327 per cent respectively.
Per unit real price for rice, wheat and sugar is lower currently than at native place. This is because currently most of the HHs buy these items from the fair price shops at concessional rates than at native place. The price of pulse, edible oil and milk/ milk products is reportedly higher currently than at native place.
TABLE 9.9: QUANTITY AND VALUE (RS.0.00) OF ANNUAL AVERAGE CONSUMPTION OF SELECTED FOOD ITEMS. PER CAPITA PER PERSON Sl. No.
Items
Quantity Percentage Change Unit Current Native life
1 Rice Kg 49.13 29.38 167 2 Wheat Kg 54.94 29.51 186 3 Coarse cereals Kg 0.14 4.19 3 4 Pulse Kg 7.55 4.13 183 5 Edible oil and vanaspati Liter 7.8 4.29 182 6 Milk and milk products Kg 34.29 11.51 298 7 Sugar Kg 9.39 2.87 327 Source: CGDR research
9.2.4 Increase in Savings
Increase in real savings is another indicator of well being. Table 9.10 presents household savings during current period along with that before leaving native place. It is found that there has been a six fold increase in the income of the slum dwellers after coming from the native place. The increase in expenditure has also been more than three fold. As regards savings, there was a negative savings at native place which became positive from INR ‐156.4 to INR 1172.6 indicating a substantial increase.

ECONOMIC GAINS TO SLUM MIGRANTS
This document is intellectual property of Centre for Global Development Research Private Limited, New Delhi prepared with the help of SER Grant extended by the Planning Commission of India. No part of the document can be copied without a written permission of CGDR and Planning Commission.
Page 101
TABLE 9.10: HOUSEHOLD SAVINGS BEFORE & AFTER LEAVING NATIVE PLACE (AT CONSTANT 1999‐00 PRICES) Annual average per person (INR.0.00)
Current Native Place Ratio of Current over Native ( Percent)
Income 7748 1856 6.04 Expenditure 6575.2 2012 3.27 Income less Expenditure 1172.6 ‐156.4 7.49 Source: CGDR research
It is also interesting to see that the savings rate across population belonging to different native states is quite at variance. Table 9.11 presents average annual income and expenditure per person (INR) across native states at constant 1999‐00 prices for high volume migrant states namely Uttar Pradesh, Bihar, Rajasthan and Madhya Pradesh. Migrants from all four states have gained in terms of increase in income, expenditure and savings. In fact they appear to be under debt when they migrated and now enjoy surplus. Thus there is net social benefit.
TABLE 9.11: AVERAGE ANNUAL INCOME AND EXPENDITURE PER PERSON (INR) BY THE HOUSEHOLDS ACROSS NATIVE STATES (1666 HOUSEHOLDS) AT CONSTANT 1999‐00 PRICES State Income (INR) Expenditure (INR) Ratio of Current to Native Saving
Current Native Place
Current Native Place
Income Expenditure Rank Current Native Place
U.P. 7693 1412 6806 1903 5.45 3.58 5 887 ‐491 Bihar 7127 1890 6528 2259 3.77 2.89 9 599 ‐369 U.P. 7693 1412 6806 1903 5.45 3.58 5 887 ‐491 Rajasthan 7414 1144 6501 2477 6.48 2.62 12 913 ‐1333 M.P. 7426 1285 6433 1836 5.78 3.5 7 993 ‐551 Source: CGDR research
9.3 CONCLUDING REMARKS
About 95 per cent of the slum dwellers think it was a right decision to have moved out of their native place reflects upon the direct gains, which is supported by substantial gains in real income, real expenditure and savings. Slum dwellers enjoy the benefits of cheaper electricity, water and children education due to government interventions, which help them in supporting their life style and overall improvement in economic conditions. Given the huge gains in consumption and expenditure, net social gain appears to be obvious.

Slums of Delhi
October 2011 Page 102
Chapter 10
Willingness to Move and Willingness to Pay for Resettlement The discussion in Chapter 9 on gains to slum migrants clearly indicates an improvement in economic condition of the households relative to what would have been if they had to stay back in their respective native places. Therefore, majority of them did not want to go back to native place and evidently wish to stay back and see their future with the development of Delhi. In addition, most of the slums are created gradually over a long time with people are living there for several years and many of them would be third generation or even fourth generation. This leaves the young generation a sense of belongingness besides the economic considerations. Many of the residents must have acquired a better place to live, yet they do not want to shelve the slum for reasons of re‐sentiment benefits or earnings from rental. In addition, the slum dwellers might also be calculating and comparing the returns from resettlement plan of the government or rental from the slum house with the selling price of slum house. In this chapter an attempt is made to ponder on the issue of willingness to move out of slum as also willingness to pay for resettlement. Again, the analysis is based on sample survey of households.
10.1 GENERAL UNWILLINGNESS TO MOVE AWAY FROM PRESENT LOCALITY
Given the nature of job the slum dwellers are engaged in, relocating them in suburban areas would be too costly for their survival. At present there is a synergy between the means of livelihood, current locations of slums and the job markets. Therefore, it is legitimate to ask slum dwellers, whether they would be willing to move to a faraway place under any resettlement plan of the government. The positive response is summarised in Figure 10.1. In line with expectations, about 11 are willing to move to a faraway place and about 89 per cent of the households are not willing to move to a faraway place. The underlying fear is job insecurity, which they would have to find. The new place may or may not be conducive to the kind of job they do. However, there are 11.0 per cent people who said that they can opt for an accommodation at faraway place from their present location, which leads to a possibility of creating options with differential pricing, whereby some people can be motivated to take up resettlement at the outskirts of city. It is also possible that this percentage could be higher when under lucrative offers such as larger accommodation or higher subsidy cost.

WILLINGNESS TO MOVE AND WILLINGNESS TO PAY
This document is intellectual property of Centre for Global Development Research Private Limited, New Delhi prepared with the help of SER Grant extended by the Planning Commission of India. No part of the document can be copied without a written permission of CGDR.
Page 103
FIGURE 10.1: DISTRIBUTION OF HOUSEHOLDS WHO WOULD OPT FOR AN ACCOMMODATION FAR AWAY FROM THEIR PRESENT LOCATION.
Source: CGDR research
10.1.1 Causes of poor willingness to move to faraway place
In order to probe the issue further, attempt is made to understand the factors that affect the willingness to move away. About 59 percent of the households feel that moving away from current location would affect their employment, Children’s education, basic amenities like drinking water etc and about 41 percent said it will not affect as they have no fixed job. Thus, under specific conditions, the choice pattern may varry and this is likely to be reflected when there are alternative models to choose. This also corroborated from the analysis of distance of work place in Chapter 6, where it is demonstrated that a sizable people, such as drivers and some types of labour could not fix the distance of their work place.
FIGURE 10.2: DISTRIBUTION OF HOUSEHOLDS BY THE WAY IT WILL AFFECT THE HOUSEHOLDS
Source: CGDR research
41.90
0.00
13.70 15.30
3.50
10.70
Central East North South West All
Acceptability for resettlement at far‐off place relative to current slum
71.8
60.7 64.1 62.9
46.5
59.2
Central East North South West All
Moving would Affect employment, education and basic services

Slums of Delhi
October 2011 Page 104
10.2 UNCERTAINTIES OF SLUM LIFE: A PROBLEM OF TENURE
In Chapters 7 and 8, it has been pointed out that insecurity is one of the major reasons that slum dwellers tend to lead a substandard life even if they could afford to build a better house. The perception of households is quite pessimistic about whether the government would allow the slums to exist for long or not. About 86.5 per cent of the households are of the opinion that the government will not allow slums to exist for long. This response is consistent across regions with highest percentage of 92.8 per cent reported in North (Table 10.1). To a question, “How many years more you think you can continue to stay in this Slum?” The response indicates that households expect to stay on an average for another 4 years only (Table 10.1). Thus, there is precarious problem with the slum dwellers, they know that the slum settlement is temporary, yet they are not able to come out of it. The perception about four years of additional stay is somewhat standardised perpetual benchmark. Possibly this is linked to the time lag between notification and demolition of slums.
TABLE 10.1: EXPECTATIONS ABOUT CONTINUANCE OF SLUMS AND THE FUTURE PLANS Zone Percentage of
households Who feel that government will not allow slums to continue
Expected number of additional years the households could continue to stay in the present slum (Years)
Distribution of households by their future plan of proper settlement Purchase a house Continue
in Slum No plan at all
Grand Total
Central 78.0 3.0 0.6 4.0 95.4 100 East 89.9 6.0 4.8 10.0 85.2 100 North 92.8 4.0 7.8 16.3 75.9 100 South 88.2 4.0 24.7 10.4 64.9 100 West 78.5 4.0 5.0 17.4 77.5 100 All 86.5 4.0 11.6 12.7 75.7 100 Source: CGDR research
10.2.1 Jittery Future Plans
The respondent households were asked about their future plan regarding their place of residence. About 75.7 per cent reported having ‘no plan’, 12.7 per cent feel that they can continue to stay in the slum and only 11.6 per cent comprising of 50,205 households have plan to purchase a house. This means that these 11.6 per cent households have improved their economic condition and attained some kind of stability in income flows that they can aspire for a better place of living of their own in at least long term.
10.2.2 Only a Few can Move Out of Their Own Effort
Although 11.6 percent household have developed a positive mental framework and desire to purchase own house, only 1.3 percent numbering 5,628 households have a plan to move out of the slum to a rented or own accommodation (Figure 10.3). Out of these households about 48 percent have a plan to shift to their own

WILLINGNESS TO MOVE AND WILLINGNESS TO PAY
This document is intellectual property of Centre for Global Development Research Private Limited, New Delhi prepared with the help of SER Grant extended by the Planning Commission of India. No part of the document can be copied without a written permission of CGDR.
Page 105
accommodation and the remaining 52 percent to a rented accommodation. Even those planning to go in a rented house wish to purchase own house in near future (Figure 10.4).
FIGURE 10.3: PERCENTAGE OF HOUSEHOLD HEAD PLANNING TO MOVE OUT OF THE SLUM
Source: CGDR research
FIGURE 10.4: DISTRIBUTION OF HOUSEHOLD HEAD WHO PLAN TO MOVE OUT OF THE SLUM BY TYPE OF ACCOMODATION THEY COULD AFFORD
Source: CGDR research
0.00.3 0.2
1.5
2.9
1.3
Central East North South West All
Percentage of HHH planning to move out of slum
Central East North South West All
Own 0.0 100 40.2 53.3 47.7
Rented 100 0.0 59.8 46.7 52.3
Distribution of those HHH who are planning to move out
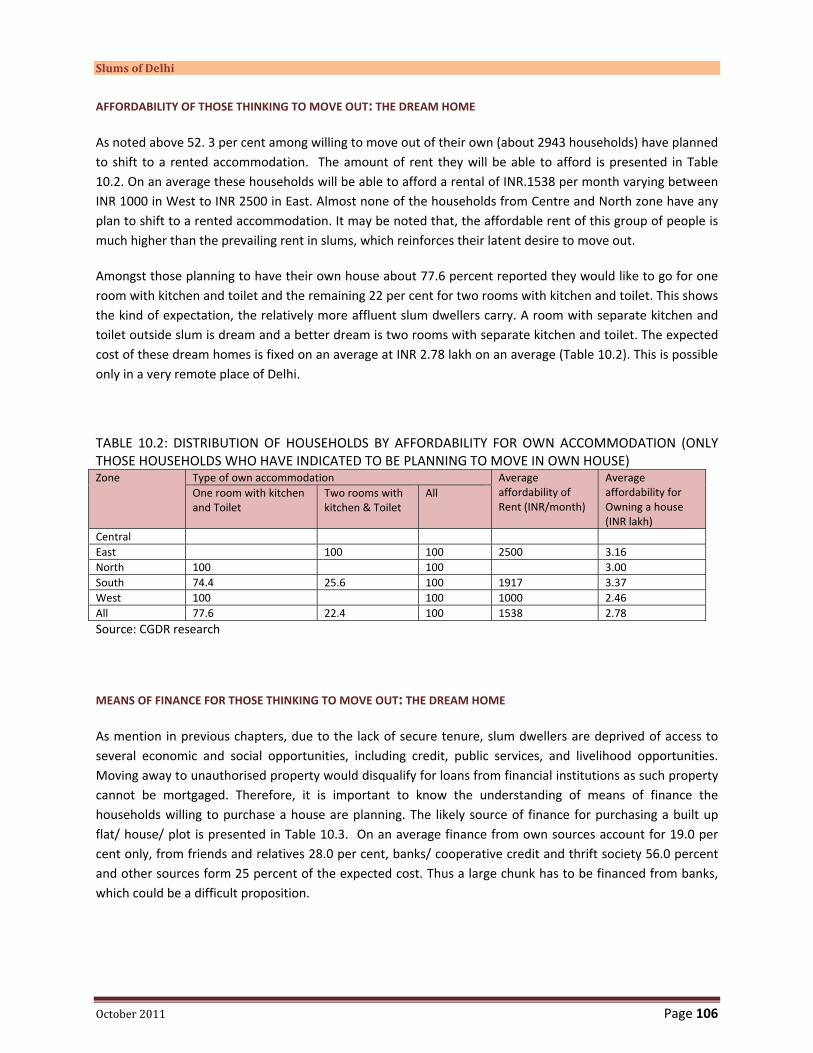
Slums of Delhi
October 2011 Page 106
AFFORDABILITY OF THOSE THINKING TO MOVE OUT: THE DREAM HOME
As noted above 52. 3 per cent among willing to move out of their own (about 2943 households) have planned to shift to a rented accommodation. The amount of rent they will be able to afford is presented in Table 10.2. On an average these households will be able to afford a rental of INR.1538 per month varying between INR 1000 in West to INR 2500 in East. Almost none of the households from Centre and North zone have any plan to shift to a rented accommodation. It may be noted that, the affordable rent of this group of people is much higher than the prevailing rent in slums, which reinforces their latent desire to move out.
Amongst those planning to have their own house about 77.6 percent reported they would like to go for one room with kitchen and toilet and the remaining 22 per cent for two rooms with kitchen and toilet. This shows the kind of expectation, the relatively more affluent slum dwellers carry. A room with separate kitchen and toilet outside slum is dream and a better dream is two rooms with separate kitchen and toilet. The expected cost of these dream homes is fixed on an average at INR 2.78 lakh on an average (Table 10.2). This is possible only in a very remote place of Delhi.
TABLE 10.2: DISTRIBUTION OF HOUSEHOLDS BY AFFORDABILITY FOR OWN ACCOMMODATION (ONLY THOSE HOUSEHOLDS WHO HAVE INDICATED TO BE PLANNING TO MOVE IN OWN HOUSE) Zone Type of own accommodation Average
affordability of Rent (INR/month)
Average affordability for Owning a house (INR lakh)
One room with kitchen and Toilet
Two rooms with kitchen & Toilet
All
Central East 100 100 2500 3.16 North 100 100 3.00 South 74.4 25.6 100 1917 3.37 West 100 100 1000 2.46 All 77.6 22.4 100 1538 2.78 Source: CGDR research
MEANS OF FINANCE FOR THOSE THINKING TO MOVE OUT: THE DREAM HOME
As mention in previous chapters, due to the lack of secure tenure, slum dwellers are deprived of access to several economic and social opportunities, including credit, public services, and livelihood opportunities. Moving away to unauthorised property would disqualify for loans from financial institutions as such property cannot be mortgaged. Therefore, it is important to know the understanding of means of finance the households willing to purchase a house are planning. The likely source of finance for purchasing a built up flat/ house/ plot is presented in Table 10.3. On an average finance from own sources account for 19.0 per cent only, from friends and relatives 28.0 per cent, banks/ cooperative credit and thrift society 56.0 percent and other sources form 25 percent of the expected cost. Thus a large chunk has to be financed from banks, which could be a difficult proposition.

WILLINGNESS TO MOVE AND WILLINGNESS TO PAY
This document is intellectual property of Centre for Global Development Research Private Limited, New Delhi prepared with the help of SER Grant extended by the Planning Commission of India. No part of the document can be copied without a written permission of CGDR.
Page 107
TABLE 10.3: DISTRIBUTION OF HOUSEHOLDS BY SOURCE OF POTENTIAL FINANCE FOR PURCHASING A HOUSE OUTSIDE SLUM Zone Percentage distribution by source
Own Sources Friends and relatives
Banks/ Cooperative credit and thrift society
Other Sources
All
Central East 13 40 60 100 North 30 70 100 South 20 28 33 27 100 West 20 20 66 23 100 All 19 28 56 25 100 Source: CGDR research
10.3 WILLINGNESS TO PAY AGAINST RESETTLEMENT
The discussion in previous sections indicates that even slum dwellers know it well that they do not have legitimate tenure of the land they are living. In addition, they are also very much uncomfortable with the prevalent uncertainties. Such an uncertainty has its own cost, which is reflected in temporary hutment with poor living condition. In order to come out of this uncertainty, the slum dwellers should be ready to pay either in terms of lump sum payment or monthly instalments for a given benefit which brings certainty in their living conditions.
An attempt has been made in this study to discover the capacity or the amount of money slum dwellers would be willing to part with if some scheme of resettlement is brought to them. It is not necessary that such willingly decided amount meets all the cost of the facility associated with the resettlement but it would go a long way in bringing market forces in the process of choice.
While exploring willingness to pay against resettlement, it has been observed that there is a perceptible difference in response of household heads and the community leaders. Therefore, both views are presented in respect of monthly instalment as well as lump sum payment. It is also noticed that the respondents do not make much difference in plot and flat of the similar size. It may be noted that the community leaders view is based interviews in all the 477 slum clusters while household view is based on sample households collected from 2024 households in 65 slum clusters.

Slums of Delhi
October 2011 Page 108
10.3.1 Average Affordability: the amount a Household would be willing to pay
The households and community leaders were asked separately as to how much amount slum dwellers could afford towards a resettlement scheme for a 25 yards plot of land or a built up 1 room Flat of 25 yards area. The average response is presented in Figures 10.5 and 10.6. Figure 10.5 represent the views of households and Figure 10.6 represents the views of community leaders on behalf of households.
10.3.1.1 AVERAGE VIEW OF HOUSEHOLDS
Considering the views of households the average monthly instalment per household per month is estimated at INR 681 while average affordability towards lump sum payment is stated to be INR 6160 (Figure 10.5).
Interestingly, willingness to pay for flat or plot is very close at the aggregate level, indicating that it is economic condition and affordability rather than type of asset which is driving the amount. The amount, households are ready to pay varies considerably across regions with lowest in central region and highest in eastern region.
FIGURE 10.5: AVERAGE AFFORDABILITY ACCORDING TO HOUSEHOLD
Source: CGDR research
10.3.1.2 AVERAGE VIEW OF COMMUNITY LEADERS
When opinion of community leaders are analysed the corresponding amount that people in general can pay is much higher and at variance across regions (Figure 10.6). At aggregate level, the average amount of instalment for a plot the slum households can pay is reported at INR 770 per month. This varies across Zones from the lowest in West Zone at INR 637 to the highest in the central zone at INR 1063. Similarly, the average amount a slum household could pay for the plot or flat or plot provided under the resettlement
Central East North South West All
25 Yards Plot _Down payment 4044 6702 5996 6706 5581 6181
25 Yards Flat _Down payment 2506 7432 4670 6678 6382 6160
25 Yards Plot/ Flat _Monthly Payment 854 814 649 630 619 681

WILLINGNESS TO MOVE AND WILLINGNESS TO PAY
This document is intellectual property of Centre for Global Development Research Private Limited, New Delhi prepared with the help of SER Grant extended by the Planning Commission of India. No part of the document can be copied without a written permission of CGDR.
Page 109
scheme reported at INR 9262, which varies across regions from INR 7181 in West zone to INR 14 328 in central zone.
Clearly, there is variation in the perception of community leaders and the actual amount declared by the households and community leaders have systematically overestimated the willingness to pay for the community. The variation in views of community leaders and households is too much in central and northern regions zones. Given the high percentage of pucca houses in central region, the community leaders appear to have rightly guessed a higher capacity to pay. However, if one looks at the absolute values of amounts it does not look high by any means and they are reasonably very much on lower side.
FIGURE 10.6: AVERAGE AFFORDABILITY ACCORDING TO COMMUNITY LEADERS
Source: CGDR research
10.3.2 Distribution of the Amounts the Households would be willing to pay
Distribution of amounts the amounts the households would be willing to pay as reported by the community leaders and the households can throw more light on the possibilities of acceptable settlement schemes. Tables 10.4 to 10.7 present the results as discussed below.
10.3.2.1 VIEWS OF THE HOUSEHOLD HEADS ON MONTHLY INSTALMENTS
About 67.6 per cent households report that they can pay below INR 500 per month with average for this group as INR 419 (Table 10.4). Another 27.25 per cent people could pay between INR 501 and INR 1000 with
Central East North South West All
Monthly payment for flat/plot 1063 766 768 773 637 770
Average down payment 14328 9110 8699 9414 7181 9262

Slums of Delhi
October 2011 Page 110
average value of INR 910. Thus, about 95 per cent households report a monthly capacity of below INR 1000 with average value of INR 610. About 4.1 per cent households can afford to pay between INR 1001 and INR 2000 with an average of INR 1591. There is small minority of people who could pay even more. Possibly, this is the latter groups who would be even willing to move out of their own. The important message is that there is difference in capacities and people would like to make choices if available.
TABLE 10.4: DISTRIBUTION OF HOUSEHOLDS BY MONTHLY INSTALMENT A HOUSEHOLD ON AN AVERAGE CAN PAY (VIEWS OF HOUSEHOLDS) Distribution of affordability with respect to monthly installments Affordability (INR) Central East North South West All Installment (INR)Range Average 1‐500 419 67.92 59.00 71.58 68.89 69.75 67.59 501‐1000 910 24.92 35.40 24.22 25.68 25.52 27.25 1001‐1500 1404 3.37 1.03 2.71 3.19 3.82 2.84 1501‐2000 2000 1.45 2.17 1.00 1.74 0.20 1.30 2001‐2500 2500 0.00 0.23 0.00 0.00 0.00 0.04 2501‐3000 3000 0.00 0.00 0.00 0.15 0.18 0.09 3501‐4000 4000 0.00 0.23 0.00 0.00 0.18 0.09 4501‐5000 5000 1.52 0.69 0.25 0.07 0.35 0.38 5501‐6000 6000 0.00 0.23 0.00 0.00 0.00 0.04 6501‐7000 7000 0.00 0.29 0.00 0.14 0.00 0.10 9501‐10000 10000 0.00 0.51 0.00 0.14 0.00 0.15 14501‐15000 15000 0.00 0.23 0.00 0.00 0.00 0.04 19501‐20000 20000 0.81 0.00 0.25 0.00 0.00 0.09 All 681 100 100 100 100 100 100 Source: CGDR research
10.3.2.2 VIEWS OF THE HOUSEHOLD HEADS ON AFFORDABLE ONE‐TIME PAYMENT TOWARDS RESETTLEMENT
Distribution of households reporting amount a household can afford to pay as one‐time payment on an average towards resettlement scheme is presented in Table 10.5. About 67.1 per cent households report that they can pay below INR 5000 with average for this group as INR 3574 (Table 10.5). Another 30.03 per cent people could pay between INR 5001 and INR 10000 with average value of INR 9840. Thus, about 97 per cent households report a monthly capacity of below INR 10000 with average value of INR 5519. However, there is small minority, who could afford anything up to INR 100000. A similar pattern of affordability is reported for plots also.

WILLINGNESS TO MOVE AND WILLINGNESS TO PAY
This document is intellectual property of Centre for Global Development Research Private Limited, New Delhi prepared with the help of SER Grant extended by the Planning Commission of India. No part of the document can be copied without a written permission of CGDR.
Page 111
TABLE 10.5: DISTRIBUTION OF AFFORDABILITY WITH RESPECT TO DOWN PAYMENT FOR 25 YARDS FLAT (VIEWS OF HOUSEHOLDS) Distribution of affordability with respect to down payment for 25 yards Flat Affordability (INR) Central East North South West All Down payment (INR) Average 1‐5000 3574 97.31 65.72 84.85 60.32 63.64 66.71 5001‐10000 9840 0.00 23.31 13.63 36.28 34.04 30.03 10001‐15000 14627 0.00 5.77 1.52 2.58 0.47 1.77 15001‐20000 20000 0.00 2.75 0.00 0.00 0.00 0.18 20001‐25000 25000 2.69 2.45 0.00 0.38 0.00 0.48 25001‐30000 28000 0.00 0.00 0.00 0.00 0.43 0.15 35001‐40000 40000 0.00 0.00 0.00 0.00 0.94 0.33 45001‐50000 50000 0.00 0.00 0.00 0.00 0.47 0.17 95001‐100000 100000 0.00 0.00 0.00 0.44 0.00 0.18 Grand Total 6160 100 100 100 100 100 100 Source: CGDR research
10.3.2.3 VIEWS OF COMMUNITY HEADS ON MONTHLY INSTALMENT
As noted earlier the community leaders tend to report a higher affordability towards resettlement. However, there are about one percent of them who feel that slum dwellers would not pay anything for resettlement and all the cost must be borne by the government. This group is neither prepared for instalments nor one‐time payment (Table 10.6 and 10.7). In fact, the percentage rises to 2.94 when question comes to one time resettlement contribution.
Distribution of community leaders reporting amount a household can afford to pay as monthly instalment on an average towards resettlement scheme is presented in Table 10.6. About 49.27 per cent slums report the households can pay below INR 500 with average for this group as INR 426. Another 42.77 per cent slums report that household could pay between INR 501 and INR 1000 with average value of INR 913. Thus, about 92 per cent slums report a monthly capacity of below INR 1000 with average value of INR 652.3 which is now closure to the value reported by households. About 4.6 per cent slums report affordability in the range of INR 1001 and INR 1500. A minority of slums leaders, nearly 2.5 per cent reported INR 1501 to INR 7000 per month.

Slums of Delhi
October 2011 Page 112
TABLE 10.6: DISTRIBUTION OF SLUMS REPORTING THE AFFORDABILITY OF PEOPLE LIVING SLUM TOWARDS MONTHLY INSTALMENT FOR A PLOT OF LAND / FLAT (INR) Monthly Installment (INR)
Average Central East North South West All
0 0 0.00 2.30 0.00 0.00 1.50 0.84 1‐500 426 19.67 55.17 39.71 40.63 72.18 49.27 501‐1000 913 60.66 33.33 57.35 53.91 22.56 42.77 1001‐1500 1475 18.03 4.60 1.47 4.69 0.00 4.61 1501‐2000 2000 0.00 1.15 0.00 0.00 1.50 0.63 2001‐2500 2500 0.00 1.15 0.00 0.00 0.00 0.21 2501‐3000 3000 0.00 0.00 0.00 0.00 0.75 0.21 4501‐5000 5000 0.00 2.30 1.47 0.78 1.50 1.26 6501‐7000 7000 1.64 0.00 0.00 0.00 0.00 0.21 All 770 100.00 100.00 100.00 100.00 100.00 100.00 Source: CGDR research
10.3.2.4 VIEWS OF COMMUNITY HEADS ON AFFORDABLE ONE‐TIME PAYMENT TOWARDS RESETTLEMENT
To the question on one‐time resettlement fee, 2.94 slums have refused to pay any amount. About 34.17 per cent slums report that the households could pay below INR 5000 with a group average of INR 3755 (Table 10.7). Another 40.67 per cent slums reported that households could pay between INR 5001 and INR 10000 with average value of INR 9259. Thus, about 75 per cent slums reported that households have capacity below INR 10000 with average value of INR 6746. Another 13.21 per cent slums report a capacity to pay between INR 10001 and INR 15000 with average value of INR 13937. Thus the average capacity of about 88 per cent slums is reported as INR 7825, which compares reasonably with the average of majority reported by the households. Again, there is small minority, who could afford anything up to INR 500000, which is less than the highest value reported by individual household in sample.
TABLE 10.7: DISTRIBUTION OF SLUMS REPORTING THE AFFORDABILITY PER FAMILY TOWARDS RESETTLEMENT SCHEME IF LAUNCHED BY THE GOVERNMENT (INR)_VIEWS OF COMMUNITY LEADERS Affordability (INR) Average Central East North South West Grand Total 0 0 0.00 2.30 0.00 0.78 8.27 2.94 1‐5000 3755 16.39 28.74 25.00 25.78 58.65 34.17 5001‐10000 9259 42.62 37.93 60.29 50.78 21.80 40.67 10001‐15000 13937 9.84 22.99 14.71 17.97 3.01 13.21 15001‐20000 19652 18.03 5.75 0.00 3.91 1.50 4.82 20001‐25000 25000 4.92 1.15 0.00 0.00 2.26 1.47 25001‐30000 30000 3.28 0.00 0.00 0.00 3.01 1.26 35001‐40000 40000 1.64 1.15 0.00 0.00 0.00 0.42 40001‐45000 45000 0.00 0.00 0.00 0.78 0.00 0.21 45001‐50000 50000 3.28 0.00 0.00 0.00 1.50 0.84 All 9262 100.00 100.00 100.00 100.00 100.00 100.00 Source: CGDR research

WILLINGNESS TO MOVE AND WILLINGNESS TO PAY
This document is intellectual property of Centre for Global Development Research Private Limited, New Delhi prepared with the help of SER Grant extended by the Planning Commission of India. No part of the document can be copied without a written permission of CGDR.
Page 113
10.4 CONCLUSIONS AND REMARKS
Survey results clearly show that slum dwellers are not interested in going back to their native places. They wish to continue in Delhi benefit from the fruits of future development of Delhi. At the same time they could understand that government will not allow the slums to exist for long. However, only 11.6 per cent have some thought of purchasing a house and a minority 1.3 per cent are planning to move out of slum. On the issue of resettlement by government, majority of slum dwellers are not willing to move to a far off place from the present location in the fear of losing their source of livelihood, children’s education, and access to basic amenities. However, there is substantial portion that are not worries about distance as nature of their work is such. This diversity in thought opens up more avenues for settlement planning. It is also important information for the authority in power to know the extent of affordability of the slum dwellers towards to note that majority of slum dwellers are willing to make contribution towards resettlement plan and such contribution has wide variations. Such variation provides additional tool to differentiate between the type and location of the resettlement according to the difference in willingness to pay.

Slums of Delhi
October 2011 Page 114
Chapter 11
Government Plans for Slums The government of India is very much aware of the fact that more than 23 per cent of the urban population resides in slum (Census: 2001), and a much higher proportion of the urban population of metropolitan cities lives in slums. It is estimated that 55 per cent of the population of Mumbai lives in slums. Compared to Mumbai, the share of population living in slum is better in the case of Delhi. Nevertheless, given the general state of slum life as discussed in previous it is critically important that one or the other strategy be adapted to up‐grade the living condition of slum dwellers. The strategies could be anything from in‐situ development to rehabilitation. The successive governments have appreciated the economic contribution of slum dwellers and the needs for improving their living conditions through legislations and plan allocations. However, the kind of thrust which is required to completely solve the problem as it is done in some of the developed countries is missing.
11.1 PLANNING PROCESS FOR DELHI AND SLUM DEVELOPMENT
Development of slums is an integral part of the planning process for urban areas. The planning of Delhi is marked by a series of Master Plans and provisioning in five year plans. The municipal corporations, the Delhi government and the Central governments have been contributing to the development of Delhi in their own ways and under different schemes. However, an integrated and systematic approach has eluded the due makeover of the Capital City. However, some events such as ASIAD 1982, Supreme Courts instructions to convert Diesel Vehicles into compressed Natural Gas (CNG) vehicles, the Common Wealth Games 2010 and introduction of Metro Rail for transport have contributed to development of Delhi more than the regular planning process. In addition development of NCR cities have provided much needed relieve to Delhi the proper city.
11.1.1 Master Plans for Delhi: Journey from MPD62 to MPD2021
The foundation of converting Delhi into a modern city was first laid down in ‘Delhi Development Act 1957’, which paved the way for formation of Delhi Development Authority (DDA). DDA was entrusted with the work of preparing a master plan for Delhi based on well documented civic survey and transparent procedure of collective effort in planning and execution.
The first Master Plan was promulgated in 1962 known as MPD‐62, which focused on micro and macro level development including housing and infrastructure during next 20 years. It ended in 1981 and since then the city has grown by leaps and bounces in population and demand on already deficit infrastructure. During this period requirements of people changed and huge influx of migrants from all over the country crowded the

WILLINGNESS TO PAY
This document is intellectual property of Centre for Global Development Research Private Limited, New Delhi prepared with the help of SER Grant extended by the Planning Commission of India. No part of the document can be copied without a written permission of CGDR.
Page 115
space in a most disorderly ways. The corrupt machinery which was responsible for law and order and protection of public property and safety of people colluded with interest groups to make the situation worse. Whether MPD‐62 was a success or failure is a matter of detailed analysis, but by 1990 it was amply clear that a new Master Plan for Delhi was essential, which led to promulgation of Master Plan for Delhi 2001 (MPD‐2001) in July/August 1990. MPD‐2001 had emphasis on high density low rise buildings which was in sharp contrast to the developments elsewhere in the World. It may be noted that during the same period cities in the region like Shanghai, Beijing, Singapore, Kuala Lumpur etc. were being planned with the idea of saving horizontal space and occupying the vertical space so that city could look less dense on the ground so that enough space was preserved for infrastructure. Other areas of emphasis included rehabilitation of slum dwellers, mass transport, city centres, protected central city area, integration with surrounding areas, and hierarchical urban development.
At the end of 2001, the MPD‐2001 claims to have achieved variety of housing types, new residential complexes such as Narela, Rohini, and Dwarka; shelter facilities to over 10 lakh families; re‐settlement of about 2.8 lakh slum dwellers, planning of 21 districts centers, development of about 2600 ha industrial area; planning of MRTS network planned, development of about 5000 ha area under greens; land fill sites converted into large greens such as Indraprastha Park; and development of 14 sports centers developed for
variety of sports activities (DDA website1).
However, at the end of 2001, Delhi became even worse in terms of congestion in residential areas, markets, roads, and transport terminals; pollution everywhere; environmental problems of garbage handling or water supply; and electricity. The slum population increased further and shelters became inadequate. The MPD‐2001 which was a handiwork of close door official of DDA proved to be superficial exercise in planning infrastructure and land use. Its forecast for 2001 population was far short at 12.80 million as against 13.78 million. It is important to note that during this period and beyond major cities of the National Capital Region (NCR) area, namely Gurgaon, Faridabad, Ghaziabad and Noida have absorbed a major part of the growth impulse emanating from Delhi. This however increased the floating population of Delhi beyond the imagination of planners of MPD‐2001. However, thanks to proactive judiciary that some of the problems like air pollution could improve significantly despite MPD‐2001.
1 http://dda.org.in/planning/mpd_2001_achievements.htm (07‐04‐2011)

Slums of Delhi
October 2011 Page 116
By the end of jurisdiction period of MPD‐2001, the city moved further and its problems got multiplied indicating short term vision in planning process and stubborn rigidities towards creating extra capacities and spacious designs, the hallmarks of modern cities. The objective of making “Delhi a global metropolis and a world‐class city” is now envisaged in Master Plan‐ Delhi 2021 (MPD‐2021). Benefiting from the earlier experiences of planning, a Vision‐2021 is prepared and a wide ranging open discussion and involvement of think tanks, general public, local bodies, NGOs and reports became the basis of planning for Delhi yet again. The core issues remain broadly the same; accommodating a larger population, strengthening of infrastructure, creation of more open spaces, and redevelopment of congested areas. The challenges of the phenomenon growth of unauthorized colonies and JJ clusters have been taken into consideration as stark realities and something that needs to be taken head on. The growth of vehicle traffic is one of the chronic problems and cannot be ignored anymore as it gives rise to other problems such as congestion, pollution, parking, road accidents and crime.
MAJOR HIGHLIGHTS OF DELHI MASTER PLAN – 2021
The Central Government notified the Delhi Master Plan for 2021 on 7th February 2007, in exercise of powers under the Delhi Development Act, 1957. The notification of the MPD‐2021 marked the culmination of a detailed and extensive exercise carried out over three years and it aims to meet the challenges of fast evolving changes in the urban life style in the National Capital Region of Delhi. The MPD‐2021 is based on a projected addition of 4.8 million populations during 2011 and 2021 and use market mechanisms to development with priority on (1) public ‐ private partnerships; (2) Incentivizing re‐development and modernizing of the old buildings and localities, unauthorized colonies, and JJ Clusters; (3) Re‐structuring the physical infrastructure of the city;
The MPD‐2011 has specific program on housing for poor including in‐situ slum rehabilitation, including using land as a resource for private sector participation; in order to prevent growth of slums, mandatory provision of EWS housing / slum rehabilitation in all groups housing to the extent of 15 per cent of permissible FAR or 35 per cent of dwelling units on the plot, whichever is higher; housing for urban poor to the extent of 50‐55 per cent of total; re‐categorization of housing types, development control norms and differential densities to make EWS /LIG housing viable and economical.
With respect to shelter, MPD‐2011 has emphasized shift from plotted housing to group housing for optimal utilization of land; private sector participation for development / redevelopment of housing; removing unnecessary controls (like height) for optimum utilization of land and to facilitate creation of 'signature' projects; and enhancement of ground coverage, FAR and height for all categories of residential plots.
Under redevelopment program, the MPD‐2011 has proposed to incentivise redevelopment with additional FAR has been envisaged as a major element of city development covering all the areas; (i) Planned Areas: Influence Zone along MRTS and Major Transport Corridor; underutilised / low‐density areas; Special Area; shopping / commercial centres; Industrial areas / clusters and resettlement colonies; and (ii) Unplanned Areas: Villages; unauthorised colonies and JJ Clusters.

WILLINGNESS TO PAY
This document is intellectual property of Centre for Global Development Research Private Limited, New Delhi prepared with the help of SER Grant extended by the Planning Commission of India. No part of the document can be copied without a written permission of CGDR.
Page 117
11.2 NATIONAL HOUSING & HABITAT POLICY2007
The MPD‐2011 appears to be an off‐shoot of the National Housing and Habitat Policy ‐2007 (NHHP‐2007) in content and spirit, which shows some kind of synergy in development program at the state and central level. The National Housing & Habitat Policy‐2007 is a flagship program of the Ministry of Housing & Urban Poverty Alleviation with focus on inter‐alia the following:
The Policy gives primacy to provision of shelter to the urban poor at their present location or near their work place and efforts will be made to ensure that rights provided are non‐transferable for a period of 10‐15 years. Only in cases, where relocation is necessary on account of severe water pollution, safety problems on account of proximity to rail track or other critical concerns relocation of slum dwellers will be undertaken. In such cases, special efforts will be made to ensure fast and reliable transportation to work sites.
It also aims at promoting in‐situ up‐gradation slum with partnership between the Central Government, State Government, Urban Local Bodies, Banks/MFIs and Potential beneficiaries. The State Government would (in consultation with Urban Local Bodies) prepare the State Urban Housing & Habitat Policy (SUHHP); act as a facilitator and enabler in collaboration with ULBs/Private Sector/Co‐operative Sector/NGOs with regard to Integrated Slum Development Projects, Prepare and update Master Plans along with Zone Plans, Metropolitan Plans, District Plans and the State level Regional Plan by respective agencies with provision of adequate land for urban poor.
Promote well designed Public‐Private Partnerships for undertaking housing and infrastructure projects. Encourage Cooperative Group Housing Societies, Employees Organizations, labour housing promotion organization, Non‐Government Organizations, (NGO) and Community Based Organizations (CBO) to have Partnerships with Urban Local Bodies in relation to housing related microfinance and housing development.
Income generating activities in slums, which are non‐polluting, will be encouraged on a mixed land use basis. Efforts will be made to structure such activities as an integral part of housing and habitat projects.
11.3 GOVERNMENT SCHEMES COVERING SLUM REHABILITATION
There are a number of overlapping programs being implemented by the governments at different levels. Some of these programs are such that they envelop slum development in to the broad objectives of the program, while other are exclusively meant for slum development itself. A brief over‐view of such programs are discussed below.

Slums of Delhi
October 2011 Page 118
11.3.1 Delhi Government Action for Slum Development: Bhagidari with Slum Dwellers
Sanjha Prayas under Bhagidari is a partnership of the Chief Minister and slum dwellers in Delhi launched in March 2007. Government has appointed CURE as consultant to the Bhagidari‐Sanjha Prayas initiative. Community mobilization has been started in 19 slum areas in Patparganj, Seemapuri and Shahadra constituencies and 11 blocks of Savda Ghevra, a new resettlement being developed in Delhi to relocate and house slum dwellers.
Initiatives under Sanjha Prayas include a Safai Abhiyaan (cleanliness drive in all slum areas in partnership with MCD and DJB), Jal Mission (repair and maintenance of water supply infrastructure and improvement of water supply to all areas with DJB), Social welfare camps in Savda Ghevra (improving access to welfare schemes including transferring of pension holders from old to new areas with Welfare Department), Power camps (access to metered connections and resolving billing issues with NDPL and BSES) and Access to Livelihoods Programs (employment skills, employment and micro enterprise) through SC/ST Corporation and private sector partnerships.
11.3.2 Jawaharlal Nehru Urban Renewal Mission (JNURM)
JNURM launched in 2005 is a seven year program being implemented by Ministry of Housing & Urban Poverty Alleviation and it comprises of 4 components:
1. UIG: Urban Infrastructure & Governance: Applicable to 65 cities of national importance
2. UIDSSMT: Urban Infrastructure Development Scheme for Small & Medium Towns: Applicable to other cities & Towns
3. BSUP: Basic Services to the Poor: Applicable to 65 cities of national importance
4. IHSDP: Integrated Housing & Slum Development Programme: Applicable to other cities & Towns
Huge resources have been allocated towards these programs (Table 11.1) and there seems to be physical progress also as indicated by some of the evaluation studies and more such studies are needed.
TABLE 11.1 JNNURM CUMULATIVE PHYSICAL PROGRESSES (AS ON FEBRUARY 2010) Description BSUP IHSDP Total UIG UIDSSMT Total Number of projects approved 479 862 527 764 1291 Number of states and union territories covered
31 31 31 35 66
Number of cities and towns covered
63 761 65 636 701
Number of dwelling units approved
1036819 469575
Source: JNNURM website, visited 07‐04‐2011
WILLINGNESS TO PAY
This document is intellectual property of Centre for Global Development Research Private Limited, New Delhi prepared with the help of SER Grant extended by the Planning Commission of India. No part of the document can be copied without a written permission of CGDR.
Page 119
Since UIG & UIDSSMT focus on development of city‐wide infrastructure and BSUP and IHSDP focus on housing and basic amenities to the urban poor, especially slum‐dwellers, the latter two acquire more relevance for the present study. Moreover, since Delhi is covered by the BSUP scheme, the details for the same are furnished below.
The mission of BSUP includes preparation of perspective plan for a period of 20‐25 years (with 5 yearly updates) indicating policies, programmes and strategies of meeting fund requirements. The perspective plan is followed by preparation of development plans integrating land use with services, urban transport and environment management for every five year plan period. In this context, a city development plan (CDP) would be required before the city can access Mission Funds. In addition, cities will be required to prepare Detailed Project Reports for undertaking projects under identified areas and involve private sector participation in development, management and financing of Urban Infrastructure, which would be clearly delineated. The financing pattern is marked by equal participation of centre and state.
The objectives of BSUP include basic services to Urban Poor including security of tenure at affordable prices, improved housing, water supply, sanitation and ensuring delivery through convergence of other already existing universal services of the Government for education, health and social security. It is also emphasised that urban poor are provided housing near their place of occupation. The basic services for the urban poor seeks to provide seven entitlements/services – security of tenure, affordable housing, water, sanitation, health, education and social security – in low income settlements in the 63 Mission Cities. The progress in BSUP made so far is presented in Table 11.2. Clearly, Delhi is far behind the efforts made by some of the other states. Out of 26 projects submitted by Delhi only 17 got approved with project value of 2783.78 crore and number of dwelling units approved is just about 73820, which is much less than other states such as Gujarat, and Karnataka where share of slum population is lower than Delhi.
11.3.3 Rajiv Awas Yojana (RAY)
RAY came into existence on June 4, 2009 under the jurisdiction of Ministry of Housing & Urban Poverty Alleviation. This is again a Government of India scheme for slum dwellers and the urban poor , with a vision of creating a ‘Slum Free India’ for slum redevelopment and construction of affordable housing conditioned by a set of necessary reforms by giving central support to states willing to assign property rights to slum dwellers to progress beyond JNNURM. The Ministry of Housing and Urban Poverty Alleviation (MoHUPA) has prepared Guidelines to assist the preparatory activities under RAY and this has been circulated to all States and union territories. RAY calls for a multi‐pronged approach focusing on bringing existing slums within the formal system and enabling them to avail the same level of basic amenities as the rest of the town/city; and redressing the failures of the formal system that lead to the creation of slum. As noted above, this scheme
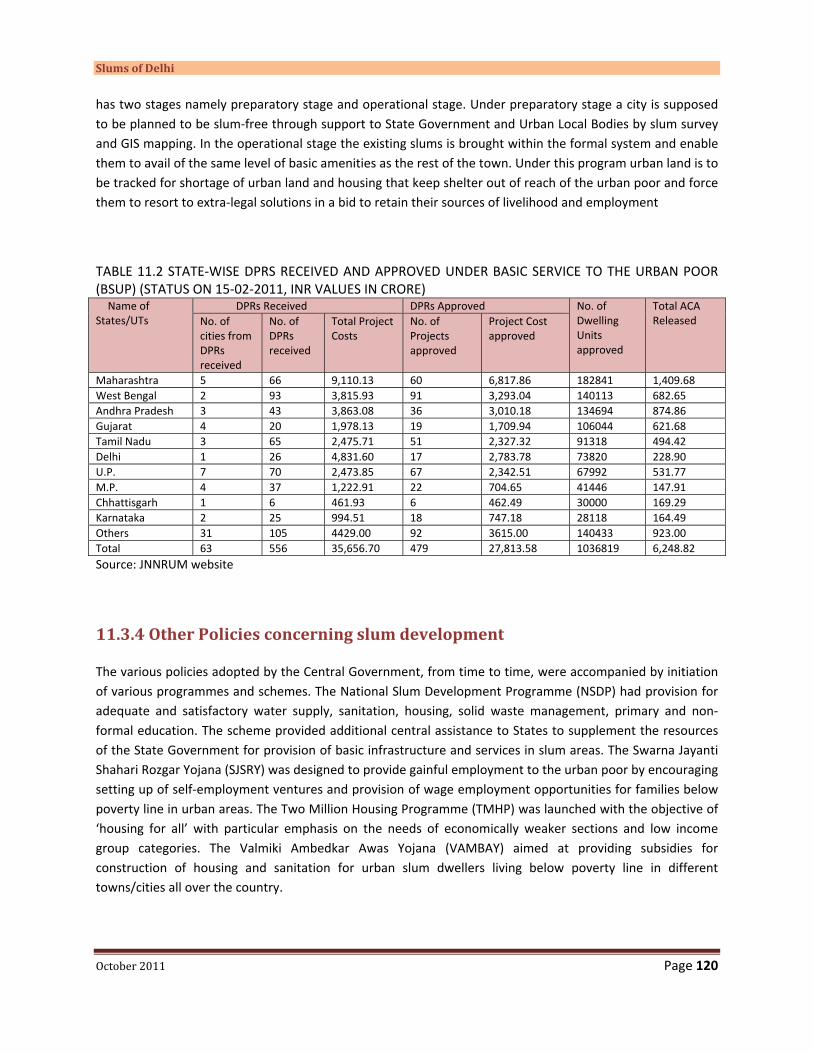
Slums of Delhi
October 2011 Page 120
has two stages namely preparatory stage and operational stage. Under preparatory stage a city is supposed to be planned to be slum‐free through support to State Government and Urban Local Bodies by slum survey and GIS mapping. In the operational stage the existing slums is brought within the formal system and enable them to avail of the same level of basic amenities as the rest of the town. Under this program urban land is to be tracked for shortage of urban land and housing that keep shelter out of reach of the urban poor and force them to resort to extra‐legal solutions in a bid to retain their sources of livelihood and employment
TABLE 11.2 STATE‐WISE DPRS RECEIVED AND APPROVED UNDER BASIC SERVICE TO THE URBAN POOR (BSUP) (STATUS ON 15‐02‐2011, INR VALUES IN CRORE) Name of
States/UTs DPRs Received DPRs Approved No. of
Dwelling Units approved
Total ACA Released No. of
cities from DPRs received
No. of DPRs received
Total Project Costs
No. of Projects approved
Project Cost approved
Maharashtra 5 66 9,110.13 60 6,817.86 182841 1,409.68 West Bengal 2 93 3,815.93 91 3,293.04 140113 682.65 Andhra Pradesh 3 43 3,863.08 36 3,010.18 134694 874.86 Gujarat 4 20 1,978.13 19 1,709.94 106044 621.68 Tamil Nadu 3 65 2,475.71 51 2,327.32 91318 494.42 Delhi 1 26 4,831.60 17 2,783.78 73820 228.90 U.P. 7 70 2,473.85 67 2,342.51 67992 531.77 M.P. 4 37 1,222.91 22 704.65 41446 147.91 Chhattisgarh 1 6 461.93 6 462.49 30000 169.29 Karnataka 2 25 994.51 18 747.18 28118 164.49 Others 31 105 4429.00 92 3615.00 140433 923.00 Total 63 556 35,656.70 479 27,813.58 1036819 6,248.82 Source: JNNRUM website
11.3.4 Other Policies concerning slum development
The various policies adopted by the Central Government, from time to time, were accompanied by initiation of various programmes and schemes. The National Slum Development Programme (NSDP) had provision for adequate and satisfactory water supply, sanitation, housing, solid waste management, primary and non‐formal education. The scheme provided additional central assistance to States to supplement the resources of the State Government for provision of basic infrastructure and services in slum areas. The Swarna Jayanti Shahari Rozgar Yojana (SJSRY) was designed to provide gainful employment to the urban poor by encouraging setting up of self‐employment ventures and provision of wage employment opportunities for families below poverty line in urban areas. The Two Million Housing Programme (TMHP) was launched with the objective of ‘housing for all’ with particular emphasis on the needs of economically weaker sections and low income group categories. The Valmiki Ambedkar Awas Yojana (VAMBAY) aimed at providing subsidies for construction of housing and sanitation for urban slum dwellers living below poverty line in different towns/cities all over the country.

WILLINGNESS TO PAY
This document is intellectual property of Centre for Global Development Research Private Limited, New Delhi prepared with the help of SER Grant extended by the Planning Commission of India. No part of the document can be copied without a written permission of CGDR.
Page 121
According to National Housing Policy 2007 document, the above mentioned policies and programmes have yielded fairly positive results in the area of housing and habitat. ‘Some increase has been noticed in the supply of serviced land, shelter and related infrastructure. For example, in the first four years of the 10th Plan period, financial assistance was provided for construction of 442369 dwelling units under VAMBAY scheme. Similarly, total number of beneficiaries under NSDP and SJSRY were 45.87 million and 31.77 million respectively during the same period. The period 1991 to 2001 witnessed a net addition of 19.52 million dwelling units in the urban housing stock (Census: 2001) involving average annual construction of 1.95 million houses. The share of ownership housing in urban areas has increased from 63% in 1991 to 67% in 2001 (Census: 2001). It is important to note that households having one room accommodation declined significantly in urban areas from 39.55 per cent to 35.1 per cent during the period 1991 to 2001. This is a result of upward mobility in accommodation indicating a robust economy and accelerated supply of improved housing stock’ (National Housing Policy 2007).
11.4 CONCLUDING REMARKS
There is evidence of considerable intervention from government but level of problem is too enormous and accordingly the efforts look to be spread in bits and pieces. A concerted effort of very large extent is required to solve the problem of migrant population. The current level of effort is not proving to be effective in eliminating slum and provide affordable housing to the migrant labour force from underdeveloped states to the metropolitan cities and much more is needed to be done.

Slums of Delhi
October 2011 Page 122
Chapter 12
Global Case Studies of Slum Rehabilitation There have been many affordable and sustainable approaches being followed across both developed and developing countries for the provision of public‐sector housing and basic amenities for the slum‐dwellers. They range from relocating the slum residents to new places of shelter, to interventions aimed at protecting the rights of slum dwellers and helping them to improve their incomes and living conditions. Comparative analysis of policy approaches to slums shows that, currently, cities are still practising many of those approaches that were in use decades ago such as the use of summary eviction and slum clearance practiced in 19th‐century. Many a times it becomes difficult for developing countries to configure public delivery systems effectively due to factors such as corruption, political interference, inefficiency, inflexibility, unfair allocation and extensive delays. Despite several well‐publicized success stories, such as Singapore, housing provision by government or even non‐governmental organization (NGO) is not common in the developing world. Since mid 1970’s the most dominant paradigm for housing provision remains aided self‐help for the economically poor sections of the society. Solutions that attempt to make use of the labour and resources of slum dwellers, and which seek to preserve and involve communities, have become some of the preferred solutions to slum improvement. However, so far, this has mostly been adopted on a limited scale or at the level of demonstration‐projects. Government largely adopts a facilitative role in getting things moving, while maintaining financial accountability and adherence to quality norms. It is now a good practice to involve the communities from the outset, often through a formalized process, and to require a contribution from the occupants, which gives them both commitment and rewards. The more sustainable efforts appear to be those that are an integral part of city development strategy (UN‐Habitat 2003).
The growth of slums in major cities is characteristic of rapid urbanization. Because rapid population growth cannot be satisfactorily accommodated, slums and shantytowns grow bigger and more visible. This requires strategies to reduce slums on a continuous basis, which could be done as resettlement or redevelopment process. A brief discussion of this issue is done in Section 12.1. In Sections 12.3 to 12..7 five slum upgrading and rehabilitation projects are discussed as case studies – one from India and four from other developing countries, which have either been successfully implemented or in the process of implementation. Each example has been presented so that the type of strategy being followed by the concerned bodies and stakeholders could be highlighted.
12.1 SLUM REDUCTION IN DEVELOPING COUNTRIES
Between the years 2000 and 2010, over 200 million people in the developing world were estimated to have been lifted out of slum conditions (UN‐HABITAT 2008). In other words, governments have collectively exceeded the Millennium Development Goals (MDG) target. However, this achievement is not uniformly
WILLINGNESS TO PAY
This document is intellectual property of Centre for Global Development Research Private Limited, New Delhi prepared with the help of SER Grant extended by the Planning Commission of India. No part of the document can be copied without a written permission of CGDR.
Page 123
distributed across regions. China and India have improved the lives of more slum dwellers than any other countries, having together lifted no less than 125 million people out of slum conditions in the same period. After China and India, the most significant improvements in slum conditions in Asia were recorded in Indonesia, Turkey and Viet Nam. Such success is highly skewed towards the more advanced emerging economies, while poorer countries have not done as well. Over the past 10 years, the proportion of the urban population living in slums in the developing world has declined from 39 per cent in the year 2000 to an estimated 32 per cent in 2010. And yet the urban divide endures, because in absolute terms the numbers of slum dwellers have actually grown considerably, and will continue to rise in the near future. For this reason, there is no room for rejoice. The Millennium “slum target” has been achieved, improving the lives of 227 million people, but only because it was set too low at the outset; 100 million was only 10 per cent of the global slum population, because in the course of the same years the number of slum dwellers increased by six million every year. Based on these trends it is expected that the world’s slum population will continue to grow if no corrective action is taken in the coming years. UN‐HABITAT estimates that the world’s slum population is expected to reach 889 million by 2020. Improving the lives of slum dwellers is the best way to achieve all the MDG targets. Improving housing conditions and providing for water and sanitation will not only save lives among the very poor, but will also support progress in education and health.
12.1.1 Slums Redevelopment or Resettlement?
Broadly, there are two options for policies and interventions regarding slums: (a) resettlement, and (b) redevelopment. Of course, both approaches must work alongside policies that attempt to deal with the root causes of poverty. At the first glance, the logic behind resettlement appears sound. Slum‐dwellers are moved into a higher standard of accommodation while the valuable inner‐city land they had previously occupied becomes available for other purposes. However, a more detailed analysis reveals problems associated with this policy. The major difficulties involved in slum clearance and subsequent resettlement of evicted slum‐dwellers, including the destruction of existing housing stock, the risk of damaging communities and livelihoods, the use of forced evictions and the problems of house ‘poaching’ by the non‐poor or reselling by the poor, make this policy inferior at times to that of upgrading. However, in certain circumstances slum clearance is necessary, for the good of the slum‐dwellers themselves or for the wider city community. Where slums are situated in places which are not fit or safe for human habitation, resettlement is seemingly the best policy.
On the other hand, the process of upgrading must work towards providing a sense of security for slum‐dwellers. Such policies must be tailored to a particular community’s priorities. Also, for shared ownership of any improvements, it is crucial that communities participate in the upgrading process and that any outside agencies involved acknowledge the existence and importance of pre‐existing local groups.

Slums of Delhi
October 2011 Page 124
12.2 CASE STUDY 1: DHARAVI REDEVELOPMENT PROJECT (DRP), MUMBAI, INDIA
It is estimated that more than 55 per cent of Mumbai's over 18 million population stays in around 2500 slums. A part of these slums are on private land, some are on state government land, some on municipal land and a small share is on central government and housing board land. Among these, Dharavi, with a population somewhere between 0.7 to 1.0 million covering almost 239 hectares is the largest slum of India and possibly largest in Asia. Dharavi is strategically located in the centre of Mumbai, an area once a marginal swamp that has been in filled over generations as squatter settlements. The first settlers in Dharavi came there over 300 years ago, and turned marshland into liveable land; today Dharavi is a conglomerate of people belonging to all religions, castes and economic strata, not just the poor. Almost none of the people who live in Dharavi own the land, but a great many own their homes and businesses some of which they rent out. Many houses have electricity which they pay for, and some have running water. Nevertheless, infrastructure is poor: few residents have toilets in their homes; open sewer lines spread disease and are a health hazard in the monsoon. Dharavi is also home to thousands of thriving informal industries, including leather, pottery, textiles, food production and now a major hub of recycling. The annual turnover of business here is estimated to be more than $650m (£350m) a year.1 However, many of these industries pollute the environment and are unsafe for workers. This also makes Dharavi a complex slum to rehabilitate.
12.2.1 Slum Rehabilitation Authority (SRA)
To ameliorate the problems of slums dwellers the then Shiv Sena‐Bharatiya Janata Party Government of Maharashtra appointed a committee chaired by the Chief Secretary of Maharashtra , Dinesh Afzalpurkar in 1995 to devise a scheme to rehabilitate slum dwellers in slums existent as of 01/01/1995. The Afzulpurkar Committee estimated that for close to 80 per cent of the slum settlements, in‐situ rehabilitation should be feasible. Accordingly, the Government of Maharashtra vide Notification of Housing and Special Assistance Department No.SRA‐1095/CR‐37/Housing Cell, dated 16th December, 1995 appointed “Slum Rehabilitation Authority” (SRA) under the provisions of section 3‐A of the Maharashtra Slum Areas (Improvement, Clearance and Redevelopment) Act, 1971. And according to the provisions of section 2(19) (A) & (B) of the said Act the SRA has been granted the status of the Planning Authority in respect of slum rehabilitation areas for the purpose of implementation of Slum Rehabilitation Scheme in Brihan Mumbai. According to SRA, its vision is to make Mumbai slum‐free by the year 2015. The basic features of the SRA scheme are:
1. Every slum structure existing prior to 01/01/1995 is treated as protected structure.
2. Every slum dweller whose name appears in the electoral rolls as on 01/01/1995 and who continues to stay in the slum is eligible for rehabilitation.
3. Every eligible residential slum structure is provided with an alternative tenement admeasuring 225 sq ft preferably at the same site, irrespective of the area of slum structure.
1 http://news.bbc.co.uk/2/shared/spl/hi/world/06/dharavi_slum/html/dharavi_slum_intro.stm (11‐04‐2011)

WILLINGNESS TO PAY
This document is intellectual property of Centre for Global Development Research Private Limited, New Delhi prepared with the help of SER Grant extended by the Planning Commission of India. No part of the document can be copied without a written permission of CGDR.
Page 125
4. Every eligible slum structure that is being used for commercial purposes is granted an alternative tenement having area equal to the structure subject to an upper limit of 225 sq ft
5. A minimum of 70 per cent of eligible slum dwellers in a slum pocket come together to form a co‐operative housing society for implementation of Slum Rehabilitation Scheme (SRS).
6. The underlying land is used as a resource for the SRS.
7. The slum dwellers appoint a developer for execution of SRS.
8. The developer puts in resources in the form of money, men and material for construction of free houses for the slum dwellers.
9. The developer is compensated for his efforts in the form of free sale component.
10. The developers are allowed to construct tenements for sale in the open market. The area allowed for sale in the open market is equal to the area of tenements constructed for Rehabilitation of slum dwellers
11. Floor Space Index (known as FAR elsewhere) up to 2.5 is allowed for SRS.
12. The developer is required to construct the rehabilitation tenements on the plot itself. The balance FSI left is allowed for construction of free sale tenements.
13. The spill over entitlement to the developer is permissible for sale in the form of transferable development right in the open market. These transferable rights can be utilised on other non slum pockets subject to the provisions of D. C. Regulations.
14. The plots which are reserved for public purposes and which are over run by slums can also be taken up for implementation of a Slum Rehabilitation Scheme.
15. In case of plots reserved for unbuildable reservations, 33 per cent of the reservation area is left free for the intended reservation.
16. In case of plots reserved for buildable reservations, a certain predetermined proportion of the permissible built up area is to be constructed as per the requirement of user agency and handed over free of cost to the city administration as a part of SRS.

Slums of Delhi
October 2011 Page 126
17. Slum Rehabilitation Authority is designated as a local planning authority to provide all the requisite approvals for SRS under one roof. The authority is mandated to act as a facilitating agency for implementation of SRS.
18. Along with the free rehabilitation tenements the developers also have to provide space for amenities like a creche (Balwadi), society office, welfare centre.
19. Facilitating measure in the form of additional 5 per cent incentive commercial area is available to the projects being implemented by either a society of slum dwellers directly or a NGO
At present, slums in Mumbai are being redeveloped by the Slum Redevelopment Authority (SRA) which also a part of Mumbai Metropolitan Region Development Authority (MMRDA). If 70 per cent of the residents of a slum agree, a developer can redevelop their plot of land by constructing seven‐storey buildings where each family will get a flat measuring 225 sq ft free. The developer can use the remaining land to build commercial or residential spaces for sale. Simultaneously, the MMRDA has been resettling slum dwellers under the World Bank‐funded Mumbai Urban Transport Project (MUTP) and the Mumbai Urban Infrastructure Project (MUIP). In a recent presentation, T. Chandrashekhar (Chandrashekhar 2011) additional Metropolitan Commissioner, MMRDA reports that about 52728 tenements have been constructed under the three projects namely MUTP, MUIP, and SRA. It is not clear how many of these have already been transferred to beneficiaries.
The MMRDA and SRA schemes are criticized by many for its bad quality of work. The problem is that the developers in these cases are only responsible for constructing the buildings and bother less about civic infrastructure such as drainage, water or sanitation. These are left to the specific agencies. As a result, instead of horizontal slums, the scheme has successfully created vertical slums. People are living in formal housing often without adequate water supply, in areas that are not serviced by public transport, and in seven‐storey buildings where they cannot afford to pay the money needed to run the lifts. For some of them, life is worse than what it was when they lived in slums (Sharma 2006). Similar observation is made by (Siddhye 2011). It is in this context that Dharavi Rehabilitation Project discussed below is being acclaimed although it is still a non‐starter. If successful, the Dharavi project has a wide potential of being replicated in reengineering other urban slums in India and elsewhere.
12.2.2 Dharavi Rehabilitation Project (DRP)
In continuation of its effort to make Mumbai slum free, the government of Maharashtra has planned ambitious Dharavi Rehabilitation Project (DRP) with an aim to change the face of Mumbai. On 4/ 02/ 2004 it passed a resolution to develop Dharavi under cluster approach. It was decided to implement Dharavi Rehabilitation Project also through the Slum Rehabilitation Authority (SRA), Mumbai. The projects aims at rehabilitating bonafide existing households/establishments and create additional residential/commercial space for sale in open market by allowing a global FSI of 4.00 on site; private property in the project will have an FSI of 1.3, municipal and government property 3.1, and slum houses will have an FSI of 4. The project will create 40 million sq ft of commercial space and 30 million sq ft of residential development and is estimated to be completed in seven years. Total project outlay pegged at an estimated INR.15000 crore (ICICI 2009).
The architectural objective of project is to convert Dharavi in to an ideal real estate project by emphasising physical and social infrastructure. DRP has decided to give 25 sq metre (269 sq ft) carpet area house with

WILLINGNESS TO PAY
This document is intellectual property of Centre for Global Development Research Private Limited, New Delhi prepared with the help of SER Grant extended by the Planning Commission of India. No part of the document can be copied without a written permission of CGDR.
Page 127
attached toilet and bathroom to each bonafide slum dweller whose name appears in the voters list as on 01.01.1995 & who is the actual occupant of the hutment.
In that sense, the Dharavi Redevelopment Project is breaking new ground. The developer will have to provide not just the buildings to resettle the slum dwellers living in the particular area but also all the infrastructure including roads, drainage, water supply, municipal office, hospital, school, industrial estate, open spaces for recreation, etc. In other words, the developer will be expected to deliver a complete `township' to the SRA (Sharma 2006). To entice developers, the government has had to modify the Development Control Rules for this project. Developers will be given a Floor Space Index (FSI) of 4 as opposed to the current 2.5 and they only need to get 60 per cent of the slum dwellers to agree to their plan rather than 70 per cent as at present.
Although Dharavi is the largest slum and it must be taken first; but questions are also asked why Dharavi first. The location of Dharavi is so central to Mumbai City that the land cost is enormous and project is sometimes called as sophisticated land grab (Committee of Experts 2009)2. Possibly, because of this aspect of the project it is facing multiple road blocks one after the other. There is also skepticism that the developer may not complete the social and physical infrastructure leaving the settlement as vertical slums as put up by another onlooker:
“Mumbai, the symbol of Indian miracles, will become the most populated megalopolis in the world by 2020. Over 40 percent of its inhabitants live in various slums which define the urban landscape of the city. In Mumbai, the most widely known slum is the Dharavi slum. It has one of the highest population densities in the world. In these "villages" within the city, the most disparate ethnic and religious groups live together in harmony, bound by the instinct to survive. In 2008, Dharavi inhabitants began to move to municipal residences and the land of Dharavi was put up for sale with the intent to build shopping malls and residential areas for the new Mumbai middle class.
In a short space of time, the inhabitants were catapulted into large concrete buildings, 20 stories high and divided into apartments along long narrow corridors. Unwilling to abandon their traditional habits, the residents modified the new spaces: they created places of joint ownership and doors to individual apartments were uprooted to make spaces communal. The structural limits imposed by the new housing were violated in order to preserve traditional lifestyles, thus transforming the compound into vertical slums.
2 http://www.dharavi.org/Dharavi_Advocacy/I._Government_Documents/DRP_Letter_by_Commitee_of_Experts

Slums of Delhi
October 2011 Page 128
One such “slum rehabilitation“ project forced people to move to places like the Lallubhai Compound in Mankurd, where buildings cluster ominously, each separated from the other by a small corridor full of garbage. More than 60,000 people live in this new kind of slum after their homes were demolished. Three kilometres from the Govandi station, close to one of Mumbai's only operating open garbage dump, the Lallubhai Compound looks like a "ghetto." The city's urban poor have been swept under the carpet where no one will see them‐‐welcome to Mumbai's slum resettlement housing projects, the future of the big metropolis.”
URL: http://myborderlight.blogspot.com/2010/11/mumbai‐by‐giulio‐di‐sturco.html (11‐04‐2011)
Almost two‐and‐a‐half years after the Maharashtra government unveiled its show‐piece project to transform Dharavi into a model township and a world‐class commercial hub, not an inch of mud has moved. What has gained momentum with each passing day is mud‐slinging by different authorities entrusted to take the project forward (Kamath 2009).
Another big issue is about the socialisation. The maidservant can be a slum dweller; the driver can be a slum dweller; the dhobi can be a slum dweller; but the neighbour cannot be a slum dweller. Nobody wants to live next to a slum dweller, because slum dwellers are dirty, they play loud music, they have many children, they fight all the time, they tease women and spit everywhere. These are some of the reasons that flat purchasers give builders who construct buildings under the much‐touted slum rehabilitation programme (D’Souza 2004).
THE DRP DETAILS AND PROCEDUR AS CONCEIVED
Government of Maharashtra has accepted the proposal submitted by Architect, Mukesh Mehta, ‘MM Project Consultants’ for the redevelopment of Dharavi which, after suitable modifications, will be implemented through the Slum Rehabilitation Authority (SRA), according to the norms of S. R. Act of 1971. The SRA website describes the DRP as follows:
Development Plan: The slum dweller whose names appear in the voters list as on 01.01.1995 & who is actual occupant of the hutment is eligible for rehabilitation. Each family will be allotted a self contained house of 225 sq ft carpet area free of cost. The eligible slum dwellers certified by the Competent Authority will be included in the rehabilitation scheme and will be given rehab tenement in Dharavi.
Transit Tenements: During the implementation of this project, Dharavi residents will be provided with transit tenements, in close proximity of Dharavi or in Dharavi itself. The developer will bear the cost on account of rent of the transit tenements but the cost of expenditure of consumables like water, electricity, telephone etc. will have to be borne by the slum dwellers.
Sustainable Development: The development plan for Dharavi has many amenities in it; viz. wider roads, electricity, ample water supply, playgrounds, schools, colleges, medical centres, socio‐cultural centres etc. For proper implementation, Dharavi has been divided into 10 sectors and sectors will be developed by different developers. The total duration of this project is expected to be of 5 to 7 years. Rehabilitation building will be of 7 storeys.

WILLINGNESS TO PAY
This document is intellectual property of Centre for Global Development Research Private Limited, New Delhi prepared with the help of SER Grant extended by the Planning Commission of India. No part of the document can be copied without a written permission of CGDR.
Page 129
Development Procedure: After considering the redevelopment plan, a detailed plane table survey has been carried out to know the ground realities. Also, consent of the slum dwellers to join this project is being obtained. After obtaining suggestions & objectives from the public for the revised development plan, the same will be finalized by Govt. For each sector a detailed sectoral plan will be prepared by the selected developer in consultation with SRA. This will be placed before the public for suggestion/objectives and then finalized after due amendments.
Appointment of the Developer: Global tenders will be invited from developers for this project. The developer will be evaluated technically and financially by a Committee headed by the Chief Secretary of Government of Maharashtra. Each developer is required to explain his development strategy in his sector and obtain objectives & suggestions from the residents before starting the development process.
Development of local Industrial units: Taking into consideration the various industrial units in Dharavi, it is being proposed that, non‐polluting industrial / businesses will be retained in Dharavi itself. All the established businesses and manufacturing units will be encouraged and will be provided with modern technical and economical strategies for sustainable development.
THE DRP DETAILS AND PROCEDURE: AN UNRESOLVED ISSUE
The DRP has been modified many times since its inception resulting in considerable increase in costs as opposed to the original plan and therefore, the description here is mere indicative of terms of event as reported in various documents, which may be conflicting to each other. The SRA website also does not provide the latest version of DRP but whatever available is attempted to incorporate.
The architectures define the project as “integrated and sustainable” spirit‐of‐the‐times approach, and call it as HIKES that stands for: housing, income, knowledge, environment and socio‐cultural development. They suggested replacing the Dharavi slum with a community of five self‐sufficient sectors that include residential buildings, shops, industrial centres, schools, hospitals, gardens, golf courses, and sports complexes. Unlike in the other SRA projects, the five builders who will be responsible for the redevelopment of these five sectors will also have to ensure the establishment of basic infrastructure: water, electricity, roads, and canalization. This clause ensures that horizontal slums are not turned into vertical slums, as is too often the case (FERNANDO 2009).
In the initial years, the project was estimated to cost Rs 9,300 crore. Today it is valued at Rs 15,000 crore. The delay has helped increase profit margins as land prices have steadily gone upwards, by 30 per cent to 40 per cent (Sharma 2009).

Slums of Delhi
October 2011 Page 130
DRP is planned as a self‐funded project. According to the plan, a group of builders and developers would build free of cost houses for all the hutment dwellers of Dharavi on the very land on which their huts are standing today. Extra FSI or transfer of development rights (TDRs) would be given by way of compensation for the money to be invested by the builders. Once the project is completed, Dharavi aspires to become a world‐class township within Mumbai city.
It will have 70,000 to 75,000 residential and commercial units with ultra‐modern amenities in hygienic conditions. It aims to rehabilitate the entire slum and to re‐house all of the residents whose names appear on the voters’ list prior to 2000, in Dharavi itself. This would mean an official number of 72,000 families.
The Dharavi redevelopment plan will give slum dwellers who own their structure, new flats of area 300 sq ft each in Dharavi for free. Those who rent will have to go elsewhere. Business owners will receive 250 sq. ft., and will have to pay for anything more than that (Clinton 2010).
The entire slum of Dharavi has been divided into five sectors to be allocated to five private developers through a competitive bidding process. Developers need to build housing for slum residents, and they will also be able to build more lucrative residential buildings and commercial properties. Informal settlements are thus envisaged to be replaced with high‐rise developments irrespective of the existing vibrant economy and the diverse needs within; informal and complex that has evolved through stratifications, adaptations and historical modifications (Lamarca 2010)
ROADBLOCKS IN DRP3
(This section is heavily drawn from Kamath 2009; and Kamath 2011)
The project was approved by the government of Maharashtra in 2007 and was supposed to be completed in seven years. A request for proposals was launched in June 2007 and interested property developers, both Indian and foreign, started submitting the non‐financial technical aspects of their projects in February 2009.
The project has inched forward, with the government inviting bids, shortlisting 14 possible developers and promising that by July 30, 2010, the final bids would be announced. Inexplicably, on that day, the entire
process ground to a halt. The government claimed it had not yet amended the DCR4 to accommodate the
bigger apartments for Dharavi’s residents. Hence the bidding process could not go through. In fact, this was a mere technicality. The thought of the impending elections, and having to face the ire of disgruntled residents in Dharavi, was probably a much bigger reason for postponing the final phase of getting the project underway. With the election code of conduct, this government cannot could not take any more steps and the project had to be revisited, by the new government that takes office at the end of October.
3 ‘More stumbling blocks for Dharavi revamp’ by Naresh Kamath, Hindustan Times 22.01.11: URL: http://dharavi.org/F._Press/2011/22.01.11 per cent3A_More_Stumbling_Blocks_for_Dharavi_Revamp
4 DCR: Development Control Rule. To pacify Dharavi residents who have argued that their existing spaces are considerably larger than the 225 sq. ft apartments promised free to them under the DRP, the government agreed as a special case to increase the size of each apartment to nearly 300 sq ft. For this the relevant Development Control Rule (DCR) needed to be amended.

WILLINGNESS TO PAY
This document is intellectual property of Centre for Global Development Research Private Limited, New Delhi prepared with the help of SER Grant extended by the Planning Commission of India. No part of the document can be copied without a written permission of CGDR.
Page 131
In the meantime, MASHAL, a non‐government organisation was assigned the task of conducting abiometric survey of slum dwellers at Dharavi. It has revealed in January 2011 that 31 per cent of the residents in sector 5, which the state housing agency, Maharashtra Housing and Area Development Authority(MHADA), had planned to develop, are not eligible for free houses under the project because they moved to Dharavi after January 1, 2000. The state government has said only those who started living in Dharavi before this date can benefit from the project. According to Mashal, more than 2,900 of the total 9,300 houses in the sector have changed hands in the last 11years. Mashal has also pulled out of the survey citing non‐cooperation from the slum dwellers and financial compulsions.
The major roadblocks in DRP since its launch in 2004 till now could be summarised as below.
1. June 1, 2007: Global tenders for for expression of interest invited
2. March, 2009: Following global slowdown five companies exit the project citing lack of clarity and delay of implementation
3. July 7, 2009: Expert committee debunks Dharavi project, passes adverse remarks against consultant Mukesh Mehta. Calls the scheme “sophisticated land grab”.
4. October 16, 2009: Of the 14 bidders only seven submitted their memorandum of understanding they have signed with their foreign partners.
5. October 16, 2009: BMC submits a preliminary survey report stating that 63 per cent of Dharavi residents are ineligible for houses under the project.
6. February 2, 2010: A sub‐committee of secretaries recommends that sector‐wise redevelopment of Dharavi takes place.
7. June 11, 2010: MHADA submit proposal to the state seeking to redevelop sector 5 of Dharavi.
8. January, 2011: Mashal, a non‐government organisation has revealed in January 2011 that 31 per cent of the residents in sector 5, are not eligible for free houses under DRP.
9. Mar 23, 2011: Dharavi development authority (DDA) head and vice‐president, Maharashtra Housing and Area Development Authority (MHADAL), has told the government to re‐invite bids to redevelop Asia's second largest slum colony

Slums of Delhi
October 2011 Page 132
ISSUES OF CONFLICT
1. The first issue of conflict concerns the number of people who are to benefit from the project, which appears to have been greatly underestimated, because even by using the year 2000 as a point of reference, the SRA only came to 72,000 families, whereas the National Slum Development Federation (NSDF) estimates that 100,000 would be a more correct number. Furthermore, some 35,000 households, that live in lofts and are either tenants or members of the same family as lives below, have been left out of the reckoning altogether. Therefore the question that arises is where will the non‐rehabilitated families go? Will they relocate to new slums?Given this change in the basic calculation of how many people need to be resettled, how would the economics of the project as it stands today work?
2. The size of the apartments that are to be given for free to Dharavi residents is another problem. An area of 21 sq meters is too small for families of five to ten people who often carry out their occupation in the same place as their residence. This would not be possible in an apartment building. Through negotiations, the residents’ associations succeeded in requiring an area of 28 sq meters, which seems more acceptable, though some people would prefer 37 sq meters. This is because numerous business activities require much more space. Owners will either have to buy land at market price or move it to another slum. In addition all slum dwellers don own houses of same size, some have accommodation in 200 sq ft, while other may have as big as 700 sq ft.
3. Another point major concern raised is the absence of consultation and prior consent of Dharavi’s residents. DRP has done away with a provision in the Slum Rehabilitation Scheme (SRS) that requires developers to get the consent of at least 70 per cent of the people to be rehabilitated. When Mukesh Mehta of MM Consultants was appointed as the technical consultant for the DRP, he insisted that his team had consulted people in Dharavi. Yet, it was found that most people did not have a clue about the DRP or what it plans to do (Sharma 2009).
4. The fate of pollution‐producing informal business activities (soap‐making, tanning, pottery) also poses a problem. Will the DRP force the residents to make an end to their operations and thereby causing unemployment for the workers?

WILLINGNESS TO PAY
This document is intellectual property of Centre for Global Development Research Private Limited, New Delhi prepared with the help of SER Grant extended by the Planning Commission of India. No part of the document can be copied without a written permission of CGDR.
Page 133
12.3 CASE STUDY 2: KIBERASOWETO SLUM UPGRADING PROJECT, NAIROBI, KENYA
(This section is heavily drawn from: Dafe 2009; Mitullah 2003; Huchzermeyer 2008, UN‐HABITAT 2003; and MULCAHY and CHU)
Kibera‐Soweto slum‐upgrading project in Nairobi, is the main pilot project of the Kenyan Slum Upgrading
Programme (KENSUP)5. It is a high‐level slum‐upgrading programme being undertaken in Kenya with
international participation through UN‐Habitat. An early decision was to pilot KENSUP in Nairobi’s largest slum, Kibera, which houses over 600,000 people on 110 hectares of land. After a detailed situation analysis in 2001, it was decided to limit the pilot to the Soweto village, the south eastern sector of the Kibera slum, which has a population of 60,000 people. The Kibera‐Soweto pilot project was launched in 2004 with the main objective of planned redevelopment of the slum into orderly blocks of flats with two‐bedroomed units of size with 50 square meter to be privately owned (Huchzermeyer 2008).
12.3.1 Informal settlements (slums) in Kibera, Nairobi
Nairobi has some of the most dense, insecure and unsanitary slums in all of Africa, and Kibera in Nairobi is known to be the worst among them all. It is also known as one of the worst slums on the planet. It houses somewhere between 800,000 and 1.2 million people, which is nearly one quarter of Nairobi’s population—in just 630 acres located approximately four miles from Nairobi’s central business district. The living conditions are harsh and profoundly unforgiving. The deprivations people face on a daily basis are fundamental: severe overcrowding, terrible sanitation, chronic disease, malnutrition, and nighttime insecurity. These conditions have evolved over decades of indifference and neglect by both municipal and national governments.
In Soweto East—the focus of the Kibera Soweto Pilot Project, 70,000 residents live on 52.8 acres. The approximately 2,880 structures in Soweto East are served by only 100 toilets, 50 baths, and no vehicular infrastructure of any kind. These highly congested living conditions profoundly increase health risks and diminish quality of life for Kibera’s residents. With a large majority of households averaging five people living in single rooms of less than 10 square meters, infectious and skin diseases spread easily and food contamination is common. Families burn wood, charcoal and kerosene indoors for cooking and lighting,
5 The Kenyan Slum Upgrading Programme (KENSUP) was initiated in the year 2000, through an agreement between the previous Government of Kenya (under President Moi) and UN‐Habitat. It was renewed in January 2003 with the new NARC (National Rainbow Coalition) government under President Kibaki.
Slums of Delhi
October 2011 Page 134
which contributes to a high incidence of upper respiratory infection and irritation. Together, these circumstances create an incredibly stressful living environment.
Various non‐governmental organizations, many with the World Bank’s help, have sponsored slum upgrading projects over the past several decades with varying degrees of impact and hardly any unqualified success. Finally acknowledging the problem’s severity and persistence, Kenya’s national government took definitive action in 2002 by creating the Kenya Slum Upgrading Program (KENSUP). This national office focuses on implementing projects that are sustainable, inclusive, democratic, accountable, and transparent and that will provide communities with improved housing and access to basic services, secure tenure, and opportunities to generate income.
12.3.2 KiberaSoweto Slum Upgrading Project
The stated objectives of the Kibera‐Soweto Pilot Project are to promote and facilitate the provision of (1) secure tenure, (2) improved housing, (3) income‐generating activities, and (4) physical and social infrastructure.
The planned interventions of the project were comprehensive and intended to improve overall living conditions within the settlements in Kibera. Because of the national focus of the KENSUP programme involving so many components, policy creation and institutional capacity building were two first steps in the process.
POLICIES
Several policies and laws have directly influenced this upgrading program. The “Physical Planning Act” and the “Physical Planners Act” of 1996 mandate “competence in planning urban and rural settlements, and in participatory approaches involving public/private sector and civil society.” Several other policies, such as the “Local Government Reform Program”, were created to increase citizen participation in “matters affecting them.” In 2004, their parliament approved a landmark National Housing Policy, which recognizes for the first time the right to housing, provision of legal security of tenure to the poorer sections of society, and participation of the inhabitants in the housing and slum upgrading process. This policy specifically addressed the needs of slums and the role of slum upgrading programs.
INSTITUTIONAL CAPACITY BUILDING
Part of the memorandum of understanding between the government of Kenya and UN‐HABITAT required that Kenya create a similar fund. The fund set up in Kenya, called the Kenya Slum Upgrading, Low Cost Housing and Infrastructure Trust Fund (KENSUF) is a central depository of all mobilized financial resources for slum upgrading. It therefore draws funds from donors, CBOs, private sector and Government budgetary allocations. The fund has the potential for pooling resources and institutionalization of transparent resource allocation mechanism.
COMMUNITY PARTICIPATION
The Kenyan government has made increasing citizen participation a priority. Several policies directly address citizen involvement, and sensitization and education have been a large part of KENSUP’s focus in Kibera.

WILLINGNESS TO PAY
This document is intellectual property of Centre for Global Development Research Private Limited, New Delhi prepared with the help of SER Grant extended by the Planning Commission of India. No part of the document can be copied without a written permission of CGDR.
Page 135
While Kenya’s policies and the KENSUP plan call for significant community involvement, there is evidence that these attempts have not been very successful. Officials claim that past upgrading projects have failed due to lack of citizen involvement and that the KENSUP program focuses on community education and participation.
Language barriers have also been cited as an obstacle to participation of community in development initiatives, as much of the information is disseminated in English. Even when people are aware of public meetings, many often cannot take time off work to participate. Also, conflicts between stakeholders and organizations make consensus building extremely challenging; public officials often lack the knowledge and skills to implement participatory planning approaches.
KIBERA INTEGRATED WATER, SANITATION AND WASTE MANAGEMENT PROJECT (WATSAN)
Another component of KENSUP is the Kibera Integrated Water, Sanitation and Waste Management Project (WATSAN), an initiative of UN‐HABITAT’s Water for African Cities program, led by UN‐HABITAT and implemented by a local non‐governmental organization. A central goal of WATSAN is to address community inclusion, education, and economic development in Soweto East. Consequently, the program supports small‐scale community based initiatives in water, sanitation and waste management. This program recognizes
the fact that past attempts to improve water and sanitation in Kibera have failed because they did not integrate water, solid waste, sanitation, and drainage, which need to be addressed simultaneously in settlements like Kibera if there is to be a perceivable improvement in the living environment.
RECENT DEVELOPMENTS: FAR FROM SUCCESS
According to the plan, as the slum dwellers move into the new houses it frees up more space for the Government and UN‐HABITAT to build more housing under KENSUP. This process should continue until Kibera is no longer a slum. Through the Kibera‐Soweto slum upgrading project, permanent flats have already been constructed for the slum dwellers only a few metres from the slums. The two‐bedroom flats have electricity and running water. The houses have also been fenced to ensure adequate security. However, it is important to highlight the extremely slow pace of this project since its official launch in October 2004. In June 2007 the UN reported that they were 60 per cent complete and targeting a completion date of April 2008. Yet it took until September 2009 for the Kenyan authorities to start moving the residents out of Kibera settlement. Officials expect to take from two to five years to clear the slum, which is home to about one million people. The first people to move are being resettled nearby in 300 newly built apartments, each paying about $10 a month in rent.

Slums of Delhi
October 2011 Page 136
However, some residents and landlords have gone to court in a bid to stop the moves as they claim they own the land. The Nubians, who claim they are the original inhabitants of Kibera have refused to move from their houses for fear of losing the rent they charge to tenants as well as claiming that the move is against their customs that demands that they live with their extended families in one house. Fears also abound that the new houses may prove unaffordable to the slum residents who live on less than a dollar a day. As of July 2010, Seven years after the official launch of the Kenya Slum Upgrading Project (KENSUP), and months after Soweto East residents were shifted to flats a couple of kilometres away, demolition of the village, one of 13 in Kibera, has yet to start. A court case has been brought by about a dozen people who claim ownership of structures in Soweto East.
Urban planners have also expressed concern at the project, because according to them it involves the risk of repeating the mistakes of the past. In another similar project poor families either shared two‐roomed apartments with one or two other families in order to pay the rent, or sub‐let them to middle‐class families and moved back into the slums.
12.4 CASE STUDY – 3: ORANGI PILOT PROJECT, ORANGI TOWN, KARACHI, PAKISTAN
(This section is heavily drawn from: Hasan and Mohib 2003; Bano 2008; and Lead‐Case‐Studies 2004)
It is one of the sustainable examples of participative slum upgrading programmes. With the help of “Orangi Pilot Project” in Karachi, the residents constructed sewers to 72,000 dwellings over 12 years during 1980 to 1992, contributing more than US$2 million from their own resources. It now includes basic health, family planning, and education and empowerment components.
Karachi has experienced an influx of migrants from all parts of Pakistan in search of a source of livelihood and better opportunities. Many of the migrants to large cities settle in slums where municipal infrastructure such as roads, water supplies and drainage is either under enormous strain or non‐existent. As of 1998, Karachi
had about 650 slums, which are home to 40 percent of the city's population6. The models for community
development followed in Pakistan fall into two categories: those designed for urban slums and those for rural areas. The urban model is based on the success of the Orangi Pilot Project (OPP).
12.4.1 Orangi Township, Pakistan’s largest slum
The Orangi Township is Pakistan's largest slum. Located in the western part of the city, this slum was established in the 1960s and it now covers an area of 8000 acres. The 100,000 houses in the area were home to approximately one million people belonging to lower and lower‐middle income groups. Like other slum localities in Pakistan, Orangi Township lacked all civic amenities until 1980. The OPP is a story of local people organising themselves and taking initiatives on their own to build basic infrastructure for their community.
6 Source: Human Rights Education Programme, 1998.

WILLINGNESS TO PAY
This document is intellectual property of Centre for Global Development Research Private Limited, New Delhi prepared with the help of SER Grant extended by the Planning Commission of India. No part of the document can be copied without a written permission of CGDR.
Page 137
12.4.2 Orangi Pilot Project (OPP)
Orangi Pilot Project (OPP) is an Non Govermental Organisation (NGO) that began its work in Orangi in 1980. OPP has been involved in supporting community initiatives for development, mobilize local resources and build parterships between people and government in Orangi.
Originally, the OPP was undertaken in 1980 as a demonstration by a renowned Pakistani social scientist, Akhtar Hameed Khan. He organised 20 families in one lane to work on a self‐help basis to develop sewage and drainage system for the local community and a solid road network. Initially, the residents provided free labour to build the system, but they expected financial assistance from the government for the cost of materials. They soon realised that government assistance would not be forthcoming. Encouraged by Akhtar Hameed Khan, community members generated the necessary funds by contributing $34 per house, and they provided labour on a purely voluntary basis. With the community's investment, the demonstration project was a success. Today, 72,000 households are served by sewers constructed by the residents of Orangi Township, with technical assistance from the OPP. The Orangi community has contributed US$ 2 million to build a sewage system, which traditionally is the responsibility of the government.
The work of the OPP institutions has by and large been the most successful in upgrading and improving slums socially and physically. It has solved the neighbourhood sewage problems and created lane and neighbourhood level community organisations which have invested in the sewage system. Once the sewage programme proved successful, the OPP slowly expanded to other development initiatives: basic health and family planning, credit and savings for small enterprises, upgrading of physical and academic conditions of local schools, and women's participation in development. Health concerns were an important motivator, specifically among mothers and their children. However, because of women's segregation in this society, conventional gender development models proved to be inadequate. In some areas of Pakistan, customs, laws, religious beliefs and attitudes confine women to their homes. To overcome these obstacles, a mobile health‐training clinic, consisting of women doctors and educators, was organised to meet with groups of women in small neighborhoods. The OPP has strengthened the position of women in the Orangi community and has reinforced their participation in community activities.These organisations have later involved themselves in government programmes for intermediate and primary infrastructure development and solid waste management in their areas. The school programme has raised educational levels (Orangi has a higher literacy rate than the Karachi average); the preventive health programme has reduced infant mortality (example, Al‐Fateh Colony where infant mortality fell from 128 in 1983 to 37 in 1993); the housing programme has introduced improved building components, construction techniques and skills; and the micro credit programme has improved the employment situation.
In 1988, the project was upgraded and four autonomous institutions were established: (1) the OPP Research and Training Institute, (2) the Orangi Charitable Trust, (3) the Karachi Health and Social Development

Slums of Delhi
October 2011 Page 138
Association and (4) the OPP Society, which channels funds to these institutions from a Pakistani Charity, the Infaq Foundation. In 1992, a fifth institution called the Rural Development Trust was also established. The objective of these OPP institutions is to analyse outstanding problems with the help of the community members and to suggest viable solutions through technical assistance/advice, action research and education. These institutions have independent governing bodies with their own sources of income such as grants, donations and household contributions. All programmes are evaluated regularly and are modified on the basis of changing needs within the community. All these programmes provide an enabling environment by mobilising local resources and by facilitating cooperative action through social and technical guidance.
12.4.3 Lessons from OPP
The example of the OPP shows that the success of a community development initiative is not determined by the extent of the problem but it is determined by the extent of network resources that are mobilised to address the problem. The OPP development initiative has allowed residents to build new relationships and to launch themselves into self‐organisation and self‐sufficiency. Due to the success of the OPP, the Government of Pakistan and international donor agencies have replicated OPP's development strategy in other urban areas of Pakistan, after introducing necessary modifications to reflect local conditions and community needs. The reasons for the success of the OPP could be summarised as follows:
1. Research to understand what people are doing and how, and then supporting them in doing it. Technical research into sanitation and housing issues and developing low cost solutions and extending them through CBOs and informal sector entrepreneurs.
2. Understanding the needs of the informal sector in health and education and supporting them through credit, technical assistance, managerial advise and linking them with government programmes and funds for social uplift and poverty alleviation.
3. Developing alternatives to top‐heavy government projects for Orangi and promoting them with government agencies and international donors, and
4. Developing skills within the communities to build infrastructure at the neighbourhood level and monitor government projects in Orangi.
12.5 CASE STUDY 4: INTEGRATED SOCIAL INCLUSION PROGRAMME”, SANTO ANDRE, BRAZIL
(This section is heavily drawn from: Rodrigues and Kanto 2007; UN‐HABITAT 2003a; UN‐HABITAT 2003; and UN‐HABITAT 2001)
The ‘Integrated Social Inclusion Programme’ in Santo Andre municipality, Sao Paulo, Brazil,is a slum upgrading programme that has improved the living conditions of 16,000 slum inhabitants through partnerships with groups excluded from citizenship with local authorities and aid agencies. It is based on the principles of integrating marginalised informal settlement communities into the city, participation of the

WILLINGNESS TO PAY
This document is intellectual property of Centre for Global Development Research Private Limited, New Delhi prepared with the help of SER Grant extended by the Planning Commission of India. No part of the document can be copied without a written permission of CGDR.
Page 139
residents, and coordination across the social, economic and infrastructural sectors. Social exclusion can be understood as the absence of basic rights compatible with a social minimum that allows the exercise of citizenship. Defined in these terms, the concept of exclusion is much broader than poverty. Exclusion and inclusion are multidimensional and are reflected through economic, social, cultural and urban facets. Therefore, policies aimed at social inclusion need to go beyond mere sectoral approaches. The right to the city based on the access to minimum social standards, requires the implementation of a set of integrated policies aimed at social inclusion.
12.5.1 Urbanization Strategy: Santo André More Equal (SAMI)
Santo Andre, is part of the Sao Paulo Metropolitan Area. It had undergone a period of transformation, from its industrial past to an expanding tertiary sector. The economic gap between the rich and poor had grown, exacerbated by the slowdown of the Brazilian economy during the 1990s. As a result, living conditions have deteriorated and a number of favelas (slums) characterised by extreme poverty had emerged.
Santo Andre has 138 slums, where 120.5 thousand people live, representing 18.6 per cent of the city’s population. The majority of the slums are to be found in risky areas, such as declivities subject to regular floods, or in environmentally protected areas. The municipal administration of Santo Andre initiated the integrated programme aimed at social inclusion for the period 1997 to 2000. In this second period, the focus of the urbanization strategy was the provision of a wide range of social inclusion programs, which was known as Santo André More Equal (SAMI). This approach to urbanization went beyond the physical infrastructure to face the need to overcome social exclusion, articulating policies from several areas of the local government. In this approach, social programs and basic income initiatives were combined with urban interventions in a group of slums, in a concentrated and articulated way. The SAMI included urban infrastructure (sewage, water, electricity, and housing); land regulation; family’s health provision; illiteracy eradication; basic income provision; micro‐credit program; job qualification; and others. The workers were public servants from the municipality; NGOs employees; and people from local communities selected and trained to provide services. The slogan of SAMI was “everything together, at the same time, and in the same place” (Rodrigues, and Kanto 2007).
The SAMI was implemented in four slums from 1997 to 2000. The choice of theses slums followed technical and political criteria, having been decided in a participatory budget process. On these four slums lived 16 thousand people, representing 13,3 per cent of the Santo André slum’s population. On the total, the program’s expenditures were R$ 44 millions, being 41,3 per cent paid by the municipality government. There was also the financial support from European Commission, which contributed with 41 per cent of the resources for the project. The remaining funding came from the Federal Government, through the HABITAR program, as well as from other partners. (Rodrigues, and Kanto 2007, Larangeira, A., 2003)

Slums of Delhi
October 2011 Page 140
The SAMI also included mechanisms for the evaluation and monitoring of the quality of the public services provided to the community after the conclusion of the urbanization. People from the communities were trained to be the monitors, and the results of their analyses to be sent the companies providing the public services. Another important characteristic of SAMI was the participation of the local communities in all phases of the project: the definition of priorities, its implementation and, finally, the monitoring of the results.
12.5.2 Project details
One of the four projects undertaken within this programme was the upgrading of “Sacadura Cabral”, an informal settlement that that had existed for 32 years. Around 780 households were occupying 4.2 hectares of flood prone land (a density of 186 households per hectare). The level of the land had to be raised by 2.5 metre, in order to prevent flooding. In order to undertake this activity, all residents had to be removed temporarily from their original dwelling units. A new layout, with plots of 42 to 45 sq metres each to be held in freehold title, was developed through many workshops with the community. However, in the new layout, 200 of the original 780 households could not be accommodated. A neighbouring portion of land could be developed with new housing units. In close collaboration with the community, the concept of choice was incorporated into the relocation. Removal of households, land filling and redevelopment was to occur on a phase by phase basis with small portions of the settlement being removed at a time. However, instead of treating the neighbouring development as a decanting site, a call was made to all the residents, for people to come forward who wished to move out of the slum and into the new development on a permanent basis. Sufficient households volunteered, and their vacated units were then occupied by households living in the first phase of the development. Once Phase One was complete, these households moved back onto their demarcated plots of 42 to 45 sq metres, and with credit and technical support from the municipality began converting their shacks into formal multi‐storey houses, with commercial space on the ground floor. In the meantime, the second phase could be handled in the same manner.
The project has seen the improvement of basic services in some of the worst neighbourhoods. Micro‐credit facilities have been made available to small‐scale entrepreneurs, while health care has been made more accessible through community health agents. Other social programmes have been implemented including literacy campaigns for adults and programmes aimed at street children. Recreational facilities have been made available, serviced plots have been transferred to families and low income families were re‐housed in apartment buildings. One of the most important results has been the engagement of a wide range of actors and the creation of effective communication channels. All activities have taken into account gender participation and mainstreaming. The administration intended to extend the pilot programme to all slum areas in the city, through differentiated slum upgrading projects while strengthening the approach towards regularization of land tenure. In addition, the programme was designed to attend to all families facing situations of extreme economic exclusion through a revised minimum income policy and through the up scaling of existing programmes.
This project in Santo Andre received considerable international recognition. It has been referred by the United Nations (UN) as one of the best practices in local governance. Indeed, it is reported that the communities displayed an improvement in employment, schooling and health care. However, the expansion of the SAMI to a larger group of slums is restricted by budget constraints, since the extensive range of social inclusion programs implied high implementation costs.

WILLINGNESS TO PAY
This document is intellectual property of Centre for Global Development Research Private Limited, New Delhi prepared with the help of SER Grant extended by the Planning Commission of India. No part of the document can be copied without a written permission of CGDR.
Page 141
12.5.3 Strategic principles behind success of the social inclusion programme
The effective reduction of urban poverty and social exclusion in Santo André is based on a number of key principles:
Well targeted government interventions in the urban sector can foster citizenship and enable people to create more productive urban livelihoods.
The active participation of the urban poor in decision‐making promotes effective formulation and implementation of local action plans.
The participatory budgeting process, an innovative approach to urban governance and decision‐making, provides a real voice for the urban poor in both the allocation and use of municipal and other resources.
The Municipality of Santo Andre has shown that while effective leadership needs to be ensured by the local administration it, in turn, needs to devolve decision‐making and implementation powers to the community.
Inter‐agency collaboration and effective channels of communication between various actors and stakeholders is critical to successful slum improvement and reduction of poverty and social exclusion.
Principles of equity, civic engagement and security were followed.
12.6 CASE STUDY 5: SLUM ERADICATION IN SINGAPORE
(This section is heavily drawn from: World‐Bank 2009; and Urban‐Development‐Authority‐Singapore‐Government website)
Singapore is perhaps the most successful example of how slums can be eradicated. It is one of the few countries that have managed to implement integration policies at all levels simultaneously. Singapore being a city‐state with exceptionally rapid economic growth and a focused government in power since 1965, helped greatly in achieving slum eradication. The key lesson learnt from their example was that successful urbanization takes coordinated action at all levels of government (World Development Report 2009).

Slums of Delhi
October 2011 Page 142
12.6.1 Slums in Singapore
In the year 1965, when Singapore got its independence, almost 70 per cent of Singapore’s households lived in badly overcrowded conditions, and a third of its people squatted on the city fringes. Two of the most pressing national concerns following independence were unemployment (around 14 per cent) and lack of public housing. Also, half of the population was illiterate. Falling mortality rates and migration from the Malay Peninsula resulted in rapid population growth, further increasing the pressure on both housing and employment. There was the need for around 600,000 additional units of housing, and private supply was less than 60,000. This is Singapore, in the early 1970s. Today, less than 40 years later, Singapore’s slums are completely gone. In their place is one of the cleanest and most welcoming cities in the world. Of Singapore’s population, 86 per cent now lives in publicly built units. Most of these residents own their flats, taking advantage of special housing funds financed from the Employees Provident Fund, a mandatory retirement scheme (see World Bank 2009, Yuen 2004, Yusuf and Nabeshima 2006).
12.6.2 How Singapore succeeded in slum eradication
A combination of political will, adequate funding, community engagement, and a private sector that was consistently generating more jobs, has contributed in making Singapore a slum free city. The government became a major provider of infrastructure and services. A successful large‐scale slum‐upgrading project took place in Singapore following a massive fire in 1961. A Housing Development Board (HDB), created by the government, guided the replacement of slums with apartments and office buildings for the next two decades. The HDB was mandated to undertake a massive program of slum clearance, housing construction, and urban renewal. At the height of the program, HDB was building a new flat every eight minutes (see Yuen 2004,
Yusuf and Nabeshima 2006).
Serviced land was made available. The scarcity of land made good planning an imperative. Through the Land Amalgamation act, the government acquired almost one‐third of city land. Slum dwellers were relocated to public housing. For a city‐state in a poor region, it is not an exaggeration to assert that effective urbanization was responsible for delivering growth rates that averaged 8 per cent a year throughout the 1970s and 1980s. It required a combination of market institutions and social service provision, strategic investment in infrastructure, and improved housing for slum dwellers.
1971: THE FIRST CONCEPT PLAN
With help from the United Nations, the first Concept Plan was formed in 1971. The Concept Plan of 1971 adopted the "Ring Concept Plan". This envisaged the development of a ring of new high‐density satellite towns around the central water catchment area, with each town separated by green spaces and a system of parks and open spaces. Low and medium density private housing would be built beside these towns and there would be provisions for industrial estates. The towns would be linked by an island‐wide system of expressways. The Concept Plan also proposed a Mass Rapid Transit (MRT) system to connect the population centres with the city. The Concept Plan also called for existing facilities to be maximized. In addition, it stressed the need for a better living environment and to set aside substantial areas for recreation.

WILLINGNESS TO PAY
This document is intellectual property of Centre for Global Development Research Private Limited, New Delhi prepared with the help of SER Grant extended by the Planning Commission of India. No part of the document can be copied without a written permission of CGDR.
Page 143
1974‐1989: CENTRAL AREA PLANS
This period saw the development of Central Area. Historically, the Central Area had been the hub around which Singapore evolved. Commercial and banking activity had always been concentrated there, but over the years, it had developed haphazardly and congestion had grown to an intolerable level. The Urban Renewal Department (URD) under the HDB was entrusted with the physical, social and economic regeneration of the Central Area. However, the task facing the URD was so immense that in 1974 the department was turned into an independent statutory body under the Ministry of National Development. With that, the Urban Redevelopment Authority (URA) was created.
URA's primary task then was to redevelop the Central Area and resettle residents affected by redevelopment. Between 1967 and 1989, a total of 184 hectares of land were cleared, assembled and sold under the URA Sale of Sites Programme, resulting in the development of 155 projects. Through this programme, Singapore's Central Area was transformed from an area of slums and squatters into a modern financial and business hub. In 1980, the URA, supported by other government agencies, prepared a comprehensive long‐term plan for the Central Area. Chief among its proposals were the development of Marina City on 690 hectares of reclaimed land south of Singapore into an integrated hotel, shopping, office, residential and recreational development. In 1983, the URA completed an urban design plan for the Central Area. This resulted in an orderly transformation of the city skyline and the creation of an impressive environment interwoven with the historical, architectural and cultural heritage of the older parts of the city.
1991: CONCEPT PLAN
By 1989, the Central Area Business District was also almost fully developed. In 1989, the URA merged with the Planning Department and Research & Statistic Unit of the Ministry of National Development, and a new URA emerged. It became the national planning and conservation authority, with greatly expanded resources to guide the physical development of Singapore into the year 2000 and beyond. The challenge for urban planning in the 1990s was a more qualitative one as Singapore strove to be the first developed city on the equatorial belt, with its own identity distinct from cities in the west. To achieve this, a major review of the 1971 Concept Plan was undertaken and completed in 1991. It stressed quality, identity and variety when planning for a population of 4 million.
2001: CONCEPT PLAN
The vision of The Concept Plan 2001 is to develop Singapore into a thriving city in the 21st century. It is based on a population scenario of 5.5 million and sets the vision for the next 40 to 50 years. Key proposals include new housing in familiar places, high‐rise city, more choices for recreation, an extensive rail network and focus on identity.
Slums of Delhi
October 2011 Page 144
12.7 CONCLUSION
The reduction of slum populations is an important issue affecting almost one billion people globally. Whether it is redevelopment or resettlement – depending on the specific requirement of a particular slum, either one or the other approach needs to be followed. In order to formalize the UN approach towards slum reduction “Millennium Development Goal 7 (target 4)” was introduced in the year 2000 to improve living standards for one hundred million people living in slum conditions (Kirk and Potekhin 2010). While MDG targets to reduce slum settlements have been successful, it is clear that substantial efforts are still required to improve the plights of hundreds of millions worldwide. The unequal progress of regions and particular need for improvements in Africa, Caribbean and Pacific States demonstrates a clear necessity to refocus on slum rehabilitation. In order to achieve this goal, it is essential local levels of government be empowered and take leadership. Being closer to the general public they are better placed to deal with issues at the local level and to deliver services. With specific local knowledge, these are the bodies most familiar with local issues; they know the particular development challenges of their area and are more cost effective and efficient.
Similar to the case of Dharavi, many of the slum rehabilitation projects in developing countries generally stuck up at design,conceptualization and initial stages and not pick up the way they are planned. On the face of it,these projects look extremely lucrative for delelopers as in a slum rehabilitation project,the biggest cost head,land,comes free.A developer is expected to build houses for the slum dwellers and in return get a portion of the total space for development which it can sell at market rates.The developer gets higher floor area ratio (FAR),that is permission to build more floor area on a piece of land in a slum redevelopment project,and thus books higher margins in these projects. However,the return on these projects is qualified by the fact that there are huge payouts as too many parties are involved. Also, such projects are hardly funded by financial institution. It is tough to execute such projects as they are generally required to have the consent of more than two third of the slum dwellers. On top of that,such resettlement projects face opposition from political interests as well as voluntary organizations because of associated humanitarian and livelihood issues of the slum dwellers.
The five case studies presented in the previous section of this paper have been selected in such a way that they present different types of strategies adopted, processes followed and obstacles faced while trying to introduce and implement slum interventions‐either resettlement, or redevelopment, or both. It is fairly clear from the examples that whenever the basic strategic priciples of slum urgradation are not properly followed, such initiatives tend to lose the support of slum dwellers as well as get stuck in political and institutional challenges. Therefore a properly designed strategy that encourages the participation local residents in each stage of project implementation process and which maintains a co‐ordinated approach among different stakeholders, is extremely important for the success of any slum rehabilitaion intervention.
COST BENEFIT FRAMEWORK AND REHABILITATTION STRATEGY
This document is intellectual property of Centre for Global Development Research Private Limited, New Delhi prepared with the help of SER Grant extended by the Planning Commission of India. No part of the document can be copied without a written permission of CGDR
Page 145
Chapter 13
Cost Benefit Framework and Slum Rehabilitation Strategy The word slum has been used to identify the poorest quality housing, and the most unsanitary conditions; a refuge for marginal activities including crime, ‘vice’ and drug abuse; a likely source for many epidemics that ravaged urban areas.1 In developing countries, the word ‘slum’ simply refers to settlements which are informal, heavily populated, with lower quality housing and poor human living conditions.
As discussed in previous sections the living condition of slums dwellers is inhumane and they deserve a better life. These are poor people and poverty is curse. Therefore, slums are the most visible manifestation of urban poverty. Such settlements may or may not have permanent structure but, they all lack basic amenities of clean water, toilets, cooking space, sanitation and other basic services. The living places are overcrowded with large number of family members accommodating in small houses.
The existences of slums defy the development claim and progression of city in to twenty first century. It symbolizes rising inequality and poor planning process of urbanization. Therefore, two pronged policy is needed. On the one hand the existing slums must be developed and rehabilitated to bring the slum dwellers in to the mainstream of life style and on the other hand efforts are needed to be made with adequate provisioning of shelter for incoming migrants to avoid buildup of new slums.
1 UN‐HABITAT URL: http://www.unhabitat.org/downloads/docs/4625_51419_GC%2021%20What%20are%20slums.pdf
Slums of Delhi
October 2011 Page 146
13.1 COST BENEFIT FRAMEWORK AND RATIONALE FOR SLUM REHABILITATION STRATEGIES
Why society and its representative, the government is obliged to take care of slum dwellers is a moot question. The answer to this question can be given by applying the philosophy of cost benefits analysis to the idea of slum rehabilitation and the very process of slum formation. In order to understand the costs and benefits of rehabilitation of slum dwellers several social and economic factors needs to be analysed and evaluated. At times many of these factors would be difficult to quantify requiring a separate study in its own right. However, the discussion in previous chapters and the survey results have revealed the various issues that shadow a broad spectrum of costs and benefits to society in the context of slums. Some of these issues need discussion in order to appreciate the problem in right context.
One of the critical requirements of a comprehensive cost benefit analysis is to decipher all the elements of costs foregone and benefits accrued to society in its entirety. It would also have to predict ex‐anti the ex‐post benefits of certain acts desired to be carried out to increase the efficiency of human resources available in slums. Similarly, it has to factor in the value of land and its opportunity cost on which slums exist. The existences of slums also lead to cost in terms of insecurity of neighbouring population, and benefits in terms of cheaper labour for a number of services to organisations and individuals. Besides, there are several other mundane issues discussed below.
When such a slum is rehabilitated, the reduction in criminal activities would become part of benefit stream while benefits of labour supply would also get enhanced. Resettlement in a clean, hygienic environment brings down the incidence of disease and hospitalization leading to lesser out of pocket expenditure on medical services and reduced pressure in the public health facilities. The children will have a proper environment to pursue their studies and on the top of it, the slum dwellers attain a dignified social status. The benefits could be well visualised from the residents of existing resettlement colonies. Therefore, in order to do justices to the cost benefit analysis it is desirable to take into account all shadow costs and shadow benefits which are sometime qualitative in nature requiring an extensive survey of both, the existing slum dwellers and slum dwellers in resettlement colonies. For measuring the qualitative part of the costs and benefits appropriate econometric tools may be used for quantification to arrive at the total benefits against the total costs. However an attempt has been made in Section 13.10.2 to arrive at a direct costs and benefits of a hypothetical slum resettlement scheme.
13.1.1 SOCIAL RESPONSIBILITIES OF GOVERNMENT AND ROLE OF SLUMS
Three social objectives of government are paramount: (1) Food for all to survive; (2) shelter for all; and (3) clothing for all. Further if majority of such needy people belong to disadvantaged groups such as socially deprived or landless or economically distressed, the responsibility of government increases. There are several programs of the government which tend to or at least appear to target such people for extending benefits. The expenditures meant for such programs are in fact shadow values of any act that meets these objectives. The entire objectives would be automatically fulfilled if all hands have job and means to earn. Such large numbers of jobs are available in urban centres but the cost of living in urban centres is too high to afford. It is in this context that the role played by the slums as facilitator of affordable livelihood becomes extremely important, and this makes it eligible for credit of several benefits to its residents. Ironically, expansion of slums is a conduit towards this objective but living conditions in slums are pathetic and crowded. All social

COST BENEFIT FRAMEWORK AND REHABILITATTION STRATEGY
This document is intellectual property of Centre for Global Development Research Private Limited, New Delhi prepared with the help of SER Grant extended by the Planning Commission of India. No part of the document can be copied without a written permission of CGDR
Page 147
and physical inconveniences caused to the slum dwellers in carrying out their objective of improving life style amounts to benefit reducing cost in social cost benefit framework of analysis. This means in absence of these inconveniences the slum dwellers would have done better. So, there is benefit foregone by not providing the amenities.
13.1.2 CONTRIBUTION OF SLUM TO PRIVATE SECTOR AND RESPONSIBILITY OF PRIVATE SECTOR TOWARDS SLUM
REHABILITATION
In the first place the built up of slum must not be allowed. If it can be stopped, the influx of rural population towards urban centres would be market determined at market price. The presence of slums distorts the market price of labour, which might help in augmenting the profits of private sector. The labour cost in absence of slums is likely to be much higher due to higher cost of living. This could result in loss of competitiveness of firms. In that sense not only the government, but the agents of nearby job market should also contribute in rehabilitation of slum dwellers who have served in meeting the business objectives.
13.1.3 SLUMS ACT AS NATURAL GROWTH CENTRE FOR POOR
The analysis indicates that the location of slums are strategically and spontaneously determined through an invisible hand where there are avenues for earning livelihood and all other resources which help in cutting cost of living, are approachable. This increases the affordability of the slum dwellers and helps in multiplying their wellbeing more speedily than it would have been possible otherwise if thrown to market forces. Thus, slums work as natural growth centre for the poor. If this hypothesis is accepted then the ambiance of slum life should not be altered while designing the rehabilitation. Any disturbance may result in some cost and possibly some benefit in carrying the livelihood. However, this would also depend on the individual choices and the values, an individual household would place on each of such factor. Indirectly, this means the slum rehabilitation should have pragmatic approach in terms of availability of employment, approachable distance and affordable cost of living. In absence of such possibilities, slum dwellers are less likely to move.
13.1.4 SLUM DWELLERS HAVE GONE A LONG WAY, NOW THEY NEED AT LEAST A SMALL BUT MODERN SHELTER
WITH BEST AMENITIES
A modern and hygienic shelter for migrant labour would result in social gains due through reduction in illness and resulting loss of labour hour; better home environment resulting in increased work efficiency; better education of children, resulting in enriched human capital for future; and better citizenry resulting in reduced crime and discontent. Quantifying these benefits require more extensive survey of existing slums as well as the resettled colonies.

Slums of Delhi
October 2011 Page 148
About 14.1 per cent of total population of Delhi is living in slums for generations. Some of the slums are reportedly in existence for more than 90 years now. It is now high time to give emphasis on the millennium development goal target which promises a slum free society. ‘Right to shelter’ should be treated as a fundamental right for the citizens as has been promulgated in several other countries. A proper shelter in a hygienic environment with basic amenities could spell wonders for all round development of the disadvantaged groups living in dingy, unhygienic and unhealthy environment.
13.2 SLUM REHABILITATION: LESSON FROM GLOBAL EXPERIENCE
Increasing population of people residing in slums is a global problem. Several developing and developed countries are either facing this problem or they have faced it at one time or the other. The global experience refleted through five case studues discussed in Chapter 12 leads to several possibilities including development of locality, in‐situ resettlement and relocating with better accomodation. Whether it is redevelopment or resettlement – depending on the specific requirement of a particular slum. It has been experienced that it is essential that local levels of government be empowered and take leadership. Being closer to the general public they are better placed to deal with issues at the local level and to deliver services.
Many of the slum rehabilitation projects in developing countries generally stuck up at design, conceptualization and initial stages and not pick up the way they are planned. Two such cases are sighted in Chapter 12, one being that of Dharavi, Mumbai where developers are being engaged leading to several complications and other is the case of Kibera‐Soweto slum‐upgrading project in Nairobi. Compared to these projects the case of Singapore looks simple, where government itself took on itself to provide house for all and an exemplary success has been recorded in literature after literatute.
There is another important lesson with regards to participation of communities and local leadership at all level of planning, and execution. Transparency and commitment are the hallmark of success in such projects. It is fairly clear from the examples that whenever the basic strategic priciples of slum urgradation are not properly followed, such initiatives tend to lose the support of slum dwellers as well as get stuck in political and institutional challenges. Therefore, a properly designed strategy that encourages the participation of local residents in each stage of project implementation process and which maintains a co‐ordinated approach among different stakeholders, is extremely important for the success of any slum rehabilitaion intervention.
However, above all the success of the project would be determined by the net benefit to the slum dwellers. If they feel that the offer made in terms of resettlement is inferior proposition in terms of living conditions, it cannot be sold to them. Clearly, the living condition is linked to space offered to them, in‐house amenities like water, toilet and other infrastructure. To provide all this, use of available land has to be maximized by using vertical space. Several real estate developers and market analysts feel that it’s the FSI norms need to be relaxed from current level of 1‐3 to 10‐50 and let India to grow the vertical way as has happened in Singapore, Bangkok, Malaysia, Beijing, Shanghai, and other major cities of the world. It will increase the use of land many fold and allow construction of spacious houses for all purposes. The entire economics would be transformed. Singapore could eradicate slums only by vertical and spacious constructions, which were acceptable and livable. Make shift ideas and arrangements tend to fail.

COST BENEFIT FRAMEWORK AND REHABILITATTION STRATEGY
This document is intellectual property of Centre for Global Development Research Private Limited, New Delhi prepared with the help of SER Grant extended by the Planning Commission of India. No part of the document can be copied without a written permission of CGDR
Page 149
13.3 COMPLEXITIES INVOLVED IN REHABILITATION STRATEGIES
Discussions in previous chapters, particularly the diversity in background of slum dwellers, reasons of migration, job profile, distances of work place, income and consumption patterns and their capacities to pay, all of these make rehabilitation and development of slums a complex project. On top of this the profile of all slums is not alike, some are small, some are large, some are located near railway line, some are located by the side of canals, even inside powerhouses and within busy market places and residential areas. Each slum and has to be planned individually or in small groups for rehabilitation. Further the global experience indicates that a variety of options are available from in‐situ rehabilitation to improvement and relocation. All options should be open for analysis. Besides these broad based issues there are several specific issues that need attention, which can be broadly classified in to two groups, community level complexities and slum level complexities as discussed below.
13.3.1 Community related Complexities in Rehabilitation Project
Any slum development or rehabilitation programs requires that the people involved are well informed, and participate in discussions such that most acceptable option can be worked out. Therefore, the biggest challenge of any such project is to take on board the community at large through transparency, honesty of purpose, faith and confidence.
DIVERGENT INTERESTS AND ASPIRATION OF SLUM DWELLERS
Even while most people in slum belong to similar stratum of living condition, their interests and aspiration may be at variance. They are expected to raise unique issues and inhibitions. Their political and social affiliations may lead to conflicting paths. To find out the most acceptable solution is therefore, a matter of high social skill supported by data generation and data analysis.
DIFFERENCES IN CAPACITIES TO PAY
The willingness to pay analysis, the costs incurred in acquiring slum dwellings across regions and the structure of houses possessed by the households indicate wide variation in the financial capacity of slum dwellers. This, coupled with variation in aspirations, each dweller would like to have best possible accommodation when it available with huge subsidies. The marginal return to willingness to pay would be higher if they opt for better house even if the contribution is many times more than average. This opening to choice can be exploited to obtain a win‐win situation by offering different types of accommodations with different rates of contribution by the slum dwellers.

Slums of Delhi
October 2011 Page 150
OWNERSHIP AND SIZE OF DWELLINGS
It is important to fix the ownership of the slum dwelling a priory on a particular date to avoid unending claims. Several residents are tenants and it is possible that some of them are residing there for a very long time and fit well with beneficiaries but inclusion of such persons any results in huge manipulation and conflicts. All such issues need to be settled first and before actual process of rehabilitation program.
VESTED INTERESTS
Market forces may not always work in the interest of slum dwellers and therefore leaving them to market would be detrimental to rehabilitation plan. City land is costly and scarce and it provides ample opportunity for those who have vested interest and profit motives. Therefore, a more transparent system with adequate government intervention and participation of NGOs and local community may be essential.
GHETTO TENDENCIES AND UNWILLINGNESS OF MAINSTREAM POPULATION TO ACCEPT THE REALITY OF
REHABILITATION SOCIETIES
Despite being good human being and highly useful in day to day life the slum dwellers are not preferred neighbours. This leads to ghetto tendencies whereby general public avoids taking possession in same society where slum dwellers are planned to be rehabilitated. This reduces the attractiveness of mix development plans where part of the society can be sold at premium. However, by ensuring that the accommodation designed is world class with best architectural concepts, this problem can also be overcome.
13.3.2 Slum Cluster related Complexities in choice of Rehabilitation Scheme
There are three widely used options for the rehabilitation and resettlement approach: (1) resettlement outside the present site in the outskirts of the city (2) in‐situ rehabilitation and (3) improving the living condition of slum dwellers by providing better infrastructure, amenities and other facilities. Here the discussion is concentrated on the first two options as third option is essentially of damage control type, may not be a long term self sustaining solution and is also a proposition with poor utilisation of otherwise scarce land resource. Of the first two options there is growing consensus that in‐situ rehabilitation is least disturbing and should be preferred. However, while taking up a specific slum for rehabilitation / up gradation it is required to answer a mundane questions with respect to each slum; is it possible to rehabilitate the concerned slum in the same location by providing them with liveable accommodation? Whether, geographical location of the slum, ownership status of the land, environmental factors, size of slum allows such rehabilitation. Whether the prevailing conditions can be modified to allow in‐situ rehabilitation? In case possibility of in‐situ rehabilitation is ruled out then what is the most desirable second best option which create least disturbances in slum dwellers livelihood. Taking such decision must be relied on sufficient data based analysis and adequate participation of community.
OWNERSHIP OF LAND
The land occupied by slum dwellers belong to a variety of organisation although most of them are departments of the central or state governments. Many of the slums are located on land belonging to Railways, while others on New Delhi Municipal Corporation, Delhi Government, etc. Transferring the land
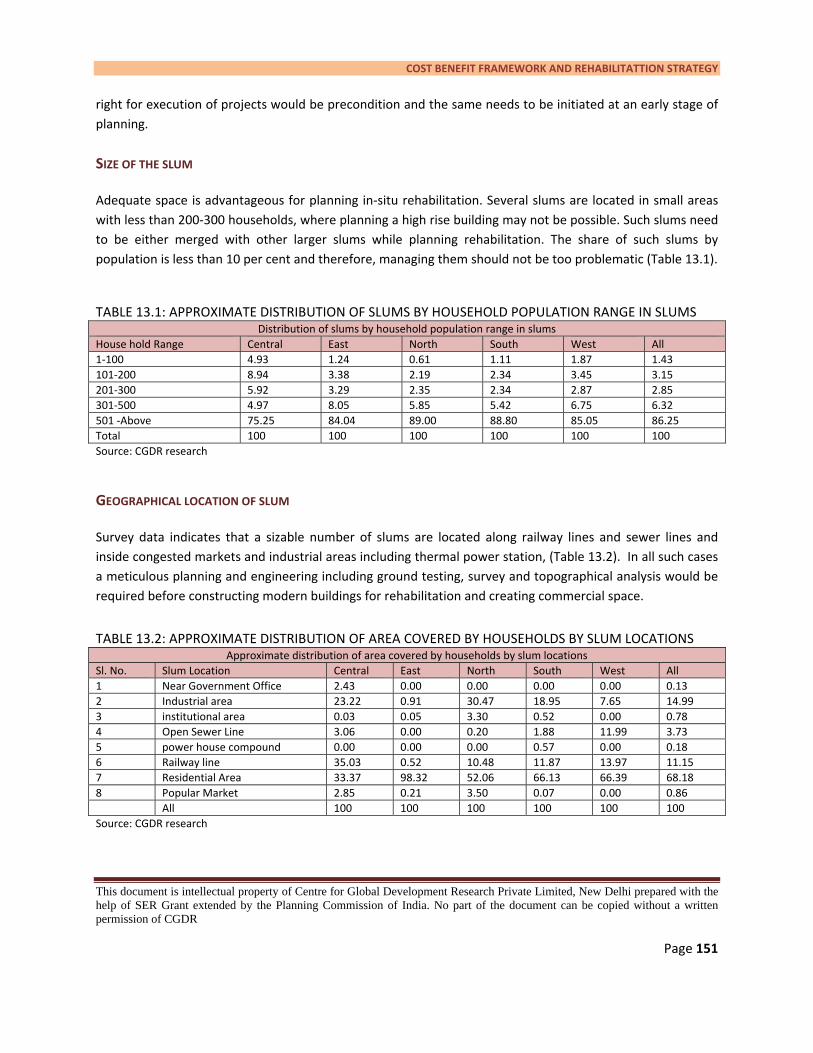
COST BENEFIT FRAMEWORK AND REHABILITATTION STRATEGY
This document is intellectual property of Centre for Global Development Research Private Limited, New Delhi prepared with the help of SER Grant extended by the Planning Commission of India. No part of the document can be copied without a written permission of CGDR
Page 151
right for execution of projects would be precondition and the same needs to be initiated at an early stage of planning.
SIZE OF THE SLUM
Adequate space is advantageous for planning in‐situ rehabilitation. Several slums are located in small areas with less than 200‐300 households, where planning a high rise building may not be possible. Such slums need to be either merged with other larger slums while planning rehabilitation. The share of such slums by population is less than 10 per cent and therefore, managing them should not be too problematic (Table 13.1).
TABLE 13.1: APPROXIMATE DISTRIBUTION OF SLUMS BY HOUSEHOLD POPULATION RANGE IN SLUMS Distribution of slums by household population range in slums
House hold Range Central East North South West All 1‐100 4.93 1.24 0.61 1.11 1.87 1.43 101‐200 8.94 3.38 2.19 2.34 3.45 3.15 201‐300 5.92 3.29 2.35 2.34 2.87 2.85 301‐500 4.97 8.05 5.85 5.42 6.75 6.32 501 ‐Above 75.25 84.04 89.00 88.80 85.05 86.25 Total 100 100 100 100 100 100 Source: CGDR research
GEOGRAPHICAL LOCATION OF SLUM
Survey data indicates that a sizable number of slums are located along railway lines and sewer lines and inside congested markets and industrial areas including thermal power station, (Table 13.2). In all such cases a meticulous planning and engineering including ground testing, survey and topographical analysis would be required before constructing modern buildings for rehabilitation and creating commercial space.
TABLE 13.2: APPROXIMATE DISTRIBUTION OF AREA COVERED BY HOUSEHOLDS BY SLUM LOCATIONS Approximate distribution of area covered by households by slum locations
Sl. No. Slum Location Central East North South West All 1 Near Government Office 2.43 0.00 0.00 0.00 0.00 0.13 2 Industrial area 23.22 0.91 30.47 18.95 7.65 14.99 3 institutional area 0.03 0.05 3.30 0.52 0.00 0.78 4 Open Sewer Line 3.06 0.00 0.20 1.88 11.99 3.73 5 power house compound 0.00 0.00 0.00 0.57 0.00 0.18 6 Railway line 35.03 0.52 10.48 11.87 13.97 11.15 7 Residential Area 33.37 98.32 52.06 66.13 66.39 68.18 8 Popular Market 2.85 0.21 3.50 0.07 0.00 0.86 All 100 100 100 100 100 100 Source: CGDR research
Slums of Delhi
October 2011 Page 152
13.3.3 Problem of Transit Accommodation
One of the major problems in developing slum area in to high quality residential complex is to provide temporary shelter for the residents for the period of construction. The government has to be extremely practical and strategic in locating such areas.
13.4 PRECAUTIONS REQUIRED IN SLUM DEVELOPMENT PROGRAMS TO AVOID DEFEATIST OUTCOME
Discussion in previous chapter has revealed that most often than not, in slum rehabilitation projects, the slum dwellers are at the receiving end and in several case because of ill conceived projects, they end up only moving from the devil to the deep sea. Relocation sites often provide less access to basic amenities than the original slum clusters. Many a times, there is compromise during actual implementation by the builder is in terms of quality of construction, design, ventilation, sanitation and hygiene and basic amenities. Therefore, some of the key issues concerning slum rehabilitation and redevelopment processes can be summarised as follows and, at the outset it is suggested that proposals in this report stand clear of such problems by avoiding congested housing and offering spacious flats.
13.4.1 AVOID HORIZONTAL SLUMS GETTING CONVERTED INTO VERTICAL SLUMS
If the new accommodation is not well planned with adequate amenities, open spaces, provisioning of maintenance and ecosystem, the entire plan can land in to a vertical slum defeating the very objective of the resettlement project.
13.4.2 AVOID LACK OF PLANNING IN PROVISIONING OF BASIC ECO SYSTEM SUCH AS LIGHT AND VENTILATION
Often new accommodation for slum dwellers are designed without much consideration of health and hygiene, confined to very small space for accommodation as well as common corridors. This again leads to the same allegation of converting horizontal slums in to vertical ones.
13.4.3 AVOID NON‐DURABLE QUALITY OF MATERIALS USED AND POOR CONSTRUCTION QUALITY
Poor construction material is another problem. The cost cutting and profit maximisation objective prevail over the humane considerations. The mindset that the slum dwellers are being doled out subsidised accommodation which any way would be better than the existing houses may dominates the planning process of developers. In absence of buyer‐seller relationship the quality runs the risk of getting compromised and it is here that strong intervention from the government is required to audit the quality by independent agencies. If such monitoring is not done and quality is allowed to be compromised, the condition of the housing complex would very soon deteriorate to the extent that it may end up with vertical slum.

COST BENEFIT FRAMEWORK AND REHABILITATTION STRATEGY
This document is intellectual property of Centre for Global Development Research Private Limited, New Delhi prepared with the help of SER Grant extended by the Planning Commission of India. No part of the document can be copied without a written permission of CGDR
Page 153
13.4.4 AVOID IGNORING THE BASIC REQUIREMENTS OF SLUM DWELLERS
The quality and adequacy of the basic amenities and infrastructure is another area of risk where slum dwellers may feel vulnerable. The project planning has to insure the adequacy of infrastructure such as road, street light, parks, shopping centre, school, dispensary etc. In terms of basic amenities, all houses must have separate toilets and cooking space of good quality. The architectural design must be obtained through a national competition.
13.4.5 AVOID SHIFTING OF FINANCIAL BURDEN ON THE INHABITANTS DUE TO RELOCATION/ REHABILITATION
Shifting of the slum dwellers should be the second best option as compared to in‐situ rehabilitation. In case of shifting, the extra burden of livelihood may be so exorbitant that slum dwellers may be worse off and the entire project of rehabilitation could lead to be counterproductive.
13.5 ALTERNATIVE APPROACHES TO REHABILITATION
In Chapter 12 a brief discussion on five slum upgrading and rehabilitation projects were discussed – one from India and four from other developing countries which have mixed experience. The Draft National Slum Policy of India requires all States/ULBs must draw up comprehensive resettlement and relocation guidelines for urban dwellers and all relocation or settlement of dwellers residing in untenable sites shall be implemented strictly in accordance with such guidelines which should ensure that:
1. Alternatives to resettlements should be fully explored before any decision is taken to move people.
2. Relocation distances should be minimised to reduce the impact on livelihoods.
3. Resident dwellers must be provided with some choice of alternative sites and where feasible, an alternative rehabilitation package.
4. All resettlement sites should be adequately serviced and provision should be made for public transportation prior to settlement.
5. The livelihoods of affected people must be sufficiently compensated within a fixed period.
Slums of Delhi
October 2011 Page 154
6. Participation of primary stakeholders, particularly women, in planning and decision making is a pre‐requisite for any resettlement process.
7. Women’s particular needs and constraints must be specifically addressed.
8. Any urban development projects that lead to be involuntary resettlement of communities, must make provision to cover the costs of R & R.
9. All stages of the resettlement process including the transition and follow‐ up periods should be closely monitored and supervised by the ULB with community representatives. (Also see section 16 on monitoring and evaluation).
In line with the central policy, several Indian states are attempting rehabilitation in various ways. Almost all major state including, Gujarat, Bihar, Orissa have brought out slum policy with attractive propositions or they have some kind of housing policy for urban poor.
GUJARAT
In March 2010, the Gujarat government announced new slum rehabilitation and development policy which prescribes the rules for private developers willing to develop slums on commercial basis. The new policy promises a two room housing dwelling attached with bath room and a kitchen to each slum dweller family residing in the government identified slum areas for 10 years in the state. As per the policy, the private player, who wants to develop the project, will have to get all the clearances and approvals from the various state government agencies involved. And will be responsible for creating necessary infrastructure like community centre, school, roads, drainage, electricity, drinking water and other facilities in the area. Such private developer will get benefits like building commercial shops in 25 per cent of the total area in the ground floor and would be able to exchange higher FSI (floor space index) of one plot to another.
ORISSA
Orissa has come out with Slum Rehabilitation and Development Policy (SRDP) which proposes in partnership with the private sector, rental accommodation for migrant labourers to reduce future slums. The SRDP has proposed rehabilitation houses in the rehabilitation area ordinarily in a G+3 configuration and all housing will have in‐house water linked to municipal supplies; private toilets linked to underground sewerage, where available, or septic tanks or sanitation units; power supply; and appropriate drainage for household wastewater. Adequate community facilities, such as access roads with street lighting and linked to main streets, covered drainage, solid waste disposal sites, courtyards and common play areas, preschools, health clinics, parking sites for carts/rickshaws. The policy also outlines need for transit accommodation, which has to be built by the developer with minimum standards specified. Very interestingly, the policy advocates transfer of rights to slum dwellers of rehabilitation houses in the joint name of the woman and man in the household.
COST BENEFIT FRAMEWORK AND REHABILITATTION STRATEGY
This document is intellectual property of Centre for Global Development Research Private Limited, New Delhi prepared with the help of SER Grant extended by the Planning Commission of India. No part of the document can be copied without a written permission of CGDR
Page 155
There is one commonality in above proposal and that is that houses for slum dwellers are being conceived with in‐house facilities of toilet and water and adequate infrastructure to sustain the pressure of population and livelihood means including parking space for cycle rickshaw, or other vehicles. However all of them are low rise housing schemes and none of them could be projected as model for Delhi. The problem of metropolitan city like Delhi is compounded due to shortage of land, which often leads to compromise of the quality of housing offered to slum dwellers. The failure of Slum settlement projects in Mumbai discussed in Chapter 12 is eye opener. Compromise on the quality of housing is not going to be acceptable by the slum dwellers.
DELHI
The city development plan for Delhi, 2006 outlines the approach of the government towards areas notified as Slums under the Slum areas Act 1956. The strategy has been three pronged (i) Clearance/Relocation; (ii) In‐situ up‐gradation; and (iii) Environmental Improvement Schemes. Clearance / relocation has been the mainstay of the policy towards the squatters and JJ clusters. The program of squatter clearance was discontinued at the end of the sixth plan (1980‐85). The clearance program has been initiated again in 2005. The general policy adopted by the government has been two fold (i) No new encroachment shall be permitted on public land and (ii) Past encroachments viz. those in existence up to 1990 would not be removed without providing alternatives. However, in practice, relocation is carried out for those JJ clusters and slums that are required for public interest projects.
According to information placed at the Delhi Development Authority (DDA) official website2 MOUAE Policy orders/guidelines indicates the following:
(1) Existing slums/JJ clusters ought to be ameliorated by a judicious mix of relocation and in‐situ development (July 2003)‐MOUD&PA guidelines for MPD‐2021.
(2) MOUAE directions vide D.O. letter no.K‐20014/5/96‐DDIIA dated 29.1.97 include (a) DDA to supply 10 per cent of residential land to Slum Department, MCD at pre‐determined rates for facilitating relocation/resettlement of JJ dwellers; (b) Further, at least 20 per cent of all flats shall be for EWS with maximum plinth area 25 sq m; and (c) Another 20 per cent of flats to be constructed by DDA for LIG with plinth area between 25 to 50 sq m. The estimates committee has recommended to the government to increase 10 per cent of residential area for Slum/JJ Rehabilitation to 20 per cent
2 http://dda.org.in/planning/slums_jj_rehabilitate.htm downloaded: 11‐07‐2011
Slums of Delhi
October 2011 Page 156
(3) MOUAE letter dated 17.1.2001: There is only one Government policy and one approved pattern of resettlement, i.e. allotment of 18 sq m. built up space to pre‐1990 squatters and 12.5 sq. m. to post‐1990 but pre‐1998 squatters. Any other procedure and pattern of development would be violation of Government order and its policy and would be administratively and financially irregular. The duality of treatment is not to be accorded, under any circumstances, to any case involving clearance and resettlement.
(4) As per MPD‐2001 for Slum re‐housing an indicative 3 per cent of total housing target is proposed, with another 25 per cent of housing is to be provided through site and services. As per modification in MPD 2001 vide notification dated 15.5.95, a minimum size of resettlement of JJ plot is 25 sq. m. which may be reduced to 18 sq m with 100 per cent coverage provided 7 sq. m. per plot is clubbed with cluster open space.
(5) The following land have been earmarked by the DDA for Slum & JJ rehabilitation: Dwarka: 56 ha; Rohini: 53 ha; Narela: 41 ha; and Bakarwala: 24 ha. DDA also issued NOC for acquisition and development of land for Slum & JJ rehabilitation at the following locations: Bawana: 100 acres, Holambikalan: 70 acres, Bhalaswa: 200 acres, Savda/Ghevra: 257 acres, and Kadipur: 65 acres. DDA also took up the following schemes for providing Slum & JJ transit camps/rehabilitation: Madanpur Khadar Ph‐I: 12.52 ha. ‐ 3174 plots; Madanpur Khadar Ph‐II: 27.35 ha. ‐ 5058 plots; Madanpur Khadar Ph‐III: 9.6 ha. ‐ 2252 plots; and Hastsal 17.43 ha. ‐ 3962 plots. DDA has also constructed 2016 tenements and 500 shops in an area of 7 ha in Sector 4A of Rohini Project. NOC has been issued to Slum & JJ Department for acquisition of 692 acres at Bawana, Holambi Kalan, Bhalswa, Savda/Ghevra & Kadipur. Land proposed for new Slum/JJ resettlement by DDA include Rohini Ph.IV/V: 20 ha; Dwarka Ph.II: 25 ha; Narela: 25ha; Total: 70 ha for 14,000 DUs @200 ppha.
In 2007, Delhi government came out with a very ambitious and massive rehabilitation program under the flagship name of Rajiv Ratan Awas Yojana (RRAY) for the resettlement of squatter families in Delhi. Under the new policy, Delhi Government has proposed to provide built up flats instead of plots to slum dwellers, and economically weaker sections (EWS). These flat were to be constructed, consisting of two rooms, a bathroom and kitchen and with a floor area of 25 square meters. The cost of the flat is about 2.0 lakh and half of it would be borne by the government, and loans would be arranged for the rest, repayable over 15 to 25 years. Licenses would be issued in the joint names of husband and wife for an initial period of 15 years. The eligibility criteria for a flat under the RRAY are that the applicant must have a household income of about INR. 60,000 and should be a resident of Delhi since 1 January 1998. Cost of infrastructure is to be shared by the central government and the state government equally, while cost of the land is to be borne by the state government
Since the start of this program thousands of three‐storied EWS flats have been constructed by Delhi State Industrial and Infrastructure Development Corporation (DSIIDC) Bawana, Narela, Bhorgarh and Baprola under the Rajiv Ratna Awas Yojna but allotment has been made to not even 500 families. The urban development department is yet to identify eligible slum dwellers. The cut‐off date for the eligibility of slum dwellers has been constantly changing from 1998 to 2002 and then to 2007. The income criteria have also been revised.
The resettlement area is very remote and lacks in connectivity to the main city and residents have to walk several kilometers to get to schools, hospitals, dispensaries and markets. It is reported that due to absence of employment avenues families are reluctant to continue in these resettlements. The mess around resettlement was attributed to the MCD and its Slum and JJ Department. Consequently, in July 2010, its functions are transferred to the newly‐created Delhi Urban Shelter Improvement Board (DUSIB) but no great sign of progress is visible yet. The website of DUSIB is poor in information content.

COST BENEFIT FRAMEWORK AND REHABILITATTION STRATEGY
This document is intellectual property of Centre for Global Development Research Private Limited, New Delhi prepared with the help of SER Grant extended by the Planning Commission of India. No part of the document can be copied without a written permission of CGDR
Page 157
13.5.1 Summary of Basic Methods of Rehabilitation and Experiences
The experience suggests that addressing the issue of rehabilitation & up gradation of slums for achieving the Millennium Development Goal towards a slum free society is not an easy task to achieve and huge amount of commitment is needed to fructify the ideas. Several complexities and issues need to be resolved while planning for a viable rehabilitation strategy. There are two major options for the rehabilitation and resettlement approach:
(1) Resettlement outside the present site in the outskirts of the city
(2) In‐situ rehabilitation in reconstructed housing or improved housing
Resettlement in the out skirts of the city would involve addressing vital issues of employment opportunities for those who are engaged as household help, self employed like electricians, masons, carpenters or running small business or informal industrial units including leather, pottery, textiles, food production like bakery & confectionery , garbage collection and recycling manufacturing units like welding, carpentry; providing for infrastructure & amenities, facilities for children seduction, health and so on.
Considering the employment avenues, in‐situ rehabilitation is desired alternative but a sizable number of slums, which are located closer to railway lines and severe lines, are not good cases for in‐situ rehabilitation. However, such slums can be merged with other slums for rehabilitation. Whether, in‐situ or outside rehabilitation there are four broad alternatives that has been practiced globally as also in Delhi:
(1) Give a small plot of land to the slum dwellers, which ensure land title enabling them to get loan to construct affordable better house;
(2) Give land ownership right to the existing slum dwellers as and where they are basis and allow then to build affordable houses while government providing the infrastructure. This is also known as Tokyo Model.
(3) Construct small flats with common amenities in low rising building and allocate such flats to slum dwellers; and
(4) Construct very high rise buildings and give spacious flats to slum dwellers at affordable cost/ rent. This also known as Singapore Model

Slums of Delhi
October 2011 Page 158
(1) EXPERIENCE WITH PLOT BASED REHABILITATION
Examples of first alternative are many in Delhi. In Delhi, following the slum areas Act 1956, JJ resettlement, relocation schemes were started in 1960. The scheme began with the allotment of two room tenements to 3,560 JJ households. Subsequently, partially developed plots of 80 square yards were allotted under the scheme to the squatters on a nominal rent. However, due to increasing demand of land in Delhi, the size of plots was reduced first to 40 square meters and then 22 square meters.
In 1974 government adopted vigorous strategy for rehabilitating slum dwellers in resettlement colonies, viz. Kalyan Puri, Trilok Puri, Khichri Pur and Himmat Puri, Seelampur, Welcome colony etc. in East Delhi. Each slum household was provided with a plot of land measuring about 22 square yards. These colonies initially had no sewer lines. The slum dwellers had to build the house on their own with the materials collected from the demolished slum houses. Common Toilets were provided in each block and the residents had to install hand pumps to source water for drinking as well as other uses. Sewer lines were laid at a much later stage. The initial period was full of trauma and hardships in re‐establishing their livelihoods and social community ties.
Over time, however, these settlements have transformed into vibrant and most populous localities of Delhi. Many of these settlements have turned into multi‐storeyed buildings with residential cum commercial uses including renting, business, and small scale factories. The heights of these buildings are growing and already as high 4‐5 storeys can be spotted, while three storeys are common. The lanes have become congested and occluded with garbage and free flowing waste water.
During the above slum rehabilitation program provision were also made to provide shops, industrial sheds to the eligible slum dwellers in settlement colonies. The entire task of resettlement and rehabilitation was conducted by MCD and DDA. The values of such commercial spaces have appreciated several folds now.
Clearly, beneficiaries have made maximum possible use of the land given to them and for many of them it has become perpetual source of income through vertical expansions. This has happened due to fast growth of Delhi in terms of population and economics and the resulting land use pattern. Ex‐post analysis would reveal this to be one of most lucrative alternatives over time. However, considering the present day situation of land scarcity, it is neither feasible nor possible to provide alternative land in lieu of the present slum house.
Most recently, a sprawling slum known as Yamuna Pushta located at the banks of Yamuna was relocated to Bawana a wasteland on the city's outer fringes. It is reported that the number of families evicted was more than 27000 and evictees had to fight to lay claims for small pucca plinth of 18 square meters with a kitchen slab and a toilet is allotted to them. Six houses surrounding one common open courtyard is the layout for this settlement. The eligibility required proof of residence in the 'basti' on and before January 31, 1990 and a payment of INR 3,000 to become member of a cooperative society, which would entitle them to become leaseholders of their own house. However, Kalyani Menon‐Sen (2011) notes that the ousted people have become poorer in effect, while complications of owning a plot is increased.

COST BENEFIT FRAMEWORK AND REHABILITATTION STRATEGY
This document is intellectual property of Centre for Global Development Research Private Limited, New Delhi prepared with the help of SER Grant extended by the Planning Commission of India. No part of the document can be copied without a written permission of CGDR
Page 159
(2) EXPERIENCE WITH SPACE CONSTRAINED LOW RISING BUILT‐UP FLATS
As discussed in earlier chapter, slums in Mumbai are being redeveloped by the Slum Redevelopment Authority (SRA) which also a part of Mumbai Metropolitan Region Development Authority (MMRDA). If 70 per cent of the residents of a slum agree, a developer can redevelop their plot of land by constructing seven‐storey buildings where each family will get a flat measuring 225 sq ft free. The developer can use the remaining land to build commercial or residential spaces for sale. Simultaneously, the MMRDA has been resettling slum dwellers under the World Bank‐funded Mumbai Urban Transport Project (MUTP) and the Mumbai Urban Infrastructure Project (MUIP). In a recent presentation, T. Chandrashekhar (Chandrashekhar 2011) additional Metropolitan Commissioner, MMRDA reports that about 52728 tenements have been constructed under the three projects namely MUTP, MUIP, and SRA. It is not clear how many of these have already been transferred to beneficiaries. However, the MMRDA and SRA schemes are criticized by many for its bad quality of work. The problem is that the developers in these cases are only responsible for constructing the buildings and bother less about civic infrastructure such as drainage, water or sanitation. As a result, instead of horizontal slums, the scheme has successfully created vertical slums. Due to poor quality of construction and subsequent casual approach to maintenance, seepages start, lifts do not work and walls cave in.
Affordable housing under RRAY in Delhi
Delhi is experimenting with low cost housing under Rajiv Ratan Awas Yojana, announced in September 2007. Four‐storey and three‐storey blocks are constructed at the outskirts of city, consisting of (1) two rooms set with a bathroom and kitchen and with a floor area of 25 square meters; and (2) one room set with bath room and kitchen. Half of the cost of dwelling is shared by the government. As noted earlier only a few allotments have taken place but the residents are not happy. Water is supplied for not even one hour a day. People are distressed with the isolation, lack of amenities and poor connectivity, which is much worse than the city slum. There are no jobs for women; and commuting being costly men who work in city, come home only during the weekends. It is feared that the relocated families would be permanently trapped in poverty and all the advantage gained from migration to Delhi would be lost. The only hope is the Bawana and Bhorgarh industrial areas, which may increase the survivability of the resettles. In terms of quality of housing the walls have started peeling, roofs are leaking and seepage is leading to fungal growth. This is one of the major disadvantages of low cost houses. The maintenance cost may be unaffordable in course of time. In addition, because of low height, the carrying capacity of the land is drastically reduced compared to high‐rise strong and standard construction.

Slums of Delhi
October 2011 Page 160
(3) IN‐SITU IMPROVEMENT, TOKYO WAY
Give land ownership right to the existing slum dwellers ‘as and where they are’ basis and allow then to build affordable houses. This is the idea; every slum dweller would love to happen. After all, it would give them the most precious thing in Delhi, the land. This idea comes from those particularly in context of Dharavi and It is favoured by those who consider that the life style of slum dwellers and their livelihood pattern must be preserved. In slums like Dharavi for several people, home is also the work place with small‐scale, family‐type businesses for the owners and therefore, shifting them in better house without ensuring the continuity of the work would be impractical proposition. Thus, many would like to argue that Dharavi is not a mess, but quite on the contrary a highly sophisticated and efficient urban organism with vibrant traditions and culture. In such places, it may be efficient to retrofit infrastructure and let the people construct their own homes as they like.
Example of Tokyo is often sited and parallels drawn between Dharavi and Tokyo. Post war period, Japan Government could not provide home to massive influx of people in cities and therefore, allowed poor people to build their own affordable homes in an organic way and simply helps them with electricity, sanitation and amenities. Incremental development of homes would lead to Tokyo like situation which is characterised by low rises, high density, small buildings, and lots of pedestrians, narrow streets, very strong local interwoven economy, artisans and small businesses. All this is very empowering for poor people because they have a say in their future. Plus the economy develops from the ground up (Matias Echanove 2007)3.
Whether, Delhi needs to follow this model is questionable because the slum conditions here are not like Dharavi. The shelters are predominantly disconnected with the work place and there is no reason to believe that the Delhi slums have organic development and interwoven life style. However, walking through narrow but fully paved lanes of Tokyo is delight but that is an experience of rapidly grown economy with huge personal commitments of government officials and civil society.
Nevertheless, land is too scarce in Delhi and the pressure on land use would continue to grow for all times to come. City cannot afford to remain flat and congested. It must grow vertically to accommodate inflows of population from all over the country.
(4) SPACIOUS FLATS IN SKY SCRAPERS
Utilisation of vertical space with strong foundations has several advantages in cities where cost of land is very high and the population is increasing beyond control. Singapore experiment is not the only one such example of resettlement but certainly it is one of the most successful one. Accommodation in multi‐storeyed apartment is flexible as it can be made spacious, with centralised supply of water and electricity. Enough space is left for roads, hospitals, schools and other infrastructure. With larger space for accommodation, it is easier to negotiate with the slum dwellers to move out. In‐situ resettlement makes it more attractive. A detailed economic analysis presented in the following section would reveal that free accommodation as large as 800 square feet is possible if buildings are allowed to acquire sufficient height.
3 http://www.dharavi.org/H._Essays,_Studies,_Research_on_Dharavi/The_Tokyo_Model_of_Urban_Development

COST BENEFIT FRAMEWORK AND REHABILITATTION STRATEGY
This document is intellectual property of Centre for Global Development Research Private Limited, New Delhi prepared with the help of SER Grant extended by the Planning Commission of India. No part of the document can be copied without a written permission of CGDR
Page 161
In the case of Delhi, Raheja Developers Limited has been awarded the first of its kind in situ slum re‐development project at Kathputli Colony, spread over 5.22 hectares near Shadipur Depot, by the Delhi Development Authority. The project envisages construction of 2,800 EWS units and community services like multi‐purpose hall, Basti Vikas Kendra, Health Centre, Shishu Vatika etc for the families of Kathputli Colony and 170 high category apartments and a commercial complex for free sale. A transit camp will be set up within a radius of 3‐4 km from Kathputli Colony, to accommodate the families of Kathputli Colony. The transit camp, which is to be made by the DDA, is still awaited. After shifting of the families, the DDA will hand over the possession of the vacant plot for development and construction. Once construction is complete, these people will shift from their homes in the transit camp to the new 14‐storey building complete with lifts. Each dwelling unit will consist of two rooms, so as to provide residents with a private and a public space inside their flats. A kitchen, a separate bathroom and a toilet too will be provided. In a move to provide better living conditions for the urban poor, the work at Kathputli Colony would act as a pilot project in Delhi, and also set a benchmark for many such projects with the ultimate goal of making Delhi a slum free state.
The only and very big concern with the above planning is the structure of the EWS flats which seems to be too small and unattractive. The economics should be meticulously worked out and negotiated hard if developers are to be involved. Alternatively, the government itself should pursue such projects given the sensitivities involved with economy of scale.
13.5.2 Economics of Spacious and Standard High Rise Rehabilitation Program: Planning for a Land Scarce City
As mentioned above, a simple analysis of land use with alternative heights of buildings would reveal great advantages of high rise buildings for in‐situ rehabilitation of slum dwellers. It is demonstrated below, how vertical space can be used to provide spacious accommodations to slum dwellers free of cost and yet be able to create huge corpus to meet every other social obligation for good living conditions. If slum dwellers could be persuaded to contribute, the corpus could be enlarged commensurately. The analysis is based on the ground realities and need for resettlement of slum dwellers which can be further improved by incorporating value of more complex factor of costs and benefits that encompass social and micro issues discussed earlier.
PRINCIPAL PREMISE OF APPROACH
The basic premise is centred on some pragmatic concerns such as scarcity of land, market value of floors, capacity of slum dwellers to pay and need of high quality accommodation fitting in to the concept of modern capital city of Delhi.
This is also important to note that given scarcity of land in the capital region and growing pressure for additional infrastructure, there is no alternative of multi‐storey accommodation which also is the going trend

Slums of Delhi
October 2011 Page 162
in most of emerging economies such as China, Malaysia, Singapore, Hong Kong etc. With high rise buildings it is possible to provide more space to slum dwellers without additional cost to government. Given the value of property/ real estate in Delhi, it is demonstrated that the key benefit to slum dwellers in terms of good quality house with space of 270 to 800 sq ft and all other amenities required for good living cam be provided without any additional cost to government and even after that huge fund would be left over to provide other benefits such as healthcare, education and maintenance.
ASSUMPTION AND SENSITIVITIES
The above proposition is based on survey based data which is presented in Tables 13.3 to 13.5. A flat cost of construction of INR 1200 per sq ft is assumed, which is about 60 per cent of average selling price of high rise residential property in NCT region. An expensive construction cost is assumed to cover the provisioning of sanitation, ventilation, hygiene and light in the same way as it is the case in any modern day high rise residential complex.
The total ground area covered by the 477 slum clusters has been arrived at by multiplying the estimated number of households with average floor area of 100 square feet and a factor of 1.1 to take into account walk ways and other common space. This translated into an effective ground area of 443 hectare covered by the slums with an inhabitation of 4.34 lakh households. Given the geographical area of Delhi State as 148300 hectare, the coverage by slums is just about 0.33 per cent where almost 21 per cent people of Delhi are taking shelter.
The market price of floors in commercial buildings around the slum clusters is estimated as INR 30900 per square ft on an average. This allows estimation the value of commercial construction generating saleable floor. It is demonstrated that the returns from sale of surplus space that can be created in the land occupied by the slums is huge enough to take care of good accommodation as well as all other welfare benefits that can reasonably be thought of. Further, the results are checked for lower average values of commercial floors and it comes out that even with one third of above value (INR 10000 per square ft), the conclusion would hold in all cases and surpluses remain positive.
For the purpose of this analysis, it has been conservatively assumed that only 40 per cent of the occupied land can be used for construction leaving aside 60 per cent space to meet statutory needs, roads, dispensary, community centre, shops etc. Also this would take care of some of the slums which cannot be rehabilitated due to space constraints. Thus, effective plinth area to be used for in‐situ construction would be about 177 hectare.
The other important assumption is that the government would allow a higher floor to surface index. This is very critical and globally accepted strategy. The assumed flat cost of construction of INR 1200 per sq ft assumed, is sensitive to the height of building but it has been checked that changing this value to even INR 1500 or INR 2000 per sq ft, the conclusion of the analysis does not change. Further, with such expensive construction, the problems of sanitation, ventilation, hygiene and light would be automatically taken care of as it is the case in any modern day high rise residential complex.
Further, the calculation is done with respect to several options of floor area to be allocated to slum dwellers. In case one (Table 13.3 to 13.5), the floor area is assumed to be given is 270 sq ft which is more than 2.5 times the space they are residing on an average and the slum dwellers are required to pay INR 20 per sq ft

COST BENEFIT FRAMEWORK AND REHABILITATTION STRATEGY
This document is intellectual property of Centre for Global Development Research Private Limited, New Delhi prepared with the help of SER Grant extended by the Planning Commission of India. No part of the document can be copied without a written permission of CGDR
Page 163
which is affordable for them as indicated in survey. In the second option, the floor area could be increased to 400 sq ft and the slum dwellers may be asked to pay INR 125 per sq ft, which has little premium. A more aggressive case is to provide 800 square feet floor at the rate of INR 1000 per square feet, which is feasible if building height is above 21 storeys. In between several cases have been presented in Table 13.3.
Finally, for simplicity it is assumed that the height of commercial and residential blocks would be similar and that these blocks could be separate or mixed as per convenience and location mainly being determined by the saleability of the commercial space. The value of commercial floors is assumed to be the average for all floors and all localities, which in fact, may vary significantly across regions. The analysis results throw a wide range of options and even if commercial floor are lesser in number than the residential floor, the conclusion holds because surpluses are huge. It is easy to calculate the zero surplus cases, which would show the minimum number of commercial floors that would be required to construct but such results are abstracted for the brevity of presentation.
THE CALCULATION AND RESULTS
With above assumption calculation of net benefit to government is calculated under several alternatives heights of building with varying SFI and different payments terms for slum dwellers including free supply. The results are summarised in Table 13.3 and details for two detailed cases are presented in Tables 13.4 and 13.5. Clearly, with increasing SFI the available area of floor increase and this increase in floor size can be exploited economically to meet all costs.
With assumption of utilising 40 per cent of slum area, the available ground for rehabilitation works out to be about 175 lakh sq ft. Next the total floor area required for accommodating 4.34 lakh households is calculated. This is fixed by the unit floor area decided to be offered. In this case it is 275 sq ft to 800 sq ft. With this range the floor area to be distributed for residents works out to be 1171 lakh sq ft to 3470 lakh sq ft respectively.
With different SFI the floor area that can be constructed is indicate in Table 13.4 to 3.5 for two example cases. Out of this area, the area to be given to slum dwellers is subtracted to obtain the floor area that would be available to government for sale. Another source of revenue is assumed to be the contribution made by the slum dwellers. With the cost of construction assumed to be INR 1200 per sq ft which is reasonable for high quality construction, the Net benefit to government is calculated by subtracting cost of construction from sale realisation of the surplus floor area and adding the contribution from slum dwellers. The same is presented in Table 13.3 for several cases and in the last row of Table 13.4 and 13.5 for two selected cases.
Clearly, the net benefit to government increase with floor height of building and it is substantial amount which varies from INR 34899 crore to INR 662925 crore. These calculations are indicative of the possibilities of land use and the welfare gain that can be promised to society.

Slums of Delhi
October 2011 Page 164
It is also feasible to give accommodation to slum dwellers even free of cost or alternatively a corpus can be created to maintain health insurance and other facilities such as education for the residents of rehabilitated society for ever.
TABLE 13.3: ADDIONAL ALTERNATIVES OBTAINED THROUGH SIMULATED SURPLUS GENERATION WITH CHANGING SFI AND FEASIBLE BUILDING HEIGHT FOR DIFFERENT FLOOR AREAS OF DWELLINGS AND CONTRIBUTION FROM SLUM DWELLERS Simulated Surplus Generation with changing SFI and Feasible Building height for different floor areas of dwellings and contribution from slum dwellers Alternative Plan Dwelling
Floor Area Sq Ft
Contribution INR/Sq Ft by Slum Dwellers
7 Storey Buildings
11 Storey Buildings
16 Storey Buildings
21 Storey Buildings
25 Storey Buildings
30 Storey Buildings
SFI 2.8 4.4 6.4 8.4 10 12
Contribution by all slum dwellers in Affordable range
270 20 35133 261856 545261
400 125 89558 372963 656367
Free Dwellings 270 0 34899 261622 545026
400 0 87390 370794 654198
600 0 102744 386148 612872
800 0 118098 344822 628226
Dwellings at very nominal rate of INR 100/sq ft
270 100 36070 262793 546198
400 100 89124 372529 655933
600 100 105346 388751 615474
800 100 121568 348292 631696
Dwellings at very nominal rate of INR 500/sq ft
270 500 40754 267478 550882
400 500 96064 379469 662873
600 500 115756 399160 625884
800 500 135448 362171 645576
Dwellings at very nominal rate of INR 1000/sq ft
270 1000 46609 273333 556737
400 1000 104739 388143 671548
600 1000 128768 412173 638896
800 1000 152797 379521 662925

COST BENEFIT FRAMEWORK AND REHABILITATTION STRATEGY
This document is intellectual property of Centre for Global Development Research Private Limited, New Delhi prepared with the help of SER Grant extended by the Planning Commission of India. No part of the document can be copied without a written permission of CGDR
Page 165
TABLE 13.4: INDICATIVE COST AND BENEFITS OF RESETTLEMENT UNDER ALTERNATIVE STRUCTURE OF BUILDINGS WITH LIMITED VARIABLES ONLY (EXAMPLE ‐1) Alternative construction for rehabilitation
Details Unit Value 7 Storey Buildings
11 Storey Buildings
16 Storey Buildings
A Assumptions
1 Estimated Number of households N 433738
2 Average floor area covered by slum dwellers Sq ft 100
3 Factor to cover unconstructed area Ratio 1.01
4 Estimated area of ground covered by slums Sq ft 43807538
5 Ground cover for construction Ratio 0.4
6 Ground area available for construction sq ft 17523015
7 Cost of construction of good quality flat INR/ sq ft 1200
8 Average market price of commercial floor in slum areas
INR/ sq ft 30900
9 Contribution from slum dwellers @ INR/ sq ft 20
10 Floor area to be given to slum dwellers @ sq ft 270
11 Approximate average SFI Index 2.8 4.4 6.4
B Estimates
1 Number of storey to be constructed A 7 11 16
2 Floor area available in building sq ft 122661106 192753167 280368243
3 Floor area to be given to slum dwellers sq ft 117109260 117109260 117109260
4 Floor area left for sale sq ft 5551846 75643907 163258983
5 Cost of construction of entire area at "A" INR crore 14719 23130 33644
6 Realizable value from saleable floor area INR crore 17155 233740 504470
7 Realizable value from slum dwellers INR crore 234 234 234
8 Benefit to government available for social expenditure on slum dwellers and sharing with the developers
INR crore 2670 210844 471060
Source: CGDR research

Slums of Delhi
October 2011 Page 166
TABLE 13.5: INDICATIVE COST AND BENEFITS OF RESETTLEMENT UNDER ALTERNATIVE STRUCTURE OF BUILDINGS WITH LIMITED VARIABLES ONLY (EXAMPLE ‐2) Alternative construction for rehabilitation
Details Unit Value 21 Storey Buildings
25 Storey Buildings
30 Storey Buildings
A Assumptions
1 Estimated Number of households N 433738
2 Average floor area covered by slum dwellers Sq ft 100
3 Factor to cover unconstructed area in slums Ratio 1.1
4 Estimated area of ground covered by slums Sq ft 47711180
5 Ground cover for construction Ratio 0.4
6 Ground area available for construction sq ft 19084472
7 Cost of construction of good quality flat INR/ sq ft 1200
8 Average market price of commercial floor in slum areas
INR/ sq ft 30900
9 Contribution from slum dwellers @ INR/ sq ft 1000
10 Floor area to be given to slum dwellers @ sq ft 800
11 Approximate average SFI Index 8.4 10 12
B Estimates
1 Number of storey to be constructed A 21 25 30
2 Floor area available in building sq ft 400773912 477111800 572534160
3 Floor area to be given to slum dwellers sq ft 346990400 346990400 346990400
4 Floor area left for sale sq ft 53783512 130121400 225543760
5 Cost of construction of entire area at "A" INR crore 48093 57253 68704
6 Realizable value from saleable floor area INR crore 166191 402075 696930
7 Realizable value from slum dwellers INR crore 34699 34699 34699
8 Benefit to government available for social expenditure on slum dwellers and sharing with the developers
INR crore 152797 379521 662925
Source: CGDR research
13.6 STRATEGIES FOR SUCCESSFUL SLUM REDUCTION4
In many urban centres most visible slums remain blind spots for policymakers ‐ caught between token gestures, clearance or mass eviction or administrative delays. The attempts at institutional reform typically founders on lack of support, funding or coordination. Still, municipalities in a number of countries have
4 This section is heavily drawn from literature of UN‐HABITAT

COST BENEFIT FRAMEWORK AND REHABILITATTION STRATEGY
This document is intellectual property of Centre for Global Development Research Private Limited, New Delhi prepared with the help of SER Grant extended by the Planning Commission of India. No part of the document can be copied without a written permission of CGDR
Page 167
managed to reduce the absolute and relative numbers of slum‐dwellers among their populations. The successful governments took the responsibility for slum reduction on their shoulders, backing commitments with bold policy reforms, and preventing future slum growth with equitable planning and economic policies. Based on policy evidence collected by UN‐HABITAT in 44 successful countries, it can be suggested that successful slum reduction broadly takes a combination of five complementary approaches: (i) awareness and advocacy; (ii) long‐term political commitment; (iii) policy reforms and institutional strengthening; (iv) implementation and monitoring; and (v) scaling‐up of successful local projects (UN‐HABITAT 2010). However, all such activities must start with a sound and complete data base about slums and slum dwellers.
13.6.1 Create a database of slum dwellers through systematic census
The discussion earlier has flagged the issue of complexities involved in identification of actual beneficiary and the ownership of dwellings. About 97.9 per cent of the slum houses are self occupied and only 2.1 percent are occupied by tenants. On the other hand, share of households without ration card is about 13 per cent and a large proportion of these could be tenants. However, from investigation it has been reported that most of the HHs without ration card are tenants. Thus, a much higher percentage of HHs reporting ownership of dwelling may be due to the fact that the tenants do not want to reveal their real status. This problem flags the importance of identification of the unique ownership of dwelling using biometric survey of owners, exact census of houses, and then strict consistency examination to avoid (1) repeat of house against more than one claimant and (2) repeat of biometric information indicating ownership of more than one slum house. Such a process is presented in Figure 13.1 through a flow chart.
The data collection must focus on the following minimum variable in addition to household information.
a) Cadastral survey – showing each structure to the scale indicating use and number of stories. b) Socio‐economic survey – collecting detailed information of family of the occupier/ establishment in
an approved format c) Biometric survey – capturing photo of the head of household and his/ her left hand thumb
impression. d) Photo verification – digitally capturing the structure with unique ID number displayed on the same e) Collection of photocopies of documents regarding proof of residence from all slum dwellers f) Preparation of individual files for each slum dweller
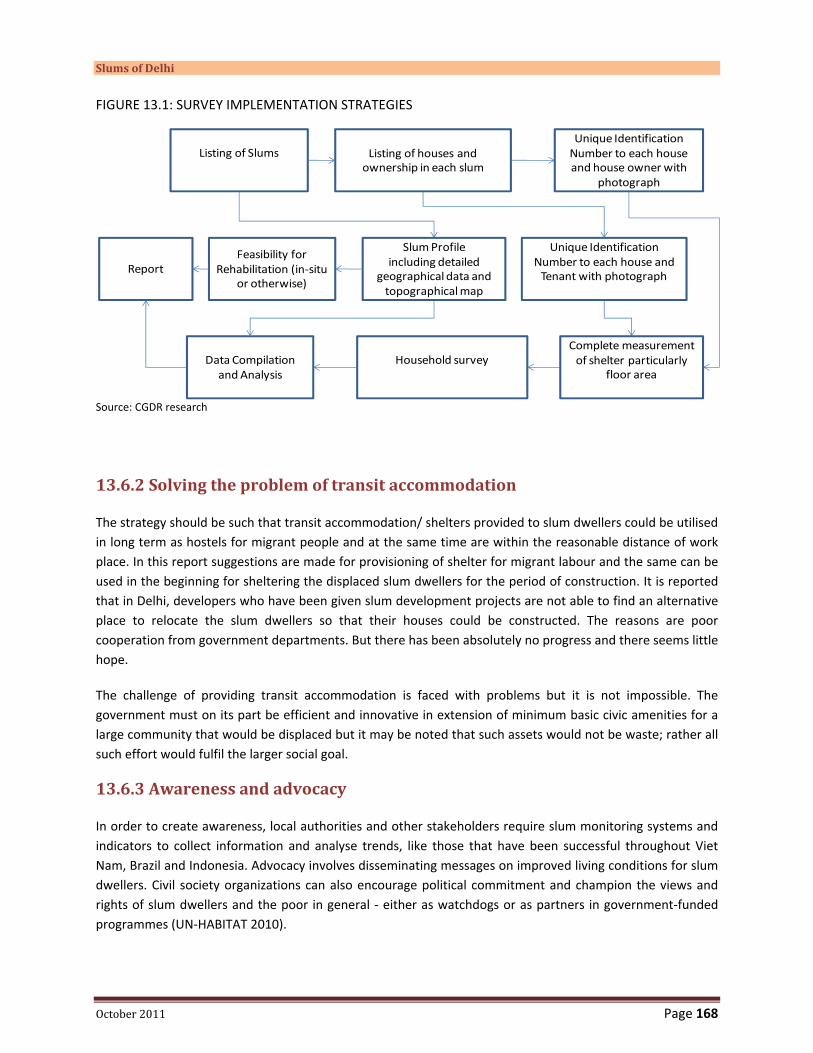
Slums of Delhi
October 2011 Page 168
FIGURE 13.1: SURVEY IMPLEMENTATION STRATEGIES
Source: CGDR research
13.6.2 Solving the problem of transit accommodation
The strategy should be such that transit accommodation/ shelters provided to slum dwellers could be utilised in long term as hostels for migrant people and at the same time are within the reasonable distance of work place. In this report suggestions are made for provisioning of shelter for migrant labour and the same can be used in the beginning for sheltering the displaced slum dwellers for the period of construction. It is reported that in Delhi, developers who have been given slum development projects are not able to find an alternative place to relocate the slum dwellers so that their houses could be constructed. The reasons are poor cooperation from government departments. But there has been absolutely no progress and there seems little hope.
The challenge of providing transit accommodation is faced with problems but it is not impossible. The government must on its part be efficient and innovative in extension of minimum basic civic amenities for a large community that would be displaced but it may be noted that such assets would not be waste; rather all such effort would fulfil the larger social goal.
13.6.3 Awareness and advocacy
In order to create awareness, local authorities and other stakeholders require slum monitoring systems and indicators to collect information and analyse trends, like those that have been successful throughout Viet Nam, Brazil and Indonesia. Advocacy involves disseminating messages on improved living conditions for slum dwellers. Civil society organizations can also encourage political commitment and champion the views and rights of slum dwellers and the poor in general ‐ either as watchdogs or as partners in government‐funded programmes (UN‐HABITAT 2010).
Listing of Slums
Feasibility for Rehabilitation (in‐situ
or otherwise)
Listing of houses and ownership in each slum
Unique Identification Number to each house and house owner with
photograph
Household survey
Unique Identification Number to each house and Tenant with photograph
Data Compilation and Analysis
Report
Complete measurement of shelter particularly
floor area
Slum Profile including detailed
geographical data and topographical map

COST BENEFIT FRAMEWORK AND REHABILITATTION STRATEGY
This document is intellectual property of Centre for Global Development Research Private Limited, New Delhi prepared with the help of SER Grant extended by the Planning Commission of India. No part of the document can be copied without a written permission of CGDR
Page 169
13.6.4 Longterm political commitment
Solutions to slum upgrading require greater political will at the highest levels to eradicate slums. Over the past 15 years, consistent political commitment to large‐scale slum upgrading and service provision to the urban poor has enabled many developing countries such as China, India, Colombia, and Morocco to reduce and stabilize slums. Other countries, including Ghana, Senegal and Argentina have fairly recently stepped up action. Some other countries have also gathered the necessary political support for land and tenure policy reforms, including Burkina Faso, Senegal and Tanzania (UN‐HABITAT 2010).
13.6.5 Policy reform and institutional strengthening
For successful slum upgrading and prevention, it is important to devise and implement a properly funded nationwide urban slum eradication program. Such a program would involve both policy change and institutional strengthening.
According to UN_HABITAT 2003, the policy reforms required for slum reduction involve housing, land and infrastructure provision and finance. Countries that have been successful in integrating slums into their cities have strengthened their institutions and carried out complementary reforms, which include a broader urban poverty reduction agenda. Some have implemented policies to integrate the urban poor into the legal and social fabric of cities; others have carried out reforms in land and housing provision.
Indonesia, Nicaragua and Peru have integrated large numbers of urban poor into the legal and social fabric; other countries, like India, have deployed major pro‐poor reforms and programmes for land and housing provision or are adopting more inclusive approaches. Some other countries try to avoid relocations and instead work on settlements in situ, improving existing living conditions. Some other successful countries including Indonesia, Iran, and Mexico look beyond the housing sector and fight slums as part of broader‐ranging urban poverty reduction strategies. Policies have tended to shift from entitlement to co‐participation (UN‐HABITAT 2010).
13.6.6 Implementation and monitoring
Another successful strategy of slum reduction process is to deploy transparent and pro‐poor policies backed up by adequate human and technical resources. Some of the developing countries have trained urban planning and management professionals and involved them in housing and basic service delivery programmes. Countries that performed well also made an effort to coordinate among central, regional, and local authorities and the private sector. Moreover, cities and countries that were successful in the delivery of basic services and housing improvements had clear performance monitoring mechanisms that require the involvement of all levels of government. Cambodia, China, and Vietnam, for example, have strict upward

Slums of Delhi
October 2011 Page 170
accountability regarding municipal implementation on infrastructure. Brazil and Indonesia, on the other hand, have bottom‐up performance monitoring, which enhances citizen participation in planning and decision making. Coordination across government levels and with the private sector is also critical for successful scaling up of slum upgrading projects (UN‐HABITAT 2010).
13.6.7 Scalingup
Replication and scaling‐up of successful slum‐upgrading pilot projects have served many developing countries with measurable impacts on national indicators of slum growth. As originally modest‐scale programmes were upgraded in many countries the private sector and civil society became involved, or the schemes benefited from additional funding for replication and mainstreaming into government policies. Other countries, including China, Chile and South Africa, engaged in large‐scale public subsidies to the housing sector, in a bid to reach the poorest groups and meet the rising costs of social housing. In most cases, success mobilized huge domestic as well as external resources to promote innovative strategies, including for slum prevention (UN‐HABITAT 2010).
A combination of these seven strategic approaches with proper coordination between well‐designed centralized interventions and local authorities can make a slum rehabilitation or redevelopment initiative successful.
13.7 CONCLUSION
It can be safely argued that high rise building is one of the highly feasible solutions with in‐situ rehabilitation. However, to make any slum rehabilitation program a success story, meticulous planning and participation of community is essential. In India, floor space index norms are very small; it is just about 1.5 in whereas it is
6-10 in Malaysia, Singapore, and China. A modification these norms are essential to implement efficient
strategies. The net benefit to government increase with floor height of building and it is substantial amount which varies from INR 34899 crore to INR 662925 crore. These calculations are indicative of the possibilities of land use and the welfare gain that can be promised to society. It is also feasible to give accommodation to slum dwellers even free of cost or alternatively a corpus can be created to maintain health insurance and other facilities such as education for the residents of rehabilitated society for ever.

KEY FINDINGS
This document is intellectual property of Centre for Global Development Research Private Limited, New Delhi prepared with the help of SER Grant extended by the Planning Commission of India. No part of the document can be copied without a written permission of CGDR
Page 171
Chapter 14
Key Findings Slums play a number of essential roles in a city life. As a place of residence for low‐cost labour, they keep the wheels of the city moving in many different ways. As a first stopping point for immigrants, they provide the affordable housing that enables them to save for their future absorption. Slums play a significant role in producing the services and commercial activities that the formal sector fails to provide through the mobilization of local enterprises and industry. Moreover, slums are places where different cultures get a platform to mix among them resulting in new forms of artistic expression. However, on the negative side, slums are home to toxic and harmful industrial activities, waste materials, ill health, crime, and polluted land. The slums have mostly poor quality housing and residential infrastructure. Having said this, when more than half of the urban population lives in slums, it becomes extremely important to recognize both these aspects of slum behaviour so that they are awarded their rightful place in the centre of policies and politics (UN‐
HABITAT 2006). 1
14.1 GENERAL CONDITION OF SLUMS IN DELHI
14.1.1 SLUM POPULATION IN DELHI IS STILL INCREASING BUT ITS SHARE IN TOTAL POPULATION HAS COME DOWN
As per Census 2001, Delhi had 4.20 lakh slum households with a population of 21.5 lakh being 16.88 per cent of Delhi’s population. As per the present study (2010) the number of JJ households is estimated at 4.34 lakh with a population of 22.14 lakh. This indicates that the share of population living in slums has come down to 14.46 per cent even though the absolute number of population living in slums has increased. Except few exceptions, almost all slums in Delhi are located on government land.
1 State of the World’s Cities, 2006/7, UN‐HABITAT

Slums of Delhi
October 2011 Page 172
14.1.2 SLUMS OCCUPY VERY HIGH VALUE LAND
A jhuggi can be sold or purchased. Average cost of purchasing a one room jhuggi in a Delhi slum is reported at INR 40243. The localities around slum command huge property price, anywhere between INR 7000 to INR 90000 per square feet of floor. Availability of land for sale is rare. Thus the lands occupied by slum dwellers can fetch such value that any market based plan of developing slums in to an attractive residential cum commercial market complex could be a worthy proposition.
14.1.3 MOST SLUMS ARE WELL CONNECTED AND WITHIN SORT DISTANCE OF WORK PLACE
Most of the slum cluster has well access to amenities like bus stand, market, post office, bank, primary school etc.
14.1.4 MOST SLUMS SUFFER FROM INADEQUATE GARBAGE DISPOSAL SYSTEM, SANITATION AND HEALTHCARE
But, only in about 43.61 per cent of the slums reported regular visit by MCD sweepers, 54.09 per cent of the slums reported the absence of a common dustbin inside the slum. More than 90.98 per cent slums located in west Delhi are without a common dust bin. The average number of immunization program per slum is estimated at 4.98 and average number of health camps is estimated at 1.91. 46.12 per cent of the slums reported one or other type of law & other problem. About 36 organizations are working in 181 slums covering only 39.41 per cent of the total slums.
14.1.5 A LARGE PROPORTION OF PEOPLE STILL USE OPEN SPACE FOR TOILET AND SUFFER FROM LACK OF WATER
SUPPLY
More than a quarter slums do not have common toilet facility inside the slum and even those slums where common facility is available; the number is not adequate enough to accommodate all the residents. As a result a large number of slum dwellers have to use open space for toilet and this situation can only be describes as pathetic. The greatest sufferers are women and girl children.
95.4 per cent of the slums have one or the other provision of drinking water. Delhi jal Board the main supplier of water has laid pipe line in 83.65 per cent of the slums. However, it may be noted that there is no water tap inside the houses and everybody has to fetch water from common taps. Men also use these taps for bathing and washing, while women bring water inside house for washing. Slums which do not have running water rely on portable system of water supply. In central zone 99 per cent slums have running water taps at reachable locations for drinking water; while in East and North zones 83.8 per cent, in West zone 69.7 per cent, and in south zone only 27.1 per cent slums have running water taps for water supply. The shortage and scarcity of tap water is felt by most of the south Delhi residents.

KEY FINDINGS
This document is intellectual property of Centre for Global Development Research Private Limited, New Delhi prepared with the help of SER Grant extended by the Planning Commission of India. No part of the document can be copied without a written permission of CGDR
Page 173
14.2 GENERAL CONDITION OF SLUM DWELLERS: PEOPLE & SOCIAL STRUCTURE
14.2.1 EIGHTY PER CENT OF THE SLUM MIGRANTS COME FROM BACKWARD DISTRICTS OF UTTAR PRADESH AND BIHAR
Although slum households have migrated from 237 districts spread over 20 states, 61.49 per cent of the households have migrated from 68 districts of U.P. and 23.7 per cent from 36 districts of Bihar. Seventy per cent of the slum migrants come from 35 backward districts. At the district level, highest percentages of households have migrated from Balia (UP) followed by Azamgarh (UP) and Deoria.
14.2.2 MAJORITY OF THE SLUM POPULATION BELONGS TO DEPRIVED CLASS OF THE SOCIETY
People belonging to schedule caste form 47 per cent of slum population and while 35.2 per cent are OBC. Hindu community constitutes 87.5 per cent and Muslims 12.1 per cent of slum population.
14.2.3 MORE THAN HALF OF THE HOUSEHOLDS HAVE BPL STATUS
87 per cent of the total households are ration card holders and out of this 61 per cent are BPL card holders, 26 per cent AAY and 13 per cent APL card holder.
14.2.4 MOST SLUM DWELLERS ARE LANDLESS PEOPLE FROM RURAL SECTOR AND THEY COME IN SEARCH OF JOB
AND LIVELIHOOD
Across various region of Delhi, percentage of landless migrants varies between 86.7 per cent in North to 98.9 per cent in the Central. These landless people have nothing to lose and therefore, any increase in their income is additional gain and slum life is not a constraint for them as their rural background help then to bear the hardship and survive. 87 per cent of the HH heads came to Delhi in search of a job.
14.2.5 UNAFFORDABLE ACCOMMODATION IS THE PRIMARY REASON OF MOVING TO SLUMS
About 78.1 percent of the households have reported their previous residence to be outside Delhi but about 90.0 percent of the households said that they have left the earlier place of residence as they were not able to afford at the earlier place of residence. Thus a large chunk of households move to slum after experiencing economic downturn.

Slums of Delhi
October 2011 Page 174
14.2.6 DESPITE RELATIVELY POOR LITERACY HOUSEHOLDS HEADS TEND TO GIVE IMPORTANCE TO EDUCATION AND
DISCRIMINATE LESS BETWEEN GIRL AND BOY CHILD
33.7 per cent of male HHH and 58.7 per cent of female HHH are illiterates. Low gender discrimination in enrolment has been reported as 83.68 percent of boys and 82.68 per cent of girls in 5‐14 years age group are enrolled in schools. Only 3.1 per cent of the HHs reported at least 1 to four child labour in the family.
14.2.7 POOR SOCIAL SECURITY FOR MEDICAL
Only 1.6 per cent of the total HHs has medical insurance cover and only 5.05 per cent have smart card provided by the government. Only 0.78 per cent has used smart card
14.2.8 CLOSE TO AVERAGE SIZE OF HOUSEHOLD BUT DENSELY POPULATED
Sixty per cent of the HHs has a family size up to 5 members and overall family size is 5.1. However, considering the fact that so many members reside in a limited space of 108 sq ft on an average, the life style is highly compromised. On top of this about two third of the households are living like this for 16‐30 years.
14.2.9 ADVERSE FEMALE TO MALE RATIO
In the total population 55.1 per cent are males and 44.9 per cent are females. Ratio of females per 100 males is higher in lower age groups indicating lesser gender bias.
14.3 HOUSING CONDITIONS & AMENITIES:
14.3.1 MAJORITY OF SLUM HOUSES ARE PUCCA IN CONSTRUCTION BUT THEY LACK BASIC AMENITIES
46.3 per cent of slum houses are pucca; Semi Pucca houses constitute about 27.9 per cent and remaining 25.8 percent are Kutcha houses. However, the composition across zones varies to some extent. Many of them are multi‐storeyed. Average number of rooms each slum house has is estimated at 1.14. Average covered area per slum house is 108 sq ft.
More than 99 per cent of the households do not have kitchen, 96.6 per cent do not have toilet and 72 .4 per cent use kerosene for cooking. 63 per cent of households have running water supply from taps. However, about 96 per cent of the HHs reported electricity connection in their slum house.
14.3.2 UNCERTAINTY AND FEAR OF DEMOLITION LOOM LARGE
Only 12.7 per cent of slum dwellers think that they can continue to stay in the slum and only 11.6 per cent have plans to purchase a house.
14.3.3 MOST SLUM DWELLERS SURVIVE ON UNORGANISED JOB MARKET AND HAVE HIGH DEPENDENCY RATIO
The largest primary job markets have been reported to be industries. The second largest primary market consists of popular markets, mandies where large number of labourers are required daily. Popular markets

KEY FINDINGS
This document is intellectual property of Centre for Global Development Research Private Limited, New Delhi prepared with the help of SER Grant extended by the Planning Commission of India. No part of the document can be copied without a written permission of CGDR
Page 175
also form the largest secondary job market. The third largest primary job market is residential areas where slum dwellers work as domestic help or jobs meant for plumber, masons, electricians etc.
In terms of employment of household heads, the gainful employment level is 90.3 per cent but when it comes to employed population the percentage falls to 28.2 per cent at the aggregate level. 46.4 per cent males and only 5.5 per cent females are employed. Unemployed persons form 9.3 per cent of the total population, 13.5 per cent among males and 3.9 per cent among females. This leads to average dependency ratio of 3.54 with highest in north and lowest in central region. The high dependency ratio also creates economic constraints on slum dwellers and at times reflects poor awareness about family planning. However, this also indicates that the employment level in slums is not as high one would expect and there are large a number of empty hands who indulge in several unsocial activities.
14.3.4 SLUM DWELLERS HAVE INVESTED SUBSTANTIAL AMOUNT FOR SHELTER
About 97.9 per cent of the slum houses are self occupied and only 2.1 percent are occupied by tenants. On the other hand, share of households without ration card is about 13 per cent and a large proportion of these could be tenants. However, from investigation it has been reported that most of the HHs without ration card are tenants. Thus, a much higher percentage of HHs reporting ownership of dwelling may be due to the fact that the tenants do not want to reveal their real status.
The average cost of owning shelter in slum house is reported as INR 57,157 varying between INR 50080in the North to INR 72513 in the Central zone. A Jhuggi can be sold and purchased. The average cost of purchasing a one room Jhuggi in a Slum is reported to be INR 40243 and average rental is INR 847 on an average.
14.4 ECONOMIC GAINS TO SLUMS MIGRANTS
In order to examine whether the economic condition of slum dwellers have actually changed, before‐after coming to the slum the analysis is carried on a number of indirect indicators including consumption, assets ownership, indebtedness, and savings. In addition certain direct indicators are also examined such willingness to go back to native land and factors which motivate them to continue in slum life.
14.4.1 MAJORITY SLUM DWELLERS THINK IT TO BE RIGHT DECISION TO MIGRATE
About 95 per cent of the households think that it was a right decision to have moved out of their native place. These households were asked the ways they have gained by leaving their native place. About 98 per cent have said that they have gained by way of improving their financial condition, 52 per cent better education of children, better food reported by 61.3 per cent, 33.8 per cent reported better health, 29.6 per
Slums of Delhi
October 2011 Page 176
cent more land, 0.9 percent more assets like automobiles, could possess more consumer durables reported by 1.8 percent, also finance for a better house by native place was reported by 1.0 per cent.
14.4.2 CHEAPER ELECTRICITY AND AFFORDABLE FOOD PRODUCTS AVAILABLE THROUGH PDS ARE MAIN SUPPORTS
TO SLUM DWELLERS
Cheaper electricity has been reported as one of biggest gain of slum life by about 57 percent of the households; 39.3 per cent households feel food items are cheaper in slums because of public distribution through fare price shops and 28.6 per cent also subsidy for children’s education’.
14.4.3 WELFARE ACTIVITIES BY GOVERNMENT IS MORE BUT SATISFACTION IS MORE WITH NON GOVERNMENT
ORGANISATIONS
Slum dwellers enjoy benefits of several types of welfare activities conducted by government and non‐government organisations, which provide an additional support for betterment of slum life. About 36 NGO’s are working in slums providing help in a number of areas such as education, health, legal advice, counselling, welfare of women and children and general support. Interviews of 2024 households spread over 65 sample slums clusters shows that among these slums 42.9 per cent have reported government program while 7.7 per cent reported intervention of welfare/charitable organisation. Importantly, the level of dissatisfaction is reported by 15.4 per cent households in case of government programs as compared to 6.7 per cent reporting unsatisfactory work of welfare/charitable organisation.
14.4.4 SLUM DWELLERS HAVE INCREASED THEIR REAL INCOME AND EXPENDITURE MANIFOLDS AFTER LEAVING THE
NATIVE PLACE
The annual average per capita real income increased by 317 per cent with respect to the income at native place. By source, income from Salary increased by 1493 per cent, income from Self Employment by 878 per cent, Income from business, trade, petty shops etc. by 672 per cent, and wage income by 169 per cent.
Per capita annual expenditure on food at 1999‐00 prices has increased from INR 1346 to INR 3870, while non‐food expenditure has increased from INNR 666 to INR 2705, which means expenditure on food increased by 2.88 times and non‐food by 4.06 times. The overall increase is 3.27 times. This amply supports the ‘Engels Law’ which states that as HH income increases the share of expenditure on non‐food too increases and on food declines because the HH are left with more surplus after meeting their basic needs on food items.
14.5 WILLINGNESS TO MOVE AND WILLINGNESS TO PAY FOR RESETTLEMENT
About 89 percent of the households will not opt for an accommodation far away from their present location. This means in‐situ resettlement can be negotiated more easily than a far off solution. However, only about 59 percent of the households feel that moving away from current location would affect their employment, Children’s education, basic amenities like drinking water etc and about 41 percent said it will not affect as they have no fixed job. Thus, under specific conditions, the choice pattern may vary and this is likely to be reflected when there are alternative models to choose. This also corroborated from the analysis of distance

KEY FINDINGS
This document is intellectual property of Centre for Global Development Research Private Limited, New Delhi prepared with the help of SER Grant extended by the Planning Commission of India. No part of the document can be copied without a written permission of CGDR
Page 177
of work place in Chapter 6, where it is demonstrated that a sizable people, such as drivers and some types of labour could not fix the distance of their work place
There is perceptible difference in response of household heads and the community leaders with regard to willingness to pay against resettlement schemes. With regard to monthly instalment for a plot of land measuring 25 yards response received from HHs was INR 681 as against the community leaders INR 770. With regard down payment towards a plot of land measuring 25 yards and for a flat on 25 yards land, the HHs reported their affordability to be INR 6181 and 6160 respectively. As against down payment for a 25 yards land / flat the community leaders reported the affordability of the HHs as INR 9262. However, 2.94 slums have refused to pay any amount towards resettlement scheme.
14.6 COMPLEXITIES INVOLVED IN REHABILITATION STRATEGIES
Discussions in previous chapters, particularly the diversity in background of slum dwellers, reasons of migration, job profile, distances of work place, income and consumption patterns and their capacities to pay, all of these make rehabilitation and development of slums a complex project. On top of this the profile of all slums is not alike, some are small, some are large, some are located near railway line, some are located by the side of canals, even inside powerhouses and within busy market places and residential areas. Each slum and has to be planned individually or in small groups for rehabilitation. Further the global experience indicates that a variety of options are available from in‐situ rehabilitation to improvement and relocation. All options should be open for analysis. Besides these broad based issues there are several specific issues that need attention, which can be broadly classified in to two groups, community level complexities and slum level complexities as discussed below.
14.7 LESSON FROM GLOBAL EXPERIENCE OF REHABILITATION
The global experience refleted through five case studues discussed in Chapter 12 leads to several possibilities including development of locality, in‐situ resettlement and relocating with better accomodation. Whether it is redevelopment or resettlement – depending on the specific requirement of a particular slum. It has been experienced many of the slum rehabilitation projects in developing countries generally get stuck up at design, conceptualization and initial stages and not pick up the way they are planned. One such cases, which is of utmost importance, is that of Dharavi, Mumbai where developers are being engaged leading to several complications. Compared to this the case of Singapore is simple, where government itself took on itself to provide house for all and an exemplary success has been recorded in literature after literatute.

Slums of Delhi
October 2011 Page 178
There is another important lesson with regards to participation of communities and local leadership at all level of planning, and execution. Transparency and commitment are the hallmark of success in such projects. It is fairly clear from the examples that whenever the basic strategic priciples of slum urgradation are not properly followed, such initiatives tend to lose the support of slum dwellers as well as get stuck in political and institutional challenges. Therefore, a properly designed strategy that encourages the participation local residents in each stage of project implementation process and which maintains a co‐ordinated approach among different stakeholders, is extremely important for the success of any slum rehabilitaion intervention.
14.8 A COST BENEFIT FRAMEWORK TO ANALYSE THE ALTERNATIVE REHABILITATION STRATEGIES
Any cost benefit analysis would require covering economic as well as social factors. It has to decipher the elements of costs foregone and benefits accrued to society in its entirety. It would also have to predict ex‐anti the ex‐post benefits of certain acts desired to be carried out to increase the efficiency of human resources available in slums. Similarly, it has to factor in the value of land and its opportunity cost on which slums exist. The existences of slums also lead to cost in terms of insecurity of neighbouring population and benefits in terms of cheaper labour for a number of services to organisations and individuals. Besides, there are several other mundane issues.
When such a slum is rehabilitated, the reduction in criminal activities would become part of benefit stream while benefits of labour supply would also get enhanced. Resettlement in a clean, hygienic environment brings down the incidence of disease and hospitalization leading to lesser out of pocket expenditure on medical services and reduced pressure in the public health facilities. The children will have a proper environment to pursue their studies and on the top of it, the slum dwellers attain a dignified social status. The benefits could be well visualised from the residents of existing resettlement colonies. Therefore, in order to do justices to the cost benefit analysis it is desirable to take into account all shadow costs and shadow benefits which are sometime qualitative in nature requiring an extensive survey of both, the existing slum dwellers and slum dwellers in resettlement colonies. For measuring the qualitative part of the costs and benefits appropriate econometric tools may be used for quantification to arrive at the total benefits against the total costs.
14.8.1 Alternative Methods of Rehabilitation and Experiences
The experience suggests that addressing the issue of rehabilitation & up gradation of slums for achieving the Millennium Development Goal towards a slum free society is not an easy task to achieve and huge amount of commitment is needed to fructify the ideas. Several complexities and issues need to be resolved while planning for a viable rehabilitation strategy. There are two major options for the rehabilitation and resettlement approach:
(1) Resettlement outside the present site in the outskirts of the city
(2) In‐situ rehabilitation in reconstructed housing or improved housing
Resettlement in the out skirts of the city would involve addressing vital issues of employment opportunities for those who are engaged as household help, self employed like electricians, masons, carpenters or running

KEY FINDINGS
This document is intellectual property of Centre for Global Development Research Private Limited, New Delhi prepared with the help of SER Grant extended by the Planning Commission of India. No part of the document can be copied without a written permission of CGDR
Page 179
small business or informal industrial units including leather, pottery, textiles, food production like bakery & confectionery , garbage collection and recycling manufacturing units like welding, carpentry; providing for infrastructure & amenities, facilities for children seduction, health and so on.
Considering the employment avenues, in‐situ rehabilitation is desired alternative but a sizable number of slums, which are located closer to railway lines and severe lines, are not good cases for in‐situ rehabilitation. However, such slums can be merged with other slums for rehabilitation. Whether, in‐situ or outside rehabilitation there are four broad alternatives that has been practiced globally as also in Delhi:
(1) Give a small plot of land to the slum dwellers, which ensure land title enabling them to get loan to construct affordable better house;
(2) Give land ownership right to the existing slum dwellers as and where they are basis and allow then to build affordable houses while government providing the infrastructure. This is also known as Tokyo Model.
(3) Construct small flats with common amenities in low rising building and allocate such flats to slum dwellers; and
(4) Construct very high rise buildings and give spacious flats to slum dwellers at affordable cost/ rent. This also known as Singapore Model
(1) EXPERIENCE WITH PLOT BASED REHABILITATION
Examples of first alternative are many in Delhi. In Delhi, following the slum areas Act 1956, JJ resettlement, relocation schemes were started in 1960. The scheme began with the allotment of two room tenements to 3,560 JJ households. Subsequently, partially developed plots of 80 square yards were allotted under the scheme to the squatters on a nominal rent. However, due to increasing demand of land in Delhi, the size of plots was reduced first to 40 square meters and then 22 square meters.
Over time, however, these settlements have transformed into vibrant and most populous localities of Delhi. Many of these settlements have turned into multi‐storeyed buildings with residential cum commercial uses including renting, business, and small scale factories. The lanes have become congested and occluded with garbage and free flowing waste water.
Clearly, beneficiaries have made maximum possible use of the land given to them and for many of them it has become perpetual source of income through vertical expansions. This has happened due to fast growth

Slums of Delhi
October 2011 Page 180
of Delhi in terms of population and economics and the resulting land use pattern. Ex‐post analysis would reveal this to be one of most lucrative alternatives over time. However, considering the present day situation of land scarcity, it is neither feasible nor possible to provide alternative land in lieu of the present slum house.
(2) EXPERIENCE WITH SPACE CONSTRAINED LOW RISING BUILT‐UP FLATS
As discussed in earlier chapter, slums in Mumbai are being redeveloped by the Slum Redevelopment Authority (SRA) which also a part of Mumbai Metropolitan Region Development Authority (MMRDA). If 70 per cent of the residents of a slum agree, a developer can redevelop their plot of land by constructing seven‐storey buildings where each family will get a flat measuring 225 sq ft free. The developer can use the remaining land to build commercial or residential spaces for sale. Simultaneously, the MMRDA has been resettling slum dwellers under the World Bank‐funded Mumbai Urban Transport Project (MUTP) and the Mumbai Urban Infrastructure Project (MUIP). However, the MMRDA and SRA schemes are criticized by many for its bad quality of work. The problem is that the developers in these cases are only responsible for constructing the buildings and bother less about civic infrastructure such as drainage, water or sanitation. As a result, instead of horizontal slums, the scheme has successfully created vertical slums. Due to poor quality of construction and subsequent casual approach to maintenance, seepages start, lifts do not work and walls cave in.
Affordable housing under RRAY in Delhi
Delhi is experimenting with low cost housing under Rajiv Ratan Awas Yojana, announced in September 2007. Four‐storey and three‐storey blocks are constructed at the outskirts of city, consisting of (1) two rooms set with a bathroom and kitchen and with a floor area of 25 square meters; and (2) one room set with bath room and kitchen. Half of the cost of dwelling is shared by the government. Several thousand flats are ready but only a part could be allotted and after allotment also occupancy is extremely poor. The residents are not happy. Water is supplied for not even one hour a day. People are distressed with the isolation, lack of amenities and poor connectivity, which is much worse than the city slum. In terms of quality of housing the walls have started peeling, roofs are leaking and seepage is leading to fungal growth. This is one of the major disadvantages of low cost houses. The maintenance cost may be unaffordable in course of time. In addition, because of low height, the carrying capacity of the land is drastically reduced compared to high‐rise strong and standard construction.
(3) IN‐SITU IMPROVEMENT, TOKYO WAY
Give land ownership right to the existing slum dwellers ‘as and where they are’ basis and allow then to build affordable houses. This is the idea; every slum dweller would love to happen. After all, it would give them the most precious thing in Delhi, the land. This idea comes from those particularly in context of Dharavi and It is favoured by those who consider that the life style of slum dwellers and their livelihood pattern must be preserved. Example of Tokyo is often sited and parallels drawn between Dharavi and Tokyo. Post war period, Japan Government could not provide home to massive influx of people in cities and therefore, allowed poor people to build their own affordable homes in an organic way and simply helps them with electricity, sanitation and amenities. Whether, Delhi needs to follow this model is questionable because the slum conditions here are not like Dharavi. The shelters are predominantly disconnected with the work place and there is no reason to believe that the Delhi slums have organic development and interwoven life style.

KEY FINDINGS
This document is intellectual property of Centre for Global Development Research Private Limited, New Delhi prepared with the help of SER Grant extended by the Planning Commission of India. No part of the document can be copied without a written permission of CGDR
Page 181
However, walking through narrow but fully paved lanes of Tokyo is delight but that is an experience of rapidly grown economy with huge personal commitments of government officials and civil society.
Nevertheless, land is too scarce in Delhi and the pressure on land use would continue to grow for all times to come. City cannot afford to remain flat and congested. It must grow vertically to accommodate inflows of population from all over the country.
(4) SPACIOUS FLATS IN SKY SCRAPERS
Utilisation of vertical space with strong foundations has several advantages in cities where cost of land is very high and the population is increasing beyond control. Singapore experiment is not the only one such example of resettlement but certainly it is one of the most successful one. Accommodation in multi‐storeyed apartment is flexible as it can be made spacious, with centralised supply of water and electricity. Enough space is left for roads, hospitals, schools and other infrastructure. With larger space for accommodation, it is easier to negotiate with the slum dwellers to move out. In‐situ resettlement makes it more attractive. A detailed economic analysis presented in earlier chapter would reveal that free accommodation as large as 800 square feet is possible if buildings are allowed to acquire sufficient height.
14.8.2 Economics of Spacious and Standard High Rise Rehabilitation Program: Planning for a Land Scarce City
A simple analysis of land use with alternative heights of buildings would reveal great advantages of high rise buildings for in‐situ rehabilitation of slum dwellers. It is demonstrated below, how vertical space can be used to provide spacious accommodations to slum dwellers free of cost and yet be able to create huge corpus to meet every other social obligation for good living conditions. If slum dwellers could be persuaded to contribute, the corpus could be enlarged commensurately. The analysis is based on the ground realities and need for resettlement of slum dwellers which can be further improved by incorporating value of more complex factor of costs and benefits that encompass social and micro issues discussed earlier.
PRINCIPAL PREMISE OF APPROACH
The basic premise is centred on some pragmatic concerns such as scarcity of land, market value of floors, capacity of slum dwellers to pay and need of high quality accommodation fitting in to the concept of modern capital city of Delhi. Given the value of property/ real estate in Delhi, it is demonstrated that the key benefit to slum dwellers in terms of good quality house with space of 270 to 800 sq ft and all other amenities required for good living cam be provided without any additional cost to government and even after that huge fund would be left over to provide other benefits such as healthcare, education and maintenance.

Slums of Delhi
October 2011 Page 182
ASSUMPTION AND SENSITIVITIES
The above proposition is based on survey based data which is presented in Tables 13.3 to 13.5. A flat cost of construction of INR 1200 per sq ft is assumed, which is about 60 per cent of average selling price of high rise residential property in NCT region. An expensive construction cost is assumed to cover the provisioning of sanitation, ventilation, hygiene and light in the same way as it is the case in any modern day high rise residential complex.
The total effective ground area covered by the 477 slum clusters has been estimated as 443 hectare with an inhabitation of 4.34 lakh households. The market price of floors in commercial buildings around the slum clusters is estimated as INR 30900 per square ft on an average (conclusion does not change even with lower sale price). This allows estimation the value of commercial construction generating saleable floor. It has been conservatively assumed that only 40 per cent of the occupied land can be used for construction leaving aside 60 per cent space to meet statutory needs, roads, dispensary, community centre, shops etc. Also this would take care of some of the slums which cannot be rehabilitated due to space constraints. Thus, effective plinth area to be used for in‐situ construction would be about 177 hectare.
The other important assumption is that the government would allow a higher floor to surface index. This is very critical and globally accepted strategy. The assumed flat cost of construction of INR 1200 per sq ft assumed, is sensitive to the height of building but it has been checked that changing this value to even INR 1500 or INR 2000 per sq ft, the conclusion of the analysis does not change. Further, with such expensive construction, the problems of sanitation, ventilation, hygiene and light would be automatically taken care of as it is the case in any modern day high rise residential complex.
Further, the calculation is done with respect to several options of floor area to be allocated to slum dwellers. In case one (Table 13.3 to 13.5), the floor area is assumed to be given is 270 sq ft in seven storey building to 800 ft in21 storey building. In between several cases have been presented in Table 13.3.
Finally, for simplicity it is assumed that the height of commercial and residential blocks would be similar and that these blocks could be separate or mixed as per convenience and location mainly being determined by the saleability of the commercial space. It is easy to calculate the zero surplus cases, which would show the minimum number of commercial floors that would be required to construct but such results are abstracted for the brevity of presentation.
THE CALCULATION AND RESULTS
With above assumption calculation of net benefit to government is calculated under several alternatives heights of building with varying SFI and different payments terms for slum dwellers including free supply. The results are summarised in Table 13.3 and details for two detailed cases are presented in Tables 13.4 and 13.5. Clearly, with increasing SFI the available area of floor increase and this increase in floor size can be exploited economically to meet all costs. Clearly, the net benefit to government increase with floor height of building and it is substantial amount which varies from INR 34899 crore to INR 662925 crore. These calculations are indicative of the possibilities of land use and the welfare gain that can be promised to society.

KEY FINDINGS
This document is intellectual property of Centre for Global Development Research Private Limited, New Delhi prepared with the help of SER Grant extended by the Planning Commission of India. No part of the document can be copied without a written permission of CGDR
Page 183
It is also feasible to give accommodation to slum dwellers even free of cost or alternatively a corpus can be created to maintain health insurance and other facilities such as education for the residents of rehabilitated society for ever.
It can be safely argued that high rise building is one of the highly feasible solutions with in‐situ rehabilitation.

Slums of Delhi
October 2011 Page 184
Chapter 15
Recommendations Slums play a number of essential roles in a city life. In Delhi it provides shelter to about 14 per cent population, who are low‐cost labour, they keep the wheels of the city moving in many different ways. As a first stopping point for immigrants, these slums provide affordable housing that enables them to save for their future absorption. Slums play a significant role in producing the services and commercial activities that the formal sector fails to provide through the mobilization of local enterprises and industry. However, on the negative side, slums are home to toxic and harmful industrial activities, waste materials, ill health, crime, and polluted land. The slums have mostly poor quality housing and residential infrastructure. Therefore, it becomes extremely important to take a balanced view on both aspects of slum behaviour so that they are awarded their rightful place in the centre of policies and politics.
15.1 ISSUES REQUIRING IMMEDIATE ATTENTION
Almost 70 per cent of the slum migrants come from 35 backward districts and 53.07 per cent of the total households are BPL Card Holders. As per the NSSO estimates percentage of population below poverty line for Delhi was estimated at 32 per cent for the year 2009‐10. Therefore, it is found that the percentage of people living below poverty line is much higher in Delhi Slums than the Delhi as a whole. In a way, bulk of the poor in Delhi is residing in the slums. Adequate measures need to be taken to address this issue by formulating various schemes exclusively for the slum dwellers to raise their living standards by providing them adequate employment opportunities, education and medical facilities and redevelopment/ resettlement of slums.
15.1.1 Need to provide common toilets in adequate numbers in each slum
About a quarter of the slums do not have common toilet facility inside the slum and in those slums which have common toilet facility, more than 50 per cent is provided by Sullabh International while government facility covers only 30.61 per cent of slums. Thus, public provisioning of common toilet is extremely poor and the greatest sufferers are women and children. Therefore, government should provide common toilet facility in all the slums not covered so far on an urgent basis.
15.1.2 Need to provide common dust bin in adequate numbers in all slums
In 54 per cent slums common dust bin has not been provided by the MCD. In west Delhi, 91 percent of the slums reported absence of common dust bin and MCD sweepers also do not visit the area. This has been worsening the living condition and driving some of the slums in to slums of despair. Immediate measures should be taken to provide such facility which is most essential to contain disease and illness. It may be noted that intensity of illness is maximum in western slums.

RECOMMENDATIONS AND CONCLUSION
This document is intellectual property of Centre for Global Development Research Private Limited, New Delhi prepared with the help of SER Grant extended by the Planning Commission of India. No part of the document can be copied without a written permission of CGDR
Page 185
15.1.3 Need to depute sweepers in all slums
About 60 per cent of the slum clusters are not visited by MCD sweepers. As a result the residents engage private sweepers, throw garbage in the open or in the open drain causing unprecedented unclean environment. It must be ensured the MCD sweepers also visit the slums regularly to keep the area clean and tidy. Senior officials should check periodically to ensure the visit by the MCD sweepers on roll. Attention should be given in western zone where only 16.54 per cent of the slums have reported visits by MCD sweepers.
15.1.4 Need to increase exposure to medical facilities in and around slums
Government facilities are extremely poor in terms of provisioning of medical facility such as dispensary or mobile vans. In absence of this, the slum dwellers have to visit private doctors or unqualified quacks and have to pay high fees for consultation and medicines. MCD should provide adequate dispensaries in various slum pockets to increase access to medical facility.
15.1.5 Need to increase the intensity of immunization programmes and health check up camps for slums
Government run immunization programmes and health check up camps in slums is highly inadequate except pulse‐polio program and steps should be taken to increase the coverage as well as frequency of such activities in the slums for both preventive and curative action to improve the health status of the slum dwellers.
15.1.6 Need to provide street light in all slums
Survey results indicate that 56 per cent of the slums do not have street lighting inside the slum which cause inconvenience to the slum dwellers and facilitates all sorts of criminal activities. Thus, there is a considerable task pending in terms of provisioning of street light. Some of the slums have been provided with high tower flood lights, which is very useful and it can be easily maintenance with community participation.
15.1.7 Need to increase awareness about medical insurance related schemes among slum dwellers
Only 1.6 per cent of the total households have medical insurance cover and only 5.05 per cent have smart card provided by the government. Only 0.78 per cent of the population has used the smart card. The coverage of smart cards needs to be increased through wide publicity and awareness campaigns among the
Slums of Delhi
October 2011 Page 186
slum dwellers. In addition, an attempt should be made to cover slum dwellers under ESI through some legislation or exemptions.
15.1.8 Need to convert slums in to slums of hope
The “slums of hope” are settlements on an upward trend, largely made up of newer, usually self‐built structures, and that is in or has recently been through a process of development, consolidation and improvement (UN‐Habitat 2007). It is recommended till such time the rehabilitation programme is implemented the existing slums need to be up graded through intervention for improving the existing structures, observing cleanliness drive, organizing awareness programs in respect of health, education and sanitation. The authorities need to ensure the availability of existing facilities for the slums not receiving these facilities adequately.
15.1.9 Need to prevent slums to become slum of despair
The ‘slums of respire” comprises “declining” neighborhoods in which environmental conditions and services are in a process of seemingly inevitable decay (UN‐Habitat 2007). The survey observation indicates existence of several well maintained, tidy and clean slums with adequate infrastructure and amenities in Delhi. These slums should not allow to be further congested by constant monitoring and supervision by the concerned government authorities. The NGOs working in the slums may be used as informers to report any kind of further encroachment of land for jhuggi or commercial use.
15.2 ISSUES IN SUSTAINED DEVELOPMENT AND REHABILITATION
There are several issues that are closely related to slum rehabilitation and redevelopment processes, which need extra care. If the new accommodation is not well planned with adequate space, amenities, open spaces, provisioning of maintenance and ecosystem, confirming to good healthy and hygienic situation, the entire plan can land in to a vertical slum, defeating the very objective of the resettlement project. Similarly Non‐durable and poor construction material is another problem. The cost cutting and profit maximisation objective prevail over the humane considerations. The feeling that the slum dwellers are being doled out subsidised accommodation which any way would be better than the existing houses, may detrimentally dominate the planning process of developers resulting in inferior designs. In absence of buyer‐seller relationship the quality runs the risk of getting compromised and it is here that strong intervention from the government is required to audit the quality by independent agencies. If such monitoring is not done and quality is allowed to be compromised, the condition of the housing complex would very soon deteriorate to the extent that it may end up with vertical slum. Another issue that need attention is about the basic requirements of slum such as road, street light, parks, shopping centre, school, dispensary etc. In terms of basic amenities, all houses must have separate toilets and cooking space of good quality. In order to ensure such design, a well thought out process is needed which may include inter‐alia the following considerations.
15.2.1 Create a database of slum dwellers through systematic census
The importance of identification of the unique ownership of dwelling using biometric survey of owners, exact census of houses, and then strict consistency examination to avoid (1) repeat of house against more than one claimant and (2) repeat of biometric information indicating ownership of more than one slum house, cannot
RECOMMENDATIONS AND CONCLUSION
This document is intellectual property of Centre for Global Development Research Private Limited, New Delhi prepared with the help of SER Grant extended by the Planning Commission of India. No part of the document can be copied without a written permission of CGDR
Page 187
be undermined. Such a process is presented in Figure 13.1 through a flow chart. The data collection must focus on the following minimum variable in addition to household information.
a) Cadastral survey – showing each structure to the scale indicating use and number of stories. b) Socio‐economic survey – collecting detailed information of family of the occupier/ establishment in
an approved format c) Biometric survey – capturing photo of the head of household and his/ her left hand thumb
impression. d) Photo verification – digitally capturing the structure with unique ID number displayed on the same e) Collection of photocopies of documents regarding proof of residence from all slum dwellers f) Preparation of individual files for each slum dweller
15.2.2 Invite high value award winning architectural competition for flats and rehabilitation complex
In order to have access to the best possible design of flats and eco‐system for slum rehabilitation, academic institutions, students, professional bodies and individuals from civil society could be involved by inviting competitions, organising seminars and conferences etc. A good value award may be motivating factor in this effort.
15.2.3 Increase floor space ratio
Good quality house requires adequate floor area. However, given scarcity of land in the capital region, there is no alternative of multi‐storey accommodation which also is the going trend in most of emerging economies such as China, Malaysia, Singapore, Hong Kong etc. In India, floor space index norms are very small; it is just
about 1.5 in Delhi whereas it is 6-10 in Malaysia, Singapore, and China. A modification of these norms are essential to implement efficient strategies. Thus, a good rehabilitation strategy would require increase in SFI norms.
15.2.4 Avoid settlement to become Ghettos
While implementing the in‐situ rehabilitation and resettlement programme, care should be taken to have a mixed land use where along with structures for the slum dwellers, residential flats for the public in general with shopping complex and all necessary infrastructure and facilities could be provided. For this, it is required to engage state of the art architecture companies who could design most modern and attractive models for such mixed land use. The idea is not to brand the settlement as a place only for slum dwellers.

Slums of Delhi
October 2011 Page 188
15.2.5 Avoid ‘totally marketdriven scheme’: It can lead to a potential nightmare
Sometimes planners tend to leave everything to market forces for slum resettlement as is the case of Mumbai project. But they fail to realise that market forces have no welfare motive for slum dwellers and slum dwellers have no capacity to fight with the developers. In absence of assurance of genuine intervention and monitoring by the government, any rehabilitation program would be viewed with suspicion leading to failure. In fact it should be government/ DDA run program as it was the case of Singapore.
15.2.6 Strategise Slum Reduction
Despite several difficulties municipalities in a number of countries have managed to reduce the absolute and relative numbers of slum‐dwellers among their populations. The successful governments took the responsibility for slum reduction on their shoulders, backing commitments with bold policy reforms, and preventing future slum growth with equitable planning and economic policies. Based on policy evidence collected by UN‐HABITAT in 44 successful countries, it can be suggested that successful slum reduction broadly takes a combination of five complementary approaches: (i) awareness and advocacy; (ii) long‐term political commitment; (iii) policy reforms and institutional strengthening; (iv) implementation and monitoring; and (v) scaling‐up of successful local projects.
AWARENESS AND ADVOCACY
Awareness and advocacy, which involves messages on improved living conditions for slum dwellers, is important tool to keep pressure on system to perform and earn goodwill of civil society at large. In order to create awareness, it is important to collect data and information, and do rigorous analyse. Civil society organizations can also encourage political commitment and champion the views and rights of slum dwellers either as watchdogs or as partners in government‐funded programmes.
LONG‐TERM POLITICAL COMMITMENT
Greater political will is required at the highest levels to eradicate slums. This is essential because of the requirement of policy reforms associated with slum development and resettlement.
POLICY REFORM AND INSTITUTIONAL STRENGTHENING
For successful slum upgrading and prevention, it is important to devise and implement a properly funded nationwide urban slum eradication program. Such a program would involve both policy change and institutional strengthening. In Indian case, such policies do exist but they lack focus because of overlapping mandates and funding process and poor coordination between states and centre.
Countries that have been successful in integrating slums into their cities have strengthened their institutions and carried out complementary reforms, which include a broader urban poverty reduction agenda. Some have implemented policies to integrate the urban poor into the legal and social fabric of cities; others have carried out reforms in land and housing provision.

RECOMMENDATIONS AND CONCLUSION
This document is intellectual property of Centre for Global Development Research Private Limited, New Delhi prepared with the help of SER Grant extended by the Planning Commission of India. No part of the document can be copied without a written permission of CGDR
Page 189
IMPLEMENTATION AND MONITORING
Another successful strategy of slum reduction process is to deploy transparent and pro‐poor policies backed up by adequate human and technical resources. Cities and countries that were successful in the delivery of basic services and housing improvements had clear performance monitoring mechanisms that require the involvement of all levels of government. Cambodia, China, and Vietnam, for example, have strict upward accountability regarding municipal implementation on infrastructure. Brazil and Indonesia, on the other hand, have bottom‐up performance monitoring, which enhances citizen participation in planning and decision making. Coordination across government levels and with the private sector is also critical for successful scaling up of slum upgrading projects.
SCALING‐UP
Replication and scaling‐up of successful slum‐upgrading pilot projects have served many developing countries with measurable impacts on national indicators of slum growth. As originally modest‐scale programmes were upgraded in many countries the private sector and civil society became involved, or the schemes benefited from additional funding for replication and mainstreaming into government policies. Other countries, including China, Chile and South Africa, engaged in large‐scale public subsidies to the housing sector, in a bid to reach the poorest groups and meet the rising costs of social housing. In most cases, success mobilized huge domestic as well as external resources to promote innovative strategies, including for slum prevention.
15.3 PREVENT CITY FROM FUTURE SLUMS
It is well known proverb, ‘prevention is better than cure’. However, prevention strategy must be based sound knowledge about the source, symptoms, and quantum of problem/ threat. Migration of rural labour to cities should be recognised as an essential evil and it will increase with increasing industrialisation and services sector. Therefore, any planning process for the industrialisation and services sector must include the issue of accommodation for labour as an integral part. Who would bear the cost can be a matter of detail, but its’ seriousness cannot be brushed aside.
15.3.1 Fix responsibility for any upcoming slum
Despite several attempts of resettlement programs for slums during post independence period, mushrooming of slums went unabated across the entire city of Delhi. In 1976 a major drive was taken to demolish slum settlements and those affected were sent to resettlement colonies in Kalyan Puri, TriLok Puri, Himmat Puri, Nand Nagari etc. But the survey records indicate that there was no initiative by the authorities to prevent further slums to come up after that. It is surprising to find that since 1976, 367 new slums have

Slums of Delhi
October 2011 Page 190
come up in various parts of the city. Maximum number of 111 slums in west Delhi, followed by 100 in south, 71 in east, 52 in north and 33 in centre have been reported. It indicates serious negligence and apathy on the part of local administration including local Police and MCD/ DDA officials.
Therefore, along with implementing rehabilitation and resettlement schemes it is essential to take strong and effective measures to check further growth of slums by fixing responsibility and provisioning strong punishment for those who show negligence to the duty assigned for the purpose. Then only the birth of new slums could be contained and the goal of ‘slum free city’ could be successful. It is beyond comprehension that slums could develop and continued to flourish without protection of administration.
15.3.2 Conduct studies to understand the size and characteristics of migrants
This study has helped estimate the origin of migrant population to Delhi slums and it was found that around 60 per cent have come from U.P. and 20 per cent from Bihar and also the districts from where maximum people have come. Slums provided assured shelter for the migrants from the backwards areas to Delhi in search of livelihood. In absence of slums, the rate of migration is likely to come down but still people will migrate with the increasing demand for work force in the NCR including Delhi. Such migrant population would require affordable housing and therefore, it is desirable to keep an eye on the size and characteristics of the migrants to estimate the future demand for low cost housing for the poor migrant population.
15.3.3 Build temporary shelters for migrating people
Temporary shelters or transit camps could be set up to provide temporary accommodation to the migrant population coming to Delhi in search of jobs till such time they are gainfully employed and move to an alternative accommodation. This will on the one hand attract the desired work force to come to NCR and also prevent slums from coming up further. However, such shelters should neither be free of cost nor it should give impression of permanent solution. Variety of hostel type accommodation can be thought off to suite different class of migrants with different capacity to pay. It can be a common hall type accommodation to highly modern hostel type accommodation.
CONCEPT OF COMMON HALLS TYPE ACCOMMODATION
A common hall could be Dharamshalla type accommodation where, all facilities are available at a very nominal price, which is enough to maintain the toilet, wash rooms, electricity, cleaning and attendant staff. There is no provision of cooking space but hall can be of different sizes with different payment structure. Such hall type accommodation can be provided near industrial estates, large markets and residential areas. A complete identifying detail of all residents must be maintained as it is done in dharamshalas. Such facilities must be multi‐storey buildings to save land and maximise accommodation.
CONCEPT OF MODERN HOSTEL
There may be a class of migrant who can pay higher amounts and who could adapt to a modern life style with community facility. Such migrants can be housed in accommodations with one room and common toilets and a common hall for cooking just like modern hostels in western universities. There is no ownership of house and every household allotted has to pay for the cooking gas and maintenance for toilet, washroom and other common facility equally. The cooking hall would have series of cooking tables with fixed gas stoves
RECOMMENDATIONS AND CONCLUSION
This document is intellectual property of Centre for Global Development Research Private Limited, New Delhi prepared with the help of SER Grant extended by the Planning Commission of India. No part of the document can be copied without a written permission of CGDR
Page 191
connected through fail‐safe gas pipeline. Such hostel should be manned with enough staff to take care of discipline and maintenance. Again a complete identifying detail of all residents must be maintained and such facilities must be multi‐storey buildings to save land and maximise accommodation.
15.3.4 Encourage industrial complexes to build accommodation for labour and temporary allotment
It is also suggested to motivate and encourage industrial complexes to build accommodation for labour staff quarters. Every industrial city should have a well planned labour colony attached to it. Indian Railways is an outstanding example of accommodation provider for almost all its staff. A similar model can be developed with private sector participation for workers in each industrial estate. These accommodations could be owned by a cooperative of industrialists in the region.
15.4 POTENTIAL REHABILITATION STRATEGIES
The experience suggests that addressing the issue of rehabilitation & up gradation of slums for achieving the Millennium Development Goal towards a slum free society is not an easy task to achieve and huge amount of commitment is needed to fructify the ideas. Several complexities and issues need to be resolved while planning for a viable rehabilitation strategy. There are two major options for the rehabilitation and resettlement approach:
(1) Resettlement outside the present site in the outskirts of the city
(2) In‐situ rehabilitation in reconstructed housing or improved housing
Resettlement in the out skirts of the city would involve addressing vital issues of employment opportunities for those who are engaged as household help, self employed like electricians, masons, carpenters or running small business or informal industrial units including leather, pottery, textiles, food production like bakery & confectionery , garbage collection and recycling manufacturing units like welding, carpentry; providing for infrastructure & amenities, facilities for children seduction, health and so on.
Considering the employment avenues, in‐situ rehabilitation is desired alternative but a sizable number of slums, which are located closer to railway lines and severe lines, are not good cases for in‐situ rehabilitation. However, such slums can be merged with other slums for rehabilitation. Whether, in‐situ or outside rehabilitation there are four broad alternatives that has been practiced globally as also in Delhi:

Slums of Delhi
October 2011 Page 192
(1) Give a small plot of land to the slum dwellers, which ensure land title enabling them to get loan to construct affordable better house;
(2) Give land ownership right to the existing slum dwellers as and where they are basis and allow then to build affordable houses while government providing the infrastructure. This is also known as Tokyo Model.
(3) Construct small flats with common amenities in low rising building and allocate such flats to slum dwellers; and
(4) Construct very high rise buildings and give spacious flats to slum dwellers at affordable cost/ rent. This also known as Singapore Model
15.4.1 Alternative strategies of rehabilitation
(1) EXPERIENCE WITH PLOT BASED REHABILITATION
Ex‐post analysis would reveal this to be one of most lucrative alternatives over time. However, considering the present day situation of land scarcity, it is neither feasible nor possible to provide alternative land in lieu of the present slum house.
(2) EXPERIENCE WITH SPACE CONSTRAINED LOW RISING BUILT‐UP FLATS
The main problem with space constrained development is that the developers in these cases are only responsible for constructing the buildings and bother less about civic infrastructure such as drainage, water or sanitation. As a result, instead of horizontal slums, the scheme has successfully created vertical slums. Due to poor quality of construction and subsequent casual approach to maintenance, seepages start, lifts do not work and walls cave in.
(3) IN‐SITU IMPROVEMENT, TOKYO WAY
Give land ownership right to the existing slum dwellers ‘as and where they are’ basis and allow then to build affordable houses. This is the idea; every slum dweller would love to happen. After all, it would give them the most precious thing in Delhi, the land. This idea comes from those particularly in context of Dharavi and It is favoured by those who consider that the life style of slum dwellers and their livelihood pattern must be preserved. In slums like Dharavi for several people, home is also the work place with small‐scale, family‐type businesses for the owners and therefore, shifting them in better house without ensuring the continuity of the work would be impractical proposition. Thus, many would like to argue that Dharavi is not a mess, but quite on the contrary a highly sophisticated and efficient urban organism with vibrant traditions and culture. In such places, it may be efficient to retrofit infrastructure and let the people construct their own homes as they like.
Example of Tokyo is often sited and parallels drawn between Dharavi and Tokyo. Post war period, Japan Government could not provide home to massive influx of people in cities and therefore, allowed poor people to build their own affordable homes in an organic way and simply helps them with electricity, sanitation and amenities.

RECOMMENDATIONS AND CONCLUSION
This document is intellectual property of Centre for Global Development Research Private Limited, New Delhi prepared with the help of SER Grant extended by the Planning Commission of India. No part of the document can be copied without a written permission of CGDR
Page 193
Whether, Delhi needs to follow this model is questionable because the slum conditions here are not like Dharavi. The shelters are predominantly disconnected with the work place and there is no reason to believe that the Delhi slums have organic development and interwoven life style. However, walking through narrow but fully paved lanes of Tokyo is delight but that is an experience of rapidly grown economy with huge personal commitments of government officials and civil society.
Nevertheless, land is too scarce in Delhi and the pressure on land use would continue to grow for all times to come. City cannot afford to remain flat and congested. It must grow vertically to accommodate inflows of population from all over the country.
(4) SPACIOUS FLATS IN SKY SCRAPERS
Utilisation of vertical space with strong foundations has several advantages in cities where cost of land is very high and the population is increasing beyond control. Singapore experiment is not the only one such example of resettlement but certainly it is one of the most successful one. Accommodation in multi‐storeyed apartment is flexible as it can be made spacious, with centralised supply of water and electricity. Enough space is left for roads, hospitals, schools and other infrastructure. With larger space for accommodation, it is easier to negotiate with the slum dwellers to move out. In‐situ resettlement makes it more attractive. A detailed economic analysis presented in the following section would reveal that free accommodation as large as 800 square feet is possible if buildings are allowed to acquire sufficient height.
The economics should be meticulously worked out and negotiated hard if developers are to be involved. Alternatively, the government itself should pursue such projects given the sensitivities involved with economy of scale.
15.4.2 Affordable housing
Several migrants have capacity to buy houses if they are affordable and cheap. Prefabricated technology in construction has made some designs affordable. However, such buildings can at best be few storeys tall in structure. It would require large ground to accommodate the entire slum population.
15.4.3 Standard High Rise Rehabilitation Program: Planning for a Land Scarce City
Given the scarcity of land in Delhi, and general consensus about the superiority of in‐situ rehabilitation, the economic analysis favours schemes with skyscrapers at the centre stage. The calculations indicate that there is hardly any cost to government and by increasing the floor to surface index huge fund can be generated that can meet all the requirement of rehabilitation as well as welfare activities.

Slums of Delhi
October 2011 Page 194
Plot should be rules out as it is too costly asset for Delhi. Option for high rise building is the most pragmatic option. However, there should be categorisation. The high rise buildings of 11‐21 storeys could be constructed with earth‐quack resistance structure of Japanese Technology with best architectural design for space and multiple heavy duty elevators/ lifts. Such accommodation is feasible without cost to government as calculated in Chapter 13.
The carpet area of these flats can be fixed from 240 sq ft to 750 sq ft. A 240 sq ft flat can have 80 ft bed room, 40 ft kitchen, 30 ft toilet and 90 ft living room. The design must be standardised to save cost and complexities. Larger flats can have accordingly standard size rooms. The floor allotment should be done through random number and cost should be fixed. Each block should have a registered cooperative society before hand to take charge of maintenance of the flats.
Each such tower of say 16 storeys could have at least 1600 flats, with 2X50 flats at each floor. About 300 towers of this kind can accommodate all slum dwellers. However, the design must not be such that the entire complex becomes a vertical slum. It must be an earthquake resistant eco‐friendly structure with enough space on the ground for parking, play ground, market and entertainment centre.
The 300 such towers should be spread according to the concentration of slums and public private partnership can play important role developing the area in such a way that all the three parties the government, the slum dwellers and the developer end up in a win‐win situation. However, a preferred solution would be the one where Delhi Development Authority itself takes the entire responsibility and uses consultants and contractors to perform the job. This would simply the decision making and the surplus could be channelled for welfare purposes.
It is recommended to take into account the affordability factor into consideration so that the type of space to be provided to the slum dwellers is determined on the basis of affordability. Free accommodation could be provided to those who have no capacity to afford anything against the house offered.
Two to three categories of flats could be built and offered to those willing to pay at the prescribed price fixed by the government. The basic idea behind this is to give an opportunity to those slum dwellers having capacity to pay for a bigger size accommodation. In this context price tags can be fixed in accordance to combinations in Table 13.3.

REFERENCES
This document is intellectual property of Centre for Global Development Research Private Limited, New Delhi prepared with the help of SER Grant extended by the Planning Commission of India. No part of the document can be copied without a written permission of CGDR
Page 195
References Bano, M. (2008). "Whose Public Action? Analysing Inter‐sectoral Collaboration for Service Delivery, Pakistan Sanitation Case Study: Orangi Pilot Project‐Research Training Institute’s (OPP‐RTI’s) Relationship with Government Agencies." Retrieved 11‐04‐2011, from URL: http://www.idd.bham.ac.uk/research/pdfs/Pakistan_OPP‐Sanitation.pdf.
Chandrashekhar, T. (2011). "Transforming Mumbai into a World Class City Resettlement & Rehabilitation of Urban Poor." Retrieved 14‐04‐2011, from URL: darpg.nic.in/darpgwebsite_cms/Document/file/slum.ppt
Clinton, L. (2010). "The remaking of a slum: the World is watching Dharavi." Retrieved 11‐04‐2011, from URL: http://beyondprofit.com/the‐remaking‐of‐a‐slum‐the‐world‐is‐watching‐dharavi/.
Committee‐of‐Experts‐on‐DRP. (2009). "DRP Letter by Committee of Expert." from URL: http://www.dharavi.org/Dharavi_Advocacy/I._Government_Documents/DRP_Letter_by_Commitee_of_Experts.
D'Souza, L. (2004). "Why has city's slum rehab plan flopped?” Retrieved 11‐04‐2011, from URL: http://www.sra.gov.in/htmlpages/RehabPlan.htm.
Dafe, F. (2009). No Business like Slum Business? the Political Economy of the Continued Existence of Slums: A Case Study of Nairobi. Working Paper 09‐98. London, London School of Economic and Political Science
Fernando, V. (2009). "In the Heart of Bombay: the Dharavi Slum." Retrieved 11‐04‐2011, from URL: http://base.d‐p‐h.info/fr/fiches/dph/fiche‐dph‐7867.html.
Hasan, A. and M. Mohib. (2003). "Urban Slum Reports: The case of Karachi, Pakistan." UNDERSTANDING SLUMS: Case Studies for the Global Report on Human Settlements 2003 Retrieved 11‐04‐2011, from URL: http://www.ucl.ac.uk/dpu‐projects/Global_Report/pdfs/Karachi.pdf.
Huchzermeyer, M. (2008). "Slum Upgrading in Nairobi within the Housing and Basic Services Market A Housing Rights Concern." Journal of Asian and African Studies, 19‐39; Vol 43(1): 19‐39.
ICICI (2009). Dharavi – A Realty Story 2025, ICICI property Services, July 20, 2009.

Slums of Delhi
October 2011 Page 196
Kalyani Menon‐Sen (2011) Evicted Residents in New Delhi Demand 'Real' Resettlement Policies. URL: http://newsblaze.com/story/20110803050505iwfs.nb/topstory.html
Kamath, N. (2011). "More stumbling blocks for Dharavi revamp’ by, Hindustan Times 22.01.11:" Retrieved 11‐04‐2011, from URL: http://dharavi.org/F._Press/2011/22.01.11 per cent3A_More_Stumbling_Blocks_for_Dharavi_Revamp.
Kamath, R. (2009). "Dharavi redevelopment: Back to square one." Retrieved 11‐04‐2011, from URL:
http://www.business‐standard.com/india/news/dharavi‐redevelopment‐back‐to‐square‐one/379143/.
Kirk, L. and P. Potekhin. (2010). "Tackling urban slums: The bottom‐up approach." Retrieved 11‐04‐2011, from URL: http://internal‐voices.blogspot.com/2010/12/tackling‐urban‐slums‐bottom‐up‐approach.html.
Lamarca, M. G. (2010). "Contested Urbanism: Reclaiming the Right to the City in Dharavi?." Retrieved 11‐04‐2011, from URL: http://www.thepolisblog.org/2010/04/contested‐urbanism‐reclaiming‐right‐to.html.
Lead‐Case‐Studies. (2004). "Sustainable Development in the Coastal City of Karachi: The Links between Conservation and Industry in Pakistan." Retrieved 11‐04‐2011, from URL: http://casestudies.lead.org/index.php?cscid=142.
Mitullah, W. (2003). "Urban Slum Report: the Case of Nairobi, Kenya." Retrieved 11‐04‐2011, from URL: http://www.begakwabega.com/documenti/Nairobi‐HabitatReport2003.pdf
MULCAHY, M. and M.‐R. CHU. "Kibera soweto east: a case study in slum upgrading’." Retrieved 11‐04‐2011, from URL: http://www.design.upenn.edu/new/cplan/02b_KiberaMulcahy.pdf.
Planning‐Commission (2002). Report of the Committee on Problems of Slums in Delhi, Government of India.
Rodrigues, R. I. and S. Kanto (2007). SLUMS UPGRADING IN BRAZIL DURING THE 1990S: AN EVALUATION USING CENSUS DATA. Fourth Urban Research Symposium, Institute of Applied Economic Research
Sharma, K. (2006). "Can a slum become a world class township?" Retrieved 10‐04‐2011, from URL: http://www.thehindu.com/2006/10/06/stories/2006100602341200.htm.
Sharma, K. (2009). "Invisible people” Retrieved 11‐04‐2011, from URL: http://www.hinduonnet.com/mag/2009/09/20/stories/2009092050110300.htm.
Sharma, K. (2009). "A reprieve for Dharavi” Retrieved 11‐04‐2011, from URL: http://infochangeindia.org/Urban‐India/Cityscapes/A‐reprieve‐for‐Dharavi.html.
Siddhaye, N. (2011). "Are MMRDA’s rehab colonies vertical slums?" Retrieved 10‐04‐2011, from URL: http://www.dnaindia.com/mumbai/report_are‐mmrdas‐rehab‐colonies‐vertical‐slums_1521714.
Sturco, G. D. (2010). "Mumbai." Retrieved 11‐04‐2011, from URL: http://myborderlight.blogspot.com/2010/11/mumbai‐by‐giulio‐di‐sturco.html.
UN‐HABITAT. (2001). "UN‐HABITAT 2001, The State of the World’s Cities Report 2001” Retrieved 10‐04‐2011, from URL: http://ww2.unhabitat.org/istanbul+5/statereport.htm.
UN‐HABITAT (2003). The Challenge of Slums, Global Report on Human Settlements 2003, United Nations Human Settlements Programme London, Earthscan.
REFERENCES
This document is intellectual property of Centre for Global Development Research Private Limited, New Delhi prepared with the help of SER Grant extended by the Planning Commission of India. No part of the document can be copied without a written permission of CGDR
Page 197
UN‐HABITAT. (2003a). "Case Studies 3: THE SANTO ANDRÉ MAIS IGUAL PROGRAM: Interventions at Sacadura Cabral, Tamarutaca, Capuava and Quilombo II: Santo André – SP." CAIXA Program for Best Practices in Local Management Retrieved 11‐04‐2011, from URL: http://www.bestpractices.org/learning/casestudies/e_santoandre_ingles.PDF.
UN‐HABITAT (2008). The State of the World’s Cities 2008/2009: Harmonious Cities New York NY, United Nations Publications
UN‐HABITAT (2010). The State of the World’s Cities 2010/2011: Bridging the Urban Divide New York NY, United Nations Publications
Urban‐Development‐Authority‐Singapore‐Government; "Our History." Retrieved 11‐04‐2011, from URL: http://www.ura.gov.sg/about/ura‐history.htm.
World‐Bank (2009). World Development Report 2009, Reshaping Economic Geography, the World Bank.
Yuen, B. (2004). Planning Singapore Growth for Better Living. In Enhancing Urban Management in East Asia. B. Y. a. M. Freire. Hampshire, U.K, Ashgate Publishing.
Yusuf, S. and K. Nabeshima (2006). Post‐industrial East Asian Cities, Innovation for Growth. Palo Alto, CA, and Washington, DC, World Bank and Stanford University Press.

Slums of Delhi
October 2011 Page 198
Annexure
ANNEXURE‐1
TABLE A1: LIST OF MAP LOCATION WITH 477 SLUMS Slum Location No.
Location Name Number of Slum
Ward No.
Ward Name Slum No
Slum Name
1 ‘0' Pushta 1 250 Zaffrabad 206 E‐43 E,L,I,J Block (along Pusta) Jaffrabad
2 Adarsh Nagar 2 14 Adarsh Nagar 235 Jhuggi Moolchand Colony , Adarsh Nagar
414 J.J. Colony Sarai pipalthala, New Adarsh Nagar
3 AGCR Enclave 1 226 Vishwash Nagar 45 AGCR Enclave Camp, Behind Laxmi Public School
4 Anand Parvat
3 71 Sangam Park 230 Om Nagar Dhobi Ghat Camp, Sangam Park
367 Taliwalan Basti, Anandparvat –G,Block
94 West Patel Nagar 313 Nepali Mandir Basti Camp , Anand Parvat
5 Andruj gang 1 159 Andrews ganj 263 Indira Camp, Andruj GanJ Road No‐3
6 Arjun Nagar(e) 2 228 Preet Vihar 47 Indira Camp , AGCR near Karkarduma Court
226 Vishwash Nagar 455 Sanjay Amar Colony
7 Aruna Nagar 5 78 Majnu ka tila 125 Balmiki Camp, N‐74, near Bullward Road
237 J.J. Cluster, Madarasi Colony Sim Colony
240 J, Block Camp , Majnu Ka Tilla, Aruna Nagar
245 N‐ 68 Cluster , Majnu Ka Tilla, New Block near Poonarvas Baccha Ghar, Aruna Nagar
473 Tibbat Camp, Majnu Ka Tilla, Opposite Aruna Nagar
8 Aya Nagar 2 175 Aya Nagar 129 Shanti Colony , Mandi Village Pahari
132 J. J. Cluster Bhim Basti , Juna Pur
9 Azadpur 1 14 Adarsh Nagar 377 J.J.Camp, Railway Road, Shadi Nagar Azadpur
10 Badarpur 1 203 Badarpur 299 Mohan Bagh Camp , near Cinema Hall Badar Pur
11 Badli 1 17 Samayapur Badli 468 J.J. Camp, M.C.D. Colony Badli
12 Baljeet Nagar 3 94 West Patel Nagar 450 Gayatri Colony , near Gulshan chowk Baljeet Nagar
451 New Gummad Camp , Gali No‐1 To 5
452 Gulshan Chowk Punjabi Basti, Baljeet Nagar
13 Bhogal 1 154 Nizamuddin 149 Sanjay camp

ANNEXURE
This document is intellectual property of Centre for Global Development Research Private Limited, New Delhi prepared with the help of SER Grant extended by the Planning Commission of India. No part of the document can be copied without a written permission of CGDR.
Page 199
Slum Location No.
Location Name Number of Slum
Ward No.
Ward Name Slum No
Slum Name
14 Bijwasan 1 141 Bijwasan 376 Nehru Camp
15 Brahampuri
2 250 Zaffrabad 381 T‐Huts E‐13 Block, Jaffrabad
405 Barham Puri E‐16 Block(3‐K) , Jafrabad
16 C Block Janakpuri
2 131 Sagar pur 104 J.J.Camp Gate No.‐ 4, Tihar jail
131 Sagar pur 105 J.J.Camp Gate No.‐ 4, Tihar jail
17 C.R.R.I. 2 193 Sriniwaspuri 292 C.R.R.I. Priya Camp, Mathura Road ,Okhla Ph.II
293 C.R.R.I. Indira Gandhi Camp, Mathura Road, Okhala Ph.‐II
18 Chandiwala Eye Institute
4 196 Kalkaji 71 Manav Kalyan Camp, near Chandiwala Estate
268 Sarvodaya Camp , near Balaji Camp School No‐2 Part ‐II
274 Sudhan Camp, Kalkaji
432 Transit Camp, Saheed Rajiv Gandhi Colony
19 Chitra Vihar 1 221 Kishan Kunj 214 Rajiv Gandhi Camp , Chitra Vihar
20 Choukhandi 2 114 Tilak Nagar 91 Jagat Mata Kusth Asharam, Tilak Nagar
114 Tilak Nagar 324 Indira colony , Choukhandi
21 Civil Center Tower
1 81 Minto Road 100 J.J.Camp, Girdhari Lal Hospital , Kamla Market New Delhi
22 Civil Lines 2 78 Majnu ka tila 124 J.J. Cluster , Khebar Pass 84
246 Balmiki Camp , Khebar Pass, Civil line
23 Dakshinpuri 6 180 Dakshin Puri Ext. 262 Saheed Camp ,Dakshin Puri, Block 16‐17
416 Subhash Camp, Block ‐ 5 Dakshin Puri
419 Sanjay Camp, D D A Mkt Dakshin Puri
495 Mini Subhash Camp , Dakshin Puri Block 14
496 Dalit Camp , Dakshin Puri
497 BanjaraCamp Main Road Market, Dakshin Puri
24 Daryaganj (Dolls museum)
1 153 Darya Ganj 116 Balmiki Bhati Camp, Behind of Jansatta press
25 Deen Dayal Upadhyay Marg
8 81 Minto Road 2 J.J.cluster , Dhobi Ghat No‐9 Press Road
3 J. J.Cluster , Dhobi Ghat No‐12 Press Road
4 J.J. Cluster, Dhobi Ghat No ‐8
5 J.J.Cluster, Dhobi Ghat No‐11 Press Road
6 J. J. Cluster, Dhobi Ghat No‐28
7 J.J.Cluster , Dhobi Ghat No ‐7
23 J.J.cluster, Dhobi Ghat No‐10

Slums of Delhi
October 2011 Page 200
Slum Location No.
Location Name Number of Slum
Ward No.
Ward Name Slum No
Slum Name
110 J.J.Cluster, Dhobi Ghat‐28 Minto Road
26 Derawal Nagar
2 72 Model Town 102 J.J. Cluster, Hanuman Mandir Model Town
72 Model Town 126 Khilona Bagh Camp, near Gurudwara Model Town
27 Dev Nagar 4 92 Dev Nagar 29 Ambedkar Jhuggi Basti Sangharsh Samiti, Part‐II Dev Nagar Rohtak Road.
30 Ambedkar Jhuggi Basti Sangharsh Samiti, Part‐I Dev Nagar Rohtak Road.
31 P‐10 –Quarter Camp, Dev Nagar near Railway Colony
32 Tanki Wala Camp, Railway Colony
28 Dilshad Colony 4 241 Dilshad Garden 14 Dr.Rajender Prashad Conony
41 E‐139 Jhuggi Basti , near Hanuman Mandir
237 Sahadra 122 Aradhak Nagar Camp
241 Dilshad Garden 159 J.J.Cluster, Opposit Swami Dayanand Hospital
239 Vivek Vihar 162 Dr. Rajender Prasad T.Huts, E‐120 Dilshad Garden
29 Dilshad Garden 5 239 Dilshad Colony 187 Deepak Colony Block‐E‐103 , Dilshad Garden
238 Dilshad Garden 209 Sonia Camp , near Dilshad Garden
239 Dilshad Garden 403 Kalendar Colony, E‐59 Dilshad Gadan
239 Vivek Vihar 467 Dilshad Vihar
30 Dr. Lohia Industrial area
3 62 Ram pura 478 B‐Block Camp, Lawrence Road Industrial Area
479 J.J.Camp No.‐ 86 , near Railway Line Lawrence Road
481 Maharshi Valmiki Jhuggi Camp, Lawrence Road
31 Durga Colony 1 129 Dabri 318 DDA Pocket 8 camp, Durga Park
32 Dwarka Sec‐7 1 145 Palam 108 Gariyal Mohlla, near palam
33 East Guru Angad Nagar
1 221 Kishan Kunj 181 East Guru Angad Nagar, DESU office near Radhu Place Laxmi Nagar
34 East of Kailash 1 192 Greater Kailash‐1 304 Asoka Bindu Shar Camp, East of Kailash Block ‐C
35 Ekta Vihar R.K.Puram
2 168 Nanak Pura 288 Ekta Vihar Camp
167 R.K. Puram 385 Ambedkar Basti Camp
36 G.P.O. 2 77 Kashmere Gate 10 J.J.Cluster, Railway Colony Camp
12 Old Gas Factory , Railway Colony
37 G.T.B. Nagar 1 12 G.T.B. Nagar 253 Outer Lane near Gurudwara Kingsway Camp
38 Gandhi 1 153 Darya Ganj 112 Gandhi Sahitya Samiti Camp
39 Gandhi Nagar 2 234 Gandhi Nagar 123 Sonia Gandhi Camp, Gandhi Nagar
163 Block‐G, E/14 Gandhi Nagar
40 Geeta Colony 2 229 Geeta Colony 225 Nursury Jhuggi , near Samshanghan Ghat Geeta Colony
368 Safada Mukhi Camp , Geeta Colony
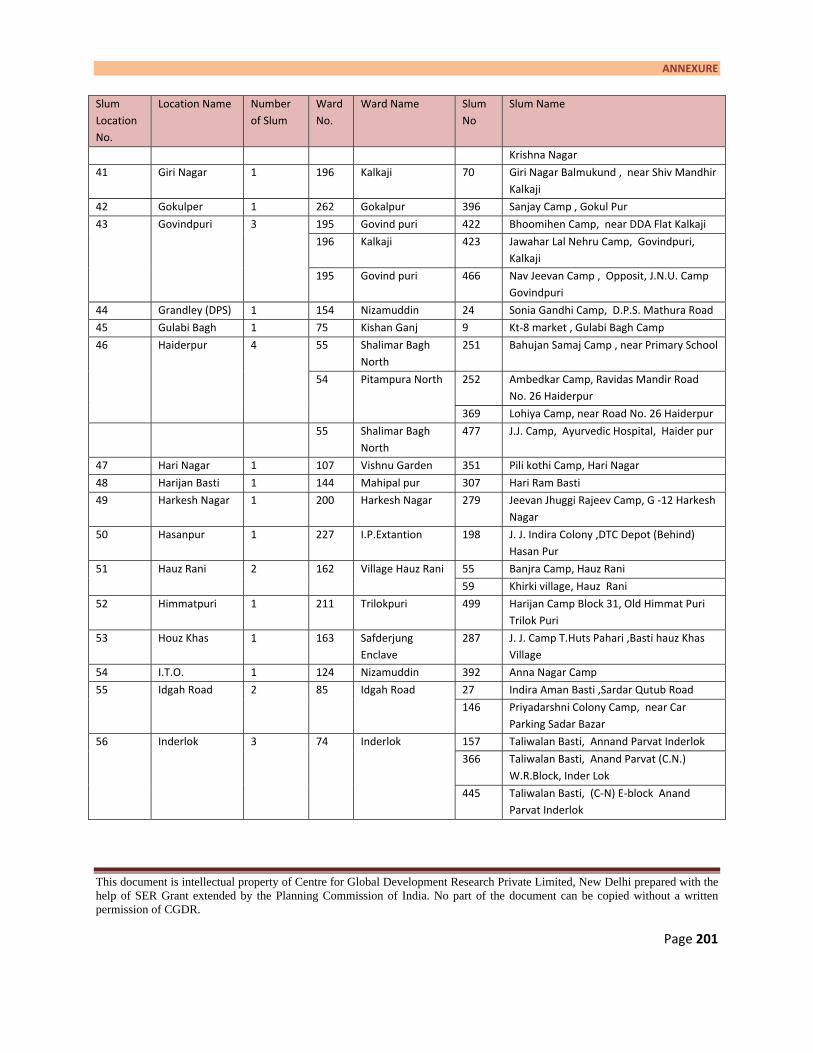
ANNEXURE
This document is intellectual property of Centre for Global Development Research Private Limited, New Delhi prepared with the help of SER Grant extended by the Planning Commission of India. No part of the document can be copied without a written permission of CGDR.
Page 201
Slum Location No.
Location Name Number of Slum
Ward No.
Ward Name Slum No
Slum Name
Krishna Nagar
41 Giri Nagar 1 196 Kalkaji 70 Giri Nagar Balmukund , near Shiv Mandhir Kalkaji
42 Gokulper 1 262 Gokalpur 396 Sanjay Camp , Gokul Pur
43 Govindpuri 3 195 Govind puri 422 Bhoomihen Camp, near DDA Flat Kalkaji
196 Kalkaji 423 Jawahar Lal Nehru Camp, Govindpuri, Kalkaji
195 Govind puri 466 Nav Jeevan Camp , Opposit, J.N.U. Camp Govindpuri
44 Grandley (DPS) 1 154 Nizamuddin 24 Sonia Gandhi Camp, D.P.S. Mathura Road
45 Gulabi Bagh 1 75 Kishan Ganj 9 Kt‐8 market , Gulabi Bagh Camp
46 Haiderpur 4 55 Shalimar Bagh North
251 Bahujan Samaj Camp , near Primary School
54 Pitampura North 252 Ambedkar Camp, Ravidas Mandir Road No. 26 Haiderpur
369 Lohiya Camp, near Road No. 26 Haiderpur
55 Shalimar Bagh North
477 J.J. Camp, Ayurvedic Hospital, Haider pur
47 Hari Nagar 1 107 Vishnu Garden 351 Pili kothi Camp, Hari Nagar
48 Harijan Basti 1 144 Mahipal pur 307 Hari Ram Basti
49 Harkesh Nagar 1 200 Harkesh Nagar 279 Jeevan Jhuggi Rajeev Camp, G ‐12 Harkesh Nagar
50 Hasanpur 1 227 I.P.Extantion 198 J. J. Indira Colony ,DTC Depot (Behind) Hasan Pur
51 Hauz Rani
2 162 Village Hauz Rani 55 Banjra Camp, Hauz Rani
59 Khirki village, Hauz Rani
52 Himmatpuri 1 211 Trilokpuri 499 Harijan Camp Block 31, Old Himmat Puri Trilok Puri
53 Houz Khas 1 163 Safderjung Enclave
287 J. J. Camp T.Huts Pahari ,Basti hauz Khas Village
54 I.T.O. 1 124 Nizamuddin 392 Anna Nagar Camp
55 Idgah Road 2 85 Idgah Road 27 Indira Aman Basti ,Sardar Qutub Road
146 Priyadarshni Colony Camp, near Car Parking Sadar Bazar
56 Inderlok 3 74 Inderlok 157 Taliwalan Basti, Annand Parvat Inderlok
366 Taliwalan Basti, Anand Parvat (C.N.) W.R.Block, Inder Lok
445 Taliwalan Basti, (C‐N) E‐block Anand Parvat Inderlok
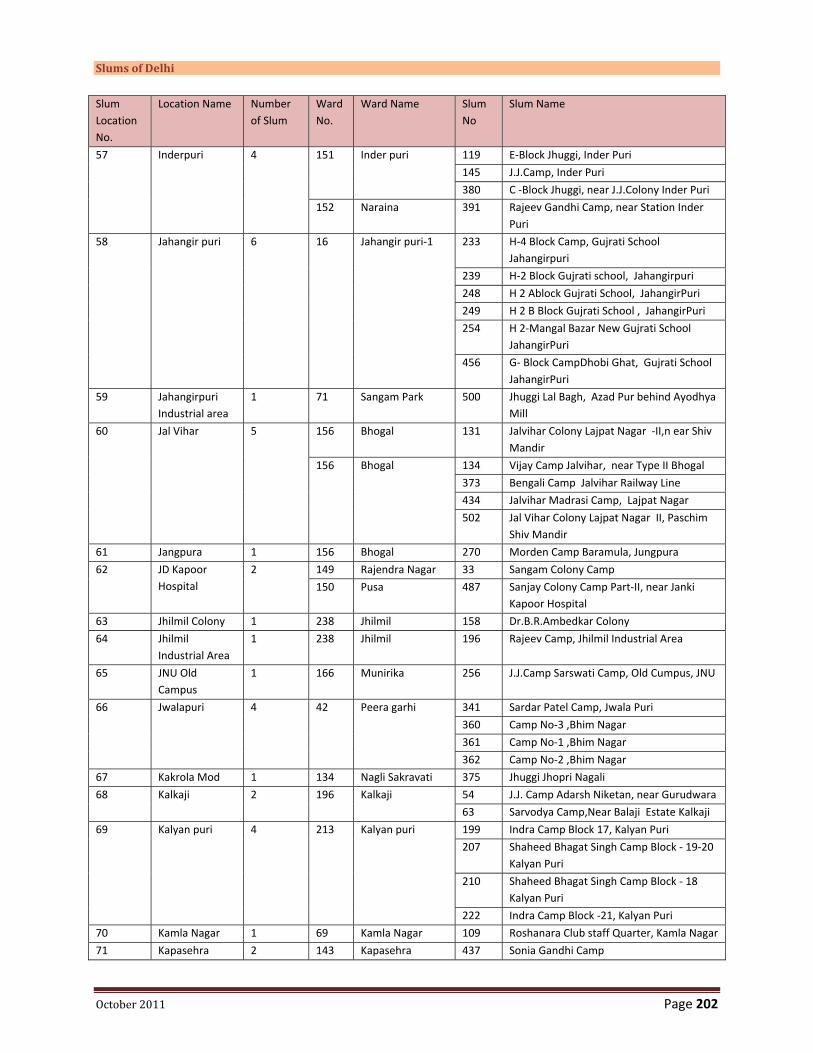
Slums of Delhi
October 2011 Page 202
Slum Location No.
Location Name Number of Slum
Ward No.
Ward Name Slum No
Slum Name
57 Inderpuri 4 151 Inder puri 119 E‐Block Jhuggi, Inder Puri
145 J.J.Camp, Inder Puri
380 C ‐Block Jhuggi, near J.J.Colony Inder Puri
152 Naraina 391 Rajeev Gandhi Camp, near Station Inder Puri
58 Jahangir puri 6 16 Jahangir puri‐1 233 H‐4 Block Camp, Gujrati School Jahangirpuri
239 H‐2 Block Gujrati school, Jahangirpuri
248 H 2 Ablock Gujrati School, JahangirPuri
249 H 2 B Block Gujrati School , JahangirPuri
254 H 2‐Mangal Bazar New Gujrati School JahangirPuri
456 G‐ Block CampDhobi Ghat, Gujrati School JahangirPuri
59 Jahangirpuri Industrial area
1 71 Sangam Park 500 Jhuggi Lal Bagh, Azad Pur behind Ayodhya Mill
60 Jal Vihar 5 156 Bhogal 131 Jalvihar Colony Lajpat Nagar ‐II,n ear Shiv Mandir
156 Bhogal 134 Vijay Camp Jalvihar, near Type II Bhogal
373 Bengali Camp Jalvihar Railway Line
434 Jalvihar Madrasi Camp, Lajpat Nagar
502 Jal Vihar Colony Lajpat Nagar II, Paschim Shiv Mandir
61 Jangpura 1 156 Bhogal 270 Morden Camp Baramula, Jungpura
62 JD Kapoor Hospital
2 149 Rajendra Nagar 33 Sangam Colony Camp
150 Pusa 487 Sanjay Colony Camp Part‐II, near Janki Kapoor Hospital
63 Jhilmil Colony 1 238 Jhilmil 158 Dr.B.R.Ambedkar Colony
64 Jhilmil Industrial Area
1 238 Jhilmil 196 Rajeev Camp, Jhilmil Industrial Area
65 JNU Old Campus
1 166 Munirika 256 J.J.Camp Sarswati Camp, Old Cumpus, JNU
66 Jwalapuri 4 42 Peera garhi 341 Sardar Patel Camp, Jwala Puri
360 Camp No‐3 ,Bhim Nagar
361 Camp No‐1 ,Bhim Nagar
362 Camp No‐2 ,Bhim Nagar
67 Kakrola Mod 1 134 Nagli Sakravati 375 Jhuggi Jhopri Nagali
68 Kalkaji 2 196 Kalkaji 54 J.J. Camp Adarsh Niketan, near Gurudwara
63 Sarvodya Camp,Near Balaji Estate Kalkaji
69 Kalyan puri 4 213 Kalyan puri 199 Indra Camp Block 17, Kalyan Puri
207 Shaheed Bhagat Singh Camp Block ‐ 19‐20 Kalyan Puri
210 Shaheed Bhagat Singh Camp Block ‐ 18 Kalyan Puri
222 Indra Camp Block ‐21, Kalyan Puri
70 Kamla Nagar 1 69 Kamla Nagar 109 Roshanara Club staff Quarter, Kamla Nagar
71 Kapasehra 2 143 Kapasehra 437 Sonia Gandhi Camp
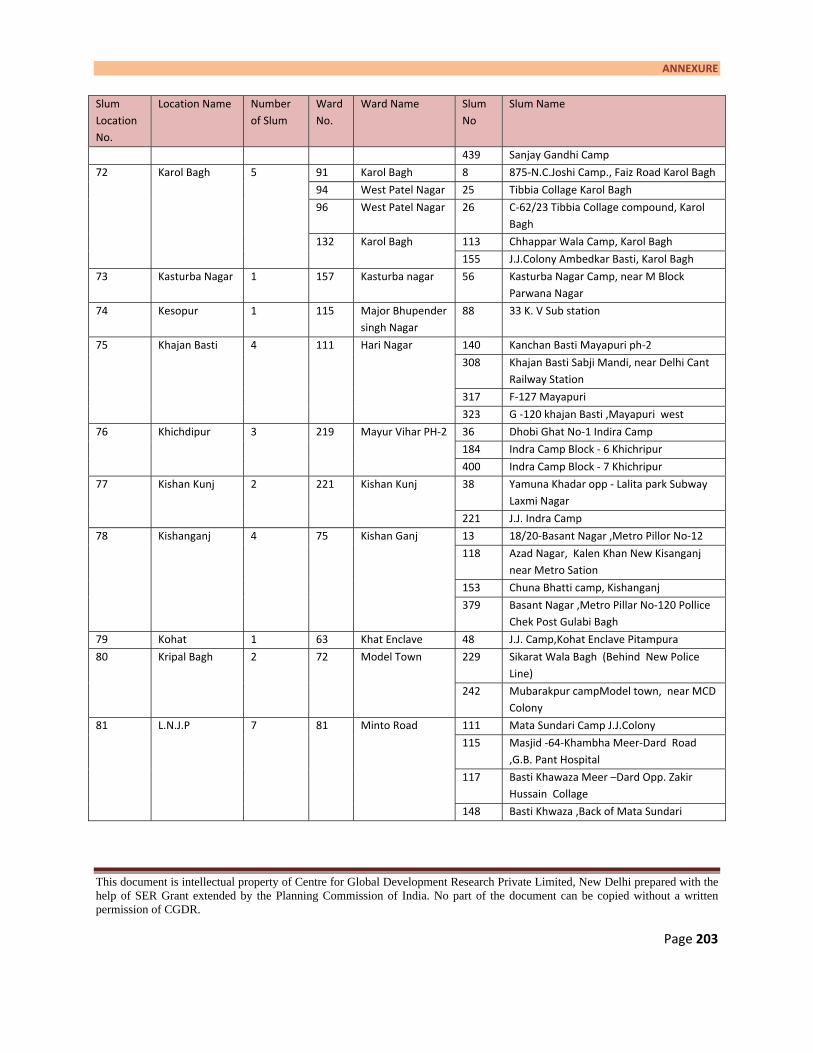
ANNEXURE
This document is intellectual property of Centre for Global Development Research Private Limited, New Delhi prepared with the help of SER Grant extended by the Planning Commission of India. No part of the document can be copied without a written permission of CGDR.
Page 203
Slum Location No.
Location Name Number of Slum
Ward No.
Ward Name Slum No
Slum Name
439 Sanjay Gandhi Camp
72 Karol Bagh 5 91 Karol Bagh 8 875‐N.C.Joshi Camp., Faiz Road Karol Bagh
94 West Patel Nagar 25 Tibbia Collage Karol Bagh
96 West Patel Nagar 26 C‐62/23 Tibbia Collage compound, Karol Bagh
132 Karol Bagh 113 Chhappar Wala Camp, Karol Bagh
155 J.J.Colony Ambedkar Basti, Karol Bagh
73 Kasturba Nagar 1 157 Kasturba nagar 56 Kasturba Nagar Camp, near M Block Parwana Nagar
74 Kesopur 1 115 Major Bhupender singh Nagar
88 33 K. V Sub station
75 Khajan Basti 4 111 Hari Nagar 140 Kanchan Basti Mayapuri ph‐2
308 Khajan Basti Sabji Mandi, near Delhi Cant Railway Station
317 F‐127 Mayapuri
323 G ‐120 khajan Basti ,Mayapuri west
76 Khichdipur 3 219 Mayur Vihar PH‐2 36 Dhobi Ghat No‐1 Indira Camp
184 Indra Camp Block ‐ 6 Khichripur
400 Indra Camp Block ‐ 7 Khichripur
77 Kishan Kunj
2 221 Kishan Kunj 38 Yamuna Khadar opp ‐ Lalita park Subway Laxmi Nagar
221 J.J. Indra Camp
78 Kishanganj 4 75 Kishan Ganj 13 18/20‐Basant Nagar ,Metro Pillor No‐12
118 Azad Nagar, Kalen Khan New Kisanganj near Metro Sation
153 Chuna Bhatti camp, Kishanganj
379 Basant Nagar ,Metro Pillar No‐120 Pollice Chek Post Gulabi Bagh
79 Kohat 1 63 Khat Enclave 48 J.J. Camp,Kohat Enclave Pitampura
80 Kripal Bagh 2 72 Model Town 229 Sikarat Wala Bagh (Behind New Police Line)
242 Mubarakpur campModel town, near MCD Colony
81 L.N.J.P 7 81 Minto Road 111 Mata Sundari Camp J.J.Colony
115 Masjid ‐64‐Khambha Meer‐Dard Road ,G.B. Pant Hospital
117 Basti Khawaza Meer –Dard Opp. Zakir Hussain Collage
148 Basti Khwaza ,Back of Mata Sundari

Slums of Delhi
October 2011 Page 204
Slum Location No.
Location Name Number of Slum
Ward No.
Ward Name Slum No
Slum Name
Collage
151 J.J.Camp Mata Sundari Road
156 Takia Kalen Khan Kabristaan, near Meer ‐Dard Road
390 L.N.J.P.Camp , Ranjeet Singh Road
82 Lajpat Nagar 2 155 Lajpat Nagar 294 Adivasi Camp, Shivji Camp,Vimhans Hospital
420 Pradeep Camp Nehru Nagar, Lajpat Nagar
83 Lodhi Institute area
4 157 Kasturba nagar 489 Sai Baba Camp ,Instiutional area lodhi Road
490 Harijan Camp ,Meharchand Market behind Lodhi Road Part 2
491 Harijan Camp, Meharchand Market Back side Lodhi Road
492 T huts Indira Gandhi Camp, Lodhi Road
84 Loha Mandi 1 152 Naraina 144 Z‐42 Loha Mandi Camp, near Railway line Naraina
85 Madanpur
3 207 Madan pur Khadar
429 J.J. Colony, Madanpur Khadar Part‐ I
433 J.J.Colony, Madanpur Khadar
462 J.J.Colony, Madanpur Khadar Part II
86 Madipur 1 104 Madipur 90 J. J. Camp Near slum Quarter,Road No.33 Punjabi Bagh
87 Mahipalpur 3 144
Mahipal pur 330 Israil cam
352 Shankar Camp
453 Indira Camp
88 Malkaganj 1 9 Malkaganj 16 Dhobi Ghat Malka Ganj, near Petrol Pump
89 Malviya Nagar 5 191 Malviya Nagar 259 Indra Camp, Begampur
286 Balmiki Camp Malviya Nagar
212 Malviya Nagar 255 Malviya Nagar Corner Camp
260 J.J. Clauster, Lal Gumbad Malviya Nagar
417 Jagdammba Camp
90 Mandawali 6 223 Shakarpur 43 Mandawali Thana Road , Railway colony
218 Mandawali 101 Mandawli Uncha Camp
215 Harijan Camp, Mandawali
216 J.J. Camp Sabji ,Mandi Sonia Vihar
227 I.P.Extantion 219 Mazdoor Nagar, Sabji Mandi Mandawali Uncha I.P. Extn.
501 Mandawali , Opp‐ Tata Wati Hospital
91 Mangolpuri 5 47 Mangolpuri 49 J.J. Camp C Block , Mangolpuri
231 Sanjay Camp L‐Block, Magolpuri
232 J.J.Camp K‐Block , Mangol Puri
234 J.J.Camp X‐Block , Mangol Puri
41 Guru Harkishan Nagar
236 J.J. Camp Y Block, near Training Center Mangolpuri
92 Mangolpuri Industrial area
1 47 Mangolpuri 103 J.J. Camp Harkishan Marg
93 Mansarowar 1 247 Ram Nagar 195 E‐88 Lalbag Mansarowar Park

ANNEXURE
This document is intellectual property of Centre for Global Development Research Private Limited, New Delhi prepared with the help of SER Grant extended by the Planning Commission of India. No part of the document can be copied without a written permission of CGDR.
Page 205
Slum Location No.
Location Name Number of Slum
Ward No.
Ward Name Slum No
Slum Name
Park
94 Max Balaji 1 227 I.P.Extantion 211 J.J. Indra Colony, I.P Extn Ph‐1 Max Balaji
95 Mayapuri I 12 111 Hari Nagar 19 A 34‐A Mayapuri phase‐1
79 C2/11‐ J.J. Colony .Maya puri
82 C ‐187, Mayapuri
83 E‐145 , J.J.Camp Maya puri
84 E‐10, J.J.CampMayapuri
86 A‐46 ,Community Center Maya puri
87 C 3/13, J.J.Camp Mayapuri
309 A 11‐12 , J.J. Camp Mayapuri Ph‐1
320 C‐ 76 Mayapuri
443 W‐21 A ,J.J. Camp Mayapuri Ph ‐I
465 W‐21 A,J.J.Camp Recovery Line Mayapuri
486 Poorwanchal J.J.Camp ,Mayapuri
96 Mayapuri II 8 111 Hari Nagar 20 288 ‐J.J.Camp, Mayapuri Ph II
76 G‐1/114, Mayapuri Ph‐I
78 G‐1/113, Mayapuri Ph‐II
81 J.J.Camp G‐1/116 Mayapuri
92 C‐200, Mayapuri
316 J.J. Camp Rewari Line, Mayapuri Ph‐2
484 B 127, J.J.Camp, Mayapuri
485 B‐ 46, Mayapuri Ph II
97 Mayur Vihar Ext 1 220 Patpar Ganj 406 Yamuna Khadar
98 Meera Bagh 1 57 Paschim Vihar South
335 B‐Meera Bag
99 Mehroli 1 170 Mehrauli 53 Lal Masjid Islam Colony, Mehrauli
100 Mithapur Ext. 1 201 Jaitpur 428 Colony Jaitpur, near Police Station Jait Pur
101 Motia Khan 2 88 Qasabpura 114 Gali Pipal Wala Motia Khan, Sadar Thana Road
142 Motia Khan ,Sadar Thana Road
102 Mukharji Nagar 2 11 Mukhrji Nagar 127 Malika Puri Tagore park Mukharji Nagar
228 Patel Chest Hospital Jhuggi , near Dhaka Village
103 Nagloi Ext. 1 35 Kirari Suleman Nagar
348 J.J.Camp Khub Ram Park Prem Nagar, Kirari
104 Nand Nagari 2 243 Nand nagri 35 E‐2 Market Nand Nagri
398 Rajiv Camp
105 Naraina 5 152 Naraina 21 B‐1 Indra Gandhi Camp Phese‐1, near D.T.D.C.

Slums of Delhi
October 2011 Page 206
Slum Location No.
Location Name Number of Slum
Ward No.
Ward Name Slum No
Slum Name
120 B‐97 Sonia Gandhi Camp Part ‐ 1
143 B‐97 Sonia Gandhi Camp Part ‐ 2
152 C‐183 Sanjay Ganghi Camp, near M.C.D. Park Naraina
154 A‐85‐Indra Gandhi Camp, near Juna Park
106 Nasirpur 1 129 Dabri 322 J.J Camp, Nasir Pur
107 Naveen Shahdara
1 248 Welcome Colony 37 Tanga Stand, Kabooter market
108 Nehru Nagar 1 155 Lajpat Nagar 273 Indira Gandhi Camp, Nehru Nagar, Lajpat Nagar
109 Netaji Nagar 1 38 312 Hari Basti Netaji Nagar
110 New Friends Colony
1 193 Sriniwaspuri 257 Dayal Singh Camp,New Friends Colony
111 New Ranjeet Nagar
2 96 New Ranjeet Nagar
11 Dhobi Ghat, New Ranjeet Nagar,‐82‐Bus Stand
137 X Block, New Ranjeet Nagar
112 New Seema puri
3 242 New Seema puri 169 D‐43 Indra Camp, New Seema Puri Nisari Masjid
171 J.J. Colony New Seema Pur,i Behind DTC Deopt
393 J.J Clauster, New Seema Puri kabristan
113 NTPC 2 203 Badarpur 298 Subash Camp, near N.T.P.C .Gate No‐1
386 N.T.P.Camp ,Badar pur
114 Okhla I 6 199 Tehkhand 67 Majdoor Camp near Cannal, Part II Okhla Ph‐I
72 Ambedkar Camp, Okhla Ph.I
289 Sail Camp ,near Steel Authority of India Ten Cannal Okhla
297 J.J.Camp II, Water Tank Okhla
302 Bengal J.J.Camp ,A‐225To263 Okhla Ph‐I
383 Gola Kuon Tekhand Camp, Okhla
115 Okhla II 11 206 Okhla 62 Manav Kalyan Camp Block 2, Okhla II
69 Sanjay Colony C‐54/2Part‐II, Okhla II
269 Sanjay Colony Part‐II ‐C Block, Okhla Ph.‐II
199 Tehkhand 296 New Sanjay Camp ,Okhla Ph‐II
206 Okhla 300 Poorwanchal Camp, near Metro Line Okhla Ph.‐II
301 J.J.Camp Harkesh Nagar,G‐ Block Okhla Ph.‐II
303 Sanjay Camp ‐4 Block , near Metro Station Okhla Ph‐II
425 Manu Kalyan Camp Part I,Z‐ Block Okhla Ph. II
199 Tehkhand 430 Indira Kalyan Camp, Post‐Office Road Okhla Ph.II
206 Okhla 461 Sanjay Colony, back of Kaliji Depot. D.T.C.Okhla Ph.II
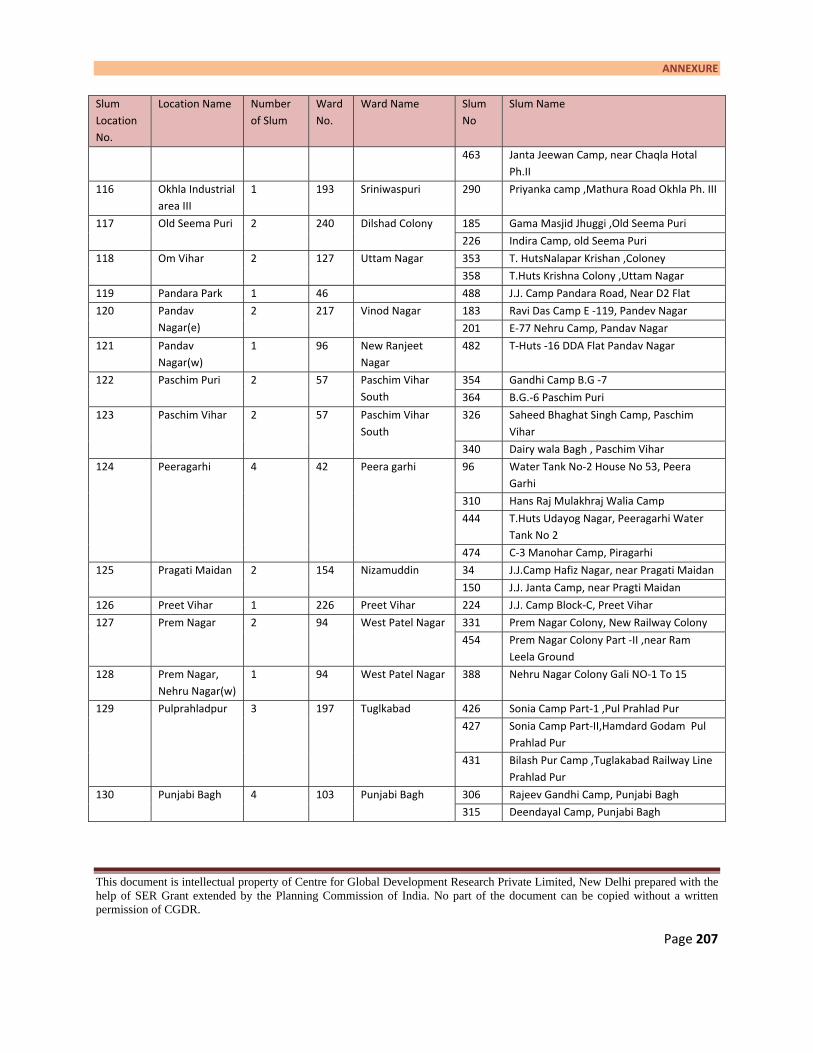
ANNEXURE
This document is intellectual property of Centre for Global Development Research Private Limited, New Delhi prepared with the help of SER Grant extended by the Planning Commission of India. No part of the document can be copied without a written permission of CGDR.
Page 207
Slum Location No.
Location Name Number of Slum
Ward No.
Ward Name Slum No
Slum Name
463 Janta Jeewan Camp, near Chaqla Hotal Ph.II
116 Okhla Industrial area III
1 193 Sriniwaspuri 290 Priyanka camp ,Mathura Road Okhla Ph. III
117 Old Seema Puri 2 240 Dilshad Colony 185 Gama Masjid Jhuggi ,Old Seema Puri
226 Indira Camp, old Seema Puri
118 Om Vihar 2 127 Uttam Nagar 353 T. HutsNalapar Krishan ,Coloney
358 T.Huts Krishna Colony ,Uttam Nagar
119 Pandara Park 1 46 488 J.J. Camp Pandara Road, Near D2 Flat
120 Pandav Nagar(e)
2 217 Vinod Nagar 183 Ravi Das Camp E ‐119, Pandev Nagar
201 E‐77 Nehru Camp, Pandav Nagar
121 Pandav Nagar(w)
1 96 New Ranjeet Nagar
482 T‐Huts ‐16 DDA Flat Pandav Nagar
122 Paschim Puri 2 57 Paschim Vihar South
354 Gandhi Camp B.G ‐7
364 B.G.‐6 Paschim Puri
123 Paschim Vihar 2 57
Paschim Vihar South
326 Saheed Bhaghat Singh Camp, Paschim Vihar
340 Dairy wala Bagh , Paschim Vihar
124 Peeragarhi 4 42 Peera garhi 96 Water Tank No‐2 House No 53, Peera Garhi
310 Hans Raj Mulakhraj Walia Camp
444 T.Huts Udayog Nagar, Peeragarhi Water Tank No 2
474 C‐3 Manohar Camp, Piragarhi
125 Pragati Maidan 2 154 Nizamuddin 34 J.J.Camp Hafiz Nagar, near Pragati Maidan
150 J.J. Janta Camp, near Pragti Maidan
126 Preet Vihar 1 226 Preet Vihar 224 J.J. Camp Block‐C, Preet Vihar
127 Prem Nagar 2 94 West Patel Nagar 331 Prem Nagar Colony, New Railway Colony
454 Prem Nagar Colony Part ‐II ,near Ram Leela Ground
128 Prem Nagar, Nehru Nagar(w)
1 94 West Patel Nagar 388 Nehru Nagar Colony Gali NO‐1 To 15
129 Pulprahladpur 3 197 Tuglkabad 426 Sonia Camp Part‐1 ,Pul Prahlad Pur
427 Sonia Camp Part‐II,Hamdard Godam Pul Prahlad Pur
431 Bilash Pur Camp ,Tuglakabad Railway Line Prahlad Pur
130 Punjabi Bagh
4 103 Punjabi Bagh 306 Rajeev Gandhi Camp, Punjabi Bagh
315 Deendayal Camp, Punjabi Bagh

Slums of Delhi
October 2011 Page 208
Slum Location No.
Location Name Number of Slum
Ward No.
Ward Name Slum No
Slum Name
349 Mahatma Gandhi Camp, Punjabi Bagh
62 Ram pura 480 Indira Colony Punjabi Bagh
131 R.K.Puram Sec‐3
1 166 Munirika 283 Ravi Dass Camp Sec ‐3, R.K.Puram
132 R.K.Puram Sec‐4
2 168 Nanak Pura 18 Adarsh Colony J.J.Camp
166 Munirika 261 Parvatia Camp sec‐ 4, R.k Puram
133 R.K.Puram Sec‐7
4 168 Nanak Pura 267 J.P. Colony
272 Shri Ram J.J. Camp
284 Sonia Gandhi Camp
285 Nehru Ekta Camp
134 Raghubir Nagar
6 101 Raja Garden 334 R‐Block Raghubir Nagar
483 B‐Block Raghubir Nagar
102 Raghubir Nagar 75 C‐Block Raghubir Nagar
435 T‐huts ‐R Block Punjabi Bagh
105 Rajouri Garden 329 New J.J.Camp, Raghubir Nagar
333 B‐1 , J.J.Camp Raghubir Nagar
135 Rajeev Nagar
2 269 Khajoori Khas 190 J.J. Clauster, Rajiv Vihar
503 Rajiv Vihar Block B C & D
136 Rajokri 1 144 Mahipal pur 138 Nala Camp
137 Rajokri Pahari 1 144 Mahipal pur 141 Pahari Mahipal Pur
138 Rajshthan Udyog Nagar
2 67 Wazir Pur Wazir Pur
51 J.J. Cluster Rajshthan Udyog Nagar Part I East G.T Road
243 J.J. Cluster Rajshthan Udyog Nagar East ,G.T. Road
139 Ram Nagar 2 247 Ram Nagar 40 E‐53 ,Shri Ramnagar
191 E‐132, Lalbag ‐Part ‐B
140 Ramesh Park 1 221 Kishan Kunj 164 Suhid Peer Ramesh Park Laxmi Nagar
141 Rana Pratap Bagh
1 70 Rana Pratrap Bagh
382 Kabir Nagar Kishore Nagar J.J. Cluster ,Behind Jammu Kalka Railway Line Rana Pratap Nagar
142 Red Fort 1 77 Kashmere Gate 22 Patti Market Camp, Anguri Bagh
143 Rohini Sec‐3 1 45 Rohini South 410 Indra Gandhi Camp near Jaipur Goldan Sec‐3
144 Sabzi Mandi 1 75 Kishan Ganj 28 C‐73/84 near Railway Colony,Subzi Mandi Sation Delhi
145 Sadh Nagar 1 146 Sadh Nagar 325 Rajeev Gandhi Camp
146 Sadik Nagar 1 159 Andrews ganj 57 Rajveer Camp Sadiq Nagar, near Police Station
147 Sagarpur 2 131 Sagar pur 77 Rajeev Camp II
355 Rajeev Camp
148 Sahabad Daulatpur
4 26 Sahibabad Daulat Pur
446 J.J. Camp A Block,Sahabad Dairy
447 J.J. Camp E Block ,Sahabad Dairy
448 J.J. Camp D Block, Sahabad Dairy
449 J.J. Camp F Block, Sahabad Dairy
149 Sainik Vihar 2 59 Rani Bagh 50 J.J. Camp near Nilamber Appartment Sainik Vihar Pitampura
60 Saraswati Vihar 52 Rang Mehal Camp, Sarswati Vihar

ANNEXURE
This document is intellectual property of Centre for Global Development Research Private Limited, New Delhi prepared with the help of SER Grant extended by the Planning Commission of India. No part of the document can be copied without a written permission of CGDR.
Page 209
Slum Location No.
Location Name Number of Slum
Ward No.
Ward Name Slum No
Slum Name
Pitampura
150 Sakurbasti 3 59 Rani Bagh 344 Diesel Sheel Shading, ShakurBasti
438 Railway Side,Shakur Basti
442 Railway Jhuggi Camp ,Sakur Basti
151 Samaypur 3 17 Samayapur Badli 470 J.J. Camp Bhagwanpur village, Samaipur Badli
471 J.J. Camp Badli village
472 sanjay Camp Badli
152 Sanjay Gandhi Transport Nagar
2 17 Samayapur Badli 413 Sanjay Camp Libaspur near G. T. karnal Road
469 J.J. Camp Badli, Fatak No.‐8
153 Saraswati Vihar 1 60 Saraswati Vihar 128 Dr. B.R. Ambedkar Camp, Dera Ghazi Khan Pitampura
154 Sarita Vihar 4 208 Sarita vihar 73 Vaidya Nath Camp, New Ishwar Nagar
372 Madhu Mohalla MadanPur, Sarita Vihar
271 Rajasthani Camp
202 Meethapur 305 New Priyanka Camp, Madanpur Khadar Sarita Vihar
155 Sawan Park 1 66 Sawan Park 415 Zailwala Bagh Ashoke Vihar, A‐ Block
156 SBI enclave 1 57 Paschim Vihar South
311 J. J. Camp Near S.B.I. Colony ,Paschim Vihar
157 Sewa Nagar 2 157 Kasturba nagar 58 Seva Nagar Camp, Q Block , Kasturba Nagar near Sukhdev Market
68 Kasturba Nagar T ‐Huts Q Block Sewa Nagar
158 Shadipur 3 150 Pusha 327 Dr. Ambedkar Camp, Opp.Shadi Pur
389 Kathputali Camp, Opp. Sadipur Depot
440 Bihari Camp, Shadipur Depot
159 Shalimar Bagh 4 14 Adarsh Nagar 238 Indra Colony Fatak‐No.‐7 ,Shalimar Bag East
17 Samayapur Badli 250 J.J.Camp Bhagwan Pur New G.T.Karnal Road
55 Shalimar Bagh North
475 J.J. Camp Shalimar Village
476 Indira Camp Shalimar Bagh
160 Sham Nagar 2 105 Rajouri Garden 328 C‐3 Block Shyam Nagar
332 Sikri Bhata Camp ShyamNagar
161 Shashi Garden 5 220 Patpar Ganj 200 Mahatma Gandhi Camp, Shashi Garden
202 Shashtri Mohalla Camp, Shashi Garden
203 Jawahar MohallaCamp, Shashi Garden

Slums of Delhi
October 2011 Page 210
Slum Location No.
Location Name Number of Slum
Ward No.
Ward Name Slum No
Slum Name
204 Ram Prasad Bishmile Camp ,Shashi Garden
223 Khokha Patti Camp,Shashi Garden
162 Shastri Park 2 233 Dharam Pura 46 Sashtri Park Lal Basti
180 J.J. Cluster Bihari Building
163 Shiv Vihar 1 124 Vikas Nagar 106 J. J. Camp Shiv Vihar
164 Silampur 1 143 Welcome Colony 178 Taj Colony, G. T. Road near Railway Line
165 Soami Nagar 1 212 Malviya Nagar 266 J.J. Camp ,Water Tank Swami Nagar
166 Sriniwashpuri 8 193 Sriniwaspuri 17 Gandhi Camp Part‐II, near Okhla Station
61 Shiv Mandir Camp, Shriniwash Puri near Okhla Station
133 Jeevan Camp ,Shriniwaspuri
135 J.J.Camp Near Pvt.Colony, Shriniwaspuri
136 Indira Gandhi Camp –I, Railway Station Okhla
275 J.J.Indira Gandhi Camp –I, Shriniwaspuri
278 Gandhi Camp Part I ,Shriniwaspuri
291 J.J. Indra Camp, Shriniwaspuri Okhala
167 Subzi Mandi 1 76 Deputy Ganj 147 Bagichi Ranjit Rani bagh Road, near Railway station Subzi mandi
168 Sultanpuri 18 37 Sultan Puri East 80 C‐2 Block Shiv Mandir, Sultan puri
85 E‐3 Block Machhli Chowk ,Sultanpuri
93 A‐2 Block ,Sultan puri
94 P‐4 J.J.Camp ,Sultanpuri
95 C‐3 near bus stand ,Sultan puri
319 D‐1 J.J.Camp Machhli Chowk Sultanpuri
338 B‐1 Mangal Bazar, Sultan puri
339 D‐4 Block Sultan puri
39 Sultanpur Majra 347 E‐3 Block Sultanpuri
40 SultanPuri South 89 F‐2 Block Post‐Office, Sultanpuri
97 J. J. Camp C‐9 ,Sultanpuri
99 D.D.A.Market, near Mother Dairy
336 J.J.Camp ,W‐49/F‐2 Block Sultan puri
345 C‐10 J.J.Camp ,Sultan puri
350 J.J.Camp‐C Block Post‐Office Sultanpuri
356 J.J. Camp F‐7 Sultan puri
436 H.G. I. Labour Colony, Sultan Puri
441 P‐1 Block J.J.Cluster, Sultanpuri
169 Sunder Nagri 4 244 Sunder Nagri 173 Sunder Nagari E‐60 Juggl F‐ I, Opp
182 J.J. Camp F‐I & II ,Sunder Nagari
212 E‐57 Block B Block –G, Behind Sunder Nagri
401 E‐51 ABCD ,Sunder Nagari
170 Taharpur Chowk
3 242 New Seema puri 167 Sarhad Puri‐II ,Road No. 64
176 E‐ Ph‐1 , Road No. 64 Tahirpur
217 Sarhad puri Camp Part‐I ,
171 Taigor Garden 1 101 Raja Garden 346 S.P.M.Camp Tagore Garden
172 Taimoor Nagar 2 205 Zakir Nagar 277 Indira Gandhi Camp ,Pahari Ist, Tamoor
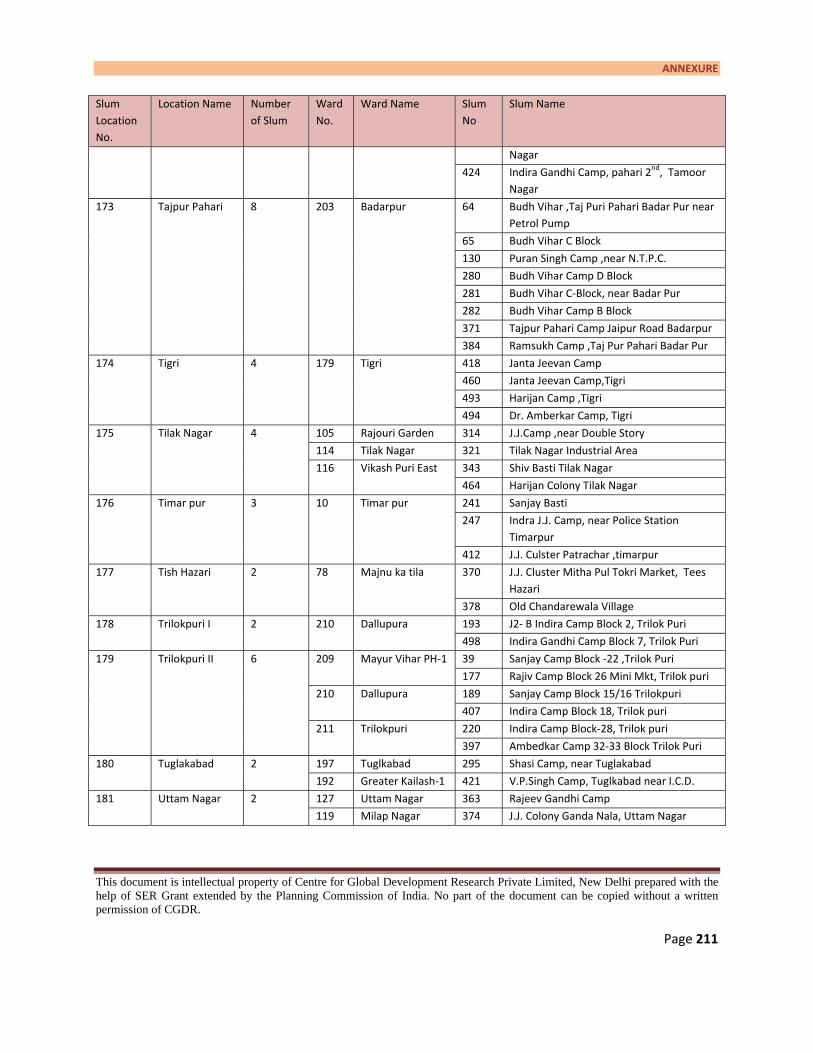
ANNEXURE
This document is intellectual property of Centre for Global Development Research Private Limited, New Delhi prepared with the help of SER Grant extended by the Planning Commission of India. No part of the document can be copied without a written permission of CGDR.
Page 211
Slum Location No.
Location Name Number of Slum
Ward No.
Ward Name Slum No
Slum Name
Nagar
424 Indira Gandhi Camp, pahari 2nd, Tamoor Nagar
173 Tajpur Pahari 8 203 Badarpur 64 Budh Vihar ,Taj Puri Pahari Badar Pur near Petrol Pump
65 Budh Vihar C Block
130 Puran Singh Camp ,near N.T.P.C.
280 Budh Vihar Camp D Block
281 Budh Vihar C‐Block, near Badar Pur
282 Budh Vihar Camp B Block
371 Tajpur Pahari Camp Jaipur Road Badarpur
384 Ramsukh Camp ,Taj Pur Pahari Badar Pur
174 Tigri 4 179 Tigri 418 Janta Jeevan Camp
460 Janta Jeevan Camp,Tigri
493 Harijan Camp ,Tigri
494 Dr. Amberkar Camp, Tigri
175 Tilak Nagar 4 105 Rajouri Garden 314 J.J.Camp ,near Double Story
114 Tilak Nagar 321 Tilak Nagar Industrial Area
116 Vikash Puri East 343 Shiv Basti Tilak Nagar
464 Harijan Colony Tilak Nagar
176 Timar pur 3 10 Timar pur 241 Sanjay Basti
247 Indra J.J. Camp, near Police Station Timarpur
412 J.J. Culster Patrachar ,timarpur
177 Tish Hazari 2 78 Majnu ka tila 370 J.J. Cluster Mitha Pul Tokri Market, Tees Hazari
378 Old Chandarewala Village
178 Trilokpuri I 2 210 Dallupura 193 J2‐ B Indira Camp Block 2, Trilok Puri
498 Indira Gandhi Camp Block 7, Trilok Puri
179 Trilokpuri II 6 209 Mayur Vihar PH‐1 39 Sanjay Camp Block ‐22 ,Trilok Puri
177 Rajiv Camp Block 26 Mini Mkt, Trilok puri
210 Dallupura 189 Sanjay Camp Block 15/16 Trilokpuri
407 Indira Camp Block 18, Trilok puri
211 Trilokpuri 220 Indira Camp Block‐28, Trilok puri
397 Ambedkar Camp 32‐33 Block Trilok Puri
180 Tuglakabad 2 197 Tuglkabad 295 Shasi Camp, near Tuglakabad
192 Greater Kailash‐1 421 V.P.Singh Camp, Tuglkabad near I.C.D.
181 Uttam Nagar 2 127 Uttam Nagar 363 Rajeev Gandhi Camp
119 Milap Nagar 374 J.J. Colony Ganda Nala, Uttam Nagar

Slums of Delhi
October 2011 Page 212
Slum Location No.
Location Name Number of Slum
Ward No.
Ward Name Slum No
Slum Name
182 Uttari Pitampura
2 53 Pitampura South 244 Ekta Camp A‐U Block,Pitampura
409 J.J. Camp G‐P Block, Pitampura
183 Vasant Kunj 2 171 Vasant Kunj 276 Motilal Nehru Camp, Vasant kunj
459 Kusumpur Camp Pahari, Vasant Kunj
184 Vasant Vihar 6 165 Vasant Vihar 258 Nepali Camp Vasant Vihar
387 Bhavar Singh Camp ,Vasant Vihar
168 Nanak Pura 66 Lal Bahadur Shastri Camp, Nanak Pura
74 Jeevan Visth Ashram
264 Kanak Durga Colony Camp
265 Malai Mandir Camp
185 Vasant Vihar Malai Mandir
1 168 Nanak Pura 60 Malai Mandir Camp
186 VikashPuri
7 113 Mahavir Nagar 139 Shankar garden ,Vikaspuri
337 T.Huts Tilak Nagar, near Harkishan Public School
359 IndiraCamp No‐4
116 Vikash Puri East 342 IndiraCamp No‐2
124 Vikas Nagar 98 Indira Camp No‐6
357 Indira Camp No.‐5 Vikashpuri
365 Indira Camp No‐3
187 Vinod Nagar 2 219 Mayur Vihar PH‐2 172 J.J. Bharti Camp, East Vinod Nagar, near Nilam Mata Mandir J&E Block
205 J.J. Bharti Camp ,East Vinod Nagar near Police Chowki
188 Viswash Nagar 1 226 Vishwash Nagar 44 18 Quarters Viswash Nagar
189 Vivek Vihar RS. 1 237 Sahadra 165 E‐55 Dilshad Vihar Colony G.T Road
190 Wazirpur Industrial area
4 67 Wazir Pur 408 Satsang Colony camp, near Railway Line ,Wazirpur
411 Shahid Shukhdev Colony Camp
457 Shahid Udhamsingh Park Camp
458 Chander Sehkar J.J. Camp
191 Yamuna Bazar 1 77 Kashmere Gate 1 70 Calcuttayamuna bazar Kasmiri Gate
ANNEXURE
This document is intellectual property of Centre for Global Development Research Private Limited, New Delhi prepared with the help of SER Grant extended by the Planning Commission of India. No part of the document can be copied without a written permission of CGDR.
Page 213
MAP
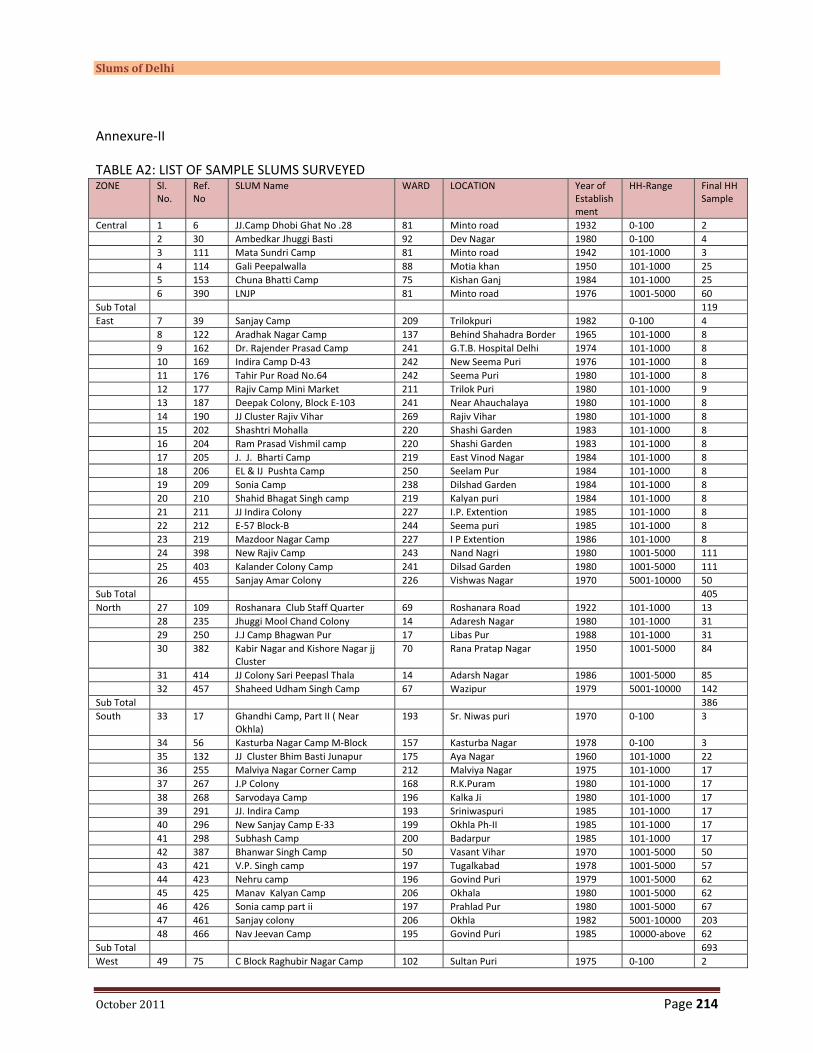
Slums of Delhi
October 2011 Page 214
Annexure‐II
TABLE A2: LIST OF SAMPLE SLUMS SURVEYED ZONE Sl.
No. Ref. No
SLUM Name WARD LOCATION Year of Establishment
HH‐Range Final HH Sample
Central 1 6 JJ.Camp Dhobi Ghat No .28 81 Minto road 1932 0‐100 2 2 30 Ambedkar Jhuggi Basti 92 Dev Nagar 1980 0‐100 4 3 111 Mata Sundri Camp 81 Minto road 1942 101‐1000 3 4 114 Gali Peepalwalla 88 Motia khan 1950 101‐1000 25 5 153 Chuna Bhatti Camp 75 Kishan Ganj 1984 101‐1000 25 6 390 LNJP 81 Minto road 1976 1001‐5000 60Sub Total 119East 7 39 Sanjay Camp 209 Trilokpuri 1982 0‐100 4 8 122 Aradhak Nagar Camp 137 Behind Shahadra Border 1965 101‐1000 8 9 162 Dr. Rajender Prasad Camp 241 G.T.B. Hospital Delhi 1974 101‐1000 8 10 169 Indira Camp D‐43 242 New Seema Puri 1976 101‐1000 8 11 176 Tahir Pur Road No.64 242 Seema Puri 1980 101‐1000 8 12 177 Rajiv Camp Mini Market 211 Trilok Puri 1980 101‐1000 9 13 187 Deepak Colony, Block E‐103 241 Near Ahauchalaya 1980 101‐1000 8 14 190 JJ Cluster Rajiv Vihar 269 Rajiv Vihar 1980 101‐1000 8 15 202 Shashtri Mohalla 220 Shashi Garden 1983 101‐1000 8 16 204 Ram Prasad Vishmil camp 220 Shashi Garden 1983 101‐1000 8 17 205 J. J. Bharti Camp 219 East Vinod Nagar 1984 101‐1000 8 18 206 EL & IJ Pushta Camp 250 Seelam Pur 1984 101‐1000 8 19 209 Sonia Camp 238 Dilshad Garden 1984 101‐1000 8 20 210 Shahid Bhagat Singh camp 219 Kalyan puri 1984 101‐1000 8 21 211 JJ Indira Colony 227 I.P. Extention 1985 101‐1000 8 22 212 E‐57 Block‐B 244 Seema puri 1985 101‐1000 8 23 219 Mazdoor Nagar Camp 227 I P Extention 1986 101‐1000 8 24 398 New Rajiv Camp 243 Nand Nagri 1980 1001‐5000 111 25 403 Kalander Colony Camp 241 Dilsad Garden 1980 1001‐5000 111 26 455 Sanjay Amar Colony 226 Vishwas Nagar 1970 5001‐10000 50Sub Total 405North 27 109 Roshanara Club Staff Quarter 69 Roshanara Road 1922 101‐1000 13 28 235 Jhuggi Mool Chand Colony 14 Adaresh Nagar 1980 101‐1000 31 29 250 J.J Camp Bhagwan Pur 17 Libas Pur 1988 101‐1000 31 30 382 Kabir Nagar and Kishore Nagar jj
Cluster 70 Rana Pratap Nagar 1950 1001‐5000 84
31 414 JJ Colony Sari Peepasl Thala 14 Adarsh Nagar 1986 1001‐5000 85 32 457 Shaheed Udham Singh Camp 67 Wazipur 1979 5001‐10000 142Sub Total 386South 33 17 Ghandhi Camp, Part II ( Near
Okhla) 193 Sr. Niwas puri 1970 0‐100 3
34 56 Kasturba Nagar Camp M‐Block 157 Kasturba Nagar 1978 0‐100 3 35 132 JJ Cluster Bhim Basti Junapur 175 Aya Nagar 1960 101‐1000 22 36 255 Malviya Nagar Corner Camp 212 Malviya Nagar 1975 101‐1000 17 37 267 J.P Colony 168 R.K.Puram 1980 101‐1000 17 38 268 Sarvodaya Camp 196 Kalka Ji 1980 101‐1000 17 39 291 JJ. Indira Camp 193 Sriniwaspuri 1985 101‐1000 17 40 296 New Sanjay Camp E‐33 199 Okhla Ph‐II 1985 101‐1000 17 41 298 Subhash Camp 200 Badarpur 1985 101‐1000 17 42 387 Bhanwar Singh Camp 50 Vasant Vihar 1970 1001‐5000 50 43 421 V.P. Singh camp 197 Tugalkabad 1978 1001‐5000 57 44 423 Nehru camp 196 Govind Puri 1979 1001‐5000 62 45 425 Manav Kalyan Camp 206 Okhala 1980 1001‐5000 62 46 426 Sonia camp part ii 197 Prahlad Pur 1980 1001‐5000 67 47 461 Sanjay colony 206 Okhla 1982 5001‐10000 203 48 466 Nav Jeevan Camp 195 Govind Puri 1985 10000‐above 62Sub Total 693West 49 75 C Block Raghubir Nagar Camp 102 Sultan Puri 1975 0‐100 2
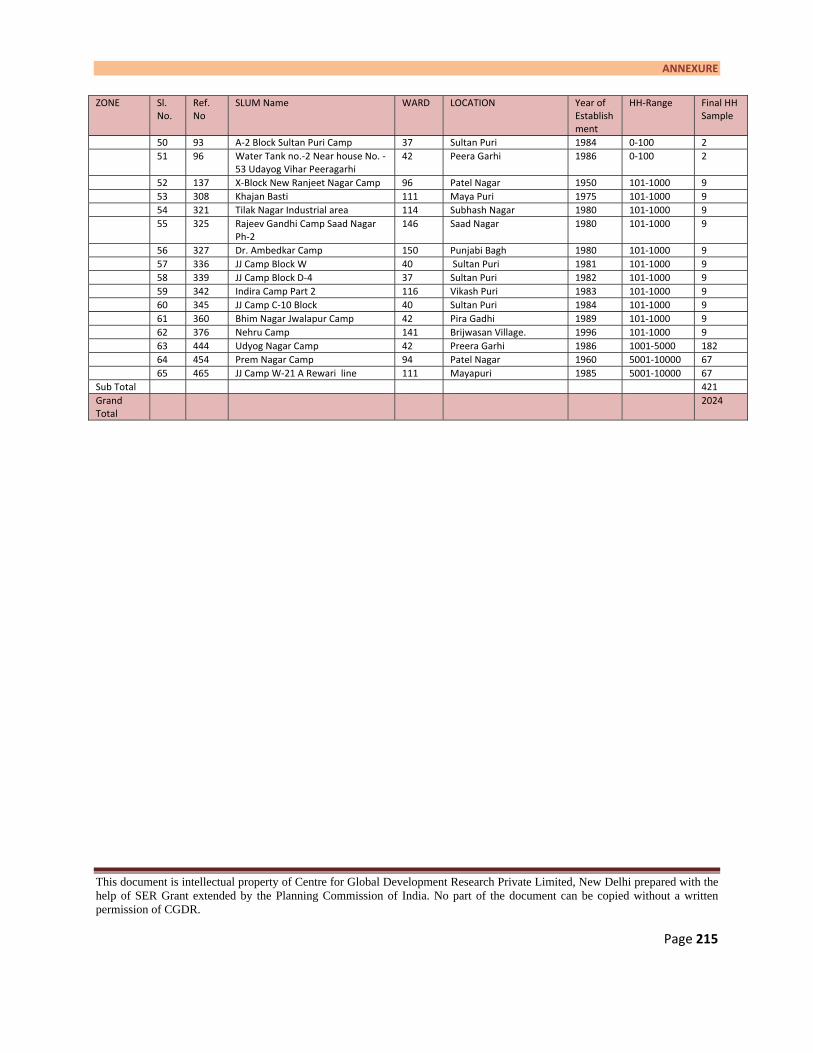
ANNEXURE
This document is intellectual property of Centre for Global Development Research Private Limited, New Delhi prepared with the help of SER Grant extended by the Planning Commission of India. No part of the document can be copied without a written permission of CGDR.
Page 215
ZONE Sl. No.
Ref. No
SLUM Name WARD LOCATION Year of Establishment
HH‐Range Final HH Sample
50 93 A‐2 Block Sultan Puri Camp 37 Sultan Puri 1984 0‐100 2 51 96 Water Tank no.‐2 Near house No. ‐
53 Udayog Vihar Peeragarhi 42 Peera Garhi 1986 0‐100 2
52 137 X‐Block New Ranjeet Nagar Camp 96 Patel Nagar 1950 101‐1000 9 53 308 Khajan Basti 111 Maya Puri 1975 101‐1000 9 54 321 Tilak Nagar Industrial area 114 Subhash Nagar 1980 101‐1000 9 55 325 Rajeev Gandhi Camp Saad Nagar
Ph‐2 146 Saad Nagar 1980 101‐1000 9
56 327 Dr. Ambedkar Camp 150 Punjabi Bagh 1980 101‐1000 9 57 336 JJ Camp Block W 40 Sultan Puri 1981 101‐1000 9 58 339 JJ Camp Block D‐4 37 Sultan Puri 1982 101‐1000 9 59 342 Indira Camp Part 2 116 Vikash Puri 1983 101‐1000 9 60 345 JJ Camp C‐10 Block 40 Sultan Puri 1984 101‐1000 9 61 360 Bhim Nagar Jwalapur Camp 42 Pira Gadhi 1989 101‐1000 9 62 376 Nehru Camp 141 Brijwasan Village. 1996 101‐1000 9 63 444 Udyog Nagar Camp 42 Preera Garhi 1986 1001‐5000 182 64 454 Prem Nagar Camp 94 Patel Nagar 1960 5001‐10000 67 65 465 JJ Camp W‐21 A Rewari line 111 Mayapuri 1985 5001‐10000 67Sub Total 421Grand Total
2024

Slums of Delhi
October 2011 Page 216
Annexure III
TABLE A3: LIST OF SLUMS ESTABLISHED DURING 1922 TO 1947 Sl. No. Slum Name Locality Year 1 Roshanara Club Staff quarter Roshnara Road, kamla
Nagar 1922
3 Dhobi Ghat No‐9, Press Road Minto Road 1932 4 J J. Cluster Dhobi Ghat No‐12, Press Road Minto Road 1932 5 J.J. Dhobi Ghat No ‐8 Minto Road 1932 6 J.J. Cluster Dhobi Ghat No‐11, Press Road Minto Road 1932 7 Dhobi Ghat No.28 Minto Road 1932 8 J.J. Dhobi Ghat No ‐7 Minto Road 1932 9 J.J.C luster Dhobi Ghat no‐10 Minto Road 1932 10 J.J. Cluster Dhobi Ghat‐28 Minto Road 1932 11 J.J. Camp Railway Road, Shadi Nagar Azadpur 1932 12 Dhobi Ghat, Near 82‐Bus Stand New Ranjeet Nagar 1932 13 875‐N.C.Joshi Road Camp, Faiz Road Karol Bagh 1940 14 Indira Camp, Rangpuri Pahari Mahipalpur 1940 15 Mata Sundari Camp J.J Colony Minto Road 1942 16 Gandhi Sahitya Samity Rajghat 1945 17 Old Chandarewala Village Majnu‐Ka‐Tila 1946 18 Kt‐8 Market, Gulabi Bagh (near red light Kishan ganj) Kishan Ganj 1947 19 J.J. Cluster Railway Colony Kashmiri Gate 1947