Acido base integracion
11
The new england journal of medicine n engl j med 371;19 nejm.org november 6, 2014 1821 review article Disorders of Fluids and Electrolytes Julie R. Ingelfinger, M.D., Editor Integration of Acid–Base and Electrolyte Disorders Julian L. Seifter, M.D. From the Department of Medicine, Renal Division, Brigham and Women’s Hospital and Harvard Medical School — both in Boston. Address reprint requests to Dr. Seifter at the Renal Division, Department of Medicine, Brigham and Women’s Hos- pital, 75 Francis St., Boston, MA 02482, or at [email protected]. N Engl J Med 2014;371:1821-31. DOI: 10.1056/NEJMra1215672 Copyright © 2014 Massachusetts Medical Society. T his review describes a method of analyzing acid–base disorders that incorporates insights from the traditional, bicarbonate-centered model and the Stewart (or strong ion) model (Table 1). 1-6 Acid–base balance and electrolyte homeostasis are intricately connected at the cellular level and in clinical disorders. This article emphasizes the integration of the principles of mass balance and electroneutrality — which are prominently featured in the strong ion model (also known as the physicochemical model) — for interpretation of acid–base phenomena. Most acid–base abnormalities can be diagnosed and interpreted with the use of the traditional approach. Why, then, should the strong ion theory be in- corporated into teaching about acid–base balance? Although the Stewart model is not primarily a mathematical expression of a confirmed reality, it is relevant be- cause it is a powerful construct that can shed light on an important biologic system. Included in this article are several case vignettes that show the explanatory power of the strong ion approach in clinical practice. Some of these examples have been presented in a companion article on the physiological approach to acid–base balance by Berend et al. 7 Other cases that are interpreted with a strong ion ap- proach are included in the Supplementary Appendix, available with the full text of this article at NEJM.org. The more complex chemistry of the hydrogen-ion concen- tration in intracellular and extracellular fluid compartments is beyond the scope of this article. Bicarbonate-Centered and Strong Ion Approaches The traditional model uses easily measured concentrations of blood carbon diox- ide [CO 2 ] and bicarbonate [HCO 3 − ]. 6 It is the basis of the Henderson–Hasselbalch equation: pH=pK+log 10 [HCO 3 − ] 0.03 (Paco 2 ) ) , (1) where pK is the acid dissociation constant, Paco 2 the partial pressure of arterial carbon dioxide, and 0.03 the solubility of CO 2 in blood. The overall equilibrium between carbon dioxide and bicarbonate is shown below: CO 2 +H 2 O←→H 2 CO 3 ←→H + +HCO 3 − , (2) where H 2 CO 3 denotes carbonic acid, and H + hydrogen. In a teaching model, this relationship shows how alterations in the partial pres- sure of carbon dioxide (Pco 2 ) or levels of hydrogen or bicarbonate affect the other variables through mass balance. The fact that the hydrogen ion concentra- ( The New England Journal of Medicine Downloaded from nejm.org on November 20, 2014. For personal use only. No other uses without permission. Copyright © 2014 Massachusetts Medical Society. All rights reserved.
-
Upload
rubenclick -
Category
Science
-
view
134 -
download
1
Transcript of Acido base integracion
T h e n e w e ngl a nd j o u r na l o f m e dic i n e
n engl j med 371;19 nejm.org november 6, 2014 1821
review article
Disorders of Fluids and ElectrolytesJulie R. Ingelfinger, M.D., Editor
Integration of Acid–Base and Electrolyte Disorders
Julian L. Seifter, M.D.
From the Department of Medicine, Renal Division, Brigham and Women’s Hospital and Harvard Medical School — both in Boston. Address reprint requests to Dr. Seifter at the Renal Division, Department of Medicine, Brigham and Women’s Hospital, 75 Francis St., Boston, MA 02482, or at [email protected].
N Engl J Med 2014;371:1821-31.DOI: 10.1056/NEJMra1215672Copyright © 2014 Massachusetts Medical Society.
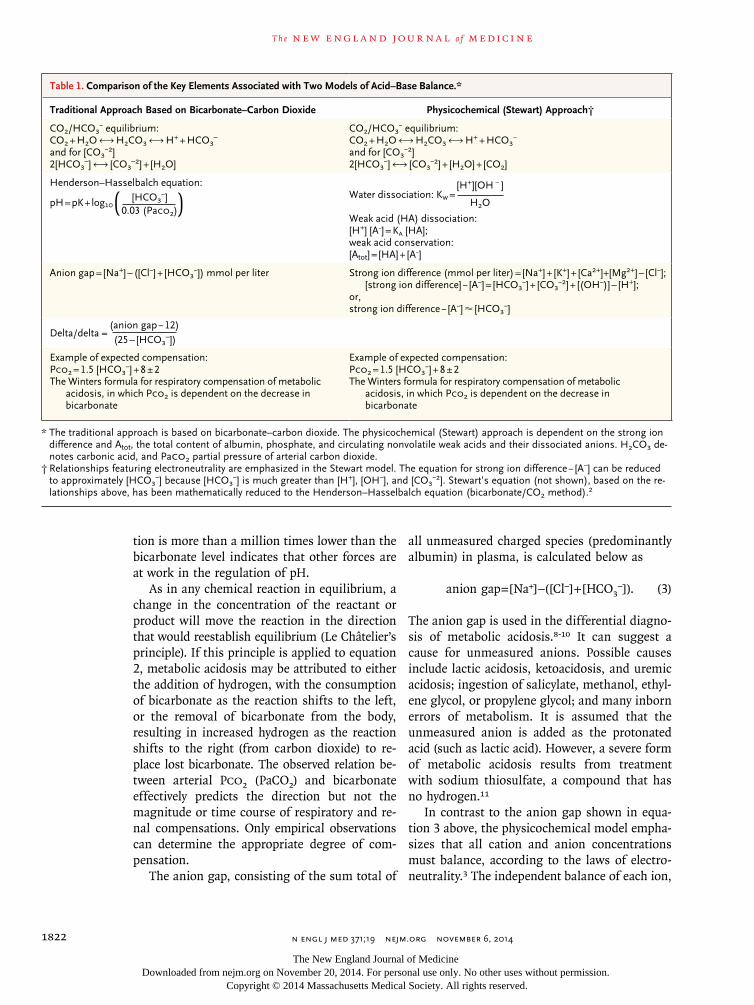
This review describes a method of analyzing acid–base disorders that incorporates insights from the traditional, bicarbonate-centered model and the Stewart (or strong ion) model (Table 1).1-6 Acid–base balance and
electrolyte homeostasis are intricately connected at the cellular level and in clinical disorders. This article emphasizes the integration of the principles of mass balance and electroneutrality — which are prominently featured in the strong ion model (also known as the physicochemical model) — for interpretation of acid–base phenomena. Most acid–base abnormalities can be diagnosed and interpreted with the use of the traditional approach. Why, then, should the strong ion theory be in-corporated into teaching about acid–base balance? Although the Stewart model is not primarily a mathematical expression of a confirmed reality, it is relevant be-cause it is a powerful construct that can shed light on an important biologic system.
Included in this article are several case vignettes that show the explanatory power of the strong ion approach in clinical practice. Some of these examples have been presented in a companion article on the physiological approach to acid–base balance by Berend et al.7 Other cases that are interpreted with a strong ion ap-proach are included in the Supplementary Appendix, available with the full text of this article at NEJM.org. The more complex chemistry of the hydrogen-ion concen-tration in intracellular and extracellular fluid compartments is beyond the scope of this article.
Bic a r bonate- Cen ter ed a nd S trong Ion A pproaches
The traditional model uses easily measured concentrations of blood carbon diox-ide [CO2] and bicarbonate [HCO3
−].6 It is the basis of the Henderson–Hasselbalch equation:
pH = pK + log10 [HCO3
−] 0.03 (Paco2)), (1)
where pK is the acid dissociation constant, Paco2 the partial pressure of arterial carbon dioxide, and 0.03 the solubility of CO2 in blood.
The overall equilibrium between carbon dioxide and bicarbonate is shown below:
CO2 + H2O ←→ H2CO3 ←→ H+ + HCO3−, (2)
where H2CO3 denotes carbonic acid, and H+ hydrogen.In a teaching model, this relationship shows how alterations in the partial pres-
sure of carbon dioxide (Pco2) or levels of hydrogen or bicarbonate affect the other variables through mass balance. The fact that the hydrogen ion concentra-
(
The New England Journal of Medicine Downloaded from nejm.org on November 20, 2014. For personal use only. No other uses without permission.
Copyright © 2014 Massachusetts Medical Society. All rights reserved.
T h e n e w e ngl a nd j o u r na l o f m e dic i n e
n engl j med 371;19 nejm.org november 6, 20141822
tion is more than a million times lower than the bicarbonate level indicates that other forces are at work in the regulation of pH.
As in any chemical reaction in equilibrium, a change in the concentration of the reactant or product will move the reaction in the direction that would reestablish equilibrium (Le Châtelier’s principle). If this principle is applied to equation 2, metabolic acidosis may be attributed to either the addition of hydrogen, with the consumption of bicarbonate as the reaction shifts to the left, or the removal of bicarbonate from the body, resulting in increased hydrogen as the reaction shifts to the right (from carbon dioxide) to re-place lost bicarbonate. The observed relation be-tween arterial PCO2 (PaCO2) and bicarbonate effectively predicts the direction but not the magnitude or time course of respiratory and re-nal compensations. Only empirical observations can determine the appropriate degree of com-pensation.
The anion gap, consisting of the sum total of
all unmeasured charged species (predominantly albumin) in plasma, is calculated below as
anion gap = [Na+] – ([Cl−] + [HCO3−]). (3)
The anion gap is used in the differential diagno-sis of metabolic acidosis.8-10 It can suggest a cause for unmeasured anions. Possible causes include lactic acidosis, ketoacidosis, and uremic acidosis; ingestion of salicylate, methanol, ethyl-ene glycol, or propylene glycol; and many inborn errors of metabolism. It is assumed that the unmeasured anion is added as the protonated acid (such as lactic acid). However, a severe form of metabolic acidosis results from treatment with sodium thiosulfate, a compound that has no hydrogen.11
In contrast to the anion gap shown in equa-tion 3 above, the physicochemical model empha-sizes that all cation and anion concentrations must balance, according to the laws of electro-neutrality.3 The independent balance of each ion,
Table 1. Comparison of the Key Elements Associated with Two Models of Acid–Base Balance.*
Traditional Approach Based on Bicarbonate–Carbon Dioxide Physicochemical (Stewart) Approach†
CO2/HCO3− equilibrium:
CO2 + H2O ←→ H2CO3 ←→ H+ + HCO3–
and for [CO3−2]
2[HCO3–] ←→ [CO3
–2] + [H2O]
CO2/HCO3− equilibrium:
CO2 + H2O ←→ H2CO3 ←→ H+ + HCO3−
and for [CO3−2]
2[HCO3−] ←→ [CO3
−2] + [H2O] + [CO2]
Henderson–Hasselbalch equation:
pH = pK + log10 [HCO3
−] 0.03 (Paco2)) Water dissociation: Kw =
[H+][OH − ]
Weak acid (HA) dissociation:[H+] [A−] = KA [HA];weak acid conservation:[Atot] = [HA] + [A−]
Anion gap = [Na+] – ([Cl−] + [HCO3−]) mmol per liter Strong ion difference (mmol per liter) = [Na+] + [K+] + [Ca2+]+[Mg2+] – [Cl−];
[strong ion difference] − [A−] = [HCO3−] + [CO3
−2] + [(OH−)] – [H+];or,strong ion difference − [A−] ≈ [HCO3
−]
Delta/delta =
Example of expected compensation:Pco2 = 1.5 [HCO3
−] + 8 ± 2The Winters formula for respiratory compensation of metabolic
acidosis, in which Pco2 is dependent on the decrease in bicarbonate
Example of expected compensation:Pco2 = 1.5 [HCO3
−] + 8 ± 2The Winters formula for respiratory compensation of metabolic
acidosis, in which Pco2 is dependent on the decrease in bicarbonate
* The traditional approach is based on bicarbonate–carbon dioxide. The physicochemical (Stewart) approach is dependent on the strong ion difference and Atot, the total content of albumin, phosphate, and circulating nonvolatile weak acids and their dissociated anions. H2CO3 denotes carbonic acid, and Paco2 partial pressure of arterial carbon dioxide.
† Relationships featuring electroneutrality are emphasized in the Stewart model. The equation for strong ion difference − [A−] can be reduced to approximately [HCO3
−] because [HCO3−] is much greater than [H+], [OH−], and [CO3
−2]. Stewart’s equation (not shown), based on the relationships above, has been mathematically reduced to the Henderson–Hasselbalch equation (bicarbonate/CO2 method).2
(anion gap − 12) (25 – [HCO3
–])
( H2O
The New England Journal of Medicine Downloaded from nejm.org on November 20, 2014. For personal use only. No other uses without permission.
Copyright © 2014 Massachusetts Medical Society. All rights reserved.
Integr ation of Acid –Base and Electrolyte Disorders
n engl j med 371;19 nejm.org november 6, 2014 1823
when disrupted, provides a mechanism for the acid–base condition. In their classic article, Pe-ters and Van Slyke defined acid–base balance in the blood as the chemical state resulting from the balance between cations and anions.12 Car-rying this idea to the extreme, one could view metabolic acid–base disorders as the predicted consequences of primary fluid and electrolyte imbalance.
Strong ions such as sodium and chloride are assumed to be completely dissociated in body water but can be lost or gained disproportion-ately. When the sum of all negatively charged ions (predominantly chloride) is subtracted from the sum of all positively charged strong ions, a value known as the strong ion difference (in millimoles per liter) is introduced. The strong ion difference is calculated as shown below:
strong ion difference = [Na+] + [K+] + [Ca2+] + [Mg2+] − [Cl−],
(4)
where Ca2+ denotes calcium, and Mg2+ mag-nesium.
As shown in equation 5 below, the total con-tent of albumin, phosphate, and circulating nonvolatile weak acids [HA] and their dissoci-ated anions [A−] is referred to as [Atot] in the Stewart model:
[Atot] = [HA] + [A−]. (5)
As shown in equation 6 below, in which CO3
−2 denotes carbonate and OH− hydroxide, an expression for remaining charged species, con-sidered to be the dependent variables, is
[strong ion difference] – [A−] = [HCO3
−] + [CO3−2] + [(OH−)] − [H+],
(6)
in which the levels of carbonate, hydroxide, and hydrogen are much lower than the levels of bi-carbonate. Any developed difference in the ionic charge, or strong ion difference, determines the bicarbonate concentration. Essential to this ar-gument is that any difference in an unbalanced charge will immediately result in the appearance or disappearance of bicarbonate formed from ubiquitous and neutral carbon dioxide and wa-ter. It is also expected that the changes in the bicarbonate concentration will begin to occur at
a very minimal strong ion difference, since large charge separations are not possible. We can as-sume that electrostatic forces come into play until changes in bicarbonate concentrations match the charge separations among other ionic spe-cies. Clearly, electroneutrality in the macroenvi-ronment always exists.
One drawback of using equation 6 in a clini-cal calculation of the hydrogen concentration is that the error in measurements of electrolytes in the millimolar range cannot allow for an accu-rate determination of the hydrogen level in nano-molar concentrations.
As shown in Table 1, the Stewart (or physico-chemical) model of acid–base balance is quanti-tatively based on the view that the hydrogen and bicarbonate concentrations are not independently determined. Instead, they are dependent on the following: carbon dioxide (Paco2) and its spon-taneous relationship with hydrogen and bicar-bonate, the dissociation of water (the abundant source of hydrogen within body fluids), the dis-solved strong ions, the strong ion difference, and Atot, which is the sum of all buffer pairs (mostly weak acids) that move toward equilibrium with a dissociated anion [A−] according to the dissociation constant for each (e.g., albumin with its net negative charge under physiological conditions).13
In keeping with the laws of electroneutrality, all charged species must balance. This requires that any change in the concentration of one of the charged variables (the strong ion difference) must be matched by a change in the concentra-tion of another charged species. According to constraints in this internal system, the hydrogen and bicarbonate concentrations are dependent on the other variables, the total mass of which is conserved.
The simultaneous mathematical solution of these reactions is complex and is not required to diagnose acid–base disorders. Furthermore, both experimental and clinical observations can be ex-plained with the use of either model. Yet the physicochemical model is useful in revealing in-dividual processes in the development of an acid–base disturbance because it associates the abnor-mality with specific electrolyte disturbances. The traditional model uses the calculated, and useful, anion gap to elucidate the pathophysiology of metabolic disorders. The usual calculation for the
The New England Journal of Medicine Downloaded from nejm.org on November 20, 2014. For personal use only. No other uses without permission.
Copyright © 2014 Massachusetts Medical Society. All rights reserved.
T h e n e w e ngl a nd j o u r na l o f m e dic i n e
n engl j med 371;19 nejm.org november 6, 20141824
anion gap is shown in equation 3. For this equality to hold true, for electroneutrality pur-poses, the anion gap must be the net value for a complex mixture of all ionic species not in-cluded in the calculation, such as albumin, other proteins, calcium, magnesium, potassium, and phosphate, plus any additional anions such as lactate or acetoacetate. To illustrate the use-fulness of a more inclusive approach in separat-ing out various components of the anion gap, an anion gap hypothetically could be calculated as simply [Na+] − [HCO3
−]. From a charge point of view, it works out, but obviously, hyperchlo-remic acidosis could not be distinguished from an “anion gap” acidosis.
The anion-gap equation could be rearranged to solve for the bicarbonate concentration in-stead of unmeasured anions:
[Na+] − ([Cl−] + [AG]) = [HCO3−],
where AG denotes the anion gap.This is analogous to the strong ion differ-
ence. The anion gap, which is usually calculated with the use of plasma bicarbonate, is useful clinically. If every charged species were known and measured, the equation could be rearranged to calculate the bicarbonate concentration, but often the unmeasured ion is unknown. How, then, does the strong ion difference increase or decrease? The answer lies in specific gains or losses of electrolytes such as sodium and chlo-ride in a different proportion to each other than the proportion in the normal extracellular fluid. The first step in understanding how an acid–base disorder develops is to know or assume the specific electrolyte content of any gained fluids (e.g., intravenous fluids) or lost fluids (e.g., gas-trointestinal fluids, sweat, or urinary fluids).
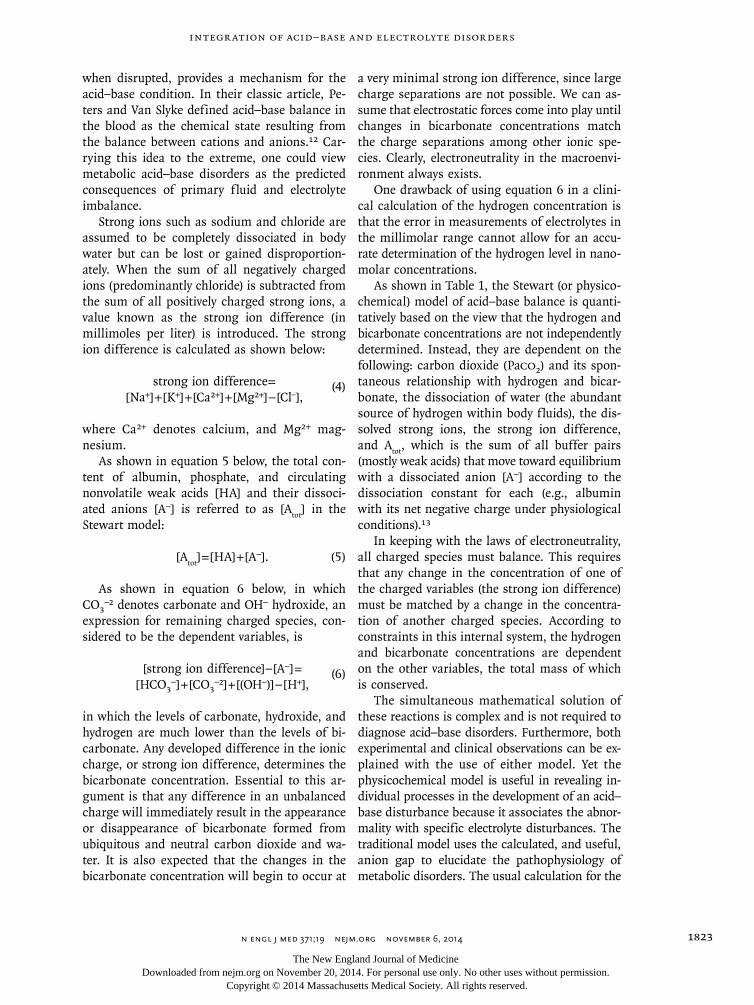
Since the normal concentration ratio of so-dium to chloride in extracellular fluid is ap-proximately 140:100, an increase in the sodium level, a decrease in the chloride level, or both will increase the strong ion difference and the bicarbonate concentration will increase (meta-bolic alkalosis), according to electroneutrality requirements.3 When the strong ion difference decreases, pH and the bicarbonate level will de-crease (metabolic acidosis). The electroneutrality relationship in equation 6 can be useful in diag-nosing the causes of metabolic alkalosis and metabolic acidosis shown in Table 2.
Table 2. Acid–Base Disorders and Their Causes According to the Relationship between Gains and Losses of Circulating Cations or Anions.*
Metabolic alkalosis
Decrease (loss) of anion
Hypochloremic
Gastrointestinal
Vomiting
Chloridorrhea (villous adenoma, some chloride secretory diarrheas)
Renal
Chloruretic agents (loop diuretics, thiazides)
Chloride channelopathies (e.g., the Bartter syndrome, the Gitelman syndrome)
Hypokalemia leading to loss of chloride
Sweat
Cystic fibrosis
Hypoalbuminemic state13: malnutrition
Increase (gain) of cation
Sodium citrate, sodium lactate, sodium bicarbonate, sodium acetate
Hypernatremic
Hyperaldosteronism
Hypercalcemic
Milk alkali syndrome, calcium carbonate
Metabolic acidosis
Increase (gain) of anion
Hyperchloremic (potassium chloride, calcium chloride, hydrogen chloride, sodium chloride, arginine hydrochloride, lysine hydrochloride, ammonium chloride)
Aniongap acidosis
Lactic acidosis
Diabetic ketoacidosis
Other unmeasured anions
Thiosulfate
Hyperphosphatemic
Decrease (loss) of cation (sodium and potassium)
Renal
Renal tubular acidosis
Natriuretic agents (e.g., amiloride, triamterene)
Sodium with anions in urine: ketoacids, dlactate, hippurate
Hypoaldosteronism
Gastrointestinal
Diarrhea with bicarbonate or bacterial organic anions in stool
Vomiting pancreatic secretions
* All metabolic acid–base disorders can be viewed in the context of the relative losses or gains of cations or anions in body fluids. Hypophosphatemia is not listed because the plasma phosphate level is normally low.
The New England Journal of Medicine Downloaded from nejm.org on November 20, 2014. For personal use only. No other uses without permission.
Copyright © 2014 Massachusetts Medical Society. All rights reserved.
Integr ation of Acid –Base and Electrolyte Disorders
n engl j med 371;19 nejm.org november 6, 2014 1825
Me ta bolic Dis t ur b a nces a nd S trong Ions
Acid–base balance is dependent on strong ions in the macroscopic sense because the same cellular mechanisms regulate acid–base homeostasis and electrolyte homeostasis. The following case vi-gnette illustrates this point:
A 31-year-old woman with gastroenteritis had been vomiting for 2 days. She was weak and hypotensive. Laboratory tests revealed a sodium concentration of 125 mmol per liter, potassium 2.6 mmol per liter, chlo-ride 72 mmol per liter, and bicarbonate 40 mmol per liter. The arterial pH was 7.54, the Paco2 48 mm Hg, and the uri-nary pH 5.0.
Depletion of the extracellular fluid from vom-iting creates profound needs to conserve sodium and water and preserve potassium balance; these mechanisms are clearly obstacles to maintaining a normal blood pH and bicarbonate concentra-tion. With volume and potassium depletion, metabolic alkalosis is maintained, not corrected, by the kidneys.14,15 Low extracellular fluid vol-ume and low blood pressure increase angioten-sin II and aldosterone levels. Increased sodium reabsorption through proximal tubular sodium–hydrogen exchange and the collecting-duct sodium channel, accompanied by hydrogen secre-tion by the hydrogen ATPase and the potassium–hydrogen ATPase, in turn increases bicarbonate reabsorption until the urinary pH decreases as it becomes free of bicarbonate. This paradoxical aciduria in the midst of alkalemia is evidence that blood pH depends on strong ion balance. The alkalemia will be corrected only with suffi-cient replacement of sodium, chloride, and po-tassium. In this patient, after the administration of 0.9% normal saline with potassium chloride, the electrolyte status improved, and the urinary pH increased to 8.0 with the prompt excretion of sodium, potassium, and bicarbonate. In this clinical situation, the interdependency of acid–base and electrolyte balance is self-evident. If this were not the case, and kidney function in-stead focused on maintaining a normal acid–base balance, the bicarbonate generated by vomiting would result in the urinary loss of even larger quantities of sodium, potassium, and water, lead-
ing to life-threatening volume and potassium depletion.
The traditional acid–base approach tacitly overlaps with aspects of the strong ion theory (Table 1). Consider the familiar concept known as the “delta-delta” (Δ - Δ), the increase (Δ) in the anion gap versus the decrease (Δ) in the bi car-bonate level.8,9
All metabolic acid–base disorders are associ-ated with either a change in the concentration of sodium, potassium, calcium, chloride, hydrogen phosphate, or albumin or a change in the anion gap. The normal anion gap can be adjusted for hypoalbuminemia by allowing for 2.5 mmol per liter of negative charge for each 1 g per deciliter of albumin concentration.13 The relative change in the bicarbonate level and the anion gap (Δ - Δ) is only part of the electroneutrality requirement. The net sum of all cation and anion electrolyte charge gaps must cancel out. In the search for a “Δ-Δ-Δ-Δ-Δ-Δ,” clues about any acid–base disor-der will emerge.
A finding of an increase in the anion gap above the normal concentration (the Δ anion gap) that exceeds the decrease in the bicarbonate concentration (Δ bicarbonate) may indicate mixed metabolic acidosis and metabolic alkalosis. The following case shows that a ratio other than 1:1 is not pathognomonic for a mixed acid–base disturbance:
Before a cardiac arrest, a 67-year-old man with an acute myocardial infarction had normal levels of serum electrolytes (level of sodium 140 mmol per liter, potassium 4.0 mmol per liter, chloride 103 mmol per liter, and bicarbonate 25 mmol per liter). While he was anuric after the cardiac ar-rest, his laboratory tests showed a sodium level of 140 mmol per liter, potassium 5.0 mmol per liter, chloride 62 mmol per liter, and bicarbonate 5 mmol per liter. The arterial pH was 7.10, and the Paco2 was 16 mm Hg. The lactate level was 60 mmol per liter, and the anion gap was 73 mmol per liter.
This patient had severe anion-gap metabolic acidosis due to lactate overproduction from tis-sue hypoperfusion. Since lactate production can result in blood lactate concentrations greater than a normal bicarbonate concentration, what
The New England Journal of Medicine Downloaded from nejm.org on November 20, 2014. For personal use only. No other uses without permission.
Copyright © 2014 Massachusetts Medical Society. All rights reserved.
T h e n e w e ngl a nd j o u r na l o f m e dic i n e
n engl j med 371;19 nejm.org november 6, 20141826
happens when the bicarbonate concentration decreases almost to zero? Hydrogen might be preferentially reactive with other tissue buffer sys-tems, but a decrease in the chloride level is often observed, yielding a hypochloremic anion-gap acidosis.16,17 With lactate acting as a strong ion, the strong ion difference [Na+] – [Cl−] – [lactate−] is decreased and the bicarbonate concentration decreases to achieve electroneutrality. Chloride moves into cells, probably in exchange for lac-tate or bicarbonate. In this case, there was no clinical evidence of superimposed metabolic alka-losis:
Δ [HCO3−] + Δ [Cl−] = Δ [AG] = [lactate].
Also, consider examples of metabolic alkalosis in which the increase in a strong cation is bal-anced by an increase in the bicarbonate concen-tration, as in the following case, which was also described by Berend et al.7:
A 50-year-old woman with a recent onset of hypertension had the following labora-tory results: sodium level 150 mmol per liter, potassium 2.2 mmol per liter, chlo-ride 103 mmol per liter, and bicarbonate 32 mmol per liter. The arterial pH was 7.50, and the Paco2 was 43 mm Hg. She was found to have an aldosterone-secreting adrenal adenoma.
In this case, the change in the bicarbonate level was associated with an increased sodium concentration, which is often seen in primary hyperaldosteronism and is attributable to in-creased function of epithelial sodium channels in renal cortical collecting-duct principal cells. Mild hypernatremia probably occurred as a re-sult of extracellular fluid expansion that de-creased vasopressin release, with a consequent decrease in renal reabsorption of water. The plasma chloride level was not increased in pro-portion to the sodium level, which is consistent with less chloride than sodium retention in pri-mary hyperaldosteronism.18 Loss of chloride, a feature of “aldosterone escape from edema,” is linked to decreased sodium–chloride cotrans-port in the distal renal tubule.19 Hypokalemia in turn is associated with increased loss of urinary chloride. Thus,
Δ [HCO3−] = Δ [Na+] + Δ [K+] − Δ [Cl−],
with changes in each of these strong ions con-tributing to the alkalosis.
Treatment of the alkalosis in this patient with hyperaldosteronism will require replacement with potassium chloride. Administering chloride in the form of saline would worsen the hypokale-mia, and administering potassium without chlo-ride would not correct it; thus, the term “saline unresponsive” is more accurate than “chloride unresponsive” as a description of this type of alkalosis.
Hypercalcemia will increase the strong ion difference and is associated with metabolic alka-losis.20 The milk alkali syndrome, which is often caused by excessive ingestion of calcium-con-taining antacids, is characterized by alkalosis and hypercalcemia. In contrast, hypercalcemia in primary hyperparathyroidism is associated with a proximal renal tubular metabolic acidosis rather than metabolic alkalosis. This observa-tion may be explained by the decrease in the strong ion difference due to losses of urinary sodium resulting from inhibition of proximal tubular sodium–hydrogen exchange by parathy-roid hormone.21
G a s troin tes tina l L osses of S trong Ions
Losses of ions due to diarrhea are associated with the development of metabolic acidosis22 or metabolic alkalosis. Since depletion of extracel-lular volume can occur in cases of acidosis or alkalosis and may be initiated by losses of sodi-um and chloride in any ratio, the term “contrac-tion alkalosis” is a misnomer. As shown in the following case, the relative content of the strong ions lost (sodium and potassium vs. chloride),23 not the site of the loss, determines the acid–base disorder:
A 40-year-old woman who underwent a colonic resection for ulcerative colitis had excessive liquid drainage from an ileostomy. Her laboratory results revealed a plasma so-dium level of 138 mmol per liter, potassium 5.0 mmol per liter, chloride 110 mmol per liter, and bicarbonate 15 mmol per liter. The arterial pH was 7.30, and the Paco2 was 32 mm Hg.
In this case, the loss of watery small-intestinal and pancreatic secretions, which have high sodi-
The New England Journal of Medicine Downloaded from nejm.org on November 20, 2014. For personal use only. No other uses without permission.
Copyright © 2014 Massachusetts Medical Society. All rights reserved.
Integr ation of Acid –Base and Electrolyte Disorders
n engl j med 371;19 nejm.org november 6, 2014 1827
um and bicarbonate levels and very low chloride levels, would result in the relative retention of more chloride than sodium in the extracellular fluid, causing hyperchloremic acidosis. In cases of colonic diarrhea, hyperchloremic acidosis may develop because of loss of sodium and po-tassium with organic anions of bacterial origin, such as acetate, rather than bicarbonate per se.23
When diarrhea is the cause of metabolic alka-losis, rather than acidosis, the mechanism is determined by measuring the electrolyte content in stool. Large losses of chloride may occur in patients who have villous adenomas or other secretory diarrheas that cause depletion of chlo-ride, as shown in the following case, described by Berend et al.7:
Large volumes of watery diarrhea from in-fectious gastroenteritis developed in a 22- year-old man. Laboratory tests revealed a plasma sodium concentration of 140 mmol per liter, potassium 3.0 mmol per liter, chloride 86 mmol per liter, and bicarbon-ate 38 mmol per liter. The arterial pH was 7.60, and the Paco2 was 40 mm Hg.
In this case, the electrolyte concentrations in liquid stool, if measured, would probably show a charge gap, in which (Na+ + K+) − Cl− would be less than the normal plasma bicarbonate con-centration. High losses of chloride in stool, like losses of chloride from vomiting or after the use of loop diuretics, cause hypochloremic alkalosis.
Ur ina r y Ch a rge G a p a nd S trong Ions
Measurements of urinary electrolyte concentra-tions and flow rate indicate renal acid–base func-tion even without measurement of urinary bicar-bonate. As shown in equation 7, the urinary net charge compares the loss of measured strong cations (sodium and potassium) with the loss of chloride24:
Urinary net charge gap = [UNa+] + [UK
+] − [UCl−]. (7)
Negative Urinary Charge Gap
A negative value for the urinary net charge gap indicates the presence of the unmeasured cation, ammonium (excretion of ammonium chloride). The loss of ammonium chloride in the urine of a patient with metabolic acidosis is an appropriate
compensation, since the very process of excret-ing acid in this way has an alkalinizing effect on body fluids. The loss of net acid in the form of ammonium chloride is a normal renal response to nonrenal causes of metabolic acidosis, such as severe watery diarrhea. The losses of urinary chloride result in an increased plasma strong ion difference, which in turn permits the formation of more bicarbonate.
However, in a patient with metabolic alkalo-sis, a relative excess of chloride in the urine strongly suggests that the losses of urinary chlo-ride cause the metabolic alkalosis by increasing the plasma strong ion difference. In the follow-ing case, such losses of urinary chloride led to hypochloremic alkalosis:
An 80-year-old man with congestive heart failure received furosemide until all pe-ripheral edema disappeared. Laboratory tests revealed a sodium level of 130 mmol per liter, potassium 2.5 mmol per liter, chloride 80 mmol per liter, and bicarbon-ate 40 mmol per liter. The arterial pH was 7.50, and the Paco2 was 53 mm Hg.
In this patient, the sodium–potassium–chlo-ride cotransporter was inhibited by furosemide (in the thick ascending limb of the loop of Henle). Under these circumstances, the stoichio-metric balance of sodium, potassium, and chlo-ride was 1:1:2, and proportionately more chlo-ride than sodium was lost in the urine. Thus, there is a direct explanation for the hypochlore-mic metabolic alkalosis in this patient. Inhibi-tion of the sodium–chloride cotransporter of the distal tubule by thiazides (stoichiometric balance between sodium and chloride, 1:1) is also pre-dictive of metabolic alkalosis because of the greater loss of chloride than sodium from the ex-tracellular fluid. In addition to chloride-wasting diuretics, many hereditary disorders of sodium and chloride transport by the renal tubules (so-called channelopathies) may cause acid–base dis-orders, as shown in Table 2.
Positive Urinary Charge Gap
A positive value for the urinary net charge gap indicates excretion of an unmeasured anion. The lost, unmeasured anion may be bicarbonate or nonbicarbonate anions such as ketones, lactate, l-lactate, d-lactate, and hippurate in persons who sniff glue. Such loss of anions will decrease
The New England Journal of Medicine Downloaded from nejm.org on November 20, 2014. For personal use only. No other uses without permission.
Copyright © 2014 Massachusetts Medical Society. All rights reserved.
T h e n e w e ngl a nd j o u r na l o f m e dic i n e
n engl j med 371;19 nejm.org november 6, 20141828
the plasma strong ion difference and acidify the extracellular fluid as the process returns chloride to the circulation.10,25 If the urinary clearance of these nonchloride anions is high enough that they do not accumulate as a plasma anion gap, then the hyperchloremia may be mistaken for renal tubular acidosis.24 Without those nonbicar-bonate anions, metabolic acidosis with the loss of urinary sodium and potassium and retention of chloride (the positive-charge gap) will result in a decreased plasma strong ion difference, consti-tuting a renal cause of acidosis (e.g., carbonic anhydrase inhibition or renal tubular acidosis).
If metabolic alkalosis is present, a positive urinary gap suggests that the renal loss of strong cations (sodium and potassium) and con-servation of chloride will acidify the extracellu-lar fluid because of a decrease in the plasma strong ion difference and in the bicarbonate concentration.
The excretion patterns of urinary electrolytes reflect the ability of the kidney to counteract nonrenal acid–base disorders. The capacity of the kidney to excrete ammonium chloride in acidosis allows for elimination of anions with conservation of sodium for volume and potassi-um for potassium balance. This potassium-sparing effect of urinary ammonium is evident in hypokalemic stimulation of ammoniagenesis.
The traditional physiological approach inter-prets the urine electrolytes to deduce the pres-ence of ammonium and bicarbonate with less emphasis on the strong ion pathogenesis of acid–base disorders. The physicochemical model emphasizes the relative losses of the actual mea-sured quantities to determine the cause of the disturbance. Both perspectives are enlightening.
Compens ation for R espir at or y Disor der s a nd Ur ina r y
S trong Ions
The ratio of bicarbonate to Paco2 in the Hender-son–Hasselbalch equation (equation 1) is a sim-ple way to illustrate the initial disturbance and then the modulating effect of the compensatory response on pH. In respiratory conditions, the Paco2 is the initial abnormality leading to sharp, sudden changes in pH, with little change in strong ion concentrations. Over time, however, the change in the level of chloride and reciprocal changes in the level of bicarbonate are the major factors that allow pH to return toward normal
values. The hyperchloremic renal compensation for respiratory alkalosis is the excretion of fil-tered sodium and potassium with bicarbonate, because low Paco2 decreases proximal and distal hydrogen secretion. As the plasma strong ion difference decreases, the plasma bicarbonate concentration will decrease.
In respiratory acidosis, high Paco2 increases production of ammonia by the kidney, and the excretion of ammonium chloride with a negative urinary net charge, shown in equation 7, results in hypochloremia, an increased plasma strong ion difference, and an elevated plasma bicarbon-ate concentration. The elevated Paco2 increases the renal reabsorption of sodium and bicarbon-ate, so the compensation is maintained. If the Paco2 is abruptly lowered by means of a ventila-tor, the compensatory response transitions to posthypercapnic hypochloremic metabolic alka-losis, which will not resolve until the chloride that is lost as ammonium chloride is replenished.
In tr av enous Fluids a nd Con ten t of S trong Ions
The gain of fluids containing strong ions in ra-tios dissimilar to those in the extracellular fluid also affects acid–base balance, as shown in the following case, which was also described by Berend et al.7 in their article about the physiolog-ical approach:
A 22-year-old woman who had been injured in an accident received 6 liters of isotonic saline, after which the level of sodium was 135 mmol per liter, potassium 3.8 mmol per liter, chloride 115 mmol per liter, and bicarbonate 18 mmol per liter. The arterial pH was 7.28, and the Paco2 was 39 mm Hg. The urinary sodium level was 65 mmol
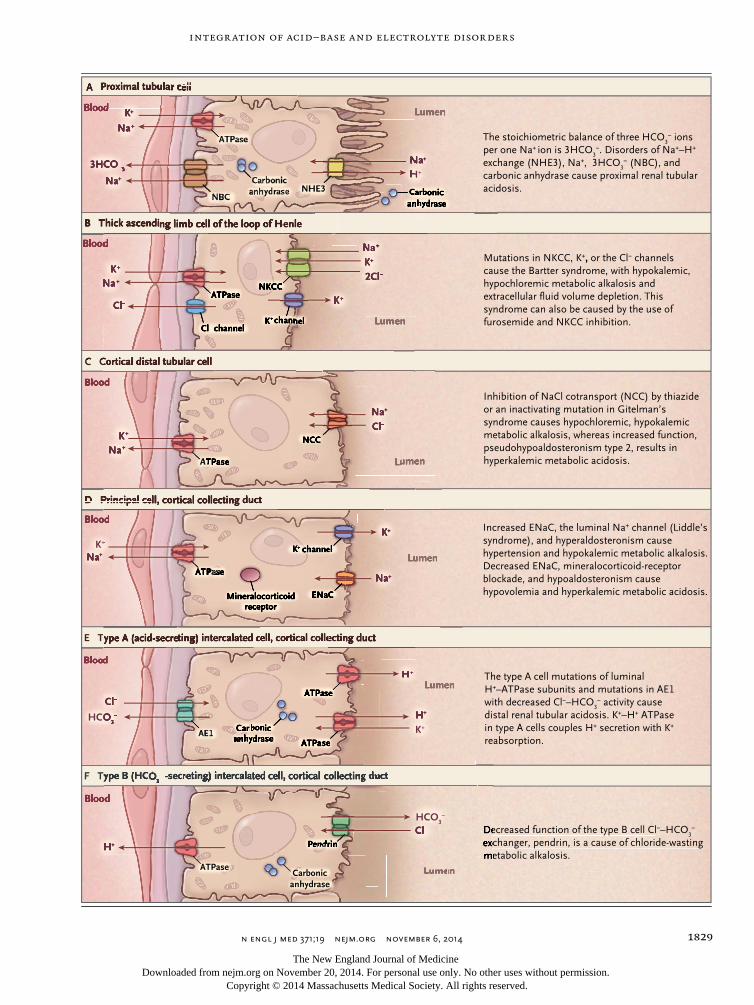
Figure 1 (facing page). Renal Tubular Cells with Trans-porters That Are Targets of Hormones, Diuretics, and Mutations Affecting Acid–Base Balance.
Similar transporters in the gastrointestinal tract that are associated with disease are not shown. All cell transporters on the blood side interface with interstitial fluid (not shown) before transport into blood. AE1 denotes anion exchanger 1, ENaC epithelial sodium channel, NBC sodium bicarbonate cotransporter, NCC sodium chloride cotransporter, NHE3 sodium–hydrogen exchange, and NKCC sodium–potassium 2chloride cotransporter.
The New England Journal of Medicine Downloaded from nejm.org on November 20, 2014. For personal use only. No other uses without permission.
Copyright © 2014 Massachusetts Medical Society. All rights reserved.
Integr ation of Acid –Base and Electrolyte Disorders
n engl j med 371;19 nejm.org november 6, 2014 1829
A Proximal tubular cell
B Thick ascending limb cell of the loop of Henle
C Cortical distal tubular cell
D Principal cell, cortical collecting duct
E Type A (acid-secreting) intercalated cell, cortical collecting duct
F Type B (HCO3− -secreting) intercalated cell, cortical collecting duct
Proximal tubular cell
ATPase
ATPase
ATPase
ATPase
ATPase
ATPase
Pendrin
NKCC
NCC
Cl− channel K+ channel
K+ channel
Mineralocorticoidreceptor
ENaC
Carbonic anhydrase
Carbonic anhydrase
Carbonic anhydrase
Blood
Blood
Blood
Blood
Blood
Blood
Lumen
Lumen
Lumen
Lumen
Lumen
Lumen
The stoichiometric balance of three HCO3− ions
per one Na+ ion is 3HCO3−. Disorders of Na+–H+
exchange (NHE3), Na+, 3HCO3− (NBC), and
carbonic anhydrase cause proximal renal tubular acidosis.
Mutations in NKCC, K+, or the Cl− channels cause the Bartter syndrome, with hypokalemic, hypochloremic metabolic alkalosis and extracellular fluid volume depletion. This syndrome can also be caused by the use of furosemide and NKCC inhibition.
Inhibition of NaCl cotransport (NCC) by thiazide or an inactivating mutation in Gitelman’s syndrome causes hypochloremic, hypokalemic metabolic alkalosis, whereas increased function, pseudohypoaldosteronism type 2, results in hyperkalemic metabolic acidosis.
Increased ENaC, the luminal Na+ channel (Liddle’s syndrome), and hyperaldosteronism cause hypertension and hypokalemic metabolic alkalosis. Decreased ENaC, mineralocorticoid-receptor blockade, and hypoaldosteronism cause hypovolemia and hyperkalemic metabolic acidosis.
The type A cell mutations of luminal H+–ATPase subunits and mutations in AE1 with decreased Cl−–HCO
3− activity cause
distal renal tubular acidosis. K+–H+ ATPase in type A cells couples H+ secretion with K+ reabsorption.
Decreased function of the type B cell Cl−–HCO3−
exchanger, pendrin, is a cause of chloride-wasting metabolic alkalosis.
Na+
Na+
Na+
Na+
Na+
Na+
Na+
C Cortical distal tubular cell
Cl−
Blood
Cl−
LumenLumen
Cl− Decreased function of the type B cell Clexchanger, pendrin, is a cause of chloride-wasting metabolic alkalosis.
LumenLumen
Cl−HCO
3−
F Type B (HCO
Blood
HCO3−
Lumen
Cl−
2Cl−
Na+
LumenLumen
Na+
Carbonic Carbonic anhydraseanhydraseCarbonic
anhydrase
Na+
H+
H+
H+
Blood
H+
3HCO−3
Proximal tubular cellProximal tubular cellA Proximal tubular cellProximal tubular cell
BloodBloodBloodBlood
3HCO3HCO
K+
Blood
Na
B Thick ascending limb cell of the loop of HenleB Thick ascending limb cell of the loop of Henle
K+
Blood
K+
LumenLumen
K+
LumenLumen
H+
K+
D Principal cell, cortical collecting duct
Blood
D Principal cell, cortical collecting duct
Na+K+
anhydrase
K+
K+
C Cortical distal tubular cell
E Type A (acid-secreting) intercalated cell, cortical collecting duct
F Type B (HCO
D Principal cell, cortical collecting duct
ATPase
F Type B (HCO3− -secreting) intercalated cell, cortical collecting duct
ATPase
-secreting) intercalated cell, cortical collecting duct
ATPase
ATPaseATPase
B Thick ascending limb cell of the loop of Henle
NCC
C Cortical distal tubular cell
ATPase
Cl− channel
ATPaseNKCCNKCCNKCC
channel K+ channel
D Principal cell, cortical collecting duct
E Type A (acid-secreting) intercalated cell, cortical collecting ductE Type A (acid-secreting) intercalated cell, cortical collecting duct
ATPaseATPaseATPaseATPase
E Type A (acid-secreting) intercalated cell, cortical collecting duct
MineralocorticoidMineralocorticoidreceptor
E Type A (acid-secreting) intercalated cell, cortical collecting ductE Type A (acid-secreting) intercalated cell, cortical collecting ductE Type A (acid-secreting) intercalated cell, cortical collecting ductE Type A (acid-secreting) intercalated cell, cortical collecting duct
K+ channel channel channel
E Type A (acid-secreting) intercalated cell, cortical collecting ductE Type A (acid-secreting) intercalated cell, cortical collecting duct
MineralocorticoidMineralocorticoidreceptorreceptor
ENaC
B Thick ascending limb cell of the loop of HenleB Thick ascending limb cell of the loop of HenleB Thick ascending limb cell of the loop of HenleB Thick ascending limb cell of the loop of Henle
-secreting) intercalated cell, cortical collecting duct
ATPase
-secreting) intercalated cell, cortical collecting duct-secreting) intercalated cell, cortical collecting duct
ATPase
ATPaseATPase
-secreting) intercalated cell, cortical collecting duct
ATPase
-secreting) intercalated cell, cortical collecting duct-secreting) intercalated cell, cortical collecting duct
ATPase
ATPaseATPase
Carbonic Carbonic Carbonic Carbonic anhydraseanhydraseanhydraseanhydraseanhydraseanhydraseanhydraseanhydraseanhydraseanhydraseanhydraseanhydraseanhydraseanhydraseanhydraseanhydraseanhydrase
Pendrin
Blood
D Principal cell, cortical collecting duct
E Type A (acid-secreting) intercalated cell, cortical collecting ductE Type A (acid-secreting) intercalated cell, cortical collecting duct
channel
E Type A (acid-secreting) intercalated cell, cortical collecting duct
ENaCENaC
C Cortical distal tubular cellC Cortical distal tubular cell
Blood
F Type B (HCOF Type B (HCO -secreting) intercalated cell, cortical collecting duct
Blood
Cl−
HCO3−
LumenLumen
Na+
Cl−
Lumen
Carbonic Carbonic anhydrase
NaH
E Type A (acid-secreting) intercalated cell, cortical collecting ductE Type A (acid-secreting) intercalated cell, cortical collecting ductE Type A (acid-secreting) intercalated cell, cortical collecting duct
H+
Blood
H+
NaNa+
3
Blood
Na+Na+
3HCO−3
K+
B Thick ascending limb cell of the loop of Henle
Blood
Na+
Cl−
B Thick ascending limb cell of the loop of HenleB Thick ascending limb cell of the loop of HenleB Thick ascending limb cell of the loop of HenleB Thick ascending limb cell of the loop of Henle
K+
Blood
Na+
K+
channel Lumen
NaNaNa+
KK+
-secreting) intercalated cell, cortical collecting duct-secreting) intercalated cell, cortical collecting duct-secreting) intercalated cell, cortical collecting duct-secreting) intercalated cell, cortical collecting duct-secreting) intercalated cell, cortical collecting duct
H+
D Principal cell, cortical collecting ductD Principal cell, cortical collecting duct
Blood
D Principal cell, cortical collecting ductD Principal cell, cortical collecting duct
+
NaNa+
anhydrase
NKCC
channel channel channel channel channel channel channel channel Lumen
NaNaNaNa++
2Cl−KK+
KK+
1
Ingelfinger
10/22/14
AUTHOR PLEASE NOTE:Figure has been redrawn and type has been reset
Please check carefully
Author
Fig #
Title
ME
DEArtist
Issue date
COLOR FIGURE
Draft 8Seifter
N Koscal
11/06/2014
Integration of Acid-Base Disorders with Electrolyte Balance
The New England Journal of Medicine Downloaded from nejm.org on November 20, 2014. For personal use only. No other uses without permission.
Copyright © 2014 Massachusetts Medical Society. All rights reserved.
T h e n e w e ngl a nd j o u r na l o f m e dic i n e
n engl j med 371;19 nejm.org november 6, 20141830
per liter, potassium 15 mmol per liter, and chloride 110 mmol per liter.
This is an example of saline-induced acido-sis,26 which develops because the infusion of a proportionately high sodium chloride–contain-ing solution, one with a sodium-to-chloride ratio of less than 140:100, will decrease the plasma strong ion difference and the bicarbonate con-centration. The insufficient urinary excretion of the extra chloride as ammonium chloride leads to metabolic acidosis. The infusion of saline with its 1:1 sodium-to-chloride ratio, resulting in hyperchloremic acidosis, is the converse of inhibition of the 1:1 sodium-to-chloride trans-port ratio in thiazide-induced diuresis and hypo-chloremic metabolic alkalosis.
Even Ringer’s lactate, with a level of sodium of 130 mmol per liter, chloride 109 mmol per liter, and lactate 28 mmol per liter, can cause hyperchloremic acidosis because the ratio of sodium to chloride is smaller than the ratio of sodium to chloride in the normal extracellular fluid.26,27 Thus, what matters is the content and amount of infused fluids.
Conclusions
Clinical evidence can be interpreted with the use of both the strong ion theory and the traditional
bicarbonate-centered approach to provide an op-timal understanding of acid–base disorders. Electrolyte concentrations of plasma may be al-tered by the gains and losses associated with in-travenous fluids and with urinary, intestinal, or sweat-gland secretions. An understanding of the consequences of these disturbances helps in the diagnosis and treatment of the associated acid–base disorders.
The evidence connecting acid–base balance with electrolyte balance is apparent at the cel-lular level (i.e., ion transporters, their stoichio-metric balance, and the hormones that regulate them) (Fig. 1) and in clinical practice. The fact that transporters often couple a strong ion such as sodium or potassium with hydrogen, or chlo-ride with bicarbonate,28-30 suggests an ultimate coherence between the two approaches (Fig. 1). As more is learned about the molecular nature of disorders of epithelial-cell transport as well as about intracellular pH, it will become more im-portant to understand interactions between car-bon dioxide and bicarbonate with strong ions and cellular buffers in the body.31
No potential conflict of interest relevant to this article was reported.
Disclosure forms provided by the author are available with the full text of this article at NEJM.org.
References
1. Gamble JL Jr. Sodium and chloride and acid-base physiology. Bull Johns Hop-kins Hosp 1960;107:247-54.2. Kurtz I, Kraut J, Ornekian V, Nguyen MK. Acid-base analysis: a critique of the Stewart and bicarbonate-centered ap-proaches. Am J Physiol Renal Physiol 2008;294:F1009-F1031.3. Stewart PA. Modern quantitative acid-base chemistry. Can J Physiol Pharmacol 1983;61:1444-61.4. Constable PD. A simplified strong ion model for acid-base equilibria: applica-tion to horse plasma. J Appl Physiol (1985) 1997;83:297-311.5. Fencl V, Rossing TH. Acid-base disor-ders in critical care medicine. Annu Rev Med 1989;40:17-29.6. Adrogué HJ, Gennari FJ, Galla JH, Madias NE. Assessing acid-base disorders. Kidney Int 2009;76:1239-47.7. Berend K, de Vries APJ, Gans ROB. Physiological approach to assessment of acid–base disturbances. N Engl J Med 2014;371:1434-45.8. Emmett M, Narins RG. Clinical use of the anion gap. Medicine (Baltimore) 1977; 56:38-54.
9. Goodkin DA, Krishna GG, Narins RG. The role of the anion gap in detecting and managing mixed metabolic acid-base disorders. Clin Endocrinol Metab 1984; 13:333-49.10. Oh MS, Carroll HJ. The anion gap. N Engl J Med 1977;297:814-7.11. Selk N, Rodby RA. Unexpectedly se-vere metabolic acidosis associated with sodium thiosulfate therapy in a patient with calcific uremic arteriolopathy. Semin Dial 2011;24:85-8.12. Carbonic acid and acid-base balance. In: Peters JP, Van Slyke DD. Quantitative clinical chemistry: interpretations. Balti-more: Williams & Wilkins, 1939:868-1018.13. McAuliffe JJ, Lind LJ, Leith DE, Fencl V. Hypoproteinemic alkalosis. Am J Med 1986;81:86-90.14. Seldin DW, Rector FC Jr. Symposium on acid-basis homeostasis: the generation and maintenance of metabolic alkalosis. Kidney Int 1972;1:306-21.15. Luke RG, Galla JH. It is chloride de-pletion alkalosis, not contraction alkalo-sis. J Am Soc Nephrol 2012;23:204-7.16. Case Records of the Massachusetts
General Hospital (Case 18-1968). N Engl J Med 1968;278:1004-13.17. Madias NE, Homer SM, Johns CA, Co-hen JJ. Hypochloremia as a consequence of anion gap metabolic acidosis. J Lab Clin Med 1984;104:15-23.18. Relman AS, Schwartz WB. The effect of DOCA on electrolyte balance in normal man and its relation to sodium chloride intake. Yale J Biol Med 1952;24:540-58.19. Wang XY, Masilamani S, Nielsen J, et al. The renal thiazide-sensitive Na-Cl co-transporter as mediator of the aldoste-rone-escape phenomenon. J Clin Invest 2001;108:215-22.20. Medarov BI. Milk-alkali syndrome. Mayo Clin Proc 2009;84:261-7.21. Kahn AM, Dolson GM, Hise MK, Ben-nett SC, Weinman EJ. Parathyroid hor-mone and dibutyryl cAMP inhibit Na+/H+ exchange in renal brush border vesicles. Am J Physiol 1985;248:F212-F218.22. Gennari FJ, Weise WJ. Acid-base dis-turbances in gastrointestinal disease. Clin J Am Soc Nephrol 2008;3:1861-8.23. Fordtran JS. Organic anions in fecal contents. N Engl J Med 1971;284:329- 30.
The New England Journal of Medicine Downloaded from nejm.org on November 20, 2014. For personal use only. No other uses without permission.
Copyright © 2014 Massachusetts Medical Society. All rights reserved.
Integr ation of Acid –Base and Electrolyte Disorders
n engl j med 371;19 nejm.org november 6, 2014 1831
24. Batlle DC, Hizon M, Cohen E, Gutter-man C, Gupta R. The use of the urinary anion gap in the diagnosis of hyperchlo-remic metabolic acidosis. N Engl J Med 1988;318:594-9.25. Carlisle EJ, Donnelly SM, Vasuvat-takul S, Kamel KS, Tobe S, Halperin ML. Glue-sniffing and distal renal tubular aci-dosis: sticking to the facts. J Am Soc Nephrol 1991;1:1019-27.26. Waters JH, Gottlieb A, Schoenwald P, Popovich MJ, Sprung J, Nelson DR. Nor-
mal saline versus lactated Ringer’s solu-tion for intraoperative fluid management in patients undergoing abdominal aortic aneurysm repair: an outcome study. Anesth Analg 2001;93:817-22.27. Omron EM, Omron RM. A physico-chemical model of crystalloid infusion on acid-base status. J Intensive Care Med 2010;25:271-80.28. Gennari FJ. Pathophysiology of meta-bolic alkalosis: a new classification based on the centrality of stimulated collecting
duct ion transport. Am J Kidney Dis 2011; 58:626-36.29. Koeppen BM. The kidney and acid-base regulation. Adv Physiol Educ 2009; 33:275-81.30. Chadha V, Alon US. Hereditary renal tubular disorders. Semin Nephrol 2009; 29:399-411.31. Corey HE. Stewart and beyond: new models of acid-base balance. Kidney Int 2003;64:777-87.Copyright © 2014 Massachusetts Medical Society.
The New England Journal of Medicine Downloaded from nejm.org on November 20, 2014. For personal use only. No other uses without permission.
Copyright © 2014 Massachusetts Medical Society. All rights reserved.