Achieving Safety Results by Addressing Behavioral Issues
44
Achieving Safety Results by Addressing Behavioral Issues June 28, 2017 Presented by: Nicole Waldheim, Cambridge Systematics
-
Upload
rpo-america -
Category
Government & Nonprofit
-
view
197 -
download
2
Transcript of Achieving Safety Results by Addressing Behavioral Issues

Achieving Safety Results by Addressing
Behavioral IssuesJune 28, 2017
Presented by: Nicole Waldheim, Cambridge Systematics

Session Agenda
• Welcome and Introductions
• Importance of Transportation Safety
– Human Factors and Crashes
• Opportunities to Engage in Behavioral Safety
• Resources to Address Behavioral Safety
• Key Takeaways
7

Session Objectives
3
• Summarize the need to address transportation safety
and move towards zero deaths through behavioral
solutions
• Discuss how RTPOs can become engaged in
behavioral safety and fund solutions
• Work through the steps to identify and address
behavioral solutions

Behavioral Safety
• The factors contributing to a crash generally fall into three
categories – human, vehicle, and roadway/environment
• Human factors are attributes of the driver that may
contribute to a crash
4
Common Human Risk Factors
• Distraction
• Drowsy
• Impairment (drugs or alcohol)
• Not buckling up
• Aggressive Driving/Speeding
• Age
• Exposure (bike/pedestrian,
motorcycle)

Why Address Human Factors
5
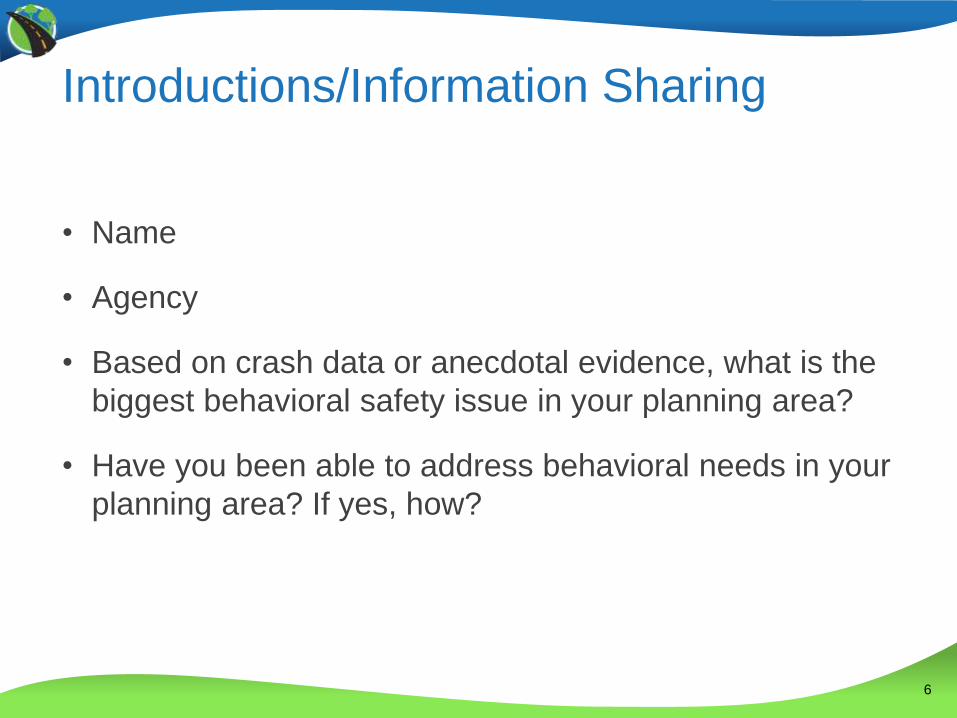
Introductions/Information Sharing
• Name
• Agency
• Based on crash data or anecdotal evidence, what is the
biggest behavioral safety issue in your planning area?
• Have you been able to address behavioral needs in your
planning area? If yes, how?
6

Importance of Transportation Safety

National Transportation Safety Facts
• Over 40,000 estimated motor vehicle fatalities in 2016
– 6% increase from 2015 and 14% increase from 2014
• During daylight hours, 660,000 drivers are using cell
phones while driving (2017 NHTSA Report)
• In 2015, motor vehicle fatalities was the single largest
cause of death for persons aged 15-29.
• In 2015, alcohol-impaired driving was involved in 29
percent of traffic fatalities
8

Rural Transportation Safety Facts
• 19 % of the US population lives in rural areas, but rural
fatalities account for 49% of all fatalities (2015)
• Of the 35,092 traffic fatalities in 2015, 17,114 (49%)
occurred in rural areas
• Rural fatalities increased 2% from 2014 to 2015
• For fatalities occurring in rural areas, 50% of passengers
were unrestrained
– 61% of rural pickup truck occupants killed were unrestrained.
9

Toward Zero Deaths – You Can
Contribute
• National strategy, adopted by many transportation agencies, that envisions a transportation system free of fatalities
– Engineering Solutions
• Roadway Design
• Countermeasures
• Speed Limits
– Behavioral Solutions
• Law Enforcement
• Education/Outreach Campaigns
• Emergency Response
– Vehicle Solutions
• Connected and Autonomous Vehicles
10

Be Part of the Solution
• Some ninety percent of
motor vehicle crashes
are caused at least in
part by human error.
• Participate in/convene safety meetings
• Identify top contributing factors to crashes
• Identify/Participate in solutions
• Find partners and resources
11

Opportunities to Engage in Behavioral Safety
Collaboration

13
Opportunities to Coordinate on
Behavioral Safety
• SHSP teams or committees
• Highway Safety Office
coalitions (i.e. safe
communities)
• Regional or local safety
committees
• Law Enforcement, Insurance
companies, Major employers,
Universities/Colleges, Drivers
Education, Non-profits (MADD,
AARP)
Participate on Existing Groups Establish a Group
13
Examples of Stakeholders to Engage
• Houma Regional Transportation Safety Plan
• North Shore Regional Transportation Plan
• Bozeman Community Traffic Safety Plan
• Destination Safe Coalition (MARC)

Community Traffic Resource Center
14

Key Partner
Highway Safety Office
• Every state has a Highway Safety Office
• Responsible for planning and implementing programs to address behavioral traffic safety issues
• Develop Highway Safety Plans (HSPs) every July and Annual Reports (AR) every December
– HSP is data driven and outlines programs eligible for NHTSA grants
– Applications for grants every January/February
– Annual report demonstrates progress on previous years programs and performance
• Administer Federal Grants (402 and 405)
15

Highway Safety Office Resources
• Listing of every State’s Highway safety plan
– https://one.nhtsa.gov/links/StateDocs/pages/SafetyPlans.htm
– Search “highway safety plan nhtsa”
• NHTSA Countermeasures That Work
– https://www.nhtsa.gov/sites/nhtsa.dot.gov/files/812202-countermeasuresthatwork8th.pdf
• NHTSA Grants Program
– https://www.nhtsa.gov/highway-safety-grants-program
16
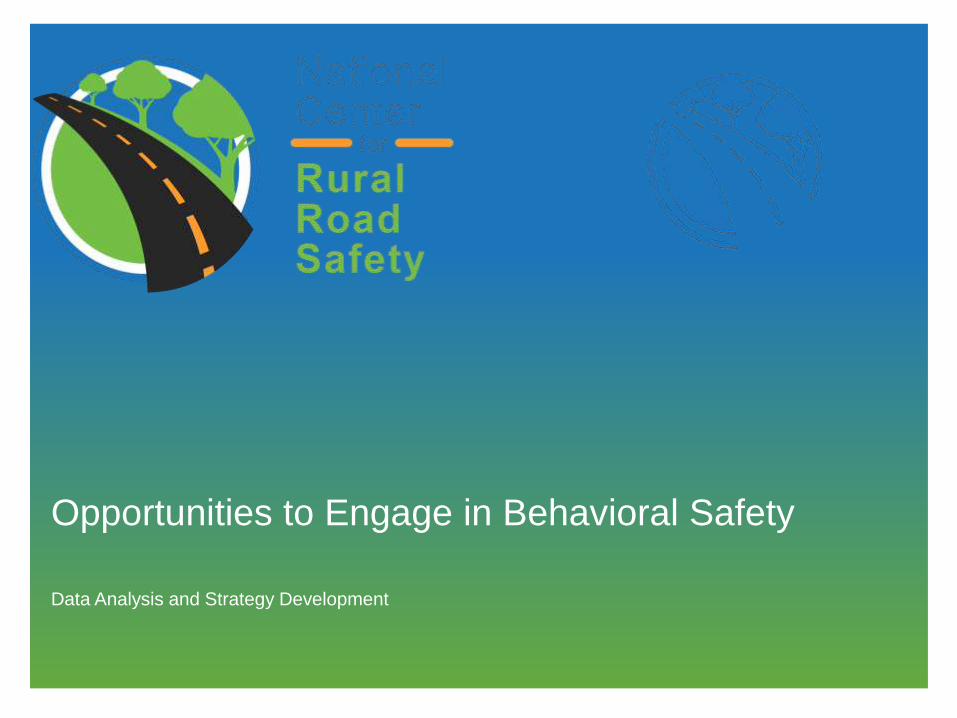
Opportunities to Engage in Behavioral Safety
Data Analysis and Strategy Development
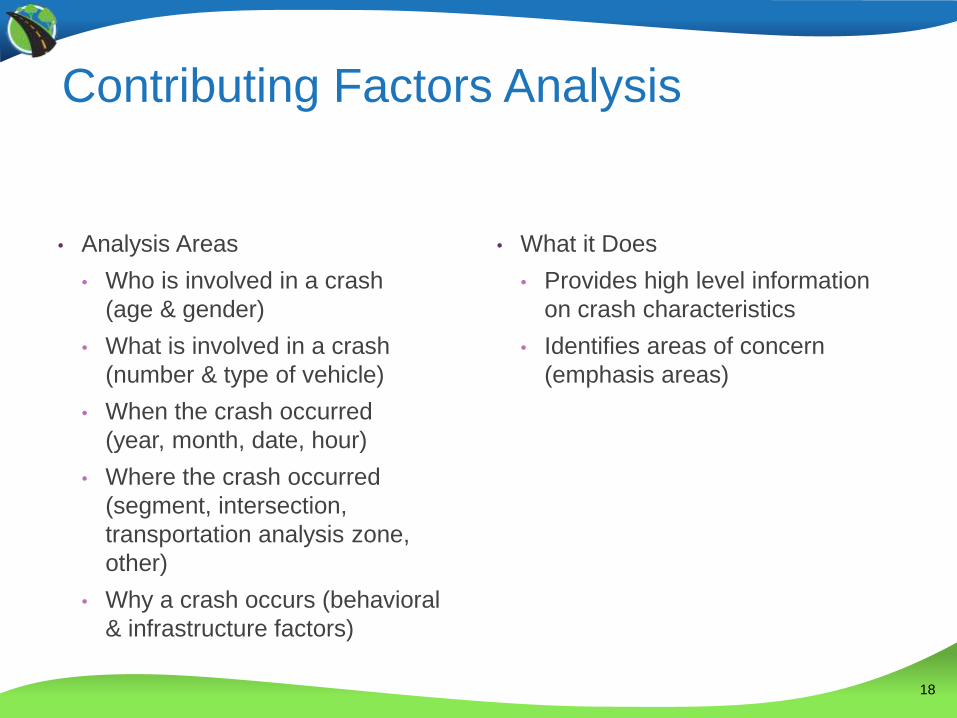
Contributing Factors Analysis
• Analysis Areas
• Who is involved in a crash
(age & gender)
• What is involved in a crash
(number & type of vehicle)
• When the crash occurred
(year, month, date, hour)
• Where the crash occurred
(segment, intersection,
transportation analysis zone,
other)
• Why a crash occurs (behavioral
& infrastructure factors)
• What it Does
• Provides high level information
on crash characteristics
• Identifies areas of concern
(emphasis areas)
18

Contributing Factor Data
• Minimum
– Total crashes and/or total fatalities & serious injuries
– Demographics (i.e. age, gender, time of day, day of week, location)
– Collision type (i.e. run off road, rear-end)
– Behavioral Factors (i.e. impairment, seatbelt usage)
• Optional Data
– Person data (i.e. repeat offenses)
– Motor vehicle make, type, & total occupants
– Crash incidence data (i.e. roadway conditions)
19

2020
Identify The Key RisksContributing Factor Analysis
• Obtain 5 years of crash data for your planning area
– Fatalities, Serious Injuries, and/or All Crashes
• Depends on what is available
• Also want to have a sufficient sample size
– For data received, also need to request contributing factor
information
• Many states have a crash data portal to assist with this
type of request or can complete a custom request
20

2121
Identify the Key RisksTypes of Contributing Factor Analysis
49.1%
35.3% 31.8%
19.6% 18.4% 17.9% 15.5% 14.8%8.6% 6.5% 5.9% 3.8% 2.1% 1.9%
0%
8%
16%
24%
32%
40%
48%
56%
Ro
ad
way
Dep
art
ure
Inte
rsect
ion
Sp
eed
ing
Yo
ung
Drive
r
Unre
stra
ined
Alc
oho
l
Ag
ing
Drive
r
Dis
tract
ed
Drive
r
Mo
torc
ycle
Larg
e V
ehic
le
Ped
est
rian
Dro
wsy
Drive
r
Dru
gs
Bic
ycle
Traffic Deaths and Severe Injuries
2001 to 2015
Traffic Fatalities and Serious Injuries2011 to 2015
0 10 20 30 40 50 60 70 80
Under influence of alcohol
Distracted
Speeding
Bicycle/ Pedestrian
Young driver
Unbelted
Fatal (K) Serious Injury (A) Evident Injury (B) Possible Injury (C) PDO0.1%
0.7%
0.7%
7.0%
1.8%
2.7%
2.8%
7.7%
18.1%
4.6%
4.3%
21.3%
14.0%
13.3%
21.4%
21.2%
13.1%
56.4%
Train-Related
Bicycle
Work Zone-Related
Distracted Driving-Related
Drowsy Driving
ATV Involved
Pedestrian
Motorcycle Involved
Intersection-Related
CMV Involved
Involved Driver with Invalid License
Young Driver Involved
Older Driver Involved
Speeding-Related
Aggressive Driving-Related
Occupant Protection
Alcohol- or Drug-Related
Roadway Departure-Related
0.3%
0.3%
0.8%
1.1%
1.5%
6.0%
6.2%
9.6%
9.9%
11.8%
13.4%
14.2%
19.4%
29.7%
42.2%
47.1%
53.1%
65.0%All Fatal and Serious Injury Crashes
Serious Injuries Fatalities

2222
Identify the Key RisksPrioritize Contributing Factors
• Number of fatalities and serious injuries
• Crash Severity
• Percent of Fatal Crashes Higher than Total Crashes
• Fatality and Serious Injury Trends
• Stakeholder Input
Commercial Vehicles
Bicycles
Inattentive Drivers
Unlicensed Drivers
Pedestrians
Unrestrained Occupants
Motorcycles
Alcohol (No Drugs)
Older Drivers (65+)
Alcohol and/or Other Drugs
Speed-Related
Young Drivers (15-25)
Intersections
Aggressive Driving
Roadway Departure
Cra
sh S
eve
rity
Crash Frequency
31
.3%
16
.3%
2.4
%
2.3
%
2.2
%
0.8
%
0.5
%
44
.3%
15
.9%
9.0
%
0.6
%
6.9
%
4.8
%
1.2
%
31
.3%
20
.8%
18
.8%
2.1
% 5.2
%
25
.0%
4.2
%
0%
5%
10%
15%
20%
25%
30%
35%
40%
45%
50%
Aggressive/careless driving
Lane departure Alcohol or drugs usesuspected
Improper passing Speeding Pedestrian involved Bicyclist involved
Total Severe Fatal
Potential Emphasis Area
2009 Fatal and
Serious Injury
Crashes
Annual Change Average Annual
Change, 2009-2013
(5-Year Trend line
Slope) 2010 2011 2012 2013
Roadway Departure Crashes 747 6.2% 11.2% -0.3% -8.8% +19.6 per Year
Aggressive Driving Involved 501 9.4% 10.0% -6.0% -3.4% +11.3 per Year
+36.2 per Year
Intersections Crashes 419 19.1% 15.2% 1.0% -3.8% +36.2 per Year
Young Drivers - 15-25 Involved 401 20.7% 6.0% 0.4% -12.0% +13.5 per Year
Speed-Related Crashes 379 11.1% 7.6% -8.4% -3.9% +3.4 per Year
Alcohol and/or Other Drugs Involved 288 -2.8% 29.3% 11.3% -10.2% +27.1 per Year
+14.5 per Year
Older Drivers - 65+ Involved 271 5.9% 13.9% 7.6% -11.6% +14.5 per Year
Alcohol Involved (No Drugs) 246 -2.8% 32.2% 8.9% -12.8% +21.3 per Year
Unrestrained Occupants 203 -16.3% 35.9% -2.6% -11.1% +4.9 per Year
+15.6 per Year
Motorcycle Involvement 198 3.5% 20.5% 14.6% -16.3% +15.6 per Year
Pedestrian(s) Injured or Killed 128 21.1% 5.8% 6.1% -14.4% +6.1 per Year
Unlicensed Drivers Involved 89 -4.5% 60.0% 14.7% -12.2% +16.7 per Year
Pedalcycle(s) Injured or Killed 66 -33.3% 81.8% -1.3% -17.7% +3.3 per Year
Inattentive Drivers Involved 55 29.1% 11.3% 1.3% -18.8% +2.9 per Year
Commercial Motor Vehicle Involved 49 49.0% 12.3% -35.4% 22.6% +1.2 per Year

2323
Identify the Key Risks Digging Deeper
23
0.0%
0.0%
7.1%
0.4%
0.4%
5.8%
2.1%
2.5%
4.1%
6.2%
21.1%
4.1%
9.8%
24.6%
17.0%
22.5%
Train-Related
Bicycle
Intersection-Related
Pedestrian
Work zone-Related
Distracted Driving-Related
Drowsy Driving
ATV Involved
CMV Involved
Motorcycle Involved
Young Driver Involved
Involved Driver with Invalid License
Older Driver Involved
Occupant Protection
Alcohol- or Drug-Related
Speeding / Aggressive Driving-Related
0.0%
0.0%
0.0%
0.2%
0.7%
1.0%
1.6%
6.7%
8.6%
8.9%
13.8%
14.2%
14.7%
54.9%
59.0%
60.0%
Roadway Departure Serious Injury and Fatality Crashes
Serious Injuries Fatalities

You Have All This Data, Now What?
• Share this information with relevant stakeholders
– State DOT
– Highway Safety Office
– Local/Regional Coalitions
• Establish emphasis areas
• Customize strategies and actions from SHSP or HSP
• Develop strategies and actions using 4E
stakeholder engagement
Less
Resource
Intensive
Additional
Resources
and Time
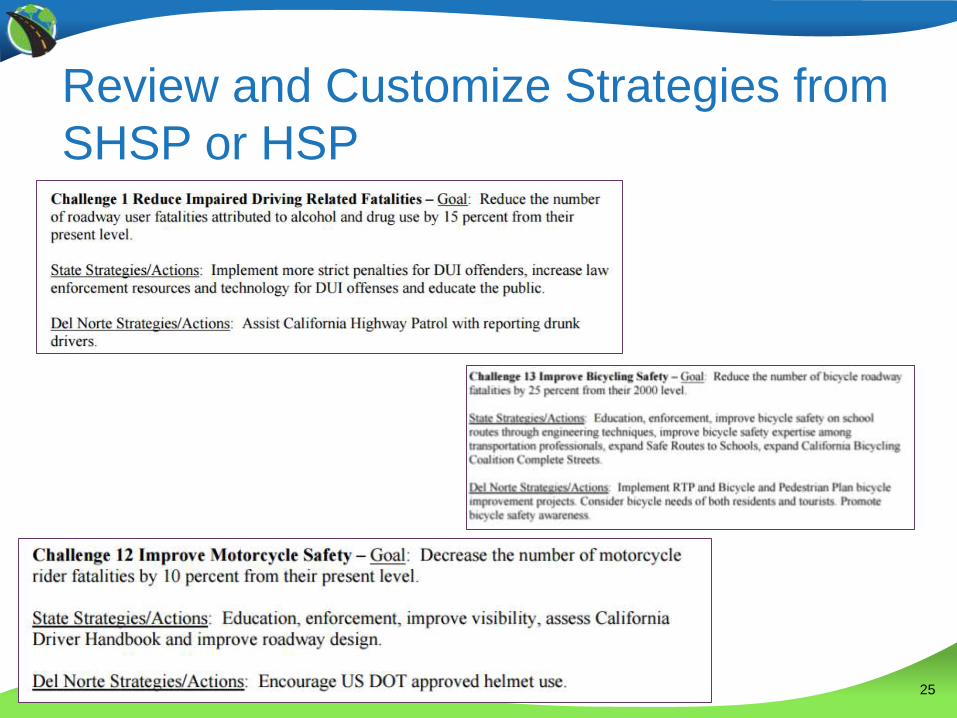
Review and Customize Strategies from
SHSP or HSP
25

Develop Strategies and Actions
26

Communicating the Safety Message
27

Opportunities to Engage in Behavioral Safety
Implementation Ideas

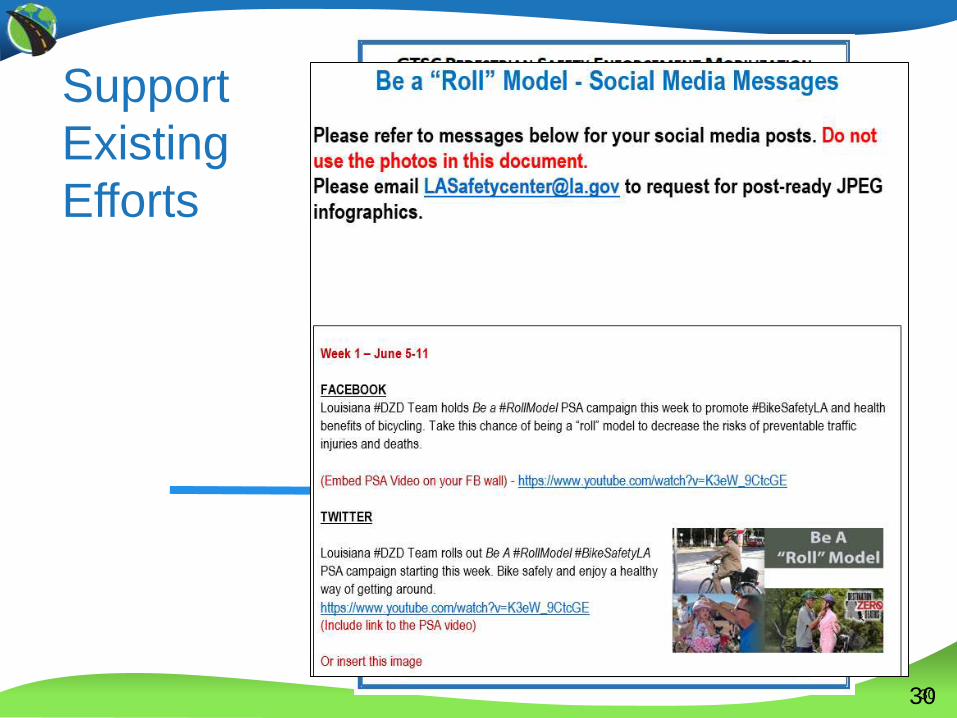
Support Existing Efforts
29
30
Support
Existing
Efforts
30

3131
Marketing Materials You Can
Use/Customizewww.trafficsafetymarketing.gov

32
Promote Behavioral Safety on Website

Share Information on Behavioral Safety
33
34
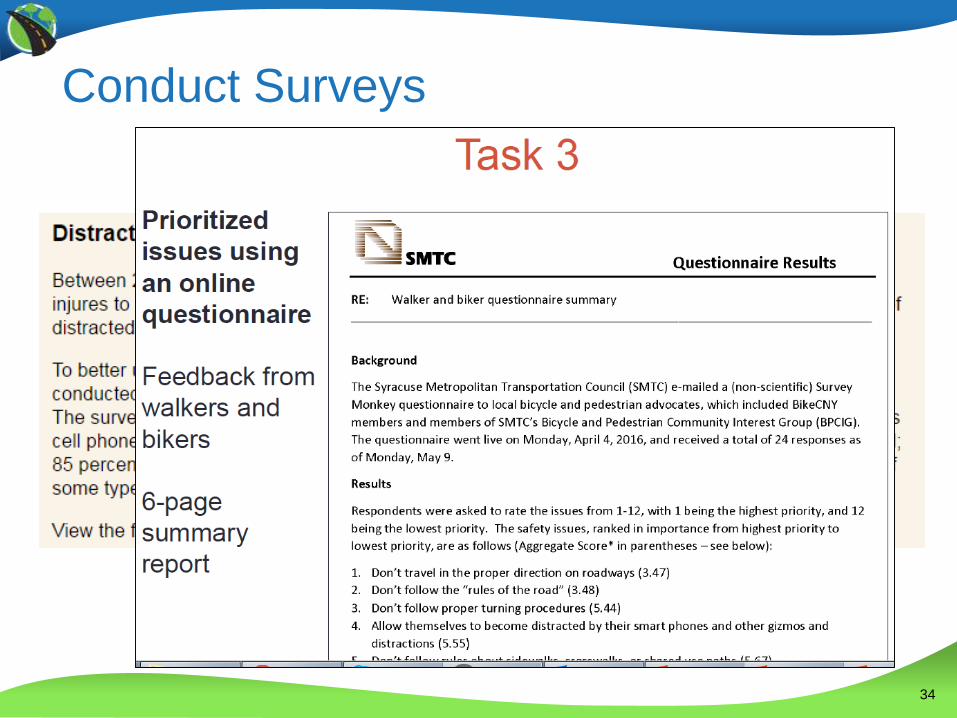
Conduct Surveys

35
Use Crash Data Infographics and
Information to Raise Awareness
36
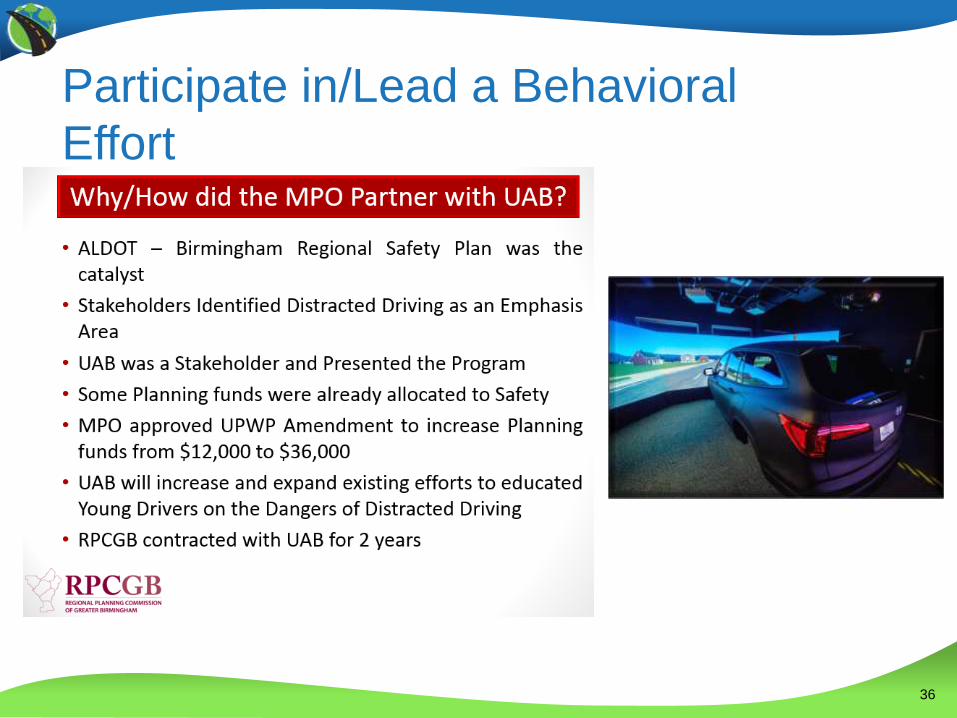
Participate in/Lead a Behavioral
Effort

Participate in/Lead a Behavioral Effort
• Identify bicycle and pedestrian behavioral safety issues
– 4E Committee and Data
• Identify local and state laws that address the issues
• Prioritize the issues
– Online Questionnaire
• Research existing campaigns (state and nation) that exist in the public domain
• Identify a campaign that addressed our concerns – sought permission to co-brand

Resources to Address Behavioral Safety
Funding

Highway Safety Office – NHTSA
Funding
• 402 Funding - State and Community Highway Safety
Program
• 405 - National Priority Safety Programs
– (b) addresses occupant protection,
– (c) is for improving traffic safety information and data systems,
– (d) is for impaired driving and ignition interlock laws
– (e) is for distracted driving,
– (f) is for motorcycle safety,
– (g) is to encourage graduated drivers licensing programs, and
– (h) is for nonmotorized roadway user programs
39

How to Apply
• Review priority areas in HSP
– Impaired, speed, distracted
• Identify overlapping priority areas
• Determine which strategies align
• Attend an annual grant training seminar (January)
• Submit an application/participate in an application
(January/February)
40

Resources to Address Behavioral Safety
Conclusion

42
Finding Solutions to the Behavioral
Issues
Bring data analysis to the table
Bring together 4E stakeholders to discuss safety issues
Identify strategies and actions to address behavioral issues in your planning area
Find funding to implement behavioral programs
Lead or actively participate in initiatives/programs to address behavioral safety
Work with data analyzed by others
Join an existing group or participate in meetings
Adopt or follow existing strategies and actions
Learn about funding opportunities
Lend support to existing behavioral initiatives
High Level of EffortLow Level of Effort

Key Takeaways
• What are your next steps?

Contact Information
If you have any questions related to this presentation,
please contact the instructors at:
To learn more about the National Center for Rural Road
Safety :
http://ruralsafetycenter.org/about-our-center/history-of-the-
safety-center/
44