Achieving Data Center Cost Savings Through Renewable Energy · Resource; yield forecast; utility...
53
Click To Edit Master Title Style Achieving Data Center Cost Savings Through Renewable Energy Tuesday - May 16 3:45 PM – 5:00 PM
Transcript of Achieving Data Center Cost Savings Through Renewable Energy · Resource; yield forecast; utility...

Click To Edit Master
Title Style
Achieving Data Center
Cost Savings Through
Renewable Energy
Tuesday - May 16
3:45 PM – 5:00 PM

Panelists
▪ Brad Gustafson, Department of Energy
▪ Otto VanGeet, National Renewable Energy
Laboratory
▪ Isaac Negusse, Iron Mountain
2

Topics
• RE Costs Trends
• RE Generation U.S. Generation Capacity Additions
• Motivations for Renewable Energy Implementation
• Factors Impacting RE Implementation
• Project Identification and Development
• Resources

Solar Growth and Declining Costs
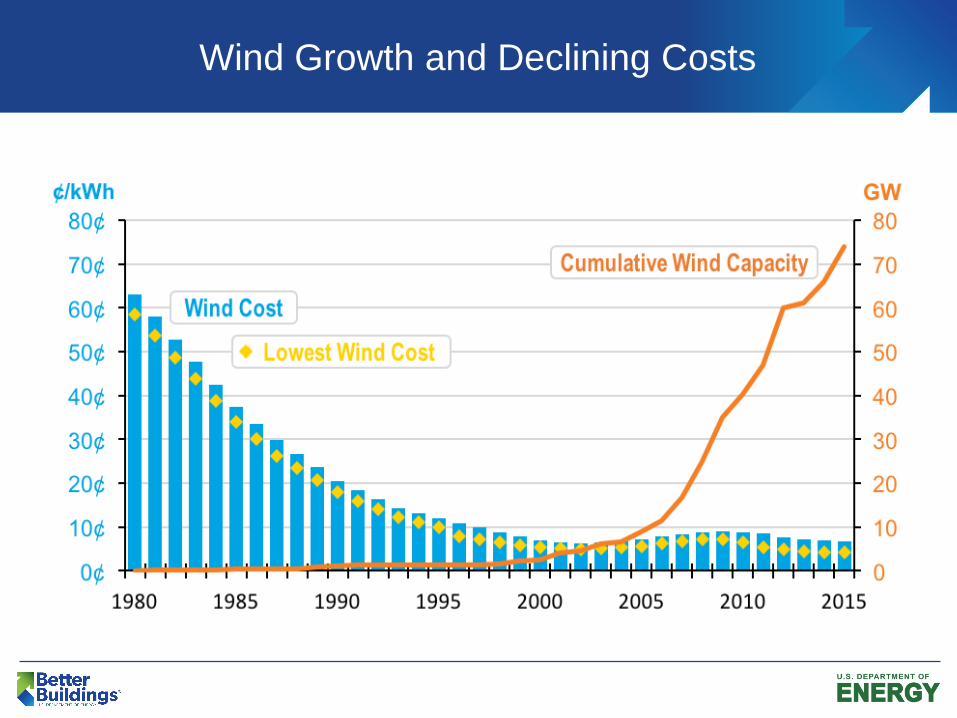
Wind Growth and Declining Costs
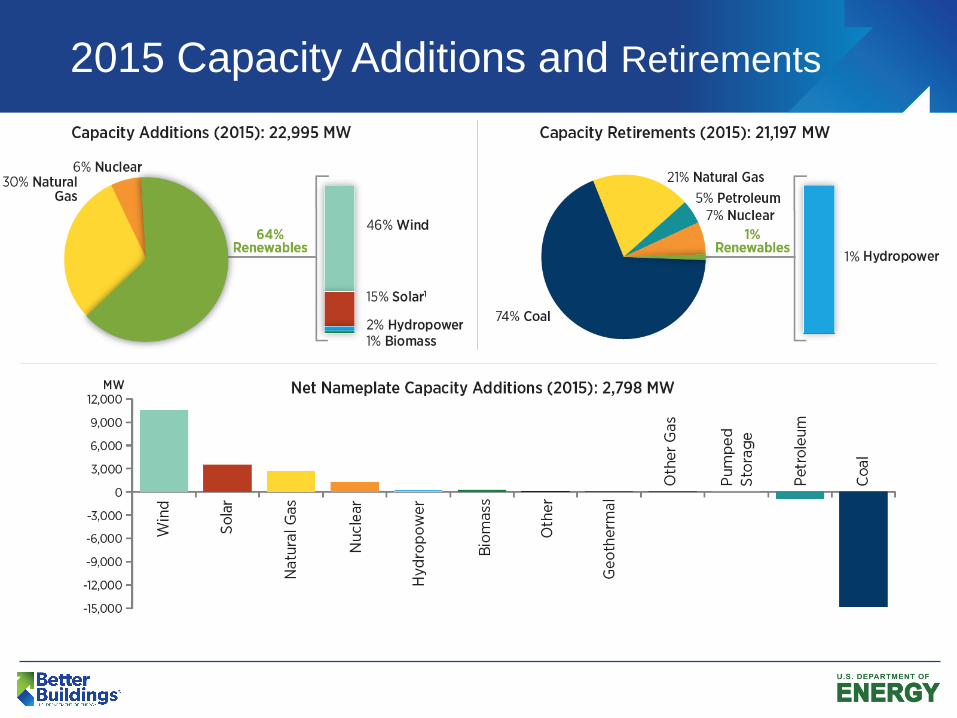
2015 Capacity Additions and Retirements
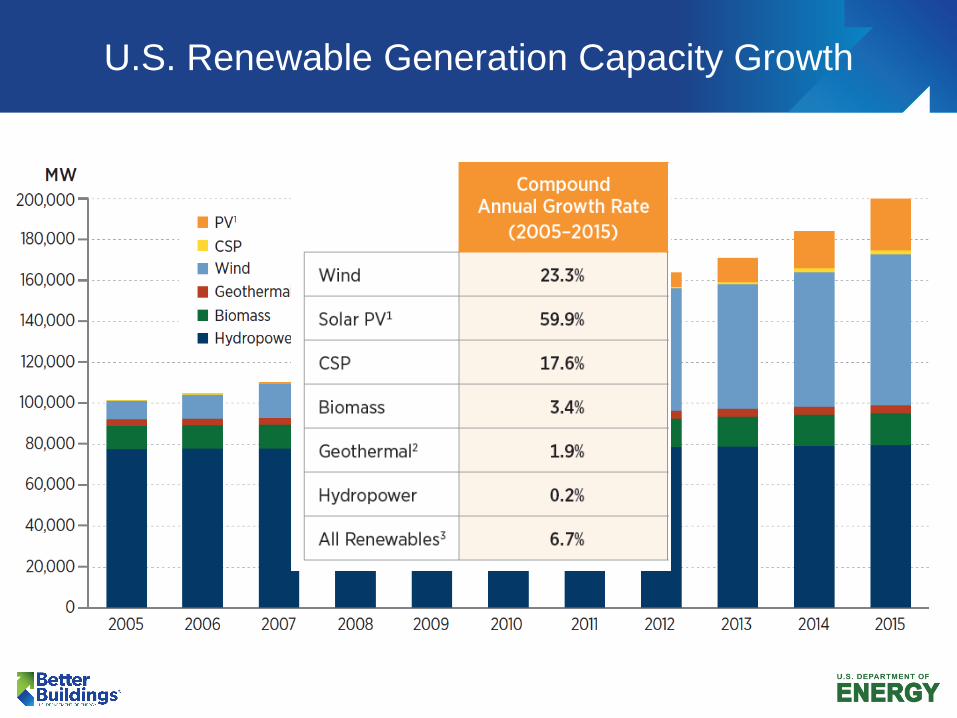
U.S. Renewable Generation Capacity Growth

Motivations for Renewable Energy Implementation
• Increase sales, gain more customers, keep
existing customers satisfied - Marketing
• Energy Cost Savings
• Avoid cost of infrastructure (power line
extension, upgrade)
• Reduced Emissions (tons CO2/year)
• Reduced volatility (fuel adjustment charge)
• Hedge against rate increases (%/year)
• Hedge against fuel/power supply interruptions

Factors Impacting RE Implementation
• Your cost of energy
• Your organizations policies and mandates
• Impact on facility mission
• Your local renewable energy resources
• State, Utility and Federal incentives
• State, utility policies (interconnection, net metering, charge
structure)
• Technology characteristics
• Cost ($/kW installed; O&M costs)
• Performance (efficiency)
• Compliance requirements
• Environmental (NEPA)
• Historic (NHPA)

On-Site Project Implementation Process*
Phase 1
Initial Renewable Screening/Identification
of Project
Phase 2
Form a Strong Project Team
Phase 3
Project Validation
Phase 4
Procurement
Phase 5
Construction and Performance Period
*Based off of FEMP’s Guide to Integrating Renewable Energy in Federal Construction, Large-Scale Renewable
Energy Guide, Small- to Medium-Scale Federal Renewable Energy Projects, and Energy Savings Performance
Contract Energy Sales Agreement (ESPC ESA) Toolkit

Small- To Medium-Scale Renewable Energy
Projects
• PRELIMINARY SCREENINGS
Determine whether a renewable energy project is worth exploring.
At the headquarters or regional level, prescreen multiple sites to
identify and prioritize locations for further study.
• SCREENINGS
Narrow site and project options. Identify technologies to pursue, and
comparison of financing mechanisms to consider.
• FEASIBILITY STUDIES
Feasibility studies provide technology and financing
recommendations.
https://energy.gov/eere/femp/small-medium-scale-federal-renewable-
energy-projects
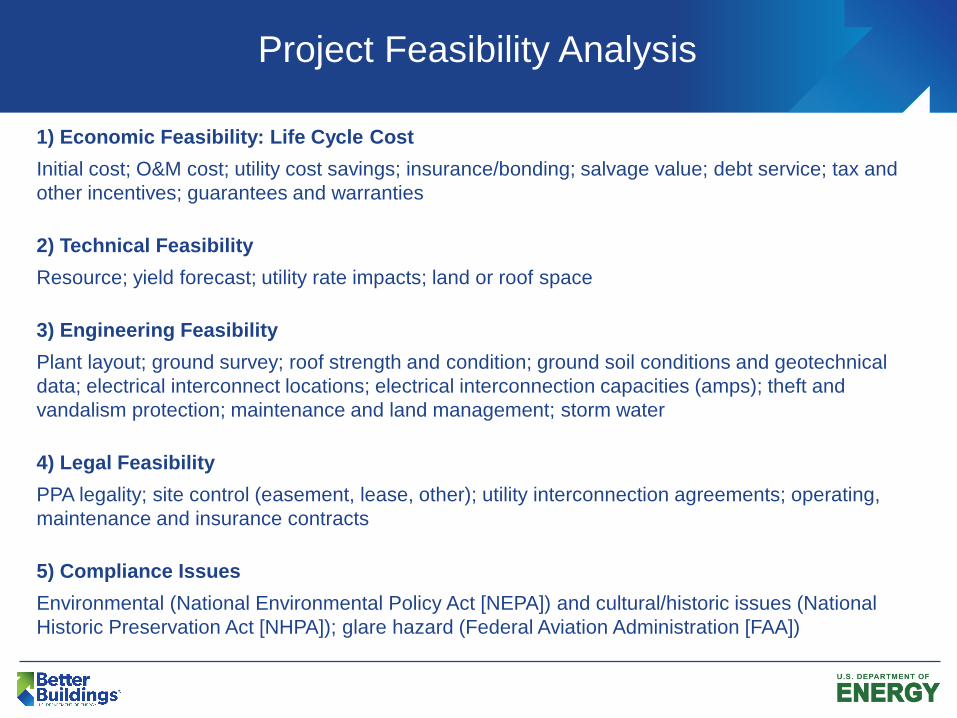
1) Economic Feasibility: Life Cycle Cost
Initial cost; O&M cost; utility cost savings; insurance/bonding; salvage value; debt service; tax and
other incentives; guarantees and warranties
2) Technical Feasibility
Resource; yield forecast; utility rate impacts; land or roof space
3) Engineering Feasibility
Plant layout; ground survey; roof strength and condition; ground soil conditions and geotechnical
data; electrical interconnect locations; electrical interconnection capacities (amps); theft and
vandalism protection; maintenance and land management; storm water
4) Legal Feasibility
PPA legality; site control (easement, lease, other); utility interconnection agreements; operating,
maintenance and insurance contracts
5) Compliance Issues
Environmental (National Environmental Policy Act [NEPA]) and cultural/historic issues (National
Historic Preservation Act [NHPA]); glare hazard (Federal Aviation Administration [FAA])
Project Feasibility Analysis

Construction and Performance Period: Important
Considerations
1) Complete the design
Design documents and design review process; construction contract or performance contract;
design-bid-build or design-build
2) Begin construction
Establish a single point of contact; review milestone progress frequently; maintain close contact
with the utility; involve inspection officials early; keep occupants in the loop
3) Commission the System
Third-party commissioning authority (CA); prepare “commissioning plan”; verify system complies
with specifications; update documents to “as built” condition; perform testing of components and
complete system
4) Perform Operations and Maintenance
O&M manual by installer; O&M plan including administration, monitoring, preventative
maintenance, and corrective maintenance (repair)
5) Close out the Project
Refurnish system and extend life or remove and restore site; design for recyclability and control
toxic materials; liability or asset; recycling
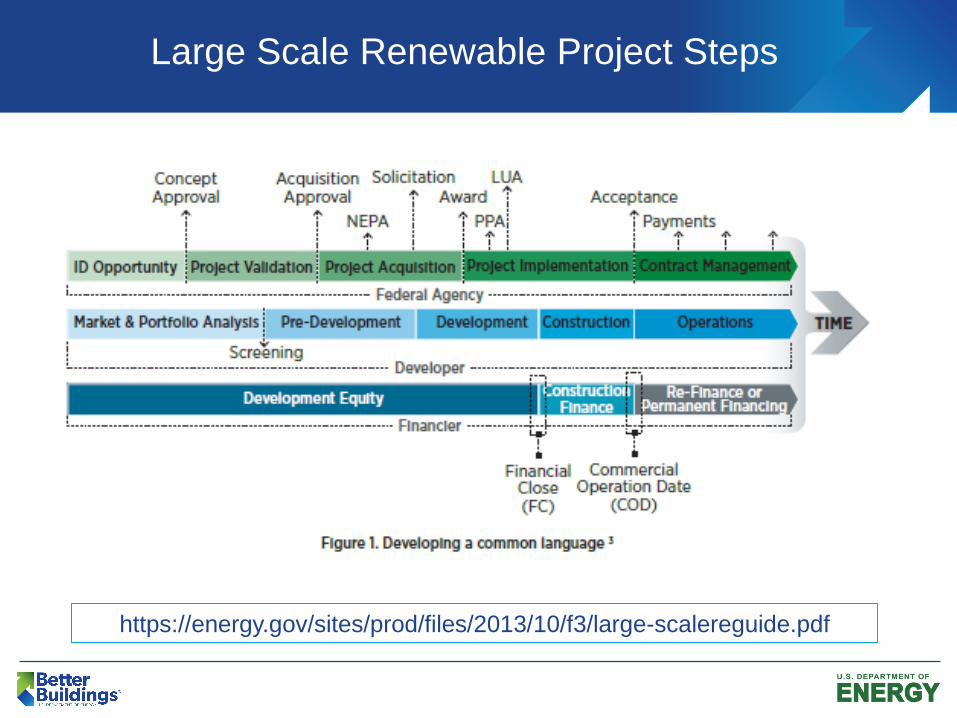
Large Scale Renewable Project Steps
https://energy.gov/sites/prod/files/2013/10/f3/large-scalereguide.pdf

Renewable Energy Optimization (Reopt)
• Decision support service to evaluate energy opportunities
• Recommends a mix of technologies and an operating strategy that meets client goals at minimum lifecycle costo Considers interactions between multiple technologieso Estimates costs and energy savings
• Draws on site data, NREL GIS resource data, DSIRE incentive database, and RE technology info
• Has been used to assess opportunities at 8000+ sites
• Technologies currently modeled:o PVo Windo Solar hot watero Solar vent preheato Biomasso Waste to energyo Landfill gaso GSHPo Diesel and natural gas generatorso Electric and thermal storage
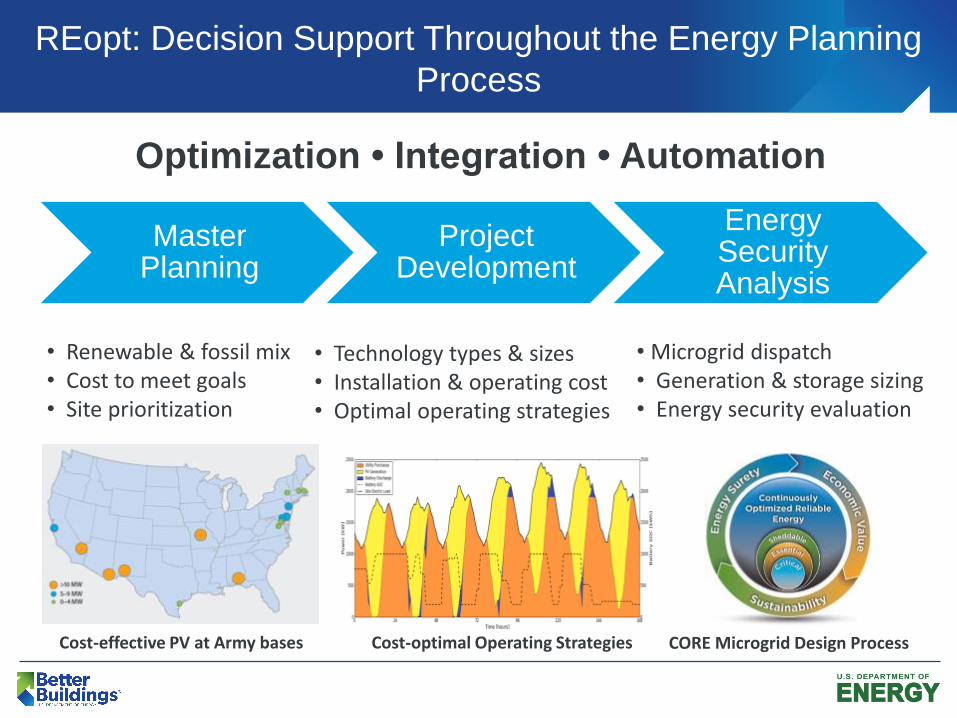
REopt: Decision Support Throughout the Energy Planning
Process
• Renewable & fossil mix• Cost to meet goals• Site prioritization
• Technology types & sizes• Installation & operating cost• Optimal operating strategies
• Microgrid dispatch• Generation & storage sizing• Energy security evaluation
Cost-effective PV at Army bases Cost-optimal Operating Strategies CORE Microgrid Design Process
Master Planning
Project Development
Energy Security Analysis
Optimization • Integration • Automation

Reopt Users
• Natural Energy Laboratory of Hawaii
• Remote communities in Alaska• National Zoo• Town of Greensburg, KS• Towns of North Hempstead and
East Hampton, NY• High School in Sun Valley, ID• Frito Lay• Anheuser Busch• E&J Gallo• Time Warner Cable• Wells Fargo• Microsoft• San Diego Gas & Electric• Arizona State University• Miami University of Ohio• City University of New York• University of Minnesota Duluth
REopt has been used to assess opportunities at over 8000 sites for:
• US Forest Service• National Park Service• Fish and Wildlife Service• Department of Defense• Department of Energy• Department of Commerce• Department of State• General Services Administration• US Department of Veteran’s Affairs• Department of Homeland Security• US Department of Agriculture• US Bureau of Reclamation• Bureau of Land Management• Indian Health Service• Western Area Power Administration• Navajo Generating Station

REopt Example: Army and Navy Installations

Mission: Provide access to site-specific, optimized, and integrated
renewable energy decision analysis
Vision: Advance data-driven decision-making and deployment of
renewable energy and energy storage technologies
REoptWeb
Integration and Optimization
FEMP has sponsored NREL to develop a
publically available web version of
REopt. The first version of the tool will
include:
• Estimates the optimal size of PV and
battery that minimizes the cost of
energy to a site
• Evaluate the economics of PV and
battery storage
REopt: Publically Available Web Tool

▪ RE Cost and Performance Matrix
▪ http://www.nrel.gov/analysis/tech_cost_dg.html
▪ Initial cost, O&M cost, useful life; LCOE calculator
▪ GIS Tools and Data
▪ http://maps.nrel.gov/femp
▪ Resources, topography, environmental concerns, boundaries
▪ LCC analysis for PV, wind, solar water heating, and solar ventilation air preheat
▪ REOpt Development
▪ http://www.nrel.gov/tech_deployment/tools_reopt.html
▪ Optimizes a portfolio of RE projects based on LCC
▪ RE Website
▪ http://www.energy.gov/eere/femp/federal-renewable-energy-projects-and-
technologies
▪ Publications, data, technical assistance portal
▪ RE Training
▪ http://www.energy.gov/eere/femp/federal-energy-management-program-training
▪ Project development, technology, O&M
FEMP RE Tools and Resources

Power Purchase Opportunities
▪ The Environmental Protection Agency’s Green Power Partnership has a Project Matching Initiative that works to connect renewable power users with new, not-yet-built renewable projects. https://www.epa.gov/greenpower/project-matching-initiative).
▪ Bureau of Land Management’s hosts a list of renewable energy projects with signed leases on BLM land, many of which are still seeking an off-taker. This list focuses on projects west of the Mississippi. https://www.blm.gov/programs/energy-and-minerals/renewable-energy/data
▪ The Rocky Mountain Institute’s Business Renewables Center (member-based) hosts a marketplace database that lists 81 projects totaling 13,000 MW from 28 developers, as of July 2016. http://businessrenewables.org/how-to-join/
21

Brad Gustafson
Department of Energy
202-586-5865
Thank You

National Renewable Energy Laboratory
(NREL)
• Leading clean-energy innovation for 35 years
• 1740 employees with world-class facilities
• Campus is a living model of sustainable energy
• Owned by the Department of Energy
• Operated by the Alliance for Sustainable Energy
Only National Laboratory Dedicated Solely to Energy Efficiency and Renewable Energy
http://www.nrel.gov/
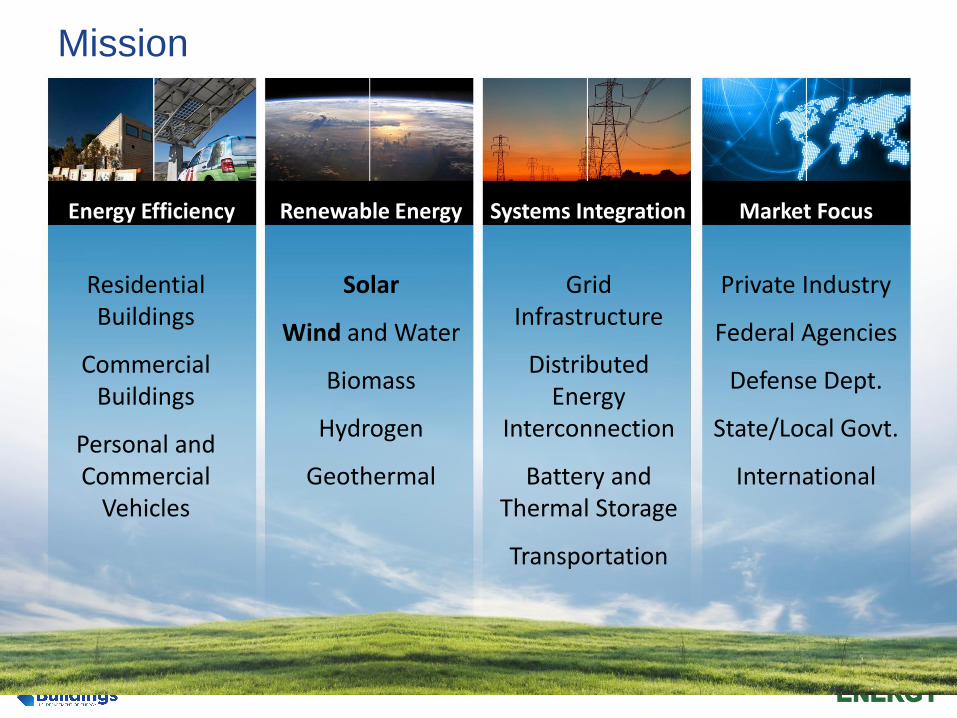
Mission
Energy Efficiency Renewable Energy Systems Integration Market Focus
Residential Buildings
Commercial Buildings
Personal and Commercial
Vehicles
Solar
Wind and Water
Biomass
Hydrogen
Geothermal
Grid Infrastructure
Distributed Energy
Interconnection
Battery and Thermal Storage
Transportation
Private Industry
Federal Agencies
Defense Dept.
State/Local Govt.
International
Solar
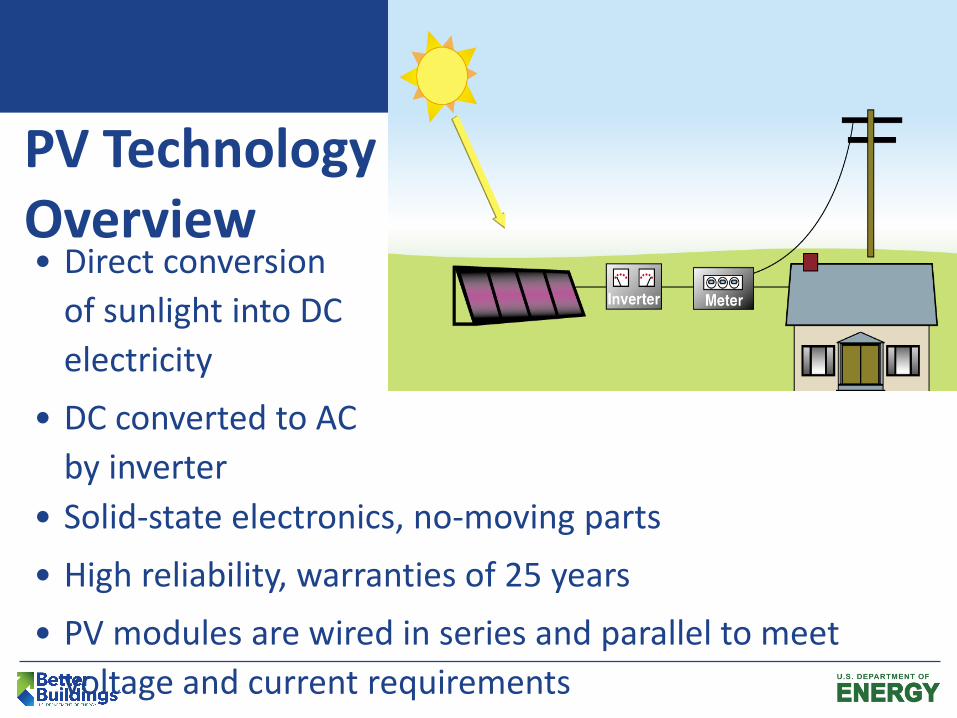
PV Technology Overview
• Solid-state electronics, no-moving parts
• High reliability, warranties of 25 years
• PV modules are wired in series and parallel to meet
voltage and current requirements
• Direct conversion
of sunlight into DC
electricity
• DC converted to AC
by inverter


Solar Resource: Tilt = Local Latitude
Annual average kWh/m2/year
Source: FEMP’s Renewable Energy Geospatial Screening Tool

Flat Plate PV
Systems
Arizona Public Service, Prescott, AZ
Dangling Rope Marina, Glen Canyon
National Recreation Area, UT
Alamosa PV System, Alamosa, CO
5 – 10 acres per MW for PV systems
Land can be left as is or graded

Roof Mounted – 8 to 18 W/ Sq. Ft. Available
Area

System Diagram – Gross to Net
Available
Energy -
Resource
PPA Contract Terms
Field
LossesDelivered
Energy
Local
Condition
s
REVENUE
“Gross
Energy
Conversion
”
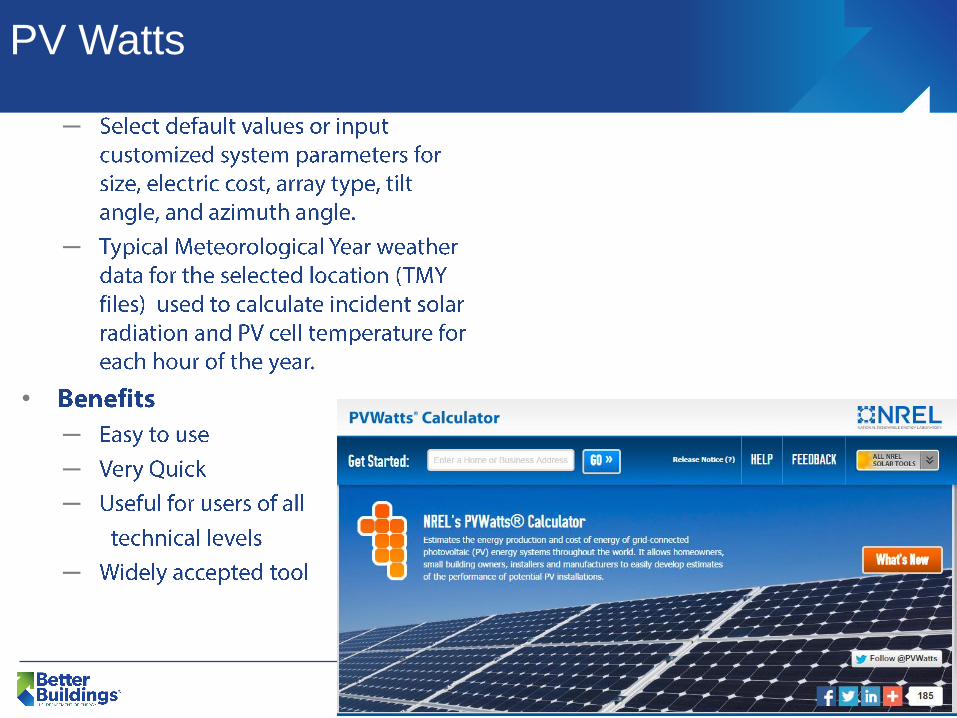
PV Watts
─
─
•
─
─
─
─
33
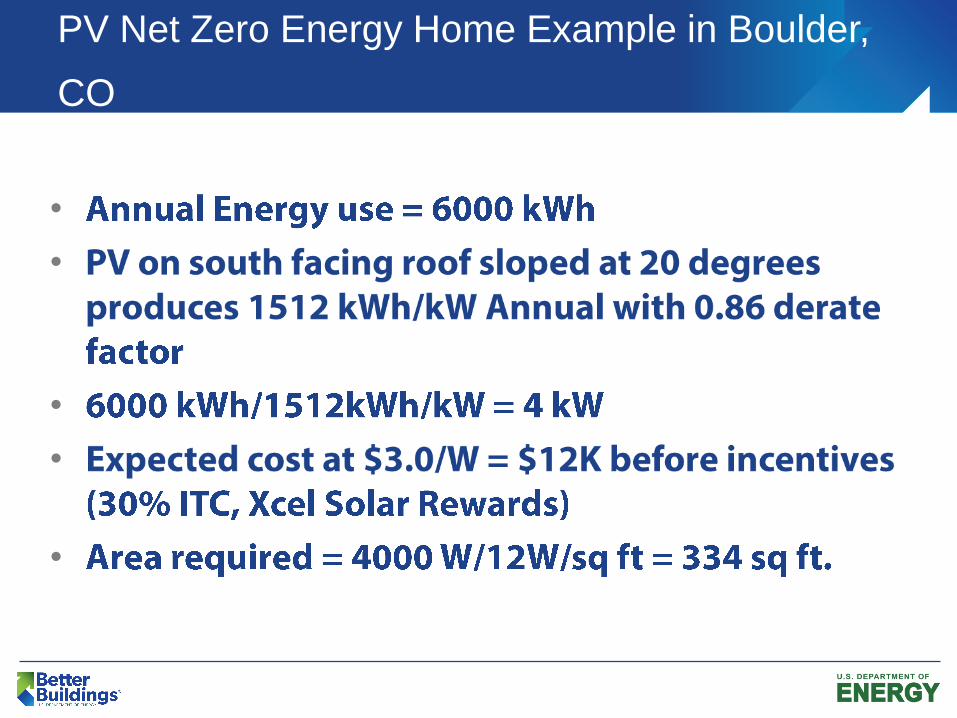
PV Net Zero Energy Home Example in Boulder,
CO
•
•
•
•
•

Wind

Wind Resource
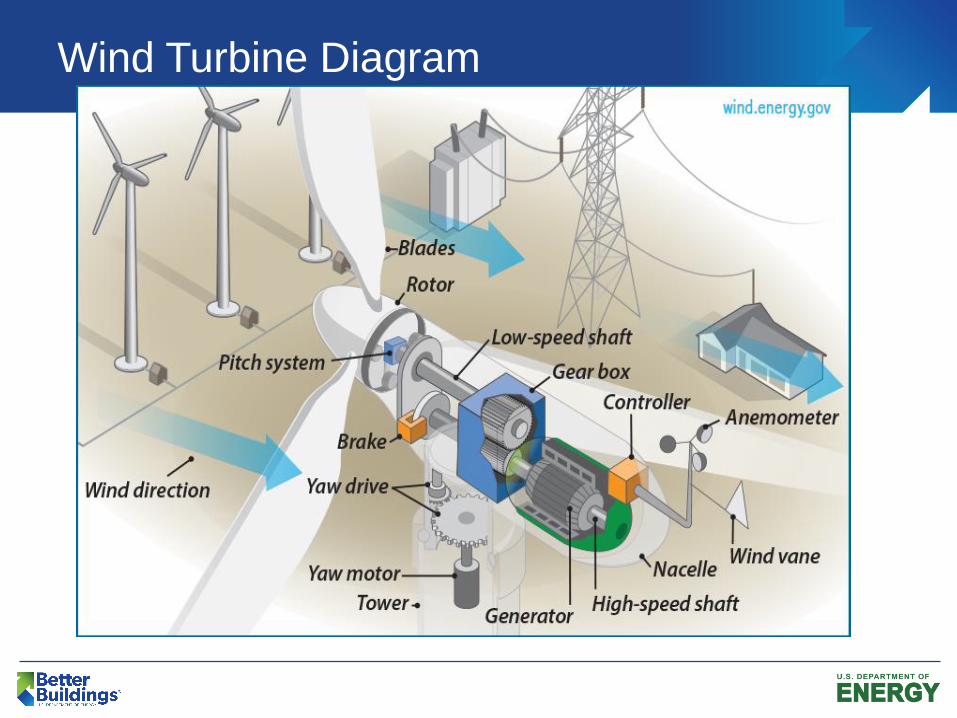
Wind Turbine Diagram
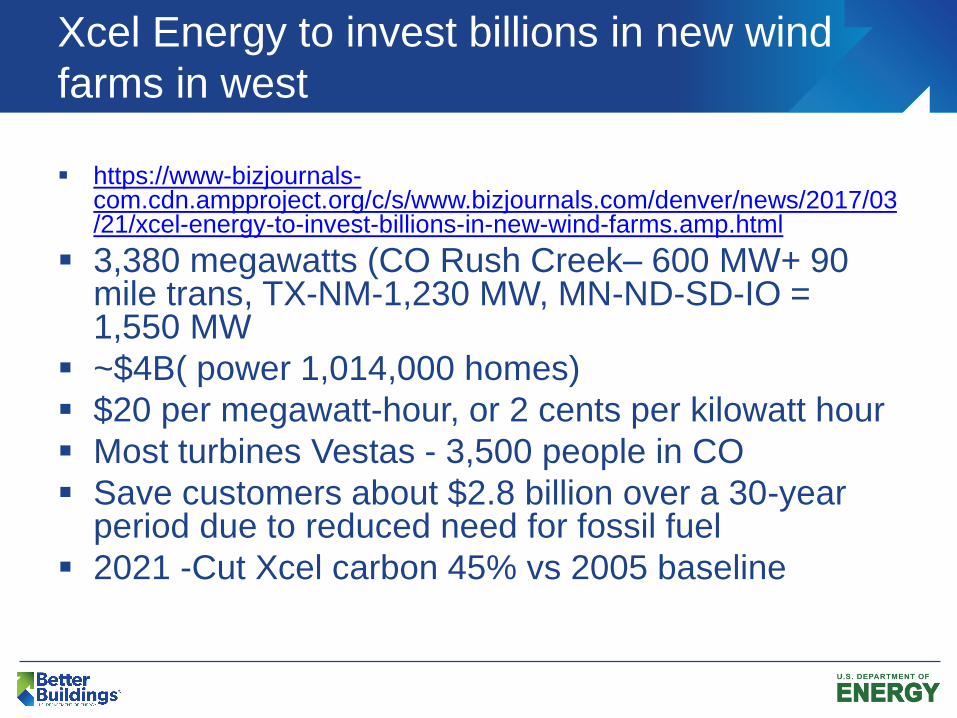
▪ https://www-bizjournals-com.cdn.ampproject.org/c/s/www.bizjournals.com/denver/news/2017/03/21/xcel-energy-to-invest-billions-in-new-wind-farms.amp.html
▪ 3,380 megawatts (CO Rush Creek– 600 MW+ 90 mile trans, TX-NM-1,230 MW, MN-ND-SD-IO = 1,550 MW
▪ ~$4B( power 1,014,000 homes)
▪ $20 per megawatt-hour, or 2 cents per kilowatt hour
▪ Most turbines Vestas - 3,500 people in CO
▪ Save customers about $2.8 billion over a 30-year period due to reduced need for fossil fuel
▪ 2021 -Cut Xcel carbon 45% vs 2005 baseline
Xcel Energy to invest billions in new wind
farms in west

Converting Data to Information
Resource Solar PV/CSP) Wind Geothermal Water Power Biopower
Theoretical
Potential
155,000 GW
(PV)
38,000GW
(CSP)
11,000 GW
(onshore)
4,200 GW
(offshore to
50 nm)
38 GW
(conventional)
4,000 GW
(EGS)
68 GW 62 GW
Current US System – 1,100 GW

Resiliency Analysis
0%
20%
40%
60%
80%
100%
1 2 3 4 5 6 7 8 9 10 11 12 13 14
Pro
babili
ty o
f S
urv
ivin
g O
uta
ge
[%]
Length of Outage [Days]
Base case
Generator Solar PV Storage
Lifecycle
Cost Outage
1. Base case 2.5 MW - - $20 million 5 days
2. Lowest cost
solution2.5 MW 625 kW 175 kWh
$19.5
million6 days
3. Proposed system 2.5 MW 2 MW 500 kWh$20
.1million9 days
Lowest
cost
solutionProposed system
(given site goals &
constraints)
NREL evaluated thousands of random grid outages and durations
throughout the year and compared number of hours the site could survive
with a diesel generator and fixed fuel supply vs. generator augmented with
PV and battery

720 KW
1,156 KW
524 KW
449 KW408 KW 94 KW
NREL PV Systems - South Table Mesa Campus
Otto VanGeet 303.384.7369 [email protected] Anderson 303.384.7453 [email protected]
QUESTIONS?
50 KW
The following slides provide more
information.
42

Renewable GenerationSolar PVWindBiomass, etc.
Energy StorageBatteriesThermal storageWater tanks
Conventional GenerationElectric GridFuel Supply
Conventional Generators
Dispatchable TechnologiesHeating and CoolingWater Treatment
GoalsMinimize Cost
Net ZeroResiliency
EconomicsFinancial Parameters
Technology CostsIncentives
Utility CostsEnergy Charges
Demand Charges
Escalation Rate
OperationsOptimal Dispatch
REoptEnergy Planning
PlatformTechno-economic Optimization
REopt Inputs and Output
Energy Conservation Measures
Technologies Technology MixTechnology Size
Project Economics CapEx, OpExNet Present Value
Renewable Energy Strategy
@KevinHagen Director Corporate Responsibility

• $3.8B Sales
• 25,000 employees
• +1400 secure Facilities
• 46 Countries
• 85 Million Sq ft
• 220,000 customers
• 94% of FORTUNE 500
• Publically Traded REIT (NYSE: IRM)
• Listed on the DJSI
• Records Management • Data Management
• Document Management • Data Centers
• Art Storage • Secure Shredding
Global leader in storing, protecting and managing critical information and assets.
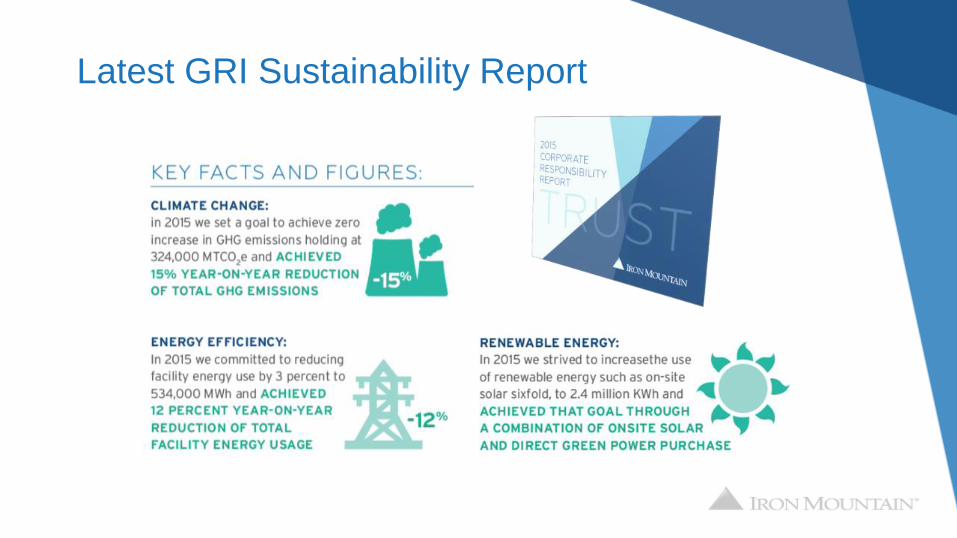
Latest GRI Sustainability Report
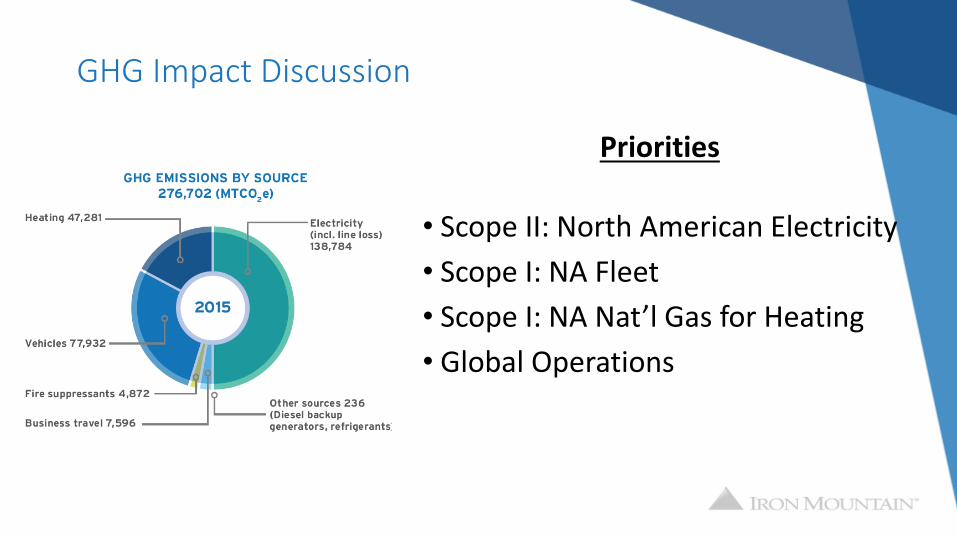
GHG Impact Discussion
Priorities
• Scope II: North American Electricity
• Scope I: NA Fleet
• Scope I: NA Nat’l Gas for Heating
• Global Operations
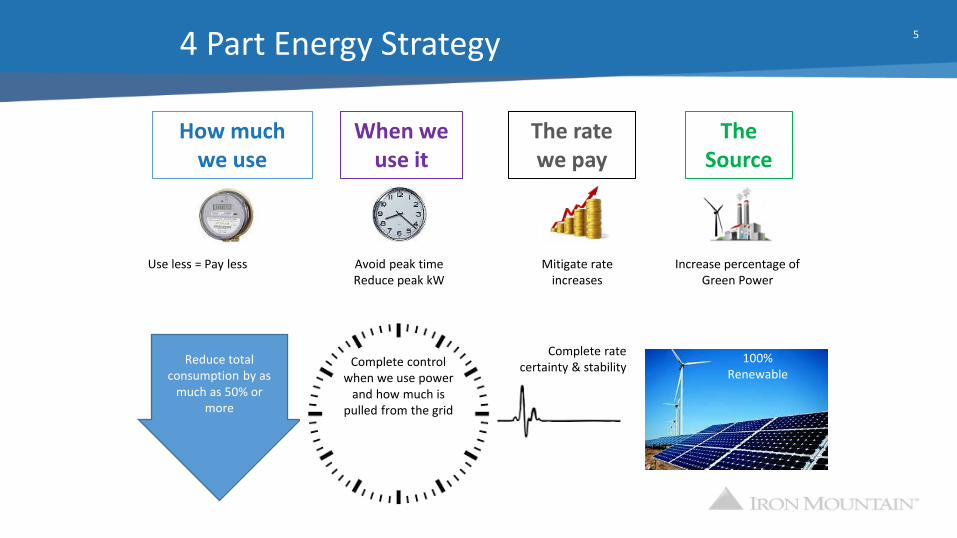
4 Part Energy Strategy 5
How much we use
When we use it
The rate we pay
The Source
Use less = Pay less Avoid peak time Reduce peak kW
Mitigate rate increases
Increase percentage of Green Power
100% Renewable
Complete rate certainty & stability Complete control
when we use power and how much is
pulled from the grid
Reduce total consumption by as
much as 50% or more

3 Tactics for Green Power Procurement
On-Site 20 year Solar PPAs
• 4.2 MW installed at existing locations
• Approx 4.5 MW under contract in development
SOLAR Short Term Direct Power Purchase
• 2016 1 yr/ 8,700 MWhrs Wind via RPD
• 2017 2 yr/ 31,000 MWhrs Wind via RPD
15 year “Virtual” Wind PPAs
• 25 MW with NJR Ringer Hill, PA
• 25 MW with Lincoln Clean Energy, Amazon Wind Farm TX
WIND POWER

Forward View of Renewable Electricity in NA
20%
100%
80%
60%
40%
5%
Electricity use
ReCall
Green
Po
wer
Ringer Hill, PA
Amazon Wind Farm, TX
Freehold, NJ
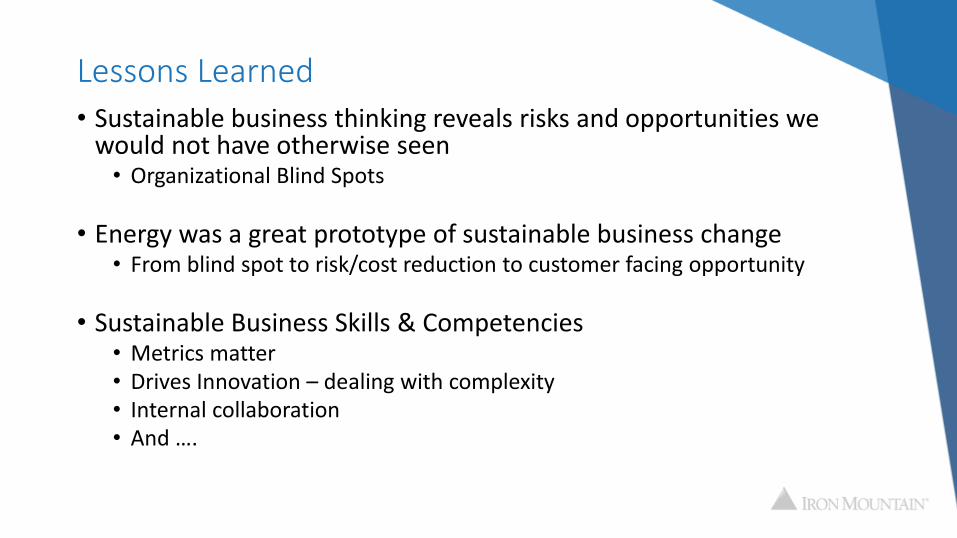
Lessons Learned
• Sustainable business thinking reveals risks and opportunities we would not have otherwise seen • Organizational Blind Spots
• Energy was a great prototype of sustainable business change • From blind spot to risk/cost reduction to customer facing opportunity
• Sustainable Business Skills & Competencies • Metrics matter • Drives Innovation – dealing with complexity • Internal collaboration • And ….
Sustainability is a Team Sport

IMDC Climate Neutral Data Center Services
Secure Cost Protected Carbon Neutral
Launching a New Product:
ESG is moving from
Operational Impacts to customer value.

Thank You
Provide feedback on this
session in the new
Summit App!
Download the app to your
mobile device or go to
bbsummit.pathable.com
41